Melanoblast transcriptome analysis reveals novel pathways promoting melanoma metastasis Kerrie L. Marie 1 , Antonella Sassano 1* , Howard H. Yang 1* , Aleksandra M. Michalowski 1 , Helen T. Michael 1 , Theresa Guo 1,2 , Yien Che Tsai 3 , Allan M. Weissman 3 , Maxwell P. Lee 1 , Lisa M. Jenkins 4 , M. Raza Zaidi 5 , Eva Pérez-Guijarro 1 , Chi-Ping Day 1 , Heinz Arnheiter 6 , Sean Davis 7 , Paul S. Meltzer 7 , Glenn Merlino 1** and Pravin J. Mishra 1 1. Laboratory of Cancer Biology and Genetics, Center for Cancer Research, National Cancer Institute, National Institutes of Health, Bethesda, MD 20892, USA. 2. Department of Otolaryngology - Head and Neck Surgery, Sidney Kimmel Comprehensive Cancer Center, Johns Hopkins Medical Institutions, Baltimore, MD 21287, USA. 3. Laboratory of Protein Dynamics and Signaling, Center for Cancer Research, National Cancer Institute, Frederick, MD 21702, USA. 4. Laboratory of Cell Biology, Center for Cancer Research, National Cancer Institute, National Institutes of Health, Bethesda, MD 20892, USA. 5. Fels Institute for Cancer Research and Molecular Biology, Lewis Katz School of Medicine at Temple University, Philadelphia, PA 19140, USA. 6. Mammalian Development Section, National Institute of Neurological Disorders and Stroke, National Institute of Health, Bethesda, MD 20892, USA. 7. Genetics Branch, Center for Cancer Research, National Cancer Institute, National Institutes of Health, Bethesda, MD 20892, USA. * These authors contributed equally ** Corresponding author GM: Email – [email protected]; Phone – 240-760-6801 . CC-BY-NC-ND 4.0 International license It is made available under a was not peer-reviewed) is the author/funder, who has granted bioRxiv a license to display the preprint in perpetuity. The copyright holder for this preprint (which . http://dx.doi.org/10.1101/721712 doi: bioRxiv preprint first posted online Aug. 6, 2019;

Welcome message from author
This document is posted to help you gain knowledge. Please leave a comment to let me know what you think about it! Share it to your friends and learn new things together.
Transcript
Melanoblast transcriptome analysis reveals novel pathways promoting
melanoma metastasis
Kerrie L. Marie1, Antonella Sassano1*, Howard H. Yang1*, Aleksandra M. Michalowski1, Helen
T. Michael1, Theresa Guo1,2, Yien Che Tsai3, Allan M. Weissman3, Maxwell P. Lee1, Lisa M.
Jenkins4, M. Raza Zaidi5, Eva Pérez-Guijarro1, Chi-Ping Day1, Heinz Arnheiter6, Sean Davis7,
Paul S. Meltzer7, Glenn Merlino1** and Pravin J. Mishra1
1. Laboratory of Cancer Biology and Genetics, Center for Cancer Research, National Cancer Institute, National
Institutes of Health, Bethesda, MD 20892, USA.
2. Department of Otolaryngology - Head and Neck Surgery, Sidney Kimmel Comprehensive Cancer Center,
Johns Hopkins Medical Institutions, Baltimore, MD 21287, USA.
3. Laboratory of Protein Dynamics and Signaling, Center for Cancer Research, National Cancer Institute,
Frederick, MD 21702, USA.
4. Laboratory of Cell Biology, Center for Cancer Research, National Cancer Institute, National Institutes of
Health, Bethesda, MD 20892, USA.
5. Fels Institute for Cancer Research and Molecular Biology, Lewis Katz School of Medicine at Temple
University, Philadelphia, PA 19140, USA.
6. Mammalian Development Section, National Institute of Neurological Disorders and Stroke, National
Institute of Health, Bethesda, MD 20892, USA.
7. Genetics Branch, Center for Cancer Research, National Cancer Institute, National Institutes of Health,
Bethesda, MD 20892, USA.
* These authors contributed equally
** Corresponding author
GM: Email – [email protected]; Phone – 240-760-6801
.CC-BY-NC-ND 4.0 International licenseIt is made available under a was not peer-reviewed) is the author/funder, who has granted bioRxiv a license to display the preprint in perpetuity.
The copyright holder for this preprint (which. http://dx.doi.org/10.1101/721712doi: bioRxiv preprint first posted online Aug. 6, 2019;
Abstract
Cutaneous malignant melanoma is an aggressive cancer of melanocytes with a strong propensity
to metastasize. We posited that melanoma cells acquire metastatic capability by adopting an
embryonic-like phenotype, and that a lineage approach would uncover novel metastatic melanoma
biology. We used a genetically engineered mouse model to generate a rich melanoblast
transcriptome dataset, identified melanoblast-specific genes whose expression contributed to
metastatic competence, and derived a 43-gene signature that predicted patient survival. We
identified a melanoblast gene, KDELR3, whose loss impaired experimental metastasis. In contrast,
KDELR1 deficiency enhanced metastasis, providing the first example of different disease
etiologies within the KDELR-family of retrograde transporters. We show that KDELR3 regulates
the metastasis suppressor, KAI1, and report an interaction with the E3 ubiquitin-protein ligase
gp78, a regulator of KAI1 degradation. Our work demonstrates that the melanoblast transcriptome
can be mined to uncover novel targetable pathways for melanoma therapy.
Melanoma is an aggressive cancer that frequently progresses to metastatic proficiency. Treatment
of metastatic melanoma remains a challenge, highlighting an urgent need to uncover new targets
that could be used in the clinic to broaden therapeutic options. In the early 19th century, Virchow
first described cancer cells as being “embryonic-like”1. Developmental systems have since proven
useful to study melanoma, and melanoma cell plasticity appears to be a key feature of melanoma
progression. Melanocyte lineage pathways are a recurring theme in melanoma etiology,
reinforcing the importance of uncovering new melanocyte developmental pathways and biology2-
13. Here we use a genetically engineered mouse (GEM), designed to facilitate the isolation and
analysis of developing melanocytes (melanoblasts), to attempt to uncover new targets relevant to
melanoma metastasis.
Melanocytes are neural crest-derived cells whose development necessitates extensive
migration/invasion to populate the skin and other sites14. This process requires melanoblasts to
adopt a migratory phenotype, to interact with and survive in foreign microenvironments and to
.CC-BY-NC-ND 4.0 International licenseIt is made available under a was not peer-reviewed) is the author/funder, who has granted bioRxiv a license to display the preprint in perpetuity.
The copyright holder for this preprint (which. http://dx.doi.org/10.1101/721712doi: bioRxiv preprint first posted online Aug. 6, 2019;
colonize distant sites − functions that are analogous to metastatic competence15. To complete these
processes, the cell may encounter numerous cellular stressors, such as shear stress, nutrient
deprivation, hypoxia, lipid stress and oxidative stress16. The cellular impact of these stressors
converges at the Endoplasmic Reticulum (ER), the organelle tied closely to protein synthesis and
responsible for correct protein folding, protein quality control and post-translational modifications.
Stress stimuli can result in aberrant ER function, a build-up of unfolded/misfolded proteins (ER
stress), and an overwhelmed system. The ER can therefore be viewed as an exquisitely sensitive
stress sensor. Upon ER stress insult, the ER launches an immediate counter measure known as of
the Unfolded Protein Response (UPR)17. The UPR consists of three arms, the IRE1, PERK and
ATF6 pathways. Cumulatively these result in transcriptional activation of chaperones and ER-
Associated Degradation (ERAD) machinery that target unfolded proteins for degradation to help
counter the stress17. Simultaneously the PERK pathway initiates general translation attenuation to
reduce protein load in the ER. Un-checked levels of ER stress result in cell death via the PERK-
stimulated CHOP pathway17. The KDEL-Receptors (KDELRs) are a family of seven-
transmembrane-domain ER protein retention receptors consisting of three members (KDELR1, 2
and 3) that function in the ER Stress Response (ERSR). They share structural homology, but each
isoform can have different ligands18, 19. They are responsible for the retrograde transport of protein
machinery from the Golgi to the ER, including chaperones that target unfolded proteins for re-
folding, and whose disassociation from membrane receptors stimulates UPR signaling19, 20. In
embryogenesis, there is a need for tightly coordinated temporal control of gene/protein expression
for correct differentiation of tissues16. Embryonic cells are therefore primed to accommodate
overwhelming ER stress, as this would affect the cell’s ability to translate, synthesize, fold and
modify proteins, which would compromise the developing embryo16.
We hypothesized that genes whose expression is upregulated in developing melanoblasts and
metastatic melanoma but downregulated in differentiated melanocytes (hereafter referred to as
MetDev genes), can be reactivated by melanoma cells to facilitate metastasis (Fig. 1a). To explore
this, we took advantage of a GEM model in which GFP is inducibly targeted to embryonic
melanoblasts and mature melanocytes by using the Dopachrome tautomerase (Dct) promoter to
drive expression (inducible Dct-GFP; iDct-GFP)21, 22. This powerful tool enables identification
and isolation of cells of the melanocytic lineage21, which can be employed to investigate the
.CC-BY-NC-ND 4.0 International licenseIt is made available under a was not peer-reviewed) is the author/funder, who has granted bioRxiv a license to display the preprint in perpetuity.
The copyright holder for this preprint (which. http://dx.doi.org/10.1101/721712doi: bioRxiv preprint first posted online Aug. 6, 2019;
melanoblast transcriptome. Using this approach, we identified a 43-gene embryonic melanoblast
gene signature that predicts metastatic melanoma patient survival, and we highlight a new role for
KDELR320, distinct from other members of the KDELR family. A metastasis suppressor screen
highlights KAI1/CD82 (hereafter referred to as KAI1) as a KDELR3-regulated protein. We
observe that KDELR3 regulates KAI1 protein levels and post-translational modification. We
demonstrate an undescribed interaction of KDELR3 with gp78, the E3 ubiquitin protein ligase
known to regulate KAI1 degradation23. Our work shows that melanoma cells can commandeer
embryonic transcriptomic programs to promote their progression to metastasis. These genes
represent an untapped source of novel targetable pathways to exploit for improving melanoma
treatment.
Results
Melanoblast transcriptomic expression in melanoma metastasis
To study melanoblast genes, GFP-positive melanocytic cells were isolated from four
developmental time points: Embryonic day (E) 15.5 and 17.5, and Postnatal day (P) 1 and 7 (Fig.
1b, Supplementary Fig. 1a-b). These four stages represent embryonic melanoblast development
from the neural crest into differentiated quiescent melanocytes of the postnatal pup24, 25.
Melanocytes/ melanoblasts were isolated using Fluorescence-Activated Cell Sorting (FACS) from
iDct-GFP mice (Supplementary Fig. 1c). At E15.5 and E17.5 melanoblasts are still migrating and
colonizing the hair follicles within the epidermis24-26 − processes that we believe are highly
relevant to metastasis, particularly with respect to colonization at the metastatic site – and
intrafollicular melanoblasts are still present26. P1 and P7 mature melanocytes were selected as a
model of quiescent differentiated melanocytes; these time points are prior to the first hair follicle
cycle that begins at 6 weeks post birth. Melanocytic cells were extracted from multiple litters (6-
10 pups) at each developmental stage to ensure comprehensive representation of all melanoblasts/
melanocytes present. RNA was extracted for whole-transcriptome sequencing.
Genes with differential expression between embryonic melanoblasts (E15.5 and E17.5) and post-
natal differentiated melanocytes (P1 and P7) were identified using DESeq227 with a q-value < 0.1,
.CC-BY-NC-ND 4.0 International licenseIt is made available under a was not peer-reviewed) is the author/funder, who has granted bioRxiv a license to display the preprint in perpetuity.
The copyright holder for this preprint (which. http://dx.doi.org/10.1101/721712doi: bioRxiv preprint first posted online Aug. 6, 2019;
yielding 976 differentially expressed genes (Supplementary Fig. 2). Of these genes, we filtered out
any whose differential expression was less than 1.5 log2 fold increased in melanoblasts, as we
deemed that a fold change of less than this was unlikely to be biologically meaningful. 467
melanoblast-specific genes were identified from our analyses, which we hypothesize to be putative
melanoma metastasis enhancer genes (MetDev genes; Fig. 1c). To test the relevance of our
melanoblast gene cohort in melanoma metastasis we interrogated this gene list in melanoma patient
data. To ask if our 467-gene MetDev cohort was enriched in genes that contributed to poor
progression of patients, we used a Cox proportional hazards model to associate their expression
with overall survival in a training dataset of human patient samples derived from melanoma
metastases (stage III and stage IV; GSE19234)28. We discerned a 43-gene survival risk predictor
(Fig. 1c, black/red arrows; Fig. 1d, black text, Kdelr3) that could accurately predict patient
outcome in a separate testing dataset of late stage (stage III and stage IV) metastatic melanoma
patient samples derived from metastases (GSE8401; Fig. 1e)29. These data show that not only is
our MetDev cohort enriched for metastatic progression genes, but it can also predict survival in
multiple independent patient datasets. Notably, gene expression levels in samples derived from
early stage (stage I and stage II) primary melanoma lesions did not predict patient outcome,
suggesting that MetDev genes play a key role in late-stage disease specifically (GSE8401; Fig.
1f)29.
To allow functional validation of our MetDev candidates in both soft agar colony forming assays
and in experimental metastasis models we elected to prioritize the list of MetDev gene candidates.
To do this in an unbiased fashion we applied criteria based solely on melanoblast expression data,
selecting for genes with no detectable gene expression in P7 postnatal pups. Differential expression
was validated using a separate microarray expression dataset derived from our iDct-GFP model
(E17.5 vs P2 and P7; q-value < 0.1)21. Further criteria using differences in fold-increase expression
in melanoblasts vs. melanocytes and the greatest expression at embryonic stages allowed us to
select 20 genes likely to be the most functionally relevant. Of these 20 we noted that 7 genes
(Kdelr3, P4ha2, Gulp1, Dab2, Lum, Aspn, Mfap5) were associated with Extracellular Matrix
(ECM) or trafficking. For functional analyses, we chose 4 of these 7 genes (Kdelr3, P4ha2, Gulp1,
Dab2) with no established role in cutaneous melanoma metastasis (Fig. 1c, green/red arrows; Fig.
1d, red text). siRNA knockdown of our four candidate genes in B16 mouse melanoma cells
.CC-BY-NC-ND 4.0 International licenseIt is made available under a was not peer-reviewed) is the author/funder, who has granted bioRxiv a license to display the preprint in perpetuity.
The copyright holder for this preprint (which. http://dx.doi.org/10.1101/721712doi: bioRxiv preprint first posted online Aug. 6, 2019;
inhibited both growth in soft agar colony formation assays and formation of lung metastases in
experimental metastasis assays compared to non-targeting controls (Table 1). Our work
demonstrates that the MetDev dataset is enriched in genes that have a functional role in melanoma
metastasis. We identify four new melanoma metastasis genes and highlight ECM and trafficking
as important pathways common to both melanoblast development and melanoma metastasis.
We further observed significant co-expression of three of the four functionally validated genes
(Kdelr3, P4ha2 and Dab2) throughout four distinct mouse models of melanoma (See Methods and
Supplementary Table 1), corroborated in a melanoma patient cohort (TCGA; Supplementary Table
2). Notably, expression of Kdelr3 and P4ha2 was highly correlated throughout all datasets
(Supplementary Fig. 3a-b), raising the possibility that some metastasis-associated MetDev genes
may be co-regulated and serve a more coordinated role in metastasis.
KDELR3 is a Golgi-resident protein whose expression correlates with melanoblast
development and melanoma progression
To understand how melanoblast genes might facilitate metastasis we chose to study one MetDev
gene in depth. KDELR3 was selected as it was a positive hit in all of our analyses: KDELR3 is a
trafficking protein important in the ERSR whose expression was associated with poor patient
prognosis in metastatic melanomas (Fig. 1e, 43 gene signature), and KDELR3 was functionally
validated in both soft agar colony formation and experimental metastasis assays (Table 1). The
KDELRs are Golgi-to-ER retrograde transporters responsible for maintaining ER localization of
their protein substrates. KDELR substrates consist of protein chaperones required for protein
folding and targeting unfolded proteins for degradation20, thereby assisting the UPR and
maintaining ER quality in times of ER stress. We show that KDELR3 is localized to both the cis-
and trans-Golgi compartments in metastatic melanoma cells (Supplementary Fig. 3c) and validate
expression of KDELR3 in mouse melanoblasts (Fig. 2a). Moreover, within the KDELR family
only KDELR3 demonstrated a melanoblast-specific expression pattern and showed consistent
upregulation in melanoma cell lines (Fig. 2b; Supplementary Fig. 3d-e). These data raise the
possibility that KDELR3 plays a role in melanoma progression which is distinct from other
.CC-BY-NC-ND 4.0 International licenseIt is made available under a was not peer-reviewed) is the author/funder, who has granted bioRxiv a license to display the preprint in perpetuity.
The copyright holder for this preprint (which. http://dx.doi.org/10.1101/721712doi: bioRxiv preprint first posted online Aug. 6, 2019;

KDELRs, despite their presumed redundancy. Analysis of human patient datasets and tumor
histology microarrays confirmed an upregulation of KDELR3 expression in malignant melanoma
vs. benign nevi (Fig. 2c-e).
We sought to functionally validate a role for KDELR3 in melanoma progression. We used human
and mouse melanoma cells to demonstrate that small-interfering RNA (siRNA) and short-hairpin
RNA (shRNA) knockdown of KDELR3 significantly reduced, and KDELR3 overexpression
enhanced, anchorage-independent growth (Fig. 3a-d; Supplementary Fig. 4a-b), which cannot be
attributed to a change in proliferation (Supplementary Fig. 4c). There are two KDELR3 variants,
and we selected the KDELR3-001 variant to perform rescue experiments as it is the most abundant
transcript expressed in human cell lines and patient samples. We therefore performed rescue
experiments via exogenous expression of KDELR3-001Mu, whose shRNA recognition site had
been mutated without altering the final protein sequence. KDELR3-001Mu expression was restored,
rescuing the anchorage-independent growth phenotype (Fig. 3e-g; Supplementary Fig. 4d).
KDELR3 was therefore validated as a mediator of anchorage-independent growth in melanoma
cells, a process required for metastasis.
KDELR3 knockdown reduces lung colonization in experimental metastasis assays
To assess the relevance of KDELR3 within the metastatic cascade, we used a tail vein experimental
metastasis assay, which specifically assesses the ability of the cells to extravasate and colonize the
lung, processes that are critical for metastatic capacity. Tail vein metastasis assays enable lung
colonization to be assessed with greater specificity/sensitivity − biology that we suggest may be
mirrored during hair follicle colonization (E17.5). Transient knockdown of KDELR3 in either
mouse (Fig. 3h-i) or human melanoma cell lines (Fig. 3j, Supplementary Fig. 5a) resulted in
significantly reduced metastatic potential compared to non-targeting controls, indicating that
KDELR3 expression is important for the cells’ ability to extravasate/ colonize the lung, further
validating that KDELR3 is a melanoblast gene that functions in metastasis (MetDev gene). Stable
shRNA knockdown of KDELR3 also resulted in a reduction in lung colonization following tail
vein metastasis and significantly fewer mice characterized with high metastatic burden
.CC-BY-NC-ND 4.0 International licenseIt is made available under a was not peer-reviewed) is the author/funder, who has granted bioRxiv a license to display the preprint in perpetuity.
The copyright holder for this preprint (which. http://dx.doi.org/10.1101/721712doi: bioRxiv preprint first posted online Aug. 6, 2019;
(Supplementary Fig. 5b-f). However, no appreciable difference in cell cycle or subcutaneous in
vivo tumor growth was observed (Supplementary Fig. 5g-i), suggesting that the KDELR3-mediated
metastatic phenotype cannot be attributed to a change in proliferation, and that KDELR3 is a
genuine melanoma metastasis progression gene.
KDELR3 and the ER Stress Response in metastatic melanoma
To uncover how KDELR3 expression may be involved with melanoma metastasis, we asked which
pathways were co-regulated with KDELR3 expression. Gene Set Enrichment Analysis (GSEA,
FDR < 0.0001) of KDELR3 co-expressed genes in TCGA skin cutaneous melanoma patients
(cBioPortal)30, 31, revealed Gene Ontology (GO) term enrichment of ECM and trafficking
pathways (consistent with previous data, Table 1, Supplementary Fig 2a), and pathways involved
in the ERSR and response to unfolded proteins (Supplementary Fig. 6a). Quantitative mass
spectrometry was used to analyze whole cell lysates of KDELR3 knockdown compared to non-
targeting controls and parental controls; GSEA analysis revealed the top-scoring, most consistent
pathway using GO term enrichment showed upregulation of ER lumen proteins (Supplementary
Fig. 6b). Enriched proteins included protein chaperones, lectins, and enzymes involved in protein
folding and targeting misfolded proteins for degradation (including UGGT, ER Lectin, FKBP7,
Calumenin), which is consistent with an increase in misfolded protein load in KDELR3 knockdown
cells32 We therefore asked how KDELR3’s role in the ERSR response is associated with its
metastasis phenotype. Metastasis is known to be linked with ER stress, activating the UPR and
therefore downstream signaling events that function to alleviate this stress17. High doses of ER
stress, or an ineffective UPR have been associated with deleterious signals and ultimately cell
death. We therefore hypothesized that one role of KDELR3 in metastasis would be to alleviate ER
stress-induced deleterious signaling (Supplementary Fig. 6c). We observed in four independent
mouse models of melanoma (N = 6-13 mice per model) that Perk (Eif2ak3) transcription was
negatively correlated with Kdelr3 transcription (Fig. 4a), whereas Gadd34 (Ppp1r15a)
transcription was positively correlated (Fig. 4b). As PERK is a protein kinase and GADD34 a
protein phosphatase that both act on EIF2α33, we hypothesized that KDELR3-low cells are primed
to activate the PERK-EIF2α arm of the UPR. We knocked down KDELR3 (KD) in both 1205Lu
.CC-BY-NC-ND 4.0 International licenseIt is made available under a was not peer-reviewed) is the author/funder, who has granted bioRxiv a license to display the preprint in perpetuity.
The copyright holder for this preprint (which. http://dx.doi.org/10.1101/721712doi: bioRxiv preprint first posted online Aug. 6, 2019;
and WM-46 human cell lines (shRNA knockdown; Supplementary Fig. 5b) and found that loss of
KDELR3 expression resulted in increased PERK and EIF2α protein levels in untreated cells,
corroborating our mouse model data (Fig. 4c). We also saw a concomitant increase in PERK and
EIF2α phosphorylation, suggesting constitutive activation of the PERK-EIF2α axis in untreated
KD cells (Fig. 4c). The other two branches of the UPR pathways, the IRE1-XBP1 and ATF6α
axes, were inactive in untreated KDELR3 KD cells (Supplementary Fig. 6d-e). Tunicamycin, a
chemical inhibitor of N-glycosylation that induces ER stress in cells, was used as a positive control
(Fig. 4c; Supplementary Fig. 6d-e).
Untreated KDELR3 KD cells exhibited reduced levels of BiP, an essential protein chaperone
necessary for activation of all arms of the UPR17, suggesting that retrograde transport in non-
stressed cell may be required for long-term maintenance of BiP homeostasis (Supplementary Fig.
6e)19. These data indicate that loss of KDELR3 expression disrupted ER homeostasis, resulting in
a dysregulated UPR, which has previously been linked with ER stress-associated cell death34. We
hypothesized that KDELR3 functions to alleviate deleterious ER stress-induced signaling
(Supplementary Fig. 6c). To test this, we asked if KDELR3 knockdown sensitizes metastatic
melanoma cells to ER stress-induced death. We treated cells with tunicamycin, and measured cell
death through flow cytometry using Live/Dead cell stain. We observed that siRNA-mediated
knockdown of KDELR3 expression resulted in a ~5-fold increase in metastatic melanoma cell
death over controls (8.3%, siKDELR3; 1.6%, siControl; Fig. 4d). These data suggest that KDELR3
promotes cell survival in metastatic melanoma cells, which likely influences metastatic potential.
KDELR3-knockdown cells have an enhanced sensitivity to ER stress induction with tunicamycin
(>13-fold difference in cell death: 28.4%, siKDELR3; 2.1%, siControl; Fig. 4d). These data
indicate that the ability of KDELR3 to relieve ER stress is crucial for adaptation and survival in
metastatic melanoma and may be instrumental to the metastatic phenotype.
KDELR3 mediates post-translational regulation of the metastasis suppressor KAI1
To further understand the role of KDELR3 in metastasis, we queried if KDELR3 knockdown would
increase expression of known metastasis suppressors in melanoma. To address this, we screened
.CC-BY-NC-ND 4.0 International licenseIt is made available under a was not peer-reviewed) is the author/funder, who has granted bioRxiv a license to display the preprint in perpetuity.
The copyright holder for this preprint (which. http://dx.doi.org/10.1101/721712doi: bioRxiv preprint first posted online Aug. 6, 2019;
protein expression of 5 melanoma metastasis suppressors following KDELR3 knockdown35, 36. Of
the 5 metastasis suppressors screened (BRMS1, Gelsolin, GAS1, NME1/NM23-H1, KAI1) only
KAI1 demonstrated an increase in expression following KDELR3 knockdown (Fig. 5a), in line
with our hypothesis. Moreover, we observed a change in KAI1 molecular weight distribution
following KDELR3 knockdown, suggesting alterations in KAI1 post-translational modification.
KAI1 protein upregulation was independent of transcriptional changes (Fig. 5b), supporting a
regulatory role for KDELR3 at the post-translational level. KAI1 has been shown to influence
metastasis through multiple mechanisms, including cell-cell adhesion, cell motility, cell death and
senescence, and protein trafficking in many cancer types, including melanoma37. To further
validate the role of KDELR3 on KAI1 protein regulation, we exogenously expressed KAI1 protein
in 1205Lu metastatic melanoma cells (in which endogenous KAI1 expression is relatively low)
and co-expressed both KDELR3-001 and KDELR3-002. Corroborating our initial findings, we
found that increased KDELR3 expression resulted in dramatically reduced KAI1 protein levels
(Fig. 5c), which could not be accounted for by KAI1 transcriptional changes (Fig. 5d-e). KAI1
protein glycosylation pattern was impacted reciprocally by knockdown and overexpression
experiments, supporting the notion that KAI1 post-translational modification pathways are
regulated by KDELR3, including an upregulation of a high molecular weight band in KDELR3
knockdown cells (Fig. 5f, red arrow) that we showed corresponds to a highly glycosylated form of
KAI1 (Fig. 5g). Glycosylated KAI1 has been linked to inhibition of cell motility and promotion of
cell death38, and has been shown to influence N-cadherin clustering and bone metastasis in AML39.
Owing to our protein expression data, we hypothesized that KDELR3 regulates KAI1 protein
degradation. We asked if KDELR3 regulates expression of the E3 ubiquitin ligase known to target
KAI1, gp78/Autocrine Motility Factor Receptor23, 40, hereafter gp78. Although we saw no
significant alterations in gp78 protein or RNA expression following KDELR3 knockdown (Fig. 5f,
h), we did observe a 3-fold increase in KDELR3 transcription following gp78/AMFR knockdown,
suggestive of a functional link between the two proteins (Fig. 5i). We identified a previously
undescribed interaction between KDELR3 and gp78, which was supported by evidence of co-
localization (Fig. 5j-k; Supplementary Fig. 7a). Interestingly, gp78 was first identified as a motility
factor associated with metastasis in several cancers41, including melanoma. We asked if the
KDELR3-gp78 interaction impacted gp78 function. We reasoned that gp78 ubiquitin ligase
.CC-BY-NC-ND 4.0 International licenseIt is made available under a was not peer-reviewed) is the author/funder, who has granted bioRxiv a license to display the preprint in perpetuity.
The copyright holder for this preprint (which. http://dx.doi.org/10.1101/721712doi: bioRxiv preprint first posted online Aug. 6, 2019;
substrates would be upregulated following gp78 knockdown, as these proteins would not be
targeted for degradation; however, not all upregulated proteins identified will be direct gp78
substrates. Quantitative mass spectrometry was used to analyze whole cell lysates of gp78 (AMFR)
knockdown or KDELR3 knockdown cells compared to non-targeting controls. We could confirm
that 43-57% of upregulated proteins matched between the gp78 and KDELR3 knockdown groups.
GSEA showed that the top-scoring, upregulated pathways (FDR <0.05) for both groups using GO
term enrichment were those associated with the ER (Supplementary Table 3-4). This result
suggests that both gp78 and KDELR3 act within similar cellular pathways and supports a role for
KDELR3 in gp78 function, highlighting at least one mechanism through which KDELR3 can
influence metastasis at the post-translational level. Since gp78 is a ubiquitin ligase known to
function in ERAD, our data link KDELR3 to ERAD regulation. In summary, our work implicates
KDELR3 in glycosylation of the metastasis suppressor, KAI1, and in its degradation through gp78
(and likely other ERAD effectors), thereby providing a mechanism for KDELR3’s influence on
the metastatic phenotype (Fig. 5l).
KDELR3 correlates with late-stage metastasis and poor prognosis in melanoma patients
To assess how KDELR3 contributes to melanoma progression in patients, we utilized multiple
melanoma patient databases, The Cancer Genome Atlas30, 42 (TCGA) and Gene Expression
Omnibus (GEO; GSE840129, GSE1923428). We found increased expression of the KDELR3-001
transcript, but interestingly not the alternate transcript, KDELR3-002, in late-stage (stage III and
IV) metastatic melanoma patients compared to early-stage (stage I and II) melanoma patients (Fig.
6a), consistent with a role for KDELR3 in melanoma progression. Metastatic melanoma patients
with KDELR3 copy number amplifications demonstrated reduced survival relative to patients
without such alterations (Supplementary Fig. 7b). We next assessed melanoma patient survival
using KDELR3 expression as a prognostic marker (GEO28, 29). High KDELR3-expressing late-
stage metastatic melanomas show statistically significant association with poor patient outcome,
whereas KDELR3 expression levels in early-stage primary tumor samples did not (Fig. 6b-c).
Taken together these data strongly support a role for KDELR3 in the advancement of late-stage
metastatic melanoma and implicate KDELR3 as a bona fide MetDev gene.
.CC-BY-NC-ND 4.0 International licenseIt is made available under a was not peer-reviewed) is the author/funder, who has granted bioRxiv a license to display the preprint in perpetuity.
The copyright holder for this preprint (which. http://dx.doi.org/10.1101/721712doi: bioRxiv preprint first posted online Aug. 6, 2019;
KDELR3 and KDELR1 knockdown have opposing effects on lung colonization
As KDELR3 is the only member of the KDELR family to be identified as a MetDev gene by our
analyses, including embryonic-specific upregulation and consistent upregulation in melanoma cell
lines, we posited that different KDELR members have different functions in melanoma
etiology/progression. To address this, we asked which pathways were co-regulated with KDELR1
expression and if these are the same or different relative to KDELR3-regulated pathways. GSEA
analysis (FDR < 0.0001) of KDELR1 co-expressed genes in TCGA skin cutaneous melanoma
patients (cBioPortal)30, 31 revealed a strong enrichment of mitochondrial, metabolic and protein
synthesis pathways (top 10 GO term enrichment, Fig. 7a), which differed from the most enriched
pathways in KDELR3 co-expressed genes that consisted predominantly of ECM, trafficking and
ERSR pathways (top 10 GO term enrichment, Fig. 7b). Moreover, knockdown of
KDELR3/KDELR1 did not consistently alter expression of each other, suggesting that expression
of these genes is not intrinsically linked (Supplementary Fig. 7c-d). These data intimate that
KDELR1 and KDELR3 play different roles in melanoma progression. To test this, we compared
the behavior of KDELR3 and KDELR1 knockdown cells using experimental metastasis assays.
Notably, in contrast to KDELR3 knockdown, which predictably diminished metastasis, KDELR1
knockdown actually increased metastasis, suggesting that KDELR1 contributes in a different way
to melanoma etiology and can function as a metastasis suppressor (Fig. 7c-d). Moreover, analysis
of KDELR1 expression in skin cutaneous melanoma patients (TCGA) showed, unlike KDELR3,
no significant difference between early-stage melanoma patients and late-stage metastatic
melanoma patients (Fig. 7e). These data demonstrate that despite assumed redundancy between
KDELR family members, KDELR3 and KDELR1 must have distinct roles, at least with respect to
metastatic competence.
Discussion
Here we propose that metastatic cancer cells exploit innate pathways that are hardwired within
their cellular lineage to ensure proper development. These pathways, quieted in the differentiated
.CC-BY-NC-ND 4.0 International licenseIt is made available under a was not peer-reviewed) is the author/funder, who has granted bioRxiv a license to display the preprint in perpetuity.
The copyright holder for this preprint (which. http://dx.doi.org/10.1101/721712doi: bioRxiv preprint first posted online Aug. 6, 2019;
cell, can be reactivated under pathologic conditions. The genetic/epigenetic reactivation of
pathways that allow embryonic melanocytes to migrate, invade and colonize would represent an
efficient strategy for melanoma cells to successfully metastasize. Here we employed a GEM model
to identify, at the transcriptome level, novel genes that are required during melanocyte
development and find that these are enriched in genes that are specific for progression of late-stage
disease. We functionally validated 4 out of 4 genes tested, demonstrating the value of our dataset
and supporting our hypothesis. We anticipate that other genes that passed our filtering criteria will
ultimately prove to be functionally relevant and deserving of further analysis in future studies.
We report a mechanistic analysis of our top hit and melanoblast gene, KDELR3, a member of the
KDEL receptor family. KDELR3 has neither been previously associated with cutaneous melanoma
metastasis nor investigated in depth in the literature. Differences between KDELRs have been
cited in the literature but the main focus has been the role of KDELR119, 20, 43-45. All three KDELR
family members have been shown to mediate retrograde transport of proteins containing a C-
terminus KDEL-like motif19. KDELRs typically reside in the cis-Golgi; however, tagged KDELRs
are known to localize in both the cis- and trans-Golgi, which is consistent with our results46. Upon
interaction with KDEL-like motif-containing proteins, KDELRs facilitate transport from the Golgi
Apparatus back to the ER via COPI vesicles47. When this system fails, KDEL-like motif-
containing proteins have been shown to be secreted out of the cell19. Our data demonstrating
reduced BiP protein in stable KDELR3 knockdown cells suggest that BiP is a genuine substrate
for KDELR3 retrograde trafficking, and that without KDELR3 expression melanoma cells are
unable to maintain normal BiP levels. KDELRs appear to differ in the substrates that they
preferentially transport, suggesting they have distinct roles within the cell19. How preferential
substrate binding of KDELRs may affect cellular biology or disease etiology is still unknown.
Our study is the first to show that distinct KDELRs mediate dramatically different experimental
metastasis phenotypes. We demonstrate that the embryonic melanoblast gene, KDELR3, is a
metastasis enhancer in both mouse and human melanoma cells, whereas KDELR1 suppresses
metastasis, despite having extensive homology and similar retrograde trafficking functions. Our
data allow a new perspective when interpreting existing KDELR literature and present a dichotomy
between KDELR3 and KDELR1 metastasis phenotypes that could be leveraged in future studies to
understand how these retrograde trafficking receptors function in disease. Moreover, Trychta and
.CC-BY-NC-ND 4.0 International licenseIt is made available under a was not peer-reviewed) is the author/funder, who has granted bioRxiv a license to display the preprint in perpetuity.
The copyright holder for this preprint (which. http://dx.doi.org/10.1101/721712doi: bioRxiv preprint first posted online Aug. 6, 2019;
colleagues have reported tissue-specific KDELR expression patterns in rats implying that different
KDELRs may have lineage-specific roles19. This is the first study to document KDELR expression
in melanocyte development, and a specific role for KDELR3.
The KDEL receptors are intrinsically linked to ER stress and proteostasis. KDELR retrograde
trafficking substrates include protein chaperones, protein folding chaperones, protein folding
enzymes, enzymes that target proteins for degradation and glycosylation enzymes19. Cumulatively,
these protein substrates help maintain correct protein processing, and regulate cellular response to
ER stress20. However, the role of ER stress response in tumor progression has been much debated48.
The success of proteasome inhibitors in the treatment of multiple myeloma patients49, as well as
provocative data linking ER stress pathways to vemurafenib-resistant melanoma and
immunotherapy sensitization, suggest UPR/ERAD biology could be harnessed for treating
metastatic melanoma50-54. Our analysis implicates both UPR and degradation pathways of the
ERSR as acting downstream of KDELR3. We show that KDELR3 expression is critical for
adaptation of melanoma cells to ER stress and provide evidence that PERK-EIF2α expression and
activation is regulated by changes in KDELR3 expression levels. Activation of the PERK-EIF2α
pathway is known to result in translational attenuation, a cellular mechanism to alleviate ER load,
causing translational rewiring of cells and affecting metastasis15, 17, 48, 55-57, which may contribute
to KDELR3’s metastatic role.
We demonstrate that KDELR3 is a regulator of glycosylated KAI1, a tetraspanin glycoprotein with
a well-documented metastasis suppressor role in tumors, including melanoma23, 36, 37, 58, 59. KAI1
functions at the cell membrane to mediate interactions between extracellular and intercellular
signaling, which is key to its metastatic suppressor function. KAI1 glycosylation leads to changes
in its membrane organization and therefore its ability to mediate this extracellular/intercellular
signaling38, 39, 60. However, no studies have linked specific KAI1 glycosylated forms with its
metastasis suppressor function in vivo. Our work notes specific glycosylated forms of KAI1 that
are subject to KDELR3 regulation and associated with metastatic function. Future work would
benefit from determining how critical each of these forms are to KAI1’s metastatic influence in
vivo. Previously KDELR1 was shown to mediate signaling and transcriptional networks43, and at
the protein level, in the relocation of lysosomes and modulation of autophagy61. However,
KDELR3 was shown to be inactive in these processes. Here we link KDELR3 to post-translational
.CC-BY-NC-ND 4.0 International licenseIt is made available under a was not peer-reviewed) is the author/funder, who has granted bioRxiv a license to display the preprint in perpetuity.
The copyright holder for this preprint (which. http://dx.doi.org/10.1101/721712doi: bioRxiv preprint first posted online Aug. 6, 2019;
regulation of protein, specifically through post-translational modification (glycosylation) and
degradation of the metastasis suppressor, KAI1. Our data insinuate an interaction with gp78,
implicating ERAD in this process. This biology may be informative for developing therapeutics
for KDELR3-high metastatic melanoma patients.
We here identify an enrichment of ECM organization and trafficking genes within our MetDev
cohort, consistent with a known role for these in metastasis62-64. Further analysis of these
genes/pathways may prove a rich resource to uncover novel metastasis biology. We found that two
such genes, KDELR3 and P4HA2 (a collagen prolyl 4-hydroxylase involved in ECM remodeling
and associated with worse clinical outcome in melanoma patients65), from our 4-gene functional
validation screen are tightly co-expressed in four independent mouse models and in human
melanoma patients. This raises the possibility that expression of some genes within our MetDev
cohort may be coordinated and/or networked to realize the complex and dynamic phenotypes
exhibited by melanocytic cells during development and metastasis. Uncovering common upstream
regulators of co-regulated genes could prove a powerful approach to target metastatic melanoma
as multiple pathways could be targeted simultaneously.
To our knowledge this is the first example in which the mouse melanoblast transcriptome has been
exploited to generate a resource of novel melanoma metastasis genes. The success of this study
supports the use of developmental models to uncover innate melanoma biology that may be at the
root of melanoma’s propensity to metastasize2-9, 11-13, 66. We anticipate that further exploration of
KDELR3 and other now-uncovered embryonic genes/pathways will facilitate the development of
more effective treatment strategies for patients with advanced melanoma, and perhaps other tumor
types. The field would further benefit from elucidation of the specific melanoblast cell
characteristics/cell states that in fact contribute to metastasis. In summary, this work describes the
creation of a novel resource of putative MetDev genes, enriched in genes that have functional roles
in melanoma metastasis that may prove to be useful targets for designing more effective
approaches to the treatment of melanoma patients.
.CC-BY-NC-ND 4.0 International licenseIt is made available under a was not peer-reviewed) is the author/funder, who has granted bioRxiv a license to display the preprint in perpetuity.
The copyright holder for this preprint (which. http://dx.doi.org/10.1101/721712doi: bioRxiv preprint first posted online Aug. 6, 2019;
Methods
Mouse models of melanoma
Experimental metastasis studies were performed using a filtered, single-cell suspension in PBS.
9.44x10⁵ (1205Lu) and 2x10⁵ cells (B16) were injected in 100 µl volume into the tail vein of 6-8-
week-old ATHYMIC NCr-nu/nu mice (01B74, Frederick National Laboratory for Cancer
Research) or C57BL/6N mice (Charles River, Frederick National Laboratory for Cancer
Research), respectively. Lungs were removed from mice 4.5 weeks (1205Lu) or 24 days
(C57BL/6N) post injection, perfused, and fixed in 10% phosphate buffered formalin (Fisher
Scientific) for histology. Metastatic nodules were counted under a dissecting microscope.
Tumor growth studies were performed by injecting 3.47x10⁵ 1205Lu cells in a single-cell
suspension subcutaneously into the flanks of 6-8-week-old ATHYMIC NCr-nu/nu mice (01B74,
Frederick National Laboratory for Cancer Research). Tumor size was estimated using the formula:
tumor volume (mm3) = 4/3π * (length/2) * (width/2) * height, where parameters were measured in
mm.
Melanoblasts and melanocytes were isolated from the iDct-GFP mouse model8. Embryonic
development was timed based on number of days post-coitum. Pregnant females and newborn
pups were placed on a doxycycline-enriched diet to activate expression of GFP.
Melanomas in Figure 4a-b and Supplementary Figure 3a were derived from the following four
mouse melanoma models: M1; Albino C57BL/6 background, with BrafCA/+; Ptenflox/+;
Cdkn2aflox/+; Tyr-CreERT2-tg transgenic alleles. UV used as the tumor-inducing carcinogen; M1
mice were treated at postnatal day 3. M2; C57BL/6 background, with BrafCA/+; Cdkn2aflox/+; Tyr-
CreERT2-tg; Hgf-tg transgenic alleles, UV used as the tumor-inducing carcinogen; M2 mice were
treated at postnatal day 3. M3; C57BL/6 background, Cdk4R24C; Hgf-tg transgenic alleles, DMBA
used as the tumor-inducing carcinogen; M3 mice were treated at postnatal day 3. M4; C57BL/6
background, with Hgf-tg transgenic allele, UV used as the tumor-inducing carcinogen; M4 mice
were treated at postnatal day 3.
.CC-BY-NC-ND 4.0 International licenseIt is made available under a was not peer-reviewed) is the author/funder, who has granted bioRxiv a license to display the preprint in perpetuity.
The copyright holder for this preprint (which. http://dx.doi.org/10.1101/721712doi: bioRxiv preprint first posted online Aug. 6, 2019;
Isolation of melanoblasts and melanocytes
FVB/N iDct-GFP dams were fed doxycycline-fortified chow for the entire duration of gestation
until collection of E15.5, E17.5 and P1 pups. Doxycycline was injected intraperitoneally at 80 μg/g
body weight 24 hr before collection of P7 pups. A single cell suspension was generated from
embryos and skin of newborn pups. Multiple litters were used for each developmental sage, and
embryos/pups from each stage were pooled to ensure adequate numbers of GFP+ cells. The head
was removed to prevent collection of GFP positive cells in the embryonic telencephalon, and
melanocytes from the inner ear or from the retinal pigmented epithelium (RPE) were discarded.
Excess tissue was also removed. The spinal cord was kept intact as some melanoblasts still remain
in the neural crest area. At E17.5, P1 and P7 stages, most melanocytes have reached the dermis,
thus only the skin was collected from these developmental stages. Back skin was immersed in a
shallow layer of 1X PBS and subcutaneous fat was scraped off until skin appeared translucent.
E15.5 was the youngest age assessed due to the necessity to capture sufficient cells for RNA-
sequencing.
Preparation of single cell suspensions
Tissue was minced and incubated for 30 min at 37°C in digestion media containing RPMI 1640
(Gibco Life Technologies) with 200 units/ml Liberase TL (Roche Applied Science). Up to 1g of
tissue was digested per 5 ml digestion media. Tissue was processed using a Medimachine (BD
Biosciences) and sterile medicon units (BD Biosciences). Cells were extracted using 1.5-2 ml of
RFD solution (24 ml RPMI media, 6 ml FBS, 300 µl 5% DNase I) through a 20 ml syringe with
18-gauge needle. Collected cells were filtered through a 50-micron filter (BD Biosciences). This
process was repeated until all the tissue was processed. Cells were spun at 1200 rpm, 4°C for 5
min and resuspended twice in a solution of 1% BSA in PBS and filtered through a 30-micron filter
for sorting.
Fluorescence activated cell sorting (FACS)
.CC-BY-NC-ND 4.0 International licenseIt is made available under a was not peer-reviewed) is the author/funder, who has granted bioRxiv a license to display the preprint in perpetuity.
The copyright holder for this preprint (which. http://dx.doi.org/10.1101/721712doi: bioRxiv preprint first posted online Aug. 6, 2019;
Embryos of the same developmental age that were heterozygous for the TRE-H2B-GFP gene but
lacked the Dct-rtTA gene were used as negative controls. Cell doublets were excluded from the
analysis. Cells were sorted based on GFP expression and SSC-A. Based on these reference sorts,
gates were set so that background cells represented less than 10% of sorted cells.
RNA Isolation and RNA sequencing
Cells were lysed in 10-fold TRIzol reagent (w/v), phases were separated by addition of 0.2X
volume of chloroform, the aqueous phase was combined with an equal volume of 70% ethanol and
applied to a RNeasy Micro column (Qiagen) and processed as per the manufacturer’s instructions.
Paired-end sequencing libraries were prepared using 1 μg of purified RNA following the mRNA-
Seq Sample Prep Kit according to the manufacturer’s instructions (Illumina). RNA-Seq libraries
were sequenced on two lanes each of an Illumina GAIIx Genome Analyser to a minimum depth
of 49 million reads. Sequence reads were aligned to the mm9 genome using the TopHat software
(https://ccb.jhu.edu/software/tophat/index.shtml). Quantified Fragments Per Kilobase of transcript
per Million mapped reads (FPKM) values were generated using the Cufflinks software (http://cole-
trapnell-lab.github.io/cufflinks/). The UCSC KnownGenes gene models were used for guided
alignment and quantification.
Analysis of MetDev genes in patient survival
Based on the RNASeq data for the samples E15, E17, P1 and P7, we used DESeq2 to find
differentially expressed genes comparing E15, E17 vs. P1, P7. We selected 467 up regulated genes
with q-value < 0.1 (based on glm model) and log2FoldChange > 1.5. We then used the GEO dataset
GSE19234 to perform survival analysis using Cox proportional hazards model for each gene. We
to selected 43 genes that were correlated patient overall survival with the patient survival with p-
value < 0.1 and HR >1. The Figure 1c-d showed the heatmaps of the gene expression (using z-
score) for the 467 genes and 43 genes respectively. The sum of the total expression of the 43 genes
forms the expression signature for prognosis prediction and the signature was tested on the new
.CC-BY-NC-ND 4.0 International licenseIt is made available under a was not peer-reviewed) is the author/funder, who has granted bioRxiv a license to display the preprint in perpetuity.
The copyright holder for this preprint (which. http://dx.doi.org/10.1101/721712doi: bioRxiv preprint first posted online Aug. 6, 2019;
dataset GSE8401. Among the late-stage patients, the patients with high expression signature had
significant poor survival compared to those with low expression (P=3.486e-5, Logrank test, Figure
1e) while for the early stage patients the two groups had no difference in survival (Figure 1e-f).
Gene filtration pipeline for functional analysis
From our 467 identified melanoblast genes we first filtered for only those genes whose P7
expression level was minimal (FPKM < 2) i.e. no functional P7 gene expression to our knowledge,
reasoning these would denote genes that truly had a unique role in melanoblast development
compared to differentiated melanocytes. Next, we validated these by identifying the genes that are
the intersect of the 467 genes with the differentially expressed genes from microarray expression
data derived from our iDct-GFP model (E17.5 vs P2 and P7)21. The microarray differential gene
expression was identified using a linear regression model with contrast to compare embryonic
versus postnatal stages and selected with a q-value < 0.1. The intersect yielded 233 genes. We
acknowledge that the microarray data is not as thorough a representation of
melanoblast/melanocyte development as our developmental cohort and therefore we may incur
false negatives, we deemed this acceptable however to shorten our list for experimental validation.
Next, we filtered the list to 81 genes with > 2.75 log2 fold increase expression in melanoblasts vs
melanocytes and P-value <0.0003. Finally, we reasoned that genes with the greatest expression at
embryonic stages would likely be the most functionally relevant, so selected for the top 20 greatest
mean embryonic expression. Of these 20 we noted that 7 genes (Kdelr3, P4ha2, Gulp1, Dab2,
Lum, Aspn, Mfap5) were all associated with Extracellular Matrix (ECM) or trafficking. Of these
we chose to test the 3 least studied genes in metastasis (Kdelr3, P4ha2, Gulp1) to uncover novel
metastasis biology, and the 1 gene well studied in metastasis (Dab2).
Statistical analysis of KDELR3 expression in microarray data
Mouse developing melanoblasts (E17.5, n = 3) and differentiated melanocytes (P2, n = 3) were
isolated and RNA extracted for microarray analysis as previously described21. The raw data
.CC-BY-NC-ND 4.0 International licenseIt is made available under a was not peer-reviewed) is the author/funder, who has granted bioRxiv a license to display the preprint in perpetuity.
The copyright holder for this preprint (which. http://dx.doi.org/10.1101/721712doi: bioRxiv preprint first posted online Aug. 6, 2019;
(GSE25164 and unpublished, probe ID’s 1690129, 4920546) from Illumina mouseRef-8 v1.1
(GSM618249) expression beadchip were processed with variance stabilization transformation
(VST) and quantile normalization as implemented in R lumi package
(http://bioconductor.org/packages/release/bioc/html/lumi.html). Unpaired two-tailed t-test with
Welch’s correction was used to compare the mean expression of KDELR3 between the two
developmental stages. As two probes for KDELR3 on the Illumina beadchip showed high positive
correlation (r = 0.987), the average KDELR3 expression was analyzed.
Analysis of The Cancer Genome Atlas (TCGA) skin cutaneous melanoma expression
All patient samples were collected between 0-14 days after disease classification (101 patients).
Processed level 3 RNA-seq by Expectation-Maximization (RSEM) values67 were imported for
melanoma patients from The Cancer Genome Atlas collection (TCGA-SKCM). Bioconductor
edgeR (ttps://bioconductor.org/packages/release/bioc/html/edgeR.html) and limma
(https://bioconductor.org/packages/release/bioc/html/limma.html) R packages were used for
further processing and differential expression analysis. Transcripts with CPM (counts per million)
greater than 1 in at least fifty percent of the samples were retained and processed with trimmed
mean of M-values (TMM) and voom normalization methods68. The empirical Bayes moderated
t-statistic test69 was applied to test the null hypothesis both for no difference in KDELR3
expression, or for KDELR1 expression level between early and late stage melanoma patients. A
P-value of 0.05 or less was considered statistically significant.
Statistics and general methods
All sample sizes were determined based on preliminary studies and prior knowledge of expected
variability within assays. For animal studies, age-matched (6-8 weeks) female ATHYMIC NCr-
nu/nu mice and C57BL/6 mice were randomly assigned to control and test groups. Blinding was
.CC-BY-NC-ND 4.0 International licenseIt is made available under a was not peer-reviewed) is the author/funder, who has granted bioRxiv a license to display the preprint in perpetuity.
The copyright holder for this preprint (which. http://dx.doi.org/10.1101/721712doi: bioRxiv preprint first posted online Aug. 6, 2019;
used to quantify lung metastases counts. Where blinding was not used, data was analyzed using
automated image analysis software when possible. All statistical tests used were deemed
appropriate and met the assumptions required. Where necessary unequal variance was corrected
for, or if no correction was used variation was assumed equal based on prior knowledge of the
experimental assay. All cell lines used in this paper were identified correctly as per the
International Cell Line Authentication Committee, version 8.0 (NB. MDA-MB-435 and MDA N
cell lines in NCI60 were correctly identified as melanoma-derived cell lines). All cell lines used
in experiments were screened for mycoplasma contamination and were tested negative for
mycoplasma contamination. Cell lines were authenticated by examining their expression of
melanoma markers using qPCR and RT-PCR analyses, and validating expression levels to those
previously reported in published data. Human melanoma cell lines (1205Lu, WM-46 and SK-
MEL-28) were validated using human-specific TRP2, SOX10, TYRP-1 primers. Mouse melanoma
cell line (B16) was validated using mouse-specific MITF, TRP2, TYR primers.
All mouse experiments were performed in accordance with Animal Study Protocols approved by
the Animal Care and Use Committee (ACUC), NCI, National Institutes of Health. NCI is
accredited by AAALACi and follows the Public Health Service Policy on the Care and Use of
Laboratory Animals. Studies were carried out according to ASP # 16-007 and LMB-042. All
animals used in this research project were cared for and used humanely according to the following
policies: The U.S. Public Health Service Policy on Humane Care and Use of Animals (2015); the
Guide for the Care and Use of Laboratory Animals (2011); and the U.S. Government Principles
for Utilization and Care of Vertebrate Animals Used in Testing, Research, and Training (1985).
The experimental records of animal studies in this project are maintained in a style consistent with
ARRIVE guideline. Here we follow the guideline to report the results of animal studies in this
manuscript.
Code Availability
Upon acceptance of the manuscript custom code will be made publicly available and a full code
availability statement will be included here.
.CC-BY-NC-ND 4.0 International licenseIt is made available under a was not peer-reviewed) is the author/funder, who has granted bioRxiv a license to display the preprint in perpetuity.
The copyright holder for this preprint (which. http://dx.doi.org/10.1101/721712doi: bioRxiv preprint first posted online Aug. 6, 2019;
Melanoma cell lines
Human melanoma cells, 1205Lu and WM-46, were obtained from the Wistar Institute (courtesy
of Meenhard Herlyn). SK-MEL-28 cells were obtained from (ATCC). 1205Lu cells were cultured
in Tu2% media (as described by the Wistar Institute). WM-46 and SK-MEL-28 cells were cultured
in 1X RPMI 1640, with 10% Serum and 2mM L-Glutamine (Gibco Life Technologies). For WM-
46 cells flasks were coated with 0.1% gelatin (Stemcell). B16 mouse melanoma cells were
obtained from Isaiah J. Fidler, M. D. Anderson Cancer Center70. Human 1205Lu cells were
transduced with a high multiplicity of infection (MOI) of FerH-ffLuc-IRES-H2B-eGFP expressing
lentivirus (11346-M04-653, Frederick National Laboratory for Cancer Research, Proteomics
Facility, courtesy of Dominic Esposito)70. GFP-expressing cells were sorted using Fluorescence-
activated cell sorting (BD FACSDiva 8.0.1, Flow Cytometry Core Facility, National Cancer
Institute).
GIPZTM Lentiviral shRNA Particles were obtained from Dharmacon™. KDELR3 shRNA
(V3LHS_307898, gene target sequence: TGTGCCTATGTTACAGTGT), or non-silencing
negative control (RHS4348) lentivirus were infected at both 34-43 transducing units (TU)/ cell,
and also at 25 TU/cell for a separate experiment. Cells were selected and maintained in puromycin
selection.
Wobble mutant cell lines were generated using the QuikChange II Site-Directed Mutagenesis Kit
(Agilent Technologies). The KDELR3 shRNA recognition sequence was edited
(t210c_c213a_t216c_t219c_a222c) from Myc-DDK-tagged KDELR3 transcript variant 1
construct (RC201571, OriGene). TOPO cloning was used to clone place this sequence into the
Gateway cloning system and the pENTR L1/L2 plasmid was combined with C413-E19 pPol2
L4/R1 and pDEST-658 R4/R2 destination plasmids. Lentivirus was produced in the Protein
Expression Laboratory, Leidos Biomedical Research, Inc., Frederick National Laboratory for
Cancer Research. Cells previously transduced and selected with KDELR3 shRNA and non-
targeting control shRNA (Dharmacon, see previous), were transduced with 32.2 infection units
.CC-BY-NC-ND 4.0 International licenseIt is made available under a was not peer-reviewed) is the author/funder, who has granted bioRxiv a license to display the preprint in perpetuity.
The copyright holder for this preprint (which. http://dx.doi.org/10.1101/721712doi: bioRxiv preprint first posted online Aug. 6, 2019;
(ifu) per cell, cells were transduced by spinoculation for 1 hour at 1200 xg. Infected cells were
selected using blasticidin.
Forward primer
5’-
GTAATGAAGGTGGTTTTTCTCCTCTGCGCATACGTCACCGTGTACATGATATATGGG
AAATTCCG -3’
Reverse primer
5’-
CGGAATTTCCCATATATCATGTACACGGTGACGTATGCGCAGAGGAGAAAAACCAC
CTTCATTAC-3’
Human gp78/AMFR expression vector was cloned using AMFR (NM_001144) sequence
(RG209639, Origene) into pDest-653 destination vector by the Protein Expression Laboratory,
Leidos Biomedical Research, Inc., Frederick National Laboratory for Cancer Research
(mPol2p>Hs.AMFR-mCherry, 19771-M01-653). Lentivirus was produced in the Protein
Expression Laboratory, Leidos Biomedical Research, Inc., Frederick National Laboratory. Cells
were infected using a Multiplicity of Infection (MOI) of 5 and 8.8. Infected cells were selected
using Fluorescence-Activated Cell Sorting for mCherry expression.
siRNA knockdown of gene expression
For experimental metastasis assays siRNA knockdown experiments were performed 2 days prior
to injection, as follows: siGENOME Human KDELR3 (11015) siRNA SMARTpool (M-012316-
02-0010, DharmaconTM) for KDELR3 siRNA knockdown in human cell lines, and siGENOME
Mouse Kdelr3 (105785) siRNA SMARTpool (M-052192-00-0005, DharmaconTM) for Kdelr3
knockdown in the mouse cell lines. For control knockdown, siGENOME Non-Targeting siRNA
Pool #1 was used (D-001206-13-20, Dharmacon). For KDELR1 knockdown in human cells,
siGENOME Human KDELR1 siRNA SMARTpool (M-019136-01-0005, DharmaconTM) was
.CC-BY-NC-ND 4.0 International licenseIt is made available under a was not peer-reviewed) is the author/funder, who has granted bioRxiv a license to display the preprint in perpetuity.
The copyright holder for this preprint (which. http://dx.doi.org/10.1101/721712doi: bioRxiv preprint first posted online Aug. 6, 2019;
used, Gene knockdown was done following the manufacturer’s instructions using DharmaFECT
1 Transfection Reagent (T-2001-02, Dharmacon). All other assays were performed using both the
siGENOME siRNAs, including siGENOME Human AMFR siRNA SMARTpool (M-006522-01-
0005, DharmaconTM), and ON-TARGET Plus SMARTpool siRNAs for human KDELR3 (L-
012316-00-0005, DharmaconTM), human KDELR1 (L-019136-01-0005, DharmaconTM) and ON-
TARGET plus™ Control Pool (Non-targeting control, D-001810-10-20, DharmaconTM). Using
either the DharmaFECT 1 Transfection Reagent (T-2001-02, Dharmacon) or the Mirus TransIT-
X2® (Mirus) system as per the manufacturers’ instructions. Results were consistent between the
all knockdown methodologies.
Anchorage-independent growth assays
In 6-well plates 50,000 cells (B16 Kdelr3 knockdown/ SK-MEL-28 KDELR3 overexpression),
15,000 cells (WM-46 KDELR3 knockdown), or 2,000 cells (WM-46 KDELR3 rescue experiments)
were plated in 0.4% Bacto™ Agar (Becton, Dickinson and Company) in 1X RPMI 1640 (Gibco
Life Technologies) solution over a layer of 0.5% Agar-RPMI. Media was replenished twice
weekly, and cell growth assessed at 4-weeks post plating. Wells were fixed in 10% Methanol/ 10%
Acetic Acid fixation solution with subsequent staining using 0.01% crystal violet staining (Sigma-
Aldrich)/ 10% Methanol solution. Colonies were analyzed under a dissecting microscope, and by
imaging (Alpha Innotech imager) with subsequent analysis (Fluorchem HD2 software).
Immunohistochemistry (IHC) and Immunofluorescence (IF) staining
Formalin-fixed paraffin-embedded (FFPE) immunofluorescence of iDct-GFP mouse skin sections
was performed using Heat Induced Epitope Retrieval (HIER) in Target retrieval buffer, pH 6
(Dako) for 7 min in an IHC microwave, followed by 15 min cooling on the bench. Overnight
incubation (4⁰C) was with 1:50 Rabbit monoclonal KDELR3 (NBP1-00896, Novus Biological;
1DB_ID, 1DB-001-0000718990) followed by incubation with a biotinylated secondary antibody.
Slides were blocked with rabbit serum prior to overnight incubation (4⁰C) with 1:500 PEP-8H
.CC-BY-NC-ND 4.0 International licenseIt is made available under a was not peer-reviewed) is the author/funder, who has granted bioRxiv a license to display the preprint in perpetuity.
The copyright holder for this preprint (which. http://dx.doi.org/10.1101/721712doi: bioRxiv preprint first posted online Aug. 6, 2019;
(Dct) Rabbit monoclonal antibody71 (courtesy of Vincent Hearing). Avidin conjugated Dy-Light
594 (1:300) and Alexa Fluor secondary antibodies were used. Sections were analyzed using
confocal microscopy.
FFPE lung sections were incubated for 15 min in Target retrieval buffer, pH6 (Dako) using HIER,
and left for 15 min to cool. 1:50 KDELR3 (NBP1-00896, Novus Biological; 1DB_ID, 1DB-001-
0000718990, Lot# CA36131)/ 1:400 KDEL Receptor 3 (L95) polyclonal (Bioworld Technology
Cat# BS3124, RRID:AB_1663176, Lot# CA36131), and 1:250 HLA A (Abcam Cat# ab52922,
RRID:AB_881225) antibodies were incubated for 1 hour, room temperature. Polymer detection
was performed with ImmPRESS AP Reagent Kit, Anti-Rabbit Ig (Vector Laboratories).
Chromagen staining was done using ImmPACT™ Vector Red Alkaline Phophatase substrate kit
(Vector Laboratories), as per the manufacturer’s instructions. Sections were analyzed by a board-
certified Veterinary Pathologist using the color deconvolution v9 algorithm in Aperio Image Scope
v12.0.1.5027 software. Metastatic counts were generated with particle analysis in ImageJ software.
WM-46 cells stably transduced with FLAG-tagged KDELR3-001 (ENST00000216014) were
transfected with GFP-tagged AMFR construct (Origene, RG209639) using FuGENE® HD
transfection reagent as per the manufacturer’s instructions. Cells were plated on 0.1% gelatin-
coated (Stemcell) glass coverslips and fixed with 4% paraformaldehyde for 15 min. Cells were
permeabilized in 0.1% Triton-X-100 in PBS for 30 min, and blocked in 4% BSA in 0.05% Triton-
X-100 in PBS for 10 min. Antibody incubation was for 1 hour, room temperature with: 1:50
Calnexin pAb (Abcam Cat# ab93355, RRID:AB_10563523, GR65788-22), 1:1000 Anti-DDK
(FLAG) Clone 4C5 (OriGene Cat# TA50011-100, RRID:AB_2622345, Lot# A031), 1:75 GFP
(D5.1) XP® mAb (Cell Signaling Technology Cat# 2956S, RRID:AB_1196615, Lot# 2). Then co-
stained with Alexa Fluor 488, 594 and 633 antibodies for 30 min, room temperature. Coverslips
were mounted using mounting medium with DAPI (Vectashield, H-1200) and analyzed by
confocal microscopy.
Flow Cytometry Analysis of Melanoma Cells
.CC-BY-NC-ND 4.0 International licenseIt is made available under a was not peer-reviewed) is the author/funder, who has granted bioRxiv a license to display the preprint in perpetuity.
The copyright holder for this preprint (which. http://dx.doi.org/10.1101/721712doi: bioRxiv preprint first posted online Aug. 6, 2019;

Cell viability was assessed using LIVE/DEADTM Fixable Violet Dead Cell Stain kit (Invitrogen,
Life technologies™). Three-days post siRNA knockdown of KDELR3 or non-targeting control.
Melanoma cells were fixed and stained as per the manufacturer’s instructions. When indicated,
cells were treated with DMSO vehicle control or 2.5 μg/ml tunicamycin 18 hours before fixation
Cell cycle analysis was performed using incubation of live cells with 10 µM 5-bromo-2’-
deoxyuridine (BrdU) for 45 min (1205Lu) or 90 min (WM-46). Cells were fixed drop-wise with
100% ethanol to a final concentration of 70% ethanol at 4°C. Cells were resuspended in 0.5 mg/ml
RNase A (37°C), and permeabilized with a solution of 5 M HCl 0.5% Triton-X-100 in dH2O for
20 min. Cells were incubated with 1:200 BrdU antibody (Cell Signaling Technology Cat# 5292S,
RRID:AB_10548898, Lot# 3), and stained with either 1:200 Alexa Fluor-647 (1205Lu cells;
Invitrogen), or 1:200 Alexa Fluor-488 (WM-46 cells; Invitrogen), then co-stained with 40 µg/ml
PI solution.
Reverse transcription and RT-PCR analysis of XBP1 splicing
Cultured cells were homogenized using TRIzol® reagent (AmbionTM) followed by vigorous
agitation in chloroform, then spun at 12,000 x g, 15 min (4⁰C). The upper aqueous phase was
utilized for RNA extraction using the RNeasy Mini Kit (Qiagen). Reverse transcription was carried
out using the ImProm-II™ Reverse Transcription System (Promega) using Oligo (dT)20
oligonucleotides for poly-A tail detection. RT-PCR analysis of XBP1 splicing was carried out
using: XBP1 F 5’-GGAGTTAAGACAGCGCTTGGGGA-3’ and XBP1 R 5’-
TGTTCTGGAGGGGTGACAACTGGG-3’ oligonucleotides and GoTaq® Green Master Mix
(Promega), using a 58⁰C annealing temperature for 25 cycles. The reaction yields a 164 bp band
(XBP1-unspliced) and a 138 bp band (XBP1-spliced). GAPDH loading control: GAPDH-F 5’-
GGATGATGTTCTGGAGAGCC-3’, GAPDH-R 5’-CATCACCATCTTCCAGGAGC-3’.
Real-Time quantitative PCR analysis of gene expression
.CC-BY-NC-ND 4.0 International licenseIt is made available under a was not peer-reviewed) is the author/funder, who has granted bioRxiv a license to display the preprint in perpetuity.
The copyright holder for this preprint (which. http://dx.doi.org/10.1101/721712doi: bioRxiv preprint first posted online Aug. 6, 2019;
SYBR Green dyes were used to run the reaction: GoTaq® qPCR Master Mix (Promega) with
addition of CXR dye, or VeriQuest SYBR Green qPCR Master Mix (2X) (Affymetrix). Reactions
were carried out according to the manufacturer’s guidelines on a 7900HT Fast Real-Time PCR
system (Applied Biosystems) using SDS 2.4 software. 57°C/60°C annealing temperatures, 40
cycles were used. Oligonucleotides designed to detect cDNA of the 18S rRNA was used as a
loading control for human cDNA: 18S-F 5’-CTTAGAGGGACAAGTGGCG-3’, 18S-R 5’-
ACGCTGAGCCAGTCAGTGTA-3’. Gapdh loading control was used for qPCR of mouse cDNA:
Gapdh-F 5’-CTGGAGAAACCTGCCAAGTA, Gapdh-R 5’-TGTTGCTGTAGCCGTATTCA-
3’. Individual human genes tested: KDELR3-F 5’TCCCAGTCATTGGCCTTTCC-3’, KDELR3-
R 5’-CCAGTTAGCCAGGTAGAGTGC-3’, KDELR1-F 5’-
TCAAAGCTACTTACGATGGGAAC-3’, KDELR1-R 5’-ATTGACCAGGAACGCCAGAAT-
3’, KDELR2-F 5’-GCACTGGTCTTCACAACTCGT-3’, KDELR2-R 5’-
AGATCAGGTACACTGTGGCATA-3’, KDELR3-001 F 5’-TGACCAAATTGCAGTCGTGT-
3’, KDELR3-001 R 5’-TCAGATTGGCATTGGAAGACT-3’. AMFR-F 5’-
GGTTCTAGTAAATACCGCTTGCT-3’, AMFR-R 5’-TCTCACTCACTCGAAGAGGGC-3’.
Exogenous expression studies
For exogenous over-expression of CD82 and KDELR3 genes the following expression plasmids
were used: CD82 transcript variant 1 (NM_002231) Human Untagged Clone (Origene, CAT#:
SC324395), pCMV6-AC Tagged Cloning mammalian vector with non-tagged expression
(Origene, CAT#: PS100020), KDELR3 transcript variant 2 (NM_016657) Human Myc-DDK-
tagged ORF Clone (Origene, CAT#: RC216726), KDELR3 transcript variant 1 (NM_006855)
Human Myc-DDK-tagged ORF Clone (Origene, CAT#: RC201571), pCMV6-Entry Tagged
Cloning mammalian vector with C-terminal Myc- DDK Tag (Origene, CAT#: PS100001).
TransIT®-LT1 (Mirus Bio LLC.). Expression plasmids were transfected into 1205Lu human
metastatic melanoma cells. Manufacturer’s guidelines were followed using a Reagent: DNA ratio
of 3 µl TransIT®-LT1 Reagent per 1 µg DNA.
.CC-BY-NC-ND 4.0 International licenseIt is made available under a was not peer-reviewed) is the author/funder, who has granted bioRxiv a license to display the preprint in perpetuity.
The copyright holder for this preprint (which. http://dx.doi.org/10.1101/721712doi: bioRxiv preprint first posted online Aug. 6, 2019;
Western blot analysis of protein expression
Cells were lysed with two methods: 1% Triton X-100 Buffer (50 mM Tris, pH 7.5, 150 mM NaCl,
1% Triton X-100, 10 mM iodoacetamide, phosphatase inhibitor cocktail 2 and 3 (Sigma-Aldrich)
and cOmplete protease inhibitor (Roche), 50 µM MG132), or in RIPA lysis buffer (Sigma) with
phosphatase inhibitor cocktails 2 and 3 (Sigma) and cOmplete™ Protease Inhibitor Cocktail
(Roche) as per manufacturers’ guidelines. Protein lysates were denatured in LDS sample buffer
(Invitrogen) and sample reducing agent containing DTT (Invitrogen) at 70°C for 10 min, then run
on a 4-12% Bis-Tris NuPAGE gel (Novex by Life Technologies) in MES SDS running buffer
(Invitrogen). Nitrocellulose membranes were probed with the following antibodies: anti-PERK
Phospho (Ser713) Antibody (BioLegend Cat# 649402, RRID:AB_10640071, Lot# B203140), and
Cell Signaling antibodies: anti-eIF2α (Cell Signaling Technology Cat# 9722, RRID:AB_2230924,
Lot# 13), Phospho-eIF2α (Ser51) (D9G8) XPTM Rabbit mAb (Cell Signaling Technology Cat#
3398, RRID:AB_2096481, Lot# 6), PERK (D11A8) Rabbit mAb (Cell Signaling Technology Cat#
5683S, RRID:AB_10831515, Lot#5), ATF-6 (D4Z8V) Rabbit mAb (Cell Signaling Technology
Cat#65880, Lot# 1), BiP (C50B12) Rabbit mAb (Cell Signaling Technology Cat# 3177S,
RRID:AB_2119845, Lot# 8), β-Tubulin (9F3) Rabbit mAb (Cell Signaling Technology Cat# 2128,
RRID:AB_823664, Lot# 7). For immunoblotting, the rabbit monoclonal antibody to CD82
(D7G6H) was used (Cell Signaling Technology Cat#12439S). The rabbit antibody to AMFR was
used (Cell Signaling Technology Cat#9590, RRIS: AB_10860080). Anti-VINCULIN mouse mAb
(Sigma Aldrich, Cat# V9131). GAS1 Rabbit Polyclonal Ab (Origene Cat# AP51781PU-N, Lot#
SH08D402D), NME1/NDKA (NM23-H1) Rabbit antibody (Cell Signaling Cat# 3345, Lot# 1),
Gelsolin (D9W8Y) Rabbit mAb (Cell Signaling Cat# 12953, Lot#1), BRMS1 Rabbit polyclonal
antibody (Invitrogen, Cat# PA5-78885, Lot# U82788252).
Mass spectrometry
Cell lysates were extracted 4 days post siRNA knockdown of KDELR3, AMFR or non-targeting
control (siGENOME) using Dharmafect #1 transfection reagent. Cell lysates (250 μg each) were
digested with trypsin using the filter-aided sample preparation (FASP) protocol as previously
.CC-BY-NC-ND 4.0 International licenseIt is made available under a was not peer-reviewed) is the author/funder, who has granted bioRxiv a license to display the preprint in perpetuity.
The copyright holder for this preprint (which. http://dx.doi.org/10.1101/721712doi: bioRxiv preprint first posted online Aug. 6, 2019;

described with minor modifications72. Lysates were first reduced by incubation with 10 mM DTT
at 55 °C for 30 min. Each lysate was then diluted with 8 M urea in 100 mM Tris-HCl (pH 8.5)
(UA) in a Microcon YM-10 filter unit and centrifuged at 14,000 × g for 30 min at 4°C. The lysis
buffer was exchanged again by washing with 200 μL UA. The proteins were then alkylated with
50 mM iodoacetamide in UA, first incubated for 6 min at 25 °C and then excess reagent was
removed by centrifugation at 14,000 × g for 30 min at 4°C. Proteins were then washed 3 × 100 μL
8 M urea in 100 mM Tris-HCl (pH 8.0) (UB). The remaining urea was diluted to 1 M with 100
mM Tris-HCl pH 8 and then the proteins were digested overnight at 37°C with trypsin at an
enzyme to protein ratio of 1:100 w/w. Tryptic peptides were recovered from the filter by first
centrifugation at 14,000 × g for 30 min at 4°C followed by washing of the filter with 50 μL 0.5 M
NaCl. The peptides were acidified and desalted on a C18 SepPak cartridge (Waters) and dried by
vacuum concentration (Labconco). Samples analyzing the effect of KDELR3 siRNA treatment
alone were dimethyl labeled, as described, with the label being rotated between replicates73.
Samples analyzing the effect of KDELR3 or AMFR siRNA knockdown were quantitated using
label-free methods. Dried peptides were fractionated by high pH reversed-phase spin columns
(Thermo). The peptides from each fraction were lyophilized, and dried peptides were solubilized
in 4% acetonitrile and 0.5% formic acid in water for mass spectrometry analysis. Each fraction of
each sample was separated on a 75 µm x 15 cm, 2 µm Acclaim PepMap reverse phase column
(Thermo) using an UltiMate 3000 RSLCnano HPLC (Thermo) at a flow rate of 300 nL/min
followed by online analysis by tandem mass spectrometry using a Thermo Orbitrap Fusion mass
spectrometer. Peptides were eluted into the mass spectrometer using a linear gradient from 96%
mobile phase A (0.1% formic acid in water) to 35% mobile phase B (0.1% formic acid in
acetonitrile) over 240 minutes. Parent full-scan mass spectra were collected in the Orbitrap mass
analyzer set to acquire data at 120,000 FWHM resolution; ions were then isolated in the quadrupole
mass filter, fragmented within the HCD cell (HCD normalized energy 32%, stepped ± 3%), and
the product ions analyzed in the ion trap.
The mass spectrometry data were analyzed and either dimethyl labeling or label-free
quantitation performed using MaxQuant version 1.5.7.474, 75 with the following parameters:
variable modifications - methionine oxidation and N-acetylation of protein N-terminus; static
modification – cysteine carbamidomethylation; first search was performed using 20 ppm error and
.CC-BY-NC-ND 4.0 International licenseIt is made available under a was not peer-reviewed) is the author/funder, who has granted bioRxiv a license to display the preprint in perpetuity.
The copyright holder for this preprint (which. http://dx.doi.org/10.1101/721712doi: bioRxiv preprint first posted online Aug. 6, 2019;
the main search 10 ppm; maximum of two missed cleavages; protein and peptide FDR threshold
of 0.01; min unique peptides 1; match between runs; label-free quantitation, with minimal ratio
count 2. Proteins were identified using a Uniprot human database from November 2016 (20,072
entries). Statistical analysis was performed using Perseus version 1.5.6.076. After removal of
contaminant and reversed sequences, as well as proteins that were only quantified in one of the
three replicate experiments, the quantitation values were base 2 logarithmized and non-assigned
values were imputed from a normal distribution of the data. Statistically significant differences
were assigned using a two-way t-test with a p-value cut-off of 0.05.
Protein de-glycosylation
1205Lu cells were transfected with control or KDELR3 siRNAs as previously described in
Methods. After 4 days cells were lysed in in 1% Triton X-100 Buffer (50 mM Tris, pH 7.5, 150
mM NaCl, 1% Triton X-100, 10 mM iodoacetamide, phosphatase inhibitor cocktail 2 and 3
(Sigma-Aldrich) and cOmplete protease inhibitor (Roche), 50 µM MG132). Lysates were diluted
1:2 with dH2O to minimize lysis buffer effect. 10 µl Deglycosylation Mix Buffer 2 (New England
Biolabs) was added to 17 µg of protein a 40 µl total volume, samples were heated at 75°C for 10
minutes. After cooling 5 µl Protein Deglycosylation Mix II (New England Biolabs) was mixed in
gently. Reaction was incubated at 37°C for 30 minutes before being transferred to 37°C for 1 hour.
Reactions were analyzed by NU-PAGE Nu-PAGE and immunoblotted with the rabbit monoclonal
antibody to CD82 (D7G6H) was used (Cell Signaling Technology Cat# 12439S).
Co-immunoprecipitation
Cells were lysed in 1% Triton X-100 Buffer (50 mM Tris, pH 7.5, 150 mM NaCl, 1% Triton X-
100, 10 mM iodoacetamide, phosphatase inhibitor cocktail 2 and 3 (Sigma-Aldrich) and
cOmplete™ Protease Inhibitor Cocktail (Roche), 50 µM MG132). Clarified lysates were pre-
cleared by incubation with Dynabeads Protein A (Thermo-Fisher Scientific), at 4°C for 30 min.
2mg of total proteins lysate were immunoprecipitated with Dynabeads protein A-antibody
.CC-BY-NC-ND 4.0 International licenseIt is made available under a was not peer-reviewed) is the author/funder, who has granted bioRxiv a license to display the preprint in perpetuity.
The copyright holder for this preprint (which. http://dx.doi.org/10.1101/721712doi: bioRxiv preprint first posted online Aug. 6, 2019;
complexes, using an anti-gp78 or anti-DDK antibody and their respective IgG isotypes: rabbit IgG
(BD Pharmingen) and mouse IgG (Santa Cruz). Incubation with rotation overnight at 4°C was
performed. Immunoprecipitates were washed five times with washing buffer (50 mM Tris, pH 7.5,
150 mM NaCl, 0.1% Triton X-100) and were resuspended in 50 µl of elution buffer containing
washing buffer, NuPAGE LDS sample buffer and NuPAGE sample reducing agent, mixed as per
manufacturer’s instructions (Invitrogen). Proteins were analyzed by Nu-PAGE and immunoblotted
using an enhanced chemiluminescence (ECL) method. For immunoblotting anti-DDK antibody
(Origene TA50011) or (Ab2) to amino acids 579–611 of gp78 was used; this antibody was
previously described23.
References
1. Virchow, R. Die cellularpathologie in ihrer begründung auf physiologische und pathologische gewebelehre. (A. Hirschwald, Berlin,; 1858).
2. Hendrix, M.J. et al. Reprogramming metastatic tumour cells with embryonic microenvironments. Nat Rev Cancer 7, 246-255 (2007).
3. Hardy, K.M. et al. Regulation of the embryonic morphogen Nodal by Notch4 facilitates manifestation of the aggressive melanoma phenotype. Cancer Res 70, 10340-10350 (2010).
4. Costa, F.F. et al. Epigenetically reprogramming metastatic tumor cells with an embryonic microenvironment. Epigenomics 1, 387-398 (2009).
5. White, R.M. et al. DHODH modulates transcriptional elongation in the neural crest and melanoma. Nature 471, 518-522 (2011).
6. Kaufman, C.K. et al. A zebrafish melanoma model reveals emergence of neural crest identity during melanoma initiation. Science 351, aad2197 (2016).
7. Taylor, K.L. et al. Differentiated melanocyte cell division occurs in vivo and is promoted by mutations in Mitf. Development 138, 3579-3589 (2011).
8. Carreira, S. et al. Mitf regulation of Dia1 controls melanoma proliferation and invasiveness. Genes Dev 20, 3426-3439 (2006).
9. Johannessen, C.M. et al. A melanocyte lineage program confers resistance to MAP kinase pathway inhibition. Nature 504, 138-142 (2013).
10. Alonso-Curbelo, D. et al. RAB7 controls melanoma progression by exploiting a lineage-specific wiring of the endolysosomal pathway. Cancer Cell 26, 61-76 (2014).
11. Rambow, F. et al. New Functional Signatures for Understanding Melanoma Biology from Tumor Cell Lineage-Specific Analysis. Cell Rep 13, 840-853 (2015).
12. Smith, M.P. et al. Inhibiting Drivers of Non-mutational Drug Tolerance Is a Salvage Strategy for Targeted Melanoma Therapy. Cancer Cell 29, 270-284 (2016).
13. Tsoi, J. et al. Multi-stage Differentiation Defines Melanoma Subtypes with Differential Vulnerability to Drug-Induced Iron-Dependent Oxidative Stress. Cancer Cell 33, 890-904 e895 (2018).
14. Ernfors, P. Cellular origin and developmental mechanisms during the formation of skin melanocytes. Exp Cell Res 316, 1397-1407 (2010).
.CC-BY-NC-ND 4.0 International licenseIt is made available under a was not peer-reviewed) is the author/funder, who has granted bioRxiv a license to display the preprint in perpetuity.
The copyright holder for this preprint (which. http://dx.doi.org/10.1101/721712doi: bioRxiv preprint first posted online Aug. 6, 2019;
15. Senft, D. & Ronai, Z.A. Adaptive Stress Responses During Tumor Metastasis and Dormancy. Trends Cancer 2, 429-442 (2016).
16. Latham, K.E. Stress signaling in mammalian oocytes and embryos: a basis for intervention and improvement of outcomes. Cell Tissue Res 363, 159-167 (2016).
17. Urra, H., Dufey, E., Avril, T., Chevet, E. & Hetz, C. Endoplasmic Reticulum Stress and the Hallmarks of Cancer. Trends Cancer 2, 252-262 (2016).
18. Capitani, M. & Sallese, M. The KDEL receptor: new functions for an old protein. FEBS Lett 583, 3863-3871 (2009).
19. Trychta, K.A., Back, S., Henderson, M.J. & Harvey, B.K. KDEL Receptors Are Differentially Regulated to Maintain the ER Proteome under Calcium Deficiency. Cell Rep 25, 1829-1840 e1826 (2018).
20. Lewis, M.J. & Pelham, H.R. Ligand-induced redistribution of a human KDEL receptor from the Golgi complex to the endoplasmic reticulum. Cell 68, 353-364 (1992).
21. Zaidi, M.R. et al. Interferon-gamma links ultraviolet radiation to melanomagenesis in mice. Nature 469, 548-553 (2011).
22. Zaidi, M.R., Hornyak, T.J. & Merlino, G. A genetically engineered mouse model with inducible GFP expression in melanocytes. Pigment Cell Melanoma Res 24, 393-394 (2011).
23. Tsai, Y.C. et al. The ubiquitin ligase gp78 promotes sarcoma metastasis by targeting KAI1 for degradation. Nat Med 13, 1504-1509 (2007).
24. Jordan, S.A. & Jackson, I.J. A late wave of melanoblast differentiation and rostrocaudal migration revealed in patch and rump-white embryos. Mech Dev 92, 135-143 (2000).
25. Steel, K.P., Davidson, D.R. & Jackson, I.J. TRP-2/DT, a new early melanoblast marker, shows that steel growth factor (c-kit ligand) is a survival factor. Development 115, 1111-1119 (1992).
26. Vandamme, N. & Berx, G. From neural crest cells to melanocytes: cellular plasticity during development and beyond. Cell Mol Life Sci 76, 1919-1934 (2019).
27. Love, M.I., Huber, W. & Anders, S. Moderated estimation of fold change and dispersion for RNA-seq data with DESeq2. Genome Biol 15, 550 (2014).
28. Bogunovic, D. et al. Immune profile and mitotic index of metastatic melanoma lesions enhance clinical staging in predicting patient survival. Proc Natl Acad Sci U S A 106, 20429-20434 (2009).
29. Xu, L. et al. Gene expression changes in an animal melanoma model correlate with aggressiveness of human melanoma metastases. Mol Cancer Res 6, 760-769 (2008).
30. Cerami, E. et al. The cBio cancer genomics portal: an open platform for exploring multidimensional cancer genomics data. Cancer Discov 2, 401-404 (2012).
31. Gao, J. et al. Integrative analysis of complex cancer genomics and clinical profiles using the cBioPortal. Sci Signal 6, pl1 (2013).
32. Lamriben, L., Graham, J.B., Adams, B.M. & Hebert, D.N. N-Glycan-based ER Molecular Chaperone and Protein Quality Control System: The Calnexin Binding Cycle. Traffic 17, 308-326 (2016).
33. Grafanaki, K. et al. Translation regulation in skin cancer from a tRNA point of view. Epigenomics 11, 215-245 (2019).
34. Senft, D. & Ronai, Z.E. Adaptive Stress Responses During Tumor Metastasis and Dormancy. Trends Cancer 2, 429-442 (2016).
35. Khan, I. & Steeg, P.S. Metastasis suppressors: functional pathways. Lab Invest 98, 198-210 (2018).
36. Zhang, G. et al. Loss of tumor suppressors KAI1 and p27 identifies a unique subgroup of primary melanoma patients with poor prognosis. Oncotarget 6, 23026-23035 (2015).
37. Tsai, Y.C. & Weissman, A.M. Dissecting the diverse functions of the metastasis suppressor CD82/KAI1. FEBS Lett 585, 3166-3173 (2011).
.CC-BY-NC-ND 4.0 International licenseIt is made available under a was not peer-reviewed) is the author/funder, who has granted bioRxiv a license to display the preprint in perpetuity.
The copyright holder for this preprint (which. http://dx.doi.org/10.1101/721712doi: bioRxiv preprint first posted online Aug. 6, 2019;
38. Ono, M., Handa, K., Withers, D.A. & Hakomori, S. Motility inhibition and apoptosis are induced by metastasis-suppressing gene product CD82 and its analogue CD9, with concurrent glycosylation. Cancer Res 59, 2335-2339 (1999).
39. Marjon, K.D. et al. Tetraspanin CD82 regulates bone marrow homing of acute myeloid leukemia by modulating the molecular organization of N-cadherin. Oncogene 35, 4132-4140 (2016).
40. Fang, S. et al. The tumor autocrine motility factor receptor, gp78, is a ubiquitin protein ligase implicated in degradation from the endoplasmic reticulum. Proc Natl Acad Sci U S A 98, 14422-14427 (2001).
41. Yanagawa, T. et al. Overexpression of autocrine motility factor in metastatic tumor cells: possible association with augmented expression of KIF3A and GDI-beta. Lab Invest 84, 513-522 (2004).
42. Cancer Genome Atlas, N. Genomic Classification of Cutaneous Melanoma. Cell 161, 1681-1696 (2015).
43. Cancino, J. et al. Control systems of membrane transport at the interface between the endoplasmic reticulum and the Golgi. Dev Cell 30, 280-294 (2014).
44. Giannotta, M. et al. The KDEL receptor couples to Galphaq/11 to activate Src kinases and regulate transport through the Golgi. EMBO J 31, 2869-2881 (2012).
45. Ruggiero, C. et al. A Golgi-based KDELR-dependent signalling pathway controls extracellular matrix degradation. Oncotarget 6, 3375-3393 (2015).
46. Tie, H.C. et al. A novel imaging method for quantitative Golgi localization reveals differential intra-Golgi trafficking of secretory cargoes. Mol Biol Cell 27, 848-861 (2016).
47. Beck, R., Rawet, M., Wieland, F.T. & Cassel, D. The COPI system: molecular mechanisms and function. FEBS Lett 583, 2701-2709 (2009).
48. Wang, M. & Kaufman, R.J. The impact of the endoplasmic reticulum protein-folding environment on cancer development. Nat Rev Cancer 14, 581-597 (2014).
49. Berenson, A. et al. Outcomes of multiple myeloma patients receiving bortezomib, lenalidomide, and carfilzomib. Ann Hematol (2016).
50. Bettigole, S.E. & Glimcher, L.H. Endoplasmic reticulum stress in immunity. Annu Rev Immunol 33, 107-138 (2015).
51. Ma, X.H. et al. Targeting ER stress-induced autophagy overcomes BRAF inhibitor resistance in melanoma. J Clin Invest 124, 1406-1417 (2014).
52. Garcia-Fernandez, M. et al. Metastatic risk and resistance to BRAF inhibitors in melanoma defined by selective allelic loss of ATG5. Autophagy 12, 1776-1790 (2016).
53. Kim, H. et al. Downregulation of the Ubiquitin Ligase RNF125 Underlies Resistance of Melanoma Cells to BRAF Inhibitors via JAK1 Deregulation. Cell Rep 11, 1458-1473 (2015).
54. Cubillos-Ruiz, J.R., Bettigole, S.E. & Glimcher, L.H. Tumorigenic and Immunosuppressive Effects of Endoplasmic Reticulum Stress in Cancer. Cell 168, 692-706 (2017).
55. Falletta, P. et al. Translation reprogramming is an evolutionarily conserved driver of phenotypic plasticity and therapeutic resistance in melanoma. Genes Dev 31, 18-33 (2017).
56. Pytel, D. et al. PERK Is a Haploinsufficient Tumor Suppressor: Gene Dose Determines Tumor-Suppressive Versus Tumor Promoting Properties of PERK in Melanoma. PLoS Genet 12, e1006518 (2016).
57. Scheuner, D. et al. Double-stranded RNA-dependent protein kinase phosphorylation of the alpha-subunit of eukaryotic translation initiation factor 2 mediates apoptosis. J Biol Chem 281, 21458-21468 (2006).
58. Bari, R. et al. Transmembrane interactions are needed for KAI1/CD82-mediated suppression of cancer invasion and metastasis. Am J Pathol 174, 647-660 (2009).
59. Wang, H. et al. N-Glycosylation pattern of recombinant human CD82 (KAI1), a tumor-associated membrane protein. J Proteomics 75, 1375-1385 (2012).
60. White, A., Lamb, P.W. & Barrett, J.C. Frequent downregulation of the KAI1(CD82) metastasis suppressor protein in human cancer cell lines. Oncogene 16, 3143-3149 (1998).
.CC-BY-NC-ND 4.0 International licenseIt is made available under a was not peer-reviewed) is the author/funder, who has granted bioRxiv a license to display the preprint in perpetuity.
The copyright holder for this preprint (which. http://dx.doi.org/10.1101/721712doi: bioRxiv preprint first posted online Aug. 6, 2019;

61. Tapia, D. et al. KDEL receptor regulates secretion by lysosome relocation- and autophagy-dependent modulation of lipid-droplet turnover. Nat Commun 10, 735 (2019).
62. Ecker, B.L. et al. Age-Related Changes in HAPLN1 Increase Lymphatic Permeability and Affect Routes of Melanoma Metastasis. Cancer Discov 9, 82-95 (2019).
63. Kaur, A. et al. Remodeling of the Collagen Matrix in Aging Skin Promotes Melanoma Metastasis and Affects Immune Cell Motility. Cancer Discov 9, 64-81 (2019).
64. Howley, B.V., Link, L.A., Grelet, S., El-Sabban, M. & Howe, P.H. A CREB3-regulated ER-Golgi trafficking signature promotes metastatic progression in breast cancer. Oncogene 37, 1308-1325 (2018).
65. Atkinson, A. et al. Collagen Prolyl Hydroxylases Are Bifunctional Growth Regulators in Melanoma. J Invest Dermatol (2018).
66. Alonso-Curbelo, D. et al. RAB7 counteracts PI3K-driven macropinocytosis activated at early stages of melanoma development. Oncotarget 6, 11848-11862 (2015).
67. Li, B. & Dewey, C.N. RSEM: accurate transcript quantification from RNA-Seq data with or without a reference genome. BMC Bioinformatics 12, 323 (2011).
68. Law, C.W., Chen, Y., Shi, W. & Smyth, G.K. voom: Precision weights unlock linear model analysis tools for RNA-seq read counts. Genome Biol 15, R29 (2014).
69. Smyth, G.K. Linear models and empirical bayes methods for assessing differential expression in microarray experiments. Stat Appl Genet Mol Biol 3, Article3 (2004).
70. Day, C.P. et al. Lentivirus-mediated bifunctional cell labeling for in vivo melanoma study. Pigment Cell Melanoma Res 22, 283-295 (2009).
71. Tsukamoto, K., Jackson, I.J., Urabe, K., Montague, P.M. & Hearing, V.J. A second tyrosinase-related protein, TRP-2, is a melanogenic enzyme termed DOPAchrome tautomerase. EMBO J 11, 519-526 (1992).
72. Wisniewski, J.R., Zougman, A., Nagaraj, N. & Mann, M. Universal sample preparation method for proteome analysis. Nat Methods 6, 359-362 (2009).
73. Boersema, P.J., Raijmakers, R., Lemeer, S., Mohammed, S. & Heck, A.J. Multiplex peptide stable isotope dimethyl labeling for quantitative proteomics. Nat Protoc 4, 484-494 (2009).
74. Cox, J. et al. Accurate proteome-wide label-free quantification by delayed normalization and maximal peptide ratio extraction, termed MaxLFQ. Mol Cell Proteomics 13, 2513-2526 (2014).
75. Cox, J. & Mann, M. MaxQuant enables high peptide identification rates, individualized p.p.b.-range mass accuracies and proteome-wide protein quantification. Nat Biotechnol 26, 1367-1372 (2008).
76. Tyanova, S. et al. The Perseus computational platform for comprehensive analysis of (prote)omics data. Nat Methods 13, 731-740 (2016).
Acknowledgements
This research was supported in part by the NCI Intramural Research Program of the NIH. PJM
was also supported in part by the NCI Director’s Innovation Award. MRZ was supported in part
by the following grant: NIH/NCI K22CA163799. TG was supported in part by the HHMI Research
Scholars Program, Howard Hughes Medical Institute. HTM funded in part by the NIH
Comparative Biomedical Scientist Training Program in partnership with University of Maryland,
College Park, and the National Cancer Institute. We would like to thank the Dr. Meenhard Herlyn
.CC-BY-NC-ND 4.0 International licenseIt is made available under a was not peer-reviewed) is the author/funder, who has granted bioRxiv a license to display the preprint in perpetuity.
The copyright holder for this preprint (which. http://dx.doi.org/10.1101/721712doi: bioRxiv preprint first posted online Aug. 6, 2019;
for providing melanoma cell lines included in this study. We are grateful to Cari Graff-Cherry for
maintenance and care of mouse lines, Dr. Stephen Locket for microscopy analysis, Dr. Joe Kalen
and Nimit Patel for imaging of developing mice, and Drs. Dominic Esposito and Carissa Grose for
lentiviral vector preparation. We acknowledge Dr. Yves Pommier and William Reinhold for
NCI60 data and CellMiner analyses. We thank Jennifer Dwyer, Shelley Hoover and Bih-Rong
Wei from the Molecular Pathology Unit for slide scanning and IVIS imaging. We acknowledge
Leidos at the British Columbia Cancer Agency for gifting us free RNA-sequencing services. We
are also grateful to Dr. Lalage Wakefield for useful discussions.
Author Contributions
KLM, GM, wrote the manuscript. GM, KLM, PJM, AS, AMM, CPD, AMW, YCT, HTM, SD,
PSM, LMJ participated in experimental/ study design. KLM, PJM, AS, AMM, HTM, TG, YCT,
MRZ, EPG, SD, LMJ generated the experimental data. GM, KLM, PJM, AS, AMM, MPL, HHY,
HTM, YCT, AMW, EPG, CPD, HA, SD, PSM contributed intellectually to the work. MPL, HHY,
AMM, SD performed bioinformatic and statistical analysis of data.
Data Availability
Upon acceptance of the manuscript all data will be made publicly available and a full code
availability statement will be included here.
.CC-BY-NC-ND 4.0 International licenseIt is made available under a was not peer-reviewed) is the author/funder, who has granted bioRxiv a license to display the preprint in perpetuity.
The copyright holder for this preprint (which. http://dx.doi.org/10.1101/721712doi: bioRxiv preprint first posted online Aug. 6, 2019;
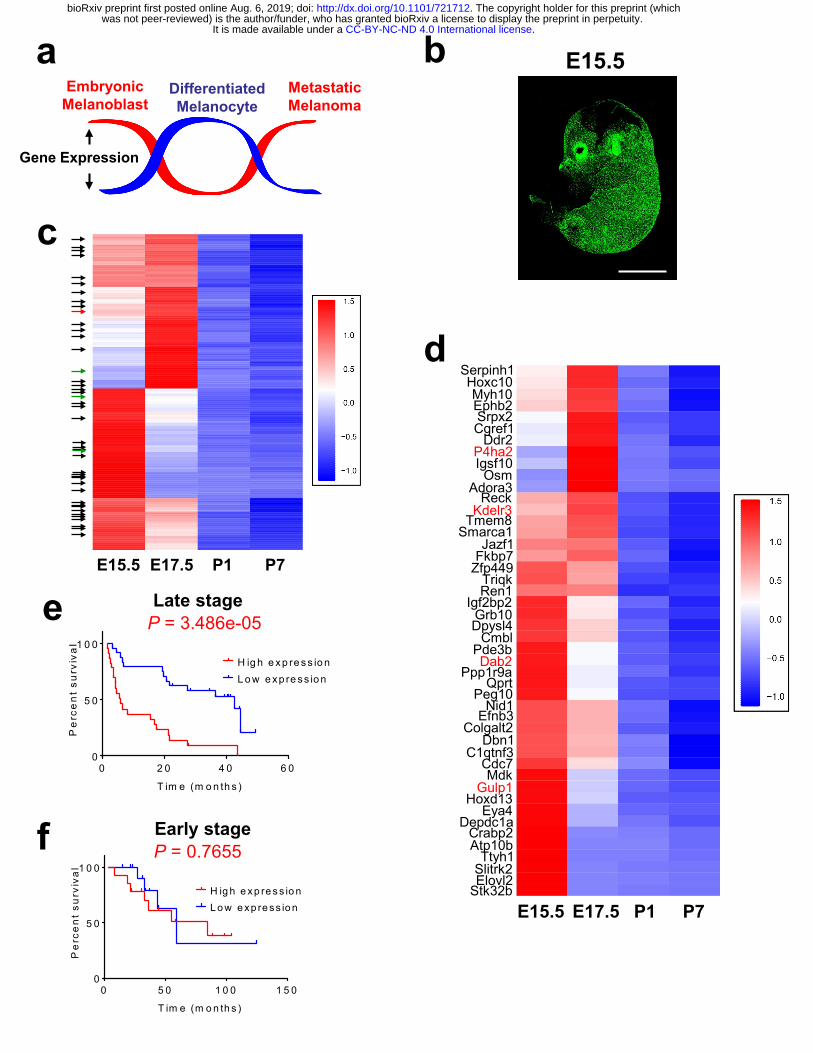
a bMetastatic Melanoma
DifferentiatedMelanocyte
Embryonic Melanoblast
Gene Expression
E15.5 E17.5 P1 P7
Serpinh1Hoxc10Myh10Ephb2Srpx2Cgref1
Ddr2P4ha2Igsf10
OsmAdora3
ReckKdelr3
Tmem8Smarca1
Jazf1Fkbp7
Zfp449TriqkRen1
Igf2bp2Grb10Dpysl4
CmblPde3bDab2
Ppp1r9aQprt
Peg10Nid1
Efnb3Colgalt2
Dbn1C1qtnf3
Cdc7Mdk
Gulp1Hoxd13
Eya4Depdc1a
Crabp2Atp10b
Ttyh1Slitrk2Elovl2
Stk32bE15.5 E17.5 P1 P7
Late stage
Early stage
0 2 0 4 0 6 00
5 0
1 0 0
T im e (m o n th s )
Pe
rce
nt
surv
iva
l
H ig h e x p re s s io nL o w e xp re ss io n
0 5 0 1 0 0 1 5 00
5 0
1 0 0
T im e (m o n th s )
Pe
rce
nt
surv
iva
l
H ig h e x p re s s io nL o w e xp re ss io n
P = 3.486e-05
P = 0.7655
c
d
e
f
E15.5.CC-BY-NC-ND 4.0 International licenseIt is made available under a
was not peer-reviewed) is the author/funder, who has granted bioRxiv a license to display the preprint in perpetuity.The copyright holder for this preprint (which. http://dx.doi.org/10.1101/721712doi: bioRxiv preprint first posted online Aug. 6, 2019;
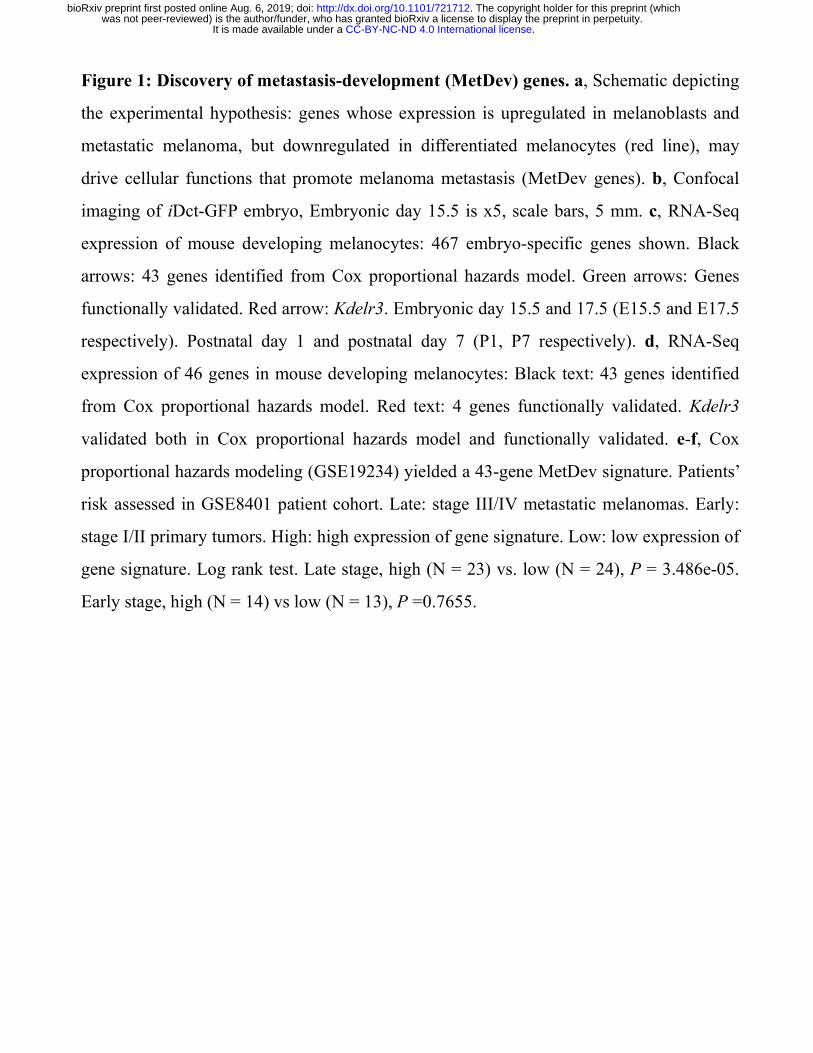
Figure 1: Discovery of metastasis-development (MetDev) genes. a, Schematic depicting
the experimental hypothesis: genes whose expression is upregulated in melanoblasts and
metastatic melanoma, but downregulated in differentiated melanocytes (red line), may
drive cellular functions that promote melanoma metastasis (MetDev genes). b, Confocal
imaging of iDct-GFP embryo, Embryonic day 15.5 is x5, scale bars, 5 mm. c, RNA-Seq
expression of mouse developing melanocytes: 467 embryo-specific genes shown. Black
arrows: 43 genes identified from Cox proportional hazards model. Green arrows: Genes
functionally validated. Red arrow: Kdelr3. Embryonic day 15.5 and 17.5 (E15.5 and E17.5
respectively). Postnatal day 1 and postnatal day 7 (P1, P7 respectively). d, RNA-Seq
expression of 46 genes in mouse developing melanocytes: Black text: 43 genes identified
from Cox proportional hazards model. Red text: 4 genes functionally validated. Kdelr3
validated both in Cox proportional hazards model and functionally validated. e-f, Cox
proportional hazards modeling (GSE19234) yielded a 43-gene MetDev signature. Patients’
risk assessed in GSE8401 patient cohort. Late: stage III/IV metastatic melanomas. Early:
stage I/II primary tumors. High: high expression of gene signature. Low: low expression of
gene signature. Log rank test. Late stage, high (N = 23) vs. low (N = 24), P = 3.486e-05.
Early stage, high (N = 14) vs low (N = 13), P =0.7655.
.CC-BY-NC-ND 4.0 International licenseIt is made available under a was not peer-reviewed) is the author/funder, who has granted bioRxiv a license to display the preprint in perpetuity.
The copyright holder for this preprint (which. http://dx.doi.org/10.1101/721712doi: bioRxiv preprint first posted online Aug. 6, 2019;

Gene Symbol Colony Formation Tail vein metastasis
Gulp1 P = 0.0002 P = 0.0002
Kdelr3 P = 0.0122 P = 0.0155
P4ha2 P = 0.022 P = 0.022
Dab2 P = 0.0428 P = 0.0421
Table 1: siRNA screen for metastatic potential of four putative MetDev genes. siRNA
knockdown of genes indicated (B16 cell line). Colony formation assay, n = 10 wells
(Dab2, Kdelr3, Control), n = 5 wells (Gulp1, P4ha2, Control), screen performed once. P-
value assessed by Kruskal-Wallis using uncorrected Dunn’s test versus siControl. Tail vein
metastasis assay, n = 10 mice (Dab2, Kdelr3, Control), n = 5 wells (Gulp1, P4ha2,
Control), screen performed once. P-value assessed by Kruskal-Wallis using uncorrected
Dunn’s test versus siControl.
.CC-BY-NC-ND 4.0 International licenseIt is made available under a was not peer-reviewed) is the author/funder, who has granted bioRxiv a license to display the preprint in perpetuity.
The copyright holder for this preprint (which. http://dx.doi.org/10.1101/721712doi: bioRxiv preprint first posted online Aug. 6, 2019;
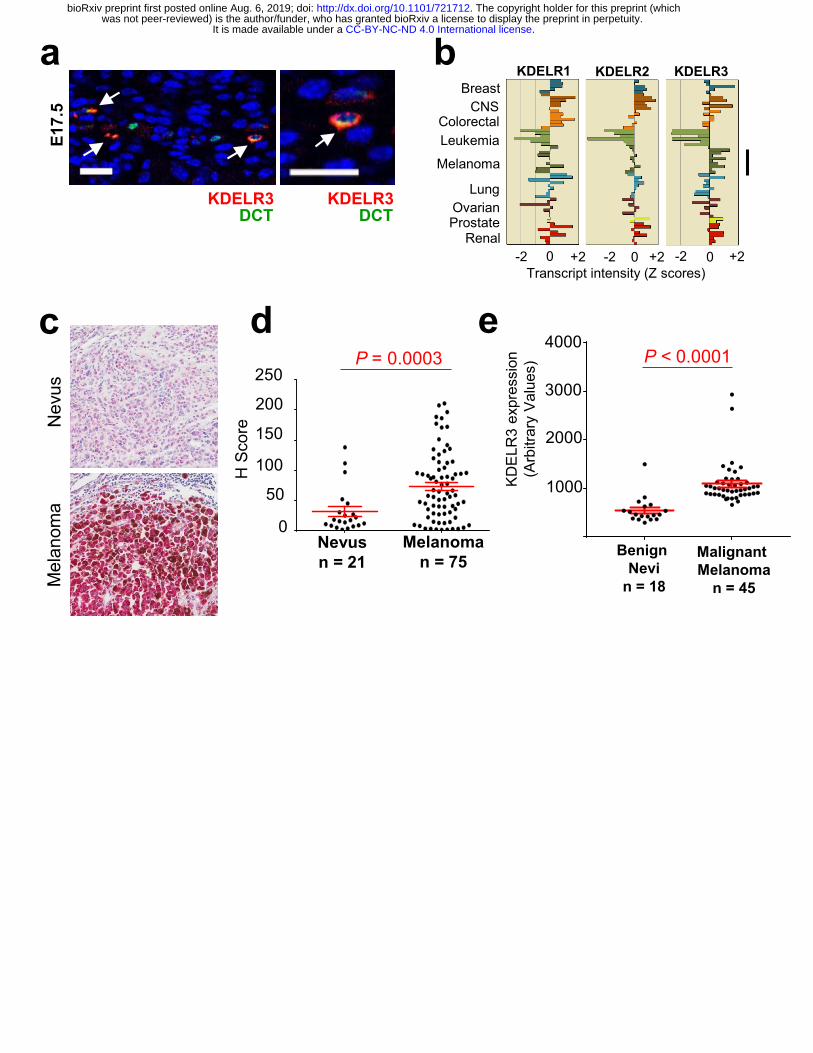
Nev
usM
elan
oma
c
b
dTranscript intensity (Z scores)
KDELR1 KDELR2 KDELR3Breast
RenalProstateOvarian
Lung
Melanoma
LeukemiaColorectal
CNS
0 0 0 +2+2+2 -2-2-2H
Sc
ore
N e v u sn = 2 1
M e la n o m an = 7 5
0
5 0
1 0 0
1 5 0
2 0 0
2 5 0
P = 0.0003
0
50
100
150
200
250
H S
core
Nevusn = 21
Melanoman = 75
E17.
5
KDELR3DCT
KDELR3DCT
a
e
N evu s
Me la
n o ma
0
1 0 0 0
2 0 0 0
3 0 0 0
4 0 0 0
KD
EL
R3
ex
pre
ss
ion
(A
rbit
rary
Va
lue
s)
P < 0.0001
Benign Nevi
n = 18
Malignant Melanoma
n = 45
1000
2000
3000
4000
KD
ELR
3 ex
pres
sion
(Arb
itrar
y V
alue
s)
.CC-BY-NC-ND 4.0 International licenseIt is made available under a was not peer-reviewed) is the author/funder, who has granted bioRxiv a license to display the preprint in perpetuity.
The copyright holder for this preprint (which. http://dx.doi.org/10.1101/721712doi: bioRxiv preprint first posted online Aug. 6, 2019;

Figure 2: Melanoblast gene expression in melanoma. a, KDELR3 (red) and DCT
(green) staining in E17.5 mouse skin. White arrows depict co-localization. Magnification,
40x. Scale bars, 20µm. Representative image of 100 cells analyzed taken from one mouse.
b, Pan-cancer RNA expression of KDEL Receptors in human cell lines (NCI60; CellMiner
analysis); KDELR3 expression in melanoma (black line). c, KDELR3 expression in human
nevus and melanoma lymph node metastasis (red intercellular staining), magnification,
20x. d, H-Score of KDELR3 immunohistochemistry in human tumor microarrays.
Unpaired two-tailed student’s t-test with Welch’s correction, P = 0.0003, df = 47.9, t =
3.936. e, KDELR3 expression in benign nevi and malignant melanoma (GSE3189;
204017_at probeset). Unpaired two-tailed student’s t-test with Welch’s correction, P <
0.0001, df = 47.39, t = 6.035. d, e, Line and error bars represent mean ± s.e.m.
.CC-BY-NC-ND 4.0 International licenseIt is made available under a was not peer-reviewed) is the author/funder, who has granted bioRxiv a license to display the preprint in perpetuity.
The copyright holder for this preprint (which. http://dx.doi.org/10.1101/721712doi: bioRxiv preprint first posted online Aug. 6, 2019;
s iCo n tro
l
s iKD
E LR3
0
1 0 0
2 0 0
3 0 0
4 0 0
5 0 0
No
. o
f m
eta
sta
ses
Β-TUB
FLAG(KDELR3)25 KDa
55 KDa
N NMu Mu
shControlKDELR3
KDCell:
OE:0
0.0020.0040.0060.0080.01
Par
enta
l
Con
t.
KD N
Mu N
Mu
Cont. KDK
DE
LR3
-001
ex
pres
sion
(2^-
DC
t)
a
C o n trol
n = 6
K D E L R 3 KD
n = 6
0
2 0 0
4 0 0
6 0 0
No.
of C
olon
ies
c d
e f
Con
trol
KD
ELR
3 O
Eb
C o n trol
n = 6
K D E L R 3 OE
n = 6
0
2 0 0
4 0 0
6 0 0P = 0.0015 P = 0.0324
No.
of C
olon
ies
KD
ELR
3K
Dsh
Con
trol
Controln = 6
KDELR3 OEn = 6
shControln = 6
KDELR3 KDn = 6
g
To
tal
are
a o
f c
olo
nie
s (
pix
els
2)
P a ren ta
l
C o n trol
K D
C o n trol +
N
C o n trol +
Mu
K D + N
K D + M
u
1
1 0
1 0 0
1 0 0 0
1 0 0 0 0 P = 0.0091
P = 0.0202
P = 0.0002P = 0.0005
Kdelr3 KDsiControl
i
h
j
S iC o n tro ln = 1 1
K D E L R 3 K Dn = 1 1
0
5 0
1 0 0
1 5 0
2 0 0 P = 0.0499
No.
of l
ung
met
s.
100
50
0
150200
siControln = 11
Kdelr3 KDn = 11
siControln = 11
KDELR3 KD n = 11
P = 0.0075
No.
of l
ung
met
s.
0100200300400500
.CC-BY-NC-ND 4.0 International licenseIt is made available under a was not peer-reviewed) is the author/funder, who has granted bioRxiv a license to display the preprint in perpetuity.
The copyright holder for this preprint (which. http://dx.doi.org/10.1101/721712doi: bioRxiv preprint first posted online Aug. 6, 2019;
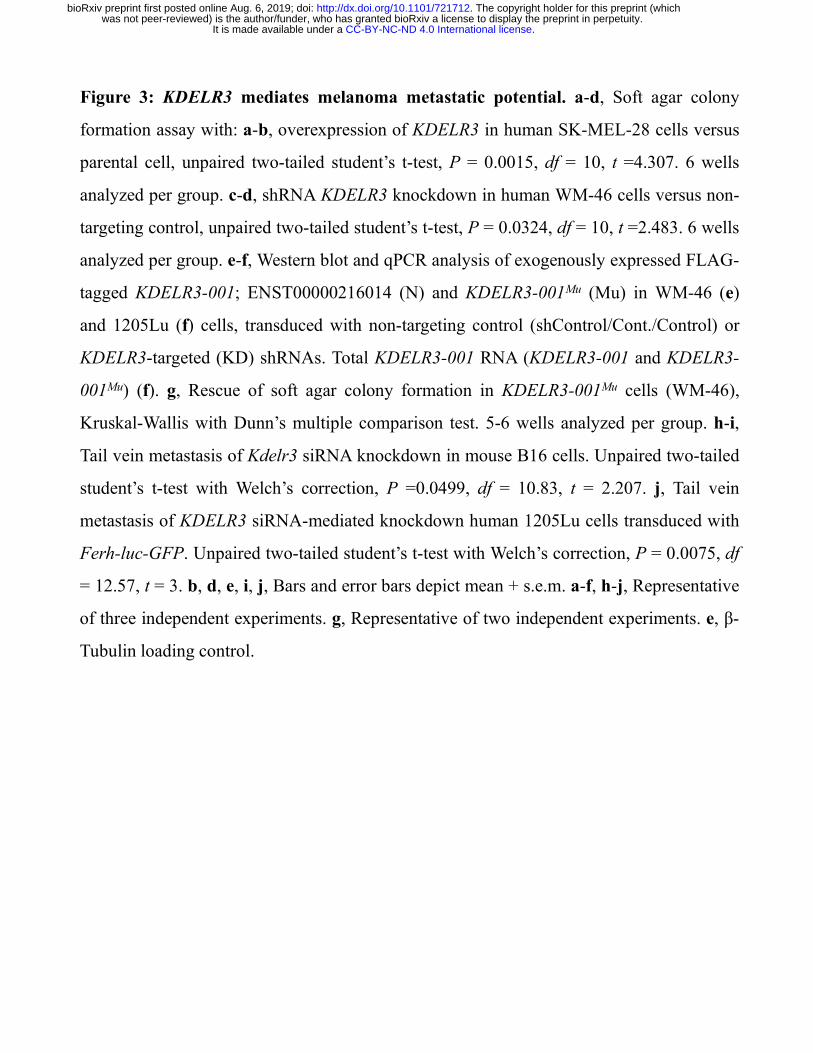
Figure 3: KDELR3 mediates melanoma metastatic potential. a-d, Soft agar colony
formation assay with: a-b, overexpression of KDELR3 in human SK-MEL-28 cells versus
parental cell, unpaired two-tailed student’s t-test, P = 0.0015, df = 10, t =4.307. 6 wells
analyzed per group. c-d, shRNA KDELR3 knockdown in human WM-46 cells versus non-
targeting control, unpaired two-tailed student’s t-test, P = 0.0324, df = 10, t =2.483. 6 wells
analyzed per group. e-f, Western blot and qPCR analysis of exogenously expressed FLAG-
tagged KDELR3-001; ENST00000216014 (N) and KDELR3-001Mu (Mu) in WM-46 (e)
and 1205Lu (f) cells, transduced with non-targeting control (shControl/Cont./Control) or
KDELR3-targeted (KD) shRNAs. Total KDELR3-001 RNA (KDELR3-001 and KDELR3-
001Mu) (f). g, Rescue of soft agar colony formation in KDELR3-001Mu cells (WM-46),
Kruskal-Wallis with Dunn’s multiple comparison test. 5-6 wells analyzed per group. h-i,
Tail vein metastasis of Kdelr3 siRNA knockdown in mouse B16 cells. Unpaired two-tailed
student’s t-test with Welch’s correction, P =0.0499, df = 10.83, t = 2.207. j, Tail vein
metastasis of KDELR3 siRNA-mediated knockdown human 1205Lu cells transduced with
Ferh-luc-GFP. Unpaired two-tailed student’s t-test with Welch’s correction, P = 0.0075, df
= 12.57, t = 3. b, d, e, i, j, Bars and error bars depict mean + s.e.m. a-f, h-j, Representative
of three independent experiments. g, Representative of two independent experiments. e, β-
Tubulin loading control.
.CC-BY-NC-ND 4.0 International licenseIt is made available under a was not peer-reviewed) is the author/funder, who has granted bioRxiv a license to display the preprint in perpetuity.
The copyright holder for this preprint (which. http://dx.doi.org/10.1101/721712doi: bioRxiv preprint first posted online Aug. 6, 2019;
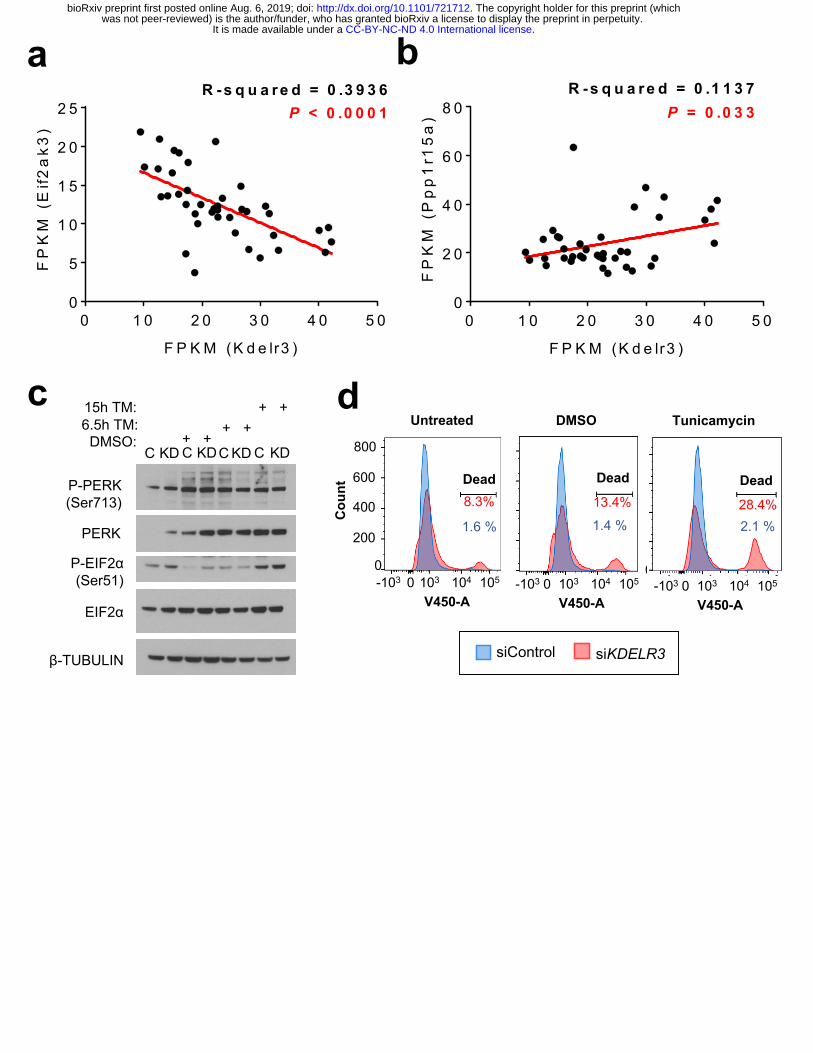
c d
siControl siKDELR3
DMSOUntreated
-103 0 103 104 105
V450-A-103 0 103 104 105
V450-A
0
200
400
600
800
Cou
nt
0
8.3% 13.4%
Tunicamycin
28.4%
DeadDeadDead
-103 0 103 104 105
V450-A
1.6 % 1.4 % 2.1 %
0 1 0 2 0 3 0 4 0 5 00
5
1 0
1 5
2 0
2 5
F P K M (K d e lr3 )
FP
KM
(E
if2a
k3)
R -s q u a re d = 0 .3 9 3 6P < 0 .0 0 0 1
0 1 0 2 0 3 0 4 0 5 00
2 0
4 0
6 0
8 0
F P K M (K d e lr3 )
FP
KM
(P
pp
1r1
5a
)
R -s q u a re d = 0 .1 1 3 7P = 0 .0 3 3
a b
P-PERK(Ser713)
P-EIF2α(Ser51)
β-TUBULIN
EIF2α
PERK
C KD C KDC KD C KDDMSO:
6.5h TM:15h TM:
+ ++ +
+ +
.CC-BY-NC-ND 4.0 International licenseIt is made available under a was not peer-reviewed) is the author/funder, who has granted bioRxiv a license to display the preprint in perpetuity.
The copyright holder for this preprint (which. http://dx.doi.org/10.1101/721712doi: bioRxiv preprint first posted online Aug. 6, 2019;
Figure 4: KDELR3 and the ER Stress Response in metastatic melanoma. a, Scatter
plot of Eif2ak3 (Perk) RNA expression versus Kdelr3 RNA expression. Linear regression
analysis, R-squared = 0.3936, P < 0.0001. b, Scatter plot of Ppp1r15a (Gadd34) RNA
expression versus Kdelr3 RNA expression. Linear regression analysis, R-squared =
0.1137, P = 0.03. a, b, Data from four independent mouse models of melanoma (see
methods). Each dot represents one mouse. M1, N= 9 mice; M2, N= 6 mice; M3, N= 12
mice; M4, N= 13 mice. c, Western blot analysis of PERK and eIF2α signaling (1205Lu
cells). Non-targeting control (shControl; C) and KDELR3 knockdown (shKDELR3; KD)
cells were untreated or treated with 3 µg/ml tunicamycin (TM) for the indicated time.
Immunoblot with antibodies specified, β-Tubulin loading control. d, Live/dead violet cell
stain in KDELR3-knockdown 1205Lu cells. Untreated, DMSO, and tunicamycin (2.5
μg/ml) treatment groups were treated 18 hours before collection. Right-hand peak on
graph indicates percentage dead cells. Representative of 3 independent experiments.
.CC-BY-NC-ND 4.0 International licenseIt is made available under a was not peer-reviewed) is the author/funder, who has granted bioRxiv a license to display the preprint in perpetuity.
The copyright holder for this preprint (which. http://dx.doi.org/10.1101/721712doi: bioRxiv preprint first posted online Aug. 6, 2019;
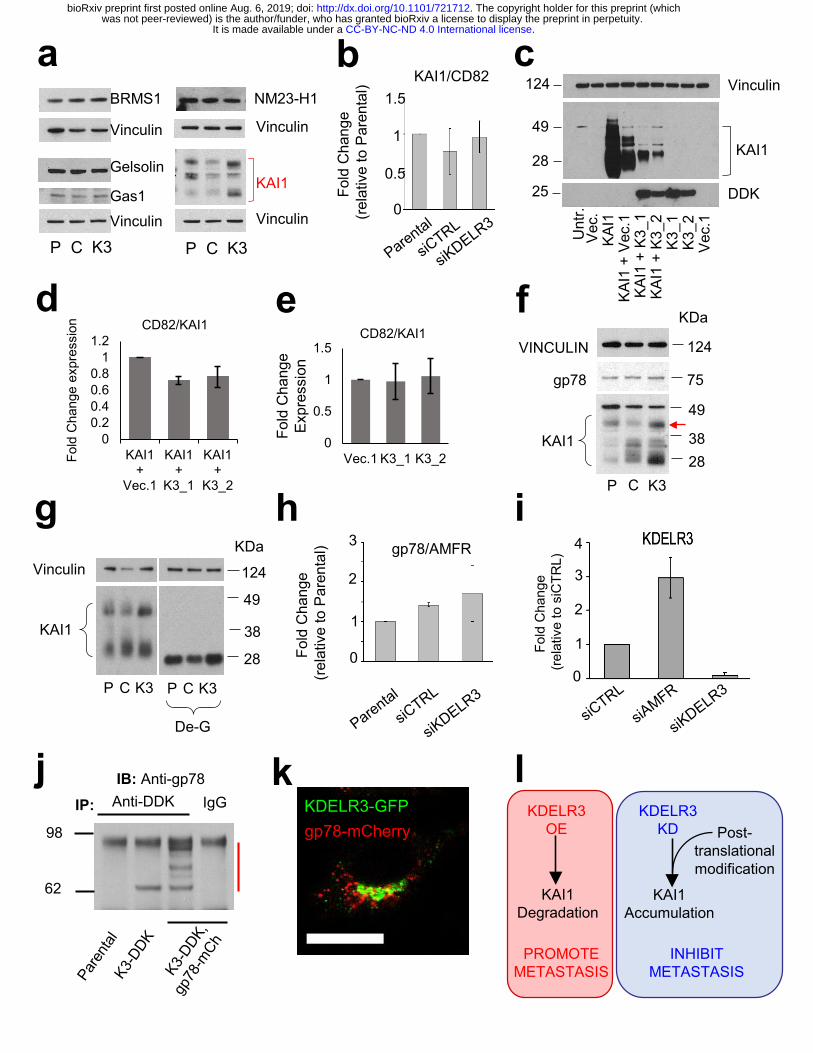
KDELR3-GFPgp78-mCherry
0
1
2
3
Fold
Cha
nge
(rela
tive
to P
aren
tal) gp78/AMFR
0
1
2
3
4Fo
ld C
hang
e (re
lativ
e to
siC
TRL)
98
62
IP: Anti-DDK IgGIB: Anti-gp78
VinculinKDa
124
28
38
49
KAI1
P C K3 P C K3
De-G
NM23-H1BRMS1
Vinculin
Gelsolin
Gas1
Vinculin
Vinculin
Vinculin
KAI1
P C K3 P C K3
a
0
1
1.5
0.5
Fold
Cha
nge
(rela
tive
to P
aren
tal)
KAI1/CD82
00.20.40.60.8
11.2
KAI1+
Vec.1
KAI1+
K3_1
KAI1+
K3_2
Fold
Cha
nge
expr
essi
on CD82/KAI1
0
0.5
1
1.5
Vec.1 K3_1 K3_2
CD82/KAI1
b c
d e f
g h i
j k l
Fold
Cha
nge
Exp
ress
ion
Vinculin
KAI1
DDK
Unt
r.V
ec.
KA
I1K
AI1
+ V
ec.1
KA
I1 +
K3_
1K
AI1
+ K
3_2
K3_
1K
3_2
Vec
.1
49
28
25
124
KDELR3OE
KDELR3KD
KAI1 Degradation
KAI1 Accumulation
PROMOTE METASTASIS
INHIBIT METASTASIS
Post-translational modification
2838
49
VINCULIN
gp78
KAI1
KDa
75
124
P K3C
.CC-BY-NC-ND 4.0 International licenseIt is made available under a was not peer-reviewed) is the author/funder, who has granted bioRxiv a license to display the preprint in perpetuity.
The copyright holder for this preprint (which. http://dx.doi.org/10.1101/721712doi: bioRxiv preprint first posted online Aug. 6, 2019;

Figure 5: KDELR3 regulates expression and processing of the metastasis suppressor
KAI1. a, Screen of known melanoma metastasis suppressor expression following KDELR3
knockdown (3 days post knockdown). P, Parental; C, siControl; K3, siKDELR3. b, qPCR
of KAI1 RNA expression (CD82 gene) in siRNA knockdown cells (indicated), 3 days post
knockdown. c-e, KAI1 protein (c) and RNA (d-e) expression in 1205Lu cells transfected
with CD82/KAI1 overexpression (KAI1) or PCMV6-AC control vector (Vec.), KDELR3
transcript 1with DDK tag (K3_1), KDELR3 transcript 2 with DDK tag (K3_2), or PCMV6
control vector (Vec.1). Harvested 3 days post transfection. Equal protein amounts subjected
to immunoblot analysis with an anti-KAI1 and anti-DDK antibody and anti-VINCULIN
loading control (c). f, 1205Lu cells parental (P), and 1205Lu cells transiently transfected
with control siRNA (C), and KDELR3 siRNA (K3), harvested 3 days post transfection and
equal protein amounts subjected to immunoblot analysis with an anti-KAI1 and anti-gp78
antibody. g, KAI1 protein expression in siRNA knockdown (indicated) 1205Lu cells
harvested 3 days post transfection and treated with de-glycosylation enzymes (De-G). h,
qPCR of gp78 RNA expression (AMFR gene) in siRNA knockdown cells (indicated), 3
days post knockdown. f, g, Anti-vinculin antibody used to control for protein loading. i,
qPCR of KDELR3 RNA expression in siRNA knockdown cells (indicated), 4 days post
knockdown j, Co-immunoprecipitation of endogenous gp78 and mCherry tagged gp78
(gp78-mCh) with FLAG-tagged KDELR3 (K3-DDK) in stably transduced 1205Lu cells.
Red line, gp78 expression. k, pol2>KDELR3-GFP (green) co-localizes with pol2>gp78-
mCherry (red) in 1205Lu metastatic melanoma cells. Scale bars, 50 µm. l, Schematic of the
KDELR3-KAI1 axis in melanoma metastasis. a-f, h, j-k, Representative of three
independent experiments. g, i, Representative of two independent experiments.
.CC-BY-NC-ND 4.0 International licenseIt is made available under a was not peer-reviewed) is the author/funder, who has granted bioRxiv a license to display the preprint in perpetuity.
The copyright holder for this preprint (which. http://dx.doi.org/10.1101/721712doi: bioRxiv preprint first posted online Aug. 6, 2019;
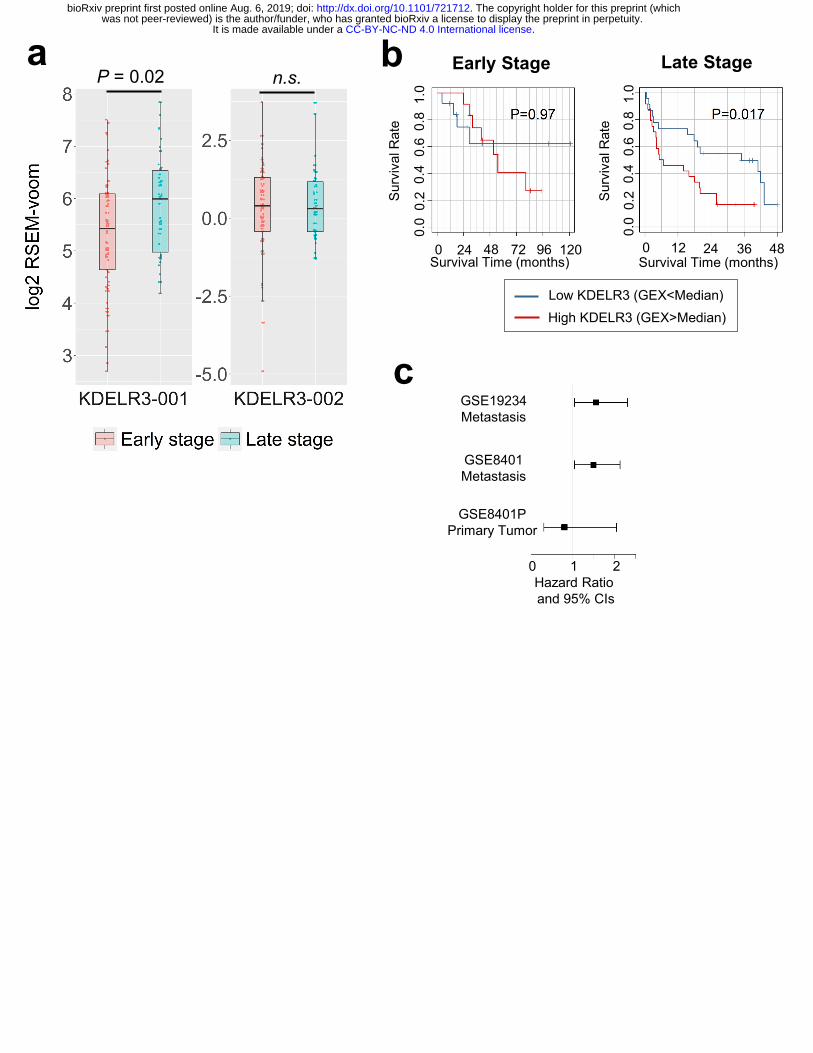
b Early Stage
0 24 48 72 96 120Survival Time (months)
0.0
0.2
0.4
0.6
0.8
1.0
Sur
viva
l Rat
e
Late Stage
0 12 24 36 48Survival Time (months)
0.0
0.2
0.4
0.6
0.8
1.0
Sur
viva
l Rat
e
Low KDELR3 (GEX<Median)High KDELR3 (GEX>Median)
c
P = 0.02 n.s.a
GSE8401PPrimary Tumor
GSE8401Metastasis
GSE19234Metastasis
0 1 2Hazard Ratio and 95% CIs
.CC-BY-NC-ND 4.0 International licenseIt is made available under a was not peer-reviewed) is the author/funder, who has granted bioRxiv a license to display the preprint in perpetuity.
The copyright holder for this preprint (which. http://dx.doi.org/10.1101/721712doi: bioRxiv preprint first posted online Aug. 6, 2019;
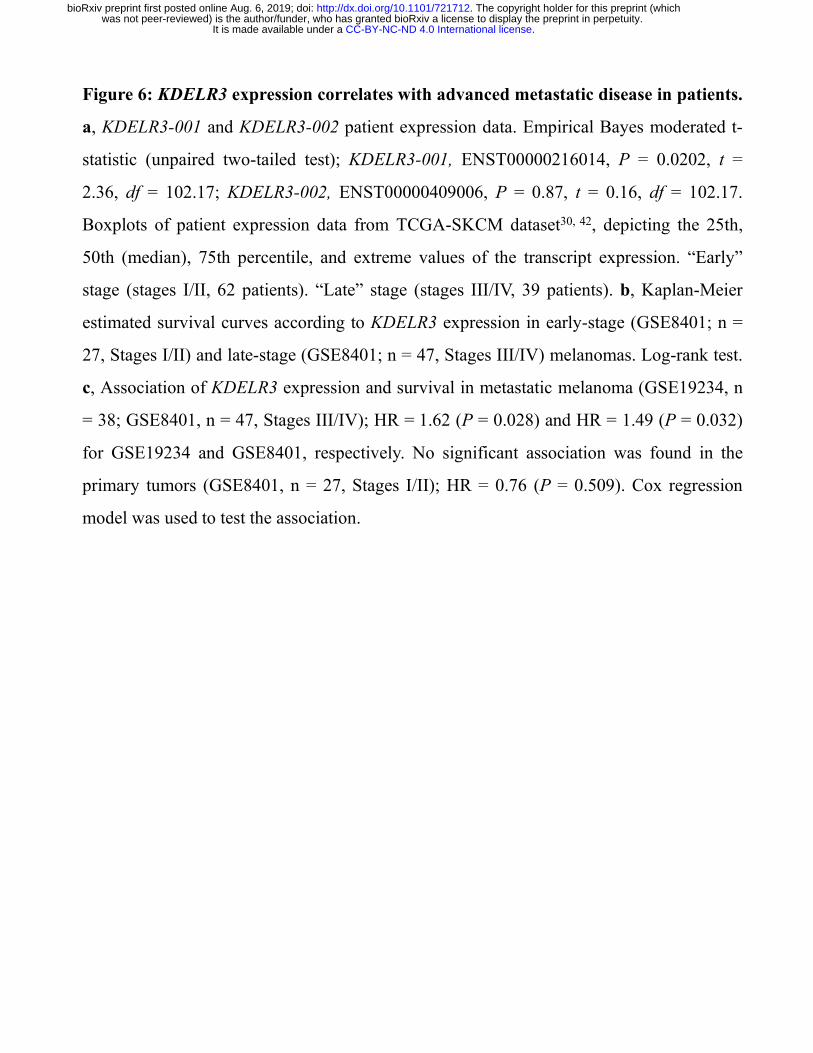
Figure 6: KDELR3 expression correlates with advanced metastatic disease in patients.
a, KDELR3-001 and KDELR3-002 patient expression data. Empirical Bayes moderated t-
statistic (unpaired two-tailed test); KDELR3-001, ENST00000216014, P = 0.0202, t =
2.36, df = 102.17; KDELR3-002, ENST00000409006, P = 0.87, t = 0.16, df = 102.17.
Boxplots of patient expression data from TCGA-SKCM dataset30, 42, depicting the 25th,
50th (median), 75th percentile, and extreme values of the transcript expression. “Early”
stage (stages I/II, 62 patients). “Late” stage (stages III/IV, 39 patients). b, Kaplan-Meier
estimated survival curves according to KDELR3 expression in early-stage (GSE8401; n =
27, Stages I/II) and late-stage (GSE8401; n = 47, Stages III/IV) melanomas. Log-rank test.
c, Association of KDELR3 expression and survival in metastatic melanoma (GSE19234, n
= 38; GSE8401, n = 47, Stages III/IV); HR = 1.62 (P = 0.028) and HR = 1.49 (P = 0.032)
for GSE19234 and GSE8401, respectively. No significant association was found in the
primary tumors (GSE8401, n = 27, Stages I/II); HR = 0.76 (P = 0.509). Cox regression
model was used to test the association.
.CC-BY-NC-ND 4.0 International licenseIt is made available under a was not peer-reviewed) is the author/funder, who has granted bioRxiv a license to display the preprint in perpetuity.
The copyright holder for this preprint (which. http://dx.doi.org/10.1101/721712doi: bioRxiv preprint first posted online Aug. 6, 2019;
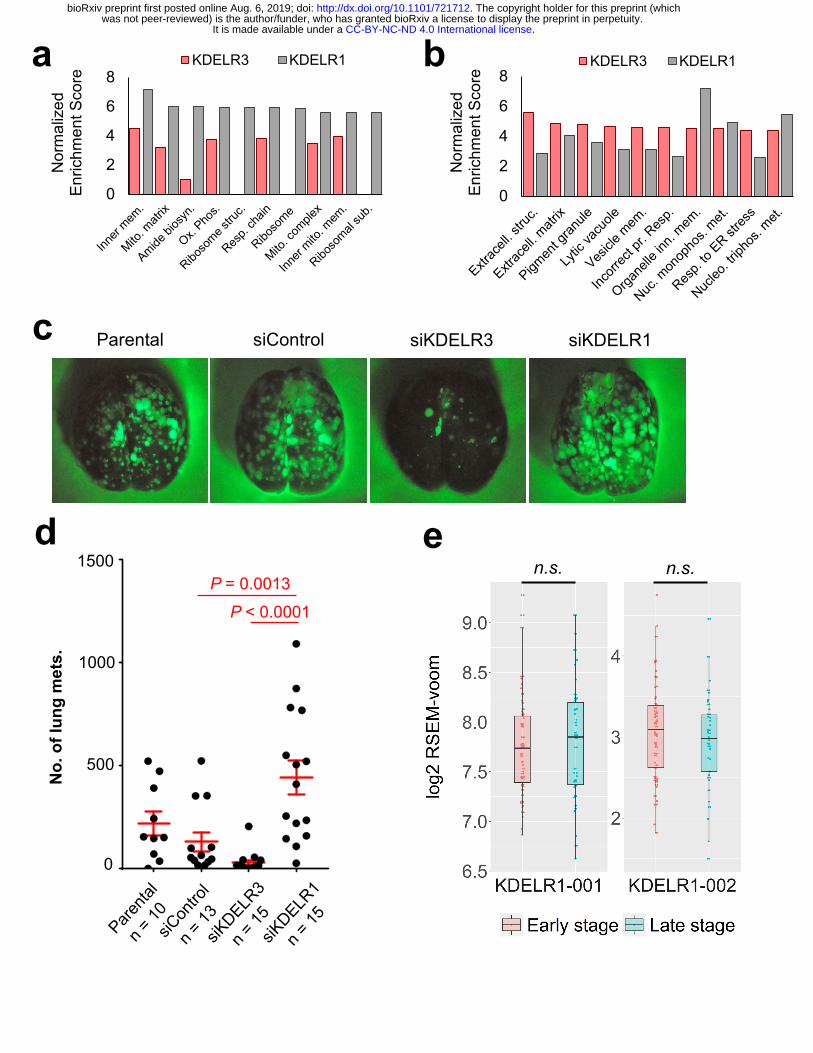
0
2
4
6
8N
orm
aliz
ed
Enr
ichm
ent S
core
KDELR3 KDELR1a
Parental siControl siKDELR3 siKDELR1
d
c
n.s. n.s.e
P aren ta
l
s iCo n tro
l
s iKD E L R 3
s iKD E L R 1
0
5 0 0
1 0 0 0
1 5 0 0
P = 0.0013
P < 0.0001
0
500
1000
1500
No.
of l
ung
met
s.b
0
2
4
6
8
Nor
mal
ized
E
nric
hmen
t Sco
re
KDELR3 KDELR1
.CC-BY-NC-ND 4.0 International licenseIt is made available under a was not peer-reviewed) is the author/funder, who has granted bioRxiv a license to display the preprint in perpetuity.
The copyright holder for this preprint (which. http://dx.doi.org/10.1101/721712doi: bioRxiv preprint first posted online Aug. 6, 2019;
Figure 7: KDELR1 knockdown increases lung colonization in tail vein metastasis
assays. a, GSEA of gene co-expression within skin cutaneous melanoma patients of the
TCGA (n = 479). Top 10 KDELR1-associated GO pathways represented, FDR < 0.0001.
Go pathways in order: Organelle inner membrane; Mitochondrial matrix; Amide
biosynthetic process; Oxidative phosphorylation; Structural constituent of ribosome;
Respiratory chain; Ribosome; Mitochondrial protein complex; Inner mitochondrial
membrane protein complex; Ribosomal subunit. b, GSEA of gene co-expression within
skin cutaneous melanoma patients of the TCGA (n = 479). Top 10 KDELR3-associated
GO pathways represented, FDR < 0.0001. Go pathways in order: Extracellular structure
organization; Extracellular matrix; Pigment granule; Lytic vacuole; Vesicle membrane;
Response to topologically incorrect protein; Organelle inner membrane; Nucleoside
monophosphate metabolic process; Response to endoplasmic reticulum stress; Nucleoside
triphosphate metabolic process. c-d, Tail vein metastasis of KDELR1 siRNA-mediated
knockdown human 1205Lu cells transduced with Ferh-luc-GFP. Parental, siControl and
siKDELR3 were used as controls. ANOVA with Tukey’s multiple comparisons test;
siControl Vs siKDELR1, P = 0.0013, [mean difference (95% CI); -312.5(-521.7; -103.4)];
siKDELR3 Vs siKDELR1, P <0.0001, [mean difference (95% CI); -415.3(-616.8; -213.7)].
df = 49, F = 10.8. CI, Confidence interval of differences. e, KDELR1-001 and KDELR1-
002 patient expression data. Empirical Bayes moderated t-statistic (unpaired two-tailed
test); KDELR1-001, ENST00000330720, P = 0.73, t = 0.35, df = 102.17; KDELR1-002,
ENST00000597017, P = 0.39, t = -0.86, df = 102.17. Boxplots of patient expression data
from TCGA-SKCM dataset30, 42, depicting the 25th, 50th (median), 75th percentile, and
extreme values of the transcript expression. “Early” stage (stages I/II, 62 patients). “Late”
stage (stages III/IV, 39 patients).
.CC-BY-NC-ND 4.0 International licenseIt is made available under a was not peer-reviewed) is the author/funder, who has granted bioRxiv a license to display the preprint in perpetuity.
The copyright holder for this preprint (which. http://dx.doi.org/10.1101/721712doi: bioRxiv preprint first posted online Aug. 6, 2019;
Related Documents