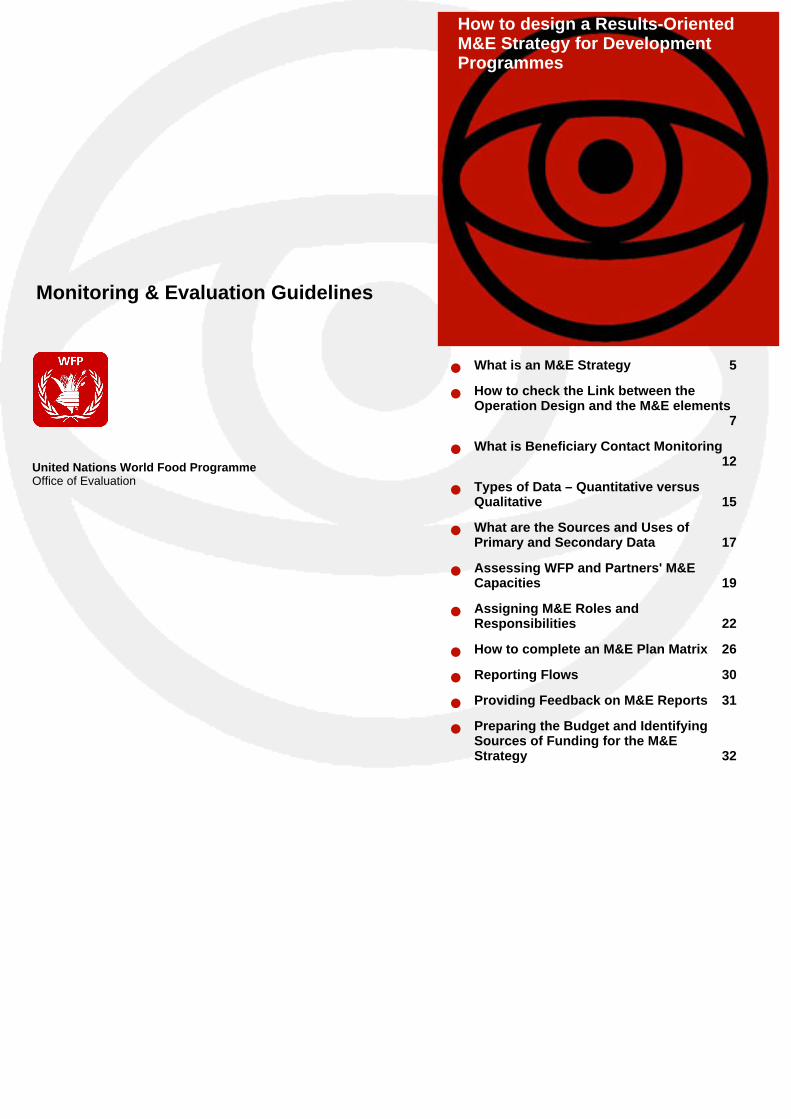
Monitoring & Evaluation Guidelines How to design a Results-Oriented M&E Strategy for Development Programmes United Nations World Food Programme Office of Evaluation • What is an M&E Strategy 5 • How to check the Link between the Operation Design and the M&E elements 7 • What is Beneficiary Contact Monitoring 12 • Types of Data – Quantitative versus Qualitative 15 • What are the Sources and Uses of Primary and Secondary Data 17 • Assessing WFP and Partners' M&E Capacities 19 • Assigning M&E Roles and Responsibilities 22 • How to complete an M&E Plan Matrix 26 • Reporting Flows 30 • Providing Feedback on M&E Reports 31 • Preparing the Budget and Identifying Sources of Funding for the M&E Strategy 32

Welcome message from author
This document is posted to help you gain knowledge. Please leave a comment to let me know what you think about it! Share it to your friends and learn new things together.
Transcript
Monitoring & Evaluation Guidelines
How to design a Results-OrientedM&E Strategy for DevelopmentProgrammes
United Nations World Food ProgrammeOffice of Evaluation
• What is an M&E Strategy 5
• How to check the Link between theOperation Design and the M&E elements
7
• What is Beneficiary Contact Monitoring12
• Types of Data – Quantitative versusQualitative 15
• What are the Sources and Uses ofPrimary and Secondary Data 17
• Assessing WFP and Partners' M&ECapacities 19
• Assigning M&E Roles andResponsibilities 22
• How to complete an M&E Plan Matrix 26
• Reporting Flows 30
• Providing Feedback on M&E Reports 31
• Preparing the Budget and IdentifyingSources of Funding for the M&EStrategy 32
How to design a Results-Oriented M&E Strategy for DevelopmentProgrammes
Overview
Introduction. The purpose of this module is to describe how an M&E strategy forDevelopment Programmes should be designed.
Why is this Module important?
At the planning and inception stages of development programmes (or operations) it is importantto clarify the link between the overall design of the programme and its M&E strategy. Themodule introduces a number of useful tools and procedures to follow in order to develop theM&E strategy. The module encourages readers to ensure that the M&E Plan and EvaluationPlan are feasible both in terms of the capacity of WFP and its partners to implement them andthe budget and other resources available.
What does this Module aim to achieve?This module has the following objectives:
• To describe the components of an M&E strategy.• To describe the critical relationship between M&E and operation design and to explain what
steps to follow to ensure that this link is clearly articulated.• To define Beneficiary Contact Monitoring and explain how it is used in monitoring and
evaluation.• To describe the 2 general types of data – quantitative and qualitative – that can be used for
M&E purposes.• To describe 2 broad categories of data – primary and secondary – and the appropriate use
of each in providing information for use in the M&E of WFP operations.• To assess WFP and partners’ M&E capacities and to develop a plan to address constraints.• To assign M&E roles and responsibilities to WFP, government and implementing partners.• To explain how to complete an M&E plan matrix.• To describe the reporting flows relevant to M&E.• To describe the importance of providing feedback on M&E information and reports.• To prepare the M&E budget and identify sources of funding.
What should be reviewed before starting?• What is RBM Oriented M&E
How does this module apply to designing or implementing an M&E strategyfor an operation?WFP staff with responsibilities for planning Development Programmes should be able toidentify, select and present the following M&E related content in key documents:· Operation’s objectives and assumptions and a related set of results indicators· Arrangements for routine collection, analysis and reporting on monitoring data, including costs· Use of and arrangements for baseline and subsequent evaluation events to gauge changeover time, including costs.· Arrangements for feedback and review of M&E findings for decision-making.
Guidelines
2
· Arrangements for capacity building of WFP and partners to conduct M&E tasks if required.· Annual M&E implementation plans and budgets.
Section Titles and Content Headings• What is an M&E Strategy
• Introduction• What are the Main Components of an M&E Strategy• Examples of the Types of M&E Strategy Documents
• How to check the Link between the Operation Design and the M&E elements
• Introduction• The Standard Logical Framework Matrix and how it relates to M&E• The main Contents of the Logical Framework Matrix• How to check the Design Logic in a Logical Framework• How to check the M&E Elements in a Logical Framework• An Example of how to check the Design Logic in a Logical Framework• An Example of Distinct and Separate Results Hierarchy Levels and Design Elements• An Example of SMART Indicators within Each Level of the Results Hierarchy
• What is Beneficiary Contact Monitoring
• Introduction• What is BCM?• BCM and the Logical Framework• An Example of BCM Leading Indicators and Their relation to Outcome Indicators in
Development Operations, PRROs and EMOPs
• Types of Data – Quantitative versus Qualitative
• Introduction• What are the Characteristics of Quantitative and Qualitative Data• Examples of Quantitative and Qualitative Data
• What are the Sources and Uses of Primary and Secondary Data
• Introduction• What are the Differences between Primary and Secondary Data• Appropriate Uses of Primary and Secondary Data• An Example of using Secondary Data in Development• An Example of a Secondary Data Source for Emergency Operations (EMOPs)• An Error to avoid
• Assessing WFP and Partners' M&E Capacities
• Introduction• Why is Assessment of WFP's and Partners' M&E Capacities needed and when
should It be done?• Steps to Assessing M&E Capacities of WFP, Government, and Implementing
Partners
• Assigning M&E Roles and Responsibilities
• Introduction• How are M&E Roles and Responsibilities shared between WFP, Government and
Partners• Guidelines for assigning M&E Roles and Responsibilities to Government
Departments and Implementing Partners• Guidelines for assigning M&E Roles and Responsibilities to Beneficiaries• Guidelines for assigning M&E Roles and Responsibilities to the WFP Country Office
Guidelines
3
• Guidelines for assigning M&E Roles and Responsibilities to WFP Regional Bureaux• M&E Roles and Responsibilities of WFP Staff in Country Offices according to
Generic Job Profiles
• How to complete an M&E Plan Matrix
• Introduction• The M&E Plan Matrix• An M&E Plan for a Community Forestry Project• Stages for completing the M&E Plan Matrix
• Reporting Flows
• Introduction• Reporting Flows within Country Offices and from the Field to HQ
• Providing Feedback on M&E Reports
• Introduction• Guidelines for providing Feedback on Reports• Examples of Formal Feedback Opportunities to be stated in the M&E Plan
• Preparing the Budget and Identifying Sources of Funding for the M&E Strategy
• Introduction• Items to consider when preparing the M&E Budget• 3 Main Sources of M&E Funds within WFP for Operations• Examples of M&E Cost Items funded by WFP’s 3 Main Operation Budget Sources
Guidelines
4
What is an M&E Strategy
Introduction. This section explains the major components and functions of an M&Estrategy, simply a detailed description of the measurements, analysis, and reportingneeded to monitor and evaluate an operation’s implementation and achievement ofresults described in the logical framework.
What are the Main Components of an M&E Strategy
The main Components of an M&E Strategy are:
• A logical framework.• An M&E plan for data collection and analysis, covering baseline, ongoing monitoring and
evaluation.• Reporting flows and formats.• A feedback and review plan.• A capacity building design.• An implementation schedule.• A budget.The logical framework matrix is the foundation document for both operation design and M&E.Additional elements of the M&E strategy are extensions of the logical framework that describehow indicators will be used in practice to measure implementation performance and resultsachievement.
The Logical Framework outlines:
• Clearly defined and realistic objectives, assumptions and risks that describe how the opera-tion is designed to work.
• A minimum set of results indicators for each objective and assumption that are feasible tocollect and analyse. Indicators measure performance on implementation and achievementof results. The means of verification provided in the logical framework for each indicatoroutlines the source of data needed to answer each indicator.
An M&E Plan for Data Collection and Analysis, covering Baseline, and ongoing Monitor-ing and Evaluation:
• Sets out arrangements for routine collection of monitoring data, based on indicators identi-fied in the logical framework including how, when, and by whom data will be collected, ana-lysed and reported. This includes descriptions of Beneficiary Contact Monitoring to gaugeprogress toward achieving results and monitoring achievement of output targets, mile-stones to measure completion of activities and compliance with contract agreements, re-source expenditures versus budget, and risks and assumptions. This also includes ar-rangements for verifying the quality and accuracy of M&E data and analysis.
• Describes the use of baseline and subsequent evaluation events to gauge change overtime in indicators identified in the logical framework. Usually WFP operations employ asimple before and after operation evaluation design. While a baseline and final evaluationare recommended, a mid-term evaluation is also employed to measure mid-course pro-gress toward results achievement and to help guide planning for subsequent phases of anoperation.
• Sets out arrangements for collection of periodic evaluation data, based on indicators inden-tified in the logical framework and including how, when, and by whom data will be collected,
Guidelines
5
analysed and reported.
Reporting Flows and Formats:
• The reporting flow and formats for both monitoring and evaluation are linked to each levelof management, as well as to the agreed system for feedback and management review.
A Feedback and Review Plan:
• Sets out the measures to be taken to ensure timely decision-making by management andother stakeholders based on monitoring and evaluation findings. In WFP usually an annualreview meeting attended by key stakeholders is held to allow for a participatory annual as-sessment of performance and results obtained to-date as well as for planning the followingyear’s M&E activities.
A Capacity Building Design:
• Sets out capacity building needed for WFP and implementing partners including specifica-tion of training if required.
An Annual Implementation Plan and a Budget:
• Links planned M&E activities to an implementation schedule and budget.
Examples of the Types of M&E Strategy Documents
• Logical Framework Matrix - specifying the operations internal design logic (inputs, activit-ies, outputs, outcomes, and impact), indicators at each level, the means of verification foreach indicator, and the risks and assumptions (external design logic) associated with eachlevel of the internal design logic.
• M&E Plan Matrix - specifying the indicators for each logical framework design element, thedata source or means of verification for each indicator, the frequency and cost of data col-lection for each indicator, the responsibility for data collection, the method to be used indata collection (if collecting primary data), and in which reports and how the information willbe used. The same information is also to be specified for the most critical assumptions.
• Evaluation Plan - identifying the before-and-after comparison of baseline, mid-term, and fi-nal evaluation results.
• Annual M&E Implementation Plan and Budget – detailed calendar of M&E activities and as-sociated costs.
• If required, a M&E Capacity Building Plan describing equipment, training and other require-ments needed for WFP and implementing partners to undertake the plans outlined above.
Guidelines
6
How to check the Link between the Operation Design and the M&Eelements
Introduction. This section clarifies the critical relationship between M&E and operationdesign, and provides the steps to follow to ensure that this link is clearly articulated.
The Standard Logical Framework Matrix and how it relates to M&E
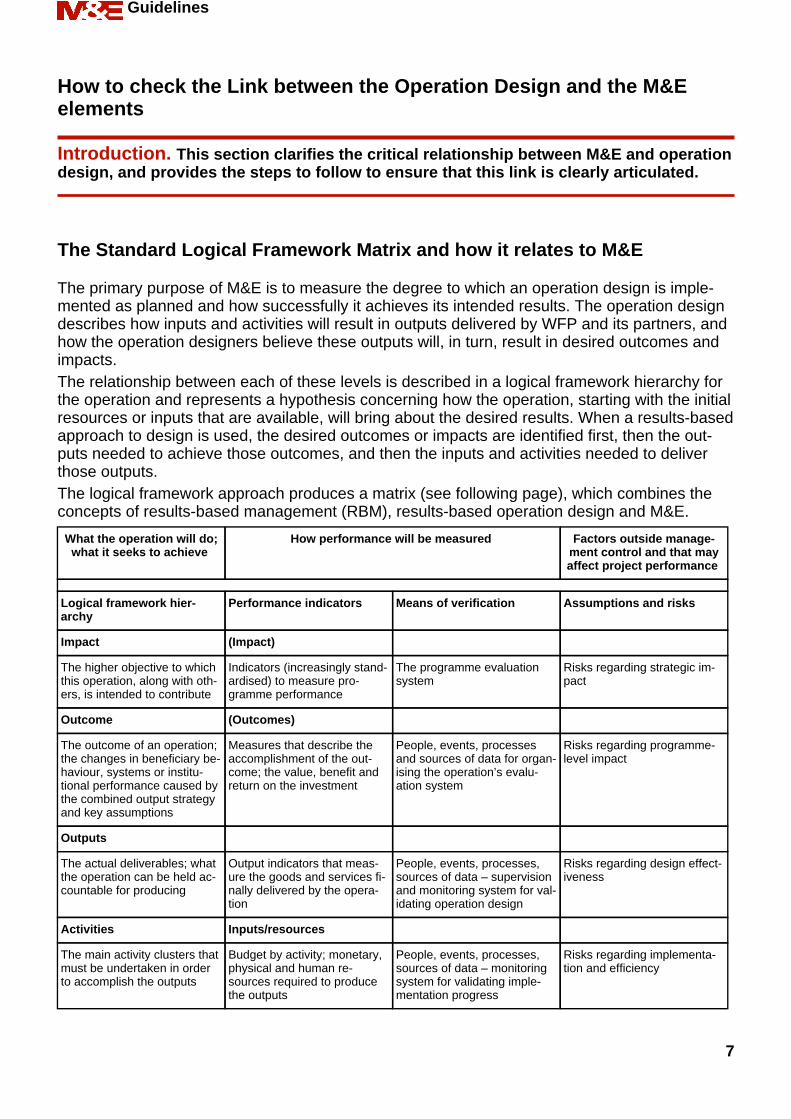
The primary purpose of M&E is to measure the degree to which an operation design is imple-mented as planned and how successfully it achieves its intended results. The operation designdescribes how inputs and activities will result in outputs delivered by WFP and its partners, andhow the operation designers believe these outputs will, in turn, result in desired outcomes andimpacts.The relationship between each of these levels is described in a logical framework hierarchy forthe operation and represents a hypothesis concerning how the operation, starting with the initialresources or inputs that are available, will bring about the desired results. When a results-basedapproach to design is used, the desired outcomes or impacts are identified first, then the out-puts needed to achieve those outcomes, and then the inputs and activities needed to deliverthose outputs.The logical framework approach produces a matrix (see following page), which combines theconcepts of results-based management (RBM), results-based operation design and M&E.
What the operation will do;what it seeks to achieve
How performance will be measured Factors outside manage-ment control and that mayaffect project performance
Logical framework hier-archy
Performance indicators Means of verification Assumptions and risks
Impact (Impact)
The higher objective to whichthis operation, along with oth-ers, is intended to contribute
Indicators (increasingly stand-ardised) to measure pro-gramme performance
The programme evaluationsystem
Risks regarding strategic im-pact
Outcome (Outcomes)
The outcome of an operation;the changes in beneficiary be-haviour, systems or institu-tional performance caused bythe combined output strategyand key assumptions
Measures that describe theaccomplishment of the out-come; the value, benefit andreturn on the investment
People, events, processesand sources of data for organ-ising the operation’s evalu-ation system
Risks regarding programme-level impact
Outputs
The actual deliverables; whatthe operation can be held ac-countable for producing
Output indicators that meas-ure the goods and services fi-nally delivered by the opera-tion
People, events, processes,sources of data – supervisionand monitoring system for val-idating operation design
Risks regarding design effect-iveness
Activities Inputs/resources
The main activity clusters thatmust be undertaken in orderto accomplish the outputs
Budget by activity; monetary,physical and human re-sources required to producethe outputs
People, events, processes,sources of data – monitoringsystem for validating imple-mentation progress
Risks regarding implementa-tion and efficiency
Guidelines
7
The main Contents of the Logical Framework Matrix
Each of the 4 columns in the Logical Framework is described in the following paragraphs. Thefirst and fourth columns articulate operation design and assumptions, while the second and thirdcolumns outline the M&E performance measurement indicators and means in order to testwhether or not the hypothesis articulated in the operation design holds true.Column 1: This column outlines the design or internal logic of the operation. It incorporates ahierarchy of what the operation will do (inputs, activities and outputs) and what it will seek toachieve (purpose and goal).Column 2: This column outlines how the design will be monitored and evaluated by providingthe indicators used to measure whether or not various elements of the operation design haveoccurred as planned.Column 3: This column specifies the source(s) of information or the means of verification forassessing the indicators.Column 4: This column outlines the external assumptions and risks related to each level of theinternal design logic that is necessary for the next level up to occur.
How to check the Design Logic in a Logical Framework
To check the design logic of the logical framework, review and test the internal and external lo-gic (columns 1 and 4, respectively) and the feasibility of the operation’s logical framework. Testthe logic beginning with inputs and move upwards towards the impact using an “if” (internal lo-gic) “and” (external logic) “then” (internal logic at the next level) logic test. Where necessary, ad-just the logical framework to overcome logic flaws or unfeasible/unlikely relationships amongvarious levels of the logical framework hierarchy. If no logical framework exists for the opera-tion, consult the Logical Framework Guidelines.Specifically check that the following conditions hold:• Inputs are necessary and sufficient for activities to take place• Activities are necessary and sufficient for outputs that are of the quality and quantity spe-
cified and that will be delivered on time.• All outputs are necessary, and all outputs plus assumptions at the output level are neces-
sary and sufficient to achieve the outcome.• The outcome plus assumptions at the outcome level are necessary and sufficient to
achieve the impact.• The impact, outcome, and output statements are not simply restatements, summaries or
aggregations of each other, but rather reflect the resulting joint outcome of 1level plus theassumptions at that same level.
• Each results hierarchy level represents a distinct and separate level, and each logicalframework element within a results hierarchy level represents a distinct and separate ele-ment.
• The impact, outcome, activities, inputs and assumptions are clearly stated, unambiguousand measurable. Impacts and outcomes are stated positively as the results that WFPwishes to see. Outputs are stated positively in terms of service/product delivery.
• The assumptions are stated positively as assumptions, rather than risks, and they have avery high probability of coming true.
How to check the M&E Elements in a Logical Framework
Check that the following conditions hold in the logical framework:• Indicators for measuring inputs, activities, outputs, outcome and impact are specific, meas-
urable, accurate, realistic and timely (SMART) (column 2).
Guidelines
8
• Beneficiary contact monitoring (BCM) indicators are identified for the purpose of trackingprogress between outputs and outcomes and are noted at the outcome level.
• 2 levels within 1 logical framework do not share the same indicator (if they do, the indicatorat 1 level is not specific enough to that level or the design logic between levels is flawed).
• The unit of study (e.g. individuals, children, households, organisations) in the numeratorand, where applicable, the denominator of each indicator are clearly defined such thatthere is no ambiguity in calculating the indicator.
• The means of verification for each indicator (column 3) are sufficiently documented, statingthe source of the data needed to assess the indicator (be sure that sources of secondarydata are in a useable form).
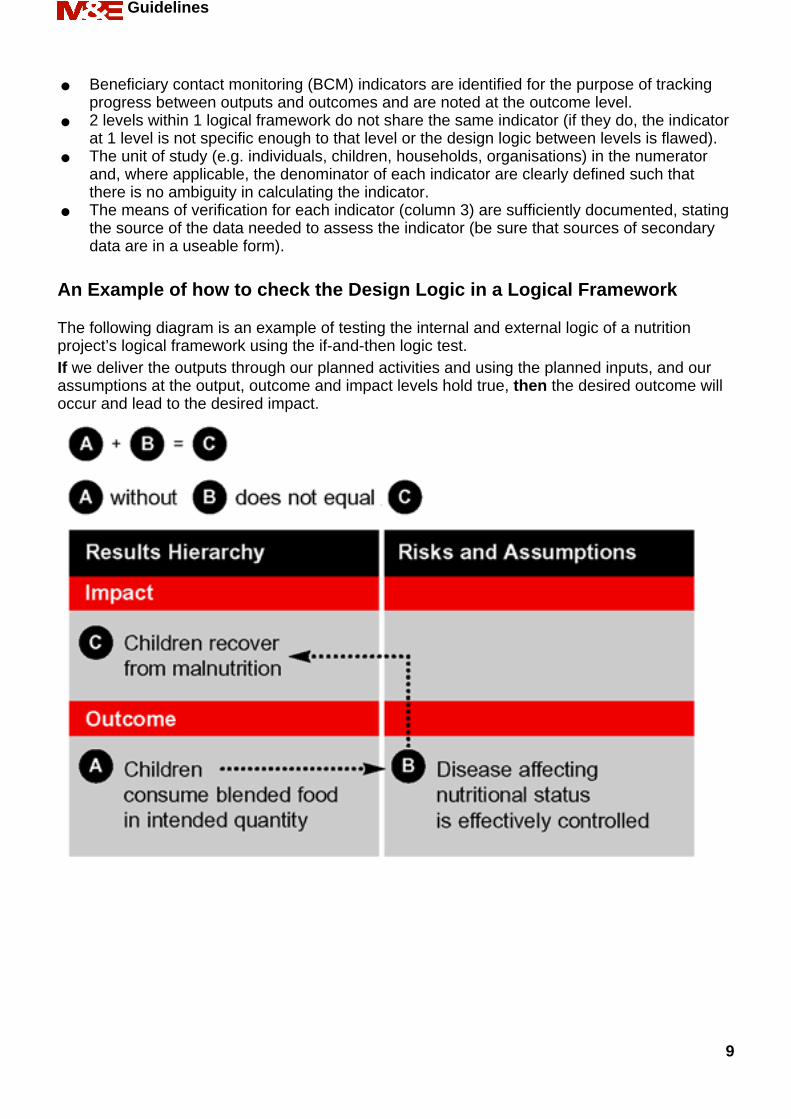
An Example of how to check the Design Logic in a Logical Framework
The following diagram is an example of testing the internal and external logic of a nutritionproject’s logical framework using the if-and-then logic test.If we deliver the outputs through our planned activities and using the planned inputs, and ourassumptions at the output, outcome and impact levels hold true, then the desired outcome willoccur and lead to the desired impact.
Guidelines
9
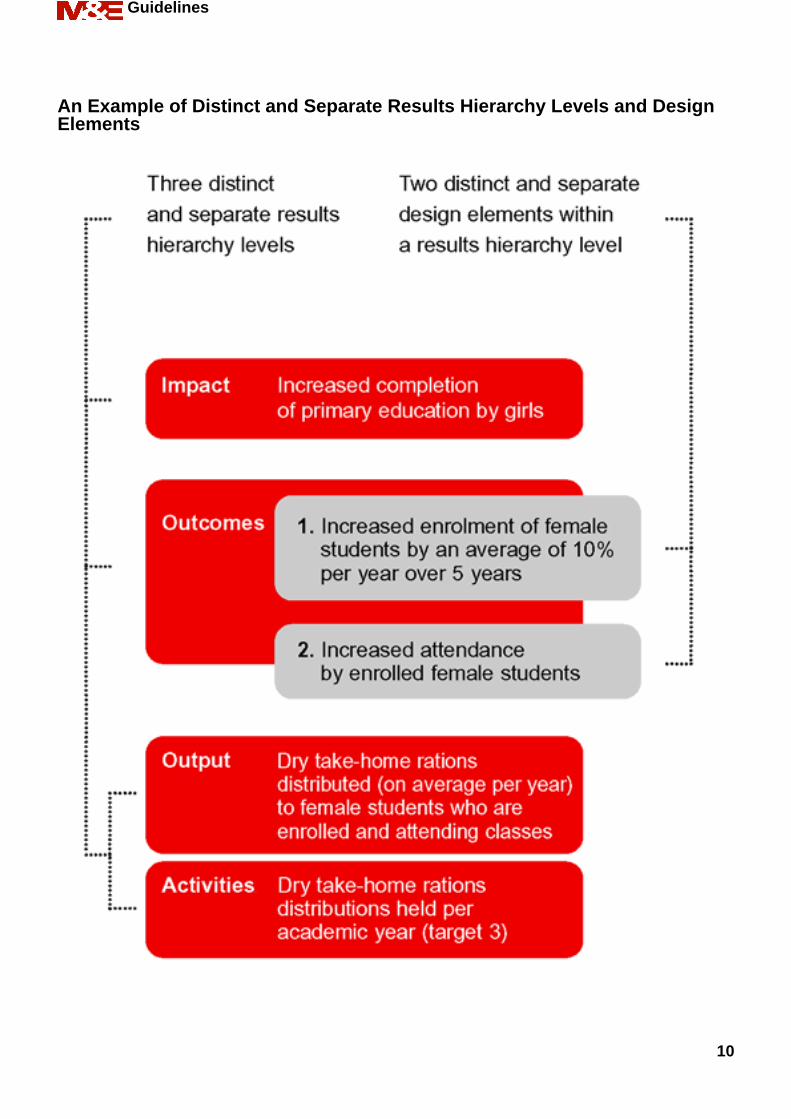
An Example of Distinct and Separate Results Hierarchy Levels and DesignElements
Guidelines
10
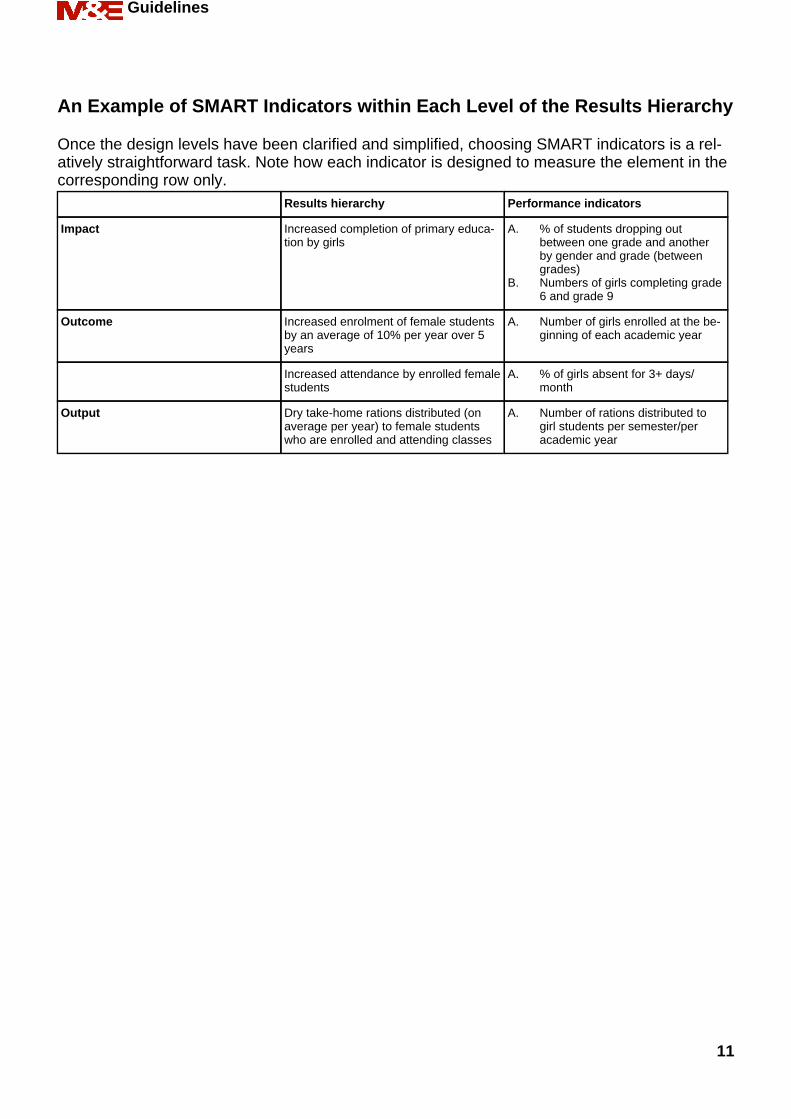
An Example of SMART Indicators within Each Level of the Results Hierarchy
Once the design levels have been clarified and simplified, choosing SMART indicators is a rel-atively straightforward task. Note how each indicator is designed to measure the element in thecorresponding row only.
Results hierarchy Performance indicators
Impact Increased completion of primary educa-tion by girls
A. % of students dropping outbetween one grade and anotherby gender and grade (betweengrades)
B. Numbers of girls completing grade6 and grade 9
Outcome Increased enrolment of female studentsby an average of 10% per year over 5years
A. Number of girls enrolled at the be-ginning of each academic year
Increased attendance by enrolled femalestudents
A. % of girls absent for 3+ days/month
Output Dry take-home rations distributed (onaverage per year) to female studentswho are enrolled and attending classes
A. Number of rations distributed togirl students per semester/peracademic year
Guidelines
11
What is Beneficiary Contact Monitoring
Introduction. This section defines Beneficiary Contact Monitoring (BCM) and explainshow it is used in monitoring and evaluation (M&E).
What is BCM?
‘BCM’ is defined as a systematic investigation to monitor beneficiaries’ – women’s, men’s, girls’and boys’ – perceptions of an operation.
BCM
• Focuses on beneficiary access to, use of and satisfaction with outputs by seeking feedbackdirectly from the women, men and children who are the target group for an operation.
• Concerns the transition between outputs and outcomes.• Provides managers with an indication of progress towards the achievement of an opera-
tion’s outcomes.• Uses a variety of techniques and data collection methods.
It applies the following logic:
• If members of the target group do not have access to operation outputs, they will not exper-ience any benefit.
• If members of the target group have access to, but have chosen not to use, the outputs,they will not experience any benefit.
• If members of the target group are using operation outputs, but are not satisfied with theservices or facilities they are receiving, they are unlikely to use them in the longer term, andtherefore their experience of benefits will be limited.
In the logical framework matrix, BCM seeks to gauge progress in the transition from service de-livery (outputs) to benefits (outcomes). The indicators used in BCM are therefore referred to as“leading indicators”. BCM indicators should be included in the logical framework at the outcomelevel.It must be noted that beneficiaries’ reaction, however positive, is only a proxy indicator of theimproved situation that an operation is intended to bring about. A proxy indicator is an indicatorthat is substituted for another indicator that would be hard to measure directly.
Guidelines
12
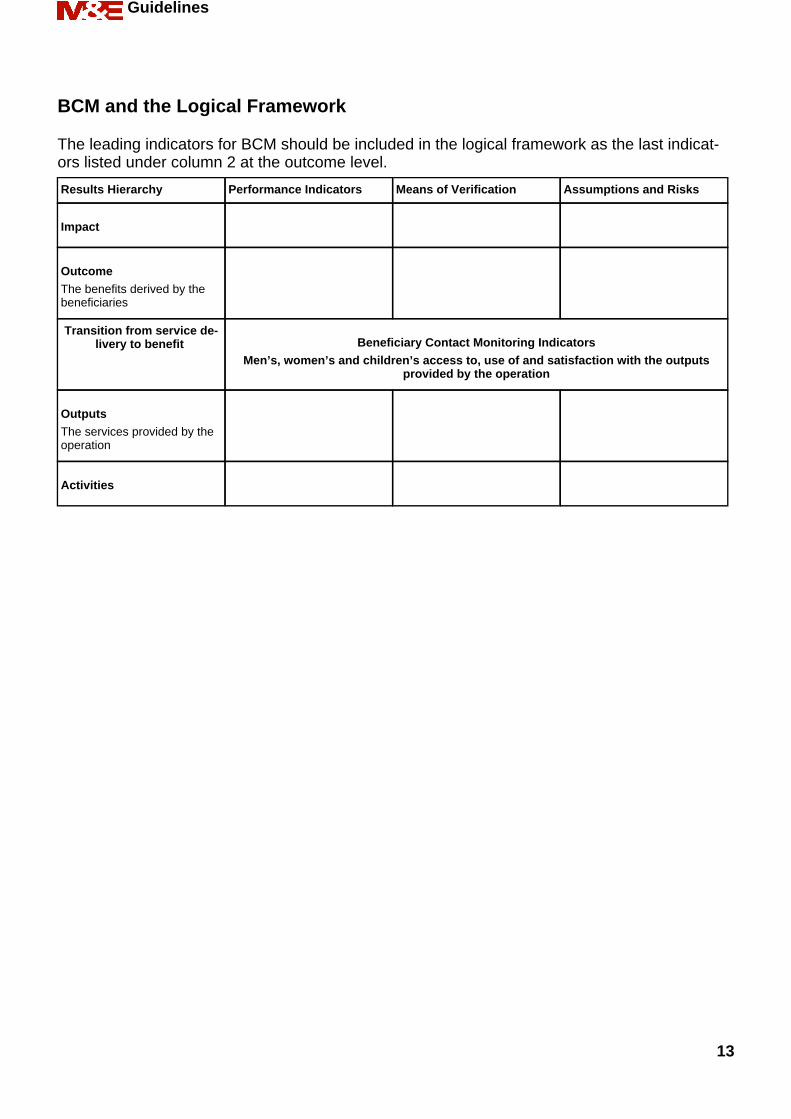
BCM and the Logical Framework
The leading indicators for BCM should be included in the logical framework as the last indicat-ors listed under column 2 at the outcome level.
Results Hierarchy Performance Indicators Means of Verification Assumptions and Risks
Impact
OutcomeThe benefits derived by thebeneficiaries
Transition from service de-livery to benefit Beneficiary Contact Monitoring Indicators
Men’s, women’s and children’s access to, use of and satisfaction with the outputsprovided by the operation
OutputsThe services provided by theoperation
Activities
Guidelines
13
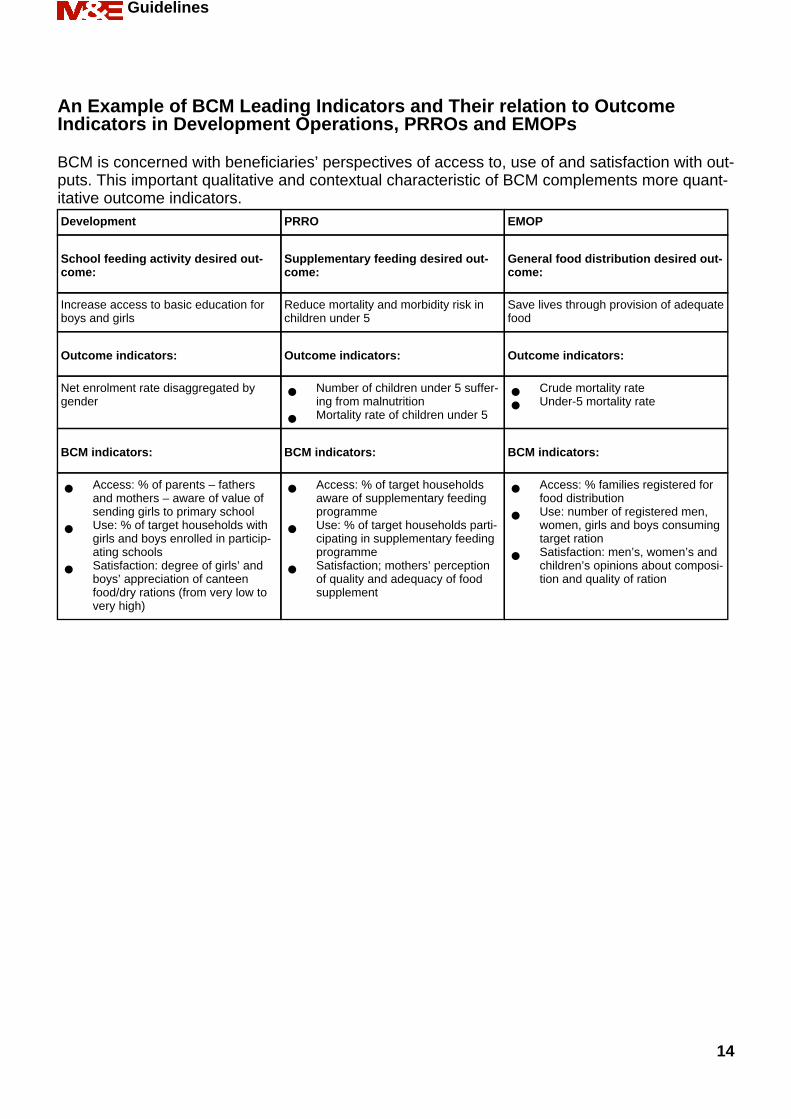
An Example of BCM Leading Indicators and Their relation to OutcomeIndicators in Development Operations, PRROs and EMOPs
BCM is concerned with beneficiaries’ perspectives of access to, use of and satisfaction with out-puts. This important qualitative and contextual characteristic of BCM complements more quant-itative outcome indicators.Development PRRO EMOP
School feeding activity desired out-come:
Supplementary feeding desired out-come:
General food distribution desired out-come:
Increase access to basic education forboys and girls
Reduce mortality and morbidity risk inchildren under 5
Save lives through provision of adequatefood
Outcome indicators: Outcome indicators: Outcome indicators:
Net enrolment rate disaggregated bygender
• Number of children under 5 suffer-ing from malnutrition
• Mortality rate of children under 5
• Crude mortality rate
• Under-5 mortality rate
BCM indicators: BCM indicators: BCM indicators:
• Access: % of parents – fathersand mothers – aware of value ofsending girls to primary school
• Use: % of target households withgirls and boys enrolled in particip-ating schools
• Satisfaction: degree of girls’ andboys’ appreciation of canteenfood/dry rations (from very low tovery high)
• Access: % of target householdsaware of supplementary feedingprogramme
• Use: % of target households parti-cipating in supplementary feedingprogramme
• Satisfaction; mothers’ perceptionof quality and adequacy of foodsupplement
• Access: % families registered forfood distribution
• Use: number of registered men,women, girls and boys consumingtarget ration
• Satisfaction: men’s, women’s andchildren’s opinions about composi-tion and quality of ration
Guidelines
14
Types of Data – Quantitative versus Qualitative
Introduction. This section describes the 2 general types of data – quantitative andqualitative – that can be used for M&E purposes.
What are the Characteristics of Quantitative and Qualitative Data
2 general types of data exist – quantitative and qualitative – although the distinction betweenthe 2 is often blurred. While quantitative data have long been cited as being more objective, andqualitative data as more subjective, more recent debates have concluded that both types ofdata have subjective and objective characteristics. As qualitative and quantitative data comple-ment each other, both should be used.
Characteristics of Quantitative DataCharacteristics of Quantitative Data:• Seek to quantify the experiences or conditions among beneficiaries in numeric terms.• Use closed-ended questions with limited potential responses.• Normally ask women, men, boys and girls to respond to questions on the basis of their indi-
vidual experiences, or the experiences of their households.• Often, but not exclusively, employ probability sampling techniques that allow for statistical
inference (or estimation) to a larger population with defined levels of probability (or confid-ence) and tolerable error (or confidence interval); although not as complicated as oftenthought, determining the appropriate parameters for calculating sample size is likely to re-quire some expertise.
• Use measurement techniques (e.g. measuring land area; maize yield, by weighing bags ofmaize; food consumption, through weighing food quantities to be consumed by type; an-thropometric indicators of children).
Characteristics of Qualitative DataQualitative data seek to uncover the context, perceptions and quality of, as well as opinionsabout, a particular experience or condition as its beneficiaries view it. Data collection methodsare more likely to employ a more participatory approach through the use of open-ended ques-tions that allow respondents to expand on their initial answers and lead the discussion towardsissues that they find important. These more participatory methods will commonly be used in theM&E of WFP operations. Sampling techniques for these methods are often purposive. Evenwhen samples are selected randomly, these methods rarely require the rigorous determinationof sample size, and respondents are often asked to generalise about the condition or experi-ence in the larger population, rather than talk about themselves.
Guidelines
15
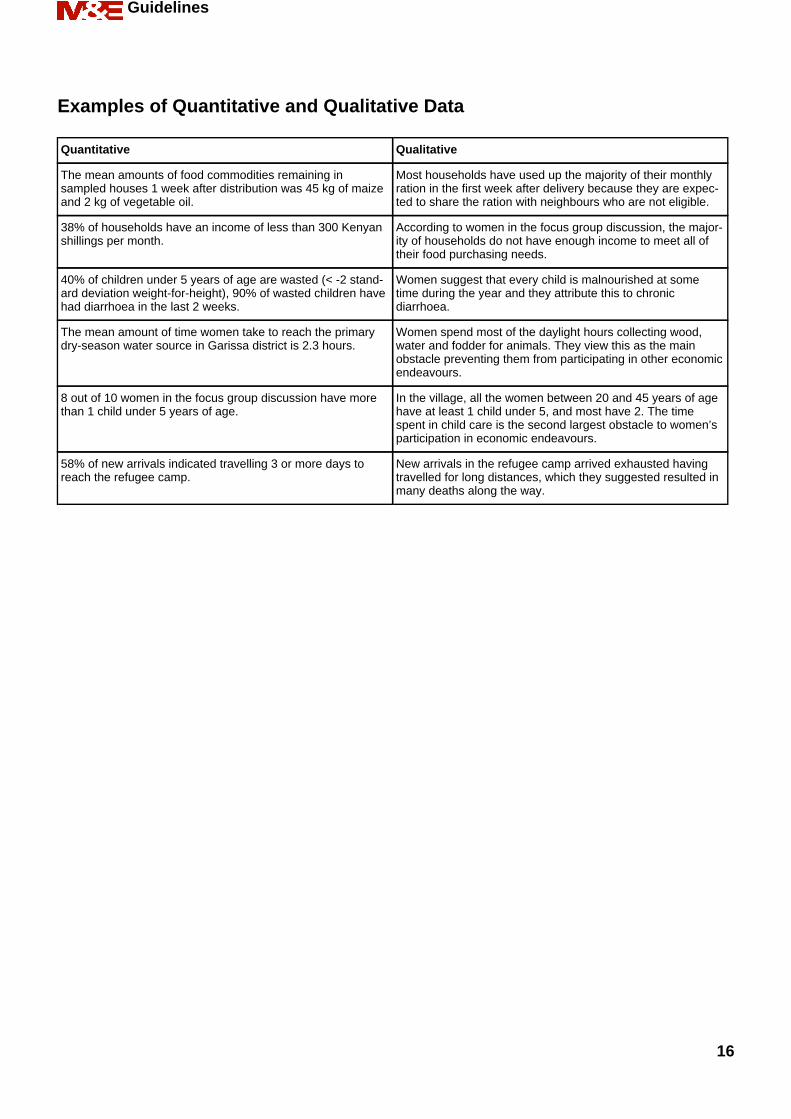
Examples of Quantitative and Qualitative Data
Quantitative Qualitative
The mean amounts of food commodities remaining insampled houses 1 week after distribution was 45 kg of maizeand 2 kg of vegetable oil.
Most households have used up the majority of their monthlyration in the first week after delivery because they are expec-ted to share the ration with neighbours who are not eligible.
38% of households have an income of less than 300 Kenyanshillings per month.
According to women in the focus group discussion, the major-ity of households do not have enough income to meet all oftheir food purchasing needs.
40% of children under 5 years of age are wasted (< -2 stand-ard deviation weight-for-height), 90% of wasted children havehad diarrhoea in the last 2 weeks.
Women suggest that every child is malnourished at sometime during the year and they attribute this to chronicdiarrhoea.
The mean amount of time women take to reach the primarydry-season water source in Garissa district is 2.3 hours.
Women spend most of the daylight hours collecting wood,water and fodder for animals. They view this as the mainobstacle preventing them from participating in other economicendeavours.
8 out of 10 women in the focus group discussion have morethan 1 child under 5 years of age.
In the village, all the women between 20 and 45 years of agehave at least 1 child under 5, and most have 2. The timespent in child care is the second largest obstacle to women’sparticipation in economic endeavours.
58% of new arrivals indicated travelling 3 or more days toreach the refugee camp.
New arrivals in the refugee camp arrived exhausted havingtravelled for long distances, which they suggested resulted inmany deaths along the way.
Guidelines
16
What are the Sources and Uses of Primary and Secondary Data
Introduction. This section describes 2 broad categories of data – primary andsecondary – and the appropriate use of each in providing information for use in the M&Eof WFP operations.
What are the Differences between Primary and Secondary Data
Data sources are listed in the third column of the logical framework matrix under the heading“means of verification”. While the indicator articulates what information will be collected, themeans of verification identifies where that information will come from.
Primary DataPrimary data is data that is collected through the use of surveys, meetings, focus group discus-sions, interviews or other methods that involve direct contact with the respondents – women,men, boys and girls.
Secondary DataBy contrast, secondary data is existing data that has been, or will be, collected by WFP or oth-ers for another purpose. Secondary data may include WFP Vulnerability Analysis and Mapping(VAM) data, data from the mid-term or final evaluation of a previous phase of WFP operations,data collected by other organisations or the government of the country concerned, or datagathered by research organisations. Routine data collected by institutions participating in anactivity (e.g. schools, health centres) are exceptionally good sources of secondary data whichcould not be replicated by primary data collection without prohibitive expense.
Distinction between Primary and Secondary DataThe critical distinction between the 2 types of data is that primary data is collected by WFP orsomeone who WFP has hired specifically for the purpose for which the data are required. Sec-ondary data have been, or will be, collected for another primary purpose (e.g. all secondarydata were or are primary data for another study), but may be used for “secondary” purposes re-lated to M&E in WFP operations. Note that both primary and secondary data sources can yieldquantitative or qualitative data.
Appropriate Uses of Primary and Secondary Data
The collection of M&E data, both primary and secondary, must focus almost exclusively on theindicators and assumptions identified at each level in the logical framework for the operation.
Secondary DataThe use of secondary data represents tremendous cost and time savings to the country office,and every effort should be made to establish what secondary data exist and to assess whetheror not they may be used for the M&E of WFP operations. Primary data is often collected unne-cessarily and at great expense simply because monitors or evaluators had not been aware thatthe data were already available. It is critical to invest the initial time and resources to investigatewhat data exist, what data collection exercises are planned for the future, and how relevant theexisting data are for the M&E of WFP operations.
Guidelines
17
Primary DataHowever, primary data collection is sometimes warranted. Although a review of secondary datasources should precede any primary data collection, existing data do not always provide the ap-propriate indicators or the appropriate disaggregation of indicators needed to monitor and eval-uate WFP operations effectively. Even secondary data that provides the appropriate indicatorsand disaggregation of indicators may not be useful if the data is out of date and the situation islikely to have changed since they were collected. This varies greatly according to the indicatorfor which the data is being collected and its volatility. For example, school enrolment data that is1 year old may suffice for establishing baseline conditions prior to a school feeding programme,but acute nutritional data (wasting) that is only a month old may no longer represent an accur-ate estimate of current conditions for that indicator.
Importance of Documenting Data Collection MethodsClear documentation of the methods to be used to collect primary and secondary data must bedeveloped during the planning stage of an operation. As data is collected, any variations fromthe planned data collection methods must also be documented. This ensures that data is collec-ted in the same way at different points in time and by different people. This is critical for ensur-ing that the data is comparable, and improves the accuracy of assessing the changes over timeassociated with a WFP operation.
An Example of using Secondary Data in Development
The most common practice is to use a combination of primary and secondary data to comple-ment each other. School feeding programmes will draw extensively on school records to meetM&E data needs. Although teachers keep records of attendance and enrolment primarily forpurposes other than reporting to WFP, this information fits well with the data needed by WFP inorder to assess the outcomes and impacts of a school feeding operation, and is therefore anideal secondary data source.
An Example of a Secondary Data Source for Emergency Operations(EMOPs)
During the early stages of an emergency, the data gathered by the emergency food needs as-sessment (EFNA) should satisfy most of the immediate criteria for baseline data. Efforts shouldfocus on ensuring that the data is reliable and representative. This exemplifies how data collec-ted for 1 purpose can be used to serve another in a cost-effective way. This is especially true inthe case of using assessment data for M&E purposes during EMOPs and PRROs.
An Error to avoid
A common error when using secondary data sources or collecting primary data is to collect toomany data. This results from data collectors’ tendency to collect all the data that is related totheir own topics of interest rather than focusing on the specific data that is required for M&E.This often leads to a reduced amount of time available for data analysis and, ultimately, dilutesthe value of the information produced.
Guidelines
18
Assessing WFP and Partners' M&E Capacities
Introduction. This section explains why and when it is important to review existingM&E capacities. It lists steps to be followed to complete an assessment of WFP andpartners' M&E capacities including, if required, developing a plan to address theconstraints identified.
Why is Assessment of WFP's and Partners' M&E Capacities needed andwhen should It be done?
For all operations the assessment of WFP's, government's and other implementing partners'M&E capacities ensures that the M&E Plan is feasible and built upon organisational structuresand human and financial resources already in place or foreseen.
This assessment and reassessment takes place:
• At design stages.• During the course of drawing up operational plans and other agreements with partners.• At regular intervals (usually annually) during implementation.
Steps to Assessing M&E Capacities of WFP, Government, and ImplementingPartners
Step 1 – Develop a checklist defining key issues.Develop a checklist of the questions that you need to answer to assess the capacity of WFP,government and other implementing partners to perform their expected M&E functions. The fol-lowing questions can be used as a guide.1. Is there a unit or a set of individuals assigned with M&E responsibilities?• If yes, how many staff and what are their current responsibilities for data collection,
processing, analysis and report preparation?• If no, who will be assigned responsibility for conducting and undertaking monitoring
functions?• What skills and experiences do existing staff have?• What staff skills and knowledge are expected to be required in the future?
2. What are the resources currently available and planned for the M&E unit or responsiblestaff?• Take into account items such as vehicles, computers (hardware and software) as well
as recurrent funding for operations.3. Are there any established procedures for the following M&E functions:• Specifying targets related to the operations outputs and outcomes in planning docu-
ments.• Conducting regular and ad hoc surveys, and reporting and disseminating findings.• Linking M&E costs to government, implementing partner and WFP annual budget pro-
cesses.• Using M&E information in annual reports and other advocacy publications prepared by
government, WFP, implementing partner or by other agencies such as UNDP, OCHA,other UN agencies or donors.
4. How has the M&E unit or responsible staff performed in the past with regard to M&E tasksof previous phases of the operation or other similar work?
Guidelines
19
5. What kind of problems has the M&E unit or responsible staff experienced in the past?• What has the unit or organisation done to overcome these problems?• Are the problems solved?• If not, why not?
Step 2 - Decide on how you want to collect and analyse the data required from WFP, gov-ernment and other implementing partners.Depending on the time and resources available you may choose:• To interview key informants in WFP government and implementing partners.• To conduct a workshop with a group of stakeholders.• To undertake a capacity assessment study conducted by an external consultant.
Step 3 - Inform WFP, government and partner managers about why the capacity assess-ment is being conducted and proceed to collect data as planned.Explain to WFP, government and partner managers the purpose and approach to be used inundertaking the capacity assessment. Gather and record the data.
Step 4 – Analyse and consolidate data collected.Together with at least 1 member of each of the major stakeholders (WFP, government and part-ners), organise and consolidate the data in the following categories:• Strengths defined as existing internal assets (management, staff capacity/motivation,
knowledge, resources, partnerships, organisational structure, etc) that help to exploit anduse the monitoring opportunities.
• Weaknesses defined as existing internal conditions that tend to function as obstacles foreffective monitoring.
• Opportunities defined as attractive areas and possibilities for co-operating on monitoring.• Threats defined as challenges posed by unfavorable developments in the environment that
may lead to a decreased monitoring capacity.
Step 5 - Review the mutually agreed/envisaged M&E Plan or Logical Framework and con-firm the feasibility of the assigned responsibilities for WFP, government and partners.Suggest possible solutions to identified problems.Together with at least 1 member of each of the major stakeholders (WFP, government and part-ners) ensure that the envisaged M&E Plan responsibilities are assigned to stakeholders in waysthat build on the strengths and opportunities and minimize major weaknesses and threats iden-tified. You need to be very pragmatic as to what is feasible given the budget and human re-sources available. Assuming that an M&E Plan exists, based on the conclusions, you may wishto update it with the new information.You may find solutions to some of the identified problems that involve investment in training, de-velopment of monitoring formats, buying office equipment or others. Make sure that the solu-tions identified are realistic, cost-efficient, relevant and feasible given the existing time and re-sources.
Step 6 –If required, prepare an M&E capacity building plan.The M&E capacity building plan should outline:• What are the problems, and how and when they are to be addressed?• Who will be responsible?• Budget.
Before you implement the M&E capacity building plan make sure that WFP and partner man-agers endorse it.
Guidelines
20

Guidelines
21
Assigning M&E Roles and Responsibilities
Introduction. Assigning M&E roles and responsibilities to WFP, government andimplementing partners is essential in preparing an M&E Plan. WFP, government andimplementing partner staff have roles and responsibilities that vary according to type ofoperation. The organisation directly implementing the operation undertakes the majorityof the M&E roles and responsibilities. Only in some special circumstances, usuallyEMOPs, does WFP directly assume an implementation role. M&E roles andresponsibilities of different categories of staff, according the WFP’s generic job profiles,are given as an example of how tasks are allocated within the organisation.
How are M&E Roles and Responsibilities shared between WFP, Governmentand Partners
WFP, government and implementing partners jointly participate in the design as well as the im-plementation of the M&E strategy. Whichever organisation has the main implementation re-sponsibility has direct responsibility for functions related to monitoring, evaluating and reportingon progress and achievement. WFP, however, for all operations has the following responsibilit-ies:• Analysing reports to ensure that operation objectives are being met,• Working together with partners to ensure that corrective action is taken when required, and,• Collecting independent field level information, following the M&E strategy, to crosscheck
partners’ findings.
Guidelines for assigning M&E Roles and Responsibilities to GovernmentDepartments and Implementing Partners
Monitoring and reportingWhere a government department implements a WFP-assisted project or relief operation, thatdepartment has direct responsibility for monitoring and reporting on progress and achieve-ments. The government must collect, analyse and report on basic data such as food distribu-tion, numbers of beneficiaries, plus data on agreed key indicators, and any additional activitiesthat have been undertaken (e.g. training).Implementing partners, such as non-governmental agencies (NGOs), implementing emergencyand relief operations directly under WFP’s guidance, undertake all monitoring and reportingfunctions and submit reports to WFP and other agencies, including the relevant government au-thority.
Feedback and Follow-up ActionTogether with WFP, government and implementing partners participate in:Quarterly progress review meetings to review output progress (planned versus actual), benefi-ciary contact monitoring findings and early evidence of outcome achievement and to act on im-provement proposals, andSemi-annual or annual Country Office Report meetings/workshops to review output progress(planned versus actual), beneficiary contact monitoring findings and early evidence of outcomeand to formally agree to concrete action to be taken.
Guidelines
22
EvaluationThe government and implementing partners are important stakeholders in any evaluation andas such should be involved in the entire evaluation process. Governments, in countries whereevaluations of Country Programmes are undertaken, may assign an observer to join evaluationteams and should receive a full briefing and debriefing.
AgreementsStandard memorandum of understanding, letters of agreement and operational contractsbetween WFP, government and implementing partners are adapted for each operation toclearly reflect the assignment of monitoring, evaluation and reporting roles and responsibilities.
Guidelines for assigning M&E Roles and Responsibilities to Beneficiaries
Obtaining and demonstrating results is important to beneficiaries. It is therefore good practicefor beneficiaries to participate in the design and implementation of the monitoring and evalu-ation strategy through design workshops, annual review meetings and self- evaluationswhenever possible.
Guidelines for assigning M&E Roles and Responsibilities to the WFPCountry Office
Monitoring and ReportingCountry Offices are responsible for monitoring and reporting on the progress, performance andachievements of operations and programmes as well as the handling and use of WFP-suppliedcommodities.For development operations, where the government is the prime implementing organisation, theWFP country office must ensure that the relevant periodic progress reports (e.g. quarterlyproject report [QPR], project implementation report [PIR]) are adequately prepared, drawing onreports from government staff. In this case the country office must monitor the performance ofthe implementing partner and continuously gauge the reliability and quality of the reports sub-mitted. When deemed necessary, WFP will support the capacity building of key government de-partments when the monitoring and reporting systems are not meeting minimum standards.In emergencies or for PRROs, WFP or an NGO partner may have the main implementing role.WFP and the partner (or both) should collect, analyse and report on basic data such as fooddistribution, numbers of beneficiaries, plus data on agreed key indicators, and any additionalactivities that have been undertaken, such as improving capacity through provision of training orequipment.Field visits are an essential monitoring tool for WFP staff, providing the necessary close contactbetween the Country Office and its beneficiaries. Field visits can serve a number of interde-pendent purposes to:• Gauge progress towards achieving the operation’s objectives,• Determine beneficiaries’ perceptions and reactions to activities and food aid,• Assess ownership and utilisation of assets created, and to identify any negative effects,• Assess the quantity and quality of work undertaken, and the appropriateness of other activ-
ities,• Make physical checks of commodity stocks, distribution and work or feeding activities,• Help managers identify problems and make decisions to overcome them,• Establish productive relationships with government, implementing partners, and• Ensure that men and women beneficiaries are fully involved in implementation and monitor-
Guidelines
23
ing of the operation.
Feedback and Follow-up ActionThe WFP Country Office, government and implementing partners participate in:Quarterly progress review meetings to review output progress (planned versus actual), benefi-ciary contact monitoring findings and early evidence of outcome achievement and to act on im-provement proposals, andSemi-annual or annual meetings/workshops to review output progress (planned versus actual),beneficiary contact monitoring findings and early evidence of outcome and to formally agree toconcrete action to be taken.The performance information obtained is used by the Country Office to inform their regular stra-tegic planning and programming exercises.The Country Office may share information regularly with donors to keep them abreast of theprogress and performance of WFP’s programmes.
EvaluationFor evaluations (self or by external consultants) which they manage, Country Offices are fullyresponsible for all stages of the evaluation.In the case of OEDE-managed evaluations, the Country Office is expected to support the evalu-ation by ensuring that staff allocate the necessary time and provide information relevant to theexercise.
AgreementsStandard memorandum of understanding, letters of agreement and operational contractsbetween WFP, government and implementing partners are adapted for each operation toclearly reflect the allocation of all monitoring, evaluation and reporting responsibilities.
Guidelines for assigning M&E Roles and Responsibilities to WFP RegionalBureaux
Monitoring and ReportingThe Regional Bureaux require accurate performance information that can be analysed region-ally and subsequently fed into corporate results reporting. To assist Country Offices in design-ing and implementing the monitoring and evaluation strategy, Regional Bureaux staff providetechnical guidance, good practice sharing and organise relevant training.Regional Bureaux systematically collect and analyse the emerging results and issues reflectedin monitoring or evaluation reports from country offices and provide direct feedback on theirfindings to country offices. This performance information is used by the Bureaux to inform theirregular strategic planning and programming exercises.
EvaluationIn the case of OEDE-managed evaluations, the Regional Bureau supports the evaluation by en-suring that staff allocate the necessary time and provide information relevant to the exercise.
Guidelines
24
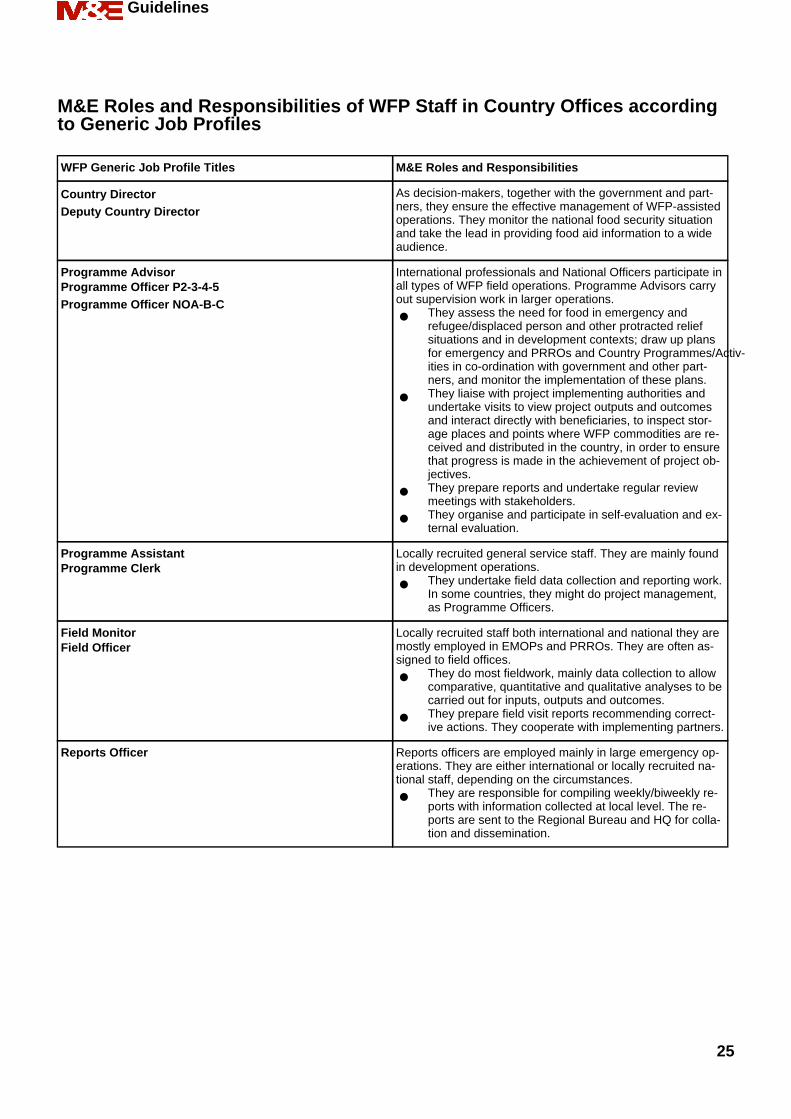
M&E Roles and Responsibilities of WFP Staff in Country Offices accordingto Generic Job Profiles
WFP Generic Job Profile Titles M&E Roles and Responsibilities
Country DirectorDeputy Country Director
As decision-makers, together with the government and part-ners, they ensure the effective management of WFP-assistedoperations. They monitor the national food security situationand take the lead in providing food aid information to a wideaudience.
Programme AdvisorProgramme Officer P2-3-4-5Programme Officer NOA-B-C
International professionals and National Officers participate inall types of WFP field operations. Programme Advisors carryout supervision work in larger operations.
• They assess the need for food in emergency andrefugee/displaced person and other protracted reliefsituations and in development contexts; draw up plansfor emergency and PRROs and Country Programmes/Activ-ities in co-ordination with government and other part-ners, and monitor the implementation of these plans.
• They liaise with project implementing authorities andundertake visits to view project outputs and outcomesand interact directly with beneficiaries, to inspect stor-age places and points where WFP commodities are re-ceived and distributed in the country, in order to ensurethat progress is made in the achievement of project ob-jectives.
• They prepare reports and undertake regular reviewmeetings with stakeholders.
• They organise and participate in self-evaluation and ex-ternal evaluation.
Programme AssistantProgramme Clerk
Locally recruited general service staff. They are mainly foundin development operations.
• They undertake field data collection and reporting work.In some countries, they might do project management,as Programme Officers.
Field MonitorField Officer
Locally recruited staff both international and national they aremostly employed in EMOPs and PRROs. They are often as-signed to field offices.
• They do most fieldwork, mainly data collection to allowcomparative, quantitative and qualitative analyses to becarried out for inputs, outputs and outcomes.
• They prepare field visit reports recommending correct-ive actions. They cooperate with implementing partners.
Reports Officer Reports officers are employed mainly in large emergency op-erations. They are either international or locally recruited na-tional staff, depending on the circumstances.
• They are responsible for compiling weekly/biweekly re-ports with information collected at local level. The re-ports are sent to the Regional Bureau and HQ for colla-tion and dissemination.
Guidelines
25
How to complete an M&E Plan Matrix
Introduction. This section describes how to prepare an M&E Plan Matrix, 1 of the maindocuments explaining the M&E Strategy for an operation. This matrix is a summary ofM&E related information, setting out detailed responsibilities for data collection.
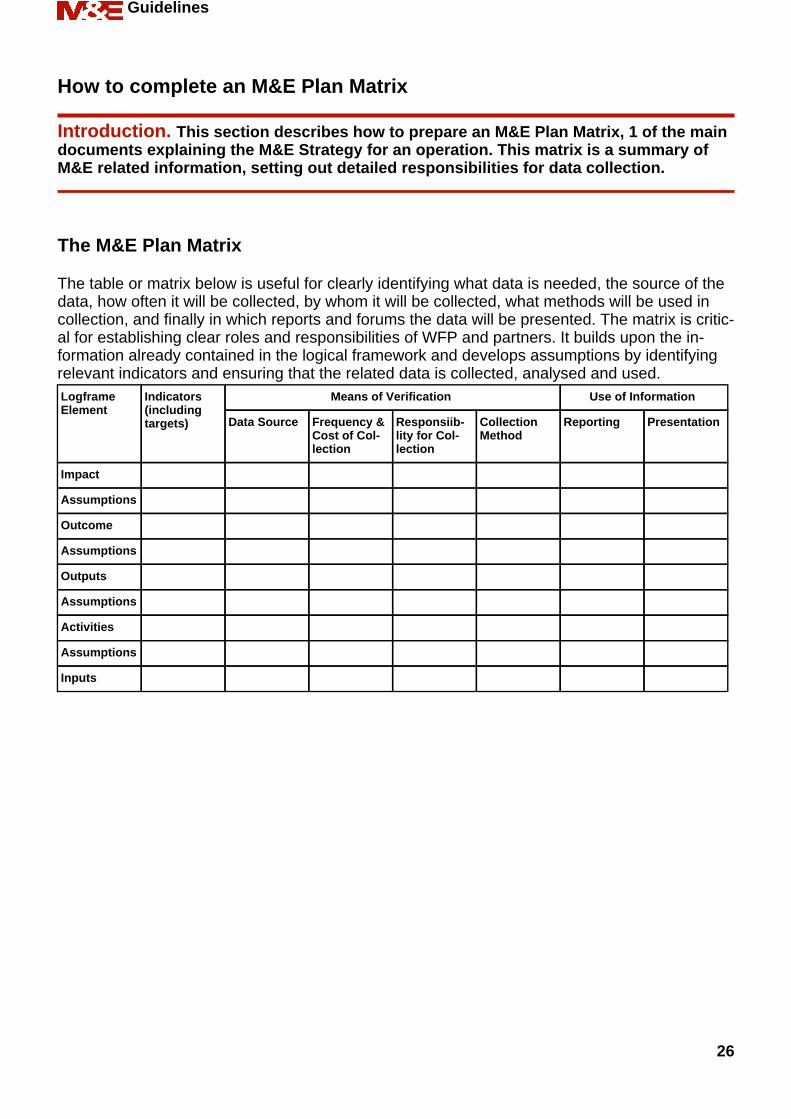
The M&E Plan Matrix
The table or matrix below is useful for clearly identifying what data is needed, the source of thedata, how often it will be collected, by whom it will be collected, what methods will be used incollection, and finally in which reports and forums the data will be presented. The matrix is critic-al for establishing clear roles and responsibilities of WFP and partners. It builds upon the in-formation already contained in the logical framework and develops assumptions by identifyingrelevant indicators and ensuring that the related data is collected, analysed and used.LogframeElement
Indicators(includingtargets)
Means of Verification Use of Information
Data Source Frequency &Cost of Col-lection
Responsiib-lity for Col-lection
CollectionMethod
Reporting Presentation
Impact
Assumptions
Outcome
Assumptions
Outputs
Assumptions
Activities
Assumptions
Inputs
Guidelines
26
An M&E Plan for a Community Forestry Project
Achievement of Activity Impact
InformationRequire-ments
Indicators Means of Verification Use of Information
Data Source Frequency &Cost of Col-lection
Responsiib-lity for Col-lection
CollectionMethod
Reporting Presentation
Impact - En-able house-holds whichdepend ondegraded nat-ural resourcesfor their foodsecurity tomake a shiftto more sus-tainable liveli-hoods
Incidence °ree offood insecur-ity amonghouseholds indistricts withdegraded nat-ural resources
VAM reports Before andafter comple-tion
VAM Officer,WFP CountryOffice
VAM Mappingtools
VAM Reports At CP evalu-ation work-shop
Achievement of Activity Outcome
InformationRequire-ments
Indicators Means of Verification Use of Information
Data Source Frequency &Cost of Col-lection
Responsiib-lity for Col-lection
CollectionMethod
Reporting Presentation
Outcome - In-crease in-comes andfood securityof target pop-ulation at risk
Changes inincome byhouseholds orhouseholdmembers
Baselinestudy & fol-low-up studyin participat-ing & controlvillages
Before, and atcompletion
WFP CountryOffice
Sample sur-vey
Baseline re-portTerminalCountry OfficeReport (COR)
At inceptionworkshop &terminal CORworkshop
Amount offorestproducts har-vested perhousehold
Leading Indic-ators:
• Numberhouse-holdsreceiv-ing in-come orfoodfromprotec-ted land
• Benefi-ciaries(men &women)percep-tions ofcosts &benefitsofscheme
Regular fieldvisitsMini survey atmid-term
Site survey ofarea protec-ted
Six-monthlyAt mid-term
WFP CountryOffice, in col-laborationwith imple-menting part-ner
Field visit andsample sur-vey
Mid-termmanagementreview report
At mid-termmanagementreview work-shop
Guidelines
27
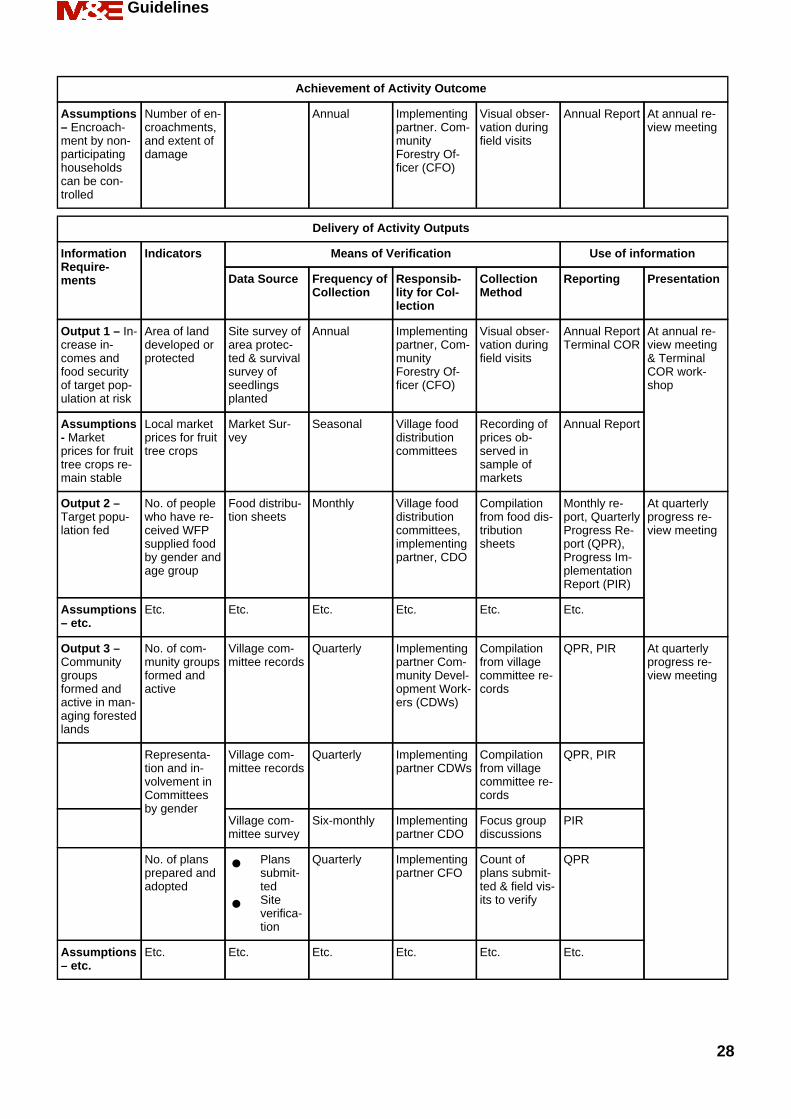
Achievement of Activity Outcome
Assumptions– Encroach-ment by non-participatinghouseholdscan be con-trolled
Number of en-croachments,and extent ofdamage
Annual Implementingpartner. Com-munityForestry Of-ficer (CFO)
Visual obser-vation duringfield visits
Annual Report At annual re-view meeting
Delivery of Activity Outputs
InformationRequire-ments
Indicators Means of Verification Use of information
Data Source Frequency ofCollection
Responsib-lity for Col-lection
CollectionMethod
Reporting Presentation
Output 1 – In-crease in-comes andfood securityof target pop-ulation at risk
Area of landdeveloped orprotected
Site survey ofarea protec-ted & survivalsurvey ofseedlingsplanted
Annual Implementingpartner, Com-munityForestry Of-ficer (CFO)
Visual obser-vation duringfield visits
Annual ReportTerminal COR
At annual re-view meeting& TerminalCOR work-shop
Assumptions- Marketprices for fruittree crops re-main stable
Local marketprices for fruittree crops
Market Sur-vey
Seasonal Village fooddistributioncommittees
Recording ofprices ob-served insample ofmarkets
Annual Report
Output 2 –Target popu-lation fed
No. of peoplewho have re-ceived WFPsupplied foodby gender andage group
Food distribu-tion sheets
Monthly Village fooddistributioncommittees,implementingpartner, CDO
Compilationfrom food dis-tributionsheets
Monthly re-port, QuarterlyProgress Re-port (QPR),Progress Im-plementationReport (PIR)
At quarterlyprogress re-view meeting
Assumptions– etc.
Etc. Etc. Etc. Etc. Etc. Etc.
Output 3 –Communitygroupsformed andactive in man-aging forestedlands
No. of com-munity groupsformed andactive
Village com-mittee records
Quarterly Implementingpartner Com-munity Devel-opment Work-ers (CDWs)
Compilationfrom villagecommittee re-cords
QPR, PIR At quarterlyprogress re-view meeting
Representa-tion and in-volvement inCommitteesby gender
Village com-mittee records
Quarterly Implementingpartner CDWs
Compilationfrom villagecommittee re-cords
QPR, PIR
Village com-mittee survey
Six-monthly Implementingpartner CDO
Focus groupdiscussions
PIR
No. of plansprepared andadopted
• Planssubmit-ted
• Siteverifica-tion
Quarterly Implementingpartner CFO
Count ofplans submit-ted & field vis-its to verify
QPR
Assumptions– etc.
Etc. Etc. Etc. Etc. Etc. Etc.
Guidelines
28
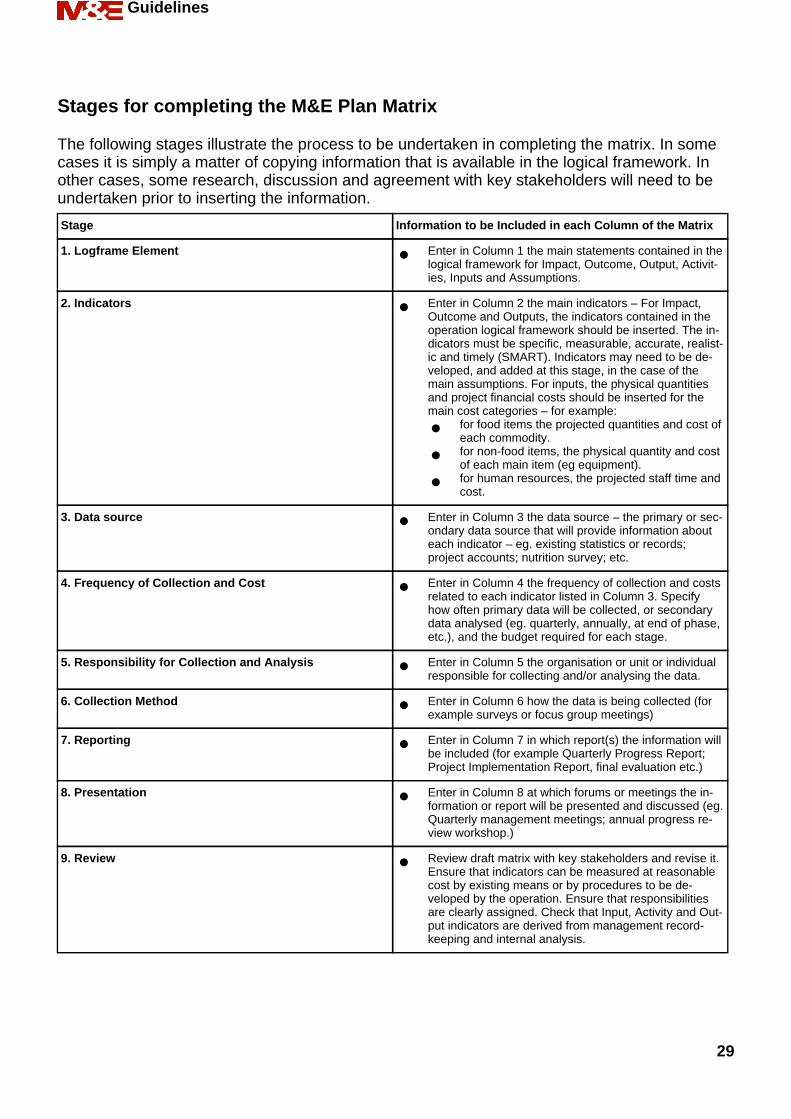
Stages for completing the M&E Plan Matrix
The following stages illustrate the process to be undertaken in completing the matrix. In somecases it is simply a matter of copying information that is available in the logical framework. Inother cases, some research, discussion and agreement with key stakeholders will need to beundertaken prior to inserting the information.
Stage Information to be Included in each Column of the Matrix
1. Logframe Element • Enter in Column 1 the main statements contained in thelogical framework for Impact, Outcome, Output, Activit-ies, Inputs and Assumptions.
2. Indicators • Enter in Column 2 the main indicators – For Impact,Outcome and Outputs, the indicators contained in theoperation logical framework should be inserted. The in-dicators must be specific, measurable, accurate, realist-ic and timely (SMART). Indicators may need to be de-veloped, and added at this stage, in the case of themain assumptions. For inputs, the physical quantitiesand project financial costs should be inserted for themain cost categories – for example:
• for food items the projected quantities and cost ofeach commodity.
• for non-food items, the physical quantity and costof each main item (eg equipment).
• for human resources, the projected staff time andcost.
3. Data source • Enter in Column 3 the data source – the primary or sec-ondary data source that will provide information abouteach indicator – eg. existing statistics or records;project accounts; nutrition survey; etc.
4. Frequency of Collection and Cost • Enter in Column 4 the frequency of collection and costsrelated to each indicator listed in Column 3. Specifyhow often primary data will be collected, or secondarydata analysed (eg. quarterly, annually, at end of phase,etc.), and the budget required for each stage.
5. Responsibility for Collection and Analysis • Enter in Column 5 the organisation or unit or individualresponsible for collecting and/or analysing the data.
6. Collection Method • Enter in Column 6 how the data is being collected (forexample surveys or focus group meetings)
7. Reporting • Enter in Column 7 in which report(s) the information willbe included (for example Quarterly Progress Report;Project Implementation Report, final evaluation etc.)
8. Presentation • Enter in Column 8 at which forums or meetings the in-formation or report will be presented and discussed (eg.Quarterly management meetings; annual progress re-view workshop.)
9. Review • Review draft matrix with key stakeholders and revise it.Ensure that indicators can be measured at reasonablecost by existing means or by procedures to be de-veloped by the operation. Ensure that responsibilitiesare clearly assigned. Check that Input, Activity and Out-put indicators are derived from management record-keeping and internal analysis.
Guidelines
29
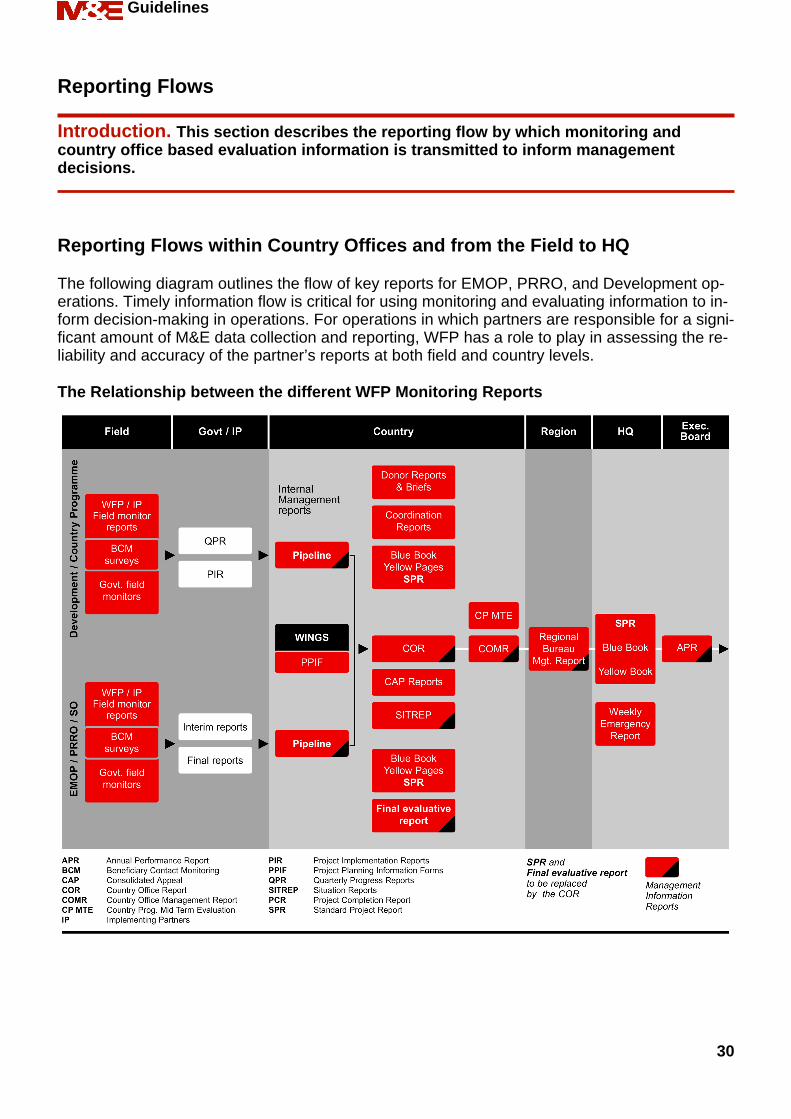
Reporting Flows
Introduction. This section describes the reporting flow by which monitoring andcountry office based evaluation information is transmitted to inform managementdecisions.
Reporting Flows within Country Offices and from the Field to HQ
The following diagram outlines the flow of key reports for EMOP, PRRO, and Development op-erations. Timely information flow is critical for using monitoring and evaluating information to in-form decision-making in operations. For operations in which partners are responsible for a signi-ficant amount of M&E data collection and reporting, WFP has a role to play in assessing the re-liability and accuracy of the partner’s reports at both field and country levels.
The Relationship between the different WFP Monitoring Reports
Guidelines
30
Providing Feedback on M&E Reports
Introduction. This section describes how to ensure that relevant monitoring andevaluation (M&E) information triggers dialogue and decision-making by the variousstakeholder groups.
Guidelines for providing Feedback on Reports
The M&E Plan identifies the report in which the M&E information is included and sets out atwhich forums or meetings the information or the reports themselves will be presented and dis-cussed. The M&E Plan, therefore, sets out the major formal feedback opportunities and ensuresthat M&E reports are disseminated to all stakeholders and appropriate formal and informal dis-cussions are held concerning key finding. This aims to permit timely and informed decision-mak-ing by the various stakeholder groups. This is especially crucial for information relating to res-ults.Those units and individuals receiving M&E reports need to provide both formal and informalfeedback to the authors of reports. To the extent possible, they should acknowledge receipt ofprogress report and provide comments regarding report conclusions, recommendations andtimeliness. Informal feedback to authors of M&E reports provides valuable lessons for them andensures them that the information is being used and reviewed. This in turn provides motivationto maintain high data collection and reporting standards. Individualised feedback is especiallyimportant when the author and the receiver are not working in the same organisation or are indifferent locations.
Examples of Formal Feedback Opportunities to be stated in the M&E Plan
The following are examples of meetings or workshops where M&E information or reports couldbe shared. The appropriate content and purpose of sharing the information is briefly explained.
• Government/donor/UN briefing sessions – To update key stakeholders on operationprogress, performance, partnerships and critical assumptions as well as emerging results.
• Quarterly progress review meetings – To review output progress (planned versus actu-al), BCM findings and early evidence of outcome and to act on improvement proposals.
• Semi-annual or annualCountry Office Report meetings/workshops – To review outputprogress (planned versus actual), BCM findings and early evidence of outcome and toformally agree to/decide on concrete action to be taken.
• Self-evaluation workshop – To include Implementing Partners (relevant Governmentagencies and NGOs) in the finalisation and review of the self-evaluation section of theCountry Office Report. They may take part in the assessment of the operation’s perform-ance.
• Evaluation debriefing workshop – To present and discuss initial evaluation findings atthe end of the field mission stage of the evaluation to stakeholders to obtain their feedbackensuring that it is incorporated into the final report and appropriately addressed in follow-upaction.
Guidelines
31
Preparing the Budget and Identifying Sources of Funding for the M&EStrategy
Introduction. This section describes what items need to be considered in preparing thebudget for the M&E strategy as well as the main sources of funding. It gives examples ofthe types of items that are covered under the main funding sources within WFP. TheM&E budget is important in determining the scope of and finalising a feasible operationM&E Plan and its related Annual Implementation Schedule and Budget.
Items to consider when preparing the M&E Budget
Data collection, processing, analysis and reporting, as well as capacity building and field sup-port must be budgeted for in terms of time and resources. These costs will be incurred either byWFP, by government or by implementing partners, and must be included in the operationbudget. The M&E budget is part of the overall operation budget. Ongoing monitoring expensesmay already be built into staff time and expenditure budgets in the overall operation budget. Inthe case of Direct Support Costs there is a special column that allocates a portion or all of cer-tain items to M&E as a Budget Plan Priority Area. Some items for special M&E events or activit-ies, such as baseline surveys, may require resources and time allocation outside of day to daystaff activities. These may include, but are not limited to, the use of consultants, the hiring ofdata collection or data entry staff, training, transportation for field visits, and supplies for field-work.
3 Main Sources of M&E Funds within WFP for Operations
1. Direct Support Costs (DSC), which refer to all staff resources, equipment and servicesutilised by a WFP Country Office or Unit in direct support to operations.
2. Other Direct Operational Costs (ODOC), which refer to all inputs (staff resources, non-food items or services) provided by WFP and utilised directly by beneficiaries, governmentor other implementing partners.
3. Landside Transport Storage and Handling (LTSH) for costs related to the distribution offood.
The planned M&E items are to be allocated to the appropriate source. DSC, ODOC and LTSHshould be budgeted at design stage for the whole duration of the operation. Annual budgets areprepared based on the expected quantity of food to be delivered and its related DSC, ODOCand LTSH.Additional sources of funding for M&E costs may also be available at country level by govern-ments, donors, UN and NGOs partners. For instance a donor may be interested in funding aconsultant for an evaluation of an operation. Special Grants provided to WFP by various donorscan also be used for some M&E activities. (These Special Grants are described on WFPgo.)
Guidelines
32
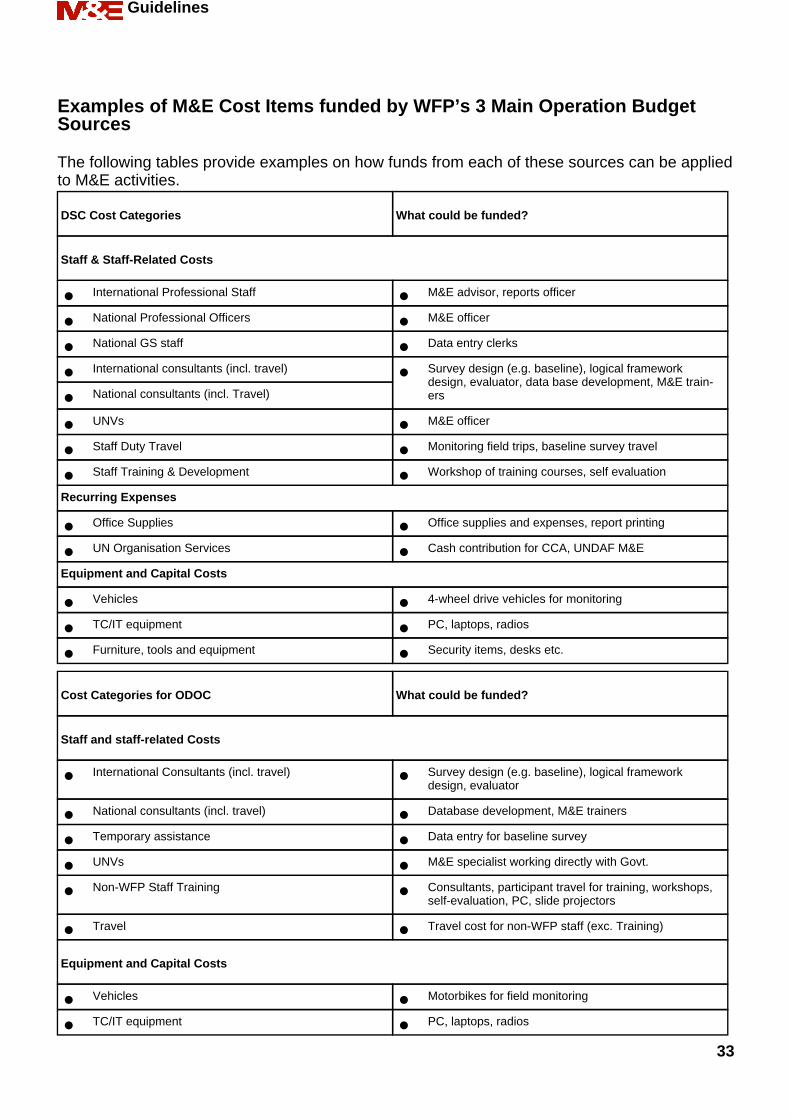
Examples of M&E Cost Items funded by WFP’s 3 Main Operation BudgetSources
The following tables provide examples on how funds from each of these sources can be appliedto M&E activities.
DSC Cost Categories What could be funded?
Staff & Staff-Related Costs
• International Professional Staff • M&E advisor, reports officer
• National Professional Officers • M&E officer
• National GS staff • Data entry clerks
• International consultants (incl. travel) • Survey design (e.g. baseline), logical frameworkdesign, evaluator, data base development, M&E train-ers• National consultants (incl. Travel)
• UNVs • M&E officer
• Staff Duty Travel • Monitoring field trips, baseline survey travel
• Staff Training & Development • Workshop of training courses, self evaluation
Recurring Expenses
• Office Supplies • Office supplies and expenses, report printing
• UN Organisation Services • Cash contribution for CCA, UNDAF M&E
Equipment and Capital Costs
• Vehicles • 4-wheel drive vehicles for monitoring
• TC/IT equipment • PC, laptops, radios
• Furniture, tools and equipment • Security items, desks etc.
Cost Categories for ODOC What could be funded?
Staff and staff-related Costs
• International Consultants (incl. travel) • Survey design (e.g. baseline), logical frameworkdesign, evaluator
• National consultants (incl. travel) • Database development, M&E trainers
• Temporary assistance • Data entry for baseline survey
• UNVs • M&E specialist working directly with Govt.
• Non-WFP Staff Training • Consultants, participant travel for training, workshops,self-evaluation, PC, slide projectors
• Travel • Travel cost for non-WFP staff (exc. Training)
Equipment and Capital Costs
• Vehicles • Motorbikes for field monitoring
• TC/IT equipment • PC, laptops, radios
Guidelines
33

Cost Categories for ODOC What could be funded?
• Other tools, material and equipment • Furniture etc.
Cost Categories for LTSH What could be funded?
Distribution Costs Monitoring food distribution
Guidelines
34
Module Summary
What has been covered in this module?The main concepts, elements and steps in designing an M&E strategy for development pro-grammes are outlined in this module.It is important to review this module at the planning and inception stages of new developmentprogrammes as it clarifies the link between the overall design of the programme and its M&Estrategy. A number of useful tools and procedures to follow are introduced, and examples aregiven, to assist the reader to develop an M&E strategy that is linked to the design and is feas-ible both in terms of the capacity of WFP and its partners and the budget available.Following a review of the module readers should be able to develop the key elements and doc-ument the same for an M&E strategy related to a specific development programme.
What additional resources are available?For further information the following modules and resources might be useful:• Choosing Methods and Tools for Data Collection• Going to the Field to collect Monitoring and Evaluation Data• How to consolidate, process and analyse Qualitative and Quantitative Data• Reporting on M&E Data and Information for Development Programmes• How to plan a Baseline Study• How to Plan an Evaluation• How to manage an Evaluation and disseminate its Results• How to plan and undertake a Self-evaluation• WFP Indicator Menu
Guidelines
35

How to design a Results-OrientedM&E Strategy for DevelopmentProgrammes
United NationsWorld Food ProgrammeOffice of Evaluation and Monitoring
Via Cesare Giulio Viola, 68/70 - 00148Rome, ItalyWeb Site: www.wfp.orgE-mail: [email protected]: +39 06 65131
Related Documents