Geophysical Fluid Dynamics Laboratory Processes controlling U.S. background ozone extremes and trends over 1980-2015 MEIYUN LIN (Princeton University & NOAA GFDL) BOSA workshop, Denver, March 28-29, 2017

Welcome message from author
This document is posted to help you gain knowledge. Please leave a comment to let me know what you think about it! Share it to your friends and learn new things together.
Transcript
Geophysical Fluid Dynamics Laboratory
Processes controlling U.S. background ozone extremes and trends over 1980-2015
MEIYUN LIN(Princeton University & NOAA GFDL)
BOSA workshop, Denver, March 28-29, 2017
GeophysicalFluidDynamicsLaboratory
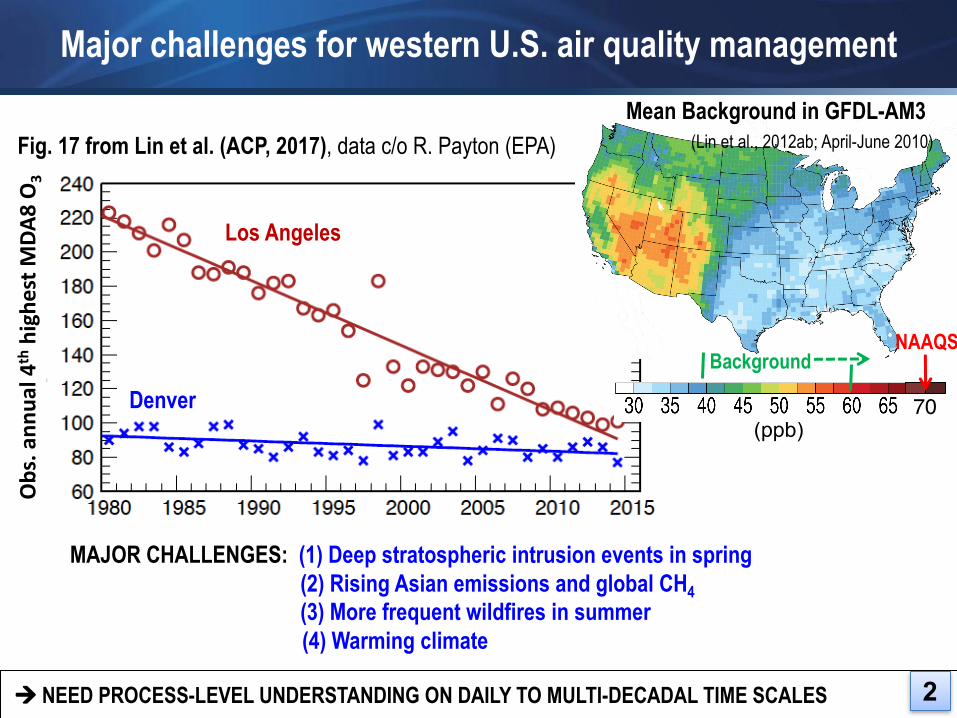
Major challenges for western U.S. air quality management
MAJOR CHALLENGES: (1) Deep stratospheric intrusion events in spring(2) Rising Asian emissions and global CH4(3) More frequent wildfires in summer(4) Warming climate
à NEED PROCESS-LEVEL UNDERSTANDING ON DAILY TO MULTI-DECADAL TIME SCALES 2
(ppb)
Mean Background in GFDL-AM3(Lin et al., 2012ab; April-June 2010)
Los Angeles
Denver 70
Background NAAQS
Obs.ann
ual4
thhighestM
DA8O3
Fig. 17 from Lin et al. (ACP, 2017), data c/o R. Payton (EPA)
GeophysicalFluidDynamicsLaboratory
GFDL-AM3
Satellites
In situ
Surface networks
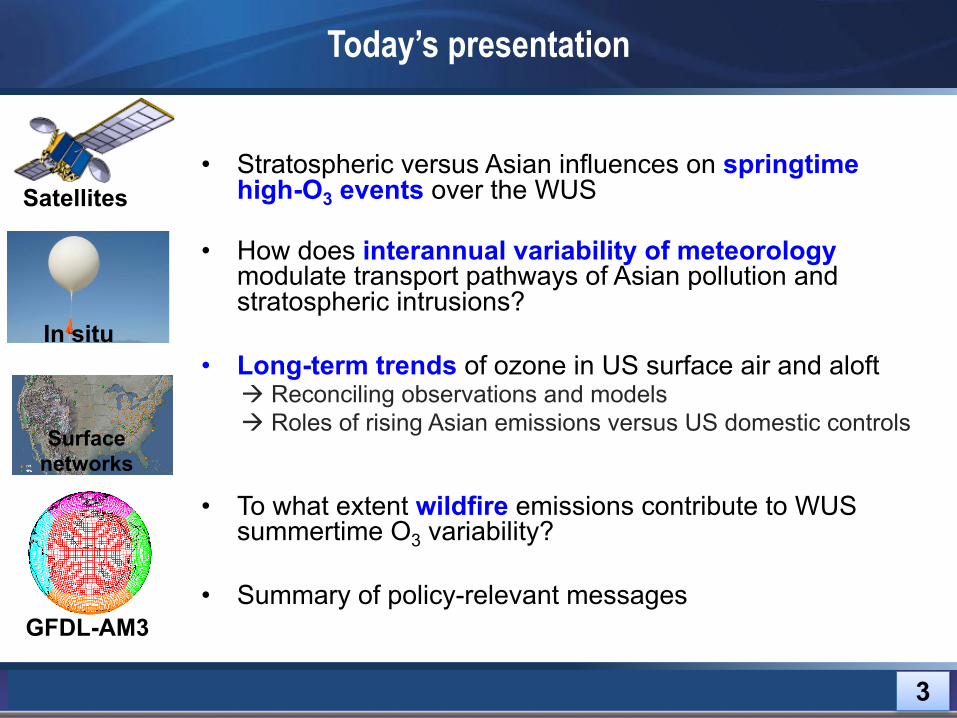
• Stratospheric versus Asian influences on springtime high-O3 events over the WUS
• How does interannual variability of meteorology modulate transport pathways of Asian pollution and stratospheric intrusions?
• Long-term trends of ozone in US surface air and aloft
• To what extent wildfire emissions contribute to WUS summertime O3 variability?
• Summary of policy-relevant messages
Today’s presentation
3
à Reconciling observations and models à Roles of rising Asian emissions versus US domestic controls
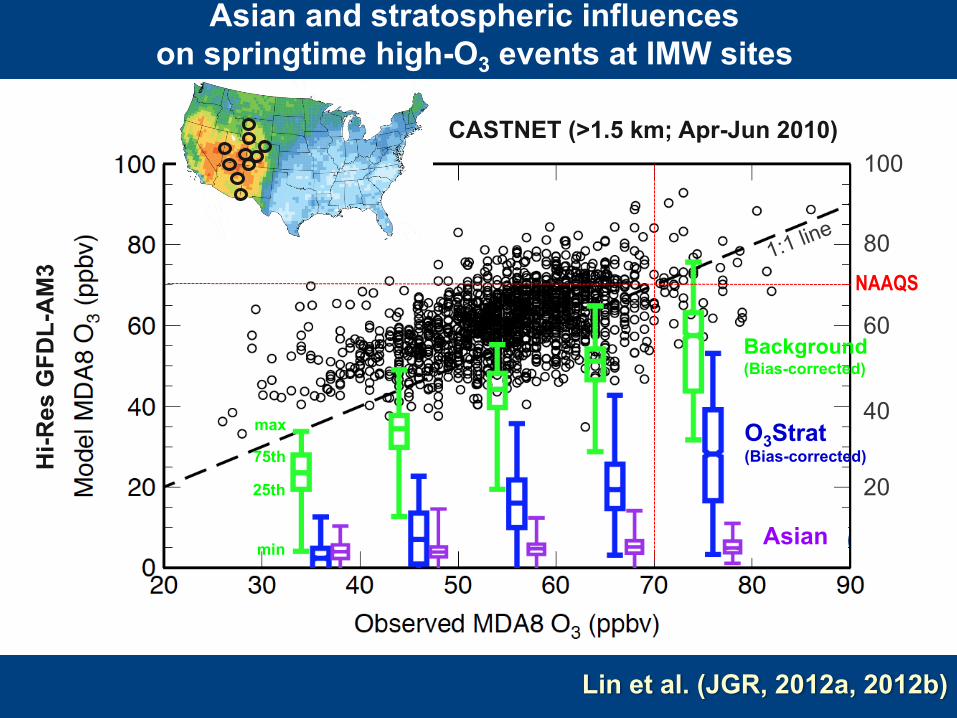
Lin et al. (JGR, 2012a, 2012b)
Asian and stratospheric influences on springtime high-O3 events at IMW sites
Hi-R
es G
FDL-
AM
3
CASTNET (>1.5 km; Apr-Jun 2010)
Background(Bias-corrected)
O3Strat(Bias-corrected)
Asian
75th
25th
min
max
NAAQS
20
40
60
80
100
GeophysicalFluidDynamicsLaboratory 5
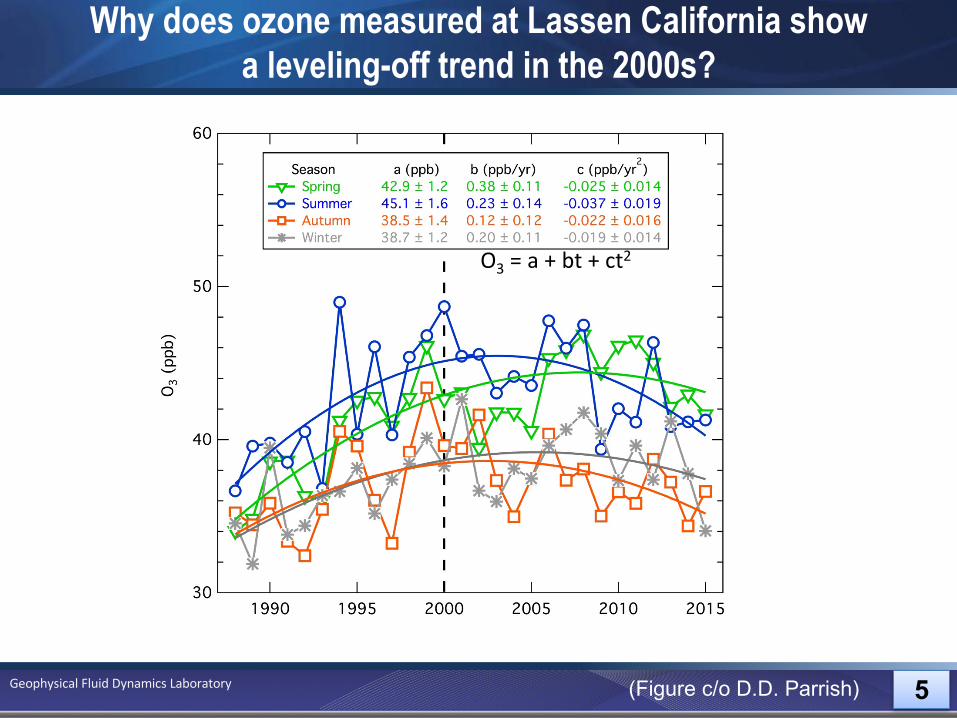
O3 =a+bt +ct2
Why does ozone measured at Lassen California show a leveling-off trend in the 2000s?
(Figure c/o D.D. Parrish)
GeophysicalFluidDynamicsLaboratory 6
(2016)
(2011)
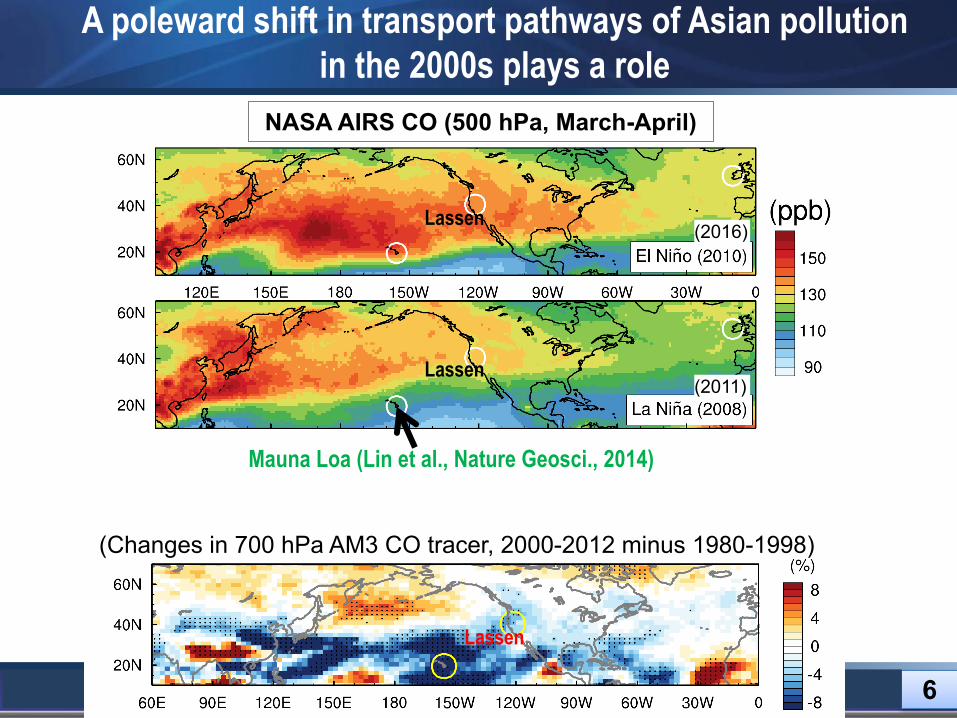
NASA AIRS CO (500 hPa, March-April)
(Changes in 700 hPa AM3 CO tracer, 2000-2012 minus 1980-1998)
Mauna Loa (Lin et al., Nature Geosci., 2014)
Lassen
A poleward shift in transport pathways of Asian pollution in the 2000s plays a role
Lassen
Lassen
GeophysicalFluidDynamicsLaboratory
OBSAM3
BGO3
7
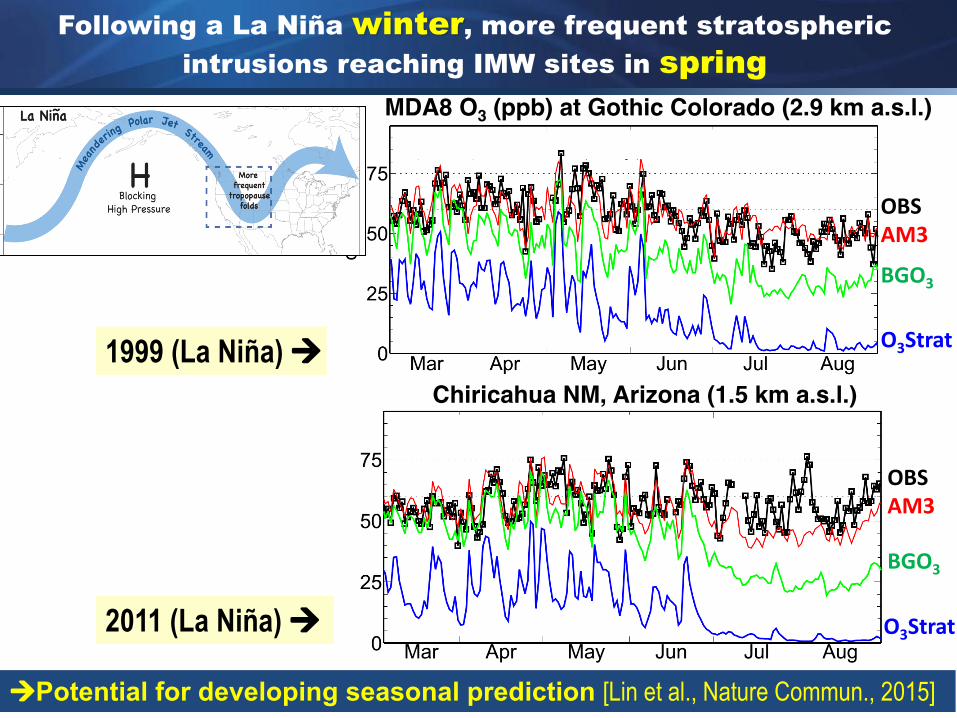
1999 (La Niña) à
MDA8 O3 (ppb) at Gothic Colorado (2.9 km a.s.l.)
O3Strat
BGO3
OBSAM3
Following a La Niña winter, more frequent stratospheric intrusions reaching IMW sites in spring
Chiricahua NM, Arizona (1.5 km a.s.l.)
2011 (La Niña) à
v
O3Strat
v v
v
àPotential for developing seasonal prediction [Lin et al., Nature Commun., 2015]
GeophysicalFluidDynamicsLaboratory
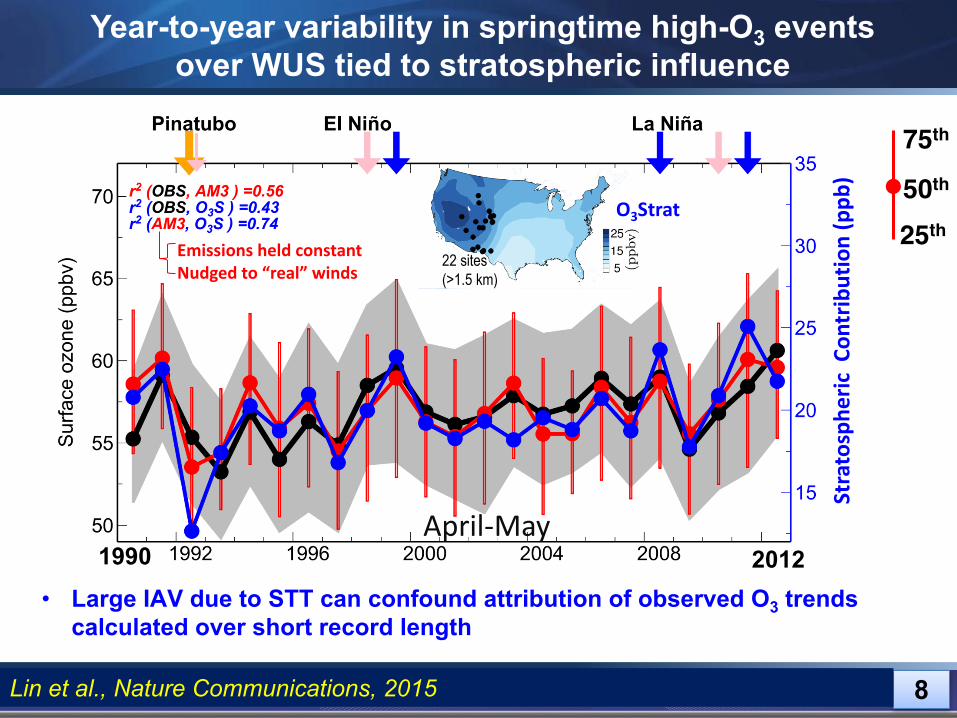
75th
25th
50th
8
Year-to-year variability in springtime high-O3 events over WUS tied to stratospheric influence
O3Strat
1990
EmissionsheldconstantNudgedto“real”winds
Stratosphe
ricCon
tribution(ppb
)
April-May
22 sites (>1.5 km)
2012• Large IAV due to STT can confound attribution of observed O3 trends
calculated over short record length
Lin et al., Nature Communications, 2015
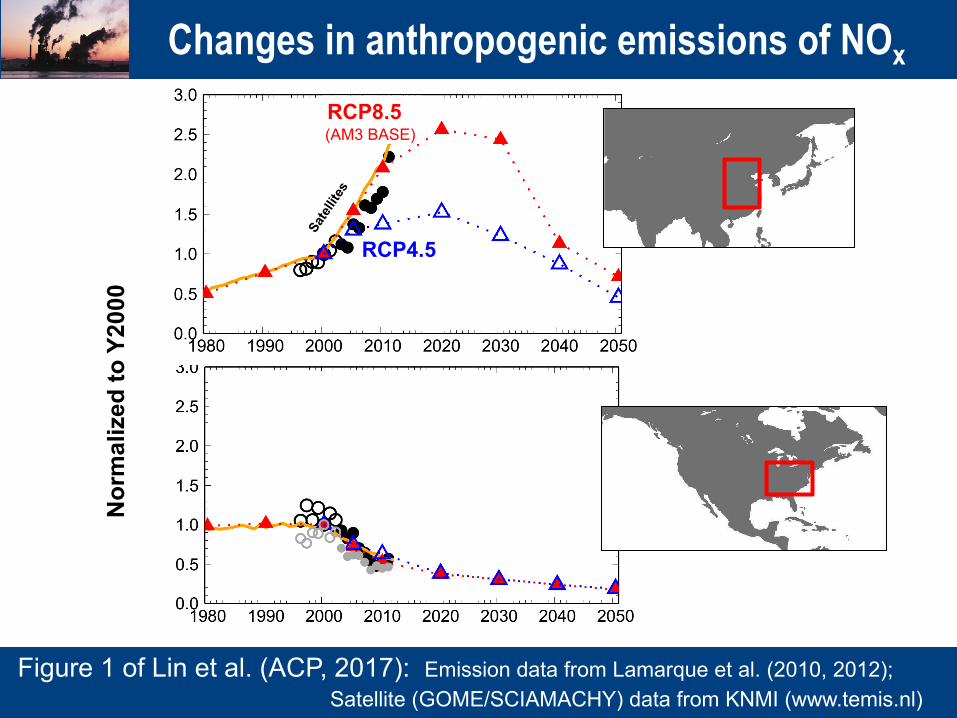
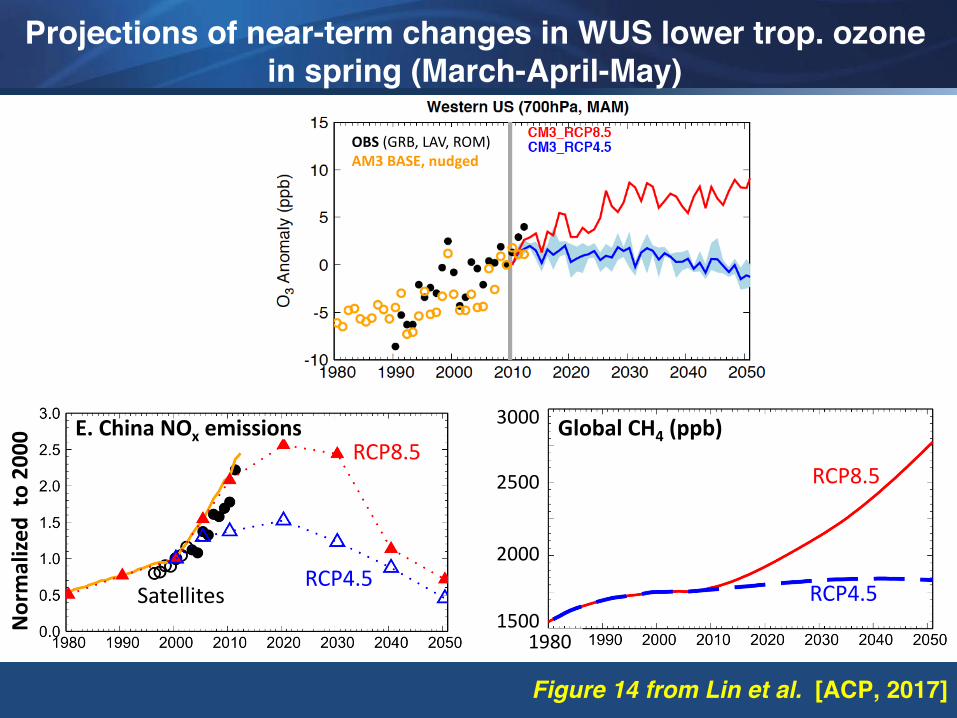
RCP4.5
Nor
mal
ized
to Y
2000
RCP8.5(AM3 BASE)
Figure 1 of Lin et al. (ACP, 2017): Emission data from Lamarque et al. (2010, 2012);Satellite (GOME/SCIAMACHY) data from KNMI (www.temis.nl)
Changes in anthropogenic emissions of NOx
GeophysicalFluidDynamicsLaboratory
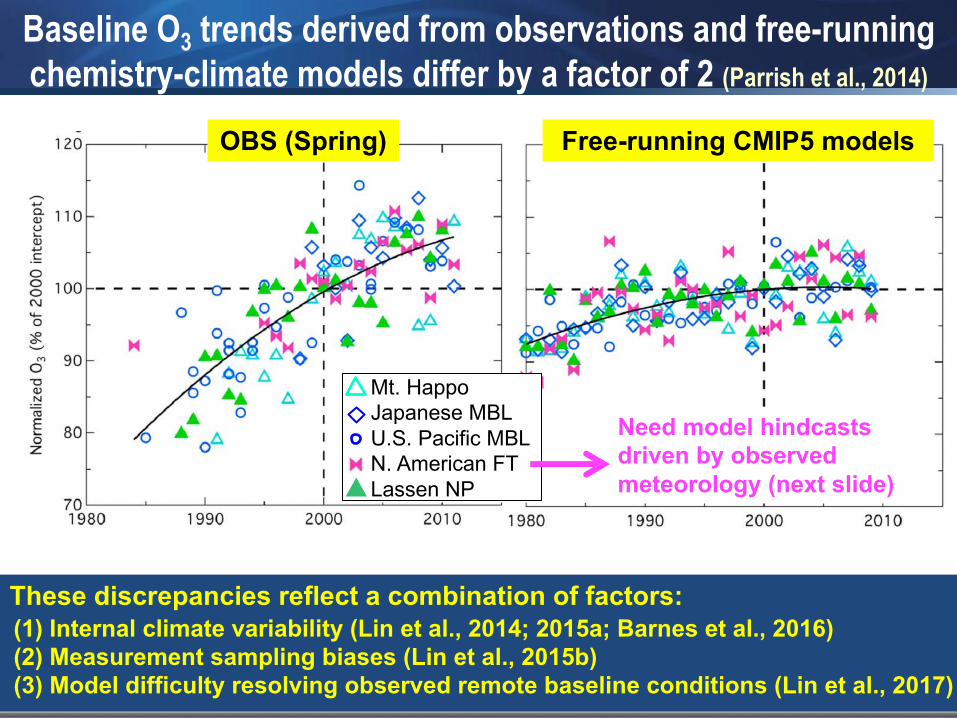
Baseline O3 trends derived from observations and free-running chemistry-climate models differ by a factor of 2 (Parrish et al., 2014)
OBS (Spring) Free-running CMIP5 models
These discrepancies reflect a combination of factors: (1) Internal climate variability (Lin et al., 2014; 2015a; Barnes et al., 2016)(2) Measurement sampling biases (Lin et al., 2015b)(3) Model difficulty resolving observed remote baseline conditions (Lin et al., 2017)
Mt. HappoJapanese MBLU.S. Pacific MBLN. American FTLassen NP
Need model hindcasts driven by observed meteorology (next slide)
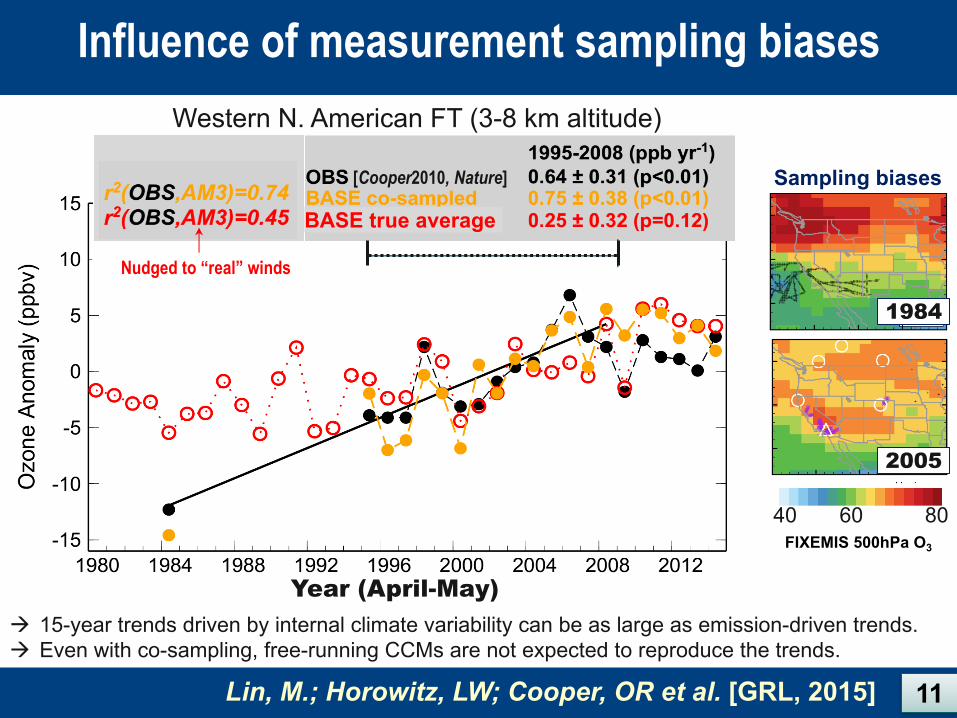
Influence of measurement sampling biases
Lin, M.; Horowitz, LW; Cooper, OR et al. [GRL, 2015]
Ozo
ne A
nom
aly
(ppb
)
Year (April-May)
[Cooper et al.][Cooper2010, Nature]
Year (April-May)
11
Western N. American FT (3-8 km altitude)
à 15-year trends driven by internal climate variability can be as large as emission-driven trends.à Even with co-sampling, free-running CCMs are not expected to reproduce the trends.
Nudged to “real” winds
BASE true average
Sampling biases
40 60 80
1984
2005
FIXEMIS 500hPa O3
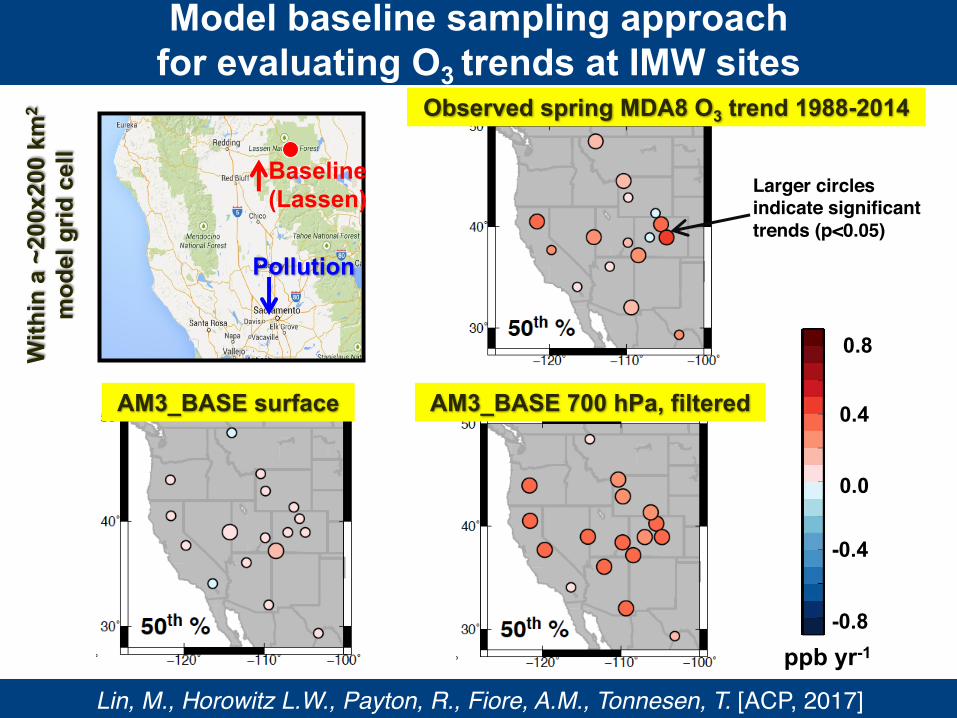
Model baseline sampling approach for evaluating O3 trends at IMW sites
Baseline(Lassen)
With
in a
~20
0x20
0 km
2
mod
el g
rid c
ell
Pollution
Observed spring MDA8 O3 trend 1988-2014
AM3_BASE surface AM3_BASE 700 hPa, filtered
-0.8
-0.4
0.0
0.4
0.8
Lin, M., Horowitz L.W., Payton, R., Fiore, A.M., Tonnesen, T. [ACP, 2017]
Larger circles indicate significant trends (p<0.05)
ppb yr-1

Median springtime MDA8 O3 trends at Great Basin NP
See Figure 13 of Lin et al. (ACP, 2017) for additional analysis for other sites
àMost of the observed variability reflect changes in the backgroundàThe effects of US NOx controls (BASE minus NAB) are < 0.1 ppb yr-1
13
GeophysicalFluidDynamicsLaboratory
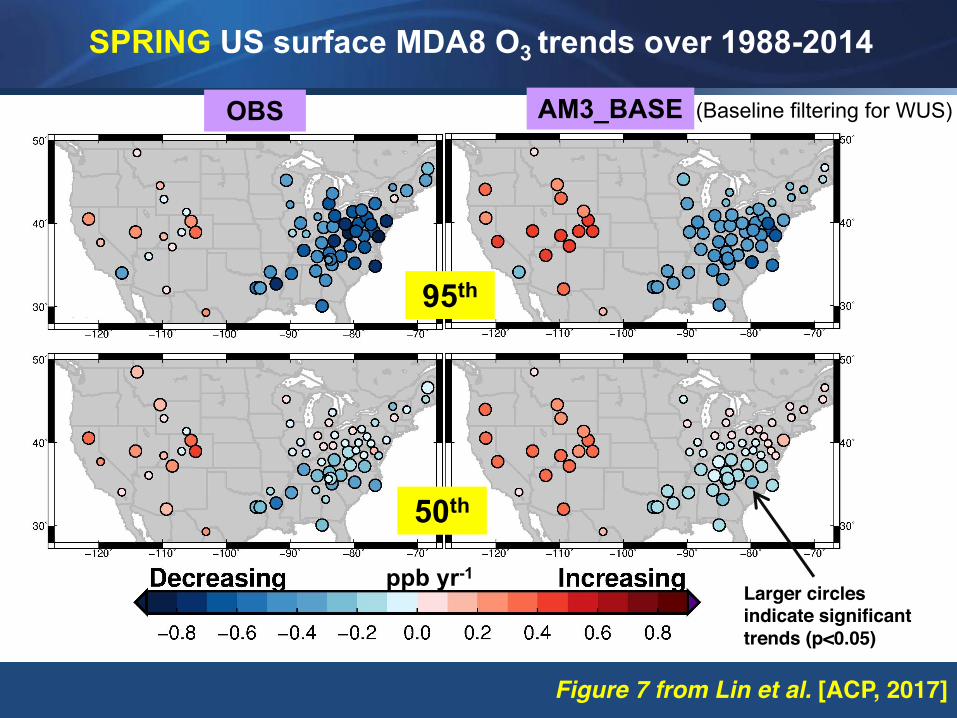
SPRING US surface MDA8 O3 trends over 1988-2014
Figure 7 from Lin et al. [ACP, 2017]
OBS AM3_BASE
Larger circles indicate significant trends (p<0.05)
ppb yr-1
95th
50th
(Baseline filtering for WUS)
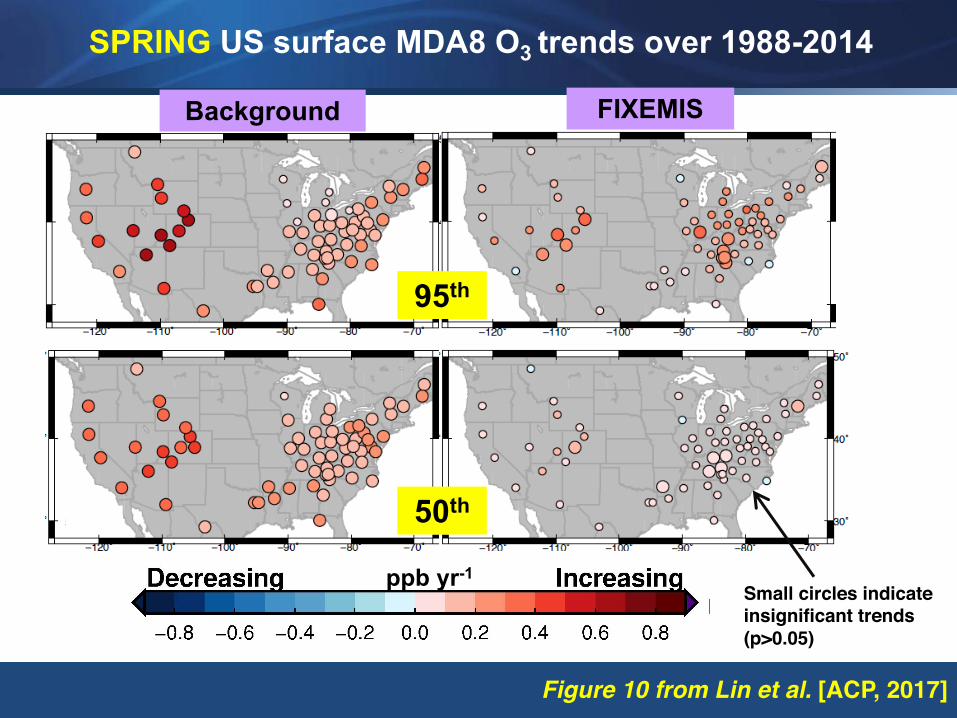
GeophysicalFluidDynamicsLaboratory
SPRING US surface MDA8 O3 trends over 1988-2014
Figure 10 from Lin et al. [ACP, 2017]
50th
95th
Background FIXEMIS
ppb yr-1Small circles indicate insignificant trends (p>0.05)
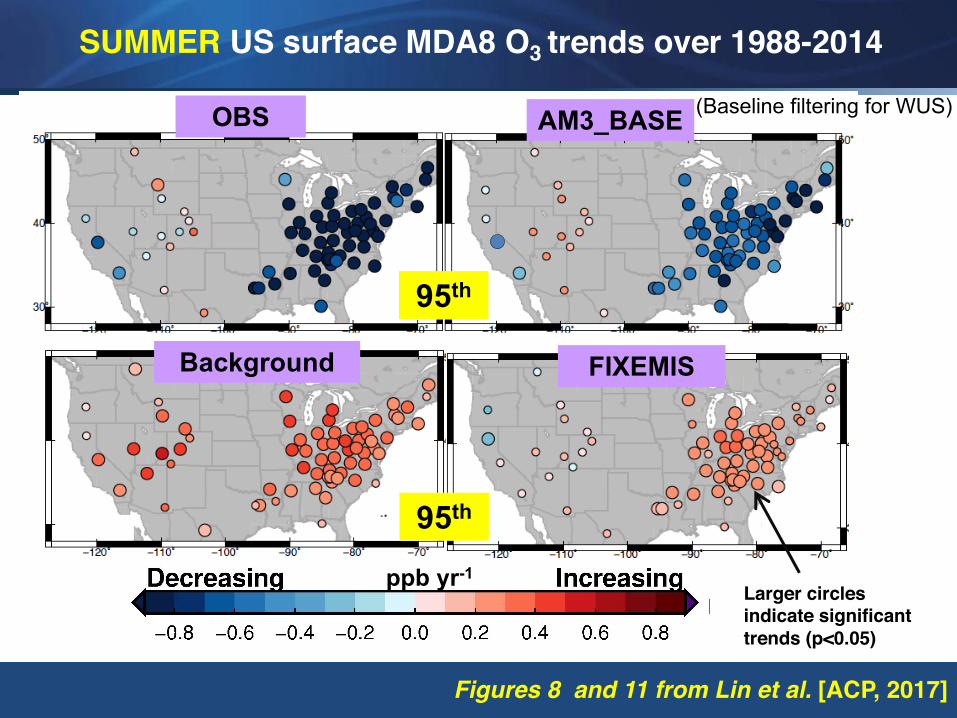
GeophysicalFluidDynamicsLaboratory
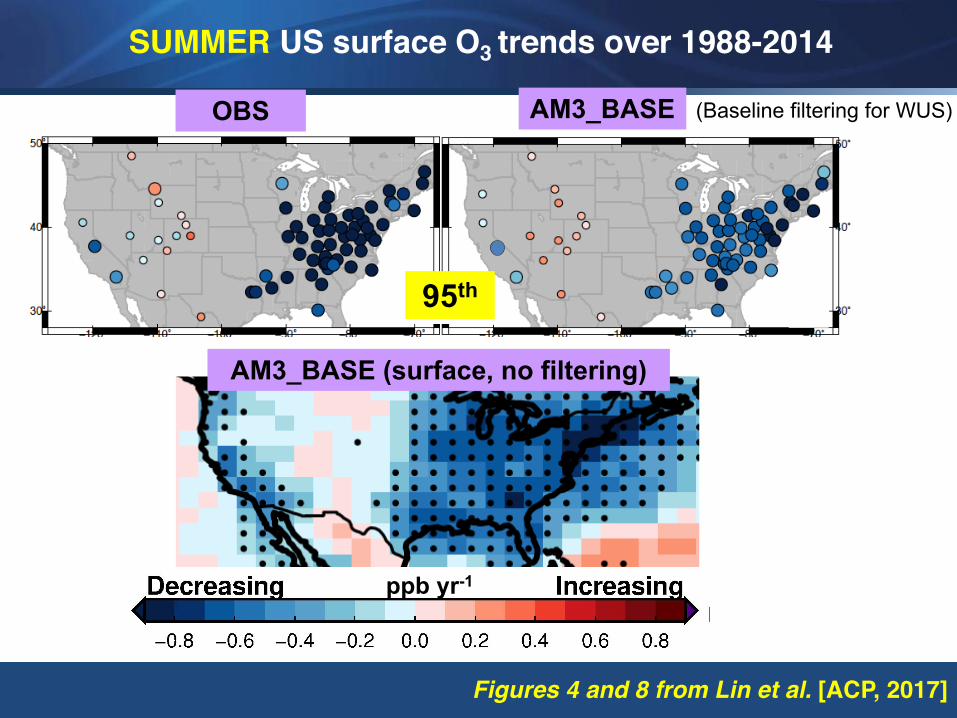
SUMMER US surface MDA8 O3 trends over 1988-2014
Figures 8 and 11 from Lin et al. [ACP, 2017]
95th
50th
OBS AM3_BASE
ppb yr-1Larger circles indicate significant trends (p<0.05)
(Baseline filtering for WUS)
cv95th
Background FIXEMIS
GeophysicalFluidDynamicsLaboratory
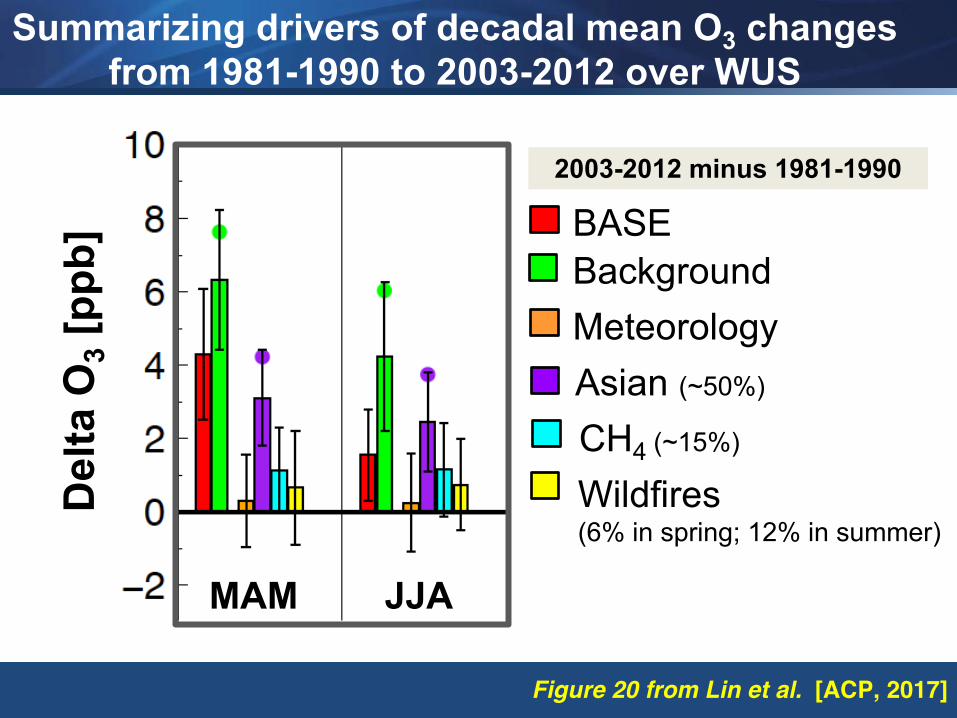
2003-2012 minus 1981-1990
Asian (~50%)
CH4 (~15%)
Wildfires (6% in spring; 12% in summer)
BASE
MeteorologyBackground
Del
ta O
3[p
pb]
MAM JJA
Summarizing drivers of decadal mean O3 changes from 1981-1990 to 2003-2012 over WUS
Figure 20 from Lin et al. [ACP, 2017]
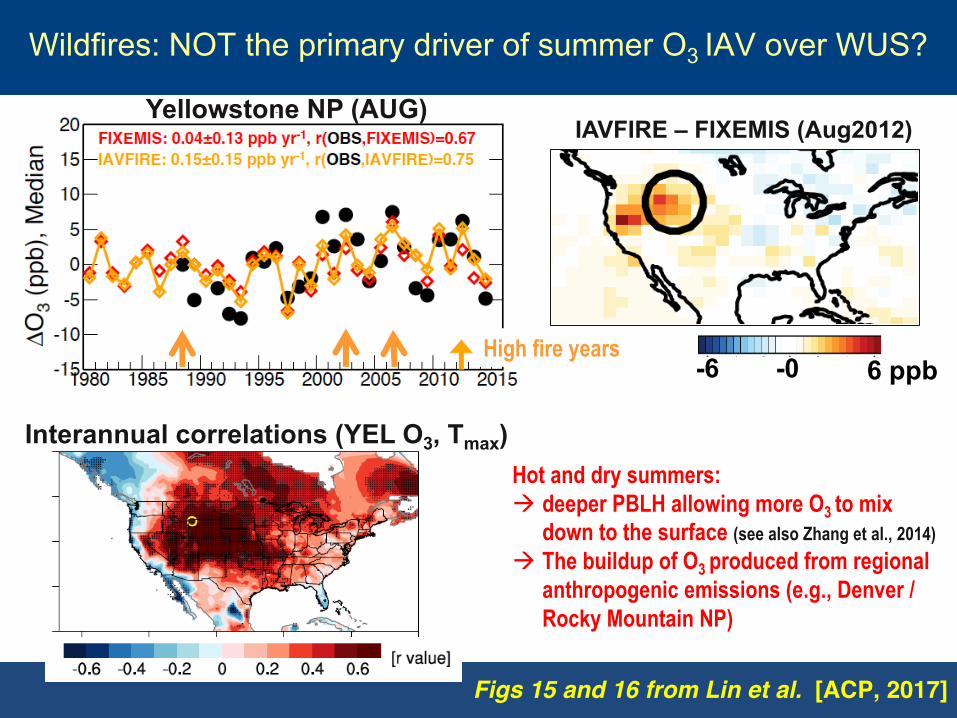
Wildfires: NOT the primary driver of summer O3 IAV over WUS?
Figs 15 and 16 from Lin et al. [ACP, 2017]
Yellowstone NP (AUG)
High fire years
IAVFIRE – FIXEMIS (Aug2012)
6 ppb-6 -0
Hot and dry summers: à deeper PBLH allowing more O3 to mix
down to the surface (see also Zhang et al., 2014)à The buildup of O3 produced from regional
anthropogenic emissions (e.g., Denver / Rocky Mountain NP)
Interannual correlations (YEL O3, Tmax)
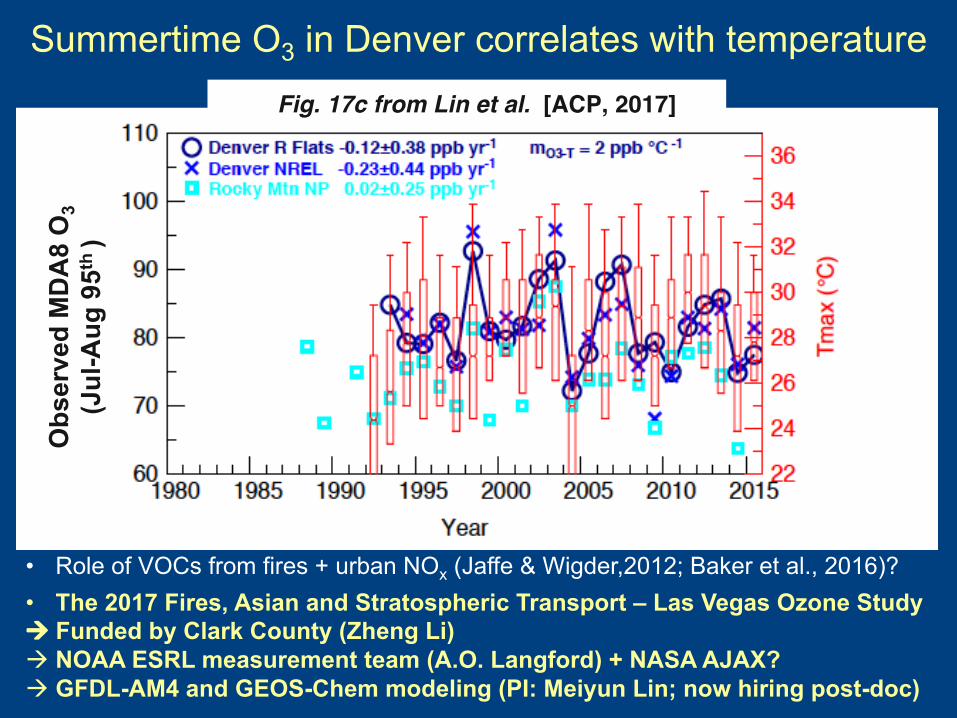
Summertime O3 in Denver correlates with temperatureFig. 17c from Lin et al. [ACP, 2017]
• Role of VOCs from fires + urban NOx (Jaffe & Wigder,2012; Baker et al., 2016)?• The 2017 Fires, Asian and Stratospheric Transport – Las Vegas Ozone Studyà Funded by Clark County (Zheng Li)à NOAA ESRL measurement team (A.O. Langford) + NASA AJAX?à GFDL-AM4 and GEOS-Chem modeling (PI: Meiyun Lin; now hiring post-doc)
Obs
erve
d M
DA
8 O
3(J
ul-A
ug 9
5th
)
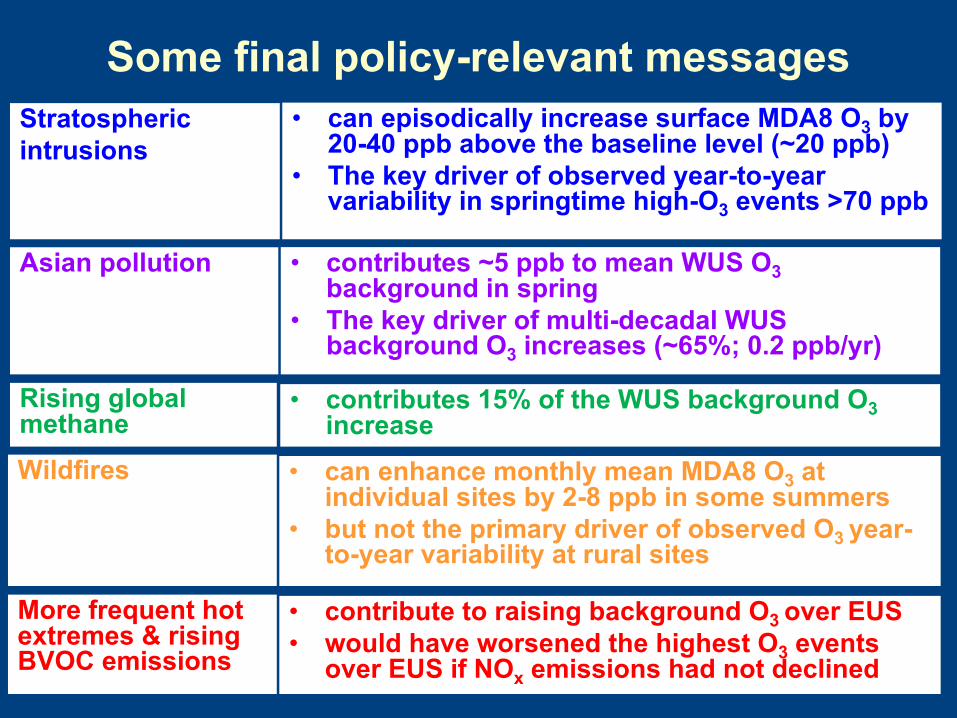
Some final policy-relevant messages• can episodically increase surface MDA8 O3 by
20-40 ppb above the baseline level (~20 ppb)• The key driver of observed year-to-year
variability in springtime high-O3 events >70 ppb
• contributes ~5 ppb to mean WUS O3background in spring
• The key driver of multi-decadal WUS background O3 increases (~65%; 0.2 ppb/yr)
• can enhance monthly mean MDA8 O3 at individual sites by 2-8 ppb in some summers
• but not the primary driver of observed O3 year-to-year variability at rural sites
Asian pollution
Stratosphericintrusions
Wildfires
• contributes 15% of the WUS background O3increase
Rising global methane
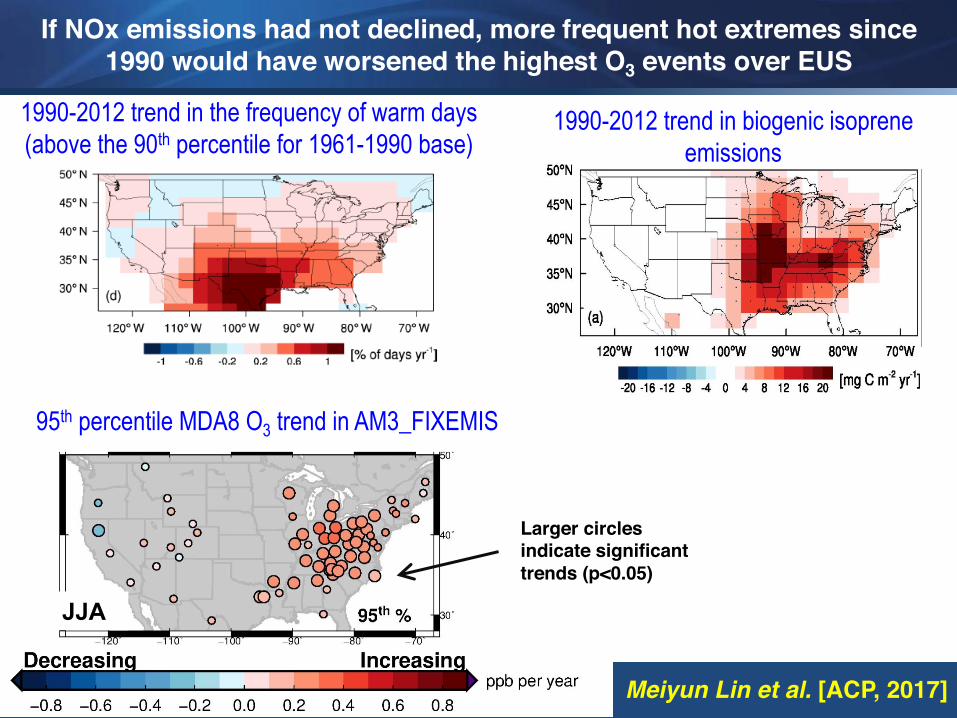
• contribute to raising background O3 over EUS• would have worsened the highest O3 events
over EUS if NOx emissions had not declined
More frequent hot extremes & rising BVOC emissions

Additional Slides for Q & A Discussions
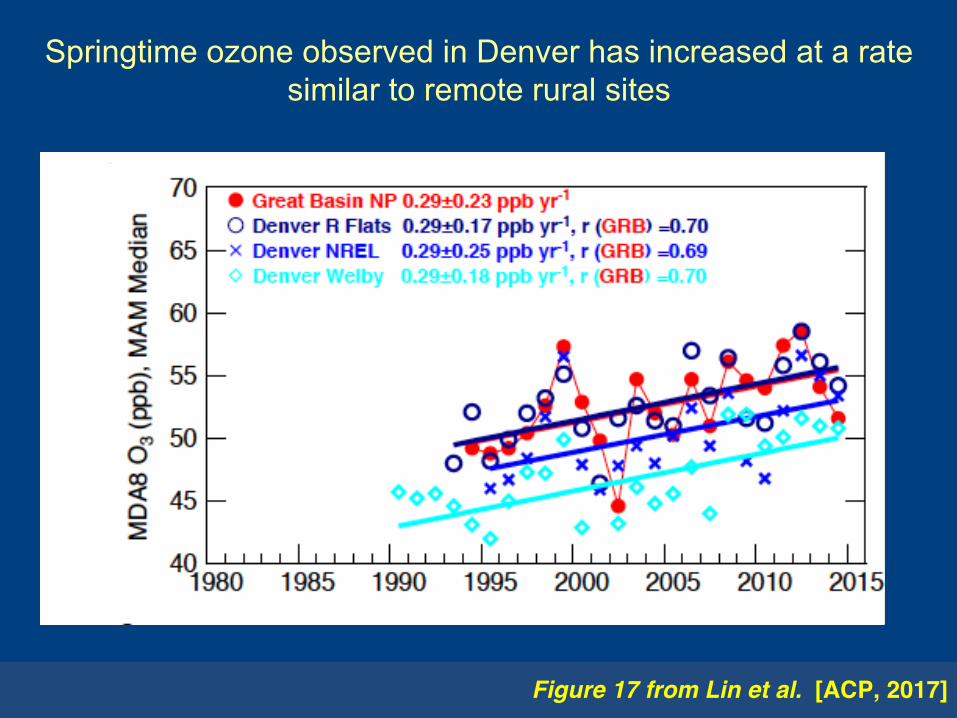
Springtime ozone observed in Denver has increased at a rate similar to remote rural sites
Figure 17 from Lin et al. [ACP, 2017]
GeophysicalFluidDynamicsLaboratory
Projections of near-term changes in WUS lower trop. ozone in spring (March-April-May)
23
Normalize
dto
2000
Satellites
RCP8.5
RCP4.5
RCP8.5
RCP4.5
GlobalCH4 (ppb)3000
2500
2000
1500
E.ChinaNOx emissions
1980
23
OBS (GRB,LAV,ROM)AM3BASE,nudged
Figure 14 from Lin et al. [ACP, 2017]
GeophysicalFluidDynamicsLaboratory
SUMMER US surface O3 trends over 1988-2014
Figures 4 and 8 from Lin et al. [ACP, 2017]
95th
OBS AM3_BASE
ppb yr-1
(Baseline filtering for WUS)
AM3_BASE (surface, no filtering)
GeophysicalFluidDynamicsLaboratory 25
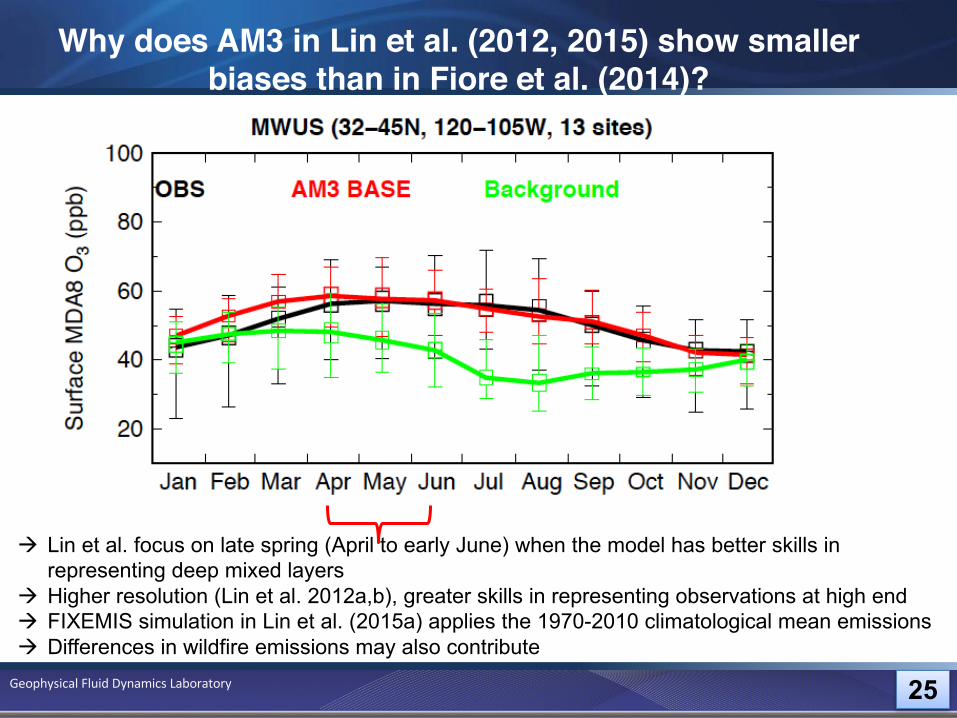
Why does AM3 in Lin et al. (2012, 2015) show smaller biases than in Fiore et al. (2014)?
à Lin et al. focus on late spring (April to early June) when the model has better skills in representing deep mixed layers
à Higher resolution (Lin et al. 2012a,b), greater skills in representing observations at high endà FIXEMIS simulation in Lin et al. (2015a) applies the 1970-2010 climatological mean emissionsà Differences in wildfire emissions may also contribute
GeophysicalFluidDynamicsLaboratory 26
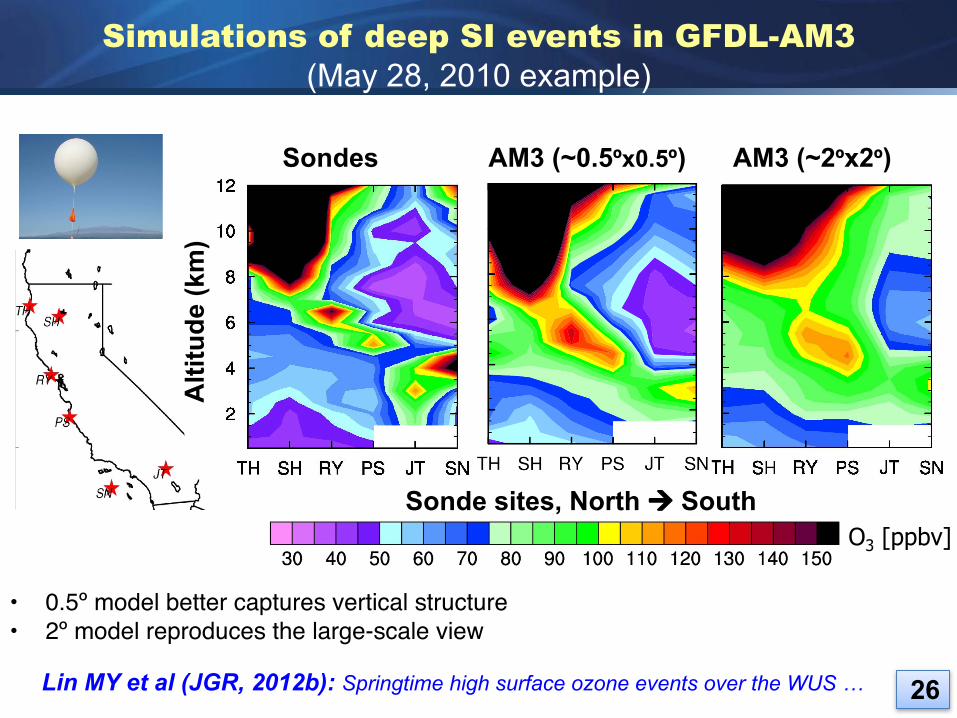
Sondes AM3 (~0.5ºx0.5º) AM3 (~2ºx2º)
Sonde sites, North à SouthO3 [ppbv]
Simulations of deep SI events in GFDL-AM3 (May 28, 2010 example)
Alti
tude
(km
)
• 0.5º model better captures vertical structure• 2º model reproduces the large-scale view
Lin MY et al (JGR, 2012b): Springtime high surface ozone events over the WUS … 26
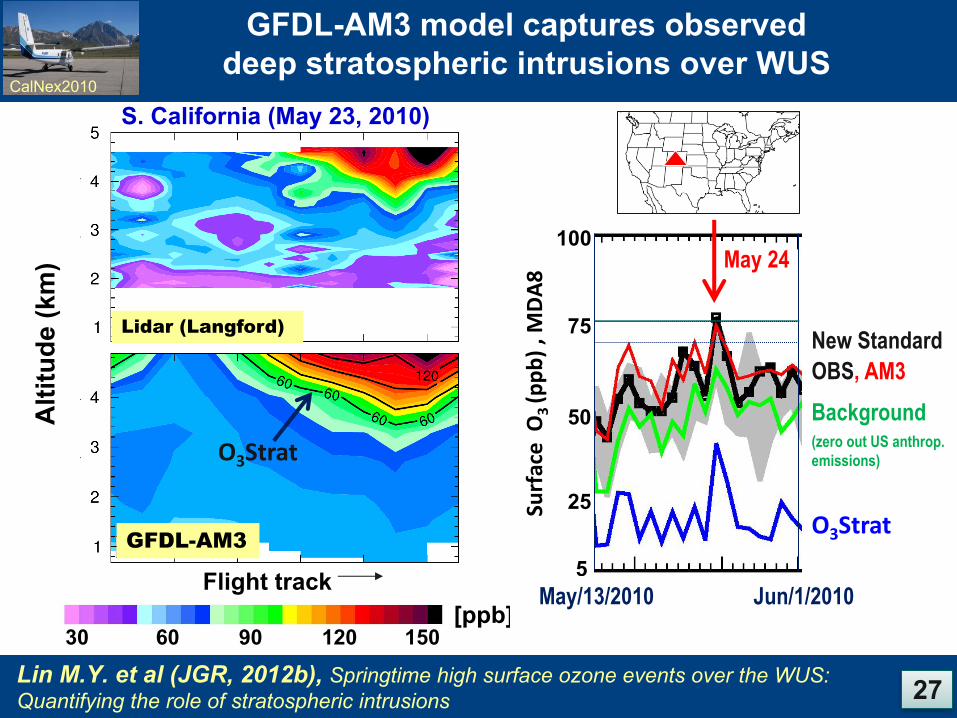
GFDL-AM3
Lidar (Langford)
Flight track
30 60 15090 120[ppb]
Alti
tude
(km
)
S. California (May 23, 2010)
O3Strat
Background(zero out US anthrop. emissions)
OBS, AM3New Standard
100
75
25
50
5SurfaceO3(ppb
),M
DA8 May 24
Jun/1/2010May/13/2010
CalNex2010
O3Strat
27Lin M.Y. et al (JGR, 2012b), Springtime high surface ozone events over the WUS:Quantifying the role of stratospheric intrusions
GFDL-AM3 model captures observed deep stratospheric intrusions over WUS
GeophysicalFluidDynamicsLaboratory
Prob
abili
ty D
ensi
ty
28
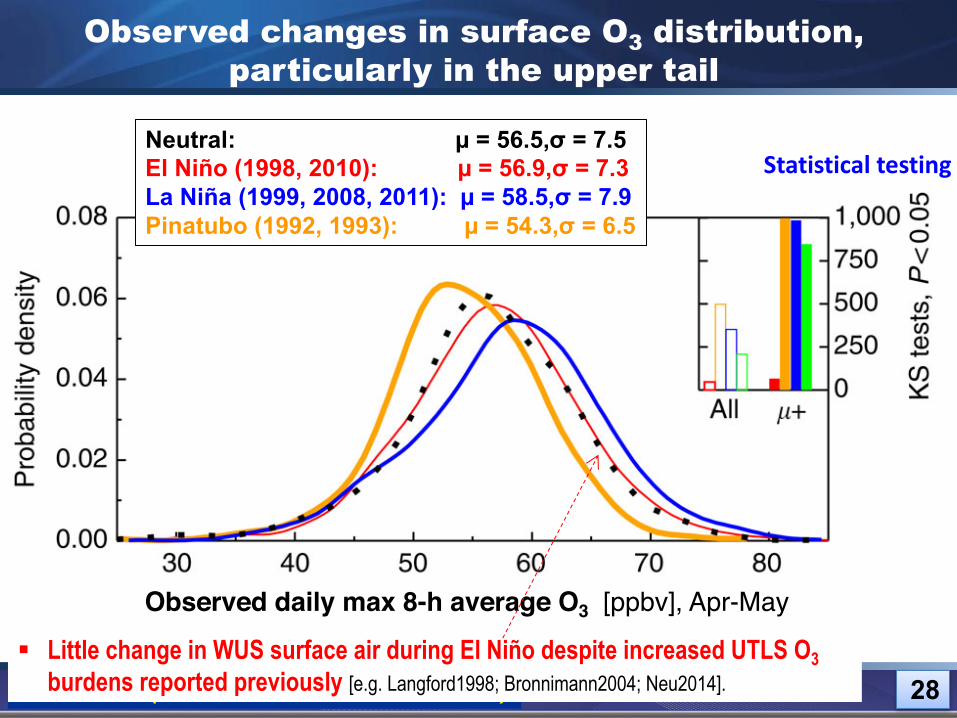
Neutral: µ = 56.5,σ = 7.5El Niño (1998, 2010): µ = 56.9,σ = 7.3La Niña (1999, 2008, 2011): µ = 58.5,σ = 7.9Pinatubo (1992, 1993): µ = 54.3,σ = 6.5
Observed daily max 8-h average O3 [ppbv], Apr-May
Statisticaltesting
Observed changes in surface O3 distribution, particularly in the upper tail
Lin M. et al (Nature Communications, 2015)§ Little change in WUS surface air during El Niño despite increased UTLS O3
burdens reported previously [e.g. Langford1998; Bronnimann2004; Neu2014].
GeophysicalFluidDynamicsLaboratory
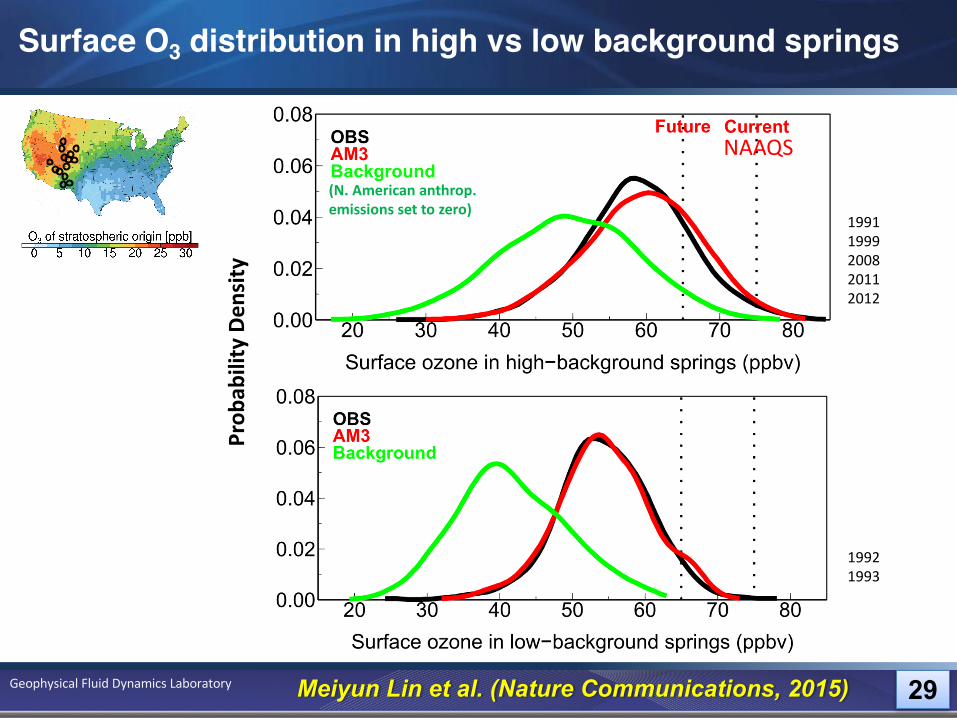
Surface O3 distribution in high vs low background springs
19911999200820112012
19921993
Meiyun Lin et al. (Nature Communications, 2015)
(N.Americananthrop.emissionssettozero)
Prob
abilityDen
sity
29
NAAQS
GeophysicalFluidDynamicsLaboratory
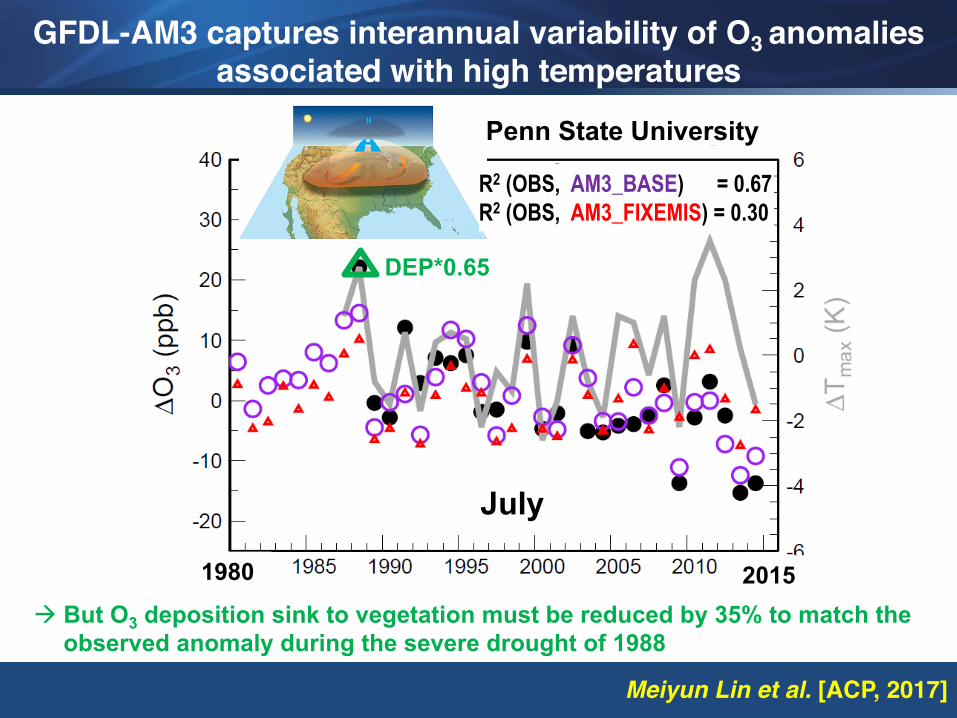
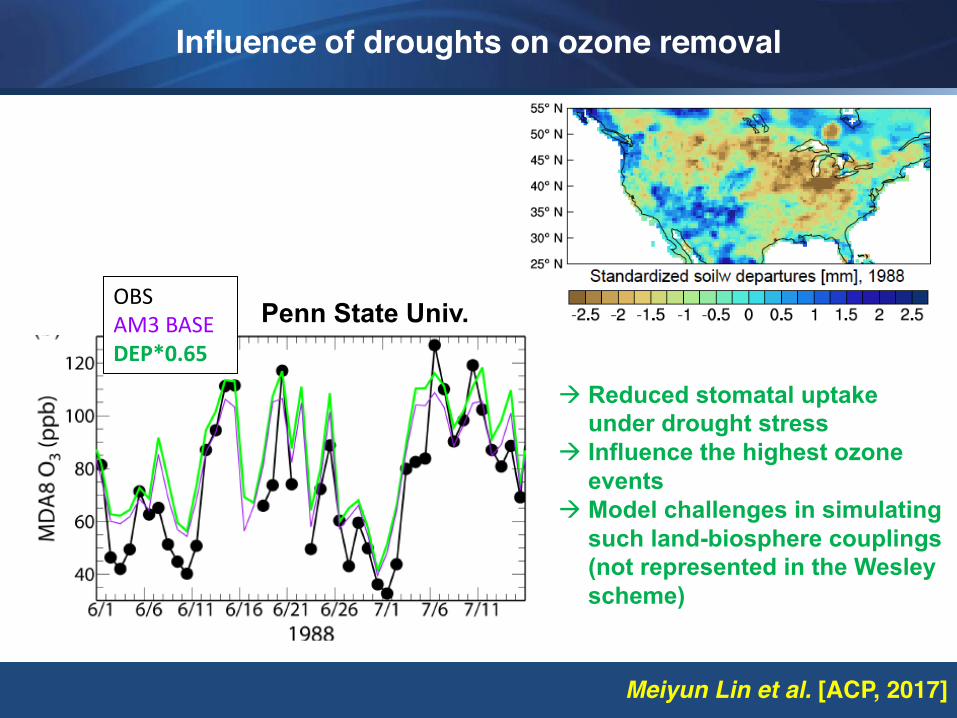
GFDL-AM3 captures interannual variability of O3 anomalies associated with high temperatures
Penn State University
à But O3 deposition sink to vegetation must be reduced by 35% to match the observed anomaly during the severe drought of 1988
Meiyun Lin et al. [ACP, 2017]
R2 (OBS, AM3_BASE) = 0.67R2 (OBS, AM3_FIXEMIS) = 0.30
July
1980 2015
DEP*0.65
GeophysicalFluidDynamicsLaboratory
Influence of droughts on ozone removal
Meiyun Lin et al. [ACP, 2017]
Penn State Univ.OBSAM3BASEDEP*0.65
à Reduced stomatal uptake under drought stress
à Influence the highest ozone events
à Model challenges in simulating such land-biosphere couplings (not represented in the Wesley scheme)
GeophysicalFluidDynamicsLaboratory
If NOx emissions had not declined, more frequent hot extremes since 1990 would have worsened the highest O3 events over EUS
Meiyun Lin et al. [ACP, 2017]
JJA
1990-2012 trend in biogenic isoprene emissions
95th percentile MDA8 O3 trend in AM3_FIXEMIS
1990-2012 trend in the frequency of warm days (above the 90th percentile for 1961-1990 base)
Larger circles indicate significant trends (p<0.05)
Related Documents