Meeting BRA-USA February 2012

Meeting BRA-USA February 2012. Technical Report 2011 February 2012.
Dec 29, 2015
Welcome message from author
This document is posted to help you gain knowledge. Please leave a comment to let me know what you think about it! Share it to your friends and learn new things together.
Transcript
Meeting BRA-USA
February 2012
Technical Report
2011
February 2012

Status of Projects
Comments
Disbursements on Projects
International Cooperation
Governance of IBA
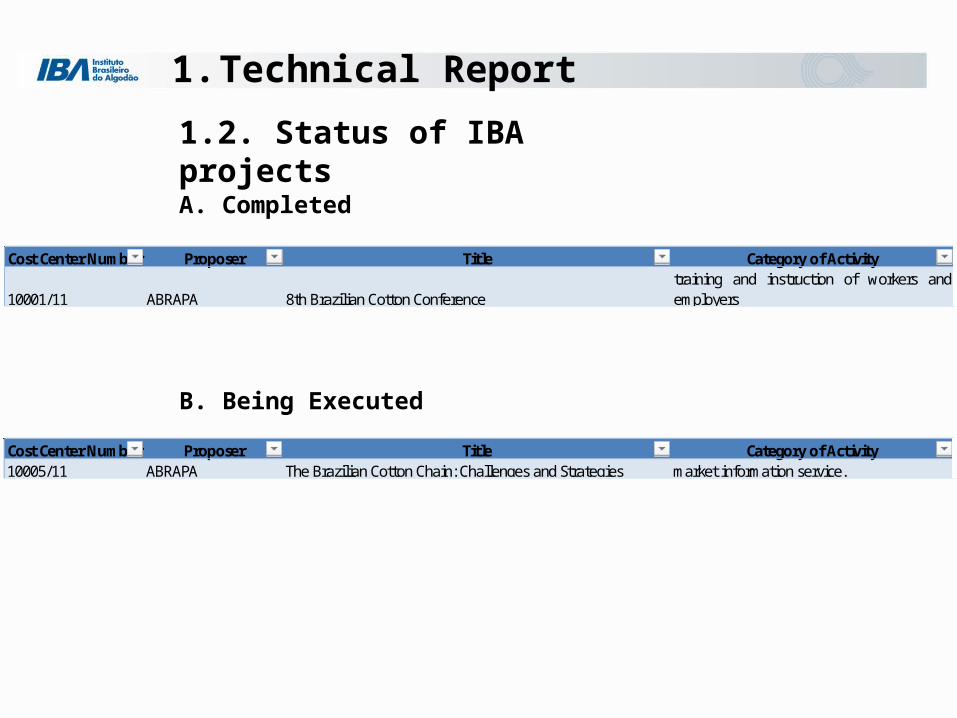
1.2. Status of IBA projects
1. Technical Report
Cost Center Number Proposer Title Category of Activity
10001/11 ABRAPA 8th Brazilian Cotton Conferencetraining and instruction of workers andemployers
A. Completed
B. Being Executed
Cost Center Number Proposer Title Category of Activity10005/11 ABRAPA The Brazilian Cotton Chain: Challenges and Strategies market information service.

1.2. Status of IBA projects
1. Technical Report
C. Under Analysis
Cost Center Number Proposer Title Category of Activity
10002/11 AGOPAPrevention, monitoring, control and suppression of cotton-plant boll weevil Anthonomus grandis
control, mitigation and eradication of pestsand diseases
10003/11 ABRAPA Sustainability Project for the Responsible Brazilian Cotton-RBC / Better Cotton Initiative - BCI. managing and preserving natural resources
compliance with labor laws
10004/11 ABRAPA Brazilian Cotton Grading System – Standard HVI Programparticipation in cotton grading systemimprovement programs
10006/11 AMIPA
Prevention and control of cotton-plant pests in the State ofMinas Gerais, focusing on the boll weevil (Anthonomusgrandis) and migrant pests in the Cerrado agricultural cotton-plant production system
control, mitigation and eradication of pestsand diseases
10007/11 APPA
Monitoring, early warning and control system for cottonpests in São Paulo focusing on the boll weevil Anthonomusgrandis
control, mitigation and eradication of pestsand diseases
10008/11 ACOPAR
Monitoring, early warning and control system for cottonpests in Paraná State focusing on the boll weevilAnthonomus grandis
control, mitigation and eradication of pestsand diseases
10009/11 AMPASULControl, Mitigation and Eradication of Pests and Diseases ofthe Cotton-plant in the State of Mato Grosso do Sul
control, mitigation and eradication of pestsand diseases
10010/11 ABAPAMonitoring and control of the Boll Weevil and other cottonpests in the State of Bahia
control, mitigation and eradication of pestsand diseases
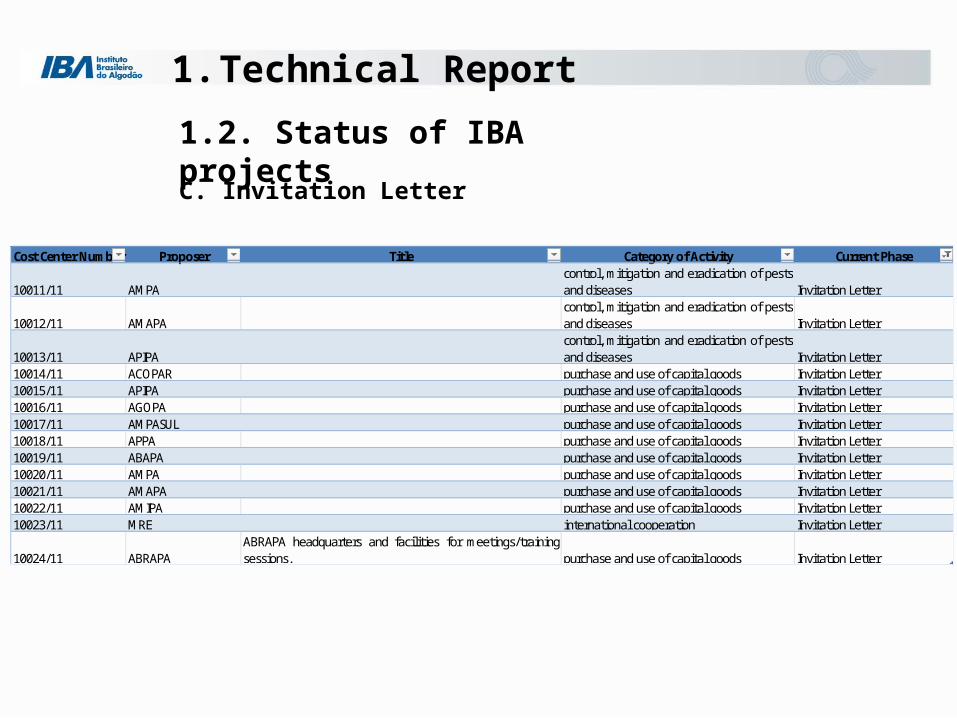
1.2. Status of IBA projects
1. Technical Report
C. Invitation Letter
Cost Center Number Proposer Title Category of Activity Current Phase
10011/11 AMPAcontrol, mitigation and eradication of pestsand diseases Invitation Letter
10012/11 AMAPAcontrol, mitigation and eradication of pestsand diseases Invitation Letter
10013/11 APIPAcontrol, mitigation and eradication of pestsand diseases Invitation Letter
10014/11 ACOPAR purchase and use of capital goods Invitation Letter10015/11 APIPA purchase and use of capital goods Invitation Letter10016/11 AGOPA purchase and use of capital goods Invitation Letter10017/11 AMPASUL purchase and use of capital goods Invitation Letter10018/11 APPA purchase and use of capital goods Invitation Letter10019/11 ABAPA purchase and use of capital goods Invitation Letter10020/11 AMPA purchase and use of capital goods Invitation Letter10021/11 AMAPA purchase and use of capital goods Invitation Letter10022/11 AMIPA purchase and use of capital goods Invitation Letter10023/11 MRE international cooperation Invitation Letter
10024/11 ABRAPAABRAPA headquarters and facilities for meetings/trainingsessions. purchase and use of capital goods Invitation Letter

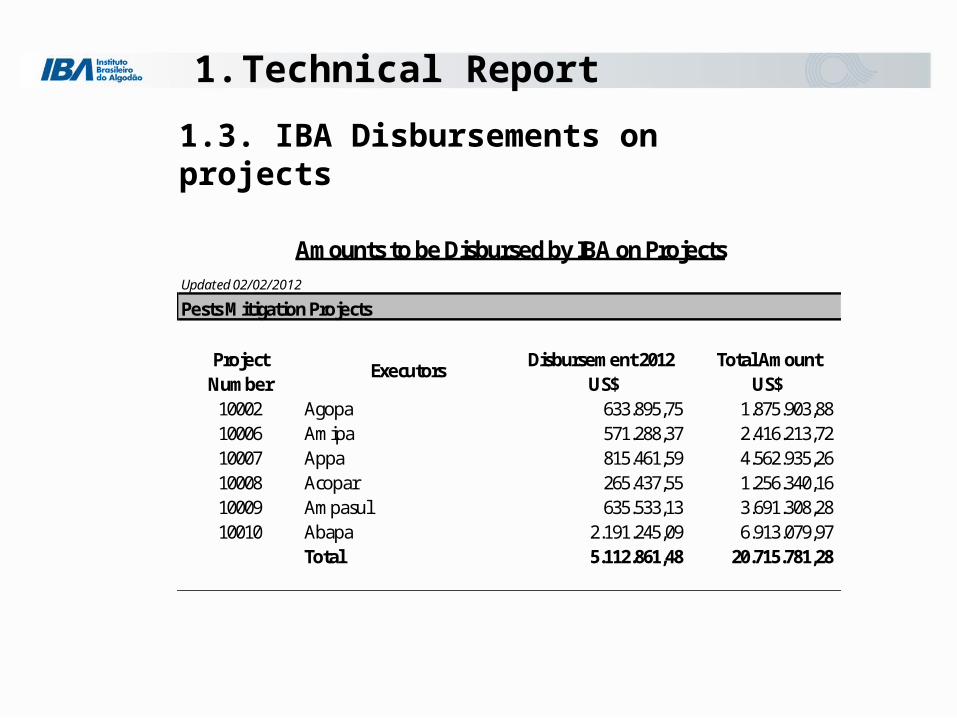
1.3. IBA Disbursements on projects
1. Technical Report
Updated 02/02/2012
Disbursement 2012 Total Amount US$ US$
Inst. Solidariedad 269.180,23 747.956,51 Abapa Grandes 926.641,86 3.181.920,93 Agopa 1.046.664,53 4.179.406,40 Ampasul 527.620,16 2.291.878,96 Amipa 806.250,00 2.524.709,30 Ampa 2.555.097,48 7.210.652,35 Abrapa 907.241,86 2.940.687,21 Abapa Pequenos 419.768,02 1.739.724,42 Total 7.458.464,15 24.816.936,08
(*) Project shows amounts for 2011 added to the total of 2012
(**) The Project provides counterpart - Fast Track Fund (FTF) - Total Value: R $ 4,870,625.52 - Disbursement 2012: R $ 2,133,551.07
ExecutorsProject Number
10003
Sustainability Project (*)(**)
Amounts to be Disbursed by IBA on Projects
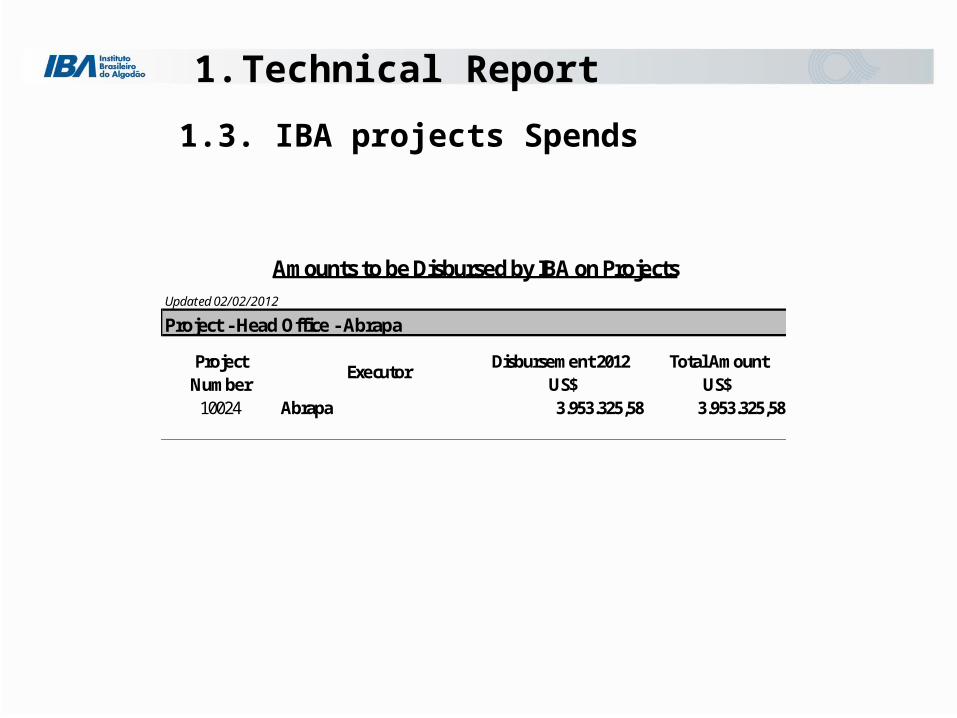
1.3. IBA projects Spends
1. Technical Report
Updated 02/02/2012
Disbursement 2012 Total Amount US$ US$
10024 Abrapa 3.953.325,58 3.953.325,58
Amounts to be Disbursed by IBA on Projects
Project - Head Office - Abrapa
ExecutorProject Number
1. Technical Report
Updated 02/02/2012
Pests Mitigation Projects
Disbursement 2012 Total Amount US$ US$
10002 Agopa 633.895,75 1.875.903,88 10006 Amipa 571.288,37 2.416.213,72 10007 Appa 815.461,59 4.562.935,26 10008 Acopar 265.437,55 1.256.340,16 10009 Ampasul 635.533,13 3.691.308,28 10010 Abapa 2.191.245,09 6.913.079,97
Total 5.112.861,48 20.715.781,28
Amounts to be Disbursed by IBA on Projects
Project Number
Executors
1.3. IBA Disbursements on projects
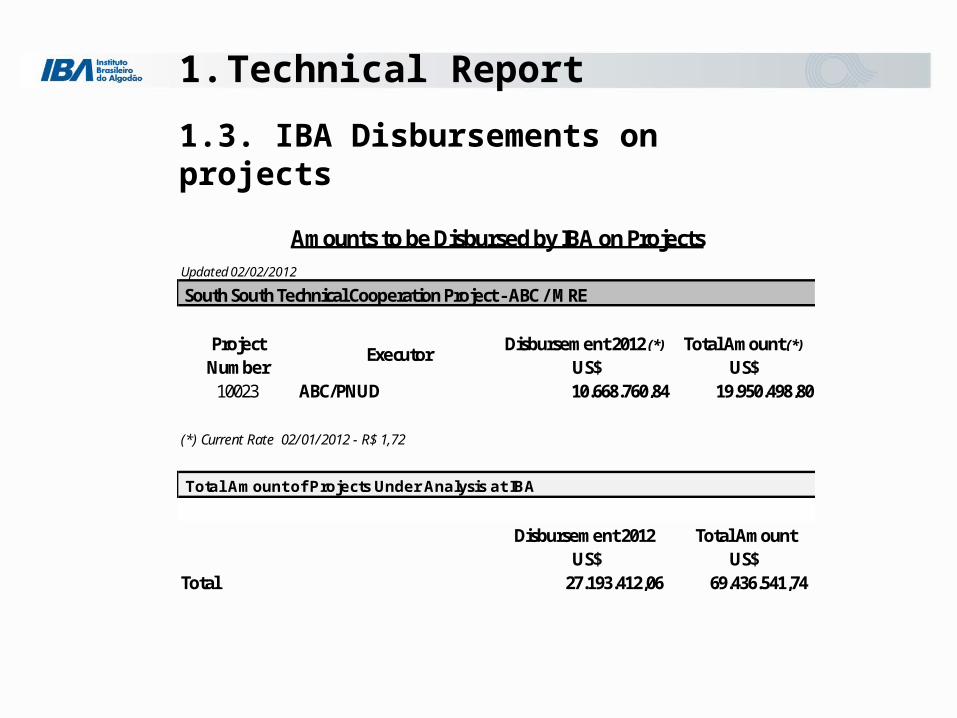
1. Technical Report
Updated 02/02/2012
South South Technical Cooperation Project - ABC / MRE
Disbursement 2012 (*) Total Amount (*)
US$ US$10023 ABC/PNUD 10.668.760,84 19.950.498,80
(*) Current Rate 02/01/2012 - R$ 1,72
Total Amount of Projects Under Analysis at IBA
Disbursement 2012 Total Amount US$ US$
Total 27.193.412,06 69.436.541,74
Amounts to be Disbursed by IBA on Projects
ExecutorProject Number
1.3. IBA Disbursements on projects
1.4. International Cooperation
i. Protocol of Intentions
ii. Memorandum of Understanding (MoU)
iii. Base-Project for Technical Cooperation
1. Technical Report
1.5. Governance of IBA
i. Approval of the STANDARDS
ii. Executive Board and Staff
iii. Information Technology (IT) Electronic Portal Integrated Project System
1. Technical Report

Financial Report
2011
February 2012
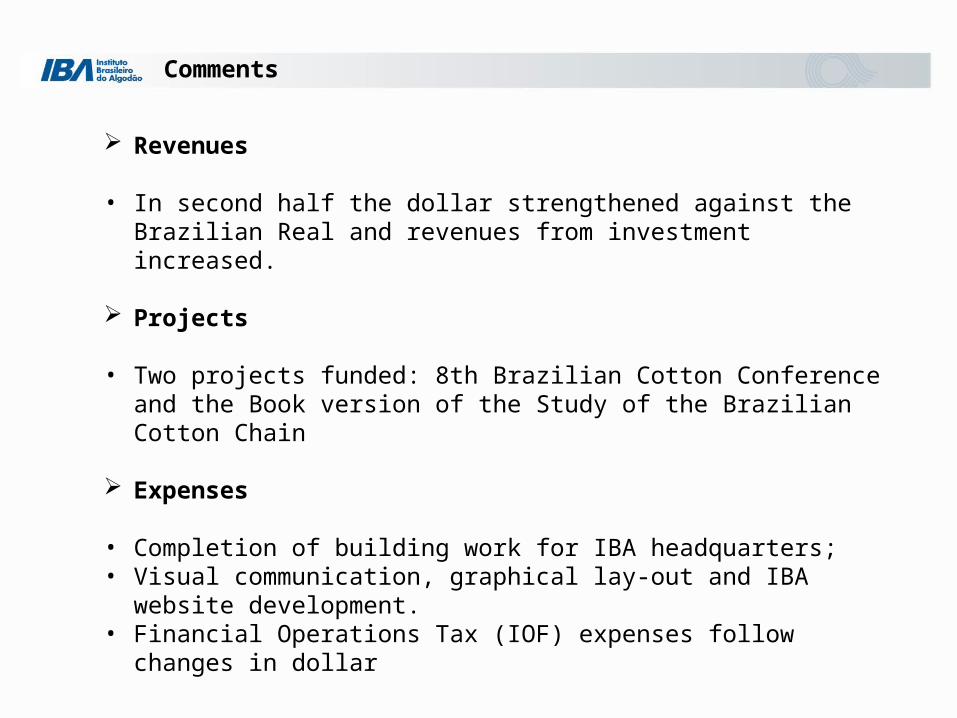
Comments
Revenues
• In second half the dollar strengthened against the Brazilian Real and revenues from investment increased.
Projects
• Two projects funded: 8th Brazilian Cotton Conference and the Book version of the Study of the Brazilian Cotton Chain
Expenses
• Completion of building work for IBA headquarters;• Visual communication, graphical lay-out and IBA website development.• Financial Operations Tax (IOF) expenses follow changes in dollar
Comments
Comments
Financial Statements
Other Matters
• Balance Sheet• Income Statement• Administrative expenses• Exchange• Cash and Investments

Financial Statements
BALANCE SHEET
Assets
Cash and Financial Investments 461.587.761 182.734.731 Prov. Inc. Tax on Returns (4.496.166) (16.249) Expenses Brought Forward 822 Other Assets 1.358
Projects -
Fixed Assets 288.230
TOTAL 457.382.005 182.718.482
Liabilities
Suppliers 22.270 Provisions for Xmas Bonus/Vacations, charges 197.095 Salaries and related charges 82.442 Tax obligations to collect 646 Loans 417.244 Other liabilitiesProjects -
EquitySurplus from tax year 274.778.314 Accumulated surplus 457.079.552 182.301.238
TOTAL 457.382.005 182.718.482
In R$ December/2011 December/2010
Financial Statements
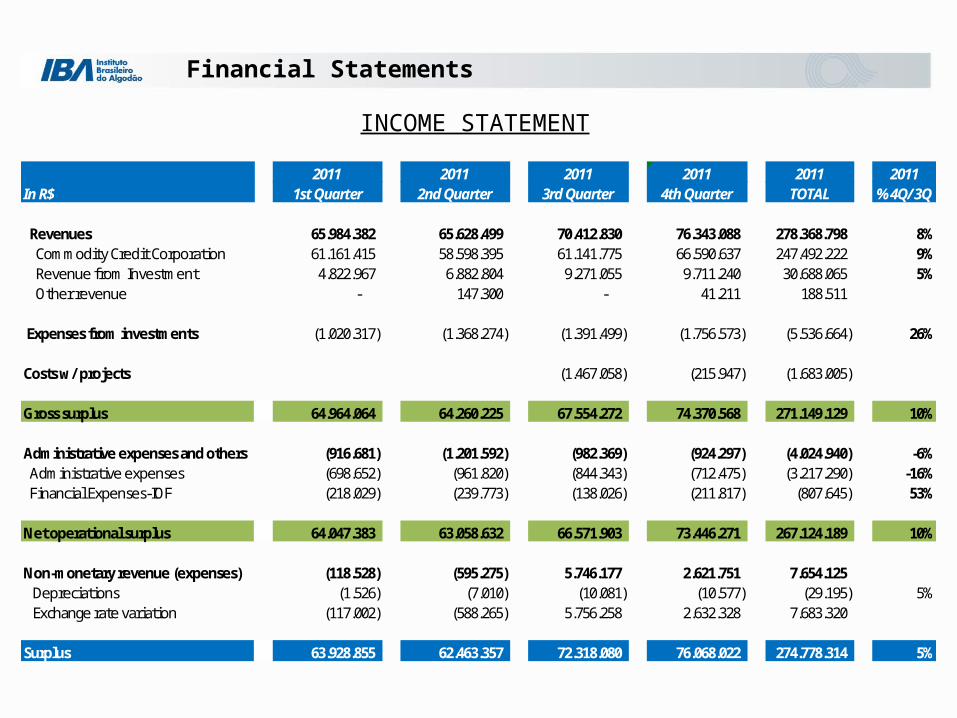
INCOME STATEMENT
2011 2011 2011 2011 20111st Quarter 2nd Quarter 3rd Quarter 4th Quarter TOTAL % 4Q/3Q
Revenues 65.984.382 65.628.499 70.412.830 76.343.088 278.368.798 8% Commodity Credit Corporation 61.161.415 58.598.395 61.141.775 66.590.637 247.492.222 9% Revenue from Investment 4.822.967 6.882.804 9.271.055 9.711.240 30.688.065 5% Other revenue - 147.300 - 41.211 188.511
Expenses from investments (1.020.317) (1.368.274) (1.391.499) (1.756.573) (5.536.664) 26%
Costs w/ projects (1.467.058) (215.947) (1.683.005)
Gross surplus 64.964.064 64.260.225 67.554.272 74.370.568 271.149.129 10%
Administrative expenses and others (916.681) (1.201.592) (982.369) (924.297) (4.024.940) -6% Administrative expenses (698.652) (961.820) (844.343) (712.475) (3.217.290) -16% Financial Expenses-IOF (218.029) (239.773) (138.026) (211.817) (807.645) 53%
Net operational surplus 64.047.383 63.058.632 66.571.903 73.446.271 267.124.189 10%
Non-monetary revenue (expenses) (118.528) (595.275) 5.746.177 2.621.751 7.654.125 Depreciations (1.526) (7.010) (10.081) (10.577) (29.195) 5% Exchange rate variation (117.002) (588.265) 5.756.258 2.632.328 7.683.320
Surplus 63.928.855 62.463.357 72.318.080 76.068.022 274.778.314 5%
In R$2011
Financial Statements
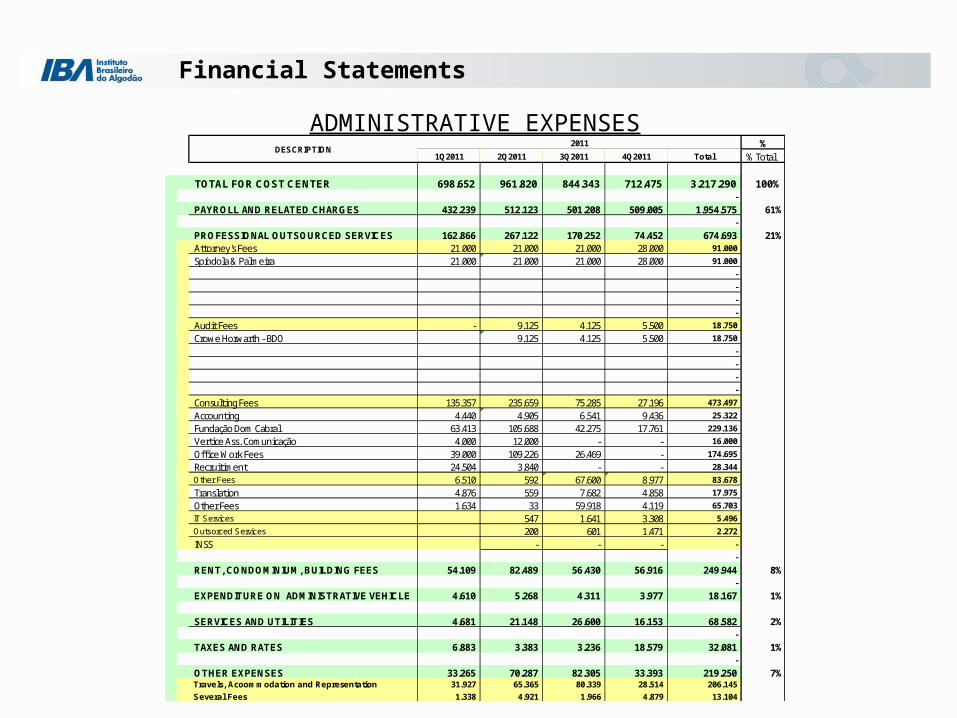
ADMINISTRATIVE EXPENSES%
1Q2011 2Q2011 3Q2011 4Q2011 Total % Total
TOTAL FOR COST CENTER 698.652 961.820 844.343 712.475 3.217.290 100%-
PAYROLL AND RELATED CHARGES 432.239 512.123 501.208 509.005 1.954.575 61%-
PROFESSIONAL OUTSOURCED SERVICES 162.866 267.122 170.252 74.452 674.693 21%Attorney's Fees 21.000 21.000 21.000 28.000 91.000
Spíndola & Palmeira 21.000 21.000 21.000 28.000 91.000
-
-
-
-
Audit Fees - 9.125 4.125 5.500 18.750
Crowe Horwarth - BDO 9.125 4.125 5.500 18.750
-
-
-
-
Consulting Fees 135.357 235.659 75.285 27.196 473.497
Accounting 4.440 4.905 6.541 9.436 25.322
Fundação Dom Cabral 63.413 105.688 42.275 17.761 229.136
Vertice Ass. Comunicação 4.000 12.000 - - 16.000
Offi ce Work Fees 39.000 109.226 26.469 - 174.695
Recruitiment 24.504 3.840 - - 28.344
Other Fees 6.510 592 67.600 8.977 83.678
Translation 4.876 559 7.682 4.858 17.975
Other Fees 1.634 33 59.918 4.119 65.703
IT Services 547 1.641 3.308 5.496
Outsorced Services 200 601 1.471 2.272
INSS - - - -
-
RENT, CONDOMINIUM, BUILDING FEES 54.109 82.489 56.430 56.916 249.944 8%-
EXPENDITURE ON ADMINISTRATIVE VEHICLE 4.610 5.268 4.311 3.977 18.167 1%
SERVICES AND UTILITIES 4.681 21.148 26.600 16.153 68.582 2%-
TAXES AND RATES 6.883 3.383 3.236 18.579 32.081 1%-
OTHER EXPENSES 33.265 70.287 82.305 33.393 219.250 7%Travels, Acoommodation and Representation 31.927 65.365 80.339 28.514 206.145
Several Fees 1.338 4.921 1.966 4.879 13.104
DESCRIPTION2011

Financial Statements
EXCHANGE RATE
Exchange rate fluctuation up until 31/12/2011: 13.63%
Source: Central Bank of Brazil
1,6
72
6
1,6
60
4
1,6
27
9
1,5
72
5
1,5
79
1
1,5
60
3
1,5
55
5
1,5
86
4 1,8
53
6
1,6
87
8
1,8
10
2
1,8
75
1
1,6
74
1
1,6
67
2
1,6
58
3
1,5
85
6
1,6
12
7
1,5
86
2
1,5
63
1
1,5
96
2
1,7
49
0
1,7
71
9
1,7
89
8
1,8
36
2
0,00
0,20
0,40
0,60
0,80
1,00
1,20
1,40
1,60
1,80
2,00
Jan Fev Mar Abr Mai Jun Jul Ago Set Out Nov Dez
Fechamento Mês
Média Mês
Financial Statements
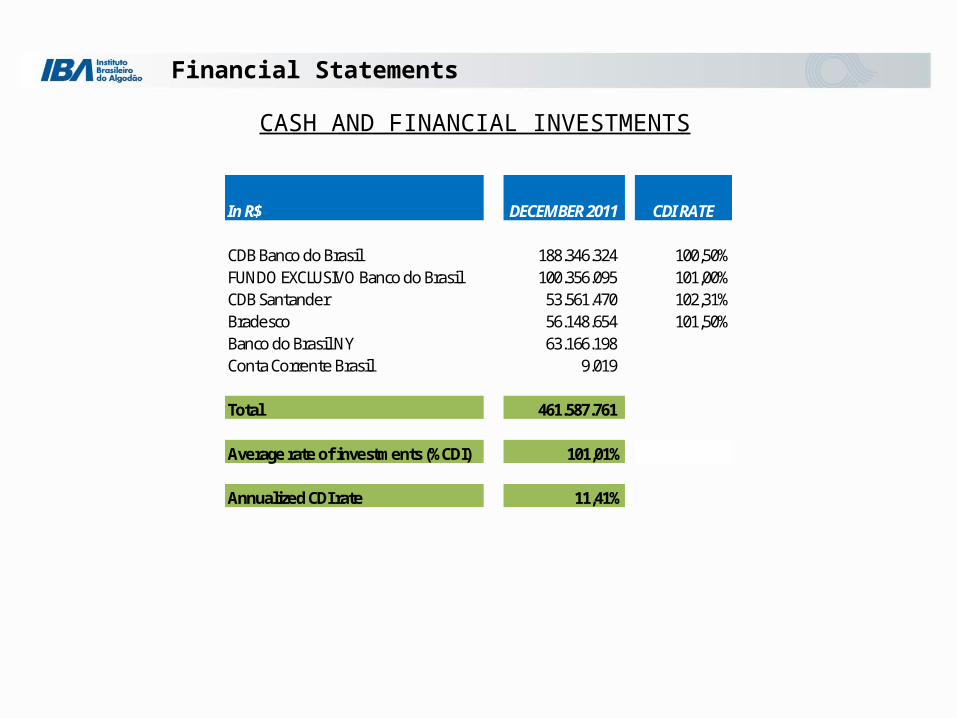
CASH AND FINANCIAL INVESTMENTS
CDB Banco do Brasil 188.346.324 100,50%FUNDO EXCLUSIVO Banco do Brasil 100.356.095 101,00%CDB Santander 53.561.470 102,31%Bradesco 56.148.654 101,50%Banco do Brasil NY 63.166.198 Conta Corrente Brasil 9.019
Total 461.587.761
Average rate of investments (%CDI) 101,01% 398.412.543
Annualized CDI rate 11,41%
In R$ DECEMBER 2011 CDI RATE
Comments
Comments
Financial Statements
Other Matters
•Projects
Other Matters
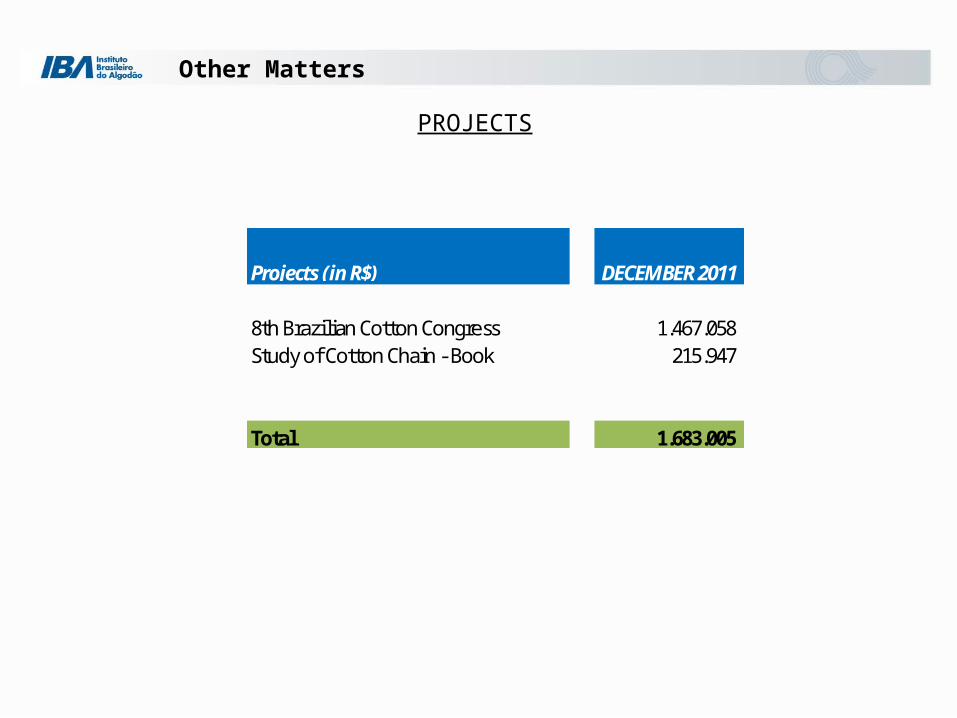
PROJECTS
8th Brazilian Cotton Congress 1.467.058 Study of Cotton Chain - Book 215.947
Total 1.683.005
Projects (in R$) DECEMBER 2011
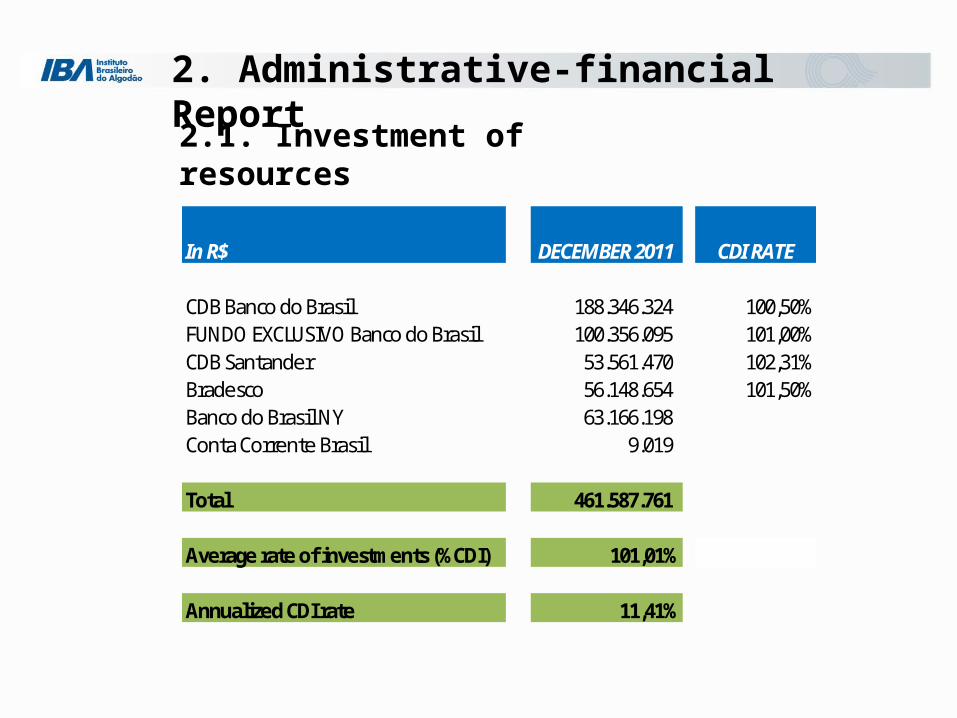
2. Administrative-financial Report
2.1. Investment of resources
CDB Banco do Brasil 188.346.324 100,50%FUNDO EXCLUSIVO Banco do Brasil 100.356.095 101,00%CDB Santander 53.561.470 102,31%Bradesco 56.148.654 101,50%Banco do Brasil NY 63.166.198 Conta Corrente Brasil 9.019
Total 461.587.761
Average rate of investments (%CDI) 101,01% 398.412.543
Annualized CDI rate 11,41%
In R$ DECEMBER 2011 CDI RATE

2. Administrative-financial Report
2.2. Administrative expenses
%1T2011 2T2011 3T2011 4T2011 Total % Total
TOTAL DO CENTRO DE CUSTO 698.652 961.820 844.343 712.475 3.217.290 100%-
FOLHA E ENCARGOS 432.239 512.123 501.208 509.005 1.954.575 61%-
SERVIÇOS PROFISSIONAIS DE TERCEIROS 162.866 267.122 170.252 74.452 674.693 21%-
ALUGUEL, CONDOMÍNIO E TAXAS PREDIAIS 54.109 82.489 56.430 56.916 249.944 8%-
DESPESAS COM VEÍCULO ADMINISTRATIVO 4.610 5.268 4.311 3.977 18.167 1%
SERVIÇOS E UTILIDADES 4.681 21.148 26.600 16.153 68.582 2%-
IMPOSTOS E TAXAS 6.883 3.383 3.236 18.579 32.081 1%-
OUTRAS DESPESAS 33.265 70.287 82.305 33.393 219.250 7%
DESCRIÇÃO2011
2. Administrative-financial Report
2.3. Appendices
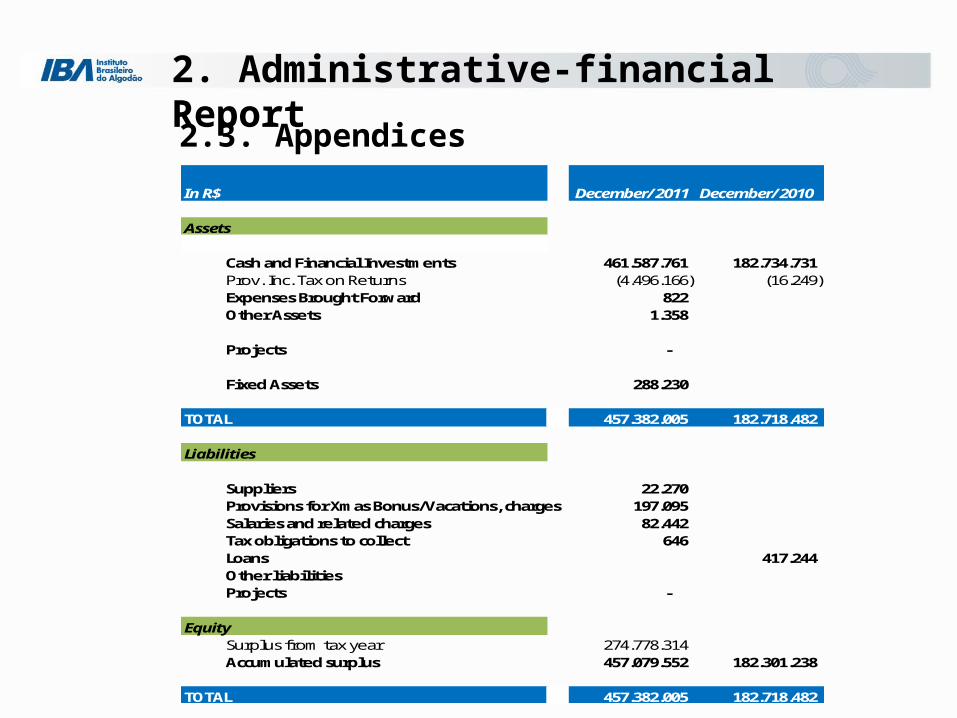
Assets
Cash and Financial Investments 461.587.761 182.734.731 Prov. Inc. Tax on Returns (4.496.166) (16.249) Expenses Brought Forward 822 Other Assets 1.358
Projects -
Fixed Assets 288.230
TOTAL 457.382.005 182.718.482
Liabilities
Suppliers 22.270 Provisions for Xmas Bonus/Vacations, charges 197.095 Salaries and related charges 82.442 Tax obligations to collect 646 Loans 417.244 Other liabilitiesProjects -
EquitySurplus from tax year 274.778.314 Accumulated surplus 457.079.552 182.301.238
TOTAL 457.382.005 182.718.482
In R$ December/2011 December/2010
2. Administrative-financial Report
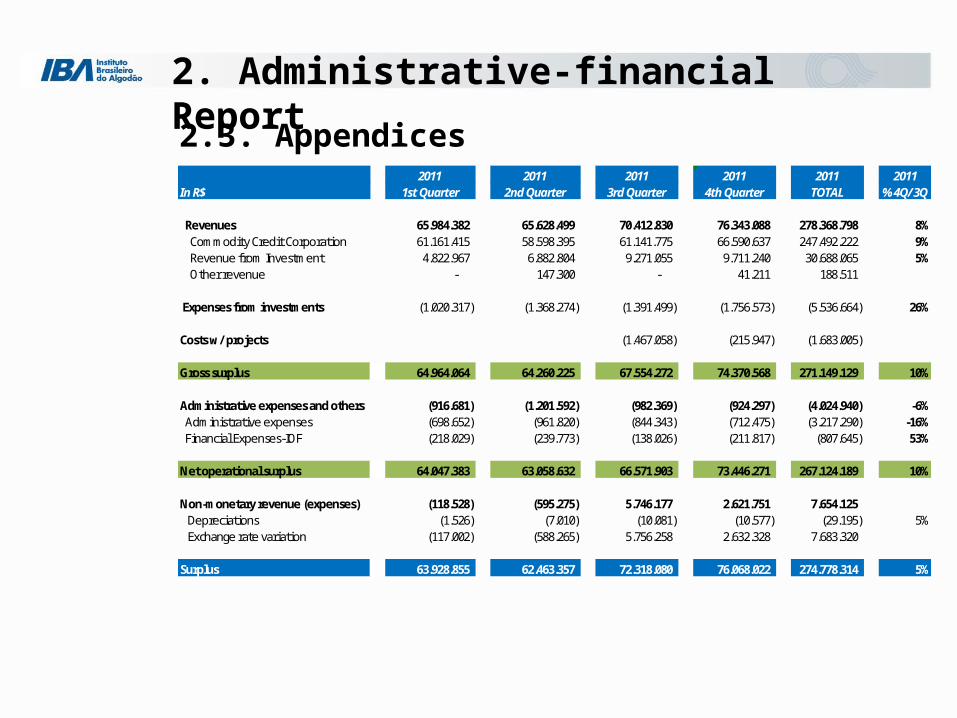
2.3. Appendices2011 2011 2011 2011 2011
1st Quarter 2nd Quarter 3rd Quarter 4th Quarter TOTAL % 4Q/3Q
Revenues 65.984.382 65.628.499 70.412.830 76.343.088 278.368.798 8% Commodity Credit Corporation 61.161.415 58.598.395 61.141.775 66.590.637 247.492.222 9% Revenue from Investment 4.822.967 6.882.804 9.271.055 9.711.240 30.688.065 5% Other revenue - 147.300 - 41.211 188.511
Expenses from investments (1.020.317) (1.368.274) (1.391.499) (1.756.573) (5.536.664) 26%
Costs w/ projects (1.467.058) (215.947) (1.683.005)
Gross surplus 64.964.064 64.260.225 67.554.272 74.370.568 271.149.129 10%
Administrative expenses and others (916.681) (1.201.592) (982.369) (924.297) (4.024.940) -6% Administrative expenses (698.652) (961.820) (844.343) (712.475) (3.217.290) -16% Financial Expenses-IOF (218.029) (239.773) (138.026) (211.817) (807.645) 53%
Net operational surplus 64.047.383 63.058.632 66.571.903 73.446.271 267.124.189 10%
Non-monetary revenue (expenses) (118.528) (595.275) 5.746.177 2.621.751 7.654.125 Depreciations (1.526) (7.010) (10.081) (10.577) (29.195) 5% Exchange rate variation (117.002) (588.265) 5.756.258 2.632.328 7.683.320
Surplus 63.928.855 62.463.357 72.318.080 76.068.022 274.778.314 5%
In R$2011

Haroldo Rodrigues da CunhaExecutive President
Tel/Phone: +55 61 3533-6451
Cel/Mobile: +55 61 8158-9746
Related Documents