1 Introductory lecture Prof. Mladen Petrovečki, MD, PhD Medizinische Universität Graz PhD Studium – Program in Molecular Medicine Selected Biostatistical Methods with Practical Examples June 2013 http://mi.medri.hr Schedule 11.6. – Basic biostatistical terminology and methods 12.6. – Qualitative data, correlation & regression 13.6. – Testing the differences 14.6. – Meta-analysis & power analysis 15.6. – Exercises & discussion Logic & reasoning www.glasbergen.com/ Types of logic www.cartoonstock.com

Welcome message from author
This document is posted to help you gain knowledge. Please leave a comment to let me know what you think about it! Share it to your friends and learn new things together.
Transcript

1
Introductory lecture
Prof. Mladen Petrovečki, MD, PhD
Medizinische Universität Graz
PhD Studium – Program in Molecular MedicineSelected Biostatistical Methods with Practical Examples
June 2013
http://mi.medri.hr Schedule
11.6. – Basic biostatistical terminology and methods
12.6. – Qualitative data, correlation & regression
13.6. – Testing the differences
14.6. – Meta-analysis & power analysis
15.6. – Exercises & discussion
Logic & reasoning
www.glasbergen.com/
Types of logic
www.cartoonstock.com
2
Nonscientific procedures
• diligence
(habit, attitude, manner, believe, momentum)
• authority
• intuition
Scientific procedures?
Argument, proof Logic in science
• system
• models of the system• deterministic
• probabilistic
• event probability → P(E)
0 ≤ P(E) ≤ 1
Probability
• mathematical calculation that something, event, will occur
• mathematic � probability theory
• statistics
• mathematics
• scientific methodology
• logic, philosophy
• reasoning about event feasibleness
Probability, calculation
• symbol – P
• No. of expected eventsP =
No. of all events
• values range 0 – 1:
• 0 – impossible event
• 1 – certain event

3
www.cartoonstock.com
Probability vs. fortune Probability vs. coincidence
www.christianforums.com/
Probability vs. impossibility
population variable
knowledge about population
� ≠ � ≠ �...
Measuring & Research
Variables in research
• all variables in research
• as many of them
• the end of research
• simple → complex (data)
• accuracy (numbers)
• measuring scales
Measurement scales
RATIO
ORDINAL
NOMINAL
INTERVAL

4
Measurement scales
nominal
ordinal
interval
ratio
difference
(equal,
unequal) direction
(lower, greater) quantity
(sum,difference) ratio
(multiply,division)
Error
systematic incidentalsystematic incidental
Population
population variable
sample statistical data
analysis
knowledge on population
SAMPLING
knowlede on sample
Sample
• part of population
• what? who?
• when?
• where?
• size
Sample
• representative
• measurable
• probabilistic
• simple
• system
• stratified
• cluster
Sample
unrelated
related

5
Sampling
www.statehousereport.com
Sampling
MedCalc
Bias (sampling)
• Bias – systemic sampling error
• prevalence bias (Neyman)
• admittance rate bias (Berkson)
• answering rate bias
• etc.
Bias (sampling)
Blinding
• single-blind
• double-blind
• triple-blind
• quadruple-blind
Bias, blinding ☺

6
Control group
• must have
• to be compared with experimental group
• Hawthorn's effect
• research with no control group
• subject changes behavior with a knowledge that is a part of experiment
• subject feels better with knowledge to be a part of experiment
Hypothesis
http://biology.ucf.edu/~pascencio/images/
Hypothesis.jpg
Statistical hypothesis
� elemental statement
� truth or not (false, lie)
� hypothesis testing → finding the truth
Ivana Brlic Mazuranic
How Quest Sought the Truth
(Kako je Potjeh tražio istinu)http://www.bulaja.com/FAIRYTALES/
Statistical hypothesis
� truth � real object stateprobabilistic system:truth → probability
� significant � any occasion other that accidentally:probability → level of significance
Null-hypothesis
No difference
Null-hypothesis
No difference ≈ Not guilty

7
Testing the hypothesis
A. null-hypothesis
B. statistical test
C. level of significance
D. statistics calculation
E. conclusion
A. Hypothesis
• null – H0 – no difference
• alternate – H1 – difference exists
• only one can be truthful
• only one can be accepted, other will be rejected
B. Choosing the test
• measuring scales
• sample• size
• related on unrelated samples
• data distribution• parametric
• nonparametric
• no. of variables
• etc.
Statistical testsScale One sample Two Three or more
related unrelated related unrelated
Nominal binomial McNemar Cohran
chi-square Fisher chi-sqr.
chi-square/
Ordinal Kol.-Smirn. Wilcoxon Friedman
MW p/median
Moses KW
Interval ...
Ratio ...
Paired & unpaired tests Level of significance
• P
�α if defined before statistics
�α – probability of rejecting H0 when H0 = truth
• error α (type I error or false positive error)
• as less as possible
• default values, e.g. P<0,05
8
Statistical errors D. Statistics
• computation...
• P = exact value
• three decimals
P > 0,05
Software Conclusion (E)
• low P� low possibility to reject the truth
• conclusion:
• P < α
• low probability that H0 is true
• reject (not accept) null hypothesis
• accept alternate hypothesis
• statement “...” is truth with P = ...
Yes & No in statistics
• hypothesis = ?
• calculation = ?
• correct data = ?
• all conditions for statistic valid = ?
• no limitations = ?
Example 1: “Not” in correlation
x
y
x
y
x
y
9
lectures students students
quality Zagreb other
well 10 31
bad 0 19
total 10 50
Example 2: “Not” with χ2-test
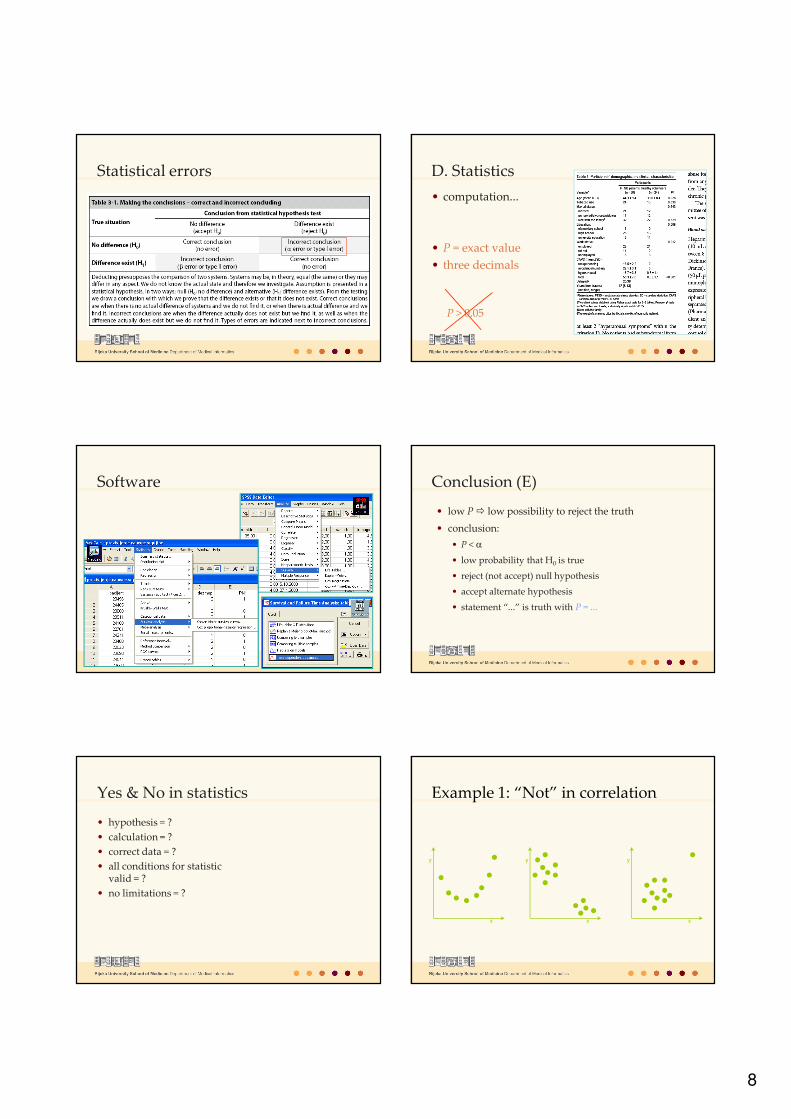
Lupus 2004;14:426
Example 3: Another “not”
ne valja / valja
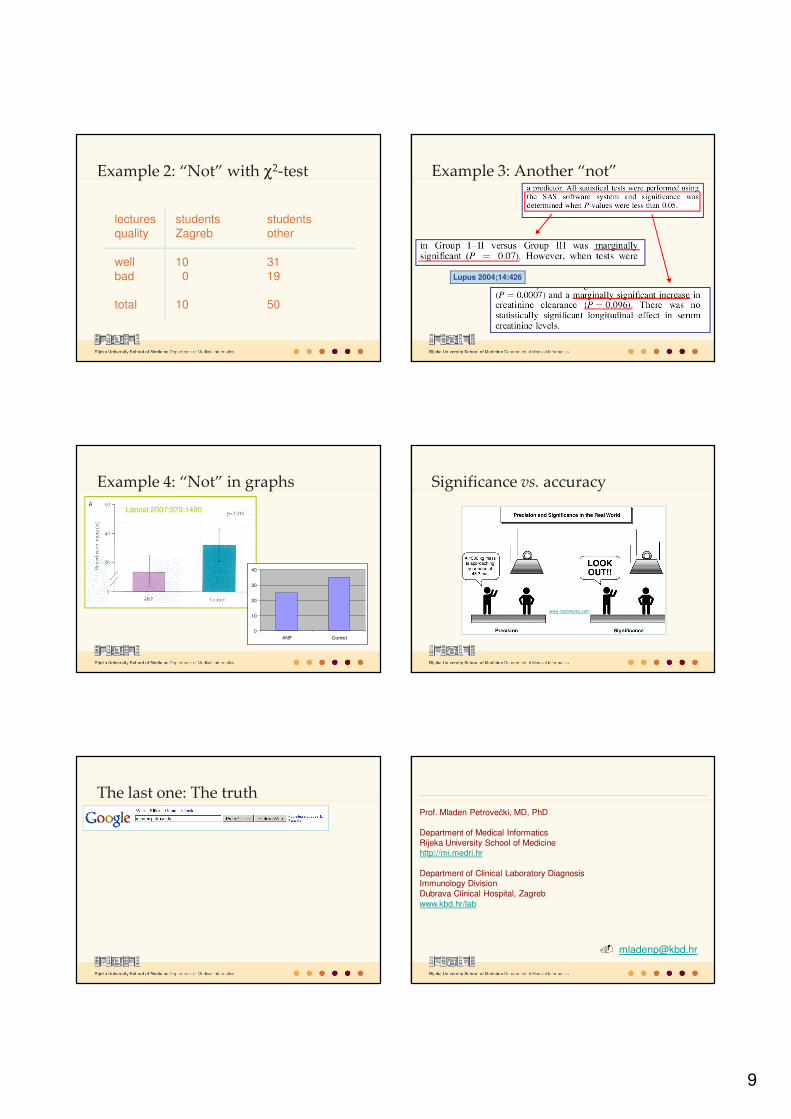
Lancet 2007;370:1490
0
10
20
30
40
ANP Control
Example 4: “Not” in graphs Significance vs. accuracy
www.mathworks.com
The last one: The truthProf. Mladen Petrovečki, MD, PhD
Department of Medical Informatics
Rijeka University School of Medicinehttp://mi.medri.hr
Department of Clinical Laboratory DiagnosisImmunology Division
Dubrava Clinical Hospital, Zagreb
www.kbd.hr/lab
Related Documents


