Medication Adherence in Clinical Research and Associated Methodological Challenges A thesis submitted for the degree of Doctor of Philosophy (Ph.D.) by David Gillespie South East Wales Trials Unit, Centre for Trials Research School of Medicine, College of Biomedical & Life Sciences Cardiff University Submitted – December 2016

Welcome message from author
This document is posted to help you gain knowledge. Please leave a comment to let me know what you think about it! Share it to your friends and learn new things together.
Transcript

Medication Adherence
in Clinical Research and
Associated
Methodological
Challenges
A thesis submitted for the degree of
Doctor of Philosophy (Ph.D.)
by
David Gillespie
South East Wales Trials Unit, Centre for Trials Research
School of Medicine, College of Biomedical & Life Sciences
Cardiff University
Submitted – December 2016

i
Declaration and Statements
DECLARATION
This work has not been submitted in substance for any other degree or award at this or any other
university or place of learning, nor is being submitted concurrently in candidature for any degree
or other award.
Signed: (candidate) Date:
STATEMENT 1
This thesis is being submitted in partial fulfillment of the requirements for the degree of PhD
Signed: (candidate) Date:
STATEMENT 2
This thesis is the result of my own independent work/investigation, except where otherwise
stated. Other sources are acknowledged by explicit references. The views expressed are my own.
Signed: (candidate) Date:
STATEMENT 3
I hereby give consent for my thesis, if accepted, to be available online in the University’s Open
Access repository and for inter-library loan, and for the title and summary to be made available
to outside organisations.
Signed: (candidate) Date:
STATEMENT 4: PREVIOUSLY APPROVED BAR ON ACCESS
I hereby give consent for my thesis, if accepted, to be available online in the University’s Open
Access repository and for inter-library loans after expiry of a bar on access previously approved
by the Academic Standards & Quality Committee.
Not applicable.

ii
It can scarcely be denied that the supreme goal of all
theory is to make the irreducible basic elements as simple
and as few as possible without having to surrender the
adequate representation of a single datum of experience.
— Albert Einstein, 1933 (the likely origin of the famous and aptly paraphrased
maxim “Everything should be made as simple as possible, but not simpler.”)

iii
Acknowledgements
I would like to use this section to express my gratitude to everyone who has either directly or
indirectly helped me throughout my PhD. This work would not have been possible without the
support of these individuals.
First and foremost, I would like to thank my supervisors, Professor Kerry Hood and Dr Daniel
Farewell, for their continuous support throughout this process. While I registered as a PhD
student in July 2013, I first began exploring ideas for doing a PhD with Kerry and Daniel during
the latter part of 2010. We have experienced both the highs of success as well as the lows of
setbacks during this time, and while ultimately the submission of my thesis is down to my own
persistence, I truly appreciate their persistence with me.
A big thank you must go to everyone I work with at the Centre for Trials Research for both
allowing me to devote time and energy towards pursuing a PhD, as well as the reprieve I got by
working on various exciting projects within the unit. A special mention must go to my line
manager Dr Rebecca Cannings-John for her empathetic approach to managing me and intriguing
procrastination tips (I still haven’t spent an afternoon trying to scrape soap residue out of my
washing machine powder drawer yet!)
I will be forever indebted to the support, both professional and personal, from Dr Fiona Lugg.
Her mentorship during the latter stages of my PhD, particularly when I struggled to prioritise
tasks, manage my workload, manage expectations of others around me, and communicate this
with relevant people in a tactful manner, was beyond helpful. Fi would always make time for me
for coffee (Starbucks may see a sharp decrease in profits now this has been submitted), whiskey
sessions (when coffee just wouldn’t cut it), and when I decided to sign up for a marathon she
laced up her trainers and joined me on the occasional training run (including one where I almost

iv
keeled over and died from hypothermia!) Her friendship is truly valued, and this section would
be incomplete without it being mentioned.
Work carried out for this thesis has resulted in the submission of four papers, and publication
of three (one is still under review at the time of writing). I am grateful to my co-authors for helping
to shape my thinking, refine my work, and engaging me in lively discussion about some of my
ideas. In addition to my supervisors, these co-authors are: Professor Christopher Butler, Dr
Angela Casbard, Professor Samuel Coenen, Dr Nick Francis, Professor Herman Goossens, Dr
Anthony Barney Hawthorne, Dr Lucy Brookes-Howell, Dr Chris Hurt, Professor Peter Barrett-
Lee, Professor Paul Little, Mr Mark Mullee, Dr Nick Murray, Professor Christopher Probert,
Ms Rachel Stenson, Dr Beth Stuart, and Professor Theo Verheij.
My wife Vicky and daughters Ava and Phoebe were a constant source of inspiration throughout
my PhD. As a learning disability nurse, Vic has helped keep my focus on doing research that has
practical real-world benefit. She has been very understanding of the long hours and late nights,
and supportive when I’ve lacked headspace or had doubts. Being a dad to Ava and Phoebe is
what I take most pride in, and I hope that this work can be a source of inspiration to them. It
may take them a few years to understand that I’m not a proper doctor, though I’m sure in the
meantime they will enjoy the endless games of doctors we play together with someone who is
actually called Dr Gillespie. I need to express how lucky I am to have Vic, Ava, and Phoebe in
my life, and how thankful I am for them putting up with me.
Another special mention goes to my mum. Her caring nature, courage, and strong work ethic
are traits I can only aspire to. She has supported me so well and has always willed me to achieve
my potential, while ensuring I remain grounded. Thank you, mum.
Finally, I would like to dedicate this work to Robert Healan and my Dad Norman; the two people
who occupy most of my counterfactual thoughts. I hope they would be proud of me.

v
Preface
I have written this thesis as a staff candidate while working full-time in the South East Wales
Trials Unit (SEWTU). My original intention was to accumulate a sufficient number of
publications around the theme of medication adherence, with a specific focus on methodological
challenges, and submit for a PhD by published works. However, I registered to submit via the
normal thesis route, assuming I could switch pathway later down the line (thus reaping the
benefits that being a student brings for as long as possible), only to find out that this was something
against regulations. Thus, following my first year, I had published one paper, was well on my way
to publishing another, but found myself at risk of lacking a coherent thesis. I took stock, planned
thesis chapters that coherently linked the work in my planned papers, and while I continued to
write papers as a priority over my thesis during my second year, I had a much better
understanding of how it would all fit together.
During this whole process, I did not stray from who I was as a researcher; an applied statistician
with a passion for high quality evidence using the best available research methods, and a desire
to communicate directly with end users.
As an applied researcher working in a clinical trials unit, I saw (and continue to see) a lot of
methods and techniques recommended out of convenience and tradition, rather than the most
rigorous, cutting edge methods that could be used in a given situation. In my opinion, this is often
due to time constraints – to take a technique that has had its theoretical principles documented
in a technical journal and translate that into an approach that can be feasibly applied, reported,
and communicated during the analysis and reporting phase of a trial can take time that an applied
researcher may not have. It is my intention that this thesis, and the publications that are produced
from it, will aid the applied researcher to readily adopt the findings and recommendations from
this work.
vi
Why write a thesis on the subject of medication adherence?
In short, I like to tackle problems that are both challenging and yield solutions that are of practical
use. I have worked on a variety of studies during almost a decade working in SEWTU. Early on,
I developed a keen interest in missing data and bias arising from nonresponse. To me,
medication adherence is a missing data problem and more. Measuring adherence presents a
challenge in itself – I was fortunate to work on a trial early in my career where medication
adherence was measured in a variety of ways. It was the first time I really had to think about some
fundamental issues around this topic – “What if participants don’t take their medication as
prescribed?” “What is the best way of measuring whether or not they are?” “Should several
measures be used, and if so, what if they don’t agree?” The consequences of poor adherence
also fascinated me early on. One of the clinical areas in which I specialise is infections treated in
primary care; an area within which antibiotic prescribing is rife and the consequences of antibiotic
resistance are a real concern. There is a strong drive to reduce antibiotic use, particularly for self-
limiting infections. However, the theoretical relationship between poor use of antibiotics and
antibiotic resistance is an area that is, I believe, underappreciated. Through the dissemination of
the work presented throughout this thesis, particularly through an international network of
primary care infections researchers (the General Practitioners’ Research in Infections Network,
or GRIN), I have raised the profile of the problem of adherence to antibiotic treatment, and have
engaged leading clinicians in discussion around this topic.
Being awarded with a PhD will allow me to progress onto the next stage of my career, which will
focus on me developing as an independent researcher. I intend to take the work I have carried
out here and apply for funding to conduct high quality research, addressing questions of
importance to clinicians treating patients, policy makers deciding on the value of medication, and
applied researchers looking to use the most appropriate methods to answer their questions.
- David Gillespie, Cardiff 2016
vii
Table of Contents
Declaration and Statements ..................................................................................... i
DECLARATION ....................................................................................................................................... i
STATEMENT 1 ........................................................................................................................................ i
STATEMENT 2 ........................................................................................................................................ i
STATEMENT 3 ........................................................................................................................................ i
STATEMENT 4: PREVIOUSLY APPROVED BAR ON ACCESS ................................................... i
Acknowledgements ................................................................................................ iii
Preface .................................................................................................................... v
Table of Contents .................................................................................................. vii
List of Tables and Figures ....................................................................................... x
List of Tables in Chapters 1 to 7 ............................................................................................................... x
List of Figures in Chapters 1 to 7 ........................................................................................................... xiii
Summary ............................................................................................................. xvi
Glossary of Abbreviations ................................................................................... xvii
CHAPTER 1: Background........................................................................................ 1
1.1 The importance of medication adherence .........................................................................................1
1.2 Medication adherence in clinical research .........................................................................................3
1.3 Methodological challenges in medication adherence ........................................................................4
1.4 Aim of thesis ........................................................................................................................................6
1.5 Thesis synopsis ....................................................................................................................................6
CHAPTER 2: Summary and Appraisal of Key Literature on the Methodological
Issues of Medication Adherence in Clinical Research .............................................. 7
2.1 Introduction .........................................................................................................................................7
2.2 Type of literature review ......................................................................................................................7
2.3 Search strategies ...................................................................................................................................8
2.4 Topic 1: The Measurement of Medication Adherence .................................................................. 11
2.4.1 Search Results ............................................................................................................................ 11
2.4.2 Findings ...................................................................................................................................... 11
2.5 Topic 2: Understanding Risk Factors for Non-Adherence to Medication..................................... 24
2.5.1 Search Results ............................................................................................................................ 24
2.5.2 Findings ...................................................................................................................................... 27
2.6 Topic 3: Adjusting Findings of Randomised Controlled Trials for Medication Non-Adherence:
The Use of Randomisation-Based Efficacy Estimators ......................................................................... 31
2.6.1 Search Results ............................................................................................................................ 31
2.6.2 Findings ...................................................................................................................................... 31
2.7 Review of Top Medical Journals ...................................................................................................... 34
viii
2.7.1 Search Results ............................................................................................................................ 34
2.7.2 Findings ...................................................................................................................................... 36
2.8 AMSTAR checklist scores and implications ................................................................................... 39
2.9 Summary ........................................................................................................................................... 40
2.10 Studies included in Topic 1 ........................................................................................................... 42
2.11 Studies included in Topic 2 ........................................................................................................... 48
2.12 Studies included in Topic 3 ........................................................................................................... 51
2.13 Studies included in review of top medical journals ....................................................................... 53
CHAPTER 3: Description of Data Sources ............................................................. 62
3.1 Introduction ...................................................................................................................................... 62
3.2 GRACE ............................................................................................................................................. 62
3.2.1 GRACE WP8 observational study ........................................................................................... 66
3.2.2 GRACE WP9 observational study ........................................................................................... 67
GRACE WP10a placebo-controlled trial .......................................................................................... 68
CODA ..................................................................................................................................................... 70
ZICE ........................................................................................................................................................ 73
Summary ................................................................................................................................................. 74
CHAPTER 4: Measuring Medication Adherence in Clinical Research: Correlation,
Agreement, and Calibration Techniques ................................................................ 76
4.1 Introduction ...................................................................................................................................... 76
4.2 Methods ............................................................................................................................................ 77
4.2.1 Adherence definitions, summary measures, and assumptions ................................................ 77
4.2.2 Longitudinal modelling of electronic monitoring data ............................................................. 79
4.2.3 Comparing different types of measures .................................................................................... 81
4.3 Results ............................................................................................................................................... 92
4.3.1 Available data ............................................................................................................................. 92
4.3.2 Summary measures of adherence ............................................................................................. 94
4.3.3 Longitudinal modelling of electronic monitoring data (CODA) ............................................. 96
4.3.4 Comparing different types of measures .................................................................................. 101
4.4 Discussion ....................................................................................................................................... 122
4.4.1 Summary .................................................................................................................................. 122
4.4.2 Learning points ........................................................................................................................ 123
CHAPTER 5: Determinants of Non-adherence to Medication: A Comparison among
Different Clinical Conditions and Study Designs ................................................. 127
5.1 Introduction .................................................................................................................................... 127
5.2 Methods .......................................................................................................................................... 128
5.2.1 Description of candidate determinants ................................................................................... 128
5.2.2 Definitions of adherence ......................................................................................................... 133
ix
5.2.3 Modelling ................................................................................................................................. 137
5.3 Results ............................................................................................................................................. 139
5.3.1 CODA ..................................................................................................................................... 139
5.3.2 ZICE ........................................................................................................................................ 144
5.3.3 GRACE .................................................................................................................................... 149
5.4 Discussion ....................................................................................................................................... 175
5.4.1 Summary .................................................................................................................................. 175
5.4.2 Learning points ........................................................................................................................ 175
CHAPTER 6: Adjusting Findings of Randomised Controlled Trials for Medication
Non-Adherence: The Use of Randomisation-Based Efficacy Estimators ............... 179
6.1 Introduction .................................................................................................................................... 179
6.2 Methods .......................................................................................................................................... 180
6.2.1 Randomised Controlled Trials and their importance for inferring causal treatment effects 180
6.2.2 Estimating treatment effectiveness in RCTs ........................................................................... 183
6.2.3 Traditional methods for estimating treatment efficacy in RCTs ........................................... 184
6.2.4 Randomisation-based efficacy estimators ............................................................................... 185
6.2.5 Modelling RBEEs in a two-arm placebo-controlled superiority trial .................................... 190
6.2.6 Modelling RBEEs in non-inferiority trials with two active treatments ................................... 191
6.3 Results ............................................................................................................................................. 196
6.3.1 RBEEs in superiority trials: analysis of the GRACE WP10a trial ......................................... 196
6.3.2 RBEEs in non-inferiority / active control trials ...................................................................... 205
6.4 Discussion ....................................................................................................................................... 217
6.4.1 Summary .................................................................................................................................. 217
6.4.2 Learning points ........................................................................................................................ 217
CHAPTER 7: Discussion ..................................................................................... 222
7.1 Summary and interpretation of findings ........................................................................................ 222
7.2 Novel aspects of this work .............................................................................................................. 231
7.3 Limitations ...................................................................................................................................... 233
7.4 Comparisons to existing literature .................................................................................................. 237
7.5 Methodological and clinical implications....................................................................................... 238
7.6 Further areas for research .............................................................................................................. 243
7.7 Concluding remarks ....................................................................................................................... 245
REFERENCES .................................................................................................... 246
Appendices ......................................................................................................... 283
x
List of Tables and Figures
List of Tables in Chapters 1 to 7
Table 2.1: Findings from the initial search for Topic 1 12
Table 2.2: Findings from the initial search for Topic 2 25
Table 2.3: Findings from the initial search for Topic 3 33
Table 2.4: Findings from the initial search for the review of top medical journals 35
Table 3.1: Outline of GRACE work packages 64
Table 3.2: Comparison of eligibility criteria for the GRACE WP8, WP9, and WP10a
studies 69
Table 4.1: Types of medication adherence measures available across the CODA and
GRACE studies 79
Table 4.2: Descriptions and visualisations of correlation coefficients 82
Table 4.3: Summary statistics of medication adherence data in the CODA study 95
Table 4.4: Summary statistics of medication adherence data in the GRACE WP10a
study 96
Table 4.5: Estimated daily adherence over time from a two-level generalised linear
mixed model with time modelled as a cubic B-spline (based on 14,863 days nested
within 58 participants)
98
Table 4.6: Correlation coefficients for different types of adherence measures in the
CODA study 102
Table 4.7: Correlation coefficients for different types of adherence measures in the
GRACE WP10a study 103
Table 4.8: Percentage of observed agreement between dichotomous measures of
adherence in the CODA study (kappa in brackets) 106
Table 4.9: Percentage of observed agreement between dichotomous measures of
adherence in the GRACE WP10a study (kappa in brackets) 109
Table 4.10: Observed disagreement between adherence as measured using self-
reported diaries and tablet counts in the GRACE WP10a study 112
Table 4.11: Direction of disagreement between adherence as measured using self-
reported diaries and tablet counts in the GRACE WP10a study 112
Table 4.12: Multivariable two-level logistic regression model of associations between
participant/illness characteristics and disagreement between self-reported diary and
tablet count adherence measures
114
Table 4.13: Univariable associations between participant and illness characteristics and
the direction of disagreement 116
xi
Table 4.14: Multivariable multinomial logistic regression model of associations
between participant/illness characteristics and the direction of disagreement between
self-reported diary and tablet count adherence measures
117
Table 4.15: Association between clinician-rated symptom severity score at baseline and
differences between adherence as rated via self-reported diaries and tablet counts 120
Table 4.16: Association between days waited prior to consulting and differences
between adherence as rated via self-reported diaries and tablet counts 120
Table 4.17: Summary of reporter classifications and mean differences within each
classification 122
Table 4.18: Summary statistics for different types of calibrated adherence measures 122
Table 5.1: Univariable analysis of determinants of adherence to mesalazine based on
self-report data 139
Table 5.2 Logistic regression model of the odds of adhering to mesalazine based on
self-report data 140
Table 5.3: Univariable analysis of determinants of adherence to mesalazine based on
tablet count data 141
Table 5.4: Univariable analysis of determinants of adherence to mesalazine based on
electronic monitoring data 143
Table 5.5: Multivariable logistic regression model of the odds of adhering to
mesalazine based on electronic monitoring data 143
Table 5.6: Adherence to treatment in the ZICE trial based on a combined summary
measure and separated into different elements (initiation and implementation) 144
Table 5.7: Univariable analysis of determinants of adherence to treatment in the ZICE
trial 145
Table 5.8: Univariable analysis of determinants of initiation of treatment in the ZICE
trial 147
Table 5.9: Participant and illness characteristics by study 151
Table 5.10: Amoxicillin prescription characteristics by study 154
Table 5.11: Healthcare setting characteristics of participants in the GRACE studies 156
Table 5.12: Hierarchy selection for a logistic regression model of adherence to
amoxicillin based on a combined summary measure 158
Table 5.13: Univariable analysis of determinants of adherence to amoxicillin based on
a combined summary measure 159
Table 5.14: Three-level logistic regression model of the odds of adhering to
amoxicillin based on a combined summary measure 160
Table 5.15: Hierarchy selection for a logistic regression model of initiation of
amoxicillin 161
xii
Table 5.16: Univariable analysis of determinants of initiation of amoxicillin 161
Table 5.17: Multivariable logistic regression model investigating the determinants of
initiation of amoxicillin 163
Table 5.18: Hierarchy selection for a logistic regression model of implementation of
amoxicillin 164
Table 5.19: Univariable analysis of determinants of implementation of amoxicillin 164
Table 5.20: Four-level logistic regression model investigating the determinants of
implementation of amoxicillin 167
Table 5.21: Univariable analysis of determinants of time to discontinuation of
amoxicillin 169
Table 5.22: Cox proportional hazards model of time from initiation to discontinuation
of amoxicillin 170
Table 5.23: Cox proportional hazards model of time from initiation to discontinuation
of amoxicillin 171
Table 6.1: Baseline characteristics of GRACE WP10a trial participants 197
Table 6.2: Levels of adherence to study medication used for statistical analyses (with
the minimum value reported when participants had more than one type of measure) 198
Table 6.3: Descriptive statistics of the three outcome measures 199
Table 6.4: Comparison of effectiveness and efficacy of amoxicillin for acute
uncomplicated LRTI in primary care 202
Table 6.5: Efficacy analyses with binary definitions of adherence (for sensitivity) 203
Table 6.6: Efficacy analysis with missing adherence data imputed as 0% 204
Table 6.7: Multivariable determinants of relapse in the CODA trial (odds of relapsing
during the 12 follow-up period) 207
Table 6.8: Multivariable determinants of adhering to medication in the CODA trial 208
Table 6.9: Multivariable determinants of outcome in the ZICE trial (odds of
experiencing a skeletal-related event during the first 12 months) 211
Table 6.10: Multivariable determinants of adhering to medication in the ZICE trial 213
Table 7.1: Overlap between determinants of adherence and determinants of
disagreement between different types of adherence measures for participants in the
GRACE studies
228
xiii
List of Figures in Chapters 1 to 7
Figure 2.1: Flow diagram outlining search strategies 10
Figure 2.2: Diagram illustrating the flow of papers from identification to review
(Topic 1) 13
Figure 2.3: Diagram of the different types of indirect adherence measures described
during this literature review (with summary measures in green) 19
Figure 2.4: Diagram illustrating the flow of papers from identification to review
(Topic 2) 26
Figure 2.5: Diagram illustrating the flow of papers from identification to review
(Topic 3) 34
Figure 2.6: Diagram illustrating the flow of papers from identification to review (Top
Medical Journals) 36
Figure 3.1: Map of Europe indicating primary care networks involved in the GRACE
project 63
Figure 3.2: Example of self-report medication use questions taken from the GRACE
WP8 diary 66
Figure 3.3: Example of a MEMS container 72
Figure 4.1: Scatter plot of two simulated variables showing perfect correlation but no
agreement 83
Figure 4.2: Example of a Bangdiwala observed agreement chart for two binary
measures of adherence 84
Figure 4.3: Example of an extended Bangdiwala agreement chart for two binary
measures of adherence (with chance agreement also illustrated) 85
Figure 4.4: Example of a Bland-Altman plot of the comparison of adherence as
measured by measure 3 (M3) and measure 4 (M4) 86
Figure 4.5: Example of an extended Bland-Altman plot of the comparison of
adherence as measured by M3 and M4 (with boundaries marked) 87
Figure 4.6: Availability of the different types of medication adherence measures for
participants in the CODA study 93
Figure 4.7: Availability of the different types of medication adherence measures for
participants in the GRACE WP10a study 94
Figure 4.8: Estimated medication adherence probabilities over time (using the
MEMS cap data) 99
Figure 4.9: Percentage of days participants adhered to regimen for each day of the
week split by allocated regimen 100
Figures 4.10: Percentage of days that participants adhered to regimen during clinic
visit periods and non-clinic visit periods split by allocated regimen 100
xiv
Figure 4.11: Scatter plot comparing medication adherence as measured quantitatively
using electronic monitoring and tablet counts (dashed line represents the line of
perfect agreement)
101
Figures 4.12a to 4.12e: Scatter plots comparing medication adherence as measured
via self-reported diaries, tablet counts, and self-reported telephone (plots d and e
include identical data to those in a and b respectively, with jittering and semi-
transparency used to indicate the extent of over plotting)
104
Figures 4.13a to 4.13f: Extended observed agreement charts for dichotomous
measures of adherence in the CODA study 107
Figure 4.14: Extended Bland-Altman plot investigating the agreement between
electronic monitoring and tablet count adherence measures in the CODA study 108
Figures 4.15a and 4.15b: Extended observed agreement charts for dichotomous
measures of adherence in the GRACE WP10a study 110
Figures 4.16a and 4.16b: Extended Bland-Altman plots investigating the agreement
between self-reported diary, tablet count, and self-reported telephone adherence
measures in the GRACE WP10a study
111
Figure 4.17: Histogram of the difference between adherence as measured using self-
reported diaries and tablet counts 113
Figures 4.18a to 4.18c: Residual plots from linear mixed model of difference
between self-report 119
Figure 5.1: The five dimensions of adherence (from Sabaté, 2003) 128
Figure 5.2: Candidate determinants available for the CODA, ZICE, and GRACE
studies 132
Figure 5.3: Levels of adherence to mesalazine by type of measure and allocated
regimen 142
Figure 5.4: Flow diagram showing data from all three GRACE studies used in this
Chapter 149
Figure 5.5: Forest plot illustrating the odds ratios and 95% confidence intervals for
the initiation model for each individual study and overall 172
Figure 5.6: Forest plot illustrating the odds ratios and 95% confidence intervals for
the implementation model for each individual study and overall 173
Figure 5.7: Forest plot illustrating the hazard ratios and 95% confidence intervals for
the discontinuation model for each individual study and overall 174
Figure 6.1: Illustration of an individual-level treatment effect 181
Figure 6.2: Illustration of a population-level (average) treatment effect from a
randomised experiment 182
Figure 6.3: Confidence intervals illustrating some conclusions drawn from different
study designs 183
xv
Figure 6.4: Illustration of a per-protocol analysis 185
Figure 6.5: Illustration of randomisation-based efficacy estimator (green ticks
correspond to those who would adhere to treatment if allocated to it) 186
Figure 6.6: Causal Directed Acyclic Graph (DAG) illustrating the use of
randomisation as an instrument to derive a randomisation-respecting estimate of
treatment efficacy
187
Figure 6.7: Causal DAG illustrating the IV approach to deriving randomisation-
respecting treatment efficacy with two active treatments 189
Figure 6.8: CONSORT flow diagram for participants in the GRACE WP10a trial 196
Figure 6.9: Proportion of participants at each adherence level (with the minimum
value reported when participants had more than one type of measure) 198
Figure 6.10: Graphical illustration of the effectiveness and efficacy of amoxicillin on
mean symptom severity on days two to four 201
Figure 6.11: Flow diagram describing data available for each type of analysis in the
CODA trial 206
Figure 6.12: Forest plot of the difference in relapse rates in the CODA trial for
various analysis sets 209
Figure 6.13: Flow diagram describing data available for each type of analysis in the
ZICE trial 210
Figure 6.14: Forest plot of the difference in the proportion with SRE in the first 12
months in the ZICE trial for various analysis sets 215
Figure 6.15 Impact of missing data on the interpretation of the SMM analysis 216
Figure 7.1: Graphical illustration of the effectiveness and efficacy of amoxicillin on
mean symptom severity on days two to four 230
xvi
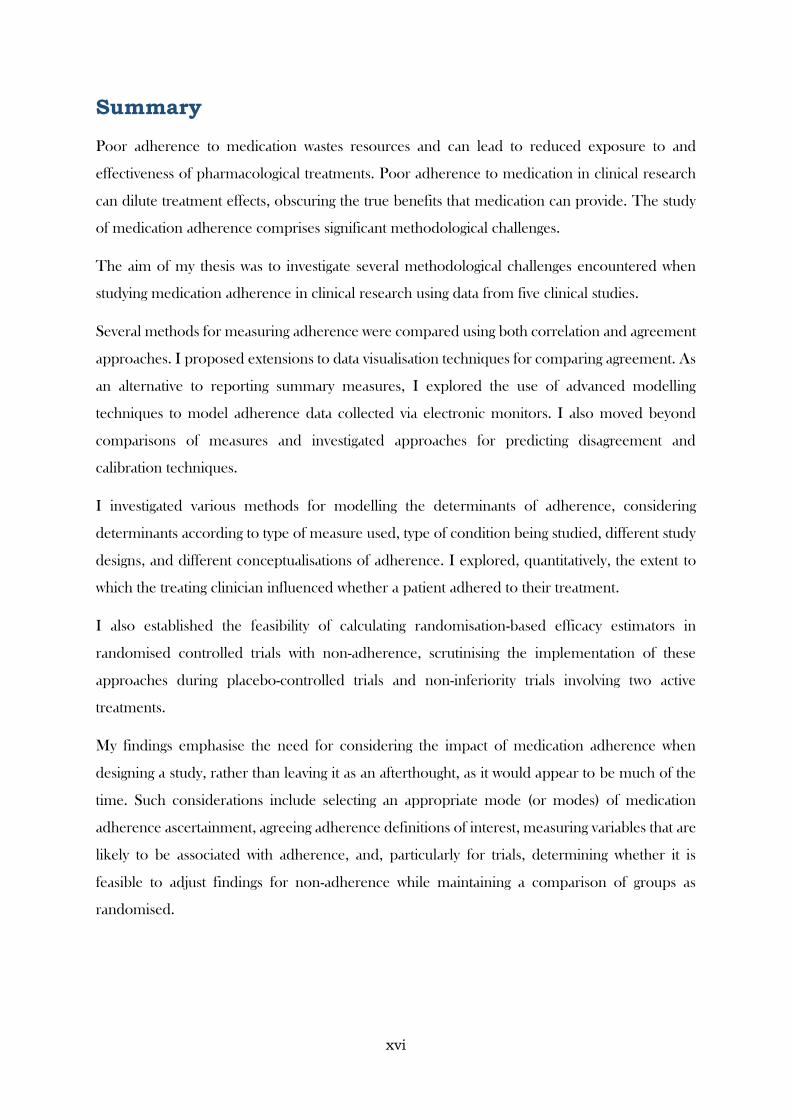
Summary
Poor adherence to medication wastes resources and can lead to reduced exposure to and
effectiveness of pharmacological treatments. Poor adherence to medication in clinical research
can dilute treatment effects, obscuring the true benefits that medication can provide. The study
of medication adherence comprises significant methodological challenges.
The aim of my thesis was to investigate several methodological challenges encountered when
studying medication adherence in clinical research using data from five clinical studies.
Several methods for measuring adherence were compared using both correlation and agreement
approaches. I proposed extensions to data visualisation techniques for comparing agreement. As
an alternative to reporting summary measures, I explored the use of advanced modelling
techniques to model adherence data collected via electronic monitors. I also moved beyond
comparisons of measures and investigated approaches for predicting disagreement and
calibration techniques.
I investigated various methods for modelling the determinants of adherence, considering
determinants according to type of measure used, type of condition being studied, different study
designs, and different conceptualisations of adherence. I explored, quantitatively, the extent to
which the treating clinician influenced whether a patient adhered to their treatment.
I also established the feasibility of calculating randomisation-based efficacy estimators in
randomised controlled trials with non-adherence, scrutinising the implementation of these
approaches during placebo-controlled trials and non-inferiority trials involving two active
treatments.
My findings emphasise the need for considering the impact of medication adherence when
designing a study, rather than leaving it as an afterthought, as it would appear to be much of the
time. Such considerations include selecting an appropriate mode (or modes) of medication
adherence ascertainment, agreeing adherence definitions of interest, measuring variables that are
likely to be associated with adherence, and, particularly for trials, determining whether it is
feasible to adjust findings for non-adherence while maintaining a comparison of groups as
randomised.
xvii
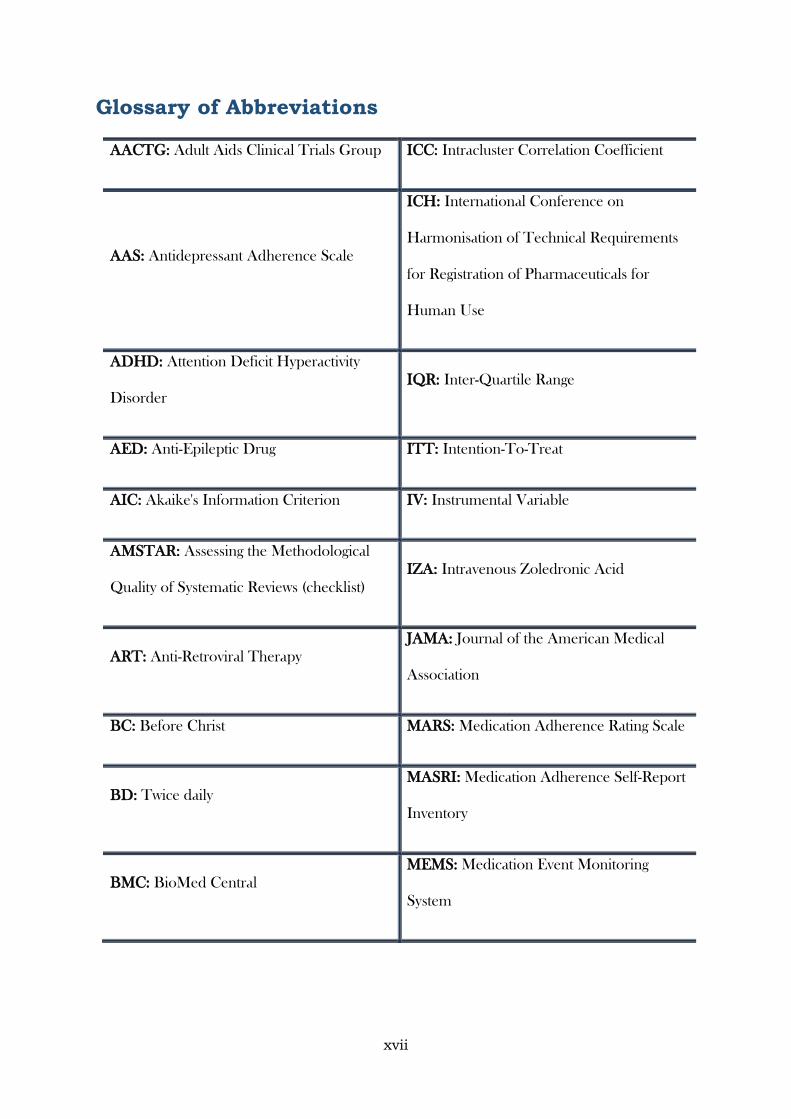
Glossary of Abbreviations
AACTG: Adult Aids Clinical Trials Group ICC: Intracluster Correlation Coefficient
AAS: Antidepressant Adherence Scale
ICH: International Conference on
Harmonisation of Technical Requirements
for Registration of Pharmaceuticals for
Human Use
ADHD: Attention Deficit Hyperactivity
Disorder
IQR: Inter-Quartile Range
AED: Anti-Epileptic Drug ITT: Intention-To-Treat
AIC: Akaike's Information Criterion IV: Instrumental Variable
AMSTAR: Assessing the Methodological
Quality of Systematic Reviews (checklist)
IZA: Intravenous Zoledronic Acid
ART: Anti-Retroviral Therapy
JAMA: Journal of the American Medical
Association
BC: Before Christ MARS: Medication Adherence Rating Scale
BD: Twice daily
MASRI: Medication Adherence Self-Report
Inventory
BMC: BioMed Central
MEMS: Medication Event Monitoring
System
xviii
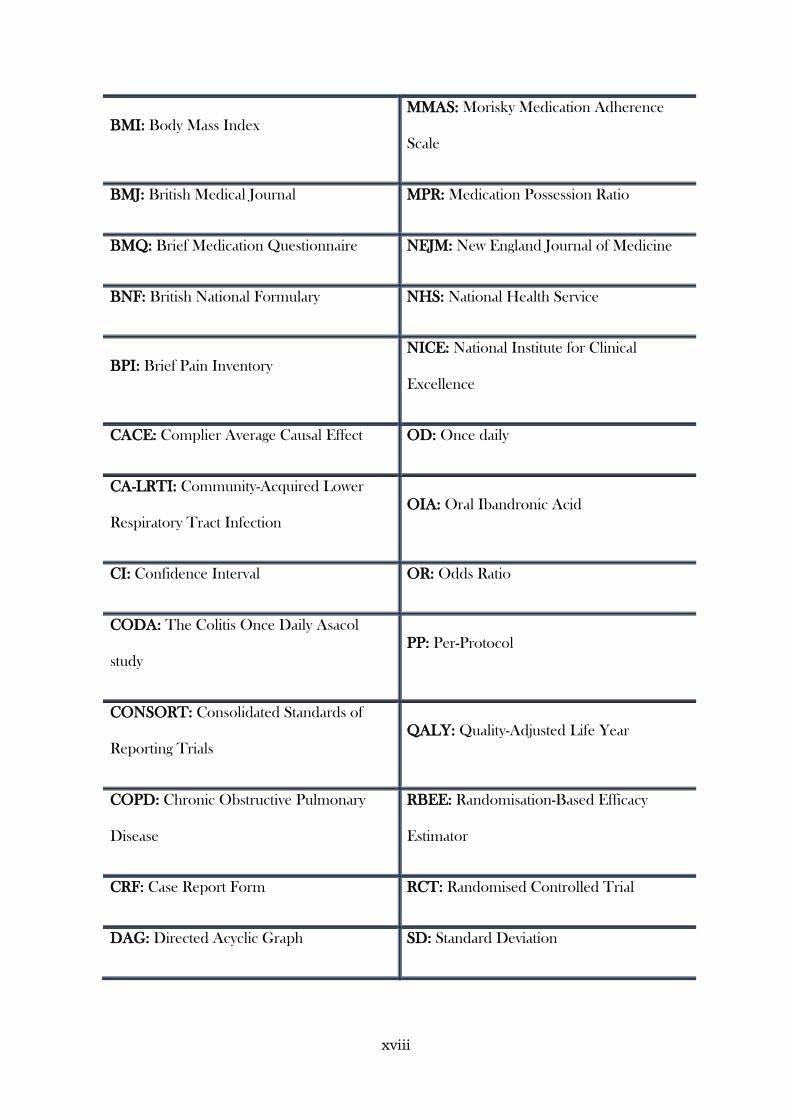
BMI: Body Mass Index
MMAS: Morisky Medication Adherence
Scale
BMJ: British Medical Journal MPR: Medication Possession Ratio
BMQ: Brief Medication Questionnaire NEJM: New England Journal of Medicine
BNF: British National Formulary NHS: National Health Service
BPI: Brief Pain Inventory
NICE: National Institute for Clinical
Excellence
CACE: Complier Average Causal Effect OD: Once daily
CA-LRTI: Community-Acquired Lower
Respiratory Tract Infection
OIA: Oral Ibandronic Acid
CI: Confidence Interval OR: Odds Ratio
CODA: The Colitis Once Daily Asacol
study
PP: Per-Protocol
CONSORT: Consolidated Standards of
Reporting Trials
QALY: Quality-Adjusted Life Year
COPD: Chronic Obstructive Pulmonary
Disease
RBEE: Randomisation-Based Efficacy
Estimator
CRF: Case Report Form RCT: Randomised Controlled Trial
DAG: Directed Acyclic Graph SD: Standard Deviation

xix
DAI: Drug Attitude Inventory SMM: Structural Mean Model
DDD: Defined Daily Dose SRE: Skeletal Related Event
EORTC QLQ-C30: European Organisation
for Research and Treatment of Cancer
Quality of Life Questionnaire Core version
TDS: Three times daily
ESAC: European Surveillance of
Antimicrobial Consumption Network
UC: Ulcerative Colitis
ESPACOMP: European Society for Patient
Adherence, Compliance, and Persistence
UK: United Kingdom
GLMM: Generalised Linear Mixed Model US: United States (of America)
GP: General Practitioner WHO: World Health Organisation
GRACE: Genomics to combat Resistance
against Antibiotics in Community-acquired
lower respiratory tract infection in Europe
WP: Work Package
HIV: Human Immunodeficiency Virus
ZICE: The Zoledronate versus Ibandronate
Comparative Evaluation
HR: Hazard Ratio
1
CHAPTER 1: Background
1.1 The importance of medication adherence
The consumption of medication has long been recognised as a topic of great importance,
concern, and complexity. (Osterberg and Blaschke, 2005)
It is an issue that was recognised by Hippocrates during the 4th century B.C., when he remarked
“Keep a watch…on the faults of the patients, which often make them lie about the taking of things
prescribed. For through not taking disagreeable drinks, purgative or other, they sometimes die.”
The phenomena has even been documented in religious texts. In one of the first stories in the
Old Testament, God commanded Adam and Eve not to eat from the tree of knowledge of good
and evil, for if they did they would most certainly die. However, despite this warning, they still
ate from the tree. Relating this to the consumption of medication, this illustrates how we (as
human beings) are susceptible to making decisions that are clearly irrational – such as avoiding
taking medication that we have been prescribed, even when this medicine has demonstrable
therapeutic benefits.
More recently, a report published by the World Health Organization indicated that adherence
(which they define as the extent to which a person’s behaviour corresponds with agreed
recommendations from a health care provider) to long-term therapies is around 50% in
developed countries and much lower in developing countries, where health resources may be
scarce, and access to health care may not be universal. (Sabaté, 2003) The report also suggested
that “increasing the effectiveness of adherence interventions may have a far greater impact on the
health of the population than any improvement in specific medical treatments”, and that
adherence is a multifaceted problem, with patients requiring support and not blame. These
aspects demonstrate the importance that is placed on this topic and development of the field.
2
Poor adherence to medication can lead to reduced exposure to and effectiveness of
pharmacological treatments. The often quoted observation from US surgeon general C. Everett
Koop that “drugs don’t work in patients who don’t take them” highlights this issue succinctly.
The clinical impact of poor adherence varies depending on the extent to which the medicine was
not taken as recommended, the condition for which the medicine was prescribed, and the
therapeutic window (or forgivingness) of the medicine.
For example, early discontinuation and non-adherence to adjuvant hormonal therapy has been
associated with increased mortality in women with breast cancer. (Hershman et al., 2011) With
cancer being a common and severe life threatening condition, it often comes as a shock to both
the public and healthcare professionals alike that non-adherence is an issue for patients with this
condition. However, as remarked at an international conference on patient adherence,
compliance, and persistence by a presenter who herself lives with chronic myeloid leukaemia
“This is cancer. Of course my patient is taking their medicine!” is often a misled assumption.
(Pelouchova, 2015)
For patients with the human immunodeficiency virus (HIV), high levels of adherence to
antiretroviral therapy (e.g. ≥95%) plays a critical role in the long-term suppression of viral load.
(Paterson et al., 2000) Sub-optimal levels of adherence are associated with the development of
resistance, which not only affects the therapeutic nature of treatment in the individual, but can
also be transmitted to others. (Wainberg and Friedland, 1998) Non-adherence is also associated
with an increased risk of the virus progressing to aids and also mortality. (Bangsberg et al., 2001)
The consequences of non-adherence to anti-epileptic drugs (AEDs) in people with epilepsy are
variable. While in some individuals the impact can be to increase seizure frequency, (Cramer et
al., 2002) with the effects immediate in some instances, there are individuals who do not adhere
to AEDs and experience no apparent ill effects and also some who adhere perfectly but continue
to have an increase in seizure frequency. (Shope et al., 1988)
3
Moving to more acute conditions, poor adherence to antibiotics, that are appropriately
prescribed for common infections in primary care, has the potential to reduce their effectiveness
(e.g. delay recovery, increase the risk of complications, recurrence, re-consultations). (Daschner
and Marget, 1975) There is also the theoretical possibility that poor adherence to antibiotics
could result in infecting bacteria being exposed to sub-optimal levels of treatment; creating an
environment that promotes antibiotic resistance. (Vrijens and Urquhart, 2005)
While the link between poor medication adherence and clinical outcomes has been disputed,
what cannot be disputed is the cost associated with poor adherence. In 2010, a report published
evaluating the scale, causes, and costs of wasted medicine found that the gross annual cost of
NHS primary and community care prescription medicines wastage in England was approximately
£300 million per annum. (Trueman et al., 2010) Combined with the cost borne out of medication
adherence-related hospital admissions, (McDonnell and Jacobs, 2002) it is evident that improper
use of medication places a substantial financial burden on healthcare systems.
1.2 Medication adherence in clinical research
In clinical research, non-adherence to medication can reduce the perceived impact of treatments.
For example, in a two-arm randomised placebo-controlled trial, treatment effects estimated by
comparing outcomes in each of the arms using the intention-to-treat principle (the gold standard
principle for comparing outcomes in randomised controlled trials) will provide a diluted estimate
of the true effect of treatment in the presence of non-adherence. (Hernán and Hernández-Díaz,
2012) While this estimate will still provide useful insight into the effectiveness of treatment at a
population level, it does not help the individual who might be interested in knowing the likely
effects they will have, good or bad, should they take their medicine as prescribed.
Medication non-adherence during the early phase drug trials, where the goal is to demonstrate
the efficacy of a therapy, has the potential to adversely impact on the drug development process,
4
and consequentially could mean that some medicines that truly are efficacious are not taken
forward to later phases and given regulatory approval. (McCann et al., 2015)
The impact of non-adherence to treatment also impacts more than the interpretation of the
statistical analysis of trial outcomes. It is common for trials to include a health economic
component, usually to demonstrate that a treatment is not only effective, but is also cost effective
(that is, the health expected to be gained from a treatment exceeds the health likely to be forfeited
through the movement of resources of other health service activities). (Drummond et al., 2015)
In the UK, the National Institute for Clinical Excellence (NICE) threshold for cost effectiveness
is up to £30,000 per quality-adjusted life year (QALY), which is a measure of health that
combined length and quality of life. (NICE, 2012) Non-adherence to treatments in clinical
research has the potential to move a treatment from being cost-effective, and therefore
recommended by NICE, to not being cost-effective and not recommended. (Brilleman et al.,
2016) This has a direct impact on the care that a patient can receive in the National Health
Service (NHS), and therefore demonstrates the importance of the study of medication adherence
in clinical research.
Interventions aimed at improving adherence to medication is an area of clinical research in itself.
There exists a plethora of interventions, based on various health and psychological models of
behaviour change, that have been trialled. (Nieuwlaat et al., 2014) While some have been shown
to be successful in improving adherence to medication, the majority to date have failed to
demonstrate that this improvement led to a clinically important improvement in clinical
outcomes.
1.3 Methodological challenges in medication adherence
The study of medication adherence comprises significant methodological challenges.
5
Obtaining an accurate measurement of whether an individual has taken their medication as
prescribed is difficult. (Farmer, 1999) Several types of measures are commonplace in research
(for example, self-report, tablet counts, blood monitoring, and electronic monitoring), but all are
indirect, relying on assumptions of varying strength and plausibility. These measures also vary in
the quality and wealth of data they can provide, and also the extent to which they can be subject
to bias. (Norell, 1981, Cramer and Mattson, 1991, Matsui et al., 1994, Vitolins et al., 2000)
Variation in the literature regarding the quantification and conceptualisation of adherence has
led to confusion, ambiguity, and inconsistent reporting. (Lehane and McCarthy, 2009) While
definitions have evolved over time (e.g. from compliance to adherence, concordance, and
persistence), these terms continue to be broad in scope. More recent developments have moved
towards defining separate elements of adherence (i.e. initiation, implementation, and persistence)
that are thought to describe the processes involved in medication taking, treating the term
“adherence” as an overarching term. (Vrijens et al., 2012)
Understanding the types of patients and circumstances that heighten the risk of poor adherence
to medicine can help when it comes to the development of effective interventions, but
determining these is not a straightforward task. (Vermeire et al., 2001) The determinants of poor
adherence to medication can be multifaceted, and not purely related to the characteristics of the
individual who was prescribed the medicine. Therefore, complex statistical analysis using detailed
data sources are required in order to accurately quantify these influences.
Randomised controlled trials that are subject to treatment non-adherence tend to provide
adjusted estimates of treatment efficacy (the effect of taking treatment as prescribed) alongside
their standard estimate based on the intention-to-treat principle. (Montori and Guyatt, 2001)
However, traditional approaches to estimating treatment efficacy make implicit assumptions (for
example, no unmeasured confounding) that are unlikely to be plausible in practice. (Altman,
1990) Methods of analysis that are more nuanced, and importantly that respect the random
6
allocation of patients, can be used, but to date have largely been restricted to technical journals
and seldom used in applied clinical research. The practicalities of their implementation remain
uncertain.
1.4 Aim of thesis
The aim of this thesis is to investigate various methodological challenges that are encountered
when studying medication adherence in clinical research, generating new evidence that will
advance the field, and indicating areas in which further developments are warranted.
1.5 Thesis synopsis
The remainder of this thesis will be structured as follows. Chapter 2 will summarise and appraise
the published literature on specific methodological issues of medication adherence in clinical
research. Chapter 3 will provide a description of the data sources used throughout the findings
chapters of the thesis. Chapter 4 will compare different types of measures of medication
adherence, their correlation and agreement with one another, and methods for combining or
calibrating an estimate of medication adherence in the presence of multiple types of disagreeing
estimates. Chapter 5 will focus on investigating the determinants of medication adherence for a
variety of conditions, including both long-term chronic conditions and short-term acute
conditions. This chapter will also explore the impact of different types of measures, and different
conceptualisations of medication adherence on the determinants that are found. Chapter 6 will
look at how causal treatment effects can be derived from randomised controlled trials in the
presence of non-adherence to medication. The concept of randomisation-based efficacy
estimators will be introduced, and the feasibility of their implementation on real data and for
different trial designs will be examined. Finally, Chapter 7 will summarise the key findings and
novel contributions from the thesis, and propose directions of future research in this field.
7
CHAPTER 2: Summary and Appraisal of Key Literature
on the Methodological Issues of Medication Adherence
in Clinical Research
2.1 Introduction
Understanding the key gaps in knowledge that exist in this field, and the opportunities that exist
for novel contribution, requires an understanding and appraisal of relevant literature. Therefore,
the purpose of this Chapter is to summarise and appraise the published literature on several
methodological issues related to medication adherence in clinical research. The topics of focus
will be
1. The measurement of medication adherence;
2. Understanding risk factors for non-adherence to medication;
3. Adjusting findings of randomised controlled trials for medication non-adherence using
randomisation-based efficacy estimators.
2.2 Type of literature review
The purpose of these literature reviews is to provide the reader with a broad overview of the
topics of focus throughout my thesis. Due to their often narrow focus and resource intensity, it is
not practical to carry out a systematic review of the literature. A rapid review process was
therefore undertaken. This is a streamlined approach for synthesising evidence in a timely
manner, and is well suited for reviewing topics that are broad in scope. (Khangura et al., 2012)
To assess how far my literature review deviates from a high quality systematic review, the
AMSTAR checklist will be completed and the scores reported. (Shea et al., 2007) I will also
highlight where these reviews may appear deficient, according to this checklist, highlighting the
likely implications of these deficiencies, and draw conclusions appropriately.
8
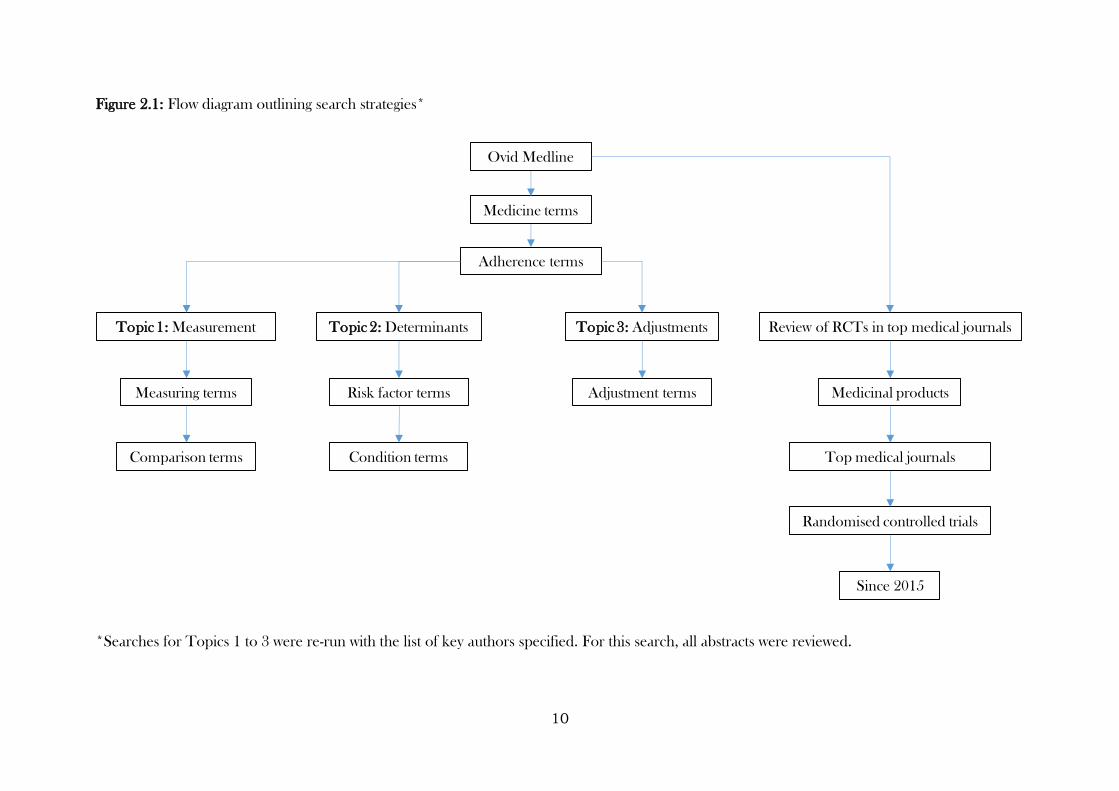
2.3 Search strategies
Search strategies were created for each topic, with each search initiated in Ovid Medline using
several terms related to medication (medicine, medication, drug, or medicinal), and adherence
(adherence, compliance, concordance, persistence, initiation, implementation, or
discontinuation). From this point, strategies diverged, with Topic 1 aiming to capture common
methods for measuring adherence (electronic monitoring, tablet count, pill count, or self-report)
and narrowing the focus down to papers that were interested in comparing measures if possible
(comparison, agreement, correlation, calibration, or adjustment). Topic 2 considered several
terms similar to “risk factor” (factors, determinants, or predictors), and aimed to cover both long-
term/chronic and short-term/acute medical conditions (long term condition, long term illness,
chronic condition, chronic illness, short term condition, short term illness, acute condition, or
acute illness). Finally, the primary aim of Topic 3 was to capture randomised controlled trials of
medicinal products that had been published, where findings were adjusted for non-adherence
using randomisation-based efficacy estimators. Therefore, a wide range of terms were used to
capture this (causal inference, principal stratification, structural mean model, randomisation
based efficacy estimator, instrumental variable, instrumental variables, complier average causal
effect, complier-average causal effect, CACE, SMM, randomisation-based efficacy estimator,
adherence-adjusted, or RBEE). The purpose of this review was to give an overview of the extent
to which these methods are being used in practice, rather than describe methods that have been
proposed in the statistical literature. Finally, an additional search was undertaken, specifically
looking at all randomised controlled trials of medicinal products that have been published since
the beginning of 2015 in the highly-ranked medical journals (specifically, The Lancet, The British
Medical Journal, The New England Journal of Medicine, and The Journal of the American
Medical Association). The purpose of this search was to identify whether these papers referred
to medication adherence, and if so, whether/how they described methods for its measurement

9
and whether/how it was modelled/adjusted for. Phase I clinical trials were excluded, as adherence
to medication would be directly observed in all of these and therefore unlikely to be reported.
All strategies also limited findings to studies published on humans and written in English.
Abstracts were initially screened for duplicates. As the purpose of the review was to obtain a
broad view of the literature, rather than ensure that every paper was reviewed, papers were
reviewed for relevance in blocks of ten until no new themes were found within an entire block.
Abstracts were reviewed in alphabetical order (with respect to the lead author). The purpose of
this was to not focus on reviewing papers from any particular time point (and risk obtaining a
biased view of the literature), and thus be more likely to obtain a broader view of the literature
(that is, both past and present methods and techniques).
To ensure that no key literature was missed using this approach, the search was re-run with a list
of key authors that have published important works on medication adherence (Bangsberg,
Claxton, DiMatteo, Farmer, Horne, Hughes, Kane, Kardas, Osterberg, Pechere, Sabate,
Urquhart, Vermeire, Vrijens, or Weinman). A review of other work published by these authors
in the field of medication adherence was also undertaken, to ensure that any key literature not
covered by these searches were read (Figure 2.1).
10
Figure 2.1: Flow diagram outlining search strategies*
*Searches for Topics 1 to 3 were re-run with the list of key authors specified. For this search, all abstracts were reviewed.
Medicine terms
Adherence terms
Topic 1: Measurement Topic 2: Determinants Topic 3: Adjustments Review of RCTs in top medical journals
Ovid Medline
Measuring terms
Comparison terms
Risk factor terms
Condition terms
Adjustment terms
Randomised controlled trials
Medicinal products
Top medical journals
Since 2015
11
2.4 Topic 1: The Measurement of Medication Adherence
2.4.1 Search Results
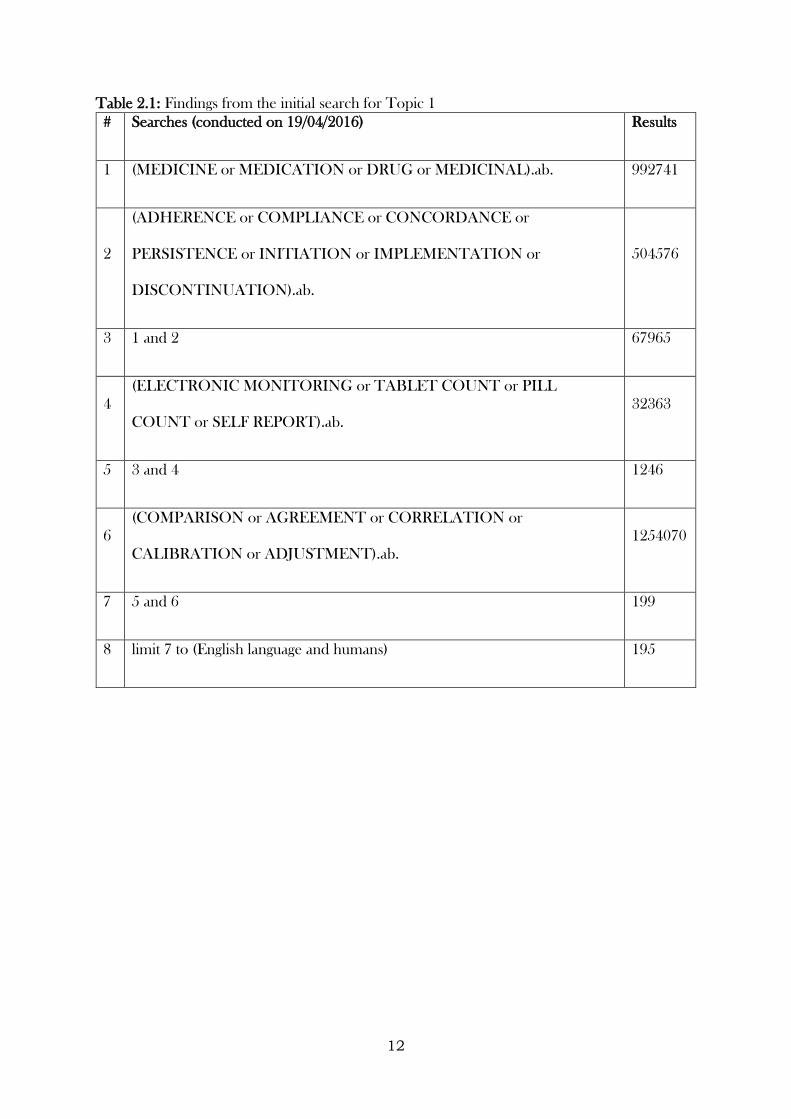
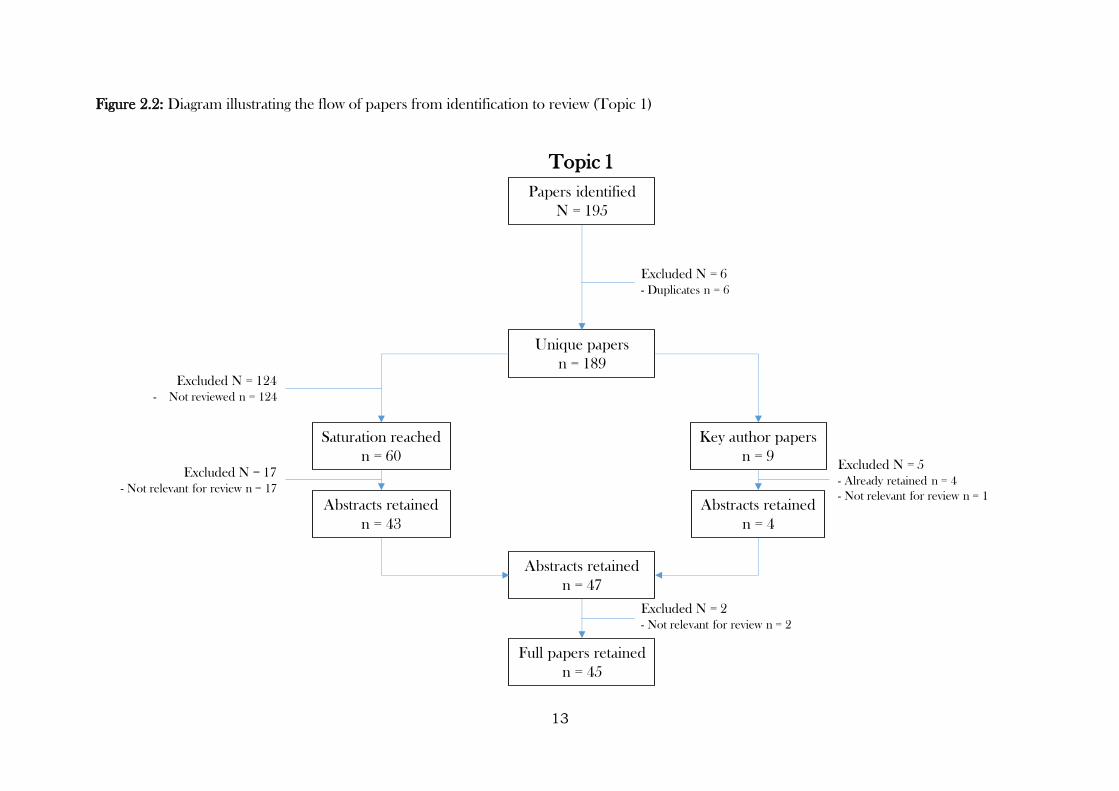
The initial search was conducted on 19/04/2016 and yielded 195 papers, six of which were
duplicates (Table 2.1). From the 189 unique papers that were identified, no new themes emerged
after reviewing 60. In total, 43 papers were deemed relevant, with the remaining 17 not relevant
for this review. The search was re-run with the names of key authors included. Nine paper were
identified. However, four had already been reviewed, and one was deemed not relevant for the
review. Therefore, this search yielded an additional four relevant papers. Following the review of
full texts of all 47 papers, two papers were excluded for not being relevant, on closer inspection.
The section of the Chapter therefore relates to the review of 45 papers (Figure 2.2).
2.4.2 Findings
2.4.2.1 Clinical conditions
The papers found cover a wide range of conditions, including those focused on the respiratory
tract (e.g. asthma, cystic fibrosis), (Berg et al., 1998, Butz et al., 2005, Daniels et al., 2011, Casey
et al., 2012) long-term physical conditions such as HIV, (Dlamini et al, 2009, Haberer et al.,
2011, Buscher et al., 2015) cancer, (Escalada and Griffiths, 2006) type 2 diabetes, (Farmer et al.,
2006, Bogner et al., 2013) and hypertension, (Choo et al., 1999, El Zubier, 2000, Horne et al.,
2010) and mental illnesses such as depression (Gabriel and Violato, 2010, De las Cuevas et al.,
2014) and schizophrenia. (Garavan et al., 1998, Frangou et al., 2005, Byerly et al., 2007, Brain
et al., 2014) There were also studies included in this review looking at adherence to treatment in
substance abusers (e.g. alcohol, ecstasy, speed, and heroin). (Digiusto et al., 1996, Cooper et al.,
2000, Feinn et al., 2003)
12
Table 2.1: Findings from the initial search for Topic 1
# Searches (conducted on 19/04/2016) Results
1 (MEDICINE or MEDICATION or DRUG or MEDICINAL).ab. 992741
2
(ADHERENCE or COMPLIANCE or CONCORDANCE or
PERSISTENCE or INITIATION or IMPLEMENTATION or
DISCONTINUATION).ab.
504576
3 1 and 2 67965
4
(ELECTRONIC MONITORING or TABLET COUNT or PILL
COUNT or SELF REPORT).ab.
32363
5 3 and 4 1246
6
(COMPARISON or AGREEMENT or CORRELATION or
CALIBRATION or ADJUSTMENT).ab.
1254070
7 5 and 6 199
8 limit 7 to (English language and humans) 195
13
Figure 2.2: Diagram illustrating the flow of papers from identification to review (Topic 1)
Topic 1
Papers identified
N = 195
Unique papers
n = 189
Abstracts retained
n = 47
Full papers retained
n = 45
Excluded N = 6
- Duplicates n = 6
Excluded N = 124
- Not reviewed n = 124
Excluded N = 2
- Not relevant for review n = 2
Saturation reached
n = 60
Abstracts retained
n = 43
Excluded N = 17
- Not relevant for review n = 17
Key author papers
n = 9
Abstracts retained
n = 4
Excluded N = 5
- Already retained n = 4
- Not relevant for review n = 1
14
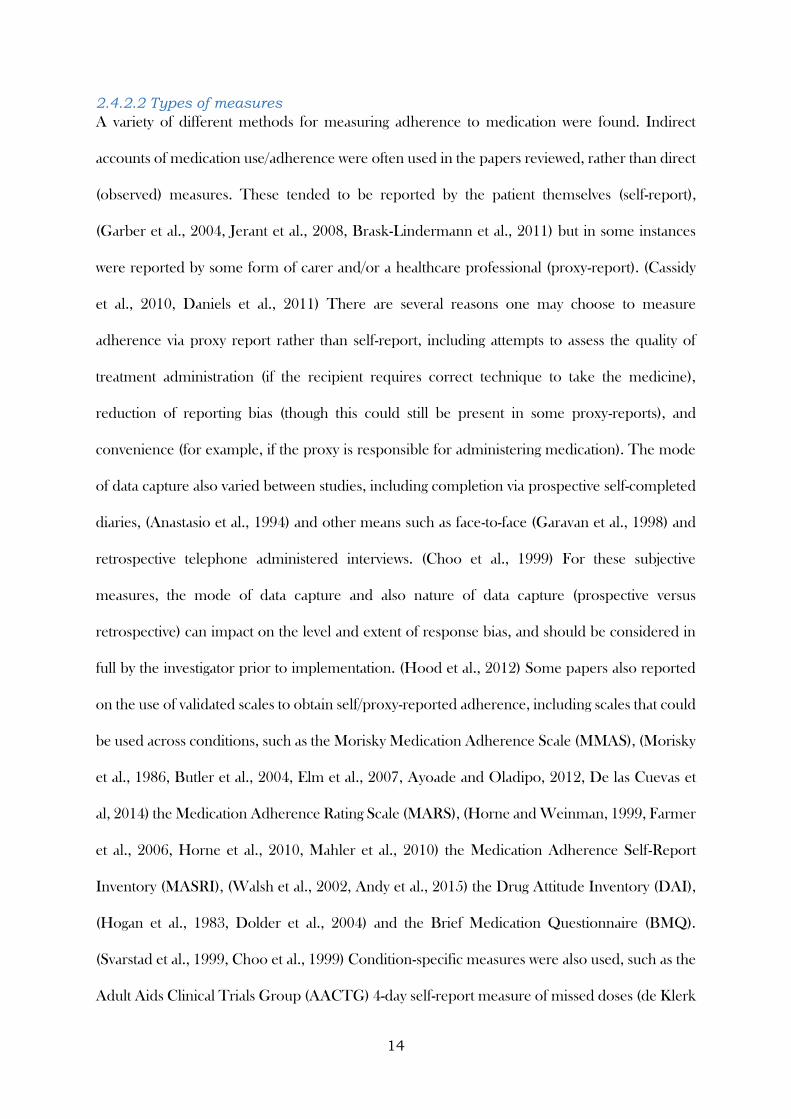
2.4.2.2 Types of measures
A variety of different methods for measuring adherence to medication were found. Indirect
accounts of medication use/adherence were often used in the papers reviewed, rather than direct
(observed) measures. These tended to be reported by the patient themselves (self-report),
(Garber et al., 2004, Jerant et al., 2008, Brask-Lindermann et al., 2011) but in some instances
were reported by some form of carer and/or a healthcare professional (proxy-report). (Cassidy
et al., 2010, Daniels et al., 2011) There are several reasons one may choose to measure
adherence via proxy report rather than self-report, including attempts to assess the quality of
treatment administration (if the recipient requires correct technique to take the medicine),
reduction of reporting bias (though this could still be present in some proxy-reports), and
convenience (for example, if the proxy is responsible for administering medication). The mode
of data capture also varied between studies, including completion via prospective self-completed
diaries, (Anastasio et al., 1994) and other means such as face-to-face (Garavan et al., 1998) and
retrospective telephone administered interviews. (Choo et al., 1999) For these subjective
measures, the mode of data capture and also nature of data capture (prospective versus
retrospective) can impact on the level and extent of response bias, and should be considered in
full by the investigator prior to implementation. (Hood et al., 2012) Some papers also reported
on the use of validated scales to obtain self/proxy-reported adherence, including scales that could
be used across conditions, such as the Morisky Medication Adherence Scale (MMAS), (Morisky
et al., 1986, Butler et al., 2004, Elm et al., 2007, Ayoade and Oladipo, 2012, De las Cuevas et
al, 2014) the Medication Adherence Rating Scale (MARS), (Horne and Weinman, 1999, Farmer
et al., 2006, Horne et al., 2010, Mahler et al., 2010) the Medication Adherence Self-Report
Inventory (MASRI), (Walsh et al., 2002, Andy et al., 2015) the Drug Attitude Inventory (DAI),
(Hogan et al., 1983, Dolder et al., 2004) and the Brief Medication Questionnaire (BMQ).
(Svarstad et al., 1999, Choo et al., 1999) Condition-specific measures were also used, such as the
Adult Aids Clinical Trials Group (AACTG) 4-day self-report measure of missed doses (de Klerk
15
et al., 1999, Chesney et al., 2000, Buscher et al., 2011) and the Antidepressant Adherence Scale
(AAS). (Gabriel and Violato, 2010) Validated, or standardised scales give the advantage of having
existing evidence demonstrating the extent to which the scale measures what it is intended to
measure (validity), can yield consistent responses (reliability), and can discriminate between
different types of subjects (sensitivity). Without previous investigation of these areas, ad-hoc
questions risk producing data that are useless (e.g. not sensitive and cannot distinguish between
people who do and do not adhere, or changes in adherence over time) or worse misleading
(because the scales measure something different than what was intended). (Streiner and Norman,
2014) Pill counts also commonly featured in the papers reviewed. (Almeida et al., 2014, Banek
et al., 2014, Baxi et al., 2015) While the majority of pill counts were scheduled (e.g. occurring
clinic visits or other known time points), (Elzubier et al., 2000, Feinn et al., 2003, Elm et al.,
2007, Brain et al., 2014) some papers reported the collection of pill count data during
unannounced home visits. (Haberer et al., 2011) The purpose of the latter being to reduce the
risk of pill dumping (removing pills from containers without consuming them with the intention
of appearing more adherent to treatment) and/or white coat adherence (increasing medication
usage as the time to a scheduled visit neared to appear more adherent) (Rudd et al, 1989,
Bangsberg et al., 2000) and thus improve the validity of the measure. Indeed, Haberer et al,
reported better agreement between electronic monitoring and unannounced pill counts
compared to scheduled pill counts. In some of the papers reviewed, biological assays were used
as a means of monitoring medication use. (Digiusto et al., 1996, Cooper et al., 2000, Banek et
al., 2014, Baxi et al., 2015) Various types of samples were used to obtain measure of medication
use, including samples obtained from blood, urine, and hair. The advantage of these are that
they can measure the concentration of drug within an individual’s body. However, they are
resource intensive, invasive, and similar to pill counts, where these are scheduled, patients may
take medication as prescribed a few days prior (where they had not been doing so previously).
16
In other words, while they can be viewed as a direct measure, in practice they remain indirect in
all but short-term treatments. Pharmacy refill records were also reported in some papers. (Choo
et al., 1999, Esposito et al., 2008, Clifford et al., 2014) These are records collected routinely by
pharmacists which provide an account of a prescription being collected. While there are a
number of advantages to using pharmacy refill data to monitor adherence (non-invasive,
participant not overtly aware they are being monitored, etc.), due to the data used during this
thesis, they will not be considered in any great detail. Electronic monitors were a frequently
utilised means of obtaining medication adherence data in the papers reviewed. (Chui et al., 2003,
Boland et al., 2014) The types of monitors varied, depending on the way in which the medication
was delivered. Examples include the Medication Event Monitoring System (MEMS), (Escalada
et al., 2006, Buscher et al., 2011, Baxi et al., 2015) that records the date and time of each bottle
cap opening, a similar micro-switch device housed inside an inhaler, (Berg et al., 1998) and
electronic nebulizer monitors, that record the date, time, and duration of each nebulizer use
event. (Butz et al., 2005) Electronic monitors do not rely on patients consciously reporting their
medication use, and can provide rich detail on patterns in adherence. However, their expense
(relative to other types of measures) can make them infeasible. The knowledge that a patient’s
medication taking habits are constantly monitored can also risk influencing adherence itself.
Where electronic monitoring is commonplace, this is not a problem. However, when an
intervention to improve adherence is being trialled, and adherence is being monitored
electronically, it may be difficult to disentangle intervention effects from the effect of the
electronic monitor due to this reactivity (French and Sutton, 2010, McCambridge et al., 2011).
Nevertheless, electronic monitors are widely regarded as the best measure of adherence in
clinical research, with a key study by Sutton et al., (2014) finding that while electronic containers
may lead to small increases in adherence, this is outweighed by their advantages. Figure 2.3
17
illustrates the different types and subtypes of measures described in this section, as well as
summaries reported in the literature.
2.4.2.3 Quantification of adherence
A range of approaches were used to quantify adherence, both between and within the different
types of measures described previously. For validated scales, scores or categories were computed
using the items suggested by the scale developers. (Dlamini et al., 2009, Buscher et al., 2011)
These, along with un-validated accounts, were often dichotomised into “adhered to medication
regimen” / “did not adhere to medication regimen”. (Elzubier et al., 2000, Dorz et al., 2003,
DiMatteo et al., 2004, De las Cuevas et al., 2014) While a categorisation such as this may appear
more intuitive for a clinical or patient audience, and for defining populations it is sometimes
needed (for example, when defining an analysis population in a randomised controlled trial),
dichotomising ordinal or continuous variables results in a loss of information for often very little
gain. (Senn, 2005) The gain is even smaller if the categorisation is not based on strong evidence
of a clear dichotomy at the chosen threshold (i.e. the threshold has been arbitrarily chosen, or
chosen based on weak evidence), as participants categorised as ‘not adhering’ might have taken
enough of the treatment for a therapeutic benefit. Indeed, these categorisations varied across
studies in a fairly arbitrary fashion, with some studies using a cut-off at 100%, (Almeida et al.,
2014) and others using cut-offs ranging from 70% upwards. (Bogner et al., 2013, Brain et al.,
2014)
Adherence measured using pill counts tended to calculate the difference between the number of
pills given and the number returned, expressing it as a percentage of the number of pills given.
(Horne et al., 2010, Haberer et al., 2011) This can provide a measure of consumption within a
defined period, but gives little understanding of patterns in adherence within the period (other
than when adherence is 0 or 100%). Calculations from biological assays were based on either the
amount of drug detected in the sample, or a categorisation of this that indicated whether the
18
amount of drug detected was consistent with someone adhering to their prescribed regimen.
(Cooper et al., 2000, Brain et al., 2014) Note the latter summary has similar issues to
dichotomisation elsewhere in that information is lost and may be an overly simplistic
representation of adherence. (Farmer, 1999) Where adherence data were obtained via pharmacy
refill records, the Medication Possession Ratio (MPR) was the popular metric of choice. The
MPR counts the number of days of medication supplied within a time interval and divides this
by the time interval, with a ratio calculated provided there is at least one refill/repeat prescription.
(Steiner and Prochazka, 1997, Steiner et al., 1998) Electronic monitors that record the date and
time of a dosing event have an advantage of providing data on adherence in multiple ways.
Indeed, from the papers reviewed, data collected via electronic monitors were used to create
adherence metrics based on the percentage of days that patients adhered to their treatment (e.g.
had at least the required number of dosing events corresponding to their prescribed regimen),
(Brain et al., 2014) the amount of times that doses were within a defined time interval, (Boland
et al., 2014) and the average duration of each dosing event (e.g. average length of time that a
nebulizer was in use during a dosing event). (Butz et al., 2005)
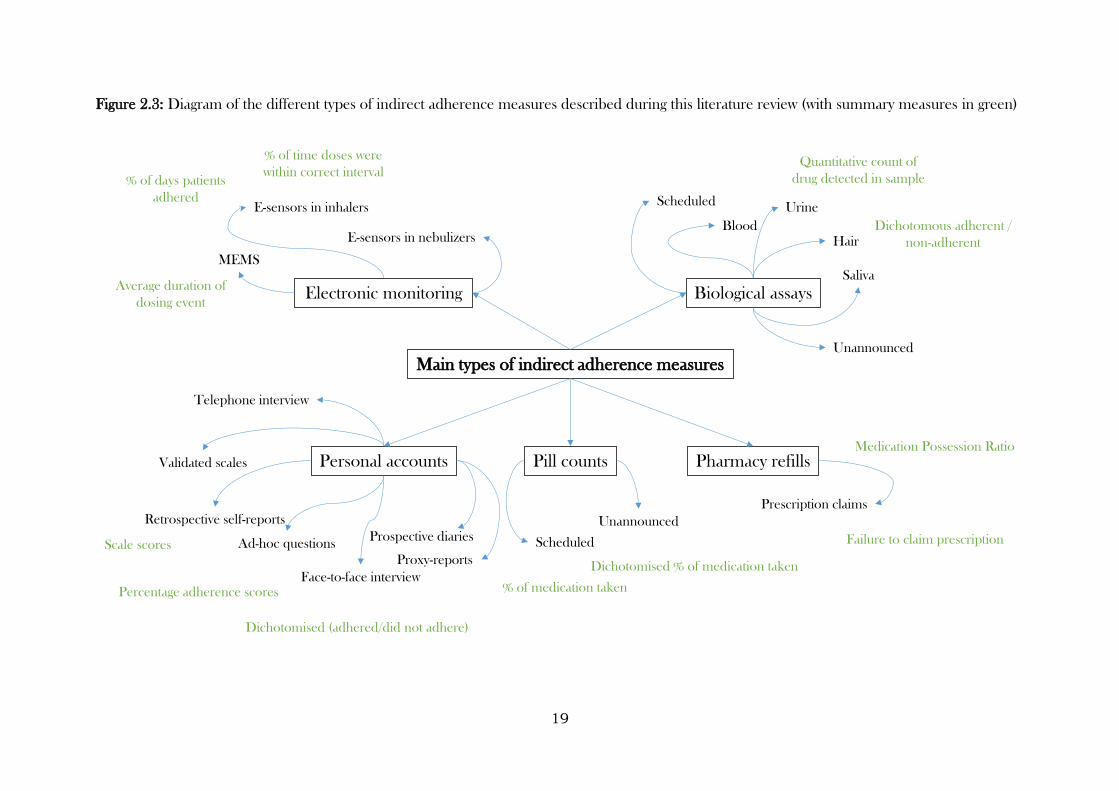
19
Figure 2.3: Diagram of the different types of indirect adherence measures described during this literature review (with summary measures in green)
Main types of indirect adherence measures
Electronic monitoring
Personal accounts Pill counts
Biological assays
Pharmacy refills
Retrospective self-reports
Proxy-reports
Validated scales
Ad-hoc questionsProspective diaries Scheduled
Unannounced
Blood
Urine
Hair
Saliva
Scheduled
Unannounced
MEMS
E-sensors in inhalers
E-sensors in nebulizers
Face-to-face interview
Telephone interview
Prescription claims
Scale scores
Percentage adherence scores
Dichotomised (adhered/did not adhere)
Quantitative count of
drug detected in sample
% of medication taken
Dichotomised % of medication taken
Dichotomous adherent /
non-adherent
Failure to claim prescription
Medication Possession Ratio
% of days patients
adhered
% of time doses were
within correct interval
Average duration of
dosing event
20
Knowledge of the treatment being investigated can influence the recommended metric of
interest. For treatments where time between consumption is vital for achieving or maintaining
efficacy (or minimising toxicity), analysis based on time intervals is important. Conversely, where
comparisons are being made between two treatments that are taken a different number of times
a day, data regarding frequency of openings is important (Figure 2.3).
2.4.2.4 Comparing different types of measures - correlation
One of the key aims of this review was to summarise literature that reports comparisons of
different methods for measuring adherence. Broadly speaking, the literature reviewed reported
comparisons between methods in two ways – correlation and agreement. The strength of
correlation between different types of methods was wide ranging. Strong relationships were found
in some studies comparing self-report to pill counts, (Feinn et al., 2003, Almeida et al., 2014)
and biological assays to electronic monitoring, (Baxi et al., 2015) but correlations that were weak
to moderate were also found. (Elm et al., 2007 Esposito et al., 2008, Buscher et al., 2011) For
example, one study found a moderate correlation between self-reported adherence and pill
count-derived adherence that weakened over time. (Andy et al., 2015) This could reflect the fact
that self-report adherence measures aim to measure adherence to treatment (both in terms of
consumption but also tendencies to consume correct doses at the correct times), whereas pill
counts are only able to provide a measure of consumption within a defined period. It would
therefore follow that strength of association between these two types of measures would weaken
as the observation period widened. Another study of inhaled medications compared different
adherence metrics derived from electronic monitors to those derived from self-reported diaries
found that while a moderate correlation was found when using frequency data (percentage of
days with correct administrations), there was considerably weaker correlation when comparing
diaries to metrics based on the number of puffs. (Berg et al., 1998) The latter metric yielded a
lower adherence rating when based on electronic monitors compared to self-reported data (i.e.
according to self-reports, patients thought they were adhering better than the electronic monitors
21
suggested). This study highlights the advantages of having automated date and time data, as this
was combined in an algorithm, with the number of puffs at each dosing event, to determine the
level of adherence of a given patient. Achieving the same detail via self-reported data would rely
on patients actively recording the date, time, and number of puffs (potentially the time of each
puff) at each dosing event. This is unlikely to be sustainable in patients on an indefinite basis, or
even research participants (particularly where a long-term condition is of interest).
2.4.2.5 Comparing different types of methods - agreement
Assessing the correlation between two methods can only indicate the strength of the relationship
between them. It cannot provide an accurate indication of the level of agreement between the
two methods (for example, it is mathematically possible for two methods that are strongly
correlated to have poor agreement), which is an important estimand for understanding the
reliability or bias of a particular method. The papers in this review estimated agreement using a
diverse range of methods. The observed percentage of agreement was often reported. (Cooper
et al., 2000, Banek et al., 2014) This was usually accompanied by Cohen’s Kappa, which takes
into account chance-agreement for categorical variables, (Digiusto et al., 1996) or the intra-class
correlation coefficient, if a quantitative measurement of adherence was used. (Cassidy et al.,
2010) Some papers reported on the sensitivity and specificity of a particular method, where the
performance of a particular method (often self-report) was compared to a gold/reference
standard (often electronic monitoring). (de Klerk et al., 1999) This method relies on a categorical
definition of adherence, and assumes that the reference standard reflects the true nature of
adherence. While these approaches can describe the amount of agreement present between two
types of measures, and to some extent the direction of disagreement (e.g. more adherent people
according to one approach), they cannot provide information about the extent of disagreement.
This might be important, as two measures may disagree by a negligible amount, or disagreement
may be sensitive to how adherence thresholds were chosen (if a continuous measure was available
but subsequently categorised). Another method for assessing agreement, less frequently reported
22
in the literature reviewed, was Bland-Altman plots and limits of agreement. These involve plotting
the average and paired-difference across two types of measures that produce quantitative
summaries of adherence. This plot is then used to compare methods and detect systematic
disagreement (bias) between them. For example, one study used a Bland-Altman plot to assess
the agreement between self-report and electronic monitoring in the use of nebulizers,
demonstrating that self-reports consistently overestimated use of nebulizers, when compared to
electronic monitoring. (Daniels et al., 2011) Similarly, another study found that electronic
monitoring and unannounced pill counts yielded lower adherence compared to carer-reported
adherence and scheduled pill counts. (Haberer et al., 2011)
2.4.2.6 Calibration and other approaches
On comparing methods, be that via correlation or agreement, the natural progression might be
to use this information in an attempt at deriving a more accurate estimate of medication
adherence. The majority of methods, indeed every method described in this review, provide an
indirect measure of medication adherence, relying on assumptions in order for their data to be
used as means for quantifying medicine use. Using information from multiple indirect sources
to acquire an improved estimate (and hence understanding) of medication would therefore seem
important. Despite this, there appear to have been few attempts at using the information obtained
in this way. One study explicitly did this by creating a consensus definition of adherence based
on pill counts along with patient, clinician, and family accounts of medication use. (Cassidy et al.,
2010) However, it is not clear how this consensus was arrived at, only that all individual measures
correlated very highly with the consensus measure (as would be expected). Another study, that
used electronic monitors to study adherence to medication given on a multiple doses per-day
regimen, added in questions at follow-up visits that took account of multiple doses being removed
during a single dosing event, stating that this information was then used to add dosing events as
appropriate. (Byerly et al., 2007) However, further detail of this process was lacking. This
approach is likely to be unreliable, unless these questions were asked frequently and specific
23
questions were asked (rather than a general question, such as “how often did you remove more
than one dose at a time?”). Nevertheless, this was an attempt at creating a calibrated adherence
measure, using multiple sources of data. Finally, one study from those reviewed, that reported
the concordance between urinalysis and self-reported drug use by applicants for methadone
maintenance, conducted an analysis that looked at predictors of misreporting drug use. (Digiusto
et al., 1996) The analyses yielded no strong associations. However, this is type of analysis appears
to be seldom reported, and may be useful when it comes to informing the reliability of reported
levels of adherence provided by individuals within a study, or potentially when it comes to
selecting a suitable method/s for measuring adherence across an entire study (that is, by
considering the typical characteristics of the population of interest in relation to known factors
that influence misreporting of treatment adherence).
2.4.2.7 Summary (Topic 1)
The review of these papers highlighted both gaps in the literature, and areas in which knowledge
and understanding could be further strengthened by the work presented in this thesis. The
majority of papers focused on adherence to medication prescribed for long-term conditions. The
measurement of adherence to medication prescribed for short-term illnesses appears to be a less
well researched area. However, non-adherence to these medicines could impact on clinical
outcomes, potentially leading to complications that have long-lasting consequences. This is an
area that therefore warrants further investigation. As previously reported, electronic monitors
used to measure medication adherence have the advantage of providing accounts of dosing
frequency, timing, and in some instances duration. However, despite there being many studies
reporting their use, simple summary measures of adherence (e.g. an average adherence score /
dichotomous indicator averaged across an entire observation period) appear to be the popular
means of reporting these data. It is my intention to move beyond that during this thesis and
provide more accurate accounts of adherence, as measured by electronic monitoring, and
demonstrate how these data can be used to demonstrate the evolution of adherence over time.
24
The investigation of agreement between adherence measures was reported in several studies.
However, most used dichotomous definition of adherence based on an arbitrary cut-off. Bland-
Altman plots were infrequently used, and this thesis will explore their use further. Agreement
between adherence measures should never be an end in itself, however. This thesis will therefore
explore means for estimating risk factors for disagreement between adherence measures, and
consider different ways in which measures can be combined in order to create a calibrated
measure that, ideally, provides a more accurate reflection of how well an individual has adhered
to their prescribed medication regimen.
2.5 Topic 2: Understanding Risk Factors for Non-Adherence to
Medication
2.5.1 Search Results
The initial search, performed on 19/04/2016, yielded 85 papers (Table 2.2). Three duplicates
were removed, leaving 82 unique papers. Similar to Topic 1, no new themes emerged after
reviewing 60 papers. In total, 30 papers were deemed relevant, with the remaining 30 not relevant
for this review. The search was re-run with the names of key authors included. Two papers were
identified. However, both had already been identified in the initial search. Therefore, this
approach yielded no additional papers. On further review of the full texts, four papers were
subsequently excluded due to their irrelevance for this review. This section therefore relates to
the review of 26 papers (Figure 2.4).

25
Table 2.2: Findings from the initial search for Topic 2
# Searches (conducted on 19/04/2016) Results
1 (MEDICINE or MEDICATION or DRUG or MEDICINAL).ab. 992741
2
(ADHERENCE or COMPLIANCE or CONCORDANCE or
PERSISTENCE or INITIATION or IMPLEMENTATION or
DISCONTINUATION).ab.
504576
3 1 and 2 67965
4
(RISK FACTORS or DETERMINANTS or PREDICTORS or
FACTORS).ab.
1381410
5 3 and 4 11798
6
(LONG TERM CONDITION or LONG TERM ILLNESS or CHRONIC
CONDITION or CHRONIC ILLNESS or SHORT TERM CONDITION
or SHORT TERM ILLNESS or ACUTE CONDITION or ACUTE
ILLNESS).ab.
12851
7 5 and 6 87
8 limit 7 to (English language and humans) 85
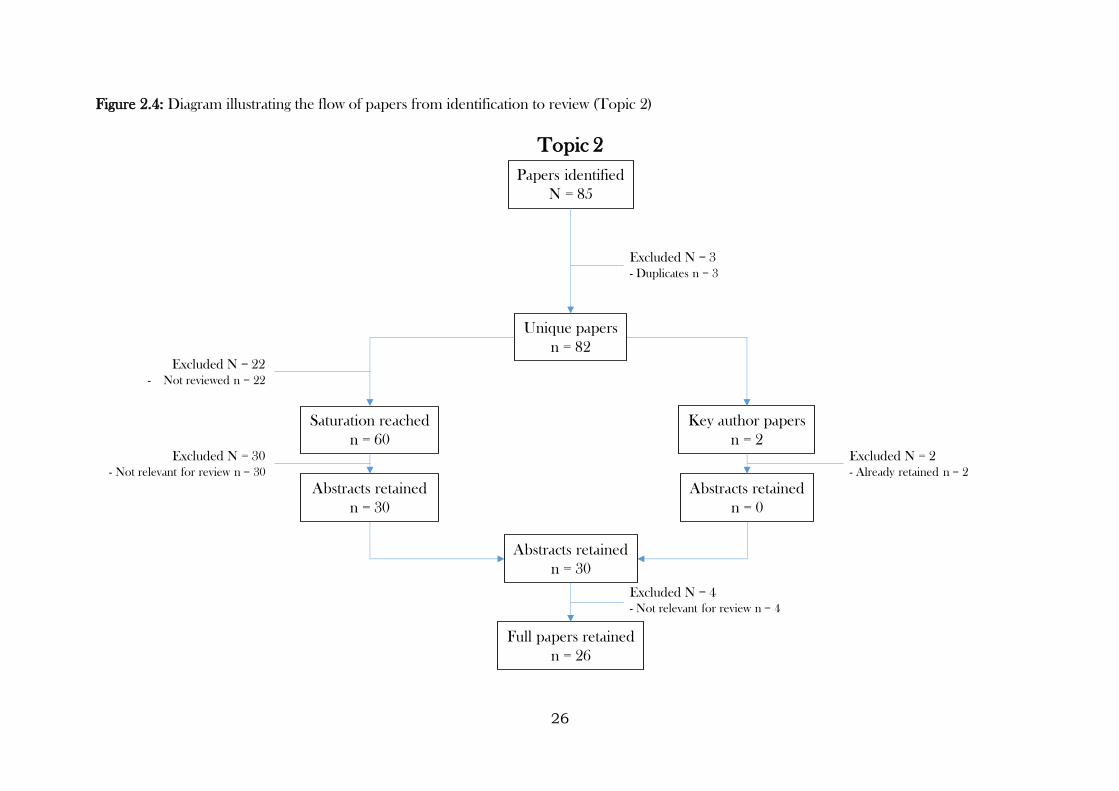
26
Figure 2.4: Diagram illustrating the flow of papers from identification to review (Topic 2)
Topic 2
Papers identified
N = 85
Unique papers
n = 82
Abstracts retained
n = 30
Full papers retained
n = 26
Excluded N = 3
- Duplicates n = 3
Excluded N = 22
- Not reviewed n = 22
Excluded N = 4
- Not relevant for review n = 4
Saturation reached
n = 60
Abstracts retained
n = 30
Excluded N = 30
- Not relevant for review n = 30
Key author papers
n = 2
Abstracts retained
n = 0
Excluded N = 2
- Already retained n = 2
27
2.5.2 Findings
2.5.2.1 Clinical conditions
In the same way as Topic 1, the papers found for this review covered a wide range of clinical
conditions. The majority focused on long-term or chronic conditions (e.g. HIV, ADHD, and
bipolar disorder), (Berk et al., 2004, Harvey et al., 2008, Coletti et al., 2012, Mackey et al., 2012)
with some papers focusing on risk factors of non-adherence medicines in general, but in a specific
population (e.g. the elderly). (Henriques et al., 2012, Dharmapuri et al., 2015)
2.5.2.2 Approaches used to study risk factors
The papers reviewed used both quantitative and qualitative means of studying risk factors for
non-adherence. Those that used quantitative means tended to report their findings on the basis
of regression analyses. (Bagchi et al., 2007, Dean et al., 2011, Gadkari et al., 2012) This is a
useful approach for measuring the strength of association that these risk factors may have on
adherence, and how this association is influenced by other factors. Univariable analyses were also
reported in some papers, though these lack the advantage of being able to be adjusted for any
confounding relationships that may exist. (Dalbeth et al., 2011, Lin et al., 2014) One paper used
a stated-preference approach to quantify how certain attributes of medication affected the
adherence to these treatments. (Johnson et al., 2007) This approach is a systematic method for
understanding preferences through structured trade-offs. (Thurstone, 1927, Louviere et al.,
2000) Relevant medication attributes were identified using existing literature (for example,
frequency of mania episode), with participants asked to choose between a series of medicines
that had varying levels of these attributes (for example, less than once a year; 1-3 times a year; 4-
6 times a year; more than 6 times a year), as well as being asked to compare their current
medication with hypothetical medication (again, with varying levels of the identified attributes).
This approach has the key advantage of data being cheap and quick to collect (compared to, for
example, a cohort study investigating risk factors of adherence to a treatment being taken long-
term). However, as with all stated-preference approaches, it has the disadvantage of yielding data
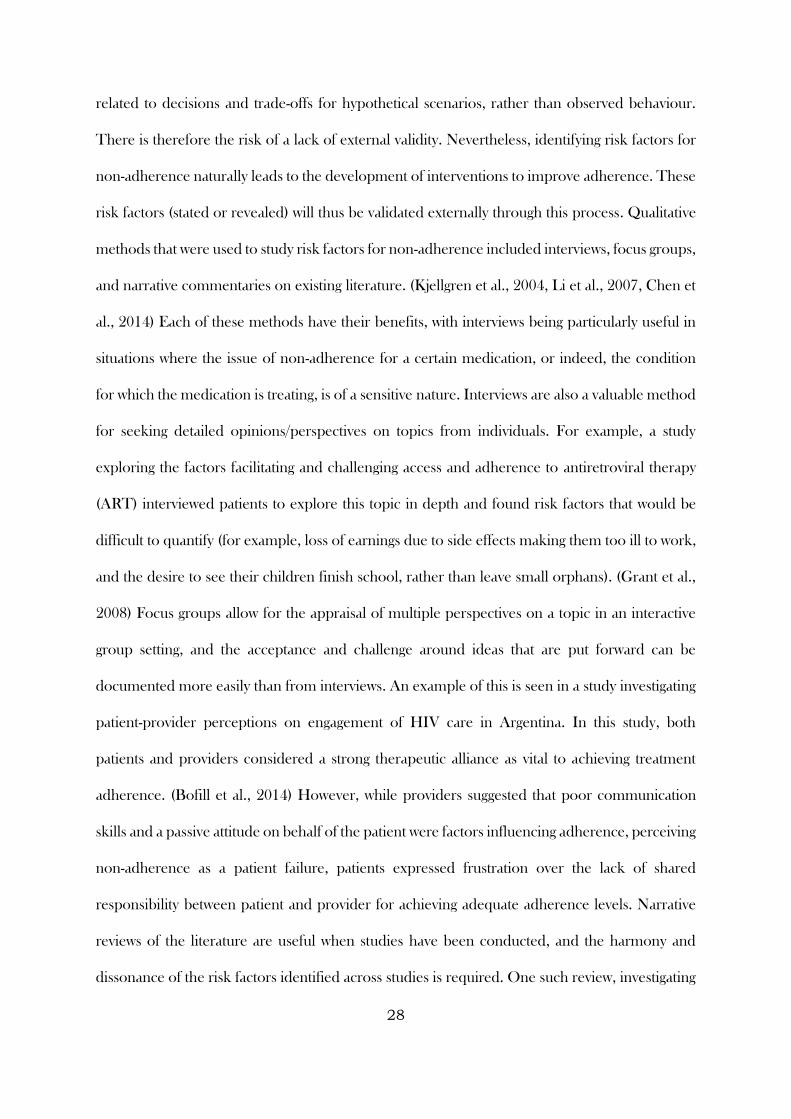
28
related to decisions and trade-offs for hypothetical scenarios, rather than observed behaviour.
There is therefore the risk of a lack of external validity. Nevertheless, identifying risk factors for
non-adherence naturally leads to the development of interventions to improve adherence. These
risk factors (stated or revealed) will thus be validated externally through this process. Qualitative
methods that were used to study risk factors for non-adherence included interviews, focus groups,
and narrative commentaries on existing literature. (Kjellgren et al., 2004, Li et al., 2007, Chen et
al., 2014) Each of these methods have their benefits, with interviews being particularly useful in
situations where the issue of non-adherence for a certain medication, or indeed, the condition
for which the medication is treating, is of a sensitive nature. Interviews are also a valuable method
for seeking detailed opinions/perspectives on topics from individuals. For example, a study
exploring the factors facilitating and challenging access and adherence to antiretroviral therapy
(ART) interviewed patients to explore this topic in depth and found risk factors that would be
difficult to quantify (for example, loss of earnings due to side effects making them too ill to work,
and the desire to see their children finish school, rather than leave small orphans). (Grant et al.,
2008) Focus groups allow for the appraisal of multiple perspectives on a topic in an interactive
group setting, and the acceptance and challenge around ideas that are put forward can be
documented more easily than from interviews. An example of this is seen in a study investigating
patient-provider perceptions on engagement of HIV care in Argentina. In this study, both
patients and providers considered a strong therapeutic alliance as vital to achieving treatment
adherence. (Bofill et al., 2014) However, while providers suggested that poor communication
skills and a passive attitude on behalf of the patient were factors influencing adherence, perceiving
non-adherence as a patient failure, patients expressed frustration over the lack of shared
responsibility between patient and provider for achieving adequate adherence levels. Narrative
reviews of the literature are useful when studies have been conducted, and the harmony and
dissonance of the risk factors identified across studies is required. One such review, investigating
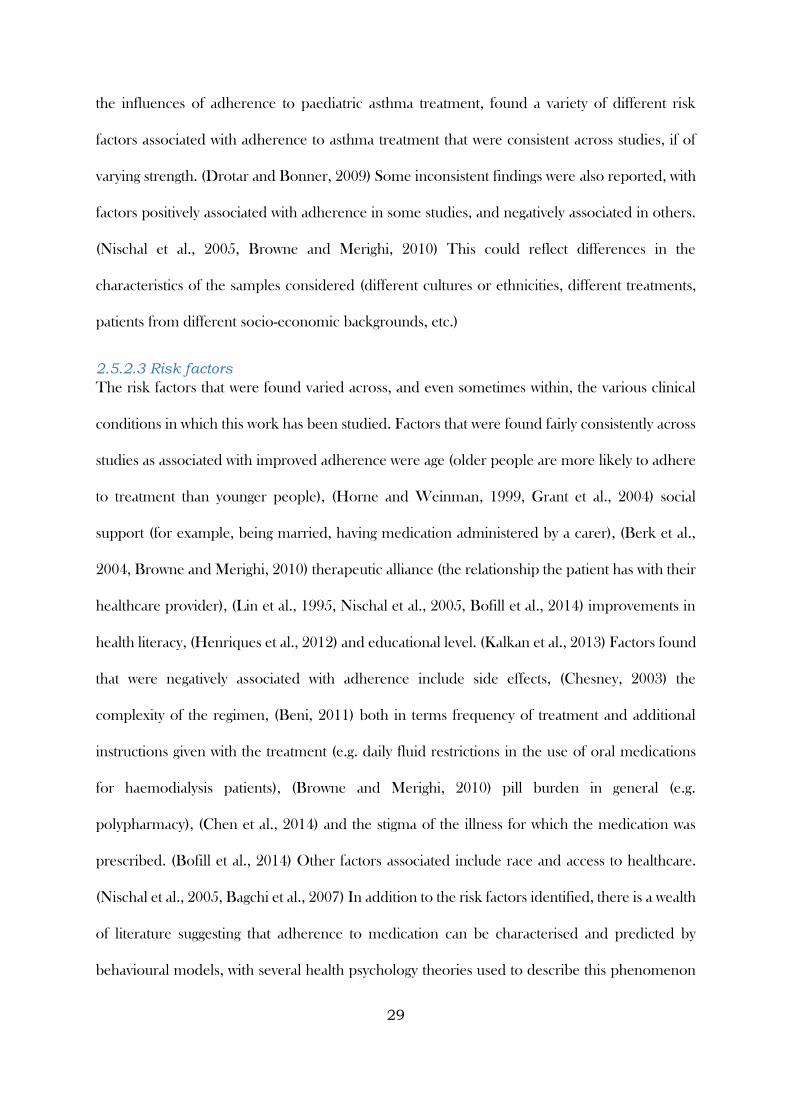
29
the influences of adherence to paediatric asthma treatment, found a variety of different risk
factors associated with adherence to asthma treatment that were consistent across studies, if of
varying strength. (Drotar and Bonner, 2009) Some inconsistent findings were also reported, with
factors positively associated with adherence in some studies, and negatively associated in others.
(Nischal et al., 2005, Browne and Merighi, 2010) This could reflect differences in the
characteristics of the samples considered (different cultures or ethnicities, different treatments,
patients from different socio-economic backgrounds, etc.)
2.5.2.3 Risk factors
The risk factors that were found varied across, and even sometimes within, the various clinical
conditions in which this work has been studied. Factors that were found fairly consistently across
studies as associated with improved adherence were age (older people are more likely to adhere
to treatment than younger people), (Horne and Weinman, 1999, Grant et al., 2004) social
support (for example, being married, having medication administered by a carer), (Berk et al.,
2004, Browne and Merighi, 2010) therapeutic alliance (the relationship the patient has with their
healthcare provider), (Lin et al., 1995, Nischal et al., 2005, Bofill et al., 2014) improvements in
health literacy, (Henriques et al., 2012) and educational level. (Kalkan et al., 2013) Factors found
that were negatively associated with adherence include side effects, (Chesney, 2003) the
complexity of the regimen, (Beni, 2011) both in terms frequency of treatment and additional
instructions given with the treatment (e.g. daily fluid restrictions in the use of oral medications
for haemodialysis patients), (Browne and Merighi, 2010) pill burden in general (e.g.
polypharmacy), (Chen et al., 2014) and the stigma of the illness for which the medication was
prescribed. (Bofill et al., 2014) Other factors associated include race and access to healthcare.
(Nischal et al., 2005, Bagchi et al., 2007) In addition to the risk factors identified, there is a wealth
of literature suggesting that adherence to medication can be characterised and predicted by
behavioural models, with several health psychology theories used to describe this phenomenon
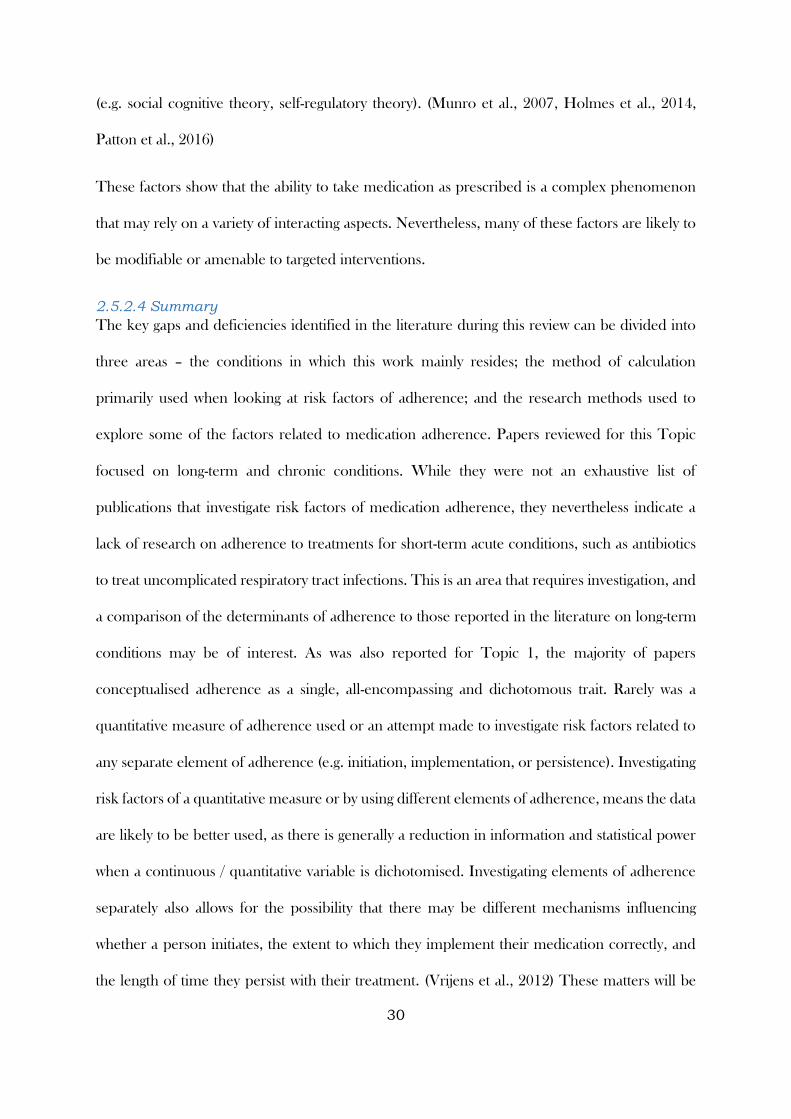
30
(e.g. social cognitive theory, self-regulatory theory). (Munro et al., 2007, Holmes et al., 2014,
Patton et al., 2016)
These factors show that the ability to take medication as prescribed is a complex phenomenon
that may rely on a variety of interacting aspects. Nevertheless, many of these factors are likely to
be modifiable or amenable to targeted interventions.
2.5.2.4 Summary
The key gaps and deficiencies identified in the literature during this review can be divided into
three areas – the conditions in which this work mainly resides; the method of calculation
primarily used when looking at risk factors of adherence; and the research methods used to
explore some of the factors related to medication adherence. Papers reviewed for this Topic
focused on long-term and chronic conditions. While they were not an exhaustive list of
publications that investigate risk factors of medication adherence, they nevertheless indicate a
lack of research on adherence to treatments for short-term acute conditions, such as antibiotics
to treat uncomplicated respiratory tract infections. This is an area that requires investigation, and
a comparison of the determinants of adherence to those reported in the literature on long-term
conditions may be of interest. As was also reported for Topic 1, the majority of papers
conceptualised adherence as a single, all-encompassing and dichotomous trait. Rarely was a
quantitative measure of adherence used or an attempt made to investigate risk factors related to
any separate element of adherence (e.g. initiation, implementation, or persistence). Investigating
risk factors of a quantitative measure or by using different elements of adherence, means the data
are likely to be better used, as there is generally a reduction in information and statistical power
when a continuous / quantitative variable is dichotomised. Investigating elements of adherence
separately also allows for the possibility that there may be different mechanisms influencing
whether a person initiates, the extent to which they implement their medication correctly, and
the length of time they persist with their treatment. (Vrijens et al., 2012) These matters will be
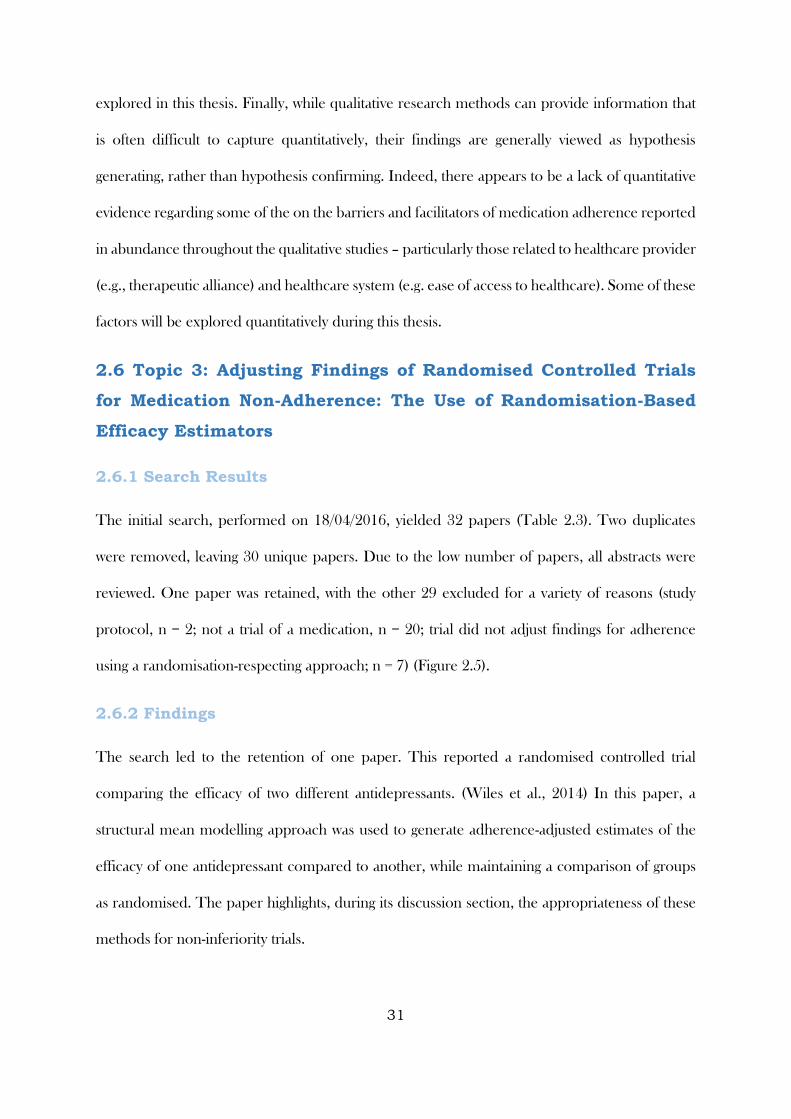
31
explored in this thesis. Finally, while qualitative research methods can provide information that
is often difficult to capture quantitatively, their findings are generally viewed as hypothesis
generating, rather than hypothesis confirming. Indeed, there appears to be a lack of quantitative
evidence regarding some of the on the barriers and facilitators of medication adherence reported
in abundance throughout the qualitative studies – particularly those related to healthcare provider
(e.g., therapeutic alliance) and healthcare system (e.g. ease of access to healthcare). Some of these
factors will be explored quantitatively during this thesis.
2.6 Topic 3: Adjusting Findings of Randomised Controlled Trials
for Medication Non-Adherence: The Use of Randomisation-Based
Efficacy Estimators
2.6.1 Search Results
The initial search, performed on 18/04/2016, yielded 32 papers (Table 2.3). Two duplicates
were removed, leaving 30 unique papers. Due to the low number of papers, all abstracts were
reviewed. One paper was retained, with the other 29 excluded for a variety of reasons (study
protocol, n = 2; not a trial of a medication, n = 20; trial did not adjust findings for adherence
using a randomisation-respecting approach; n = 7) (Figure 2.5).
2.6.2 Findings
The search led to the retention of one paper. This reported a randomised controlled trial
comparing the efficacy of two different antidepressants. (Wiles et al., 2014) In this paper, a
structural mean modelling approach was used to generate adherence-adjusted estimates of the
efficacy of one antidepressant compared to another, while maintaining a comparison of groups
as randomised. The paper highlights, during its discussion section, the appropriateness of these
methods for non-inferiority trials.
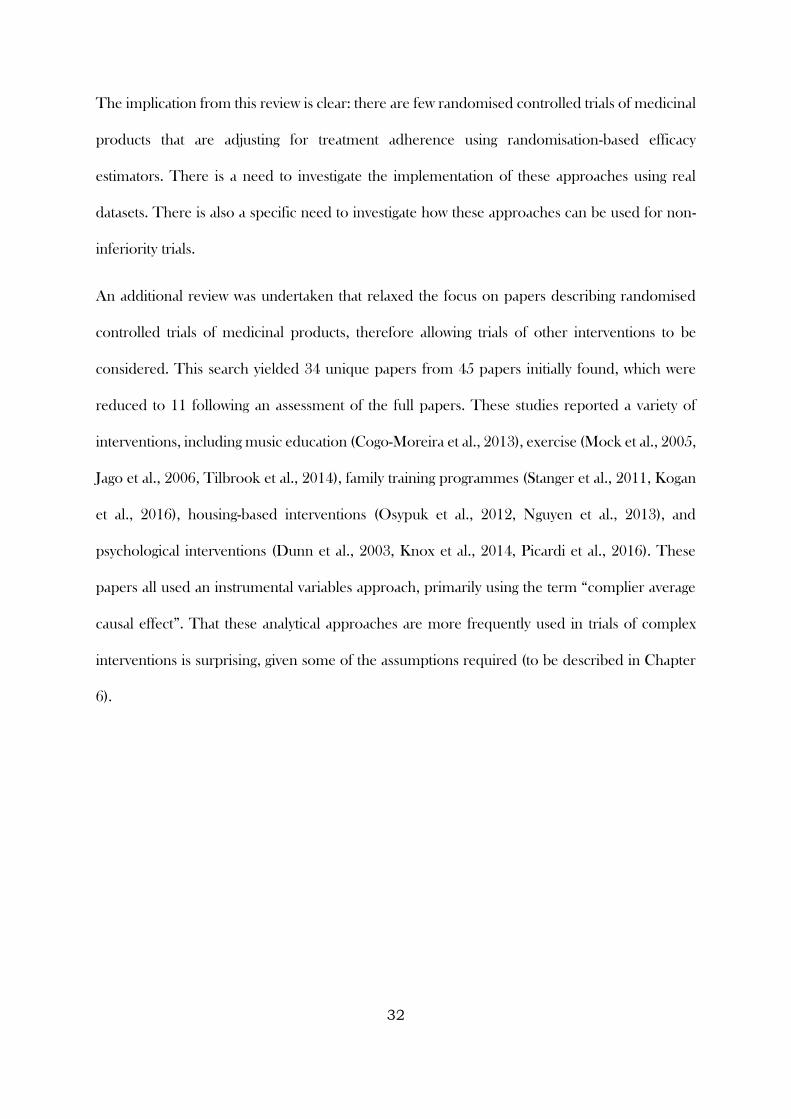
32
The implication from this review is clear: there are few randomised controlled trials of medicinal
products that are adjusting for treatment adherence using randomisation-based efficacy
estimators. There is a need to investigate the implementation of these approaches using real
datasets. There is also a specific need to investigate how these approaches can be used for non-
inferiority trials.
An additional review was undertaken that relaxed the focus on papers describing randomised
controlled trials of medicinal products, therefore allowing trials of other interventions to be
considered. This search yielded 34 unique papers from 45 papers initially found, which were
reduced to 11 following an assessment of the full papers. These studies reported a variety of
interventions, including music education (Cogo-Moreira et al., 2013), exercise (Mock et al., 2005,
Jago et al., 2006, Tilbrook et al., 2014), family training programmes (Stanger et al., 2011, Kogan
et al., 2016), housing-based interventions (Osypuk et al., 2012, Nguyen et al., 2013), and
psychological interventions (Dunn et al., 2003, Knox et al., 2014, Picardi et al., 2016). These
papers all used an instrumental variables approach, primarily using the term “complier average
causal effect”. That these analytical approaches are more frequently used in trials of complex
interventions is surprising, given some of the assumptions required (to be described in Chapter
6).

33
Table 2.3: Findings from the initial search for Topic 3
# Searches (conducted on 18/04/2016) Results
1 (MEDICINE or MEDICATION or DRUG or MEDICINAL).ab. 1048176
2
(ADHERENCE or COMPLIANCE or CONCORDANCE or
PERSISTENCE or INITIATION or IMPLEMENTATION or
DISCONTINUATION).ab.
534564
3 1 and 2 72854
4
(CAUSAL INFERENCE or PRINCIPAL STRATIFICATION or
STRUCTURAL MEAN MODEL or RANDOMISATION BASED
EFFICACY ESTIMATOR or INSTRUMENTAL VARIABLE or
INSTRUMENTAL VARIABLES or COMPLIER AVERAGE CAUSAL
EFFECT or COMPLIER-AVERAGE CAUSAL EFFECT or CACE or
SMM or RANDOMISATION-BASED EFFICACY ESTIMATOR or
ADHERENCE-ADJUSTED or RBEE or STRUCTURAL or
RANDOMIZATION-BASED EFFICACY ESTIMATOR or
RANDOMIZATION BASED EFFICACY ESTIMATOR).af.
487509
5 3 and 4 1126
6 limit 5 to (English language and humans and randomized controlled trial) 32
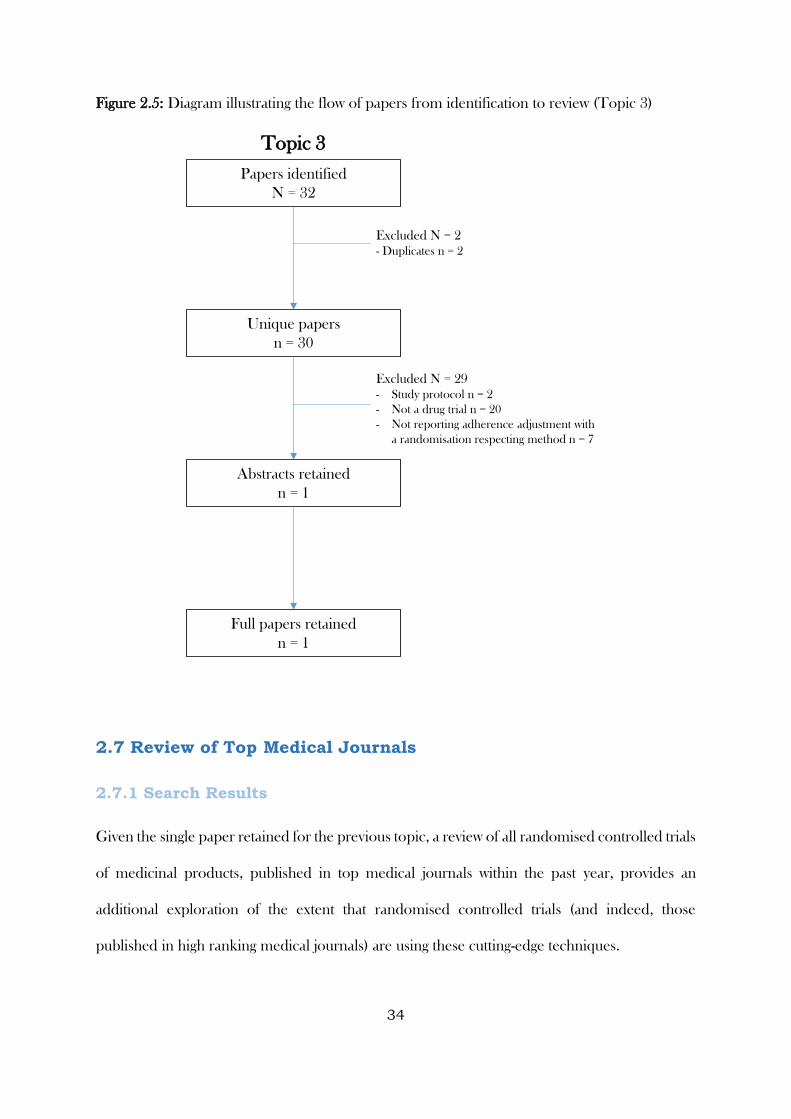
34
Figure 2.5: Diagram illustrating the flow of papers from identification to review (Topic 3)
2.7 Review of Top Medical Journals
2.7.1 Search Results
Given the single paper retained for the previous topic, a review of all randomised controlled trials
of medicinal products, published in top medical journals within the past year, provides an
additional exploration of the extent that randomised controlled trials (and indeed, those
published in high ranking medical journals) are using these cutting-edge techniques.
Topic 3
Papers identified
N = 32
Unique papers
n = 30
Abstracts retained
n = 1
Full papers retained
n = 1
Excluded N = 2
- Duplicates n = 2
Excluded N = 29
- Study protocol n = 2
- Not a drug trial n = 20
- Not reporting adherence adjustment with
a randomisation respecting method n = 7
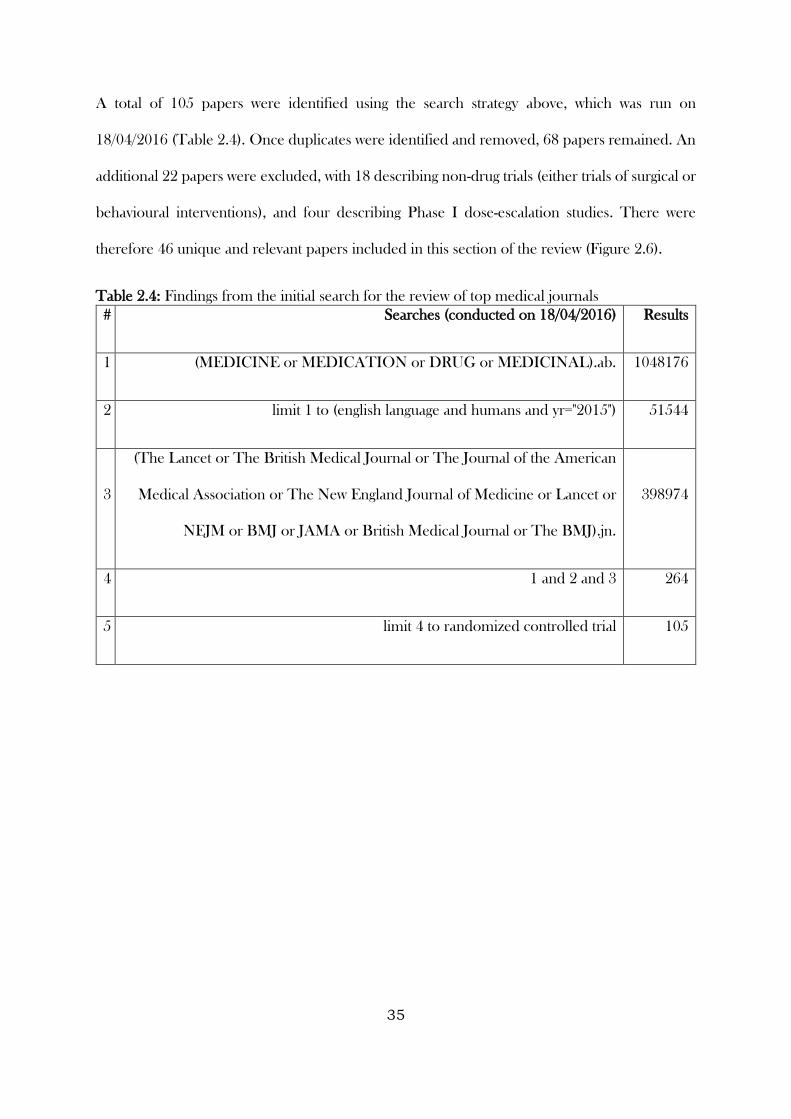
35
A total of 105 papers were identified using the search strategy above, which was run on
18/04/2016 (Table 2.4). Once duplicates were identified and removed, 68 papers remained. An
additional 22 papers were excluded, with 18 describing non-drug trials (either trials of surgical or
behavioural interventions), and four describing Phase I dose-escalation studies. There were
therefore 46 unique and relevant papers included in this section of the review (Figure 2.6).
Table 2.4: Findings from the initial search for the review of top medical journals
# Searches (conducted on 18/04/2016) Results
1 (MEDICINE or MEDICATION or DRUG or MEDICINAL).ab. 1048176
2 limit 1 to (english language and humans and yr="2015") 51544
3
(The Lancet or The British Medical Journal or The Journal of the American
Medical Association or The New England Journal of Medicine or Lancet or
NEJM or BMJ or JAMA or British Medical Journal or The BMJ).jn.
398974
4 1 and 2 and 3 264
5 limit 4 to randomized controlled trial 105
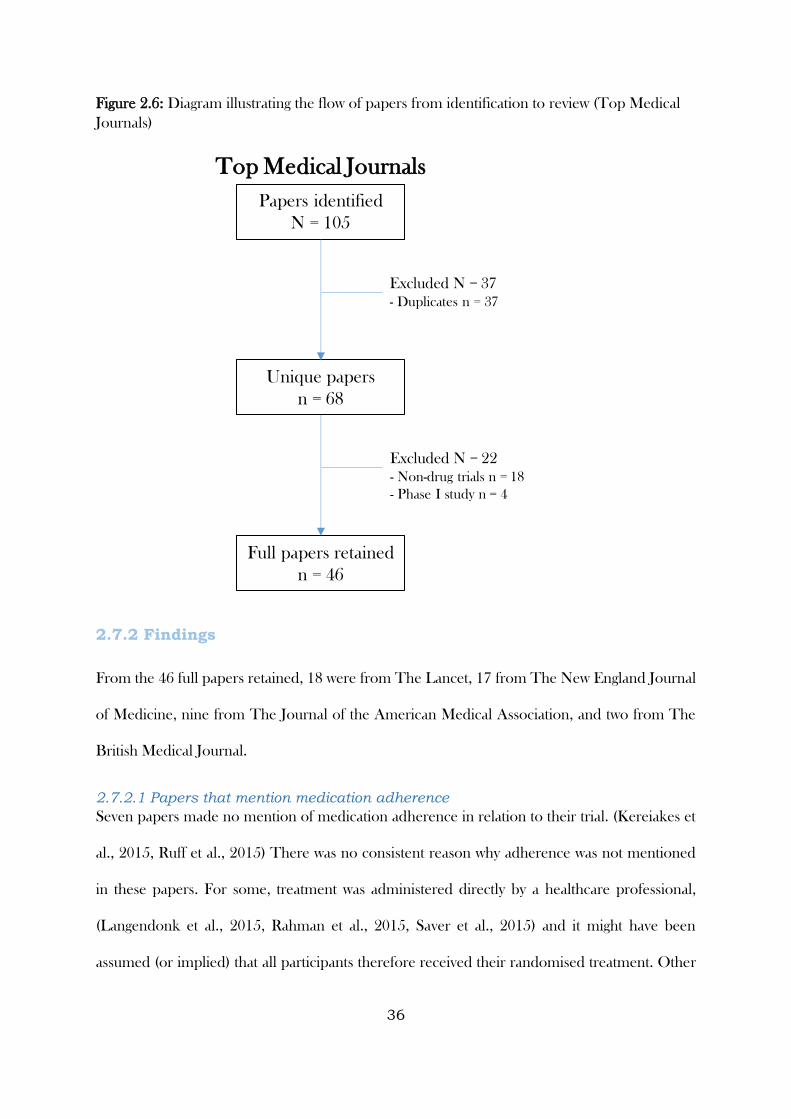
36
Figure 2.6: Diagram illustrating the flow of papers from identification to review (Top Medical
Journals)
2.7.2 Findings
From the 46 full papers retained, 18 were from The Lancet, 17 from The New England Journal
of Medicine, nine from The Journal of the American Medical Association, and two from The
British Medical Journal.
2.7.2.1 Papers that mention medication adherence
Seven papers made no mention of medication adherence in relation to their trial. (Kereiakes et
al., 2015, Ruff et al., 2015) There was no consistent reason why adherence was not mentioned
in these papers. For some, treatment was administered directly by a healthcare professional,
(Langendonk et al., 2015, Rahman et al., 2015, Saver et al., 2015) and it might have been
assumed (or implied) that all participants therefore received their randomised treatment. Other
Top Medical Journals
Papers identified
N = 105
Unique papers
n = 68
Full papers retained
n = 46
Excluded N = 37
- Duplicates n = 37
Excluded N = 22
- Non-drug trials n = 18
- Phase I study n = 4
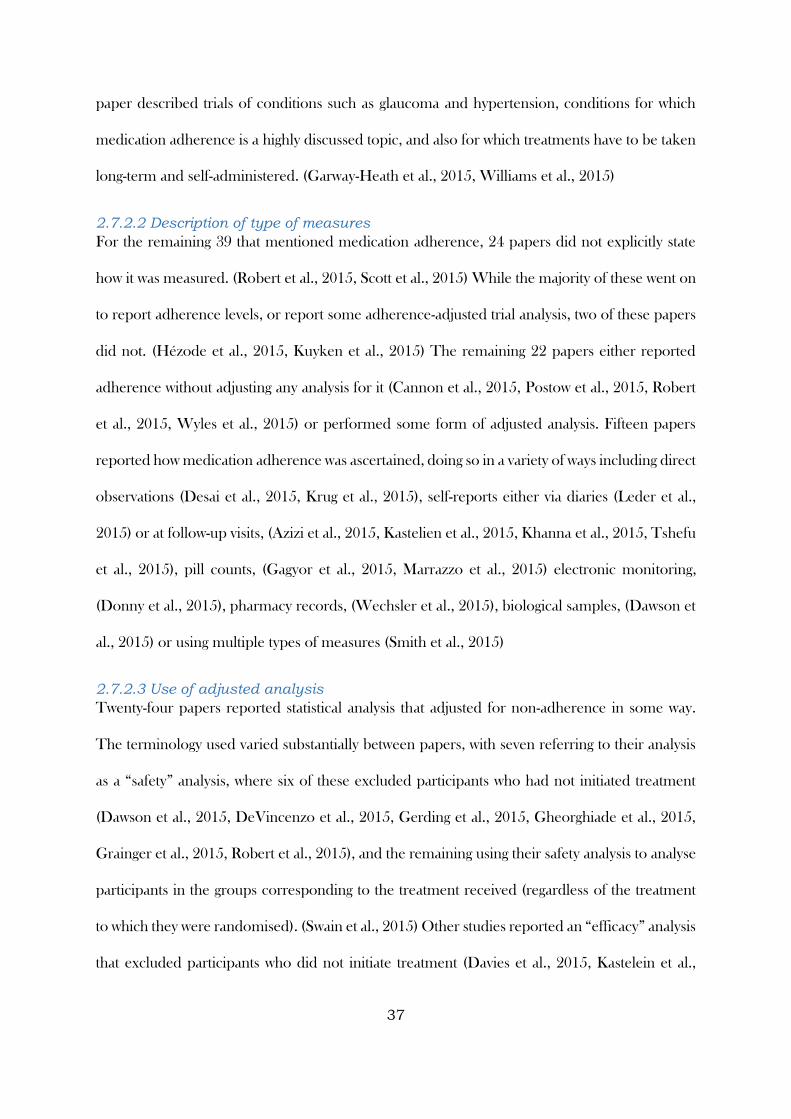
37
paper described trials of conditions such as glaucoma and hypertension, conditions for which
medication adherence is a highly discussed topic, and also for which treatments have to be taken
long-term and self-administered. (Garway-Heath et al., 2015, Williams et al., 2015)
2.7.2.2 Description of type of measures
For the remaining 39 that mentioned medication adherence, 24 papers did not explicitly state
how it was measured. (Robert et al., 2015, Scott et al., 2015) While the majority of these went on
to report adherence levels, or report some adherence-adjusted trial analysis, two of these papers
did not. (Hézode et al., 2015, Kuyken et al., 2015) The remaining 22 papers either reported
adherence without adjusting any analysis for it (Cannon et al., 2015, Postow et al., 2015, Robert
et al., 2015, Wyles et al., 2015) or performed some form of adjusted analysis. Fifteen papers
reported how medication adherence was ascertained, doing so in a variety of ways including direct
observations (Desai et al., 2015, Krug et al., 2015), self-reports either via diaries (Leder et al.,
2015) or at follow-up visits, (Azizi et al., 2015, Kastelien et al., 2015, Khanna et al., 2015, Tshefu
et al., 2015), pill counts, (Gagyor et al., 2015, Marrazzo et al., 2015) electronic monitoring,
(Donny et al., 2015), pharmacy records, (Wechsler et al., 2015), biological samples, (Dawson et
al., 2015) or using multiple types of measures (Smith et al., 2015)
2.7.2.3 Use of adjusted analysis
Twenty-four papers reported statistical analysis that adjusted for non-adherence in some way.
The terminology used varied substantially between papers, with seven referring to their analysis
as a “safety” analysis, where six of these excluded participants who had not initiated treatment
(Dawson et al., 2015, DeVincenzo et al., 2015, Gerding et al., 2015, Gheorghiade et al., 2015,
Grainger et al., 2015, Robert et al., 2015), and the remaining using their safety analysis to analyse
participants in the groups corresponding to the treatment received (regardless of the treatment
to which they were randomised). (Swain et al., 2015) Other studies reported an “efficacy” analysis
that excluded participants who did not initiate treatment (Davies et al., 2015, Kastelein et al.,
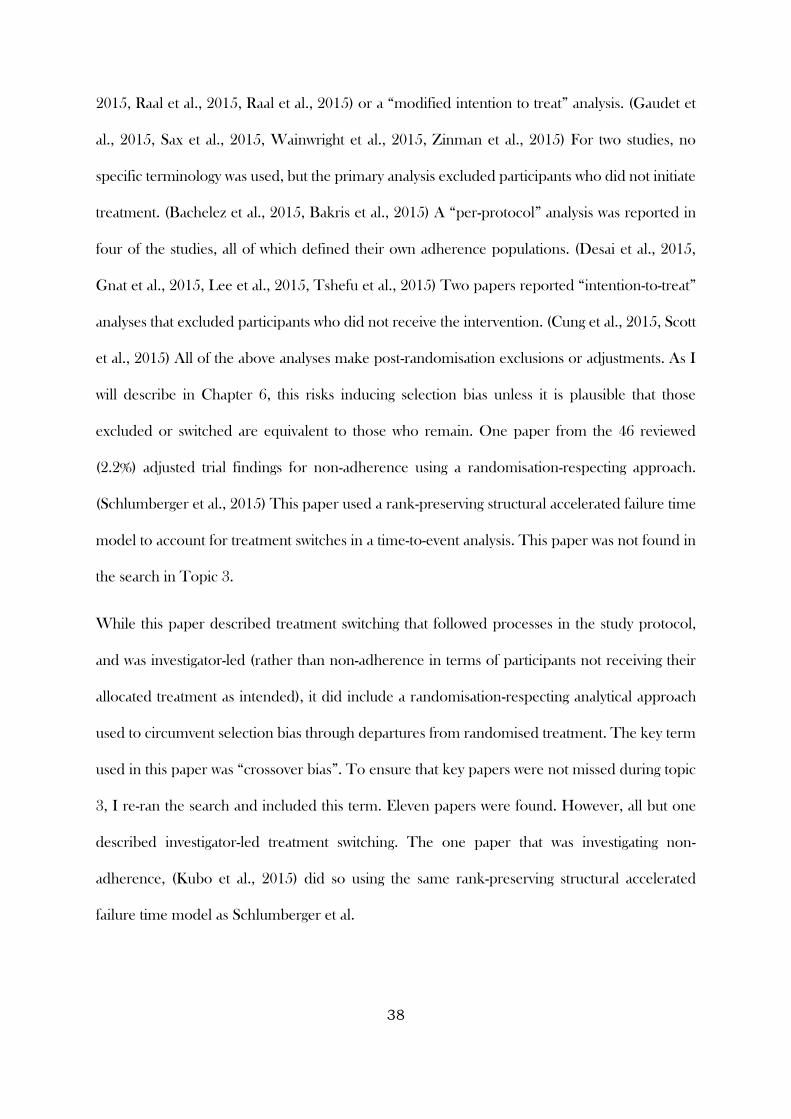
38
2015, Raal et al., 2015, Raal et al., 2015) or a “modified intention to treat” analysis. (Gaudet et
al., 2015, Sax et al., 2015, Wainwright et al., 2015, Zinman et al., 2015) For two studies, no
specific terminology was used, but the primary analysis excluded participants who did not initiate
treatment. (Bachelez et al., 2015, Bakris et al., 2015) A “per-protocol” analysis was reported in
four of the studies, all of which defined their own adherence populations. (Desai et al., 2015,
Gnat et al., 2015, Lee et al., 2015, Tshefu et al., 2015) Two papers reported “intention-to-treat”
analyses that excluded participants who did not receive the intervention. (Cung et al., 2015, Scott
et al., 2015) All of the above analyses make post-randomisation exclusions or adjustments. As I
will describe in Chapter 6, this risks inducing selection bias unless it is plausible that those
excluded or switched are equivalent to those who remain. One paper from the 46 reviewed
(2.2%) adjusted trial findings for non-adherence using a randomisation-respecting approach.
(Schlumberger et al., 2015) This paper used a rank-preserving structural accelerated failure time
model to account for treatment switches in a time-to-event analysis. This paper was not found in
the search in Topic 3.
While this paper described treatment switching that followed processes in the study protocol,
and was investigator-led (rather than non-adherence in terms of participants not receiving their
allocated treatment as intended), it did include a randomisation-respecting analytical approach
used to circumvent selection bias through departures from randomised treatment. The key term
used in this paper was “crossover bias”. To ensure that key papers were not missed during topic
3, I re-ran the search and included this term. Eleven papers were found. However, all but one
described investigator-led treatment switching. The one paper that was investigating non-
adherence, (Kubo et al., 2015) did so using the same rank-preserving structural accelerated
failure time model as Schlumberger et al.
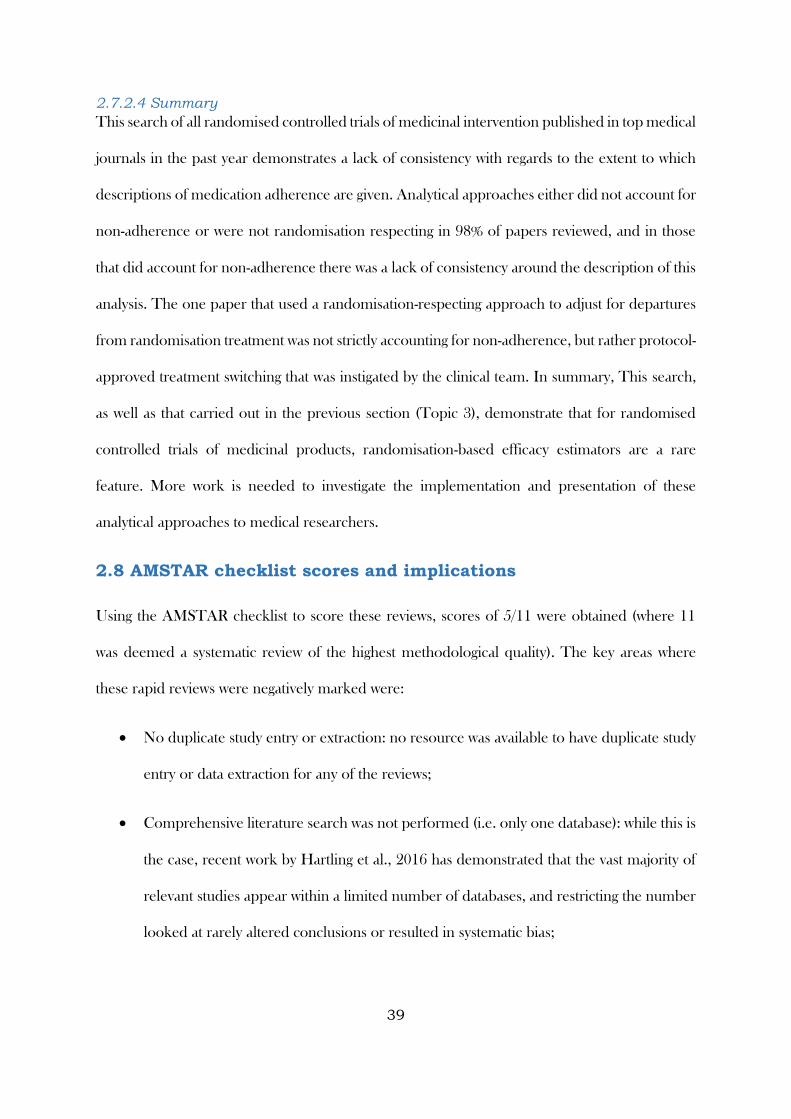
39
2.7.2.4 Summary
This search of all randomised controlled trials of medicinal intervention published in top medical
journals in the past year demonstrates a lack of consistency with regards to the extent to which
descriptions of medication adherence are given. Analytical approaches either did not account for
non-adherence or were not randomisation respecting in 98% of papers reviewed, and in those
that did account for non-adherence there was a lack of consistency around the description of this
analysis. The one paper that used a randomisation-respecting approach to adjust for departures
from randomisation treatment was not strictly accounting for non-adherence, but rather protocol-
approved treatment switching that was instigated by the clinical team. In summary, This search,
as well as that carried out in the previous section (Topic 3), demonstrate that for randomised
controlled trials of medicinal products, randomisation-based efficacy estimators are a rare
feature. More work is needed to investigate the implementation and presentation of these
analytical approaches to medical researchers.
2.8 AMSTAR checklist scores and implications
Using the AMSTAR checklist to score these reviews, scores of 5/11 were obtained (where 11
was deemed a systematic review of the highest methodological quality). The key areas where
these rapid reviews were negatively marked were:
No duplicate study entry or extraction: no resource was available to have duplicate study
entry or data extraction for any of the reviews;
Comprehensive literature search was not performed (i.e. only one database): while this is
the case, recent work by Hartling et al., 2016 has demonstrated that the vast majority of
relevant studies appear within a limited number of databases, and restricting the number
looked at rarely altered conclusions or resulted in systematic bias;

40
List of excluded studies were not included: while this is also the case, reasons for
excluding studies were documented throughout.
Two items were deemed not applicable, as they appeared focused on a systematic review asking
a clinical question, rather than methodological literature reviews (assessments of publication bias
and conflicts of interest).
Despite this, the literature reviews provide a broad overview of the methodological areas, key
authors were identified a priori, with searches re-run to screen for their works, and to ensure key
papers were not missed during Topic 3, I re-ran the search using a term newly discovered during
my review of randomised controlled trials from top medical journals.
2.9 Summary
These literature reviews have identified some key gaps and deficiencies that will be explored
during this thesis:
Adherence to treatments for short-term or acute conditions appears to be an under
researched area, with literature tending to focus on long-term conditions. During my
thesis, I intend to explore both, and particularly will aim to see how certain paradigms
that have been developed for long-term conditions fit with short-term conditions.
Electronic monitoring is a popular method for obtaining data on medication adherence.
Despite this, there seems to be an overreliance on simple summary measure. I plan to
use advanced statistical modelling techniques to exploit the richness of data obtained
from electronic monitors.
Bland-Altman plots and limits of agreement are seldom used to assess agreement
between different types of adherence measures. I will investigate their use, as well as the
use of other agreement techniques and plotting methods during this thesis.

41
Approaches for determining risk factors for disagreement between measures will be
considered throughout this thesis, as will methods for deriving calibrated measure of
adherence when multiple sources are available
Determining risk factors for non-adherence will be considered for both short and long-
term conditions. The value of separating adherence out into different processes (rather
than modelling it as a single summary measure) will be explored.
Modelling approaches that aim to quantify the extent of therapeutic alliance, or influence
that clinicians have on a patient’s adherence, will be investigated.
The implementation of randomisation-based efficacy estimators to adjust randomised
controlled trials will be investigated. This work will consider these approaches for both
placebo-controlled superiority trials and non-inferiority trials with two active treatments.
The uses and limitations of these approaches using real world data, as well as effective
ways of communicating the approaches and their findings, will be of primary focus.
The following Chapter will describe the data used to address the abovementioned gaps and
deficiencies.
42
2.10 Studies included in Topic 1
Almeida, E.D., Rodrigues, L.C.S. and Vieira, J.L.F., 2014. Estimates of adherence to treatment
of vivax malaria. Malaria journal, 13(1), p.1.
Anastasio, G.D., Little, J.M., Robinson, M.D., Pettice, Y.L., Leitch, B.B. and Norton, H.J.,
1994. Impact of compliance and side effects on the clinical outcome of patients treated with oral
erythromycin. Pharmacotherapy: The Journal of Human Pharmacology and Drug Therapy,
14(2), pp.229-234.
Andy, U.U., Harvie, H.S., Smith, A.L., Propert, K.J., Bogner, H.R. and Arya, L.A., 2015.
Validation of a self‐administered instrument to measure adherence to anticholinergic drugs in
women with overactive bladder. Neurourology and urodynamics, 34(5), pp.424-428.
Ayoade, A. and Oladipo, I., 2012. Evaluation of the correlation between self-report and
electronic monitoring of adherence to hypertension therapy. Blood pressure, 21(3), pp.161-166.
Banek, K., Lalani, M., Staedke, S.G. and Chandramohan, D., 2014. Adherence to artemisinin-
based combination therapy for the treatment of malaria: a systematic review of the evidence.
Malaria journal, 13(1), p.1.
Baxi, S.M., Liu, A., Bacchetti, P., Mutua, G., Sanders, E.J., Kibengo, F.M., Haberer, J.E.,
Rooney, J., Hendrix, C.W., Anderson, P.L. and Huang, Y., 2015. Comparing the novel method
of assessing PrEP adherence/exposure using hair samples to other pharmacologic and traditional
measures. JAIDS Journal of Acquired Immune Deficiency Syndromes, 68(1), pp.13-20.
Berg, J., Dunbar-Jacob, J. and Rohay, J.M., 1998. Compliance with inhaled medications: the
relationship between diary and electronic monitor. Annals of Behavioral Medicine, 20(1), pp.36-
38.
43
Bogner, H.R., de Vries, H.F., O’Donnell, A.J. and Morales, K.H., 2013. Measuring concurrent
oral hypoglycemic and antidepressant adherence and clinical outcomes. The American journal
of managed care, 19(3), p.e85.
Boland, M.V., Chang, D.S., Frazier, T., Plyler, R., Jefferys, J.L. and Friedman, D.S., 2014.
Automated telecommunication-based reminders and adherence with once-daily glaucoma
medication dosing: the automated dosing reminder study. JAMA ophthalmology, 132(7),
pp.845-850.
Brain, C., Sameby, B., Allerby, K., Lindström, E., Eberhard, J., Burns, T. and Waern, M., 2014.
Twelve months of electronic monitoring (MEMS®) in the Swedish COAST-study: a comparison
of methods for the measurement of adherence in schizophrenia. European
Neuropsychopharmacology, 24(2), pp.215-222.
Brask-Lindemann, D., Cadarette, S.M., Eskildsen, P. and Abrahamsen, B., 2011. Osteoporosis
pharmacotherapy following bone densitometry: importance of patient beliefs and understanding
of DXA results. Osteoporosis international, 22(5), pp.1493-1501.
Buscher, A., Hartman, C., Kallen, M.A. and Giordano, T.P., 2015. Validity of self-report
measures in assessing antiretroviral adherence of newly diagnosed, HAART-naive, HIV patients.
HIV clinical trials.
Butler, J.A., Peveler, R.C., Roderick, P., Horne, R. and Mason, J.C., 2004. Measuring
compliance with drug regimens after renal transplantation: comparison of self-report and
clinician rating with electronic monitoring. Transplantation, 77(5), pp.786-789.
Butz, A.M., Donithan, M., Bollinger, M.E., Rand, C. and Thompson, R.E., 2005. Monitoring
nebulizer use in children: comparison of electronic and asthma diary data. Annals of Allergy,
Asthma & Immunology, 94(3), pp.360-365.
44
Byerly, M.J., Thompson, A., Carmody, T., Bugno, R., Erwin, T., Kashner, M. and Rush, A.J.,
2007. Validity of electronically monitored medication adherence and conventional adherence
measures in schizophrenia. Psychiatric Services, 58(6), pp.844-847.
Casey, J.R., Block, S.L., Hedrick, J., Almudevar, A. and Pichichero, M.E., 2012. Comparison
of amoxicillin/clavulanic acid high dose with cefdinir in the treatment of acute otitis media. Drugs,
72(15), pp.1991-1997.
Cassidy, C.M., Rabinovitch, M., Schmitz, N., Joober, R. and Malla, A., 2010. A comparison
study of multiple measures of adherence to antipsychotic medication in first-episode psychosis.
Journal of clinical psychopharmacology, 30(1), pp.64-67.
Choo, P.W., Rand, C.S., Inui, T.S., Lee, M.L.T., Cain, E., Cordeiro-Breault, M., Canning, C.
and Platt, R., 1999. Validation of patient reports, automated pharmacy records, and pill counts
with electronic monitoring of adherence to antihypertensive therapy. Medical care, 37(9),
pp.846-857.
Chui, M.A., Deer, M., Bennett, S.J., Tu, W., Oury, S., Brater, D.C. and Murray, M.D., 2003.
Association between adherence to diuretic therapy and health care utilization in patients with
heart failure. Pharmacotherapy: The Journal of Human Pharmacology and Drug Therapy, 23(3),
pp.326-332.
Clifford, S., Perez-Nieves, M., Skalicky, A.M., Reaney, M. and Coyne, K.S., 2014. A systematic
literature review of methodologies used to assess medication adherence in patients with diabetes.
Current medical research and opinion, 30(6), pp.1071-1085.
Cooper, G.A., Allen, D.L., Scott, K.S., Oliver, J.S., Ditton, J. and Smith, I.D., 2000. Hair
analysis: self-reported use of “speed” and “ecstasy” compared with laboratory findings. Journal
of Forensic Science, 45(2), pp.400-406.
45
Daniels, T., Goodacre, L., Sutton, C., Pollard, K., Conway, S. and Peckham, D., 2011. Accurate
assessment of adherence: self-report and clinician report vs electronic monitoring of nebulizers.
CHEST Journal, 140(2), pp.425-432.
De Klerk, E., Van der Heijde, D., Van der Tempel, H. and Van Der Linden, S., 1999.
Development of a questionnaire to investigate patient compliance with antirheumatic drug
therapy. The Journal of rheumatology, 26(12), pp.2635-2641.
De las Cuevas, C., Peñate, W. and Sanz, E.J., 2014. Risk factors for non-adherence to
antidepressant treatment in patients with mood disorders. European journal of clinical
pharmacology, 70(1), pp.89-98.
Digiusto, E., Seres, V., Bibby, A. and Batey, R., 1996. Concordance between urinalysis results
and self-reported drug use by applicants for methadone maintenance in Australia. Addictive
behaviors, 21(3), pp.319-329.
DiMatteo, M.R., 2004. Variations in patients’ adherence to medical recommendations: a
quantitative review of 50 years of research. Medical care, 42(3), pp.200-209.
Dlamini, P.S., Wantland, D., Makoae, L.N., Chirwa, M., Kohi, T.W., Greeff, M., Naidoo, J.,
Mullan, J., Uys, L.R. and Holzemer, W.L., 2009. HIV stigma and missed medications in HIV-
positive people in five African countries. AIDS patient care and STDs, 23(5), pp.377-387.
Dolder, C.R., Lacro, J.P., Warren, K.A., Golshan, S., Perkins, D.O. and Jeste, D.V., 2004. Brief
evaluation of medication influences and beliefs: development and testing of a brief scale for
medication adherence. Journal of clinical psychopharmacology, 24(4), pp.404-409.
Dorz, S., Lazzarini, L., Cattelan, A., Meneghetti, F., Novara, C., Concia, E., Sica, C. and Sanavio,
E., 2003. Evaluation of adherence to antiretroviral therapy in Italian HIV patients. AIDS patient
care and STDs, 17(1), pp.33-41.
46
El Zubier, A.G., 2000. Drug compliance among hypertensive patients in Kassala, eastern Sudan.
Elm, J.J., Kamp, C., Tilley, B.C., Guimaraes, P., Fraser, D., Deppen, P., Brocht, A., Weaver,
C. and Bennett, S., 2007. Self‐reported adherence versus pill count in Parkinson's disease: The
NET‐PD experience. Movement disorders, 22(6), pp.822-827.
Escalada, P. and Griffiths, P., 2006. Do people with cancer comply with oral chemotherapy
treatments?. British journal of community nursing, 11(12).
Esposito, D., Schone, E., Williams, T., Liu, S., CyBulski, K., Stapulonis, R. and Clusen, N.,
2008. Prevalence of unclaimed prescriptions at military pharmacies. Journal of Managed Care
Pharmacy, 14(6), pp.541-552.
Farmer, A., Kinmonth, A.L. and Sutton, S., 2006. Measuring beliefs about taking hypoglycaemic
medication among people with Type 2 diabetes. Diabetic Medicine, 23(3), pp.265-270.
Farmer, K.C., 1999. Methods for measuring and monitoring medication regimen adherence in
clinical trials and clinical practice. Clinical therapeutics, 21(6), pp.1074-1090.
Feinn, R., Tennen, H., Cramer, J. and Kranzler, H.R., 2003. Measurement and prediction of
medication compliance in problem drinkers. Alcoholism: Clinical and Experimental Research,
27(8), pp.1286-1292.
Frangou, S., Sachpazidis, I., Stassinakis, A. and Sakas, G., 2005. Telemonitoring of medication
adherence in patients with schizophrenia. Telemedicine Journal & E-Health, 11(6), pp.675-683.
Gabriel, A. and Violato, C., 2010. Knowledge of and attitudes towards depression and adherence
to treatment: The Antidepressant Adherence Scale (AAS). Journal of affective disorders, 126(3),
pp.388-394.
47
Garavan, J., Browne, S., Gervin, M., Lane, A., Larkin, C. and O'callaghan, E., 1998. Compliance
with neuroleptic medication in outpatients with schizophrenia; relationship to subjective
response to neuroleptics; attitudes to medication and insight. Comprehensive psychiatry, 39(4),
pp.215-219.
Garber, M.C., Nau, D.P., Erickson, S.R., Aikens, J.E. and Lawrence, J.B., 2004. The
concordance of self-report with other measures of medication adherence: a summary of the
literature. Medical care, 42(7), pp.649-652.
Gerson, A.C., Furth, S.L., Neu, A.M. and Fivush, B.A., 2004. Assessing associations between
medication adherence and potentially modifiable psychosocial variables in pediatric kidney
transplant recipients and their families. Pediatric transplantation, 8(6), pp.543-550.
Haberer, J.E., Cook, A., Walker, A.S., Ngambi, M., Ferrier, A., Mulenga, V., Kityo, C.,
Thomason, M., Kabamba, D., Chintu, C. and Gibb, D.M., 2011. Excellent adherence to
antiretrovirals in HIV+ Zambian children is compromised by disrupted routine, HIV
nondisclosure, and paradoxical income effects. PloS one, 6(4), p.e18505.
Horne, R., Clatworthy, J. and Hankins, M., 2010. High adherence and concordance within a
clinical trial of antihypertensives. Chronic Illness.
Jerant, A., DiMatteo, R., Arnsten, J., Moore-Hill, M. and Franks, P., 2008. Self-report adherence
measures in chronic illness: retest reliability and predictive validity. Medical care, 46(11),
pp.1134-1139.
Mahler, C., Hermann, K., Horne, R., Ludt, S., Haefeli, W.E., Szecsenyi, J. and Jank, S., 2010.
Assessing reported adherence to pharmacological treatment recommendations. Translation and
evaluation of the Medication Adherence Report Scale (MARS) in Germany. Journal of
evaluation in clinical practice, 16(3), pp.574-579.
48
2.11 Studies included in Topic 2
Bagchi, A.D., Esposito, D., Kim, M., Verdier, J. and Bencio, D., 2007. Utilization of, and
adherence to, drug therapy among Medicaid beneficiaries with congestive heart failure. Clinical
therapeutics, 29(8), pp.1771-1783.
Beni, J.B., 2011. Technology and the healthcare system: implications for patient adherence.
International journal of electronic healthcare, 6(2-4), pp.117-137.
Berk, M., Berk, L. and Castle, D., 2004. A collaborative approach to the treatment alliance in
bipolar disorder. Bipolar disorders, 6(6), pp.504-518.
Bofill, L.M., Lopez, M., Dorigo, A., Bordato, A., Lucas, M., Cabanillas, G.F., Sued, O., Cahn,
P., Cassetti, I., Weiss, S. and Jones, D., 2014. Patient–provider perceptions on engagement in
HIV care in Argentina. AIDS care, 26(5), pp.602-607.
Browne, T. and Merighi, J.R., 2010. Barriers to adult hemodialysis patients' self-management of
oral medications. American Journal of Kidney Diseases, 56(3), pp.547-557.
Chen, L.C., Chen, T.C., Huang, Y.B. and Chang, C.S., 2014. Disease acceptance and adherence
to imatinib in Taiwanese chronic myeloid leukaemia outpatients. International journal of clinical
pharmacy, 36(1), pp.120-127.
Chesney, M., 2003. Adherence to HAART regimens. AIDS patient care and STDs, 17(4),
pp.169-177.
Coletti, D.J., Pappadopulos, E., Katsiotas, N.J., Berest, A., Jensen, P.S. and Kafantaris, V., 2012.
Parent perspectives on the decision to initiate medication treatment of attention-
deficit/hyperactivity disorder. Journal of child and adolescent psychopharmacology, 22(3),
pp.226-237.
49
Dalbeth, N., Petrie, K.J., House, M., Chong, J., Leung, W., Chegudi, R., Horne, A., Gamble,
G., McQueen, F.M. and Taylor, W.J., 2011. Illness perceptions in patients with gout and the
relationship with progression of musculoskeletal disability. Arthritis care & research, 63(11),
pp.1605-1612.
Dean, A.J., Wragg, J., Draper, J. and McDermott, B.M., 2011. Predictors of medication
adherence in children receiving psychotropic medication. Journal of paediatrics and child health,
47(6), pp.350-355.
Dharmapuri, S., Best, D., Kind, T., Silber, T.J., Simpson, P. and D'Angelo, L., 2015. Health
literacy and medication adherence in adolescents. The Journal of pediatrics, 166(2), pp.378-382.
Drotar, D. and Bonner, M.S., 2009. Influences on adherence to pediatric asthma treatment: a
review of correlates and predictors. Journal of Developmental & Behavioral Pediatrics, 30(6),
pp.574-582.
Gadkari, A.S. and McHorney, C.A., 2012. Unintentional non-adherence to chronic prescription
medications: how unintentional is it really?. BMC health services research, 12(1), p.1.
Grant, E., Logie, D., Masura, M., Gorman, D. and Murray, S.A., 2008. Factors facilitating and
challenging access and adherence to antiretroviral therapy in a township in the Zambian
Copperbelt: a qualitative study. AIDS care, 20(10), pp.1155-1160.
Grant, R.W., O’Leary, K.M., Weilburg, J.B., Singer, D.E. and Meigs, J.B., 2004. Impact of
concurrent medication use on statin adherence and refill persistence. Archives of internal
medicine, 164(21), pp.2343-2348.
Harvey, K.M., Carrington, D., Duncan, J., Figueroa, J.P., Hirschorn, L., Manning, D. and
Jackson, S., 2008. Evaluation of adherence to highly active antiretroviral therapy in adults in
Jamaica. West Indian Medical Journal, 57(3), pp.293-297.
50
Henriques, M.A., Costa, M.A. and Cabrita, J., 2012. Adherence and medication management
by the elderly. Journal of clinical nursing, 21(21-22), pp.3096-3105.
Horne, R. and Weinman, J., 1999. Patients' beliefs about prescribed medicines and their role in
adherence to treatment in chronic physical illness. Journal of psychosomatic research, 47(6),
pp.555-567.
Johnson, F.R., Özdemir, S., Manjunath, R., Hauber, A.B., Burch, S.P. and Thompson, T.R.,
2007. Factors that affect adherence to bipolar disorder treatments: a stated-preference approach.
Medical care, 45(6), pp.545-552.
Kalkan, K., Bacciogly, K. and Kalpakliogly, A.F., 2013. Allergic rhinitis: can we identify
nonadherence to therapy and its predictors easily in daily practice. J Investig Allergol Clin
Immunol, 23(5), pp.315-322.
Kjellgren, K., Ring, L., Lindblad, A.K., Maroti, M. and Serup, J., 2004. To Follow
Dermatological Treatment Regimens- Patients' and Providers' Views. Acta dermato-
venereologica, 84(6), pp.445-450.
Li, W.W., Stotts, N.A. and Froelicher, E.S., 2007. Compliance with antihypertensive medication
in Chinese immigrants: cultural specific issues and theoretical application. Research and theory
for nursing practice, 21(4), pp.236-254.
Lin, C.W., Karaca-Mandic, P., McCullough, J.S. and Weaver, L., 2014. Access to Oral
Osteoporosis Drugs Among Female Medicare Part D Beneficiaries. Women's Health Issues,
24(4), pp.e435-e445.
Lin, W.S., Yang, W.S. and Lin, H.Y., 1995. Prednisolone non-compliance and its related factors
in patients with systemic lupus erythematosus. Zhonghua yi xue za zhi= Chinese medical journal;
Free China ed, 56(4), pp.244-251.
51
Mackey, K., Parchman, M.L., Leykum, L.K., Lanham, H.J., Noël, P.H. and Zeber, J.E., 2012.
Impact of the Chronic Care Model on medication adherence when patients perceive cost as a
barrier. Primary care diabetes, 6(2), pp.137-142.
Nischal, K.C., Khopkar, U. and Saple, D.G., 2005. Improving adherence to antiretroviral
therapy. Indian Journal of Dermatology, Venereology, and Leprology, 71(5), p.316.
2.12 Studies included in Topic 3
Cogo-Moreira, H., de Avila, C.R.B., Ploubidis, G.B. and de Jesus Mari, J., 2013. Effectiveness
of music education for the improvement of reading skills and academic achievement in young
poor readers: a pragmatic cluster-randomized, controlled clinical trial. PloS one, 8(3), p.e59984.
Dunn, G., Maracy, M., Dowrick, C., Ayuso-Mateos, J.L., Dalgard, O.S., Page, H., Lehtinen, V.,
Casey, P., Wilkinson, C., Vázquez-Barquero, J.L. and Wilkinson, G., 2003. Estimating
psychological treatment effects from a randomised controlled trial with both non-compliance and
loss to follow-up. The British Journal of Psychiatry, 183(4), pp.323-331.
Jago, R., Edwards, M.J., Sebire, S.J., Tomkinson, K., Bird, E.L., Banfield, K., May, T., Kesten,
J.M., Cooper, A.R., Powell, J.E. and Blair, P.S., 2015. Effect and cost of an after-school dance
programme on the physical activity of 11–12 year old girls: The Bristol Girls Dance Project, a
school-based cluster randomised controlled trial. International Journal of Behavioral Nutrition
and Physical Activity, 12(1), p.128.
Knox, C.R., Lall, R., Hansen, Z. and Lamb, S.E., 2014. Treatment compliance and effectiveness
of a cognitive behavioural intervention for low back pain: a complier average causal effect
approach to the BeST data set. BMC musculoskeletal disorders, 15(1), p.17.
Kogan, S.M., Lei, M.K., Brody, G.H., Futris, T.G., Sperr, M. and Anderson, T., 2016.
Implementing family-centered prevention in rural African American communities: a randomized
52
effectiveness trial of the strong African American families program. Prevention Science, 17(2),
pp.248-258.
Mock, V., Frangakis, C., Davidson, N.E., Ropka, M.E., Pickett, M., Poniatowski, B., Stewart,
K.J., Cameron, L., Zawacki, K., Podewils, L.J. and Cohen, G., 2005. Exercise manages fatigue
during breast cancer treatment: a randomized controlled trial. Psycho‐Oncology, 14(6), pp.464-
477.
Nguyen, Q.C., Schmidt, N.M., Glymour, M.M., Rehkopf, D.H. and Osypuk, T.L., 2013. Were
the mental health benefits of a housing mobility intervention larger for adolescents in higher
socioeconomic status families?. Health & place, 23, pp.79-88.
Osypuk, T.L., Schmidt, N.M., Bates, L.M., Tchetgen-Tchetgen, E.J., Earls, F.J. and Glymour,
M.M., 2012. Gender and crime victimization modify neighborhood effects on adolescent mental
health. Pediatrics, pp.peds-2011.
Picardi, A., Lega, I., Tarsitani, L., Caredda, M., Matteucci, G., Zerella, M.P., Miglio, R.,
Gigantesco, A., Cerbo, M., Gaddini, A. and Spandonaro, F., 2016. A randomised controlled
trial of the effectiveness of a program for early detection and treatment of depression in primary
care. Journal of affective disorders, 198, pp.96-101.
Stanger, C., Ryan, S.R., Fu, H. and Budney, A.J., 2011. Parent training plus contingency
management for substance abusing families: A Complier Average Causal Effects (CACE)
analysis. Drug and alcohol dependence, 118(2), pp.119-126.
Tilbrook, H.E., Hewitt, C.E., Aplin, J.D., Semlyen, A., Trewhela, A., Watt, I. and Torgerson,
D.J., 2014. Compliance effects in a randomised controlled trial of yoga for chronic low back
pain: a methodological study. Physiotherapy, 100(3), pp.256-262.
53
Wiles, N.J., Fischer, K., Cowen, P., Nutt, D., Peters, T.J., Lewis, G. and White, I.R., 2014.
Allowing for non-adherence to treatment in a randomized controlled trial of two antidepressants
(citalopram versus reboxetine): an example from the GENPOD trial. Psychological medicine,
44(13), pp.2855-2866.
2.13 Studies included in review of top medical journals
Azizi, M., Sapoval, M., Gosse, P., Monge, M., Bobrie, G., Delsart, P., Midulla, M., Mounier-
Véhier, C., Courand, P.Y., Lantelme, P. and Denolle, T., 2015. Optimum and stepped care
standardised antihypertensive treatment with or without renal denervation for resistant
hypertension (DENERHTN): a multicentre, open-label, randomised controlled trial. The
Lancet, 385(9981), pp.1957-1965.
Bachelez, H., van de Kerkhof, P.C., Strohal, R., Kubanov, A., Valenzuela, F., Lee, J.H.,
Yakusevich, V., Chimenti, S., Papacharalambous, J., Proulx, J. and Gupta, P., 2015. Tofacitinib
versus etanercept or placebo in moderate-to-severe chronic plaque psoriasis: a phase 3
randomised non-inferiority trial. The Lancet, 386(9993), pp.552-561.
Bakris, G.L., Agarwal, R., Chan, J.C., Cooper, M.E., Gansevoort, R.T., Haller, H., Remuzzi, G.,
Rossing, P., Schmieder, R.E., Nowack, C. and Kolkhof, P., 2015. Effect of finerenone on
albuminuria in patients with diabetic nephropathy: a randomized clinical trial. Jama, 314(9),
pp.884-894.
Cannon, C.P., Blazing, M.A., Giugliano, R.P., McCagg, A., White, J.A., Theroux, P., Darius,
H., Lewis, B.S., Ophuis, T.O., Jukema, J.W. and De Ferrari, G.M., 2015. Ezetimibe added to
statin therapy after acute coronary syndromes. New England Journal of Medicine, 372(25),
pp.2387-2397.
54
Cung, T.T., Morel, O., Cayla, G., Rioufol, G., Garcia-Dorado, D., Angoulvant, D., Bonnefoy-
Cudraz, E., Guérin, P., Elbaz, M., Delarche, N. and Coste, P., 2015. Cyclosporine before PCI
in patients with acute myocardial infarction. New England Journal of Medicine, 373(11),
pp.1021-1031.
Davies, M.J., Bergenstal, R., Bode, B., Kushner, R.F., Lewin, A., Skjøth, T.V., Andreasen, A.H.,
Jensen, C.B. and DeFronzo, R.A., 2015. Efficacy of liraglutide for weight loss among patients
with type 2 diabetes: the SCALE diabetes randomized clinical trial. Jama, 314(7), pp.687-699.
Dawson, R., Diacon, A.H., Everitt, D., van Niekerk, C., Donald, P.R., Burger, D.A., Schall, R.,
Spigelman, M., Conradie, A., Eisenach, K. and Venter, A., 2015. Efficiency and safety of the
combination of moxifloxacin, pretomanid (PA-824), and pyrazinamide during the first 8 weeks
of antituberculosis treatment: a phase 2b, open-label, partly randomised trial in patients with
drug-susceptible or drug-resistant pulmonary tuberculosis. The Lancet, 385(9979), pp.1738-
1747.
Desai, M., Gutman, J., L'lanziva, A., Otieno, K., Juma, E., Kariuki, S., Ouma, P., Were, V.,
Laserson, K., Katana, A. and Williamson, J., 2016. Intermittent screening and treatment or
intermittent preventive treatment with dihydroartemisinin–piperaquine versus intermittent
preventive treatment with sulfadoxine–pyrimethamine for the control of malaria during
pregnancy in western Kenya: an open-label, three-group, randomised controlled superiority trial.
The Lancet, 386(10012), pp.2507-2519.
DeVincenzo, J.P., McClure, M.W., Symons, J.A., Fathi, H., Westland, C., Chanda, S., Lambkin-
Williams, R., Smith, P., Zhang, Q., Beigelman, L. and Blatt, L.M., 2015. Activity of oral ALS-
008176 in a respiratory syncytial virus challenge study. New England Journal of Medicine,
373(21), pp.2048-2058.
55
Donny, E.C., Denlinger, R.L., Tidey, J.W., Koopmeiners, J.S., Benowitz, N.L., Vandrey, R.G.,
al’Absi, M., Carmella, S.G., Cinciripini, P.M., Dermody, S.S. and Drobes, D.J., 2015.
Randomized trial of reduced-nicotine standards for cigarettes. New England Journal of Medicine,
373(14), pp.1340-1349.
Gágyor, I., Bleidorn, J., Kochen, M.M., Schmiemann, G., Wegscheider, K. and Hummers-
Pradier, E., 2015. Ibuprofen versus fosfomycin for uncomplicated urinary tract infection in
women: randomised controlled trial. bmj, 351, p.h6544.
Garway-Heath, D.F., Crabb, D.P., Bunce, C., Lascaratos, G., Amalfitano, F., Anand, N., Azuara-
Blanco, A., Bourne, R.R., Broadway, D.C., Cunliffe, I.A. and Diamond, J.P., 2015. Latanoprost
for open-angle glaucoma (UKGTS): a randomised, multicentre, placebo-controlled trial. The
Lancet, 385(9975), pp.1295-1304.
Gaudet, D., Alexander, V.J., Baker, B.F., Brisson, D., Tremblay, K., Singleton, W., Geary, R.S.,
Hughes, S.G., Viney, N.J., Graham, M.J. and Crooke, R.M., 2015. Antisense inhibition of
apolipoprotein C-III in patients with hypertriglyceridemia. New England Journal of Medicine,
373(5), pp.438-447.
Gerding, D.N., Meyer, T., Lee, C., Cohen, S.H., Murthy, U.K., Poirier, A., Van Schooneveld,
T.C., Pardi, D.S., Ramos, A., Barron, M.A. and Chen, H., 2015. Administration of spores of
nontoxigenic Clostridium difficile strain m3 for prevention of recurrent c difficile infection: A
randomized clinical trial. Jama, 313(17), pp.1719-1727.
Gheorghiade, M., Greene, S.J., Butler, J., Filippatos, G., Lam, C.S., Maggioni, A.P., Ponikowski,
P., Shah, S.J., Solomon, S.D., Kraigher-Krainer, E. and Samano, E.T., 2015. Effect of vericiguat,
a soluble guanylate cyclase stimulator, on natriuretic peptide levels in patients with worsening
chronic heart failure and reduced ejection fraction: the SOCRATES-REDUCED randomized
trial. JAMA, 314(21), pp.2251-2262.
56
Gnant, M., Pfeiler, G., Dubsky, P.C., Hubalek, M., Greil, R., Jakesz, R., Wette, V., Balic, M.,
Haslbauer, F., Melbinger, E. and Bjelic-Radisic, V., 2015. Adjuvant denosumab in breast cancer
(ABCSG-18): a multicentre, randomised, double-blind, placebo-controlled trial. The Lancet,
386(9992), pp.433-443.
Grainger, J.D., Locatelli, F., Chotsampancharoen, T., Donyush, E., Pongtanakul, B.,
Komvilaisak, P., Sosothikul, D., Drelichman, G., Sirachainan, N., Holzhauer, S. and Lebedev,
V., 2015. Eltrombopag for children with chronic immune thrombocytopenia (PETIT2): a
randomised, multicentre, placebo-controlled trial. The Lancet, 386(10004), pp.1649-1658.
Hézode, C., Asselah, T., Reddy, K.R., Hassanein, T., Berenguer, M., Fleischer-Stepniewska, K.,
Marcellin, P., Hall, C., Schnell, G., Pilot-Matias, T. and Mobashery, N., 2015. Ombitasvir plus
paritaprevir plus ritonavir with or without ribavirin in treatment-naive and treatment-experienced
patients with genotype 4 chronic hepatitis C virus infection (PEARL-I): a randomised, open-label
trial. The Lancet, 385(9986), pp.2502-2509.
Kastelein, J.J., Besseling, J., Shah, S., Bergeron, J., Langslet, G., Hovingh, G.K., Al-Saady, N.,
Koeijvoets, M., Hunter, J., Johnson-Levonas, A.O. and Fable, J., 2015. Anacetrapib as lipid-
modifying therapy in patients with heterozygous familial hypercholesterolaemia (REALIZE): a
randomised, double-blind, placebo-controlled, phase 3 study. The Lancet, 385(9983), pp.2153-
2161.
Kereiakes, D.J., Yeh, R.W., Massaro, J.M., Driscoll-Shempp, P., Cutlip, D.E., Steg, P.G.,
Gershlick, A.H., Darius, H., Meredith, I.T., Ormiston, J. and Tanguay, J.F., 2015. Antiplatelet
therapy duration following bare metal or drug-eluting coronary stents: the dual antiplatelet
therapy randomized clinical trial. Jama, 313(11), pp.1113-1121.
Khanna, R., Bressler, B., Levesque, B.G., Zou, G., Stitt, L.W., Greenberg, G.R., Panaccione,
R., Bitton, A., Paré, P., Vermeire, S. and D'Haens, G., 2015. Early combined
57
immunosuppression for the management of Crohn's disease (REACT): a cluster randomised
controlled trial. The Lancet, 386(10006), pp.1825-1834.
Krug, N., Hohlfeld, J.M., Kirsten, A.M., Kornmann, O., Beeh, K.M., Kappeler, D., Korn, S.,
Ignatenko, S., Timmer, W., Rogon, C. and Zeitvogel, J., 2015. Allergen-induced asthmatic
responses modified by a GATA3-specific DNAzyme. New England Journal of Medicine,
372(21), pp.1987-1995.
Kuyken, W., Hayes, R., Barrett, B., Byng, R., Dalgleish, T., Kessler, D., Lewis, G., Watkins, E.,
Brejcha, C., Cardy, J. and Causley, A., 2015. Effectiveness and cost-effectiveness of mindfulness-
based cognitive therapy compared with maintenance antidepressant treatment in the prevention
of depressive relapse or recurrence (PREVENT): a randomised controlled trial. The Lancet,
386(9988), pp.63-73.
Langendonk, J.G., Balwani, M., Anderson, K.E., Bonkovsky, H.L., Anstey, A.V., Bissell, D.M.,
Bloomer, J., Edwards, C., Neumann, N.J., Parker, C. and Phillips, J.D., 2015. Afamelanotide
for erythropoietic protoporphyria. New England Journal of Medicine, 373(1), pp.48-59.
Leder, B.Z., Tsai, J.N., Uihlein, A.V., Wallace, P.M., Lee, H., Neer, R.M. and Burnett-Bowie,
S.A.M., 2015. Denosumab and teriparatide transitions in postmenopausal osteoporosis (the
DATA-Switch study): extension of a randomised controlled trial. The Lancet, 386(9999),
pp.1147-1155.
Lee, A.Y., Kamphuisen, P.W., Meyer, G., Bauersachs, R., Janas, M.S., Jarner, M.F. and
Khorana, A.A., 2015. Tinzaparin vs warfarin for treatment of acute venous thromboembolism
in patients with active cancer: a randomized clinical trial. Jama, 314(7), pp.677-686.
Marrazzo, J.M., Ramjee, G., Richardson, B.A., Gomez, K., Mgodi, N., Nair, G., Palanee, T.,
Nakabiito, C., Van Der Straten, A., Noguchi, L. and Hendrix, C.W., 2015. Tenofovir-based
58
preexposure prophylaxis for HIV infection among African women. New England Journal of
Medicine, 372(6), pp.509-518.
Postow, M.A., Chesney, J., Pavlick, A.C., Robert, C., Grossmann, K., McDermott, D., Linette,
G.P., Meyer, N., Giguere, J.K., Agarwala, S.S. and Shaheen, M., 2015. Nivolumab and
ipilimumab versus ipilimumab in untreated melanoma. New England Journal of Medicine,
372(21), pp.2006-2017.
Raal, F.J., Honarpour, N., Blom, D.J., Hovingh, G.K., Xu, F., Scott, R., Wasserman, S.M., Stein,
E.A. and TESLA Investigators, 2015. Inhibition of PCSK9 with evolocumab in homozygous
familial hypercholesterolaemia (TESLA Part B): a randomised, double-blind, placebo-
controlled trial. The Lancet, 385(9965), pp.341-350.
Raal, F.J., Stein, E.A., Dufour, R., Turner, T., Civeira, F., Burgess, L., Langslet, G., Scott, R.,
Olsson, A.G., Sullivan, D. and Hovingh, G.K., 2015. PCSK9 inhibition with evolocumab (AMG
145) in heterozygous familial hypercholesterolaemia (RUTHERFORD-2): a randomised,
double-blind, placebo-controlled trial. The Lancet, 385(9965), pp.331-340.
Rahman, N.M., Pepperell, J., Rehal, S., Saba, T., Tang, A., Ali, N., West, A., Hettiarachchi, G.,
Mukherjee, D., Samuel, J. and Bentley, A., 2015. Effect of opioids vs NSAIDs and larger vs
smaller chest tube size on pain control and pleurodesis efficacy among patients with malignant
pleural effusion: the TIME1 randomized clinical trial. Jama, 314(24), pp.2641-2653.
Robert, C., Karaszewska, B., Schachter, J., Rutkowski, P., Mackiewicz, A., Stroiakovski, D.,
Lichinitser, M., Dummer, R., Grange, F., Mortier, L. and Chiarion-Sileni, V., 2015. Improved
overall survival in melanoma with combined dabrafenib and trametinib. New England Journal of
Medicine, 372(1), pp.30-39.
59
Robert, C., Long, G.V., Brady, B., Dutriaux, C., Maio, M., Mortier, L., Hassel, J.C., Rutkowski,
P., McNeil, C., Kalinka-Warzocha, E. and Savage, K.J., 2015. Nivolumab in previously untreated
melanoma without BRAF mutation. New England journal of medicine, 372(4), pp.320-330.
Ruff, C.T., Giugliano, R.P., Braunwald, E., Morrow, D.A., Murphy, S.A., Kuder, J.F.,
Deenadayalu, N., Jarolim, P., Betcher, J., Shi, M. and Brown, K., 2015. Association between
edoxaban dose, concentration, anti-Factor Xa activity, and outcomes: an analysis of data from
the randomised, double-blind ENGAGE AF-TIMI 48 trial. The Lancet, 385(9984), pp.2288-
2295.
Saver, J.L., Starkman, S., Eckstein, M., Stratton, S.J., Pratt, F.D., Hamilton, S., Conwit, R.,
Liebeskind, D.S., Sung, G., Kramer, I. and Moreau, G., 2015. Prehospital use of magnesium
sulfate as neuroprotection in acute stroke. New England Journal of Medicine, 372(6), pp.528-
536.
Sax, P.E., Wohl, D., Yin, M.T., Post, F., DeJesus, E., Saag, M., Pozniak, A., Thompson, M.,
Podzamczer, D., Molina, J.M. and Oka, S., 2015. Tenofovir alafenamide versus tenofovir
disoproxil fumarate, coformulated with elvitegravir, cobicistat, and emtricitabine, for initial
treatment of HIV-1 infection: two randomised, double-blind, phase 3, non-inferiority trials. The
Lancet, 385(9987), pp.2606-2615.
Schlumberger, M., Tahara, M., Wirth, L.J., Robinson, B., Brose, M.S., Elisei, R., Habra, M.A.,
Newbold, K., Shah, M.H., Hoff, A.O. and Gianoukakis, A.G., 2015. Lenvatinib versus placebo
in radioiodine-refractory thyroid cancer. New England Journal of Medicine, 372(7), pp.621-630.
Scott, D.L., Ibrahim, F., Farewell, V., O’Keeffe, A.G., Walker, D., Kelly, C., Birrell, F.,
Chakravarty, K., Maddison, P., Heslin, M. and Patel, A., 2015. Tumour necrosis factor inhibitors
versus combination intensive therapy with conventional disease modifying anti-rheumatic drugs
60
in established rheumatoid arthritis: TACIT non-inferiority randomised controlled trial. bmj, 350,
p.h1046.
Smith, L.J., Kalhan, R., Wise, R.A., Sugar, E.A., Lima, J.J., Irvin, C.G., Dozor, A.J. and
Holbrook, J.T., 2015. Effect of a soy isoflavone supplement on lung function and clinical
outcomes in patients with poorly controlled asthma: a randomized clinical trial. Jama, 313(20),
pp.2033-2043.
Swain, S.M., Baselga, J., Kim, S.B., Ro, J., Semiglazov, V., Campone, M., Ciruelos, E., Ferrero,
J.M., Schneeweiss, A., Heeson, S. and Clark, E., 2015. Pertuzumab, trastuzumab, and docetaxel
in HER2-positive metastatic breast cancer. New England Journal of Medicine, 372(8), pp.724-
734.
Tshefu, A., Lokangaka, A., Ngaima, S., Engmann, C., Esamai, F., Gisore, P., Ayede, A.I.,
Falade, A.G., Adejuyigbe, E.A., Anyabolu, C.H. and Wammanda, R.D., 2015. Oral amoxicillin
compared with injectable procaine benzylpenicillin plus gentamicin for treatment of neonates
and young infants with fast breathing when referral is not possible: a randomised, open-label,
equivalence trial. The Lancet, 385(9979), pp.1758-1766.
Wainwright, C.E., Elborn, J.S., Ramsey, B.W., Marigowda, G., Huang, X., Cipolli, M.,
Colombo, C., Davies, J.C., De Boeck, K., Flume, P.A. and Konstan, M.W., 2015. Lumacaftor–
ivacaftor in patients with cystic fibrosis homozygous for Phe508del CFTR. New England Journal
of Medicine, 373(3), pp.220-231.
Wechsler, M.E., Yawn, B.P., Fuhlbrigge, A.L., Pace, W.D., Pencina, M.J., Doros, G., Kazani,
S., Raby, B.A., Lanzillotti, J., Madison, S. and Israel, E., 2015. Anticholinergic vs long-acting β-
agonist in combination with inhaled corticosteroids in black adults with asthma: The BELT
randomized clinical trial. JAMA, 314(16), pp.1720-1730.
61
Williams, B., MacDonald, T.M., Morant, S., Webb, D.J., Sever, P., McInnes, G., Ford, I.,
Cruickshank, J.K., Caulfield, M.J., Salsbury, J. and Mackenzie, I., 2015. Spironolactone versus
placebo, bisoprolol, and doxazosin to determine the optimal treatment for drug-resistant
hypertension (PATHWAY-2): a randomised, double-blind, crossover trial. The Lancet,
386(10008), pp.2059-2068.
Wyles, D.L., Ruane, P.J., Sulkowski, M.S., Dieterich, D., Luetkemeyer, A., Morgan, T.R.,
Sherman, K.E., Dretler, R., Fishbein, D., Gathe Jr, J.C. and Henn, S., 2015. Daclatasvir plus
sofosbuvir for HCV in patients coinfected with HIV-1. New England Journal of Medicine,
373(8), pp.714-725.
Zinman, B., Wanner, C., Lachin, J.M., Fitchett, D., Bluhmki, E., Hantel, S., Mattheus, M.,
Devins, T., Johansen, O.E., Woerle, H.J. and Broedl, U.C., 2015. Empagliflozin, cardiovascular
outcomes, and mortality in type 2 diabetes. New England Journal of Medicine, 373(22), pp.2117-
2128.
62
CHAPTER 3: Description of Data Sources
3.1 Introduction
The aim of this thesis is to investigate various methodological challenges that are encountered
when studying medication adherence in clinical research. It therefore follows from this aim that
data from real clinical research will form the basis of the illustration of these challenges. Datasets
from five clinical studies, three of which are from the same research project, will be used
throughout this thesis. It is my intention to exemplify and discuss some of the methodological
challenges that are common when studying medication adherence and how they differ for various
study designs, for example randomised controlled trials and observational studies, and for
different clinical conditions, for example short-term or acute conditions and long-term or chronic
conditions.
The remainder of this Chapter will provide an introduction to the different research projects and
datasets used throughout this thesis. An outline of the studies will be given, the method/s used to
record adherence to study medication will be described, and the contribution that the dataset
makes to the thesis will be specified.
3.2 GRACE
Acute lower respiratory tract infection (LRTI) is a short-term, largely self-limiting condition that
accounts for approximately one fifth of all consultations in primary care. (Currie et al., 2014) The
majority of patients who consult with this condition are prescribed antibiotics, though the
appropriateness of these prescriptions is often questionable. (Butler et al., 2009) Use (and
overuse) of antibiotics has been shown to be associated with the development of antibiotic
resistance, (Goossens et al., 2005, Costelloe et al., 2010) the consequences of which involve
widespread deaths from common infections and minor illness that were previously treatable.
(World Health Organization, 2014) However, adherence to antibiotics in primary care is often

63
poor. (Kardas et al., 2005, Francis et al., 2012) Poor adherence to antibiotics, in those who are
prescribed, them wastes healthcare resources, could negatively impact on clinical outcomes (e.g.
slow recovery or increase the risk of complications), and for those in whom they are needed
could also result in the infecting bacteria being exposed to suboptimal levels of antibiotic; creating
an environment that promotes antibiotic resistance. (Vrijens and Urquhart, 2005)
Genomics to combat Resistance against Antibiotics in Community-acquired LRTI (CA-LRTI)
in Europe (GRACE) was a European Union Framework Programme 6 funded network of
excellence. The project aimed to combat resistance to antibiotics in CA-LRTI by integrating and
co-ordinating the activities of clinicians and scientists from 15 European countries (Figure 3.1).
Figure 3.1: Map of Europe indicating primary care networks involved in the GRACE project

64
The project was divided into several work packages (WPs), with three of these containing clinical
studies. These studies are described in chronological order below. For completeness, Table 3.1
briefly outlines the 12 different WPs included in the project.
Table 3.1: Outline of GRACE work packages
Work package Purpose
1 Project management
2 Manage data and outputs from all work packages
3
i.) Develop novel rapid genome-based diagnostic tests for the detection of
pathogens; ii.) Establish a European repository of specimens and strains
linked to a database including microbial and patient information
4
i.) Undertake a large-scale genome wide screen for human susceptibility
genes affecting severe CA-LRTI; ii.) Use human genomic data to devise
the potential genetic risk profile; iii.) Determine whether the human
genetic risk factors identified in GRACE interact with each other or with
key microbial genetic or other environmental risk factor
5
Develop and test novel molecular techniques based on amplification-based
detection assays
6
i.) Correlate antibiotic resistance, virulence characteristics and
pneumococcal genotype to severity of CA-LRTI; ii.) Perform comparative
pneumococcal genomics with micro-array technology
7 i.) Investigate the distribution, transmission and evolution of antibiotic
resistance; ii.) Assess risk factors for infection with resistant H. influenza;
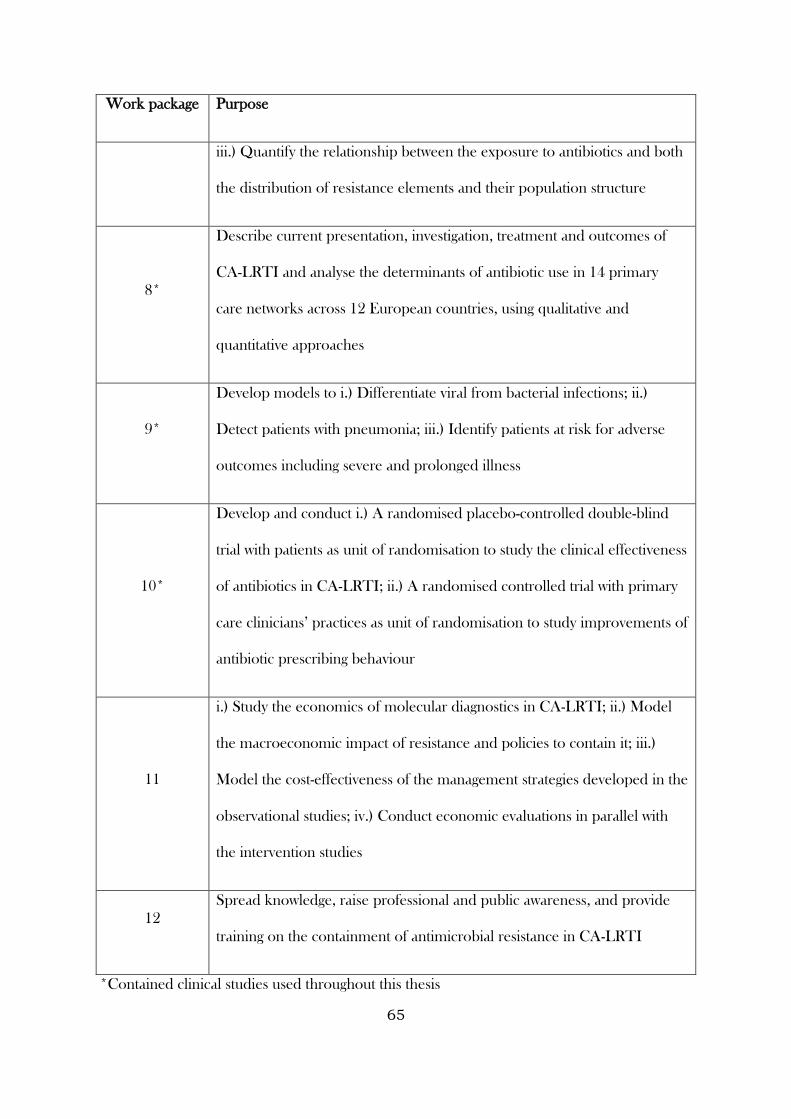
65
Work package Purpose
iii.) Quantify the relationship between the exposure to antibiotics and both
the distribution of resistance elements and their population structure
8*
Describe current presentation, investigation, treatment and outcomes of
CA-LRTI and analyse the determinants of antibiotic use in 14 primary
care networks across 12 European countries, using qualitative and
quantitative approaches
9*
Develop models to i.) Differentiate viral from bacterial infections; ii.)
Detect patients with pneumonia; iii.) Identify patients at risk for adverse
outcomes including severe and prolonged illness
10*
Develop and conduct i.) A randomised placebo-controlled double-blind
trial with patients as unit of randomisation to study the clinical effectiveness
of antibiotics in CA-LRTI; ii.) A randomised controlled trial with primary
care clinicians’ practices as unit of randomisation to study improvements of
antibiotic prescribing behaviour
11
i.) Study the economics of molecular diagnostics in CA-LRTI; ii.) Model
the macroeconomic impact of resistance and policies to contain it; iii.)
Model the cost-effectiveness of the management strategies developed in the
observational studies; iv.) Conduct economic evaluations in parallel with
the intervention studies
12
Spread knowledge, raise professional and public awareness, and provide
training on the containment of antimicrobial resistance in CA-LRTI
*Contained clinical studies used throughout this thesis
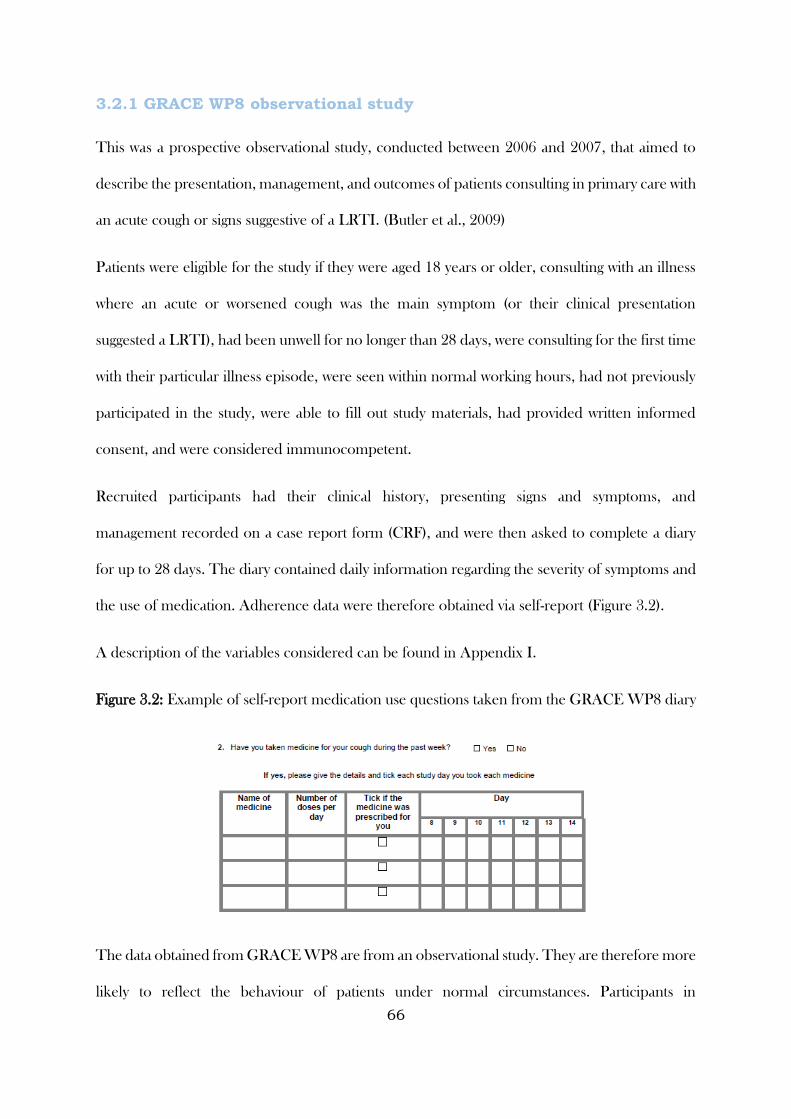
66
3.2.1 GRACE WP8 observational study
This was a prospective observational study, conducted between 2006 and 2007, that aimed to
describe the presentation, management, and outcomes of patients consulting in primary care with
an acute cough or signs suggestive of a LRTI. (Butler et al., 2009)
Patients were eligible for the study if they were aged 18 years or older, consulting with an illness
where an acute or worsened cough was the main symptom (or their clinical presentation
suggested a LRTI), had been unwell for no longer than 28 days, were consulting for the first time
with their particular illness episode, were seen within normal working hours, had not previously
participated in the study, were able to fill out study materials, had provided written informed
consent, and were considered immunocompetent.
Recruited participants had their clinical history, presenting signs and symptoms, and
management recorded on a case report form (CRF), and were then asked to complete a diary
for up to 28 days. The diary contained daily information regarding the severity of symptoms and
the use of medication. Adherence data were therefore obtained via self-report (Figure 3.2).
A description of the variables considered can be found in Appendix I.
Figure 3.2: Example of self-report medication use questions taken from the GRACE WP8 diary
The data obtained from GRACE WP8 are from an observational study. They are therefore more
likely to reflect the behaviour of patients under normal circumstances. Participants in
67
randomised controlled trials tend to receive considerably more information about their
treatment, are more closely monitored, and tend to have higher motivations for participation.
Their adherence levels may therefore not reflect that which is seen in routine practice.
These data will be used to investigate the determinants of adherence to antibiotics for this
condition, and will be useful in comparing adherence levels and determinants across different
study types for the same condition, with observational studies likely to more closely reflect
practice than randomised controlled trials.
3.2.2 GRACE WP9 observational study
Similar to WP8, GRACE WP9 was also a prospective observational study. It was conducted
between 2007 and 2010, and aimed to investigate the aetiology, diagnosis, and prognosis of
LRTI. (van Vugt et al., 2013) The key difference between this study and the WP8 observational
study is that participants in this study provided various biological samples alongside being
observed over time.
Eligibility was similar to that in GRACE WP8, with the addition of patients having not been on
antibiotic treatment in the previous month and not pregnant at the point of recruitment.
Data collection methods were similar to GRACE WP8, and adherence was captured via self-
report. The rationale for including these data in this thesis are therefore the same as for the
previous study.
A description of the variables considered can be found in Appendix I.
While participants in GRACE WP8 and WP9 could be prescribed any treatment for their
illness, the analysis in this thesis will be restricted to those that were prescribed amoxicillin for
immediate use. Amoxicillin is the recommended first-line choice of antibiotic for LRTI in the
European Union, and consequently the most frequently prescribed. By focussing on this
68
treatment, it allows for the investigation of the impact of the dose, frequency, and duration
without being confounded by type of antibiotic prescribed. This thesis does not consider
adherence to delayed prescriptions, focussing solely on amoxicillin prescribed for immediate
use. While a delayed prescription is also a legitimate prescribing strategy, adherence under this
strategy is ambiguous. Delay instructions can often be vague (for example, “here is a prescription
if you get any worse”), and delayed prescriptions are often issued with the intention that the
patient would never actually take their treatment. This is in contrast with a prescription issued
for immediate use, where the working assumption is that the clinician intended that the treatment
would be taken as prescribed.
GRACE WP10a placebo-controlled trial
The aim of GRACE WP10a was to investigate the benefits and harm of amoxicillin in acute
uncomplicated community-acquired LRTI. To achieve this, a randomised placebo-controlled
trial was conducted between 2007 and 2010, nested within GRACE WP9. (Little et al., 2013)
Patients were eligible to participate in the trial if they met the eligibility criteria for WP9, and in
addition were not allergic to penicillin (or have a contra-indication for amoxicillin because of a
major interaction with other medication), and their history/physical examination was not
suggestive of community-acquired pneumonia (see Table 3.2 for a comparison of eligible
criteria).
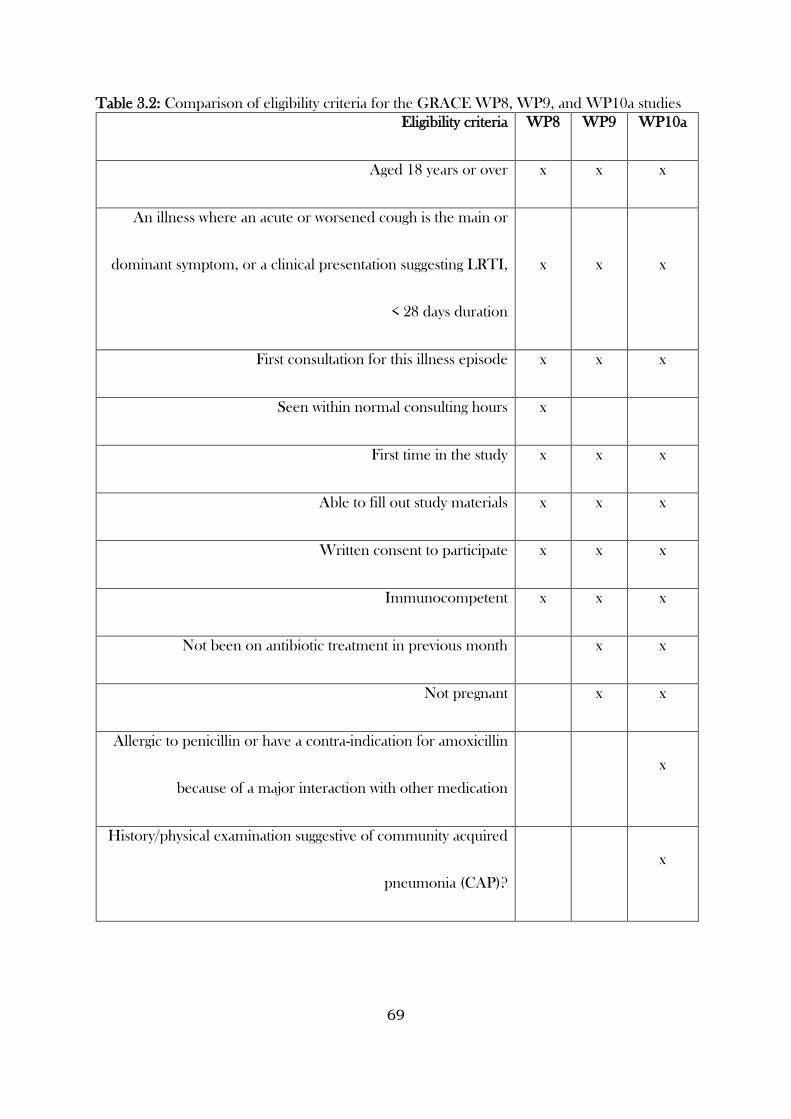
69
Table 3.2: Comparison of eligibility criteria for the GRACE WP8, WP9, and WP10a studies
Eligibility criteria WP8 WP9 WP10a
Aged 18 years or over x x x
An illness where an acute or worsened cough is the main or
dominant symptom, or a clinical presentation suggesting LRTI,
< 28 days duration
x x x
First consultation for this illness episode x x x
Seen within normal consulting hours x
First time in the study x x x
Able to fill out study materials x x x
Written consent to participate x x x
Immunocompetent x x x
Not been on antibiotic treatment in previous month x x
Not pregnant x x
Allergic to penicillin or have a contra-indication for amoxicillin
because of a major interaction with other medication
x
History/physical examination suggestive of community acquired
pneumonia (CAP)?
x
70
Randomised participants received a prescription for amoxicillin, to be taken as two 500mg tablets
three times a day for seven days, or a placebo identical in appearance, taste and texture. Other
data collection methods were similar to GRACE WP8 and WP9.
A description of the variables considered can be found in Appendix I.
While data collection methods were mostly similar to GRACE WP8 and WP9, adherence to
trial medication in WP10a was also recorded via tablet counts at the end of the study and during
telephone follow-ups, with the latter generally conducted in participants who had not returned a
diary (i.e. after the 28 day follow-up period).
The data from GRACE WP10a will contribute to this thesis in many ways. Capturing adherence
using multiple types of measures allows for a comparison of the different types, and levels of
agreement between types to be estimated. Using other information on the trial participants,
variables that predict disagreement can also be investigated. The participants allocated to the
amoxicillin group can be used to explore the determinants of adherence to amoxicillin. Finally,
data from participants in the whole trial can also be used to investigate the use of randomisation-
based efficacy estimators for adjusting trial findings for treatment non-adherence.
CODA
Ulcerative Colitis (UC) is a chronic inflammatory disease that affects the internal lining of the
colonic mucosa and rectum, with patients exhibiting symptoms such as abdominal pain, blood
and pus in stools, diarrhoea, fever, rectal pain and weight loss. The estimated prevalence of UC
is 8 to 246 cases per 100,000 per year, and is most commonly seen in the populations of Northern
Europe and North America. The disease is often relapse-remitting, with patients experiencing
few or no symptoms between systematic flare ups. (Ardizzone, 2003) Coated formulations of
mesalazine (Asacol®) have been demonstrated in many trials to prevent relapses in patients who
have achieved remission. (Sutherland and MacDonald, 2006) Treatment is often prescribed in
71
divided daily doses (e.g. two or three times daily dosing schedules (BD, TDS)), (BNF Online,
2013) with adherence and treatment success suffering as a result. (Shale and Riley, 2003, D’IncÀ
et al., 2008) There has thus been an increasing interest in evaluating once-daily (OD) dosing of
mesalazine. (Hussain et al., 2001, Kane, 2006, Gandia et al., 2007, Flourie et al., 2013)
The Colitis Once Daily Asacol (CODA) study assessed the efficacy and safety of OD dosing with
mesalazine versus TDS dosing over a 12-month period for patients in remission with UC.
(Hawthorne et al., 2012) Patients were eligible to take part in the study as long as they were in
remission with UC and on maintenance therapy with mesalazine, sulfasalazine, olsalazine, or
balsalazide for at least 4 weeks, but who had had at least one relapse within the previous two
years. Patients had to be aged over 18, if female to be taking adequate contraception (if otherwise
able to conceive), and able to give informed consent. Patients were excluded if they had Crohn’s
disease; symptoms of active colitis; a modified Baron score at sigmoidoscopy of 2 or 3; used
enema or suppository therapy for UC in the past 4 weeks; had started or altered the dose of
azathioprine or 6-mercaptopurine in the past 3 months (these drugs were permitted if in stable
dosage over that period of time); had intolerance to mesalazine; known HIV infection; significant
renal or hepatic impairment; or other medical or psychiatric disorder (including alcohol
dependence) that in the opinion of the investigator would affect participation in the study; or
females if pregnant or lactating.
Randomised participants were given 800mg Asacol tablets and told to take either three tablets
once daily (OD) or in three divided doses (TDS) for 12-months or until relapse (whichever came
first). Participants attended trial follow-up visits at six weeks, six months, and 12 months after
randomisation, or in the event of a suspected relapse. In addition, participants were also
contacted via telephone at three and nine months.
A description of the variables considered can be found in Appendix II.
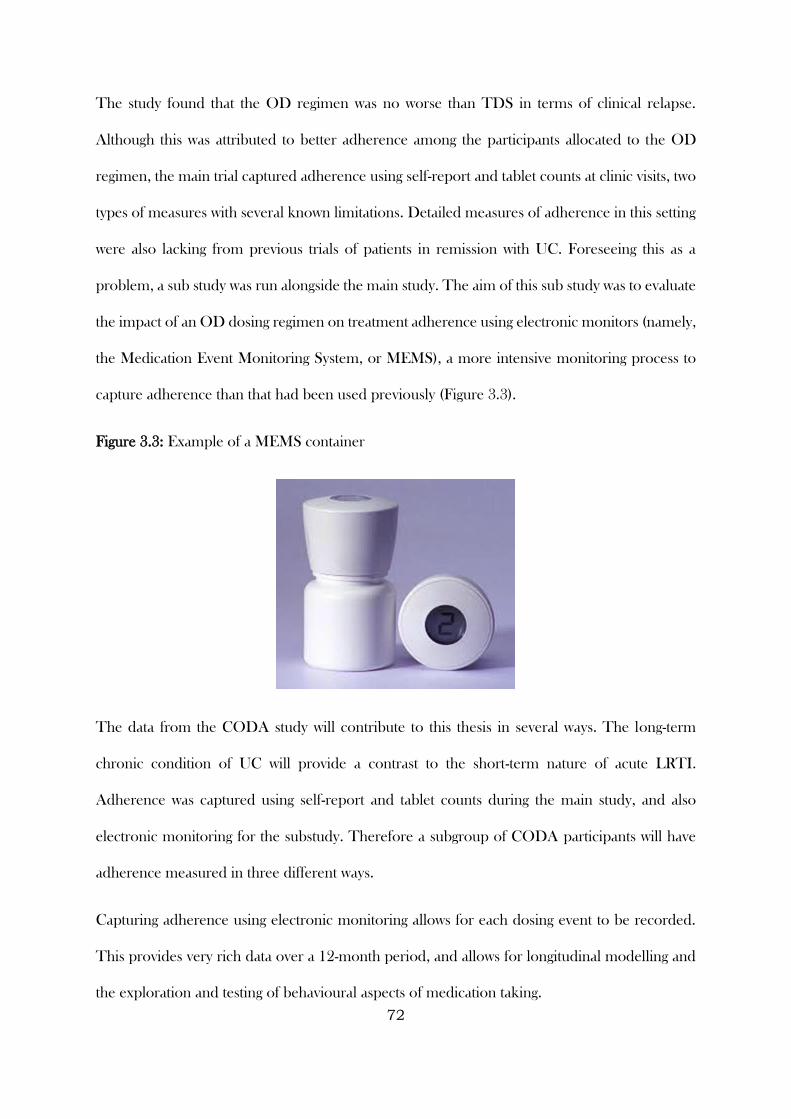
72
The study found that the OD regimen was no worse than TDS in terms of clinical relapse.
Although this was attributed to better adherence among the participants allocated to the OD
regimen, the main trial captured adherence using self-report and tablet counts at clinic visits, two
types of measures with several known limitations. Detailed measures of adherence in this setting
were also lacking from previous trials of patients in remission with UC. Foreseeing this as a
problem, a sub study was run alongside the main study. The aim of this sub study was to evaluate
the impact of an OD dosing regimen on treatment adherence using electronic monitors (namely,
the Medication Event Monitoring System, or MEMS), a more intensive monitoring process to
capture adherence than that had been used previously (Figure 3.3).
Figure 3.3: Example of a MEMS container
The data from the CODA study will contribute to this thesis in several ways. The long-term
chronic condition of UC will provide a contrast to the short-term nature of acute LRTI.
Adherence was captured using self-report and tablet counts during the main study, and also
electronic monitoring for the substudy. Therefore a subgroup of CODA participants will have
adherence measured in three different ways.
Capturing adherence using electronic monitoring allows for each dosing event to be recorded.
This provides very rich data over a 12-month period, and allows for longitudinal modelling and
the exploration and testing of behavioural aspects of medication taking.
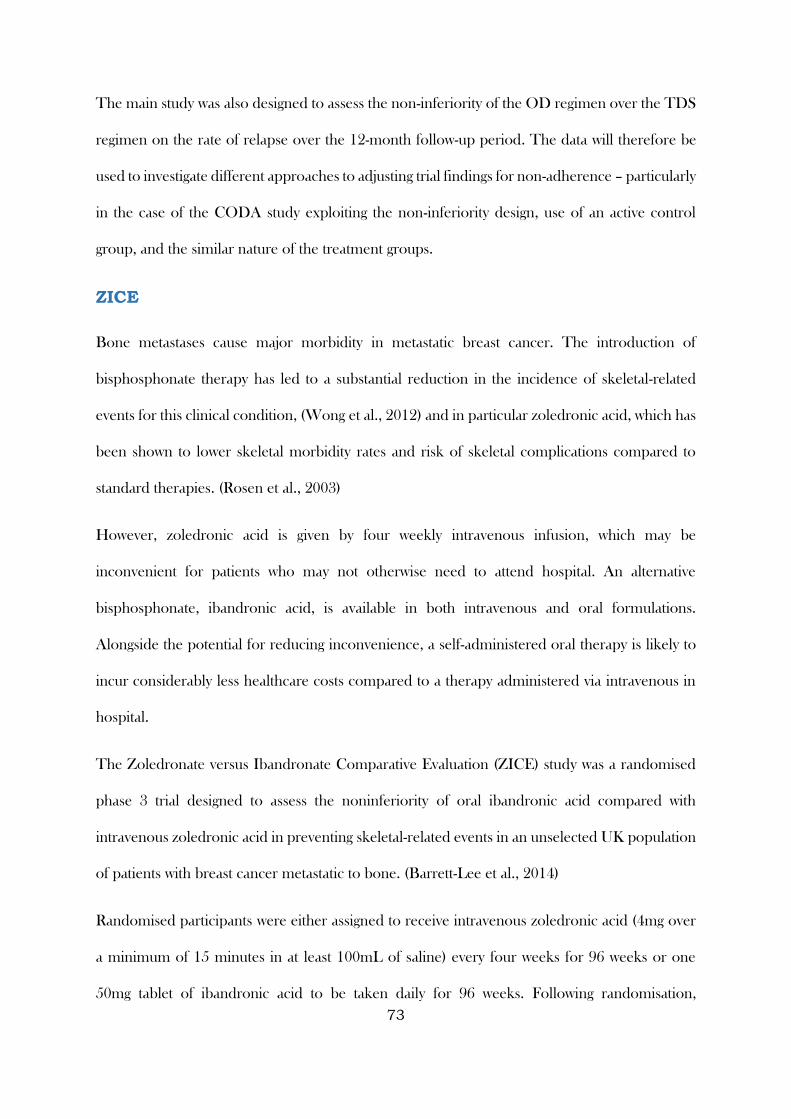
73
The main study was also designed to assess the non-inferiority of the OD regimen over the TDS
regimen on the rate of relapse over the 12-month follow-up period. The data will therefore be
used to investigate different approaches to adjusting trial findings for non-adherence – particularly
in the case of the CODA study exploiting the non-inferiority design, use of an active control
group, and the similar nature of the treatment groups.
ZICE
Bone metastases cause major morbidity in metastatic breast cancer. The introduction of
bisphosphonate therapy has led to a substantial reduction in the incidence of skeletal-related
events for this clinical condition, (Wong et al., 2012) and in particular zoledronic acid, which has
been shown to lower skeletal morbidity rates and risk of skeletal complications compared to
standard therapies. (Rosen et al., 2003)
However, zoledronic acid is given by four weekly intravenous infusion, which may be
inconvenient for patients who may not otherwise need to attend hospital. An alternative
bisphosphonate, ibandronic acid, is available in both intravenous and oral formulations.
Alongside the potential for reducing inconvenience, a self-administered oral therapy is likely to
incur considerably less healthcare costs compared to a therapy administered via intravenous in
hospital.
The Zoledronate versus Ibandronate Comparative Evaluation (ZICE) study was a randomised
phase 3 trial designed to assess the noninferiority of oral ibandronic acid compared with
intravenous zoledronic acid in preventing skeletal-related events in an unselected UK population
of patients with breast cancer metastatic to bone. (Barrett-Lee et al., 2014)
Randomised participants were either assigned to receive intravenous zoledronic acid (4mg over
a minimum of 15 minutes in at least 100mL of saline) every four weeks for 96 weeks or one
50mg tablet of ibandronic acid to be taken daily for 96 weeks. Following randomisation,
74
participants were assessed at three to four week intervals up to week 12, and every 12 weeks up
to 96 weeks thereafter. Following week 96, participants were assessed every year up to five years
post-randomisation. Adherence to study medication was noted by the treating clinician at interim
and 12-weekly visits (clinician / self-report).
The primary outcome in the main ZICE study was based on the time and frequency of skeletal-
related events (SREs) over the first 96 weeks post-randomisation. For illustrative purposes, this
thesis will focus on a simplified version of this outcome, specifically the proportion of participants
experiencing a skeletal-related event during the first 12 months of the study.
A description of the variables considered can be found in Appendix III.
The original study found that oral ibandronic acid was inferior to intravenous zoledronic acid,
though side effect profiles were similar in both groups and the oral treatment was generally more
convenient.
Like the CODA study, data from the ZICE study allows for the assessment of adherence to a
long-term condition and was designed to assess non-inferiority. However, unlike CODA, ZICE
has two very contrasting treatment arms, comparing a four-weekly intravenous therapy
administered in hospital by a clinician to a daily oral therapy self-administered at home. This
study will mainly be used during this thesis to investigate different approaches to adjusting trial
findings for non-adherence.
Summary
This Chapter described the data sources that will be used throughout the following three
Chapters, including a justification for the study, a description of the data flow, and the rationale
for using these particular studies throughout this thesis. This concludes the background Chapters
that have laid out the motivation of the thesis, problems that will be addressed, and data sources

75
that will be used. The next three Chapters will each focus on distinct methodological challenges
encountered when studying medication adherence in clinical research, providing the reader with
detail on the methodologies used, and using the data sources to illustrate how the proposed
methods work on data from real clinical research studies.
76
CHAPTER 4: Measuring Medication Adherence in
Clinical Research: Correlation, Agreement, and
Calibration Techniques
4.1 Introduction
When clinical research involves determining the safety and efficacy of treatments intended for
human use, the goal is to conduct this research as rigorously as possible, while balancing this
within the confines of limited resources. In clinical research aiming to generalise findings to a
real world setting, there is an additional aspiration of ensuring that considerations have been
made related to the usefulness and implementation of these findings in practice (e.g. outcomes
have been selected that are of importance to patients and clinicians). (Loudon et al, 2015) The
study of medication adherence within clinical research does not escape these restrictions, and as
such there is a reliance on methods for measuring adherence that are cheap, minimise participant
burden, and can be replicated in a real world setting, if required. (Lam and Fresco, 2015) The
consequence of this is that the majority of medication adherence measures used in clinical
research are indirect. That is, they rely on unverifiable assumptions that vary in their degree of
plausibility, depending on context, and consequently multiple modes of measurement are often
used in clinical research. Gaining an understanding of different types of measures of medication
adherence, their advantages and disadvantages, how to compare them (when multiple modes are
available), and what to do when disagreement occurs, is therefore an area of great importance in
this field.
The aims of this Chapter are to compare several methods commonly used for measuring
medication adherence in clinical research, using a variety of method-comparison techniques. I
will demonstrate the potential of advanced statistical modelling techniques for modelling patterns
in electronically monitored medication adherence over time. Moving beyond method-
comparison, I will also investigate the predictors of disagreement between medication adherence
77
measures, and develop calibration techniques to arrive at summary measures of medication
adherence that incorporates knowledge and uncertainty from the different types of measures.
To meet these aims, this Chapter will draw on data from the CODA and GRACE WP10a
studies, to highlight the differences and similarities between medication given for long-term and
short-term conditions.
4.2 Methods
4.2.1 Adherence definitions, summary measures, and assumptions
As described during Chapter 3, adherence to medication during the CODA study was monitored
via self-report and tablet counts at study follow-up visits, and electronically via the MEMs.
Participants were asked about their adherence levels (i.e. whether or not they thought they had
taken their study tablets as prescribed at least 90% of the time) and the ease of medication taking
(very easy, fairly easy, fairly difficult or very difficult to remember to take their medication). These
provide retrospective accounts of adherence. For analysis purposes, these reports are taken at
face value (i.e. it was assumed that participants reported their levels of adherence accurately and
had perfect recall in the time under consideration). Tablet counts were performed by trained
research nurses at each trial follow-up visit. It was assumed that the difference between the
number of tablets participants started with and the amount remaining at each follow-up visit
equated to the amount taken during the time interval. For the purposes of reporting, adherence
measured using tablet counts was reported as the number of tablets taken expressed as the
percentage of correct number of tablets taken. The date and time of bottle cap openings were
electronically recorded using the MEMS, with data uploaded onto the study database at each trial
follow-up visit. Calculating adherence using the MEMS assumed that the correct number of
tablets were removed and consumed each time the bottle was opened. Adherence was reported
78
as the percentage of days that a participant adhered to their allocated regimen (i.e. the percentage
of days that a participant opened their bottle the correct number of times).
The GRACE WP10a study measured adherence to allocated medication via self-reported
diaries, tablet counts, and self-reports collected over the telephone. Using their daily symptom
diary, participants prospectively recorded whether or not they took their study medication on a
given day, and whether they took their study medication according to the instructions.
Participants for whom a diary was not returned were asked to (retrospectively) state the number
of days that they took their study medication. This information was collected via telephone
interviews. Participants were also instructed to return their study medication bottles, complete
with any unused medication, at the end of the trial. The number of tablets returned was recorded
by members of the research team. Participants were given 42 tablets in total (two 500mg tablets,
to be taken three times a day for seven days).
Adherence to study medication was defined as the percentage of the correct number of tablets
taken during the first seven days of the follow-up period (i.e. the period for which the medication
was prescribed). For each of the three types of measures, a binary definition was also created,
with a cut-off at 100% (i.e. took all prescribed tablets during the first seven days of the follow-up
period).
Where participants indicated that they had taken medication on a particular day, in the absence
of information to the contrary (e.g. stating that they only took one tablet three times a day instead
of two tablets), to calculate adherence, an assumption was made that a participant consumed all
study medication as instructed. Where medication bottles were returned, it was assumed that the
difference between the number of tablets prescribed and the number returned equated to the
number of tablets consumed. It was also assumed that all tablets were consumed during the first
seven days of the follow-up period. Where a short questionnaire or telephone call was
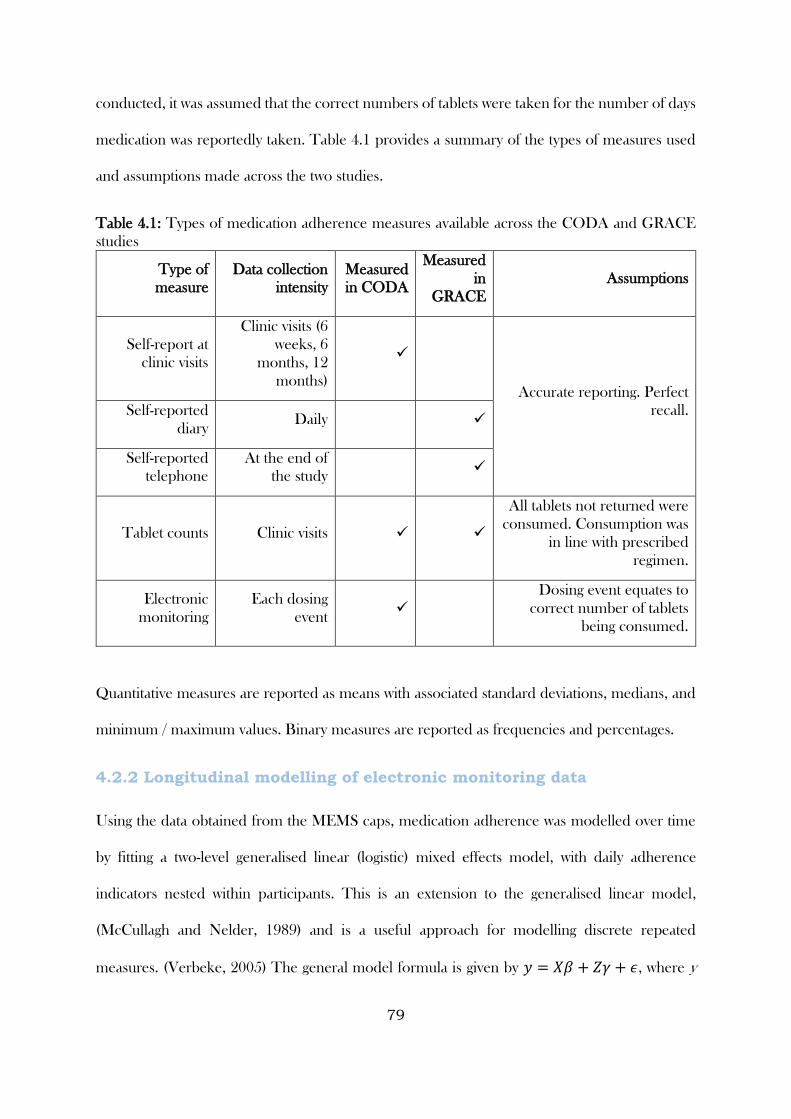
79
conducted, it was assumed that the correct numbers of tablets were taken for the number of days
medication was reportedly taken. Table 4.1 provides a summary of the types of measures used
and assumptions made across the two studies.
Table 4.1: Types of medication adherence measures available across the CODA and GRACE
studies
Type of
measure
Data collection
intensity
Measured
in CODA
Measured
in
GRACE
Assumptions
Self-report at
clinic visits
Clinic visits (6
weeks, 6
months, 12
months)
Accurate reporting. Perfect
recall. Self-reported
diary Daily
Self-reported
telephone
At the end of
the study
Tablet counts Clinic visits
All tablets not returned were
consumed. Consumption was
in line with prescribed
regimen.
Electronic
monitoring
Each dosing
event
Dosing event equates to
correct number of tablets
being consumed.
Quantitative measures are reported as means with associated standard deviations, medians, and
minimum / maximum values. Binary measures are reported as frequencies and percentages.
4.2.2 Longitudinal modelling of electronic monitoring data
Using the data obtained from the MEMS caps, medication adherence was modelled over time
by fitting a two-level generalised linear (logistic) mixed effects model, with daily adherence
indicators nested within participants. This is an extension to the generalised linear model,
(McCullagh and Nelder, 1989) and is a useful approach for modelling discrete repeated
measures. (Verbeke, 2005) The general model formula is given by 𝑦 = 𝑋𝛽 + 𝑍𝛾 + 𝜖, where y
80
is the outcome variable, X represents the predictor variables, Z represents the random effects
(participants for whom multiple daily adherence indicators are available), and ɛ are the residuals.
A logit link function (𝑙𝑜𝑔 (𝑝
1−𝑝)) is applied to account for the binary nature of the outcome
variable. Alternatives to this approach would involve summarising adherence over the time
period, or not accounting for the correlated nature of responses within individuals. For the
former, information regarding the evolution of adherence over time (and behavioural patterns
over time) would be lost. For the latter, assuming observations were independent would risk
calculating standard errors that were artificially narrow, and hence drawing erroneous conclusions
regarding the width of the confidence intervals around model estimates. For these models, a
participant was assumed to have adhered to their allocated regimen on a given day if they opened
their cap the required number of times (once for the OD group and three times for the TDS
group). Non-linear patterns of adherence over time were accounted for using B-splines. The
model also accounted for different participant adherence patterns by fitting B-spline estimates of
a time-varying mean with random coefficients, thereby allowing each participant to have their
own individual curve that was not restricted by the overall fixed effect curve. B-splines are
piecewise polynomials with interior knots (or turning points) linking each polynomial function
via a series of linear combinations. (Marsh and Cormier, 2001) An accessible mathematical
formulation of B-splines has been presented previously. (Weisstein) B-splines provide a flexible
and arguably more interpretable approach to accounting for non-linear effects in regression
models. Alternative approaches involving making linearity assumptions or fitting polynomial
functions (e.g. modelling time as a quadratic or cubic function, or using fractional polynomial
functions (Royston and Altman, 1994)). However, the drawback of these is poorer model fit,
implausibility of assumptions, and difficulties in interpretation. (Tilling et al., 2014) Trial arm
(dosing regimen) was included in the model as an explanatory variable, in order to describe the
81
difference in adherence patterns between regimens. The interaction between trial arm and time
was also explored, in order to assess whether adherence trajectories differed for each regimen.
To explore any potential differences in adherence during the week compared to the weekend,
the above model was extended by the addition of an indicator that distinguished whether a day
fell on a weekday or weekend. Its interaction with trial arm was also explored to determine
whether these differences were larger for participants allocated to a particular dosing regimen.
Similarly, the model was also extended to explore any potential differences in adherence at clinic
visit dates (defined as the date of a scheduled clinic visit and one week either side of this date).
Model fit was assessed using Akaike’s Information Criterion (AIC). (Akaike, 1974) The AIC is
a relative assessment of model fit (i.e. it compares the fit of a model relative to each of the other
models fitted) that penalises for the number of parameters included in the model. The AIC value
is calculated as 𝐴𝐼𝐶 = 2𝑘 − 2 ln(𝐿), where k is the number of parameters and L is the maximum
value of the likelihood function, and smaller AIC values reflect better model fit. Results are
presented as odds ratios with associated 95% confidence intervals and p-values.
4.2.3 Comparing different types of measures
4.2.3.1 Correlation
Different types of measures were initially compared using correlational methods. Scatter plots
were produced to compare different quantitative measures to each other. Each scatter plot
includes a black dashed line along the line of perfect agreement (y=x). Where multiple data
points overlapped (i.e. there was over-plotting), jittering and semi-transparency were used to
highlight this, (Few, 2009) with these modified plots displayed beneath the original. Pearson
product-moment correlation coefficients were calculated to compare the different types of
measures, (Pearson, 1895) with mathematically equivalent point biserial correlation coefficients
used for the binary measures. (Glass and Hopkins, 1970) To provide some qualitative
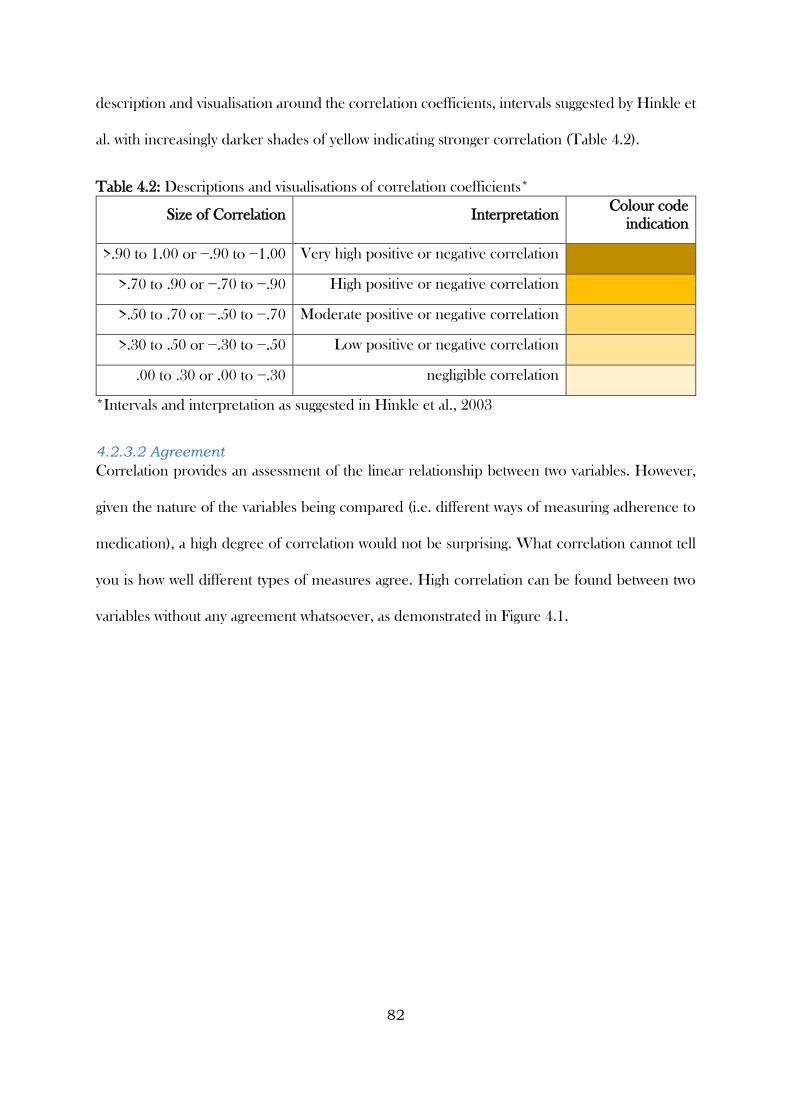
82
description and visualisation around the correlation coefficients, intervals suggested by Hinkle et
al. with increasingly darker shades of yellow indicating stronger correlation (Table 4.2).
Table 4.2: Descriptions and visualisations of correlation coefficients*
Size of Correlation Interpretation Colour code
indication
>.90 to 1.00 or −.90 to −1.00 Very high positive or negative correlation
>.70 to .90 or −.70 to −.90 High positive or negative correlation
>.50 to .70 or −.50 to −.70 Moderate positive or negative correlation
>.30 to .50 or −.30 to −.50 Low positive or negative correlation
.00 to .30 or .00 to −.30 negligible correlation
*Intervals and interpretation as suggested in Hinkle et al., 2003
4.2.3.2 Agreement
Correlation provides an assessment of the linear relationship between two variables. However,
given the nature of the variables being compared (i.e. different ways of measuring adherence to
medication), a high degree of correlation would not be surprising. What correlation cannot tell
you is how well different types of measures agree. High correlation can be found between two
variables without any agreement whatsoever, as demonstrated in Figure 4.1.
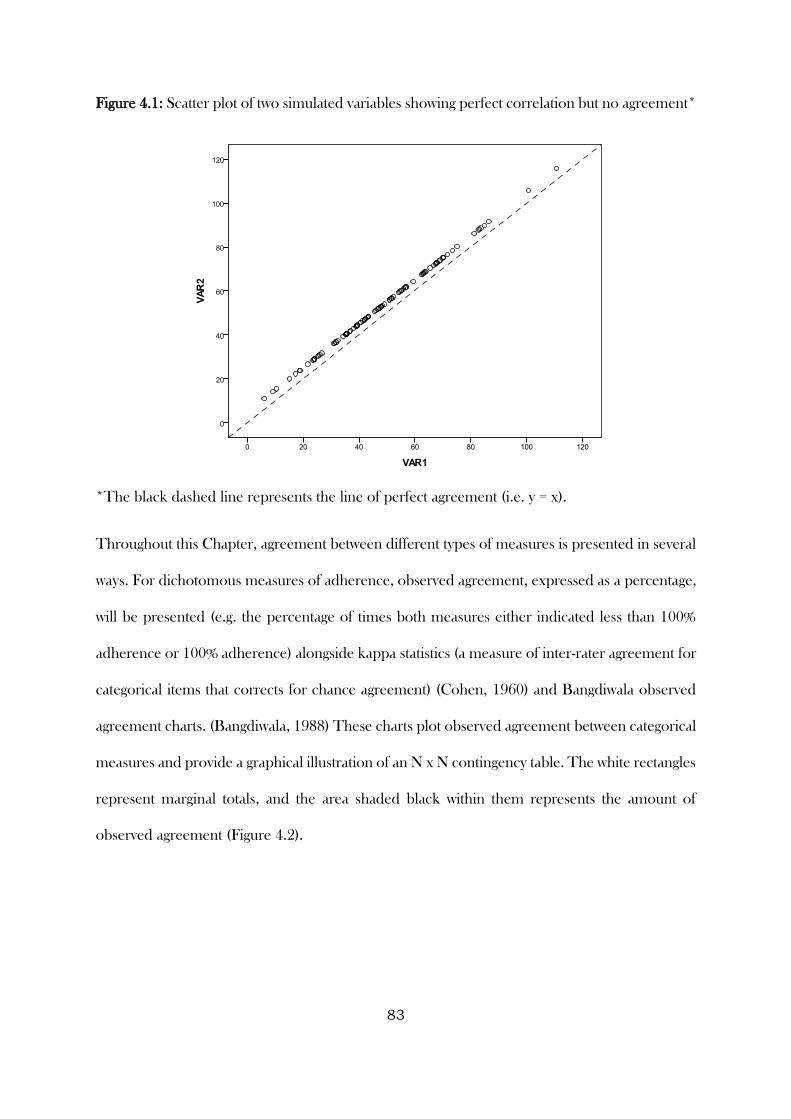
83
Figure 4.1: Scatter plot of two simulated variables showing perfect correlation but no agreement*
*The black dashed line represents the line of perfect agreement (i.e. y = x).
Throughout this Chapter, agreement between different types of measures is presented in several
ways. For dichotomous measures of adherence, observed agreement, expressed as a percentage,
will be presented (e.g. the percentage of times both measures either indicated less than 100%
adherence or 100% adherence) alongside kappa statistics (a measure of inter-rater agreement for
categorical items that corrects for chance agreement) (Cohen, 1960) and Bangdiwala observed
agreement charts. (Bangdiwala, 1988) These charts plot observed agreement between categorical
measures and provide a graphical illustration of an N x N contingency table. The white rectangles
represent marginal totals, and the area shaded black within them represents the amount of
observed agreement (Figure 4.2).
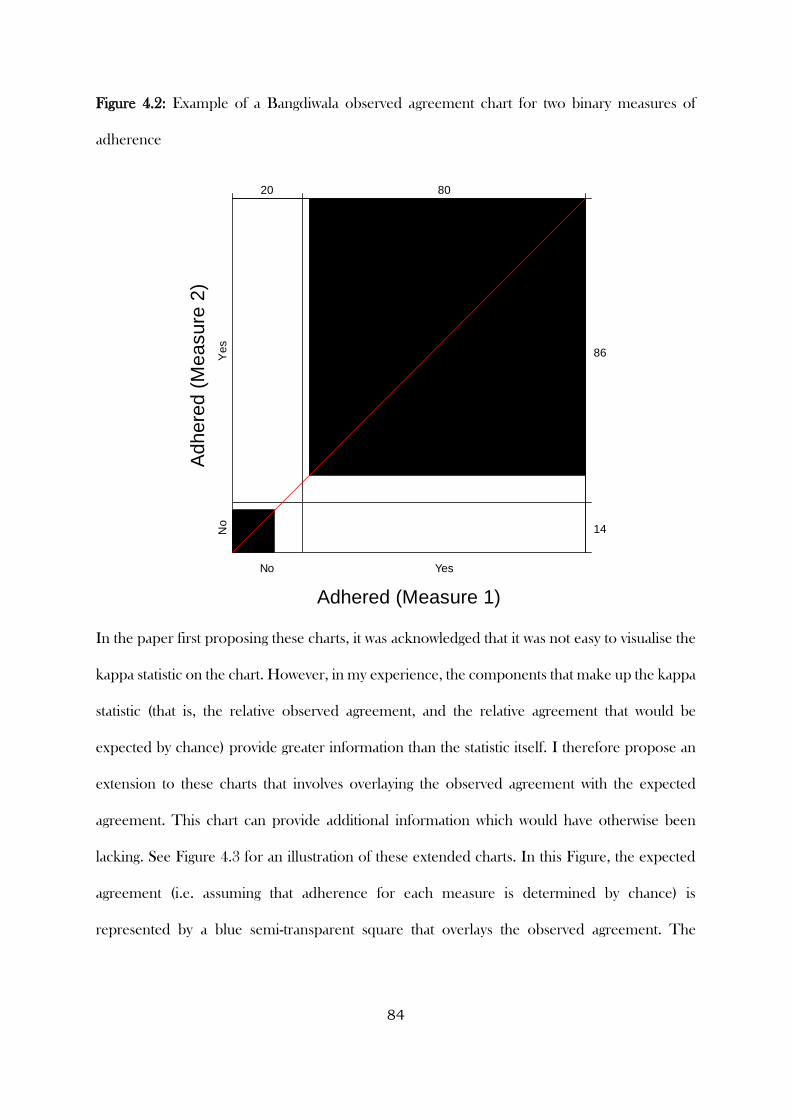
84
Figure 4.2: Example of a Bangdiwala observed agreement chart for two binary measures of
adherence
In the paper first proposing these charts, it was acknowledged that it was not easy to visualise the
kappa statistic on the chart. However, in my experience, the components that make up the kappa
statistic (that is, the relative observed agreement, and the relative agreement that would be
expected by chance) provide greater information than the statistic itself. I therefore propose an
extension to these charts that involves overlaying the observed agreement with the expected
agreement. This chart can provide additional information which would have otherwise been
lacking. See Figure 4.3 for an illustration of these extended charts. In this Figure, the expected
agreement (i.e. assuming that adherence for each measure is determined by chance) is
represented by a blue semi-transparent square that overlays the observed agreement. The
Adhered (Measure 1)
Adhere
d (
Measure
2)
No
No
Yes
Ye
s
20 80
14
86
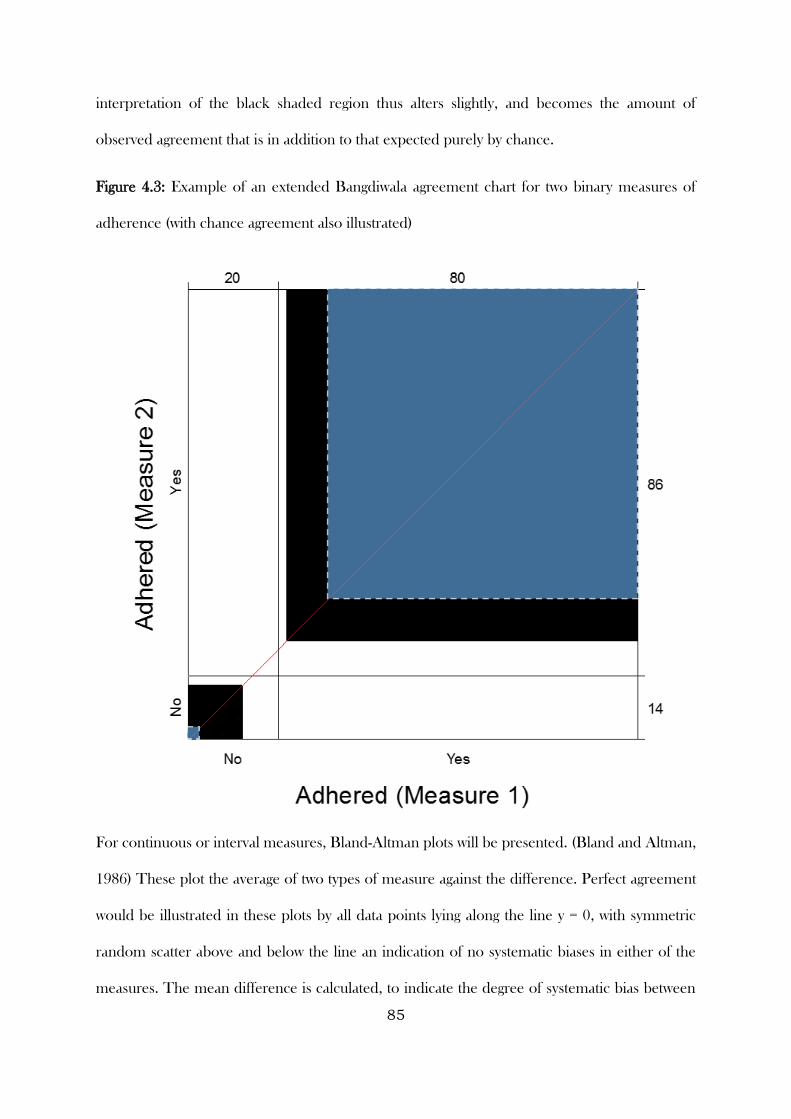
85
interpretation of the black shaded region thus alters slightly, and becomes the amount of
observed agreement that is in addition to that expected purely by chance.
Figure 4.3: Example of an extended Bangdiwala agreement chart for two binary measures of
adherence (with chance agreement also illustrated)
For continuous or interval measures, Bland-Altman plots will be presented. (Bland and Altman,
1986) These plot the average of two types of measure against the difference. Perfect agreement
would be illustrated in these plots by all data points lying along the line y = 0, with symmetric
random scatter above and below the line an indication of no systematic biases in either of the
measures. The mean difference is calculated, to indicate the degree of systematic bias between
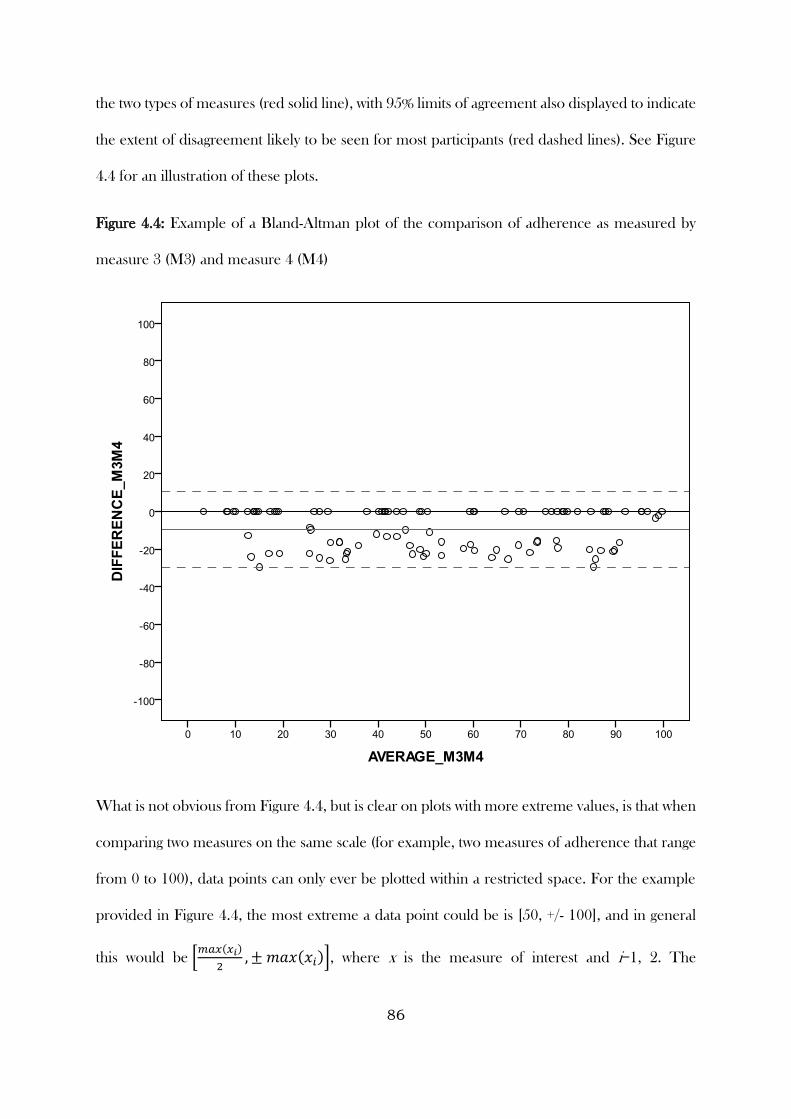
86
the two types of measures (red solid line), with 95% limits of agreement also displayed to indicate
the extent of disagreement likely to be seen for most participants (red dashed lines). See Figure
4.4 for an illustration of these plots.
Figure 4.4: Example of a Bland-Altman plot of the comparison of adherence as measured by
measure 3 (M3) and measure 4 (M4)
What is not obvious from Figure 4.4, but is clear on plots with more extreme values, is that when
comparing two measures on the same scale (for example, two measures of adherence that range
from 0 to 100), data points can only ever be plotted within a restricted space. For the example
provided in Figure 4.4, the most extreme a data point could be is [50, +/- 100], and in general
this would be [𝑚𝑎𝑥(𝑥𝑖)
2, ± 𝑚𝑎𝑥(𝑥𝑖)], where x is the measure of interest and i=1, 2. The
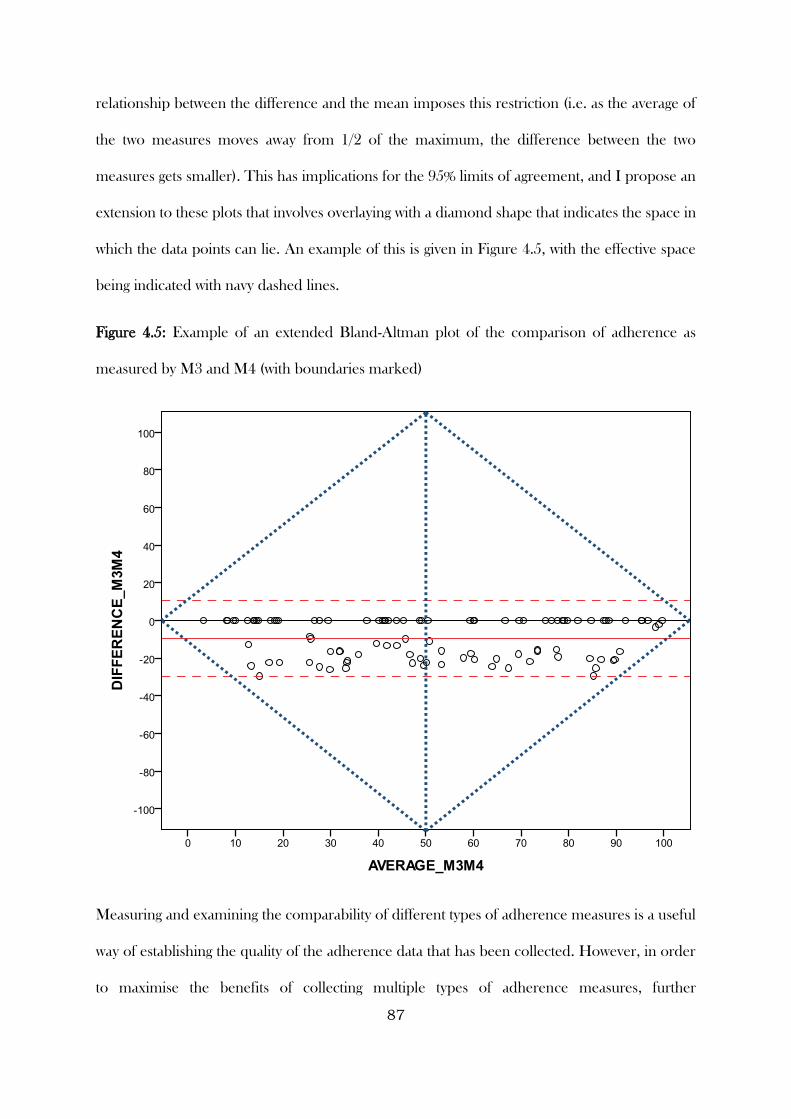
87
relationship between the difference and the mean imposes this restriction (i.e. as the average of
the two measures moves away from 1/2 of the maximum, the difference between the two
measures gets smaller). This has implications for the 95% limits of agreement, and I propose an
extension to these plots that involves overlaying with a diamond shape that indicates the space in
which the data points can lie. An example of this is given in Figure 4.5, with the effective space
being indicated with navy dashed lines.
Figure 4.5: Example of an extended Bland-Altman plot of the comparison of adherence as
measured by M3 and M4 (with boundaries marked)
Measuring and examining the comparability of different types of adherence measures is a useful
way of establishing the quality of the adherence data that has been collected. However, in order
to maximise the benefits of collecting multiple types of adherence measures, further
88
investigations can be carried out to determine characteristics that predict disagreement between
measures, and approaches to generate an agreed or calibrated measure of adherence. It is clear
to see why calibration is worthwhile. In practice, the use of multiple types of adherence measures
implies a lack of trust in any of the measures used. The aim of calibration, in this instance, is to
achieve a measure of adherence that is closer to the truth (or at least has less systematic bias).
Understanding the circumstances and situations that are likely to lead to greater disagreement
can inform researchers (and potentially practitioners) of adherence measures that are most suited
to certain populations, and whether certain populations require adherence measured via multiple
methods (i.e. a risk-adapted approach to adherence monitoring).
4.2.3.4 Predictors of disagreement between different types of adherence measures
Three different approaches were taken in this thesis to investigate predictors of disagreement
between different types of adherence measures. The first approach, and simplest of the three,
was to treat the comparison as a dichotomous variable (disagreed / agreed) and investigate
predictors of disagreement using logistic regression. The second approach was to consider the
difference between types of measures and create a categorical variable that indicated whether
they were the same (i.e. agreed), one was lower, or higher, investigating predictors of being lower
or higher compared to being the same using multinomial logistic regression. The third approach
taken was to consider the direction and extent of disagreement by treating the difference between
types of measures as a continuous variable and investigating predictors using linear regression.
The GRACE WP10a data were used to investigate predictors of disagreement using the three
approaches described above. Adherence according to self-report diaries and tablet counts were
used, as these two types of measures were most frequently available for participants. When
considering the direction and extent of disagreement, this was based on self-reported diary minus
tablet count adherence data, and therefore the “lower” category, or a lower value meant that
adherence data according to self-reported diaries was lower than tablet count data, and vice versa.

89
The clustered nature of participants within clinicians was accounted for by fitting mixed models
for approaches 1 and 3 (i.e. two-level logistic and linear regression models), and by calculating
cluster-robust standard errors for the multinomial logistic regression model. (Williams, 2000)
The candidate variables considered for inclusion related to participant characteristics (age,
gender, co-morbidities, use of chronic medication, and smoking status (never/past/current)) and
characteristics about the illness with which the participant presented (presence/absence of 14
different symptoms, clinician-rated symptom severity, auscultation abnormality, and days waited
prior to consulting). Variables were selected into a univariable model and retained if they were
significant at the p < 0.1 level (it was sufficient to demonstrate an association at the p < 0.1 level
for at least one of the lower / higher comparisons for the multinomial logistic regression model).
Variables in the multivariable model that were not significant at the p < 0.05 level were removed
sequentially, from largest to smallest p-value, until a final multivariable model was attained.
Findings from the models are presented as odds ratios / relative risk ratios / mean differences,
for approaches 1, 2, and 3 respectively, with associated 95% confidence intervals and p-values.
4.2.3.5 Calibrating adherence
Where multiple types of methods are used to measure adherence, and there are discrepancies
between them, several approaches could be taken to adjust or agree upon a measure that takes
into account these discrepancies. The GRACE WP10a data were used throughout this section.
The approaches considered in this Chapter are described below:
4.2.3.5.1 Range calibration
This approach is based on taking the minimum or maximum adherence measure across several
types of measures. There are several advantages to using an approach such as this. It is easy to
understand and communicate, it allows for calibration based on more than two methods of
measurement, and while taking the minimum could be viewed as conservative, also reporting the
maximum gives a likely range of the level of adherence in a given sample.
90
4.2.3.5.2 Hierarchy calibration
Calibrating adherence based on a hierarchy involves making a judgement by ranking your
methods from most to least reliable, and basing your measure on the most reliable method you
have available. In a similar way to the range calibration, this is easy to understand and
communicate and calibration can be based on more than two methods of measurement.
However, the judgement is, to some extent, subjective (though can be based on previous evidence
and the plausibility of the assumptions each method makes), and can vary depending on the
context (e.g. the medication and regimen under investigation, the population of interest, etc.)
Using the GRACE WP10a data, the ordering of the hierarchy was:
1. Adherence based on tablet count data
2. Adherence based on self-reported diary data
3. Adherence based on self-reported telephone data
4.2.3.5.3 Calibration based on classification
The final calibration approach presented in this thesis is an adaptation of a technique developed
by Dukic et al. The original technique used biological assays to measure cotinine, a metabolite
of nicotine, to calibrate self-reported measures of smoking in pregnant women. While a more
direct adaptation of this technique would rely on biological assays, the general approach can be
adapted for other methods of medication adherence measurement. The calibration approach,
based on having two types of measures, is as follows:
1. Declare one type of measure as the reference standard (the measure that will be used to
calibrate) and one as the comparator (the measure that will be calibrated). Using the
GRACE WP10a data, tablet count data were used to calibrate self-reported diary data.
Tablet count data were used as the reference standard. While adherence according to

91
self-reported diary allowed for an assessment of whether a participant took their
medication on a given day, it had to be assumed that if they stated they had taken it, they
had also taken the correct number of tablets. Calibrating by tablet count data therefore
provided a way of correcting for instances where this assumption may not have been true.
2. Calculate adherence according to each measure and compare them
3. Classify individuals into groups based on the above comparison and some sensibly
chosen cut-offs:
a. Extreme over-reporter
b. Over-reporter
c. Accurate reporter
d. Under-reporter
e. Extreme under-reporter
Participants were classified as “accurate reporters” if there was perfect agreement between self-
reported diary and tablet count adherence data (i.e. zero difference). A cut-off of 1/7 was used to
distinguish between over/under-reporters and extreme over/under-reporters. This cut-off was
chosen as it reflected a discrepancy equivalent to an entire days’ worth of medication. Participants
were given 42 tablets, to be taken as two tablets, three times a day for seven days. Adherence was
expressed as a percentage and 6/42 expressed as a percentage is 1/7. Over/under-reporters were
classified so if the discrepancy between self-reported diary and tablet count adherence was up to
1/7 percentage points (inclusive), with extreme classifications given when the discrepancy
exceeded this cut-off.
4. Calculate the mean in each of the above groups
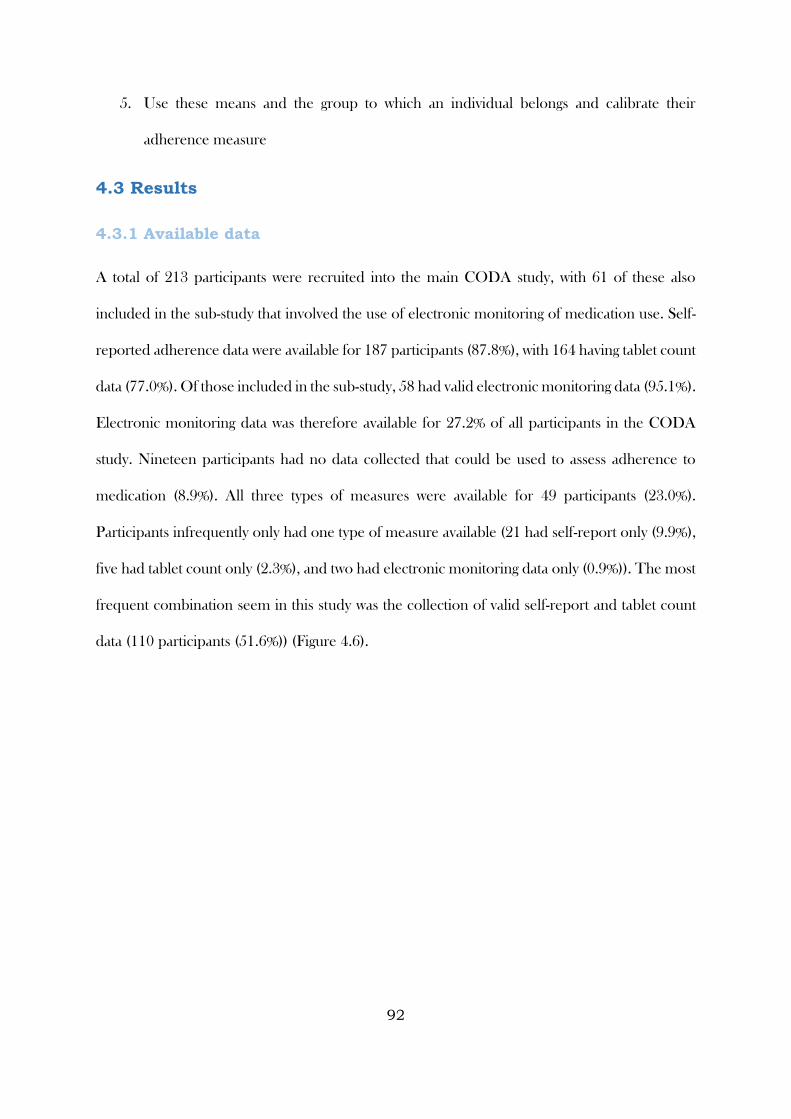
92
5. Use these means and the group to which an individual belongs and calibrate their
adherence measure
4.3 Results
4.3.1 Available data
A total of 213 participants were recruited into the main CODA study, with 61 of these also
included in the sub-study that involved the use of electronic monitoring of medication use. Self-
reported adherence data were available for 187 participants (87.8%), with 164 having tablet count
data (77.0%). Of those included in the sub-study, 58 had valid electronic monitoring data (95.1%).
Electronic monitoring data was therefore available for 27.2% of all participants in the CODA
study. Nineteen participants had no data collected that could be used to assess adherence to
medication (8.9%). All three types of measures were available for 49 participants (23.0%).
Participants infrequently only had one type of measure available (21 had self-report only (9.9%),
five had tablet count only (2.3%), and two had electronic monitoring data only (0.9%)). The most
frequent combination seem in this study was the collection of valid self-report and tablet count
data (110 participants (51.6%)) (Figure 4.6).
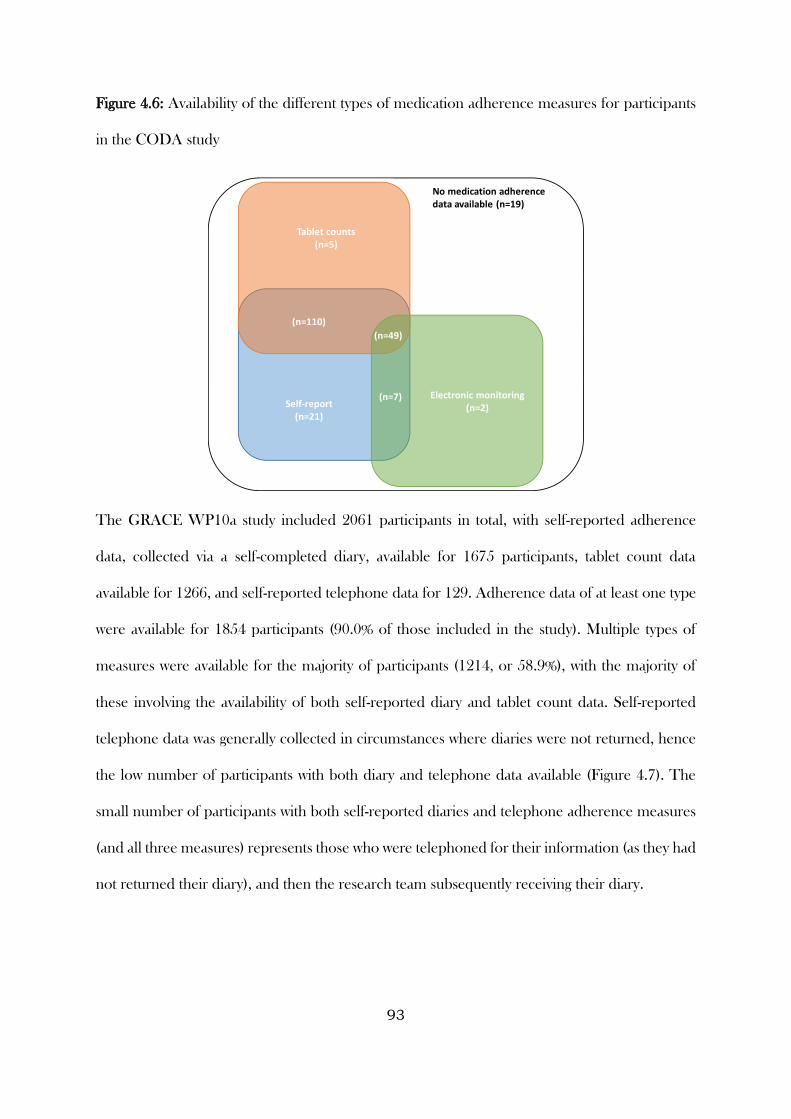
93
Figure 4.6: Availability of the different types of medication adherence measures for participants
in the CODA study
The GRACE WP10a study included 2061 participants in total, with self-reported adherence
data, collected via a self-completed diary, available for 1675 participants, tablet count data
available for 1266, and self-reported telephone data for 129. Adherence data of at least one type
were available for 1854 participants (90.0% of those included in the study). Multiple types of
measures were available for the majority of participants (1214, or 58.9%), with the majority of
these involving the availability of both self-reported diary and tablet count data. Self-reported
telephone data was generally collected in circumstances where diaries were not returned, hence
the low number of participants with both diary and telephone data available (Figure 4.7). The
small number of participants with both self-reported diaries and telephone adherence measures
(and all three measures) represents those who were telephoned for their information (as they had
not returned their diary), and then the research team subsequently receiving their diary.
Tablet counts(n=5)
Electronic monitoring(n=2)Self-report
(n=21)
(n=110)
(n=49)
(n=7)
No medication adherence data available (n=19)
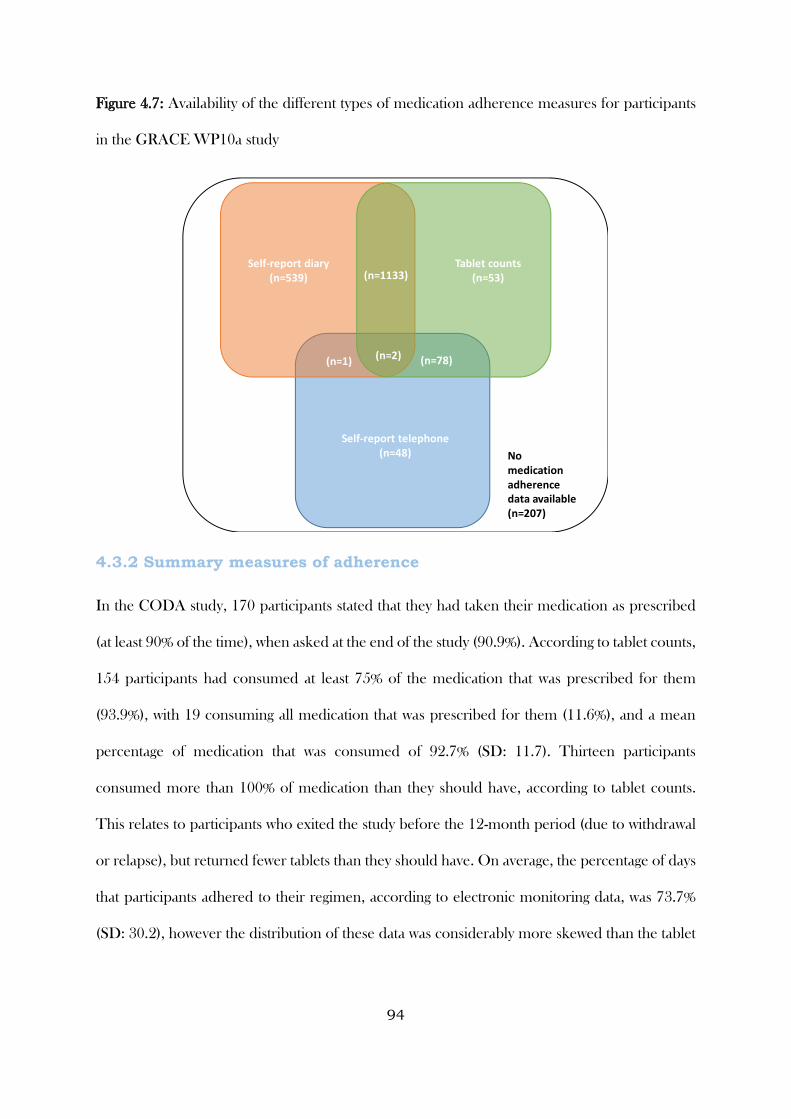
94
Figure 4.7: Availability of the different types of medication adherence measures for participants
in the GRACE WP10a study
4.3.2 Summary measures of adherence
In the CODA study, 170 participants stated that they had taken their medication as prescribed
(at least 90% of the time), when asked at the end of the study (90.9%). According to tablet counts,
154 participants had consumed at least 75% of the medication that was prescribed for them
(93.9%), with 19 consuming all medication that was prescribed for them (11.6%), and a mean
percentage of medication that was consumed of 92.7% (SD: 11.7). Thirteen participants
consumed more than 100% of medication than they should have, according to tablet counts.
This relates to participants who exited the study before the 12-month period (due to withdrawal
or relapse), but returned fewer tablets than they should have. On average, the percentage of days
that participants adhered to their regimen, according to electronic monitoring data, was 73.7%
(SD: 30.2), however the distribution of these data was considerably more skewed than the tablet
Tablet counts(n=53)
Self-report telephone(n=48)
Self-report diary(n=539) (n=1133)
(n=1) (n=78)
No medication adherence data available (n=207)
(n=2)
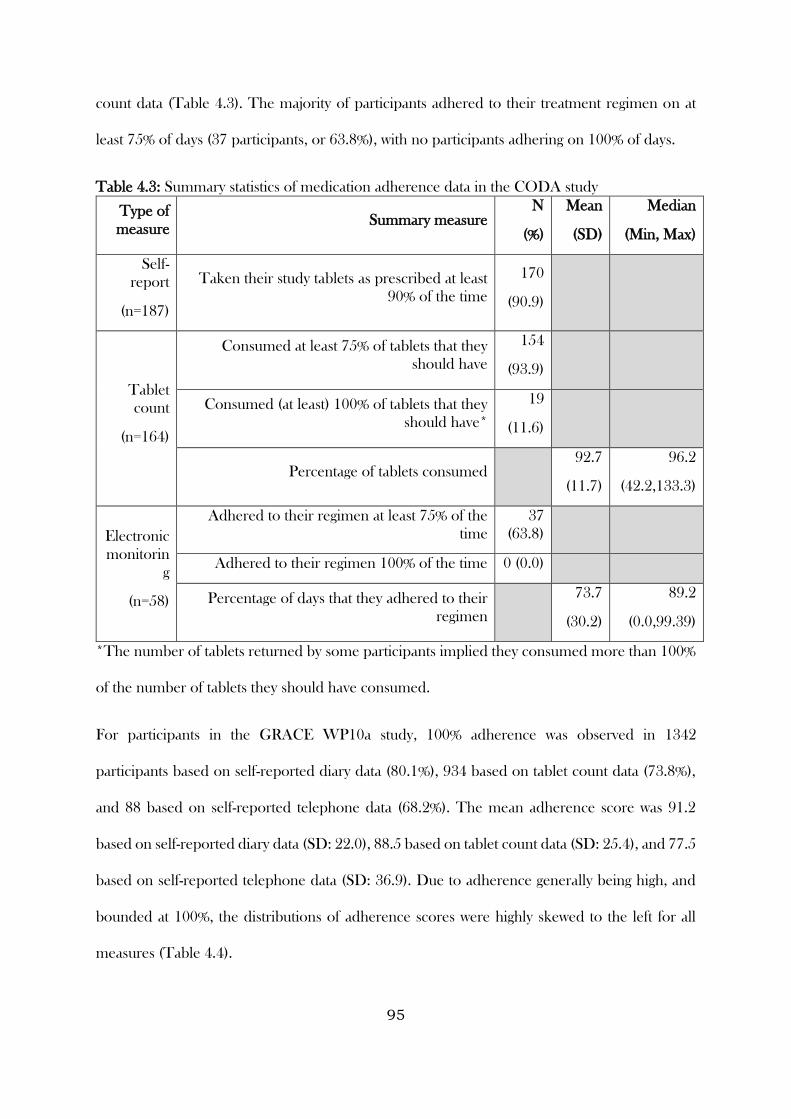
95
count data (Table 4.3). The majority of participants adhered to their treatment regimen on at
least 75% of days (37 participants, or 63.8%), with no participants adhering on 100% of days.
Table 4.3: Summary statistics of medication adherence data in the CODA study
Type of
measure Summary measure
N
(%)
Mean
(SD)
Median
(Min, Max)
Self-
report
(n=187)
Taken their study tablets as prescribed at least
90% of the time
170
(90.9)
Tablet
count
(n=164)
Consumed at least 75% of tablets that they
should have
154
(93.9)
Consumed (at least) 100% of tablets that they
should have*
19
(11.6)
Percentage of tablets consumed 92.7
(11.7)
96.2
(42.2,133.3)
Electronic
monitorin
g
(n=58)
Adhered to their regimen at least 75% of the
time
37
(63.8)
Adhered to their regimen 100% of the time 0 (0.0)
Percentage of days that they adhered to their
regimen
73.7
(30.2)
89.2
(0.0,99.39)
*The number of tablets returned by some participants implied they consumed more than 100%
of the number of tablets they should have consumed.
For participants in the GRACE WP10a study, 100% adherence was observed in 1342
participants based on self-reported diary data (80.1%), 934 based on tablet count data (73.8%),
and 88 based on self-reported telephone data (68.2%). The mean adherence score was 91.2
based on self-reported diary data (SD: 22.0), 88.5 based on tablet count data (SD: 25.4), and 77.5
based on self-reported telephone data (SD: 36.9). Due to adherence generally being high, and
bounded at 100%, the distributions of adherence scores were highly skewed to the left for all
measures (Table 4.4).
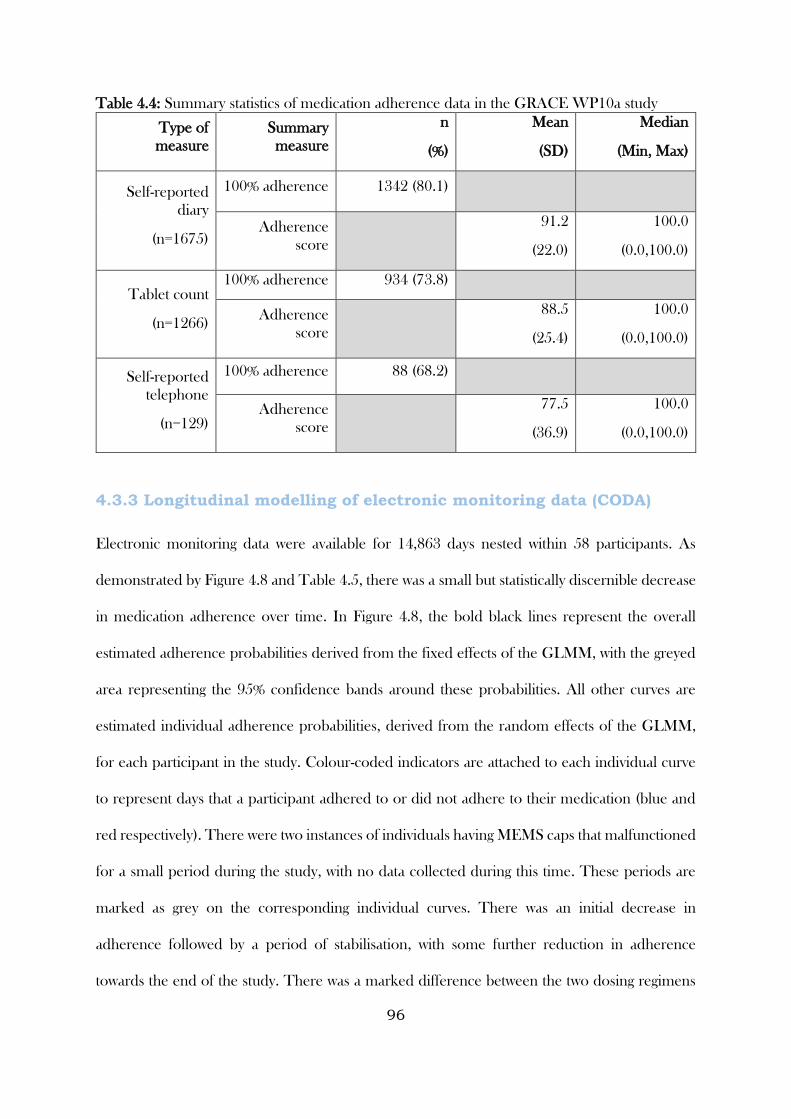
96
Table 4.4: Summary statistics of medication adherence data in the GRACE WP10a study
Type of
measure
Summary
measure
n
(%)
Mean
(SD)
Median
(Min, Max)
Self-reported
diary
(n=1675)
100% adherence 1342 (80.1)
Adherence
score
91.2
(22.0)
100.0
(0.0,100.0)
Tablet count
(n=1266)
100% adherence 934 (73.8)
Adherence
score
88.5
(25.4)
100.0
(0.0,100.0)
Self-reported
telephone
(n=129)
100% adherence 88 (68.2)
Adherence
score
77.5
(36.9)
100.0
(0.0,100.0)
4.3.3 Longitudinal modelling of electronic monitoring data (CODA)
Electronic monitoring data were available for 14,863 days nested within 58 participants. As
demonstrated by Figure 4.8 and Table 4.5, there was a small but statistically discernible decrease
in medication adherence over time. In Figure 4.8, the bold black lines represent the overall
estimated adherence probabilities derived from the fixed effects of the GLMM, with the greyed
area representing the 95% confidence bands around these probabilities. All other curves are
estimated individual adherence probabilities, derived from the random effects of the GLMM,
for each participant in the study. Colour-coded indicators are attached to each individual curve
to represent days that a participant adhered to or did not adhere to their medication (blue and
red respectively). There were two instances of individuals having MEMS caps that malfunctioned
for a small period during the study, with no data collected during this time. These periods are
marked as grey on the corresponding individual curves. There was an initial decrease in
adherence followed by a period of stabilisation, with some further reduction in adherence
towards the end of the study. There was a marked difference between the two dosing regimens
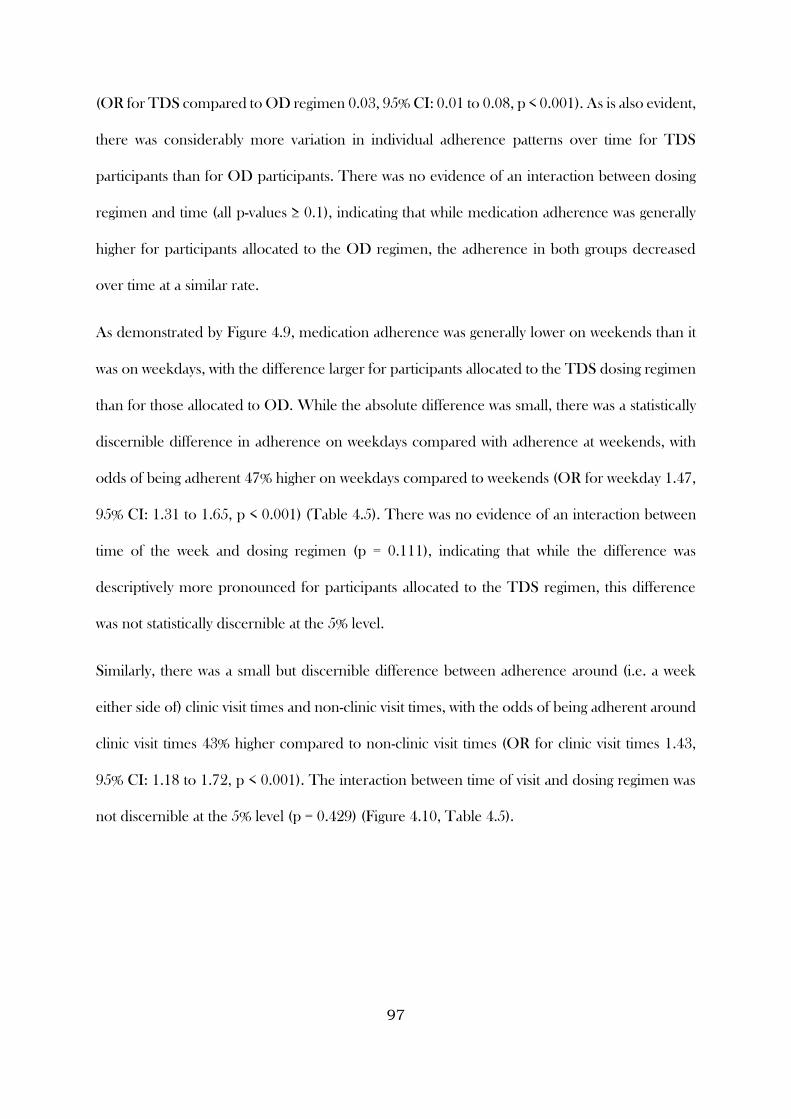
97
(OR for TDS compared to OD regimen 0.03, 95% CI: 0.01 to 0.08, p < 0.001). As is also evident,
there was considerably more variation in individual adherence patterns over time for TDS
participants than for OD participants. There was no evidence of an interaction between dosing
regimen and time (all p-values ≥ 0.1), indicating that while medication adherence was generally
higher for participants allocated to the OD regimen, the adherence in both groups decreased
over time at a similar rate.
As demonstrated by Figure 4.9, medication adherence was generally lower on weekends than it
was on weekdays, with the difference larger for participants allocated to the TDS dosing regimen
than for those allocated to OD. While the absolute difference was small, there was a statistically
discernible difference in adherence on weekdays compared with adherence at weekends, with
odds of being adherent 47% higher on weekdays compared to weekends (OR for weekday 1.47,
95% CI: 1.31 to 1.65, p < 0.001) (Table 4.5). There was no evidence of an interaction between
time of the week and dosing regimen (p = 0.111), indicating that while the difference was
descriptively more pronounced for participants allocated to the TDS regimen, this difference
was not statistically discernible at the 5% level.
Similarly, there was a small but discernible difference between adherence around (i.e. a week
either side of) clinic visit times and non-clinic visit times, with the odds of being adherent around
clinic visit times 43% higher compared to non-clinic visit times (OR for clinic visit times 1.43,
95% CI: 1.18 to 1.72, p < 0.001). The interaction between time of visit and dosing regimen was
not discernible at the 5% level (p = 0.429) (Figure 4.10, Table 4.5).
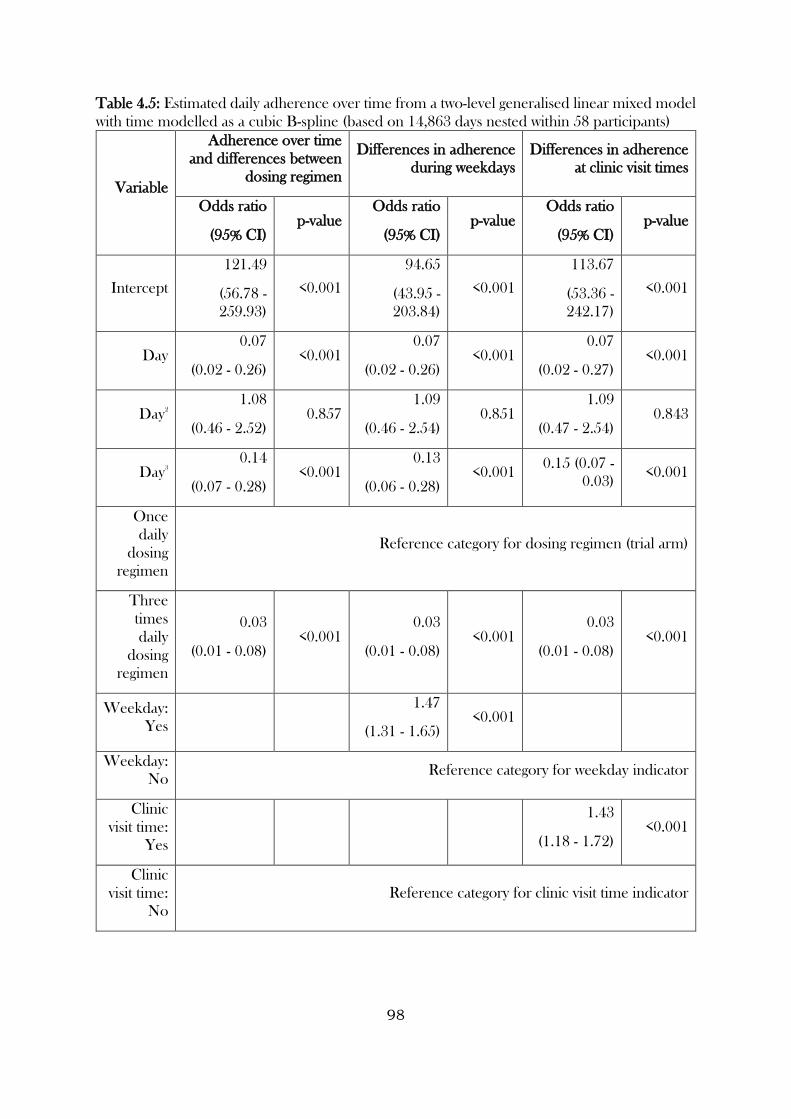
98
Table 4.5: Estimated daily adherence over time from a two-level generalised linear mixed model
with time modelled as a cubic B-spline (based on 14,863 days nested within 58 participants)
Variable
Adherence over time
and differences between
dosing regimen
Differences in adherence
during weekdays
Differences in adherence
at clinic visit times
Odds ratio
(95% CI) p-value
Odds ratio
(95% CI) p-value
Odds ratio
(95% CI) p-value
Intercept
121.49
(56.78 -
259.93)
<0.001
94.65
(43.95 -
203.84)
<0.001
113.67
(53.36 -
242.17)
<0.001
Day 0.07
(0.02 - 0.26) <0.001
0.07
(0.02 - 0.26) <0.001
0.07
(0.02 - 0.27) <0.001
Day2
1.08
(0.46 - 2.52) 0.857
1.09
(0.46 - 2.54) 0.851
1.09
(0.47 - 2.54) 0.843
Day3
0.14
(0.07 - 0.28) <0.001
0.13
(0.06 - 0.28) <0.001
0.15 (0.07 -
0.03) <0.001
Once
daily
dosing
regimen
Reference category for dosing regimen (trial arm)
Three
times
daily
dosing
regimen
0.03
(0.01 - 0.08) <0.001
0.03
(0.01 - 0.08) <0.001
0.03
(0.01 - 0.08) <0.001
Weekday:
Yes
1.47
(1.31 - 1.65) <0.001
Weekday:
No Reference category for weekday indicator
Clinic
visit time:
Yes
1.43
(1.18 - 1.72) <0.001
Clinic
visit time:
No
Reference category for clinic visit time indicator
99
Figure 4.8: Estimated medication adherence probabilities over time (using the MEMS cap data)
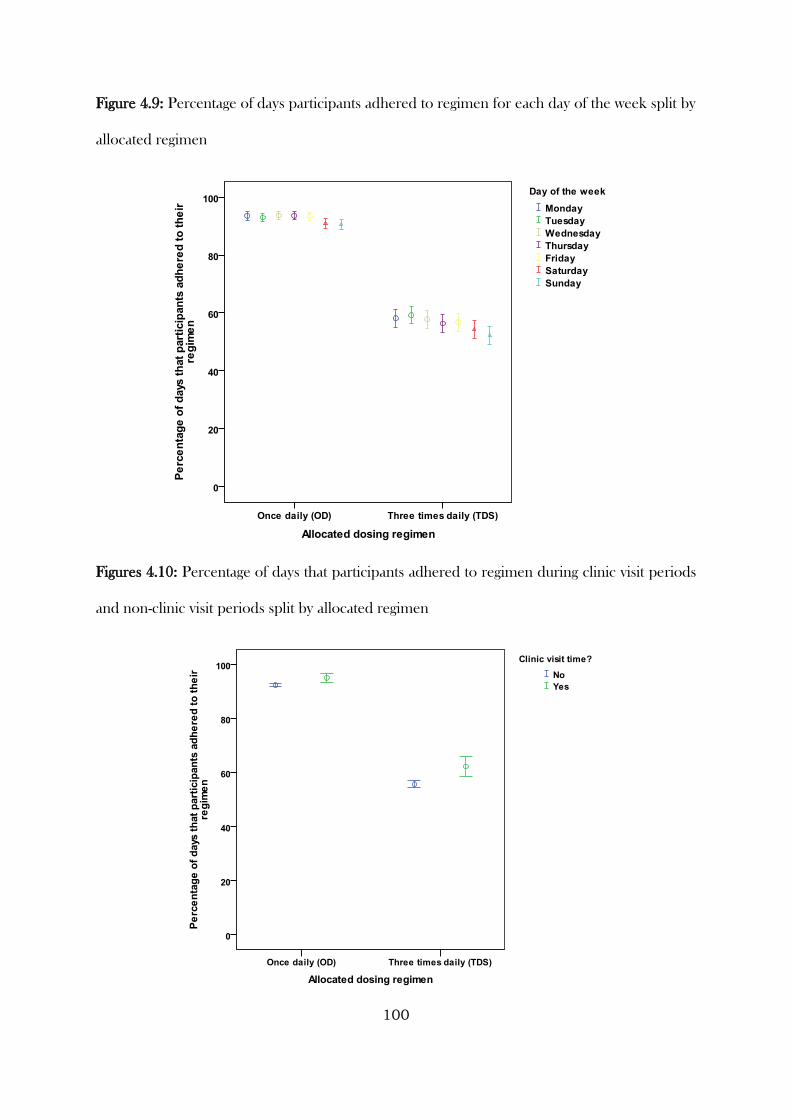
100
Figure 4.9: Percentage of days participants adhered to regimen for each day of the week split by
allocated regimen
Figures 4.10: Percentage of days that participants adhered to regimen during clinic visit periods
and non-clinic visit periods split by allocated regimen
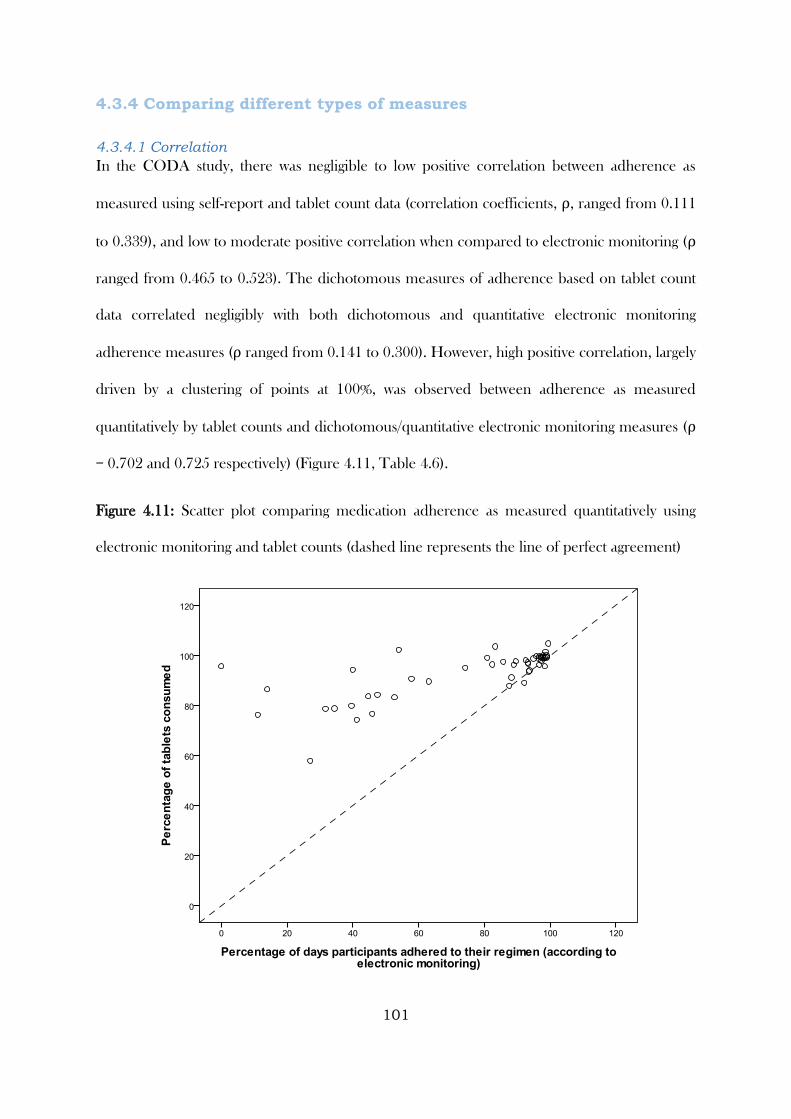
101
4.3.4 Comparing different types of measures
4.3.4.1 Correlation
In the CODA study, there was negligible to low positive correlation between adherence as
measured using self-report and tablet count data (correlation coefficients, ρ, ranged from 0.111
to 0.339), and low to moderate positive correlation when compared to electronic monitoring (ρ
ranged from 0.465 to 0.523). The dichotomous measures of adherence based on tablet count
data correlated negligibly with both dichotomous and quantitative electronic monitoring
adherence measures (ρ ranged from 0.141 to 0.300). However, high positive correlation, largely
driven by a clustering of points at 100%, was observed between adherence as measured
quantitatively by tablet counts and dichotomous/quantitative electronic monitoring measures (ρ
= 0.702 and 0.725 respectively) (Figure 4.11, Table 4.6).
Figure 4.11: Scatter plot comparing medication adherence as measured quantitatively using
electronic monitoring and tablet counts (dashed line represents the line of perfect agreement)
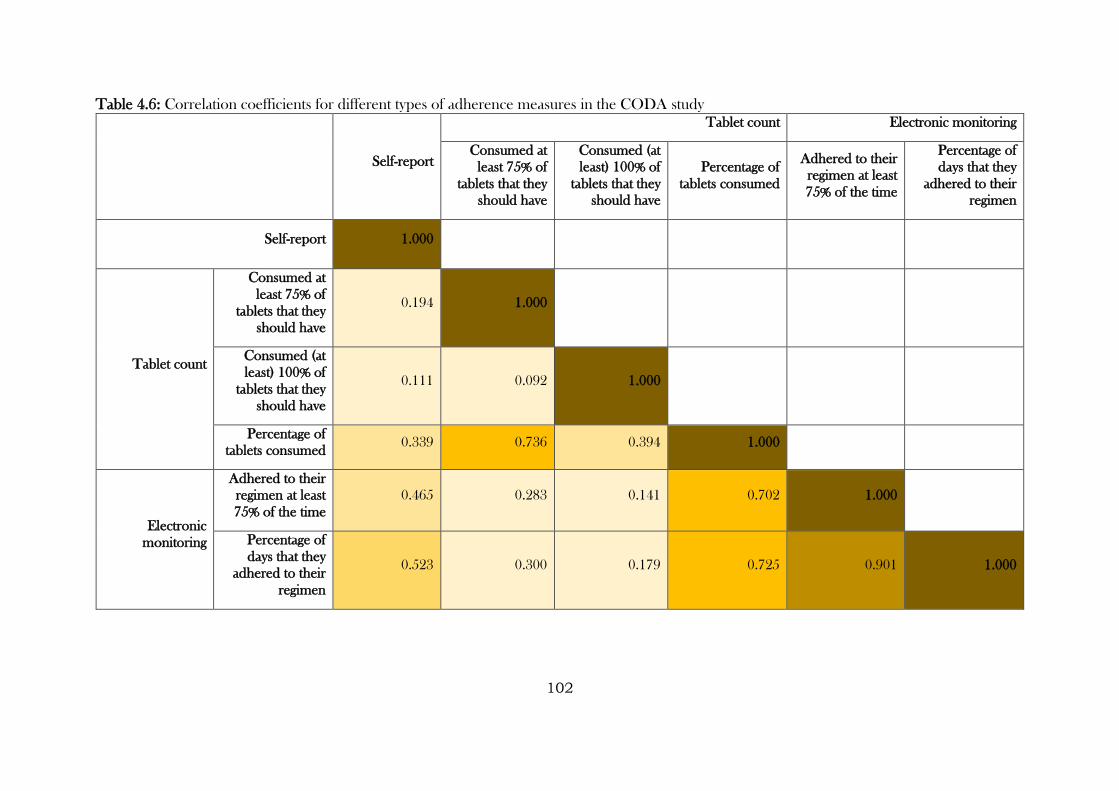
102
Table 4.6: Correlation coefficients for different types of adherence measures in the CODA study
Self-report
Tablet count Electronic monitoring
Consumed at
least 75% of
tablets that they
should have
Consumed (at
least) 100% of
tablets that they
should have
Percentage of
tablets consumed
Adhered to their
regimen at least
75% of the time
Percentage of
days that they
adhered to their
regimen
Self-report 1.000
Tablet count
Consumed at
least 75% of
tablets that they
should have
0.194 1.000
Consumed (at
least) 100% of
tablets that they
should have
0.111 0.092 1.000
Percentage of
tablets consumed 0.339 0.736 0.394 1.000
Electronic
monitoring
Adhered to their
regimen at least
75% of the time
0.465 0.283 0.141 0.702 1.000
Percentage of
days that they
adhered to their
regimen
0.523 0.300 0.179 0.725 0.901 1.000
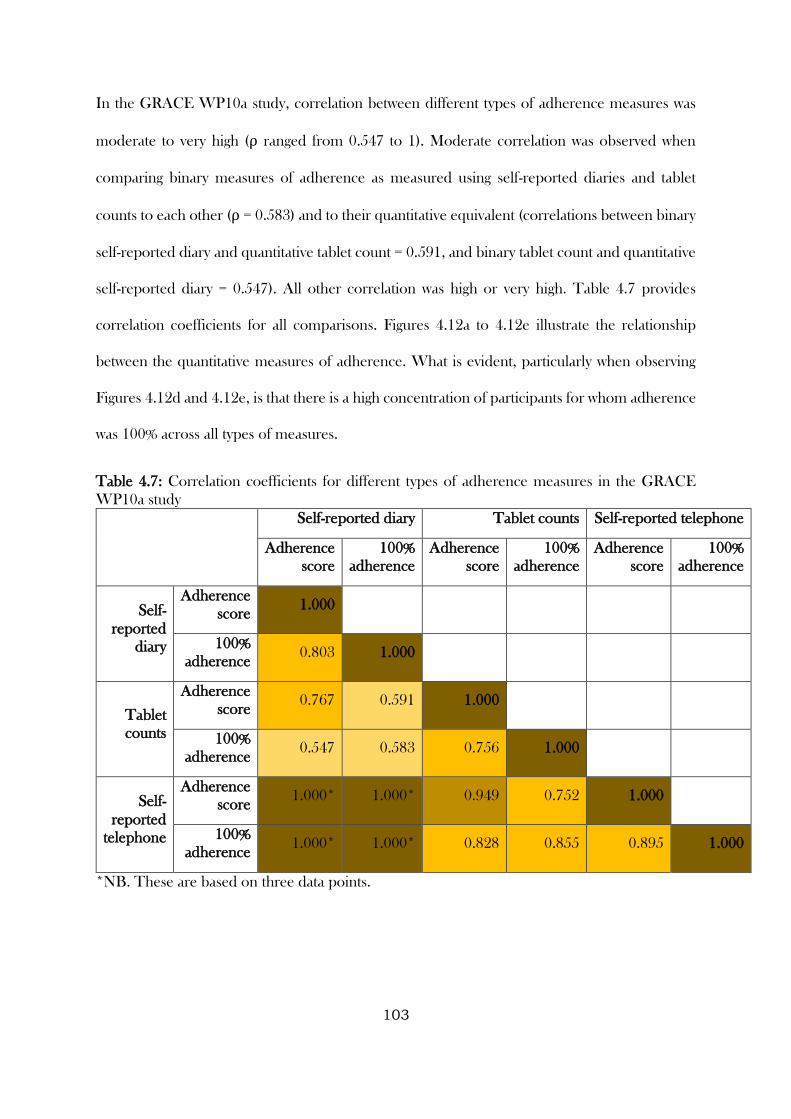
103
In the GRACE WP10a study, correlation between different types of adherence measures was
moderate to very high (ρ ranged from 0.547 to 1). Moderate correlation was observed when
comparing binary measures of adherence as measured using self-reported diaries and tablet
counts to each other (ρ = 0.583) and to their quantitative equivalent (correlations between binary
self-reported diary and quantitative tablet count = 0.591, and binary tablet count and quantitative
self-reported diary = 0.547). All other correlation was high or very high. Table 4.7 provides
correlation coefficients for all comparisons. Figures 4.12a to 4.12e illustrate the relationship
between the quantitative measures of adherence. What is evident, particularly when observing
Figures 4.12d and 4.12e, is that there is a high concentration of participants for whom adherence
was 100% across all types of measures.
Table 4.7: Correlation coefficients for different types of adherence measures in the GRACE
WP10a study
Self-reported diary Tablet counts Self-reported telephone
Adherence
score
100%
adherence
Adherence
score
100%
adherence
Adherence
score
100%
adherence
Self-
reported
diary
Adherence
score 1.000
100%
adherence 0.803 1.000
Tablet
counts
Adherence
score 0.767 0.591 1.000
100%
adherence 0.547 0.583 0.756 1.000
Self-
reported
telephone
Adherence
score 1.000* 1.000* 0.949 0.752 1.000
100%
adherence 1.000* 1.000* 0.828 0.855 0.895 1.000
*NB. These are based on three data points.
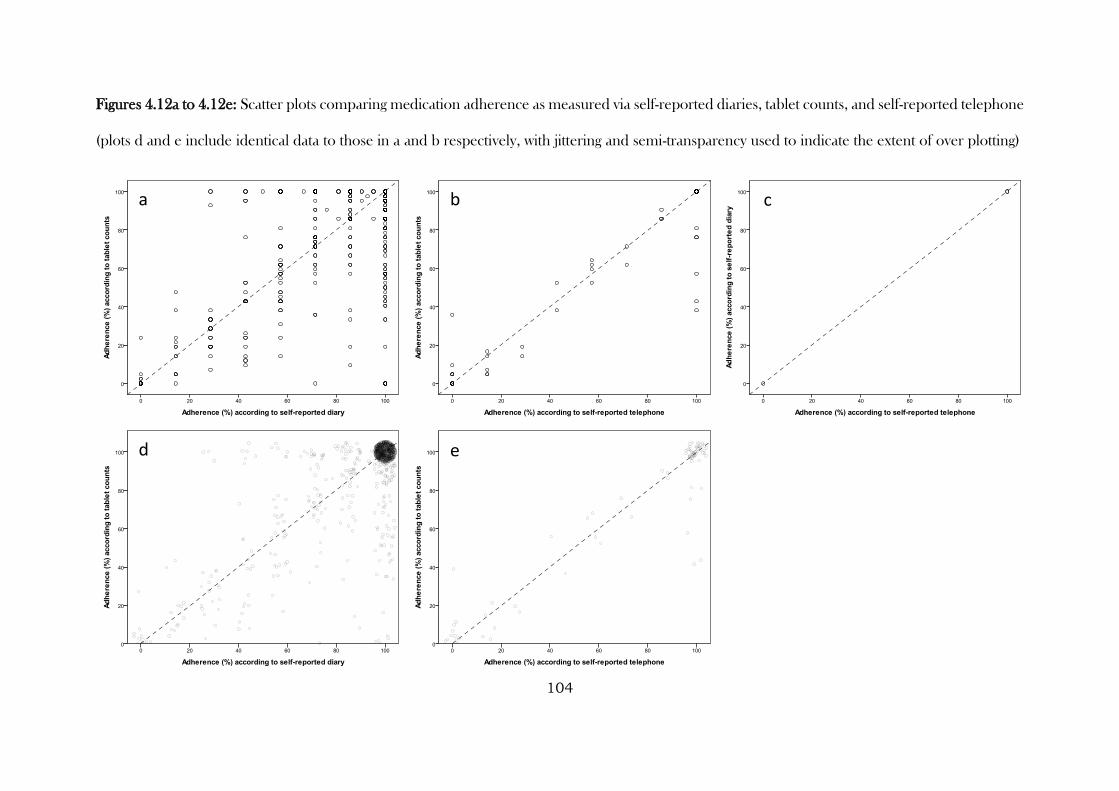
104
Figures 4.12a to 4.12e: Scatter plots comparing medication adherence as measured via self-reported diaries, tablet counts, and self-reported telephone
(plots d and e include identical data to those in a and b respectively, with jittering and semi-transparency used to indicate the extent of over plotting)
d e
a b c
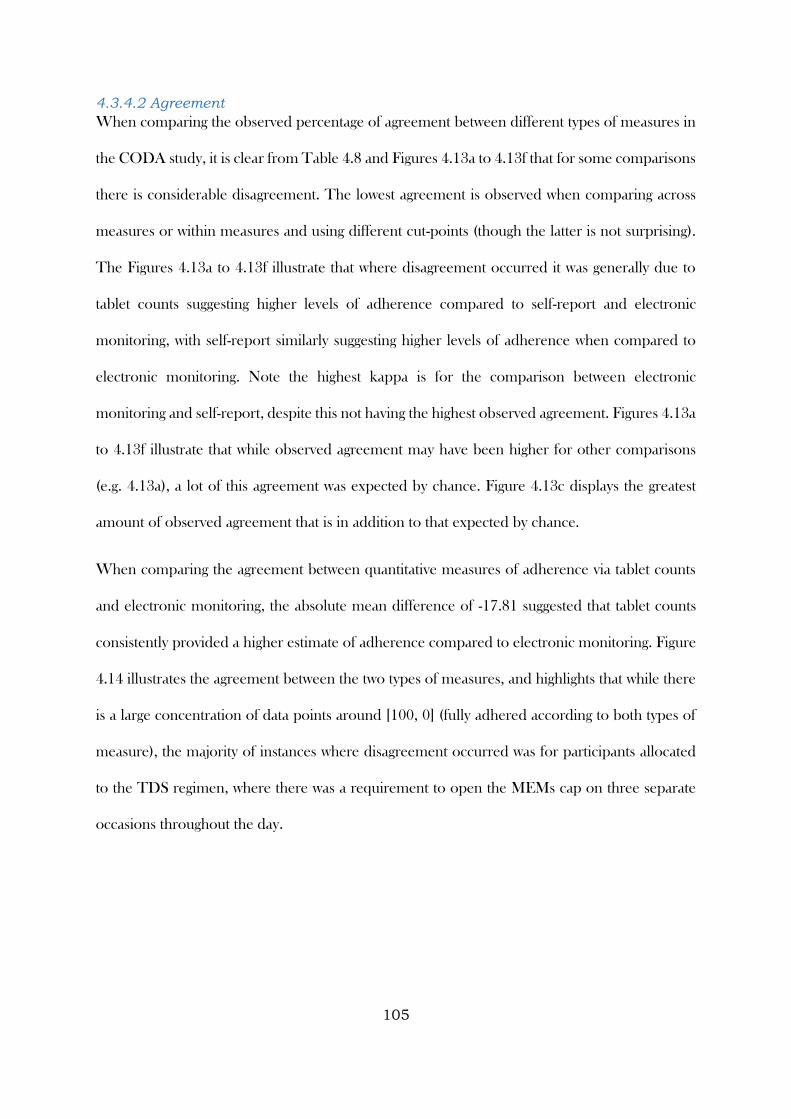
105
4.3.4.2 Agreement
When comparing the observed percentage of agreement between different types of measures in
the CODA study, it is clear from Table 4.8 and Figures 4.13a to 4.13f that for some comparisons
there is considerable disagreement. The lowest agreement is observed when comparing across
measures or within measures and using different cut-points (though the latter is not surprising).
The Figures 4.13a to 4.13f illustrate that where disagreement occurred it was generally due to
tablet counts suggesting higher levels of adherence compared to self-report and electronic
monitoring, with self-report similarly suggesting higher levels of adherence when compared to
electronic monitoring. Note the highest kappa is for the comparison between electronic
monitoring and self-report, despite this not having the highest observed agreement. Figures 4.13a
to 4.13f illustrate that while observed agreement may have been higher for other comparisons
(e.g. 4.13a), a lot of this agreement was expected by chance. Figure 4.13c displays the greatest
amount of observed agreement that is in addition to that expected by chance.
When comparing the agreement between quantitative measures of adherence via tablet counts
and electronic monitoring, the absolute mean difference of -17.81 suggested that tablet counts
consistently provided a higher estimate of adherence compared to electronic monitoring. Figure
4.14 illustrates the agreement between the two types of measures, and highlights that while there
is a large concentration of data points around [100, 0] (fully adhered according to both types of
measure), the majority of instances where disagreement occurred was for participants allocated
to the TDS regimen, where there was a requirement to open the MEMs cap on three separate
occasions throughout the day.
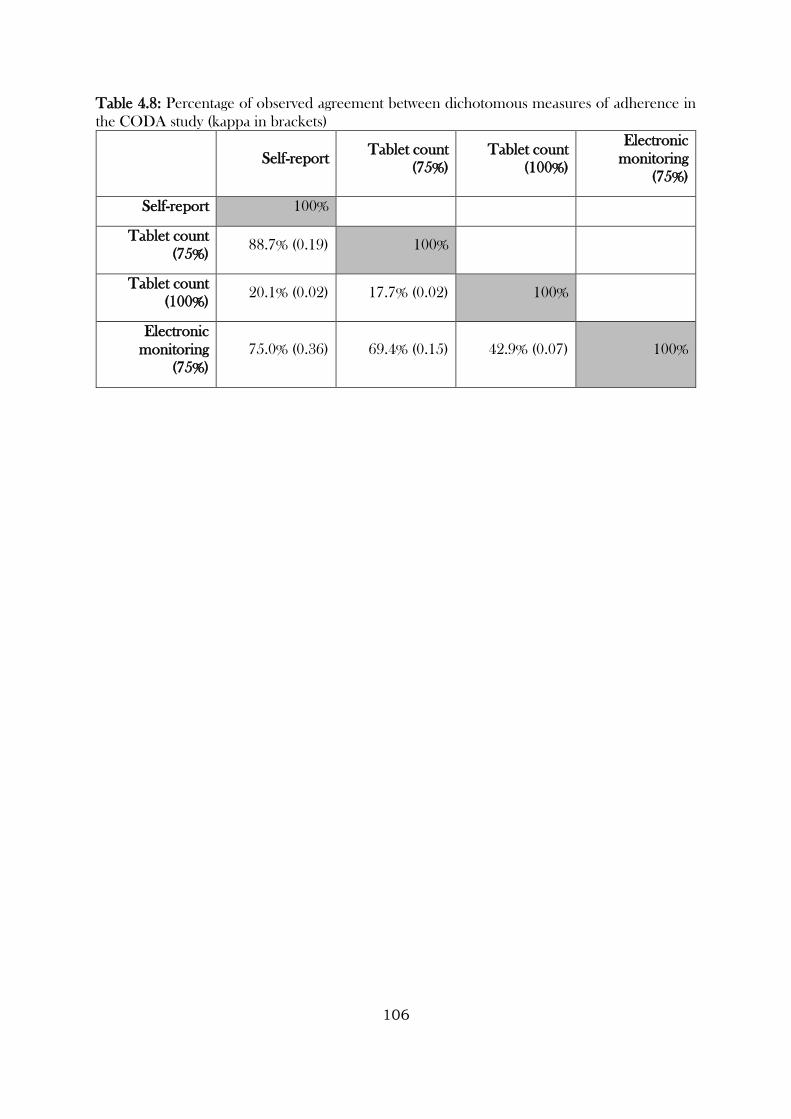
106
Table 4.8: Percentage of observed agreement between dichotomous measures of adherence in
the CODA study (kappa in brackets)
Self-report Tablet count
(75%)
Tablet count
(100%)
Electronic
monitoring
(75%)
Self-report 100%
Tablet count
(75%) 88.7% (0.19) 100%
Tablet count
(100%) 20.1% (0.02) 17.7% (0.02) 100%
Electronic
monitoring
(75%)
75.0% (0.36) 69.4% (0.15) 42.9% (0.07) 100%
107
Figures 4.13a to 4.13f: Extended observed agreement charts for dichotomous measures of adherence in the CODA study
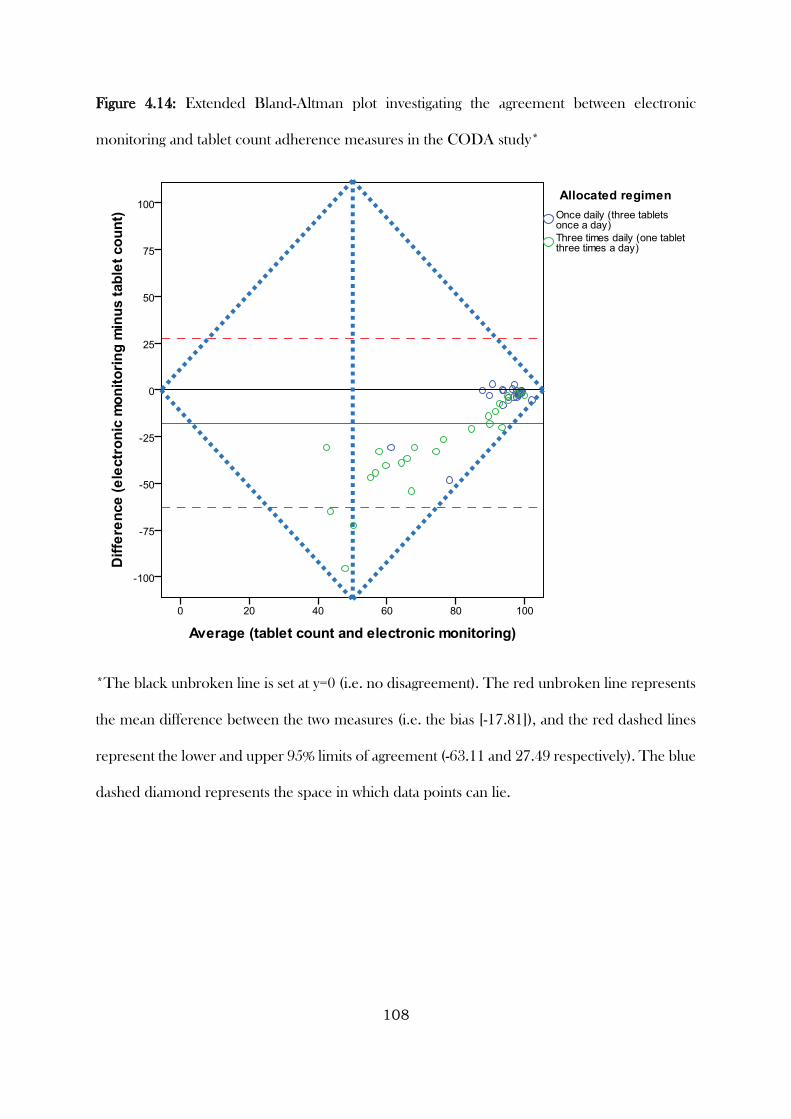
108
Figure 4.14: Extended Bland-Altman plot investigating the agreement between electronic
monitoring and tablet count adherence measures in the CODA study*
*The black unbroken line is set at y=0 (i.e. no disagreement). The red unbroken line represents
the mean difference between the two measures (i.e. the bias [-17.81]), and the red dashed lines
represent the lower and upper 95% limits of agreement (-63.11 and 27.49 respectively). The blue
dashed diamond represents the space in which data points can lie.
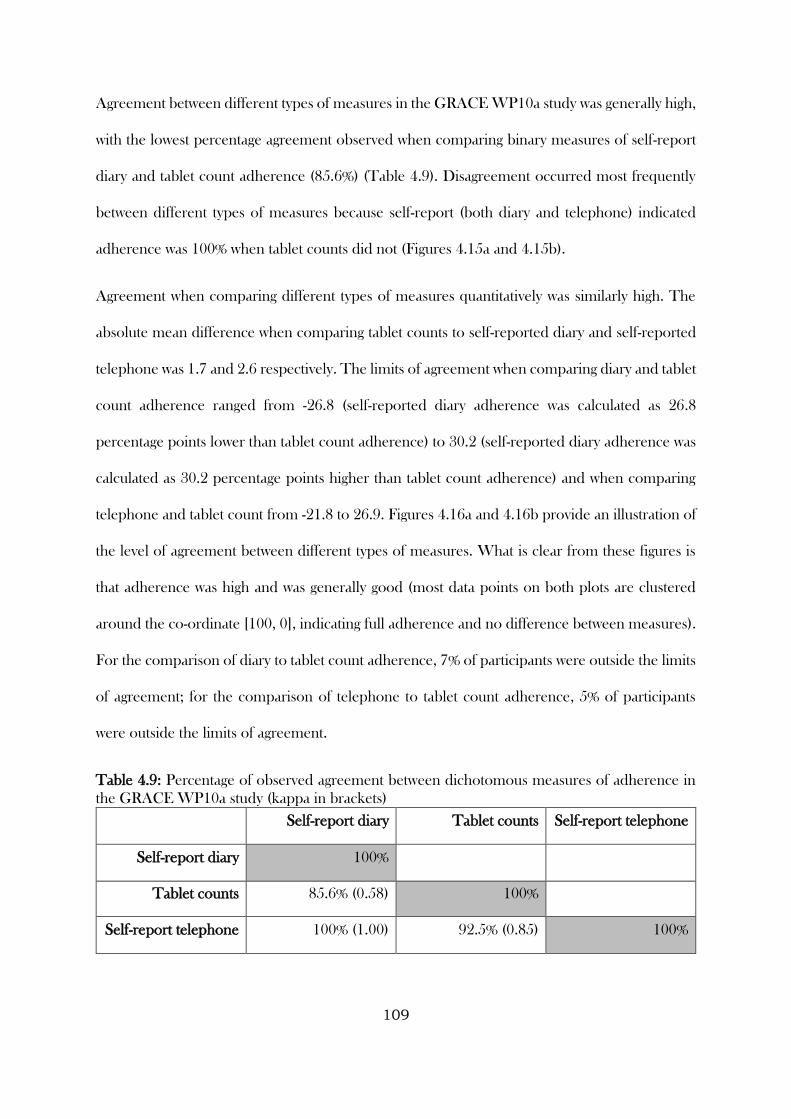
109
Agreement between different types of measures in the GRACE WP10a study was generally high,
with the lowest percentage agreement observed when comparing binary measures of self-report
diary and tablet count adherence (85.6%) (Table 4.9). Disagreement occurred most frequently
between different types of measures because self-report (both diary and telephone) indicated
adherence was 100% when tablet counts did not (Figures 4.15a and 4.15b).
Agreement when comparing different types of measures quantitatively was similarly high. The
absolute mean difference when comparing tablet counts to self-reported diary and self-reported
telephone was 1.7 and 2.6 respectively. The limits of agreement when comparing diary and tablet
count adherence ranged from -26.8 (self-reported diary adherence was calculated as 26.8
percentage points lower than tablet count adherence) to 30.2 (self-reported diary adherence was
calculated as 30.2 percentage points higher than tablet count adherence) and when comparing
telephone and tablet count from -21.8 to 26.9. Figures 4.16a and 4.16b provide an illustration of
the level of agreement between different types of measures. What is clear from these figures is
that adherence was high and was generally good (most data points on both plots are clustered
around the co-ordinate [100, 0], indicating full adherence and no difference between measures).
For the comparison of diary to tablet count adherence, 7% of participants were outside the limits
of agreement; for the comparison of telephone to tablet count adherence, 5% of participants
were outside the limits of agreement.
Table 4.9: Percentage of observed agreement between dichotomous measures of adherence in
the GRACE WP10a study (kappa in brackets)
Self-report diary Tablet counts Self-report telephone
Self-report diary 100%
Tablet counts 85.6% (0.58) 100%
Self-report telephone 100% (1.00) 92.5% (0.85) 100%
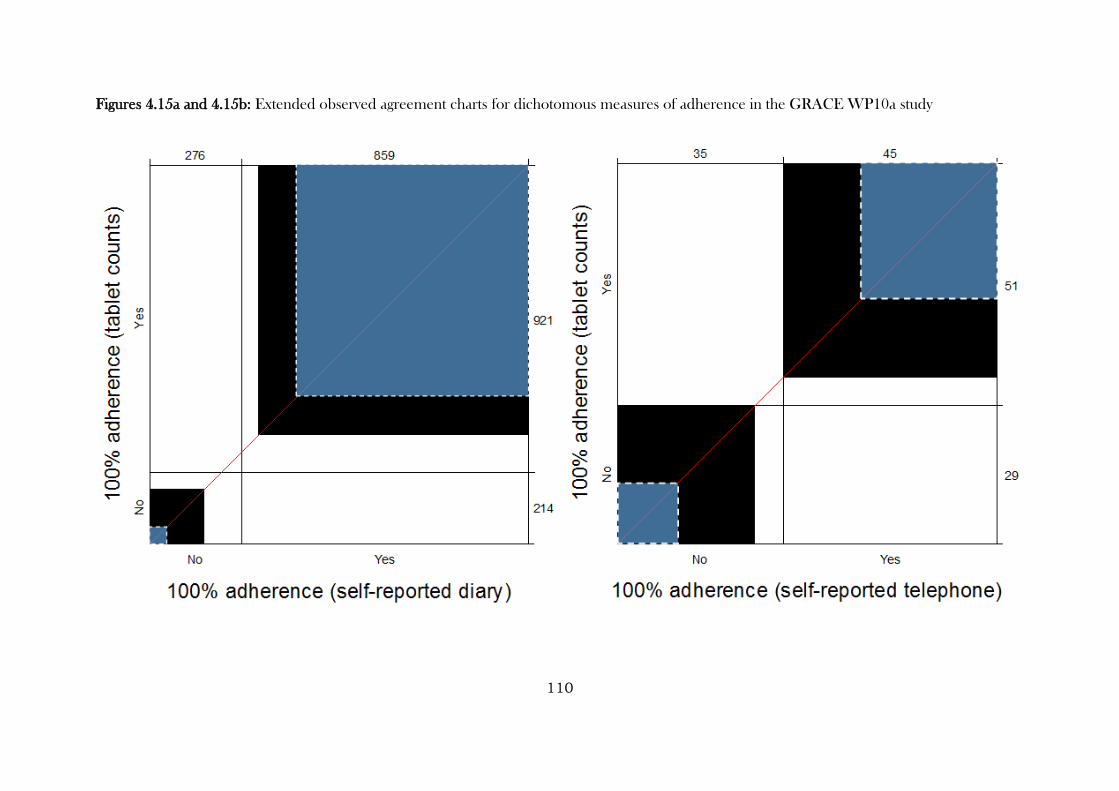
110
Figures 4.15a and 4.15b: Extended observed agreement charts for dichotomous measures of adherence in the GRACE WP10a study
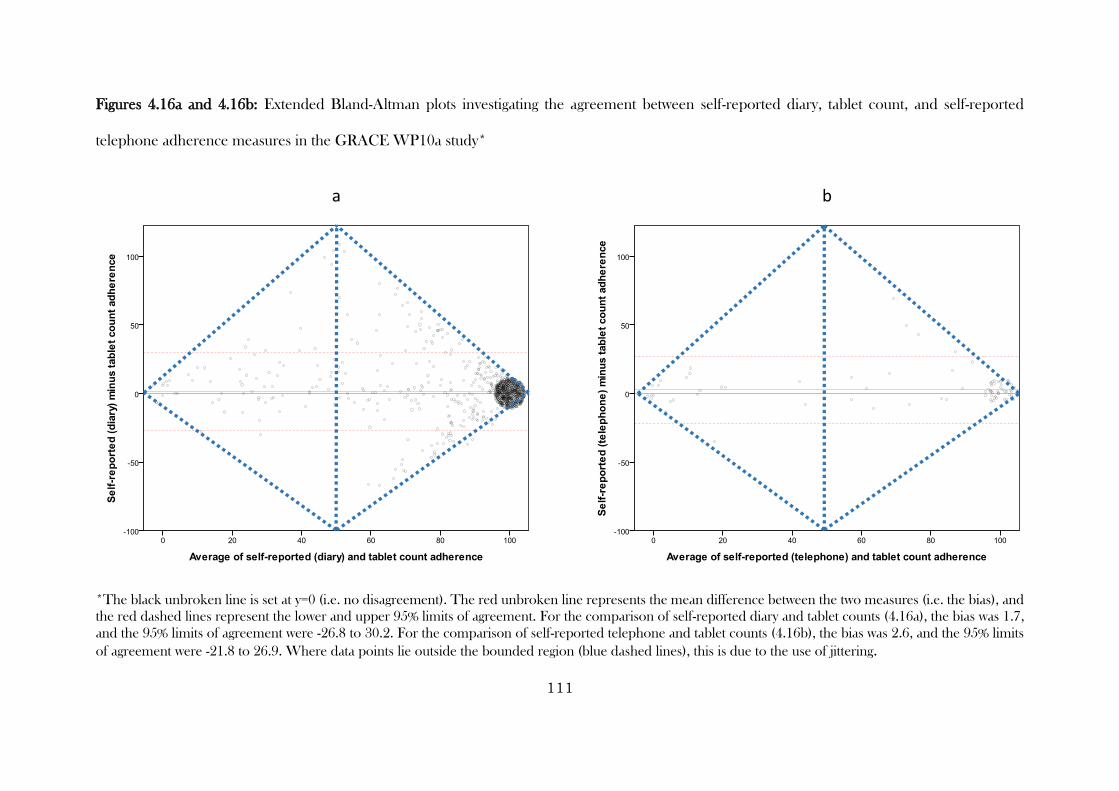
111
Figures 4.16a and 4.16b: Extended Bland-Altman plots investigating the agreement between self-reported diary, tablet count, and self-reported
telephone adherence measures in the GRACE WP10a study*
*The black unbroken line is set at y=0 (i.e. no disagreement). The red unbroken line represents the mean difference between the two measures (i.e. the bias), and
the red dashed lines represent the lower and upper 95% limits of agreement. For the comparison of self-reported diary and tablet counts (4.16a), the bias was 1.7,
and the 95% limits of agreement were -26.8 to 30.2. For the comparison of self-reported telephone and tablet counts (4.16b), the bias was 2.6, and the 95% limits
of agreement were -21.8 to 26.9. Where data points lie outside the bounded region (blue dashed lines), this is due to the use of jittering.
a ba b
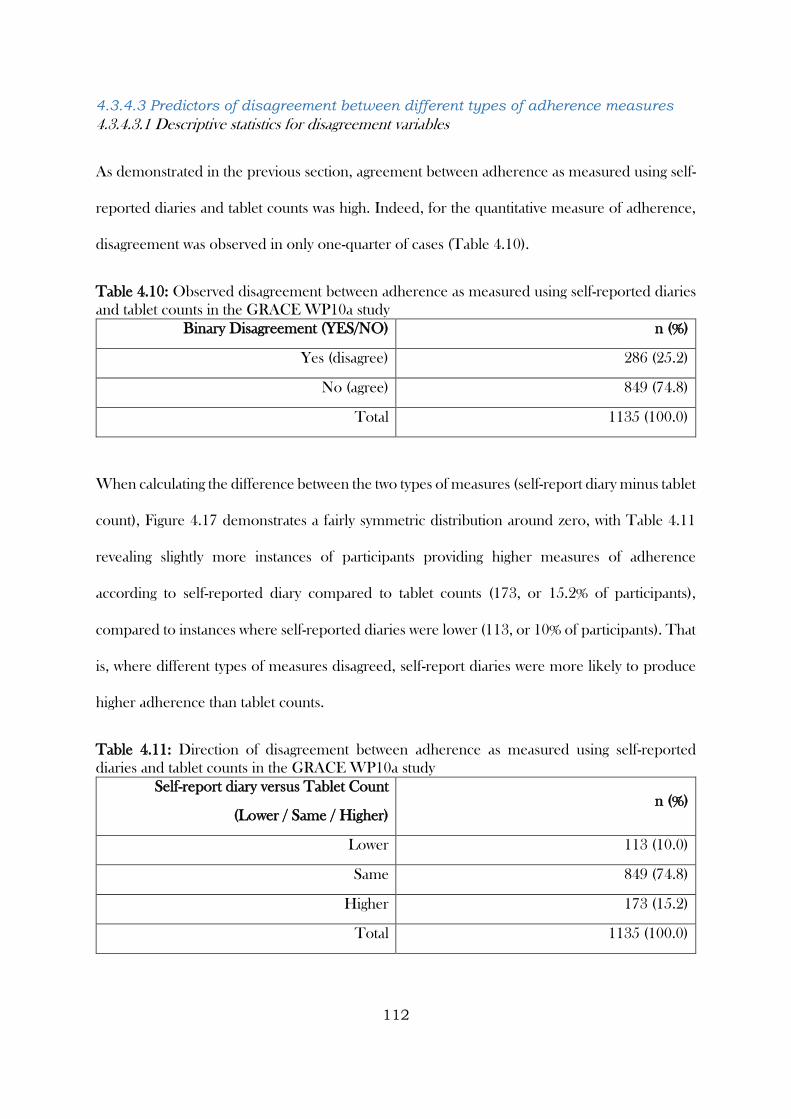
112
4.3.4.3 Predictors of disagreement between different types of adherence measures
4.3.4.3.1 Descriptive statistics for disagreement variables
As demonstrated in the previous section, agreement between adherence as measured using self-
reported diaries and tablet counts was high. Indeed, for the quantitative measure of adherence,
disagreement was observed in only one-quarter of cases (Table 4.10).
Table 4.10: Observed disagreement between adherence as measured using self-reported diaries
and tablet counts in the GRACE WP10a study
Binary Disagreement (YES/NO) n (%)
Yes (disagree) 286 (25.2)
No (agree) 849 (74.8)
Total 1135 (100.0)
When calculating the difference between the two types of measures (self-report diary minus tablet
count), Figure 4.17 demonstrates a fairly symmetric distribution around zero, with Table 4.11
revealing slightly more instances of participants providing higher measures of adherence
according to self-reported diary compared to tablet counts (173, or 15.2% of participants),
compared to instances where self-reported diaries were lower (113, or 10% of participants). That
is, where different types of measures disagreed, self-report diaries were more likely to produce
higher adherence than tablet counts.
Table 4.11: Direction of disagreement between adherence as measured using self-reported
diaries and tablet counts in the GRACE WP10a study
Self-report diary versus Tablet Count
(Lower / Same / Higher) n (%)
Lower 113 (10.0)
Same 849 (74.8)
Higher 173 (15.2)
Total 1135 (100.0)
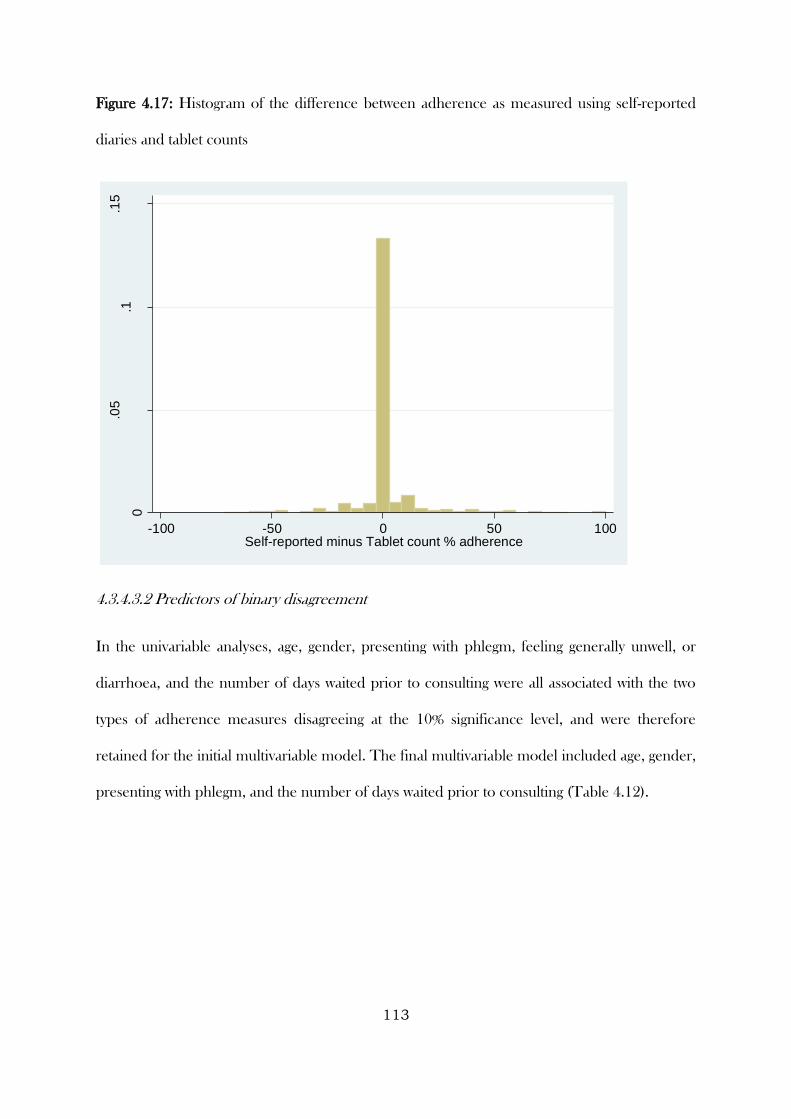
113
Figure 4.17: Histogram of the difference between adherence as measured using self-reported
diaries and tablet counts
4.3.4.3.2 Predictors of binary disagreement
In the univariable analyses, age, gender, presenting with phlegm, feeling generally unwell, or
diarrhoea, and the number of days waited prior to consulting were all associated with the two
types of adherence measures disagreeing at the 10% significance level, and were therefore
retained for the initial multivariable model. The final multivariable model included age, gender,
presenting with phlegm, and the number of days waited prior to consulting (Table 4.12).
0
.05
.1.1
5
Fre
qu
en
cy d
en
sity
-100 -50 0 50 100Self-reported minus Tablet count % adherence
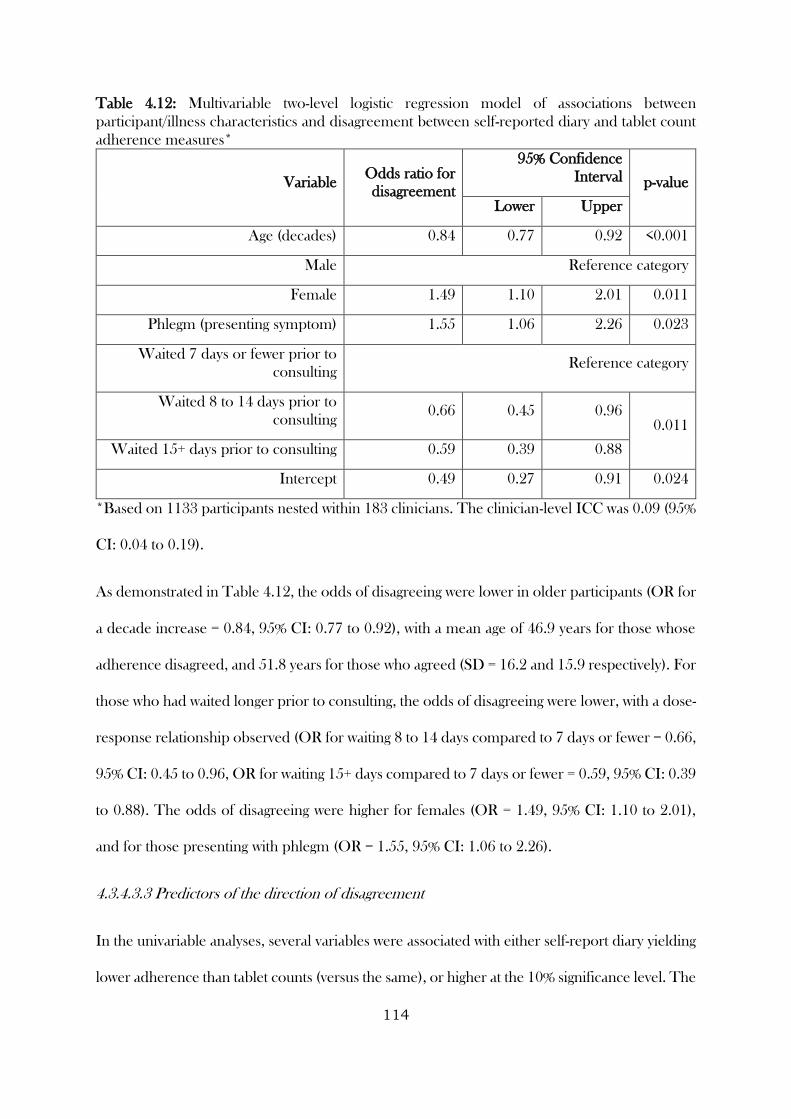
114
Table 4.12: Multivariable two-level logistic regression model of associations between
participant/illness characteristics and disagreement between self-reported diary and tablet count
adherence measures*
Variable Odds ratio for
disagreement
95% Confidence
Interval p-value
Lower Upper
Age (decades) 0.84 0.77 0.92 <0.001
Male Reference category
Female 1.49 1.10 2.01 0.011
Phlegm (presenting symptom) 1.55 1.06 2.26 0.023
Waited 7 days or fewer prior to
consulting Reference category
Waited 8 to 14 days prior to
consulting 0.66 0.45 0.96
0.011
Waited 15+ days prior to consulting 0.59 0.39 0.88
Intercept 0.49 0.27 0.91 0.024
*Based on 1133 participants nested within 183 clinicians. The clinician-level ICC was 0.09 (95%
CI: 0.04 to 0.19).
As demonstrated in Table 4.12, the odds of disagreeing were lower in older participants (OR for
a decade increase = 0.84, 95% CI: 0.77 to 0.92), with a mean age of 46.9 years for those whose
adherence disagreed, and 51.8 years for those who agreed (SD = 16.2 and 15.9 respectively). For
those who had waited longer prior to consulting, the odds of disagreeing were lower, with a dose-
response relationship observed (OR for waiting 8 to 14 days compared to 7 days or fewer = 0.66,
95% CI: 0.45 to 0.96, OR for waiting 15+ days compared to 7 days or fewer = 0.59, 95% CI: 0.39
to 0.88). The odds of disagreeing were higher for females (OR = 1.49, 95% CI: 1.10 to 2.01),
and for those presenting with phlegm (OR = 1.55, 95% CI: 1.06 to 2.26).
4.3.4.3.3 Predictors of the direction of disagreement
In the univariable analyses, several variables were associated with either self-report diary yielding
lower adherence than tablet counts (versus the same), or higher at the 10% significance level. The
115
variables, age, gender, use of chronic medication, smoking status, presenting with phlegm, muscle
aching, feeling generally unwell, confusion / disorientation, or diarrhoea, having an auscultation
abnormality, and the number of days waited prior to consulting were associated for at least one
of the directions. Only age was univariably associated in both directions (Table 4.13).
The final multivariable model included age, gender, presenting with phlegm, diarrhoea,
auscultation abnormality, and number of days waited prior to consulting. An increase in age was
associated with a lower risk of disagreeing in either direction (RRR for lower = 0.85, 95% CI:
0.74 to 0.98, RRR for higher = 0.85, 95% CI: 0.76 to 0.94). The risk of disagreeing in either
direction was higher for participants presenting with phlegm. Being female or presenting with
diarrhoea were associated with a higher risk of having an adherence score lower according to self-
report diary (versus tablet count) compared to it being the same. Having an auscultation
abnormality on presentation was associated with a lower risk of having an adherence score lower
according to self-report diary compared to it being the same. The longer participants waited
before consulting, the lower their risk of having an adherence score higher according to self-
report diary compared to it being the same (Table 4.14).
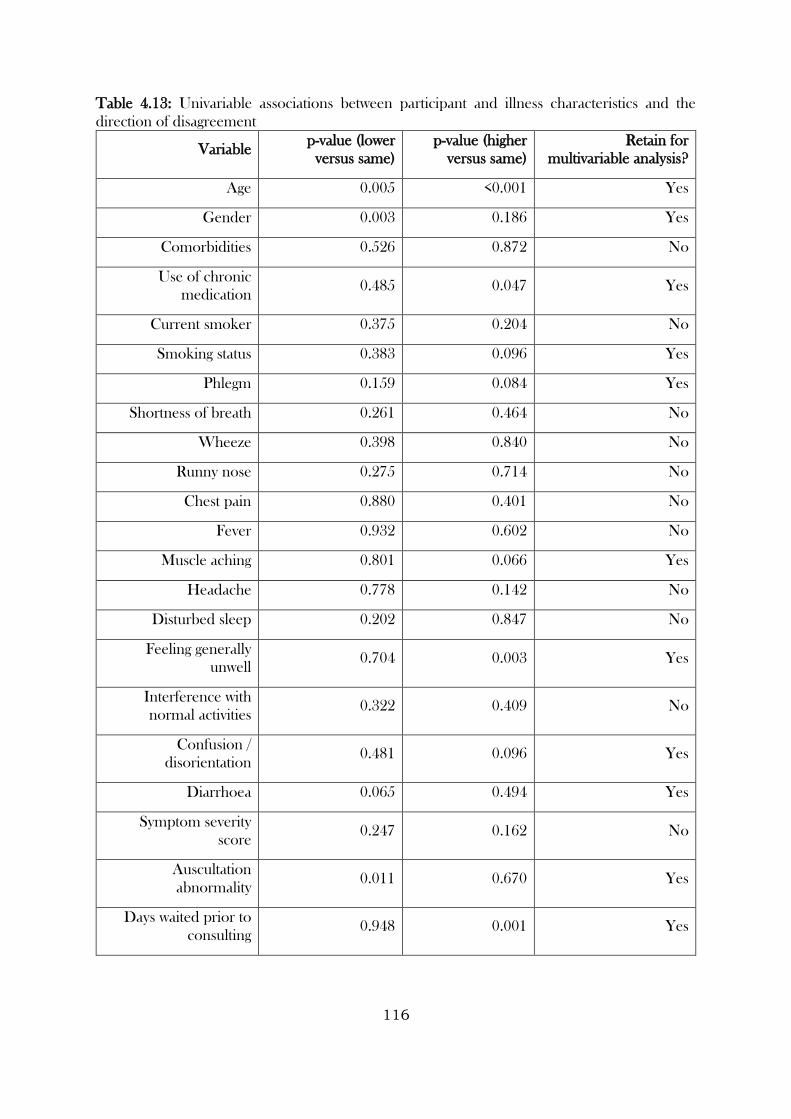
116
Table 4.13: Univariable associations between participant and illness characteristics and the
direction of disagreement
Variable p-value (lower
versus same)
p-value (higher
versus same)
Retain for
multivariable analysis?
Age 0.005 <0.001 Yes
Gender 0.003 0.186 Yes
Comorbidities 0.526 0.872 No
Use of chronic
medication 0.485 0.047 Yes
Current smoker 0.375 0.204 No
Smoking status 0.383 0.096 Yes
Phlegm 0.159 0.084 Yes
Shortness of breath 0.261 0.464 No
Wheeze 0.398 0.840 No
Runny nose 0.275 0.714 No
Chest pain 0.880 0.401 No
Fever 0.932 0.602 No
Muscle aching 0.801 0.066 Yes
Headache 0.778 0.142 No
Disturbed sleep 0.202 0.847 No
Feeling generally
unwell 0.704 0.003 Yes
Interference with
normal activities 0.322 0.409 No
Confusion /
disorientation 0.481 0.096 Yes
Diarrhoea 0.065 0.494 Yes
Symptom severity
score 0.247 0.162 No
Auscultation
abnormality 0.011 0.670 Yes
Days waited prior to
consulting 0.948 0.001 Yes
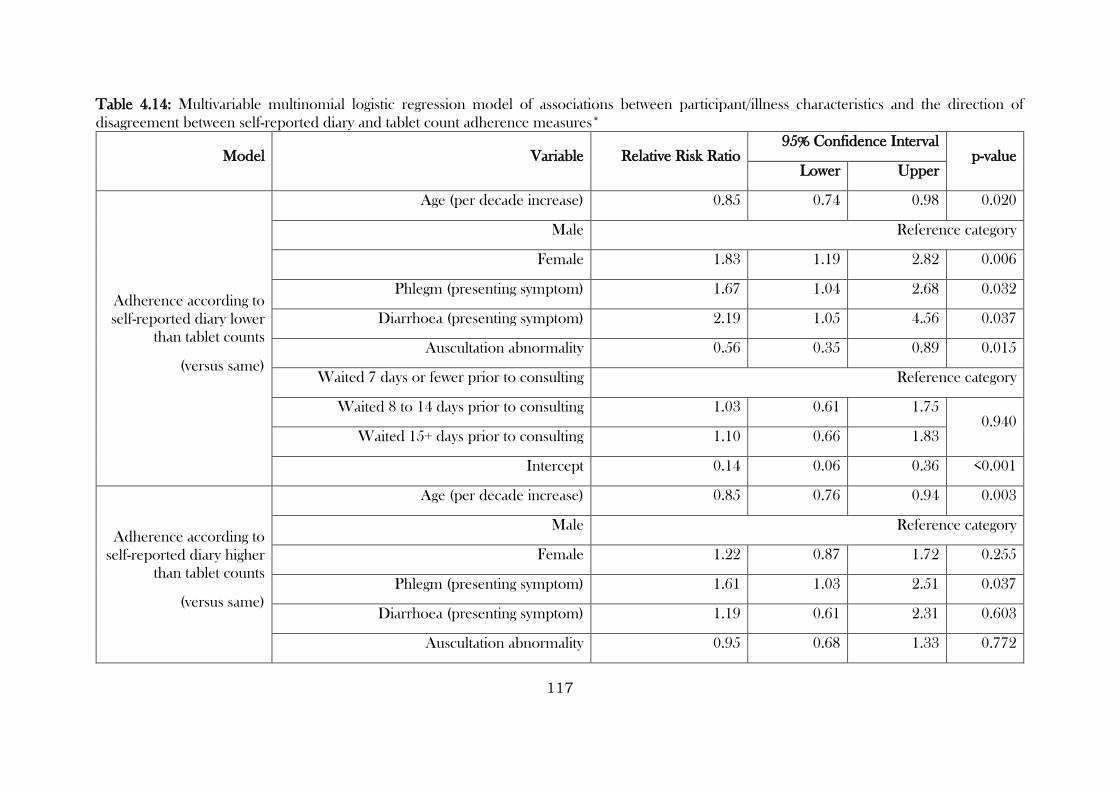
117
Table 4.14: Multivariable multinomial logistic regression model of associations between participant/illness characteristics and the direction of
disagreement between self-reported diary and tablet count adherence measures*
Model Variable Relative Risk Ratio 95% Confidence Interval
p-value Lower Upper
Adherence according to
self-reported diary lower
than tablet counts
(versus same)
Age (per decade increase) 0.85 0.74 0.98 0.020
Male Reference category
Female 1.83 1.19 2.82 0.006
Phlegm (presenting symptom) 1.67 1.04 2.68 0.032
Diarrhoea (presenting symptom) 2.19 1.05 4.56 0.037
Auscultation abnormality 0.56 0.35 0.89 0.015
Waited 7 days or fewer prior to consulting Reference category
Waited 8 to 14 days prior to consulting 1.03 0.61 1.75 0.940
Waited 15+ days prior to consulting 1.10 0.66 1.83
Intercept 0.14 0.06 0.36 <0.001
Adherence according to
self-reported diary higher
than tablet counts
(versus same)
Age (per decade increase) 0.85 0.76 0.94 0.003
Male Reference category
Female 1.22 0.87 1.72 0.255
Phlegm (presenting symptom) 1.61 1.03 2.51 0.037
Diarrhoea (presenting symptom) 1.19 0.61 2.31 0.603
Auscultation abnormality 0.95 0.68 1.33 0.772
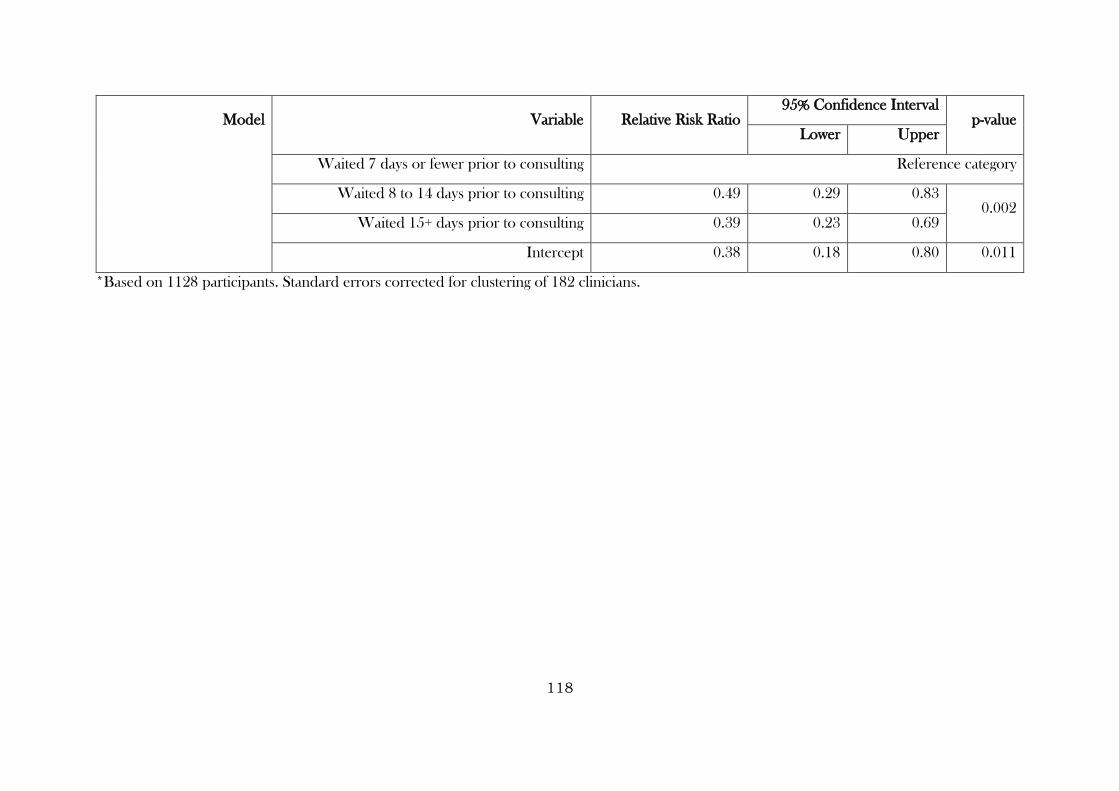
118
Model Variable Relative Risk Ratio 95% Confidence Interval
p-value Lower Upper
Waited 7 days or fewer prior to consulting Reference category
Waited 8 to 14 days prior to consulting 0.49 0.29 0.83 0.002
Waited 15+ days prior to consulting 0.39 0.23 0.69
Intercept 0.38 0.18 0.80 0.011
*Based on 1128 participants. Standard errors corrected for clustering of 182 clinicians.
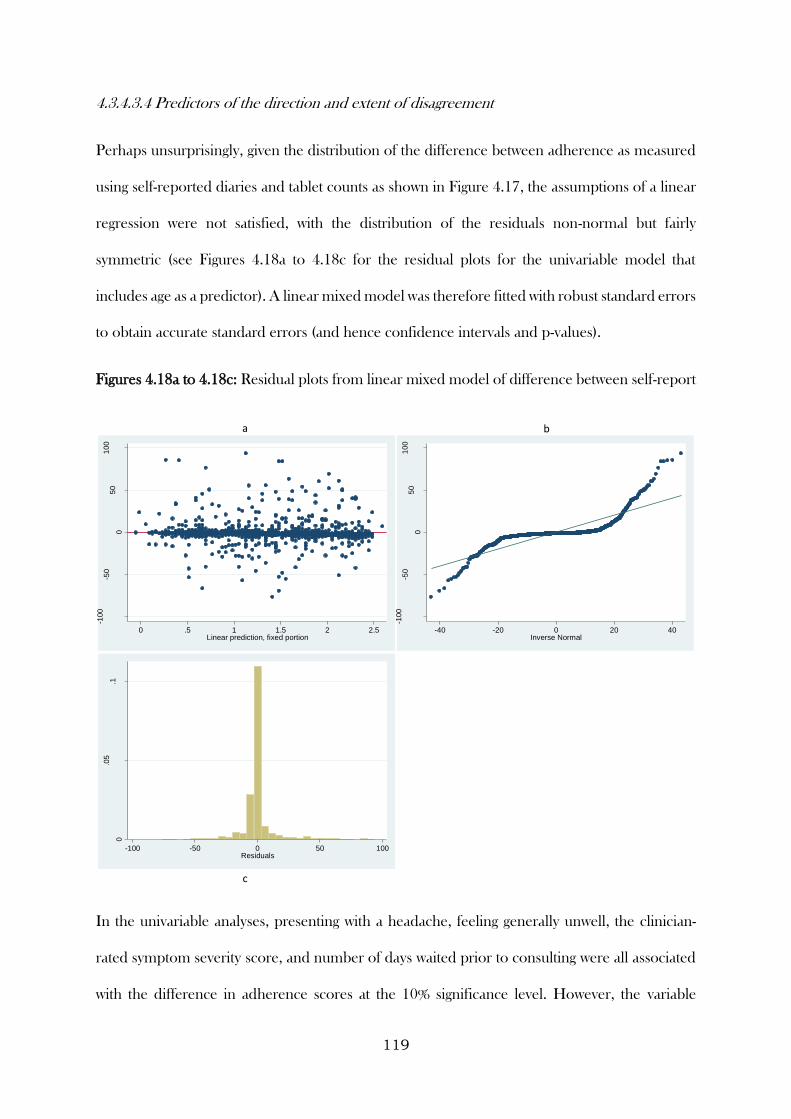
119
4.3.4.3.4 Predictors of the direction and extent of disagreement
Perhaps unsurprisingly, given the distribution of the difference between adherence as measured
using self-reported diaries and tablet counts as shown in Figure 4.17, the assumptions of a linear
regression were not satisfied, with the distribution of the residuals non-normal but fairly
symmetric (see Figures 4.18a to 4.18c for the residual plots for the univariable model that
includes age as a predictor). A linear mixed model was therefore fitted with robust standard errors
to obtain accurate standard errors (and hence confidence intervals and p-values).
Figures 4.18a to 4.18c: Residual plots from linear mixed model of difference between self-report
In the univariable analyses, presenting with a headache, feeling generally unwell, the clinician-
rated symptom severity score, and number of days waited prior to consulting were all associated
with the difference in adherence scores at the 10% significance level. However, the variable
-100
-50
05
01
00
Resid
uals
0 .5 1 1.5 2 2.5Linear prediction, fixed portion
-100
-50
05
01
00
Resid
uals
-40 -20 0 20 40Inverse Normal
0
.05
.1
Den
sity
-100 -50 0 50 100Residuals
a b
c
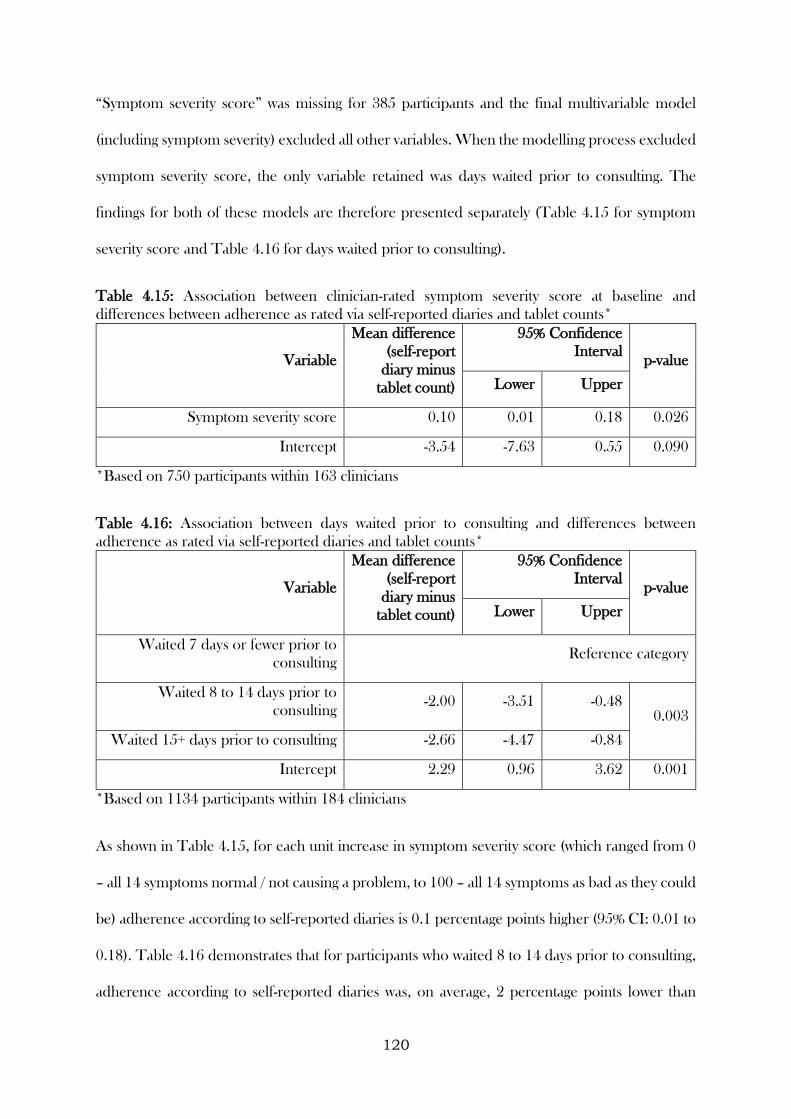
120
“Symptom severity score” was missing for 385 participants and the final multivariable model
(including symptom severity) excluded all other variables. When the modelling process excluded
symptom severity score, the only variable retained was days waited prior to consulting. The
findings for both of these models are therefore presented separately (Table 4.15 for symptom
severity score and Table 4.16 for days waited prior to consulting).
Table 4.15: Association between clinician-rated symptom severity score at baseline and
differences between adherence as rated via self-reported diaries and tablet counts*
Variable
Mean difference
(self-report
diary minus
tablet count)
95% Confidence
Interval p-value
Lower Upper
Symptom severity score 0.10 0.01 0.18 0.026
Intercept -3.54 -7.63 0.55 0.090
*Based on 750 participants within 163 clinicians
Table 4.16: Association between days waited prior to consulting and differences between
adherence as rated via self-reported diaries and tablet counts*
Variable
Mean difference
(self-report
diary minus
tablet count)
95% Confidence
Interval p-value
Lower Upper
Waited 7 days or fewer prior to
consulting Reference category
Waited 8 to 14 days prior to
consulting -2.00 -3.51 -0.48
0.003
Waited 15+ days prior to consulting -2.66 -4.47 -0.84
Intercept 2.29 0.96 3.62 0.001
*Based on 1134 participants within 184 clinicians
As shown in Table 4.15, for each unit increase in symptom severity score (which ranged from 0
– all 14 symptoms normal / not causing a problem, to 100 – all 14 symptoms as bad as they could
be) adherence according to self-reported diaries is 0.1 percentage points higher (95% CI: 0.01 to
0.18). Table 4.16 demonstrates that for participants who waited 8 to 14 days prior to consulting,
adherence according to self-reported diaries was, on average, 2 percentage points lower than
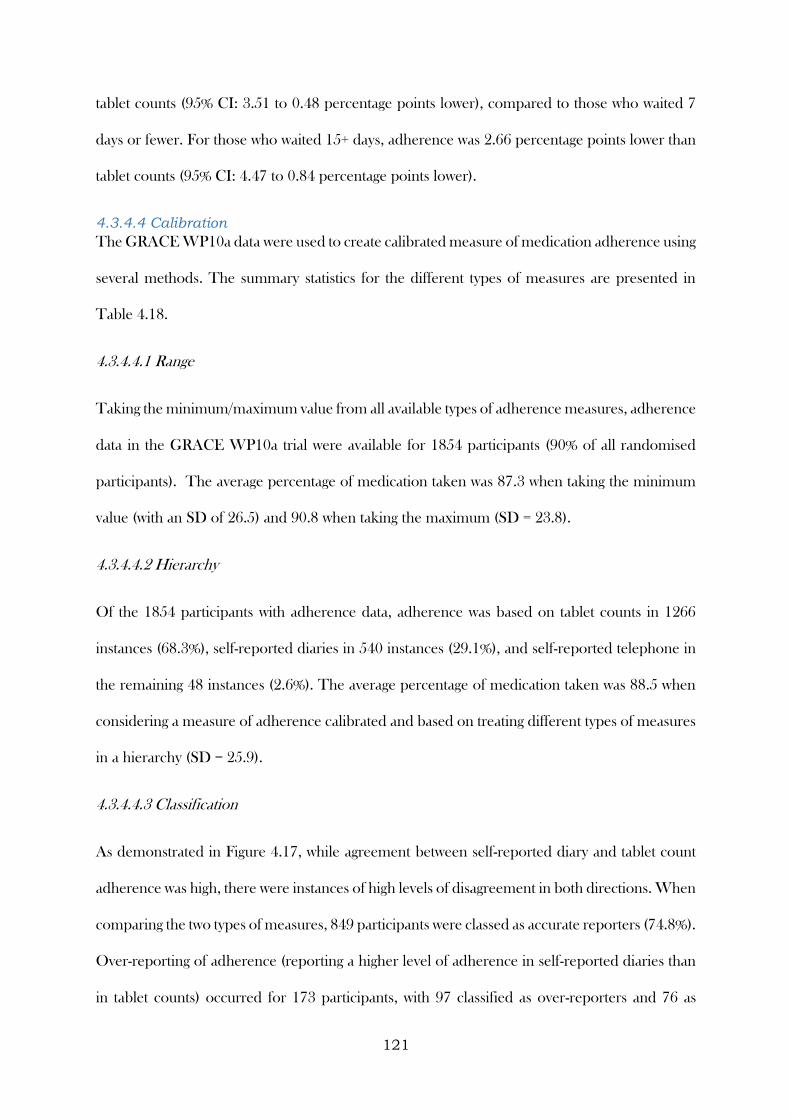
121
tablet counts (95% CI: 3.51 to 0.48 percentage points lower), compared to those who waited 7
days or fewer. For those who waited 15+ days, adherence was 2.66 percentage points lower than
tablet counts (95% CI: 4.47 to 0.84 percentage points lower).
4.3.4.4 Calibration
The GRACE WP10a data were used to create calibrated measure of medication adherence using
several methods. The summary statistics for the different types of measures are presented in
Table 4.18.
4.3.4.4.1 Range
Taking the minimum/maximum value from all available types of adherence measures, adherence
data in the GRACE WP10a trial were available for 1854 participants (90% of all randomised
participants). The average percentage of medication taken was 87.3 when taking the minimum
value (with an SD of 26.5) and 90.8 when taking the maximum (SD = 23.8).
4.3.4.4.2 Hierarchy
Of the 1854 participants with adherence data, adherence was based on tablet counts in 1266
instances (68.3%), self-reported diaries in 540 instances (29.1%), and self-reported telephone in
the remaining 48 instances (2.6%). The average percentage of medication taken was 88.5 when
considering a measure of adherence calibrated and based on treating different types of measures
in a hierarchy (SD = 25.9).
4.3.4.4.3 Classification
As demonstrated in Figure 4.17, while agreement between self-reported diary and tablet count
adherence was high, there were instances of high levels of disagreement in both directions. When
comparing the two types of measures, 849 participants were classed as accurate reporters (74.8%).
Over-reporting of adherence (reporting a higher level of adherence in self-reported diaries than
in tablet counts) occurred for 173 participants, with 97 classified as over-reporters and 76 as
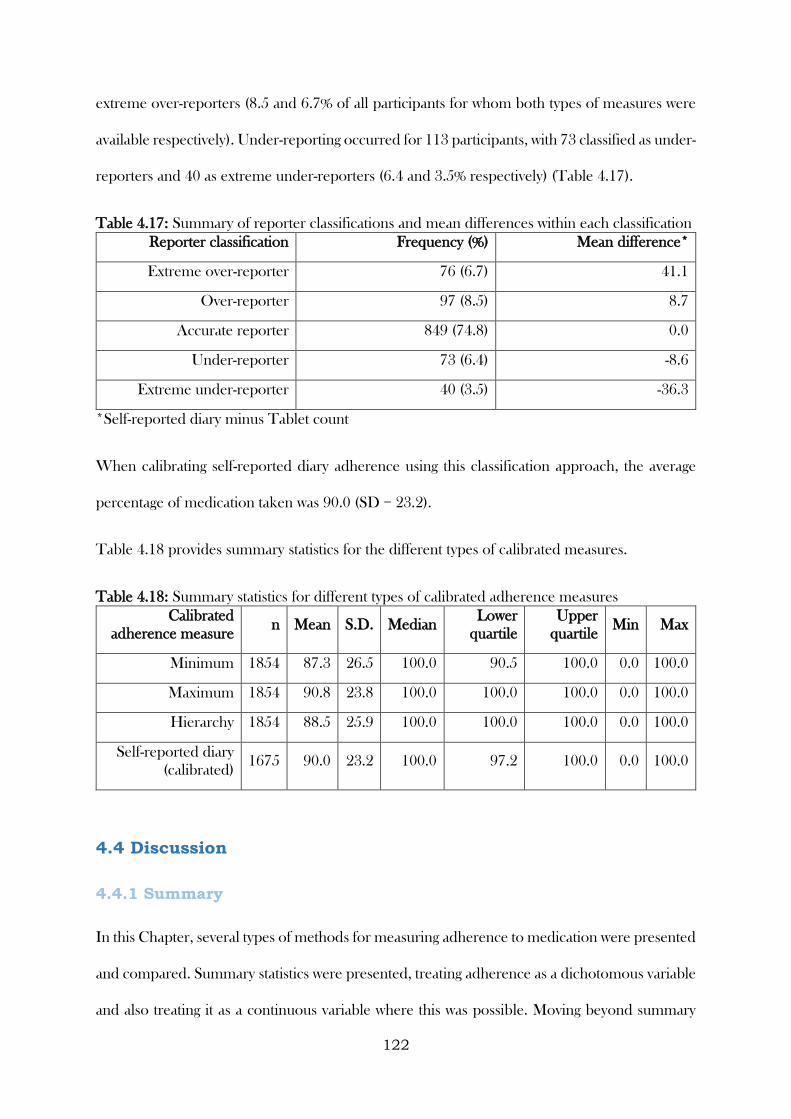
122
extreme over-reporters (8.5 and 6.7% of all participants for whom both types of measures were
available respectively). Under-reporting occurred for 113 participants, with 73 classified as under-
reporters and 40 as extreme under-reporters (6.4 and 3.5% respectively) (Table 4.17).
Table 4.17: Summary of reporter classifications and mean differences within each classification
Reporter classification Frequency (%) Mean difference*
Extreme over-reporter 76 (6.7) 41.1
Over-reporter 97 (8.5) 8.7
Accurate reporter 849 (74.8) 0.0
Under-reporter 73 (6.4) -8.6
Extreme under-reporter 40 (3.5) -36.3
*Self-reported diary minus Tablet count
When calibrating self-reported diary adherence using this classification approach, the average
percentage of medication taken was 90.0 (SD = 23.2).
Table 4.18 provides summary statistics for the different types of calibrated measures.
Table 4.18: Summary statistics for different types of calibrated adherence measures
Calibrated
adherence measure n Mean S.D. Median
Lower
quartile
Upper
quartile Min Max
Minimum 1854 87.3 26.5 100.0 90.5 100.0 0.0 100.0
Maximum 1854 90.8 23.8 100.0 100.0 100.0 0.0 100.0
Hierarchy 1854 88.5 25.9 100.0 100.0 100.0 0.0 100.0
Self-reported diary
(calibrated) 1675 90.0 23.2 100.0 97.2 100.0 0.0 100.0
4.4 Discussion
4.4.1 Summary
In this Chapter, several types of methods for measuring adherence to medication were presented
and compared. Summary statistics were presented, treating adherence as a dichotomous variable
and also treating it as a continuous variable where this was possible. Moving beyond summary
123
measures, electronic monitoring data were used to model adherence patterns over time,
considering the clustered nature of daily adherence measures within individuals, non-linear time
effects, the testing of behavioural hypotheses, and visual means by which the findings can be
presented. Several methods for comparing different types of measures were presented, including
frequently-used correlational methods and infrequently-used agreement methods (see Chapter
2). For the latter, I proposed extensions to observed agreement plots and Bland Altman limits
of agreement, which were utilised as a way of reporting agreement based on dichotomous and
continuous measures of adherence respectively. The final part of the Chapter presented various
methods for investigating predictors of disagreement, and several methods for calibrating
adherence measures. Disagreement was considered as a dichotomous variable (disagreed /
agreed), and the direction and extent of disagreement was also considered, with suitable statistical
models suggested for each. Several methods for arriving at an adherence measure that takes into
account numerous types of (occasionally discrepant) measures were presented, with some
methods requiring fewer assumptions than others.
4.4.2 Learning points
1. Summary measures of medication adherence provide useful information about the
sample from which data were collected. Continuous summary measures should be
reported, where possible, as these can give a better indication of the distribution of the
data (e.g. the average and variability) than can be provided by dichotomous summary
measures. However, dichotomous or categorical measures presented alongside can
provide complementary information, particularly if the categories have some clinically
important meaning. For example, in the CODA study the average percentage of tablets
consumed was 92.7, while only 11.6% of participants consumed 100% (or more) of their
prescribed medication.
124
2. When comparing measures in the CODA (long-term medication for a chronic condition)
and GRACE (short-term medication for an acute condition) studies, self-report and tablet
count agreement was considerably higher in the latter. This could be related to the
duration of monitoring in the CODA study, the fact that self-report data was only
obtained retrospectively during clinic visits (GRACE had both prospective self-report via
diaries and retrospective via telephone calls), and that clinic visits were often far apart
(increasing the likelihood of recall bias).
3. Measuring adherence to medication electronically allows data to be captured at each
dosing event in a passive manner (i.e. participants do not have to physically record the
event, the device records it automatically). Capturing data so frequently, particularly over
a long time period, provides the opportunity to explore patterns in adherence over time
and enable detailed insights into patient behaviour to be gained. Mixed models are a
suitable tool for the statistical analysis of these data, as they can provide estimates about
the evolution of adherence over time, while accounting for the correlated nature of events
within individuals. In the CODA study, mixed models were used to demonstrate that
adherence to mesalazine declined over time, was more variable for participants allocated
to take medication in divided doses, was better on weekdays than at weekends, and was
better around clinic visit dates than non-clinic visit dates.
4. When comparing different types of measures, correlation can provide an indication of
the strength of association between different types of measures. However, it is usually
agreement that should be the main parameter of focus. Where adherence is only
measured in a dichotomous or categorical manner, observed agreement plots provide a
visual means of representing the extent of agreement between two types of measure.
Extending these by also including the agreement expected by chance enhanced the
amount of information that could be obtained from these plots. Bland Altman plots and
125
limits of agreement provide a greater level of detail regarding the extent of agreement and
direction of disagreement between different types of measures. For example, in the
CODA study, while high positive correlation was observed between tablet count and
electronic monitoring, the Bland-Altman plot and limits of agreement suggested that this
association may belie a lack of agreement, particularly for participants allocated to take
their medication in divided doses. The plots were enhanced by overlaying them with the
boundaries within which data points can lie. These provided a more accurate
representation of the boundaries in which data can lie than that suggested by the limits of
agreement.
5. Several statistical models can be used to investigate which patient and illness
characteristics predict disagreement between different types of adherence measures. If
the focus is purely on whether there is disagreement (regardless of direction or extent), a
multivariable binary logistic regression model can be fitted. If the direction is also of
interest, a multivariable multinomial logistic regression model can be fitted. If direction
and extent are both of interest, a multivariable linear regression model can be fitted. Each
of these approaches provides increasingly detailed insights into variables that are
associated with disagreement, and these can be used to inform the selection of
appropriate type/s medication adherence measures. For example, in the GRACE
WP10a study, older patients were less likely to have adherence measured using self-
reported diary and tablet count data that disagreed. This may indicate that an age-
stratified approach to measuring adherence to medication (i.e. tailoring the type of
measure, or whether multiple types are used, is dependent on the age of a participant)
may prove useful in subsequent research.
6. Calibration techniques provide a means of moving beyond merely reporting the
comparison of different types of measures, and onto an approach to using a more reliable
126
measure of adherence (relative to reliance on a single type of measure), taking into
account multiple data sources. The approaches presented in this Chapter are
straightforward to implement, easy to communicate, and require relatively minimal
assumptions. In the GRACE WP10a study, range calibration was used to maximise the
amount of adherence data available and provide bounds on the level of medication
adherence during the study. Hierarchy calibration was used to similarly maximise the
amount of data available, but then created an agreed measure by making assumptions
about the reliability of different types of measures. Calibration by classification was then
used specifically to calibrate self-reported diary data using tablet count data. While these
different calibration techniques did not result in the mean adherence differing by a large
amount (the mean adherence was as low as 87.3 when based on the minimum value of
all available measures and was as high as 90.8 when the maximum was used), the
recommended approach will depend on the purpose of your calibration. If the purpose
is to use all available data and provide bounds on the extent that participants adhered to
treatment (for example, in sensitivity analysis), the range approach is most suitable.
However, if more formal calibration is required, whereby assumptions are required about
the reliability of different sources of adherence data, a hierarchy or classification
approach may be more suitable.
127
CHAPTER 5: Determinants of Non-adherence to
Medication: A Comparison among Different Clinical
Conditions and Study Designs
5.1 Introduction
As described in earlier Chapters, non-adherence to medication can have severe consequences at
both an individual and societal level. There exists a plethora of research investigating the
effectiveness of interventions to improve adherence to medication, (Nieuwlaat et al., 2014)
though only a minority of studies have reported on interventions that successfully improve both
adherence and clinical outcomes, the latter arguably being the main goal in research of this kind.
Interventions with this aim are likely to be most effective if they are informed by theory and
developed gradually (for example, using a framework such as that proposed for the development
of complex interventions (Craig, 2008)), and one of the first steps in this process involves
developing an understanding of the determinants of adherence/non-adherence itself.
The aims of this Chapter are to investigate the determinants of non-adherence to medication and
to explore several methodological considerations when investigating these determinants. The
methodological aspects considered in this Chapter are:
How determinants differ depending on type of measure
How they differ across different clinical conditions (short-term acute conditions versus
long-term conditions)
How they differ depending on the study design (observational studies versus trials)
How different domains of adherence can be appropriately modelled
The value of modelling adherence as distinct processes rather than as a single variable
To meet these aims, this Chapter will draw on data from all studies described in Chapter 3.
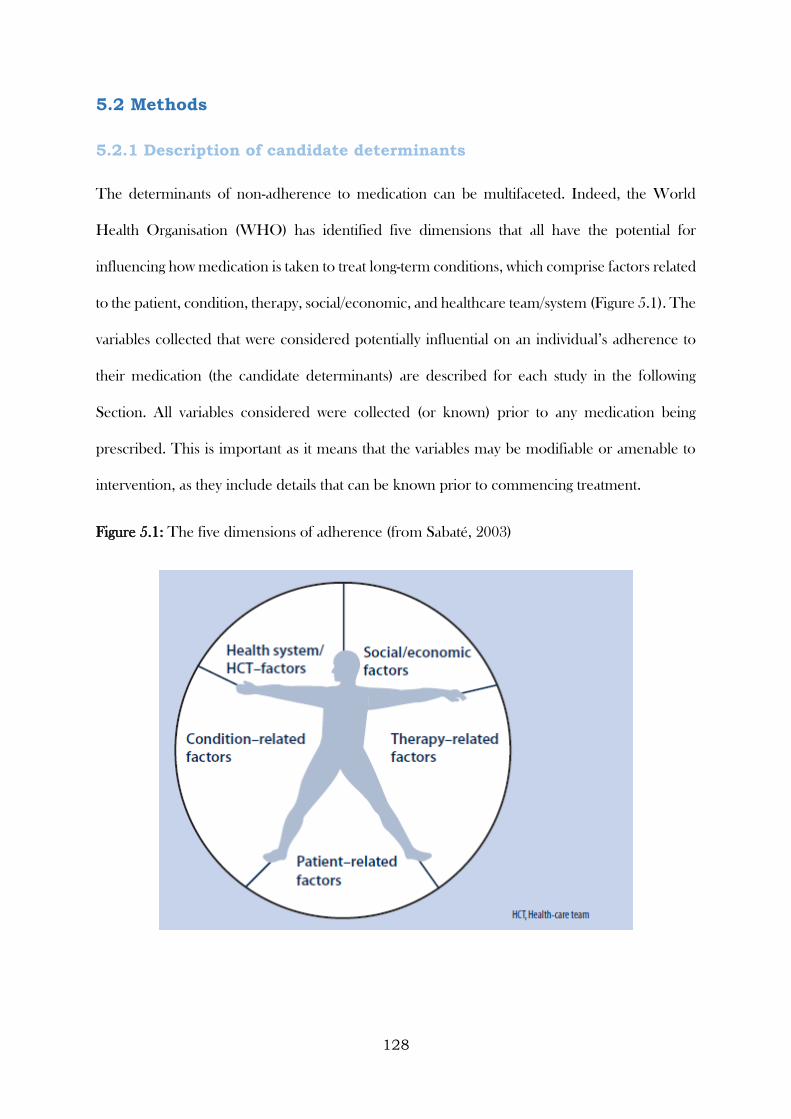
128
5.2 Methods
5.2.1 Description of candidate determinants
The determinants of non-adherence to medication can be multifaceted. Indeed, the World
Health Organisation (WHO) has identified five dimensions that all have the potential for
influencing how medication is taken to treat long-term conditions, which comprise factors related
to the patient, condition, therapy, social/economic, and healthcare team/system (Figure 5.1). The
variables collected that were considered potentially influential on an individual’s adherence to
their medication (the candidate determinants) are described for each study in the following
Section. All variables considered were collected (or known) prior to any medication being
prescribed. This is important as it means that the variables may be modifiable or amenable to
intervention, as they include details that can be known prior to commencing treatment.
Figure 5.1: The five dimensions of adherence (from Sabaté, 2003)
129
5.2.1.1 CODA
The candidate baseline determinants used in the CODA study included patient-related factors
(age study entry (<65, ≥65), age at diagnosis (≤25, 26-45, 46-64, ≥65), gender, and smoking status
(never smoker, current smoker, ex-smoker)), condition-related factors (length of remission (<12
months, ≥12 months), calprotectin concentration at study entry (<60mg/kg stool, ≥60 mg/kg
stool), maximum documented extent of colitis (extensive, left-sided or sigmoid, proctitis), disease
duration (≤10 years, 11 to 20 years, >20years), and endoscopy findings at study entry (normal,
not normal)), a therapy-related factor (allocated regimen (once daily/three times daily)), and a
social/economic factor (employment status (unemployed, employed)). No healthcare team or
healthcare system factors were collected.
5.2.1.2 ZICE
The ZICE study included determinants related to patients (age at study entry, gender, Body Mass
Index (BMI) at study entry), the condition (the modified Brief Pain Inventory severity score at
study entry, Quality of Life (EORTC QLQ-C30 score version 3.0) at study entry, SRE within the
previous three months), and therapy (previous use of bisphosphonates, treatments being received
at study entry (including painkilling drugs, chemotherapy, hormone therapy, and trastuzumab),
allocated treatment (oral ibandronic acid or intravenous zoledronic acid)). No social/economic,
healthcare team, or healthcare system factors were collected.
5.2.1.3 GRACE
Participants in the GRACE studies had a substantial amount of data collected about them prior
to receiving an allocation to or prescription of antibiotic treatment.
Patient-related determinants included age at study entry, gender, and whether the participant had
a co-morbidity (at least one of the following: Chronic Obstructive Pulmonary Disease (COPD),
asthma, other lung disease, heart failure, ischemic heart disease, other heart disease, or diabetes).
Condition-related determinants included presenting symptoms (cough, phlegm, shortness of
breath, wheeze, coryza, fever, chest pain, muscle aching, headache, disturbed sleep, feeling

130
generally unwell, interference with normal activities, confusion/disorientation, and diarrhoea),
clinician-rated symptom severity score (a summation of the severity of the 14 symptoms
previously described scaled to range from 0 to 100, where 100 represented the maximum severity
on all 14 symptoms and 0 represented no problems on any of the 14 symptoms), phlegm colour
(categorised as no phlegm, normal coloured phlegm (white or clear), and discoloured phlegm
(yellow, green, or bloodstained)), whether an abnormality was found when performing an
auscultation examination (at least one of the following: diminished vesicular breathing, wheeze,
crackles, or rhonchi), and the number of days of symptoms prior to consulting (categorised as
seven days or less, eight to 14 days, or 15 days or more).
Therapy-related determinants included the dose (categorised as less than 500mg, 500mg,
between 500 and 1000mg (not inclusive), and 1000mg or more), frequency (categorised as twice
a day or more than twice a day), and duration (categorised as five days or less, six to seven days,
or eight or more days) of the amoxicillin prescription. For the participants in the trial, this was
fixed, as all participants were prescribed 1000mg of amoxicillin, three times a day for seven days.
While there were no specific healthcare professional-related determinants available consistently
across all three datasets, responsible clinician identifiers were available and could be used to
determine whether variation in adherence could be attributed to the influence of individual
clinicians.
Participants were recruited from several European countries (Belgium, England, Finland,
France, Germany, Hungary, Italy, Norway, Poland, Slovakia, Slovenia, Spain, Sweden, The
Netherlands, and Wales), and healthcare setting-related determinants were established from
work carried out as part of the GRACE project (GRACE website. Available from:
http://www.grace-lrti.org/portal/en-gb/), and subsequent surveys among clinicians from countries
that were not represented in this work (France and Slovenia). These included whether single-
handed (i.e. one clinician running an entire practice) practices were common (i.e. representing
131
at least a quarter of all practices), whether there had been public campaigns related to antibiotic
use at the time the study was conducted, whether patients had to pay to see a general practitioner,
whether clinicians were required to certify sickness for less than seven days of absence from work,
whether amoxicillin was the first-line choice of antibiotic for a respiratory infection in primary
care, and the country-level antibiotic prescribing rate. The prescribing rate was obtained from
the European Surveillance of Antimicrobial Consumption Network (ESAC) antimicrobial
consumption interactive database (ESAC-Net. Available from: http://tinyurl.com/zh233d3),
defined as the Defined Daily Dose (DDD) per 1000 inhabitants per day, averaged across the
years 2007 to 2010.
The figure below illustrates the candidate determinants available across the different domains
and studies. Note the lack of social / economic factors available. While these factors were clearly
not measured in as much detail as other factors were (e.g. those related to the patient or
condition) in the studies considered throughout this thesis, some of the social / economic factors
reported as being found to be associated with adherence in the WHO report by Sabaté (e.g.
illiteracy, low level of education, unstable living conditions) may have also been key influencers
for people not taking part in research (potentially an indicator of sampling bias). What is also
lacking from all studies, which may have provided useful insight into how patients take their
medication, are questions related to the patient’s personality and beliefs about their condition
and treatment. (Horne et al., 2013) As highlighted during Chapter 2, these behavioural influences
(a patient-related factor) have been demonstrated to be predictive of adherence to medication.
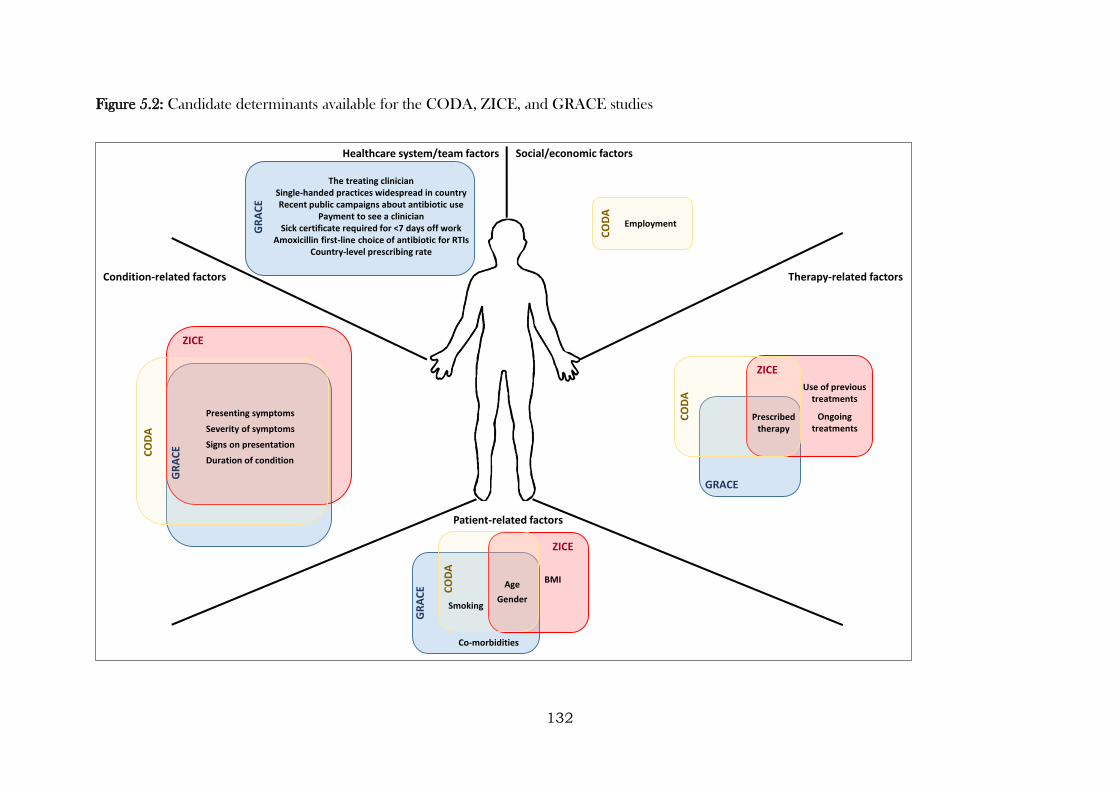
132
Figure 5.2: Candidate determinants available for the CODA, ZICE, and GRACE studies
Social/economic factors
Patient-related factors
Therapy-related factorsCondition-related factors
Healthcare system/team factors
Age
GenderSmoking
BMI
Co-morbidities
Employment
The treating clinicianSingle-handed practices widespread in countryRecent public campaigns about antibiotic use
Payment to see a clinicianSick certificate required for <7 days off work
Amoxicillin first-line choice of antibiotic for RTIsCountry-level prescribing rate
Presenting symptoms
Severity of symptoms
Duration of condition
Signs on presentation
Ongoing treatments
Prescribedtherapy
Use of previous treatments
GR
AC
E
CO
DA
CO
DA
GR
AC
E
ZICE
CO
DA
ZICE
GRACE
ZICE
CO
DA
GR
AC
E
133
5.2.2 Definitions of adherence
5.2.2.1 Determinants of adherence depending on type of measure used
As described in Chapter 4, adherence was captured in the CODA study through self-reports,
tablet counts, and electronic monitoring. In this Chapter, the determinants of adherence to
treatment in the CODA study will be assessed and compared across all three types of measure
in order to investigate the sensitivity of these (specifically, the ability to detect groups who adhered
better/worse).
5.2.2.1.1 Self-report
At the end of the study, participants were asked “whether or not they had taken their study tablets
as prescribed (e.g. at least 90% of the time)”, hence participants were defined as having adhered
to their treatment if they gave a response of “yes” and not adhered if “no”.
5.2.2.1.2 Tablet counts
Research nurses counted the number of tablets returned at each study visit, and deducting this
from the number of tablets issued determined the number consumed during the study period.
Adherence to study medication in the original trial was defined as participants consuming at least
75% of their issued medication, and due to the skewed nature of the responses, this definition
will also be used in this Chapter.
5.2.2.1.3 Electronic monitoring
The date and time of bottle cap openings were electronically recorded using the MEMS, with
data uploaded onto the study database at each trial follow-up visit. Adherence was reported as
the percentage of days that a participant adhered to their allocated regimen. Due to the skewed
nature of responses, this measure also had to be dichotomised, with a 75% threshold chosen in
order to be consistent with the tablet count threshold.
134
5.2.2.2 Adherence as a single variable or as distinct processes
Adherence may be defined as “the process by which patients take their medicine as prescribed.
Traditionally, this has been represented quantitatively as a single variable (e.g. percentage of
medicine taken as prescribed, a binary variable of taken as prescribed / not, etc.). However,
recent work in this field encourages the use of the distinct processes involved in taking medicine;
namely, initiation (the taking of the first dose), implementation (the extent to which a patient’s
actual dosing corresponds to the prescribed dosing regimen, from initiation until the last dose),
and persistence or time to discontinuation (length of time between initiation and the last dose).
(Vrijens et al., 2012) Each individual process may have its own determinants and influences on
outcomes. Therefore, different interventions may be required to address each of the adherence
processes. For the ZICE and GRACE studies, the benefits of modelling the determinants of
adherence as a single variable and as distinct processes will be considered. ZICE and GRACE
were considered to provide a comparison between long and short-term conditions. CODA was
not considered in this section as all participants initiated treatment.
5.2.2.2.1 ZICE
Questions about adherence to study medication were asked at three initial interim visits, and then
subsequently at 12-weekly visits.
Missing visit patterns were inspected, with the view to calculate adherence levels only in those
with complete visit data up until the point of an event, withdrawal, death, or the end of the first
12 months.
For participants allocated to intravenous zoledronic acid, adherence was based on interim and
12-weekly visit data, as participants were required to attend to receive intravenous medication. It
was assumed that participants did not adhere to study medication if they either did not attend a
scheduled visit, or attended but were noted as not receiving study medication as prescribed
during at least one visit. Participants in the oral ibandronic acid arm were also invited to attend
135
interim visits to minimise the likelihood that an increase in clinical contact in one arm could
impact on trial findings. However, as it was not necessary for participants in this arm to attend
visits to receive medication, and non-attendance at one or more interim visit was high, adherence
to oral ibandronic acid was based on 12-weekly visit data only. It was assumed that participants
did not adhere to study medication if they were noted as not receiving study medication as
prescribed during at least one visit.
5.2.2.2.1.1 Combined summary measure
A single combined summary measure was created that indicated whether or not a participant
took their treatment as prescribed. Based on the approach described above, a participant was
considered to have adhered to their treatment if that had reported that they had taken their
allocated treatment as prescribed when asked at valid clinic visits. This excludes visits that were
not mandatory to attend, such as the interim visits for participants allocated to the oral ibandronic
acid treatment, and visits where data were censored due to withdrawal.
5.2.2.2.1.2 Initiation
Participants were considered as having initiated their treatment if they reported, on at least one
occasion/clinic visit, that they had taken their treatment.
5.2.2.2.1.3 Implementation
In those who reported initiating their treatment, participants were considered to have fully
implemented their treatment if that had reported that they had taken their allocated treatment as
prescribed when asked at all valid clinic visits.
5.2.2.2.1.4 Discontinuation
While I considered time from initiation to discontinuation for ZICE, I ultimately concluded it
inappropriate to define with the type of measure used to capture adherence in this study.
136
Adherence relied on reports at clinic visits, but the interim visits (when treatment generally
initiated) were not mandatory for one of the treatment arms (and these participants generally did
not attend interim visits). I therefore considered it inappropriate to define time to discontinuation
for this treatment group, and determinants of discontinuation will thus not be explored for this
study.
5.2.2.2.2 GRACE
5.2.2.2.2.1 Combined summary measure
Using participant-completed diaries, a single summary measure was calculated, that indicated
whether or not a participant took the full amount of medication they were prescribed (Yes/No).
5.2.2.2.2.2 Initiation
Participants were defined as having initiated their amoxicillin if they indicated in their diary that
they took amoxicillin at least once during the 28 day follow-up period.
5.2.2.2.2.3 Implementation
In participants who initiated their amoxicillin, implementation describes the extent to which the
prescription was taken as prescribed. As the focus was on amoxicillin prescribed for immediate
use, for the purpose of this Chapter, it is defined as the proportion of amoxicillin reportedly
taken during the prescribed period. For example, if a participant was prescribed amoxicillin for
five days and only reported taking it for four days during the first five days of the follow-up period,
their implementation score would be 0.8 (i.e. they initiated their amoxicillin course and took
80% of it during the prescribing period). A participant was considered to have fully implemented
their amoxicillin if they reported taking it for the number of days it was prescribed for during the
prescribing period.
137
5.2.2.2.2.4 Discontinuation
Participants were defined as having discontinued their amoxicillin prescription if they initiated
their prescription and subsequently reported a full week of not taking their medicine. A gap of
one week was deemed appropriate in distinguishing between patients who stopped and restarted
their medicine, and those who were prescribed a new course of amoxicillin. The first day of that
one-week gap was defined as the day they discontinued, and the time to discontinuation was
calculated as the difference in days between the day of discontinuation and the day of initiation.
For example, if a participant was prescribed a seven day course of amoxicillin for immediate use,
initiated their amoxicillin on day three, and days 10 to 17 were the first full week where no
amoxicillin was reportedly taken, they would be defined as having discontinued on day 10, and
their time from initiation to discontinuation would be seven days (however, their implementation
score would be 0.7, or 5/7).
5.2.3 Modelling
Logistic regression models of the odds of adhering to, initiating, and implementing treatment
were presented as odds ratios, 95% confidence intervals, and p-values. Cox proportional hazards
models of the time from initiation to discontinuation of treatment were presented as hazard
ratios, 95% confidence intervals, and p-values. (Cox, 1972) Variables were entered into a
univariable model and retained if they were significant at the p < 0.1 level. All retained variables
were then entered into a multivariable model, with those that were not significant at the p < 0.05
level (in the multivariable model) removed sequentially, from largest to smallest p-value, until a
final multivariable model was attained.
For the GRACE studies, participants recorded the use (or non-use) of amoxicillin on each study
day. They also presented to clinicians within different countries. Data were available to indicate
where participants presented to in terms of clinician and country. Variables pertaining to the
138
healthcare setting / country were also available for analysis. To investigate the proportion of
variation that was attributable to differences between clinicians / countries, and hence may be
potential influencers in whether someone adheres to their treatment (or initiates / implements it
as intended), and also to appropriately model these determinants (i.e. calculate standard errors,
and hence confidence intervals and p-values that are not artificially small), an appropriate
hierarchy was selected prior to any further analysis taking place. To do this, null models were
fitted with an increasing number of levels, with the AIC used to establish the best fitting model,
with a smaller AIC indicating a better model fit. Some clinicians participated in more than one
of the three studies, and where this was the case their identifier was linked across studies.
Data from the GRACE studies were also combined in order to increase the precision of the
estimates. The study from which a participant provided data was used in all models (both
univariable and multivariable), to ensure that any association was not confounded by the
characteristics of participants from different studies.
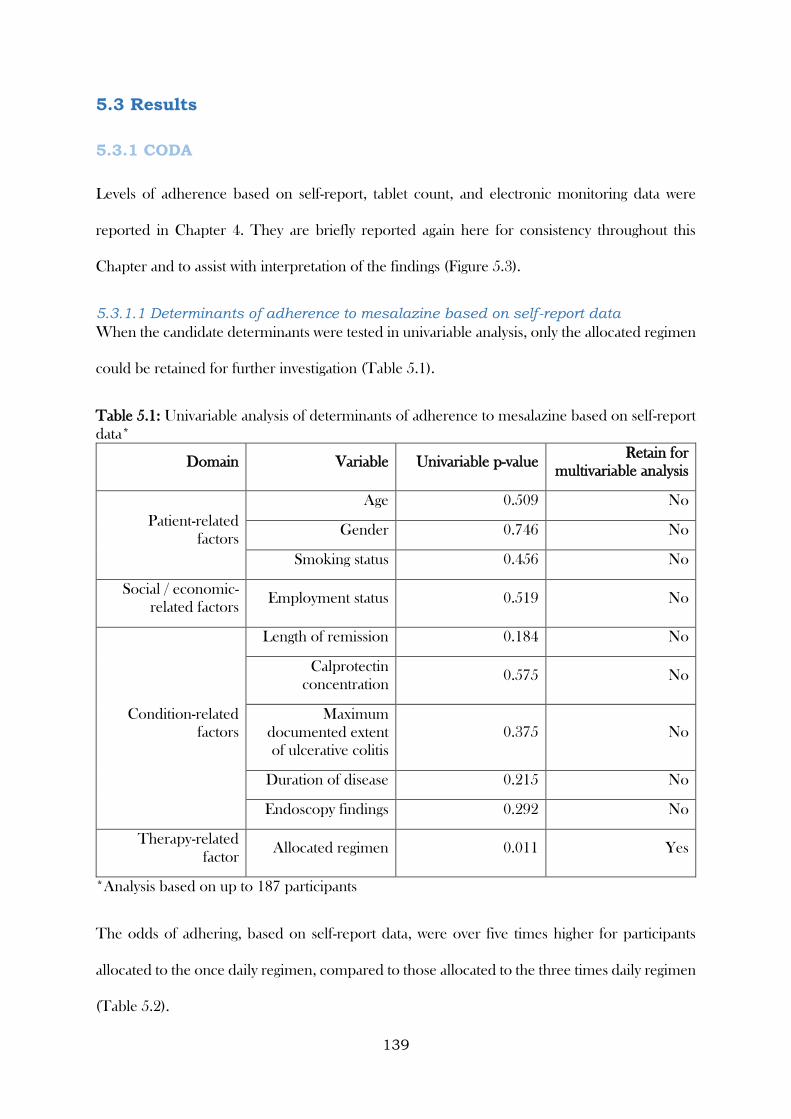
139
5.3 Results
5.3.1 CODA
Levels of adherence based on self-report, tablet count, and electronic monitoring data were
reported in Chapter 4. They are briefly reported again here for consistency throughout this
Chapter and to assist with interpretation of the findings (Figure 5.3).
5.3.1.1 Determinants of adherence to mesalazine based on self-report data
When the candidate determinants were tested in univariable analysis, only the allocated regimen
could be retained for further investigation (Table 5.1).
Table 5.1: Univariable analysis of determinants of adherence to mesalazine based on self-report
data*
Domain Variable Univariable p-value Retain for
multivariable analysis
Patient-related
factors
Age 0.509 No
Gender 0.746 No
Smoking status 0.456 No
Social / economic-
related factors Employment status 0.519 No
Condition-related
factors
Length of remission 0.184 No
Calprotectin
concentration 0.575 No
Maximum
documented extent
of ulcerative colitis
0.375 No
Duration of disease 0.215 No
Endoscopy findings 0.292 No
Therapy-related
factor Allocated regimen 0.011 Yes
*Analysis based on up to 187 participants
The odds of adhering, based on self-report data, were over five times higher for participants
allocated to the once daily regimen, compared to those allocated to the three times daily regimen
(Table 5.2).
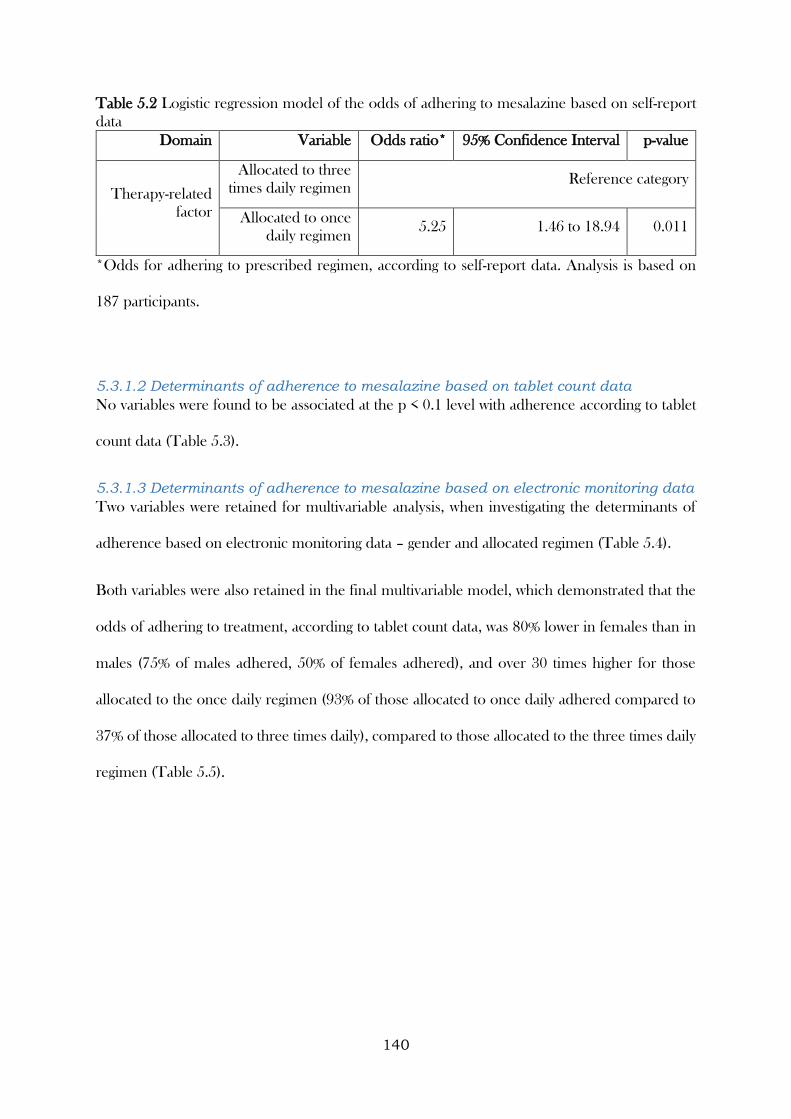
140
Table 5.2 Logistic regression model of the odds of adhering to mesalazine based on self-report
data
Domain Variable Odds ratio* 95% Confidence Interval p-value
Therapy-related
factor
Allocated to three
times daily regimen Reference category
Allocated to once
daily regimen 5.25 1.46 to 18.94 0.011
*Odds for adhering to prescribed regimen, according to self-report data. Analysis is based on
187 participants.
5.3.1.2 Determinants of adherence to mesalazine based on tablet count data
No variables were found to be associated at the p < 0.1 level with adherence according to tablet
count data (Table 5.3).
5.3.1.3 Determinants of adherence to mesalazine based on electronic monitoring data
Two variables were retained for multivariable analysis, when investigating the determinants of
adherence based on electronic monitoring data – gender and allocated regimen (Table 5.4).
Both variables were also retained in the final multivariable model, which demonstrated that the
odds of adhering to treatment, according to tablet count data, was 80% lower in females than in
males (75% of males adhered, 50% of females adhered), and over 30 times higher for those
allocated to the once daily regimen (93% of those allocated to once daily adhered compared to
37% of those allocated to three times daily), compared to those allocated to the three times daily
regimen (Table 5.5).
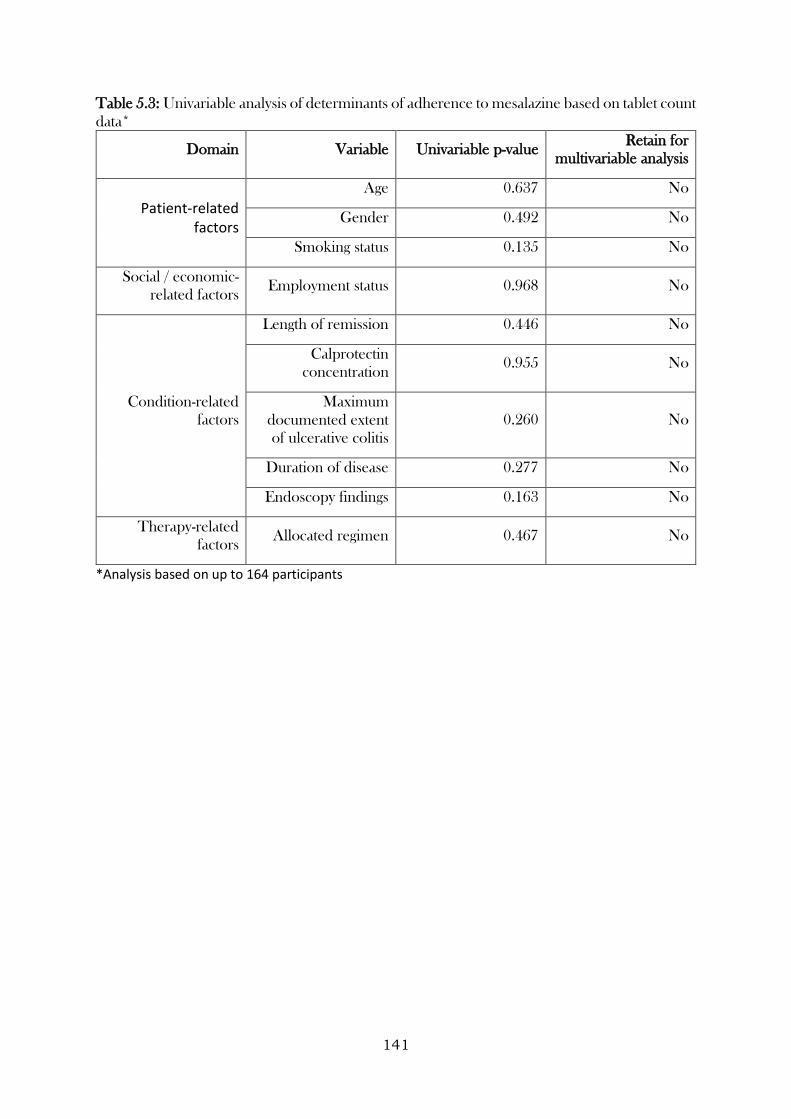
141
Table 5.3: Univariable analysis of determinants of adherence to mesalazine based on tablet count
data*
Domain Variable Univariable p-value Retain for
multivariable analysis
Patient-related factors
Age 0.637 No
Gender 0.492 No
Smoking status 0.135 No
Social / economic-
related factors Employment status 0.968 No
Condition-related
factors
Length of remission 0.446 No
Calprotectin
concentration 0.955 No
Maximum
documented extent
of ulcerative colitis
0.260 No
Duration of disease 0.277 No
Endoscopy findings 0.163 No
Therapy-related
factors Allocated regimen 0.467 No
*Analysis based on up to 164 participants
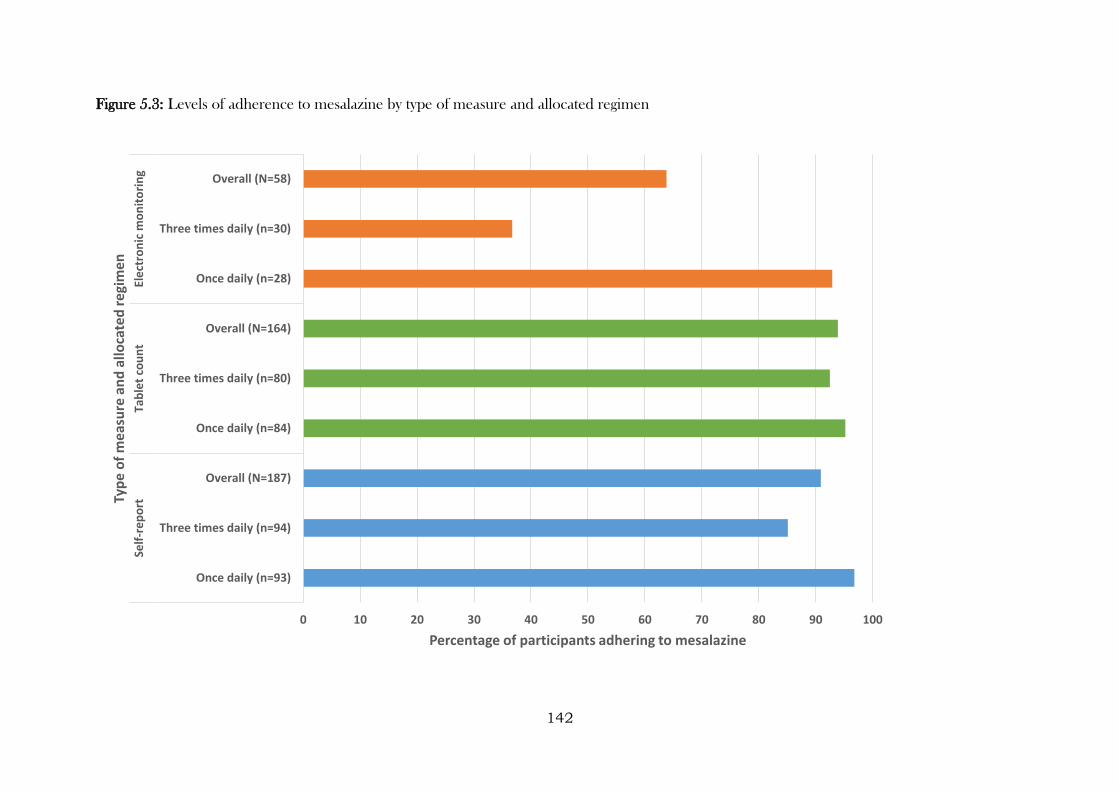
142
Figure 5.3: Levels of adherence to mesalazine by type of measure and allocated regimen
0 10 20 30 40 50 60 70 80 90 100
Once daily (n=93)
Three times daily (n=94)
Overall (N=187)
Once daily (n=84)
Three times daily (n=80)
Overall (N=164)
Once daily (n=28)
Three times daily (n=30)
Overall (N=58)
Self
-rep
ort
Tab
let
cou
nt
Ele
ctro
nic
mo
nit
ori
ng
Percentage of participants adhering to mesalazine
Typ
e o
f m
eas
ure
an
d a
lloca
ted
re
gim
en
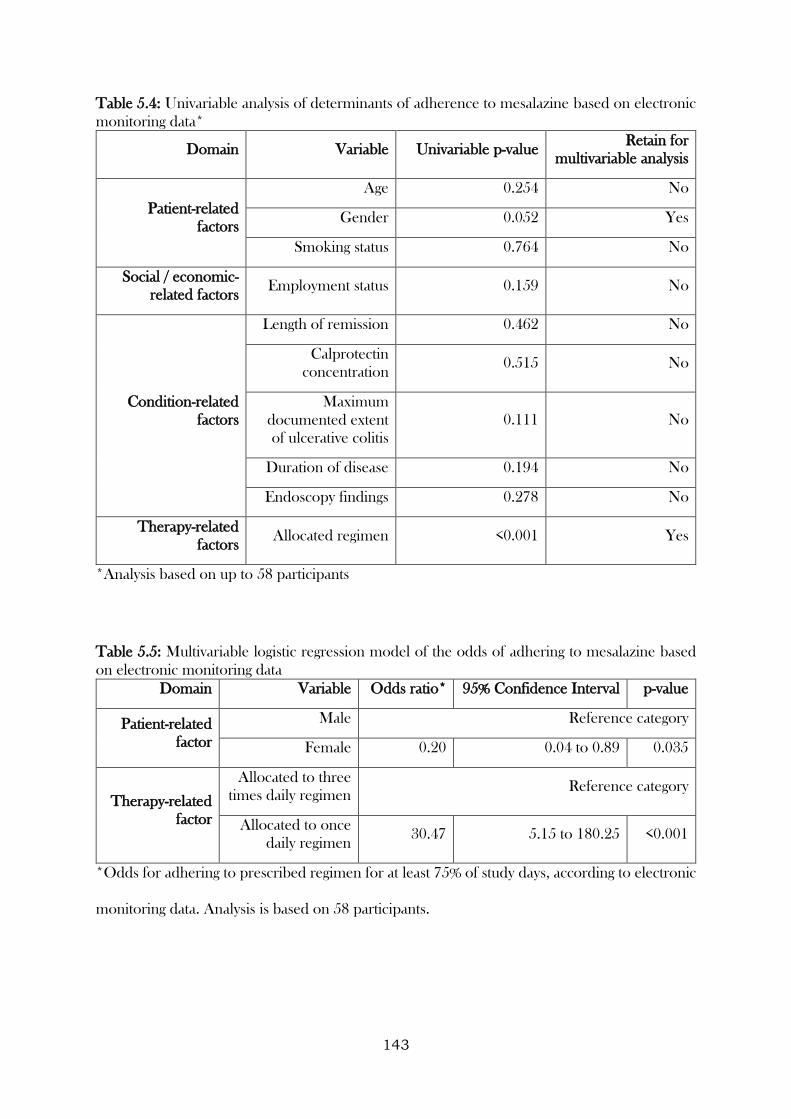
143
Table 5.4: Univariable analysis of determinants of adherence to mesalazine based on electronic
monitoring data*
Domain Variable Univariable p-value Retain for
multivariable analysis
Patient-related
factors
Age 0.254 No
Gender 0.052 Yes
Smoking status 0.764 No
Social / economic-
related factors Employment status 0.159 No
Condition-related
factors
Length of remission 0.462 No
Calprotectin
concentration 0.515 No
Maximum
documented extent
of ulcerative colitis
0.111 No
Duration of disease 0.194 No
Endoscopy findings 0.278 No
Therapy-related
factors Allocated regimen <0.001 Yes
*Analysis based on up to 58 participants
Table 5.5: Multivariable logistic regression model of the odds of adhering to mesalazine based
on electronic monitoring data
Domain Variable Odds ratio* 95% Confidence Interval p-value
Patient-related
factor
Male Reference category
Female 0.20 0.04 to 0.89 0.035
Therapy-related
factor
Allocated to three
times daily regimen Reference category
Allocated to once
daily regimen 30.47 5.15 to 180.25 <0.001
*Odds for adhering to prescribed regimen for at least 75% of study days, according to electronic
monitoring data. Analysis is based on 58 participants.
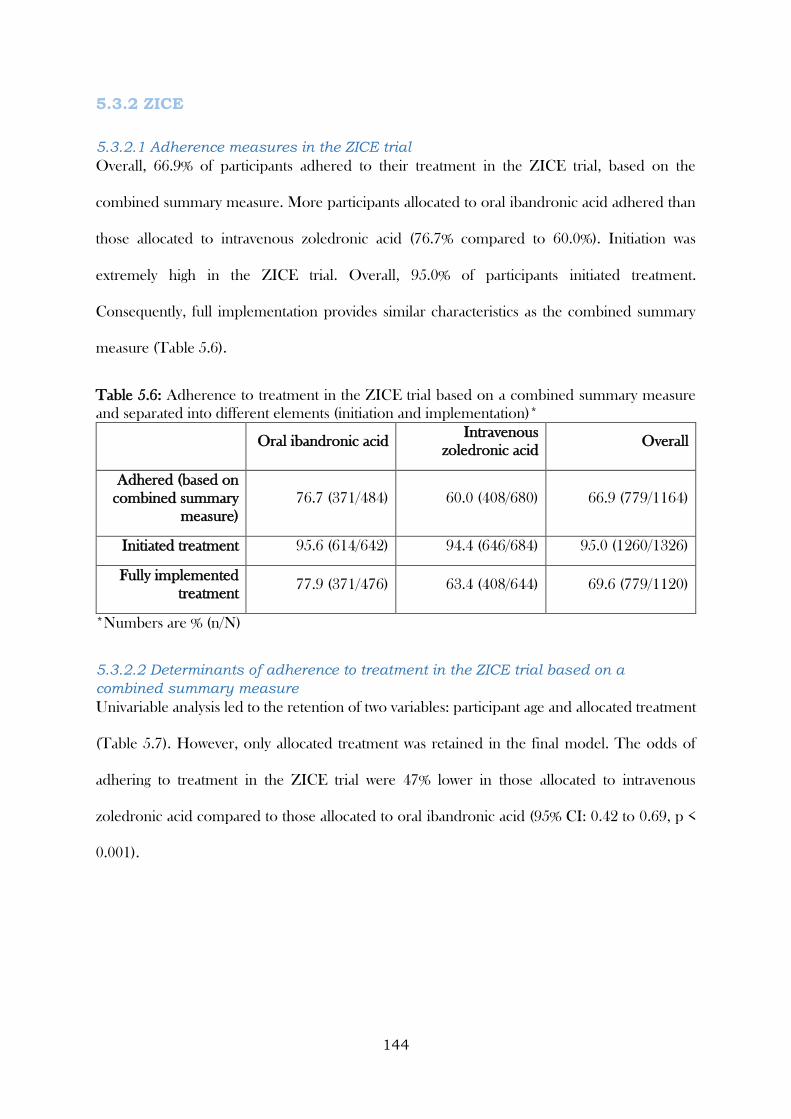
144
5.3.2 ZICE
5.3.2.1 Adherence measures in the ZICE trial
Overall, 66.9% of participants adhered to their treatment in the ZICE trial, based on the
combined summary measure. More participants allocated to oral ibandronic acid adhered than
those allocated to intravenous zoledronic acid (76.7% compared to 60.0%). Initiation was
extremely high in the ZICE trial. Overall, 95.0% of participants initiated treatment.
Consequently, full implementation provides similar characteristics as the combined summary
measure (Table 5.6).
Table 5.6: Adherence to treatment in the ZICE trial based on a combined summary measure
and separated into different elements (initiation and implementation)*
Oral ibandronic acid Intravenous
zoledronic acid Overall
Adhered (based on
combined summary
measure)
76.7 (371/484) 60.0 (408/680) 66.9 (779/1164)
Initiated treatment 95.6 (614/642) 94.4 (646/684) 95.0 (1260/1326)
Fully implemented
treatment 77.9 (371/476) 63.4 (408/644) 69.6 (779/1120)
*Numbers are % (n/N)
5.3.2.2 Determinants of adherence to treatment in the ZICE trial based on a
combined summary measure
Univariable analysis led to the retention of two variables: participant age and allocated treatment
(Table 5.7). However, only allocated treatment was retained in the final model. The odds of
adhering to treatment in the ZICE trial were 47% lower in those allocated to intravenous
zoledronic acid compared to those allocated to oral ibandronic acid (95% CI: 0.42 to 0.69, p <
0.001).
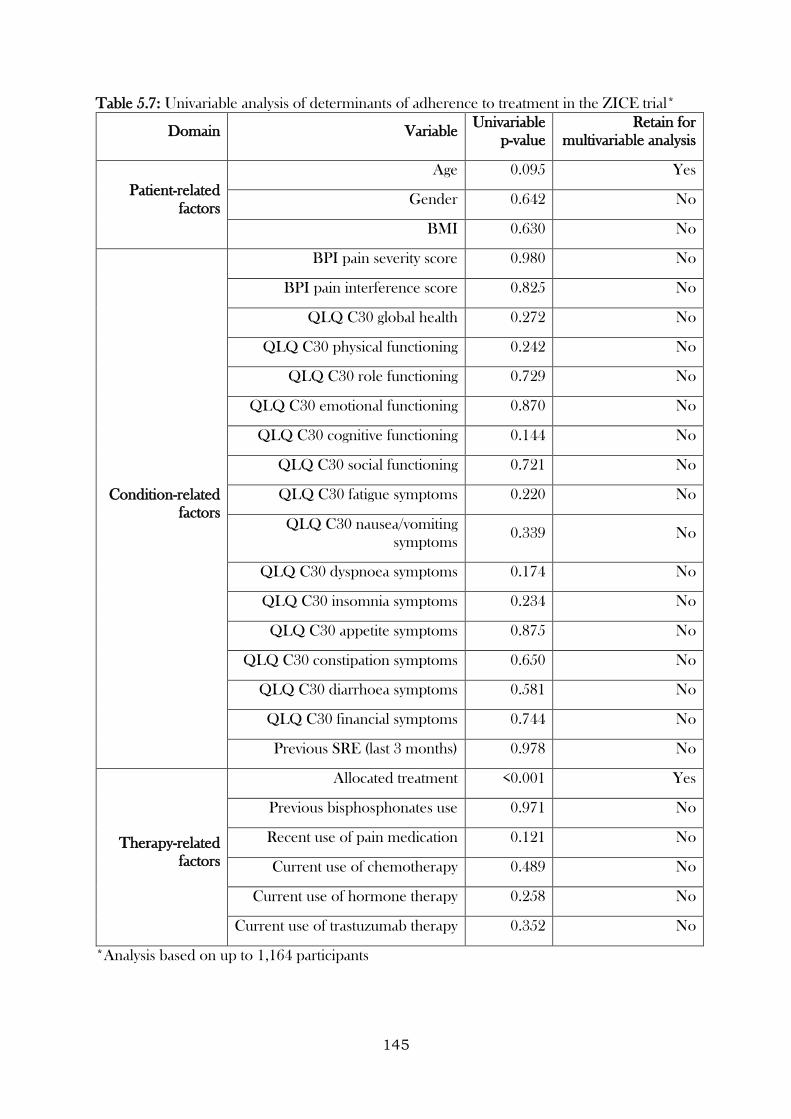
145
Table 5.7: Univariable analysis of determinants of adherence to treatment in the ZICE trial*
Domain Variable Univariable
p-value
Retain for
multivariable analysis
Patient-related
factors
Age 0.095 Yes
Gender 0.642 No
BMI 0.630 No
Condition-related
factors
BPI pain severity score 0.980 No
BPI pain interference score 0.825 No
QLQ C30 global health 0.272 No
QLQ C30 physical functioning 0.242 No
QLQ C30 role functioning 0.729 No
QLQ C30 emotional functioning 0.870 No
QLQ C30 cognitive functioning 0.144 No
QLQ C30 social functioning 0.721 No
QLQ C30 fatigue symptoms 0.220 No
QLQ C30 nausea/vomiting
symptoms 0.339 No
QLQ C30 dyspnoea symptoms 0.174 No
QLQ C30 insomnia symptoms 0.234 No
QLQ C30 appetite symptoms 0.875 No
QLQ C30 constipation symptoms 0.650 No
QLQ C30 diarrhoea symptoms 0.581 No
QLQ C30 financial symptoms 0.744 No
Previous SRE (last 3 months) 0.978 No
Therapy-related
factors
Allocated treatment <0.001 Yes
Previous bisphosphonates use 0.971 No
Recent use of pain medication 0.121 No
Current use of chemotherapy 0.489 No
Current use of hormone therapy 0.258 No
Current use of trastuzumab therapy 0.352 No
*Analysis based on up to 1,164 participants
146
5.3.2.3 Determinants of initiation of treatment in the ZICE trial
Univariable analysis led to the retention of variables related to the condition (global health,
cognitive functioning, social functioning, and fatigue symptoms) and therapy (current use of
hormone therapy) (Table 5.8).
The final model found that the odds of initiating treatment in the ZICE study increased as social
functioning increased (odds ratio for a unit increase = 1.01, 95% CI: 1.00 to 1.02, p = 0.029).
5.3.2.4 Determinants of implementation of treatment in the ZICE trial
Univariable analysis of the determinants of implementation of treatment in the ZICE trial led to
the retention of similar variables to those retained when using the combined summary measure
(participant age and allocated treatment), with the addition of another therapy-related factor
(recent use of pain medication). However, only allocated treatment was retained in the final
model, which demonstrated that the odds of implementing treatment in the ZICE trial was 51%
lower for those allocated to intravenous zoledronic acid compared to those allocated to oral
ibandronic acid (95% CI: 0.37 to 0.64, p < 0.001).
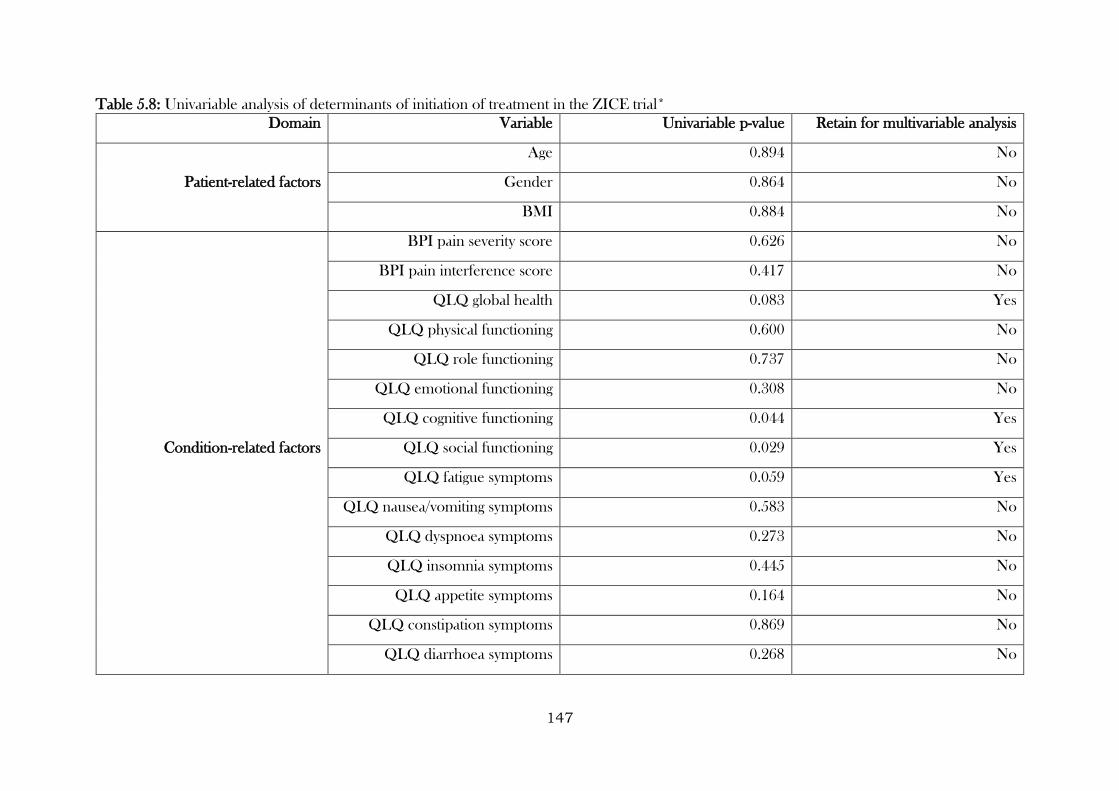
147
Table 5.8: Univariable analysis of determinants of initiation of treatment in the ZICE trial*
Domain Variable Univariable p-value Retain for multivariable analysis
Patient-related factors
Age 0.894 No
Gender 0.864 No
BMI 0.884 No
Condition-related factors
BPI pain severity score 0.626 No
BPI pain interference score 0.417 No
QLQ global health 0.083 Yes
QLQ physical functioning 0.600 No
QLQ role functioning 0.737 No
QLQ emotional functioning 0.308 No
QLQ cognitive functioning 0.044 Yes
QLQ social functioning 0.029 Yes
QLQ fatigue symptoms 0.059 Yes
QLQ nausea/vomiting symptoms 0.583 No
QLQ dyspnoea symptoms 0.273 No
QLQ insomnia symptoms 0.445 No
QLQ appetite symptoms 0.164 No
QLQ constipation symptoms 0.869 No
QLQ diarrhoea symptoms 0.268 No
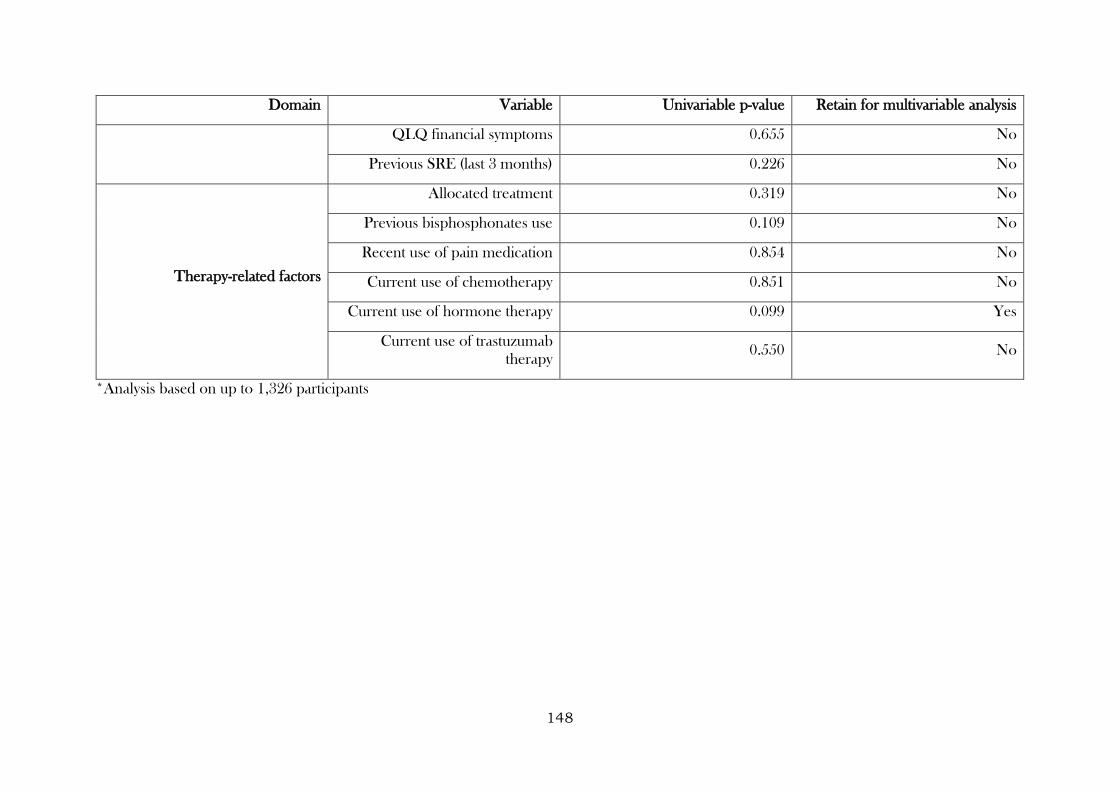
148
Domain Variable Univariable p-value Retain for multivariable analysis
QLQ financial symptoms 0.655 No
Previous SRE (last 3 months) 0.226 No
Therapy-related factors
Allocated treatment 0.319 No
Previous bisphosphonates use 0.109 No
Recent use of pain medication 0.854 No
Current use of chemotherapy 0.851 No
Current use of hormone therapy 0.099 Yes
Current use of trastuzumab
therapy 0.550 No
*Analysis based on up to 1,326 participants
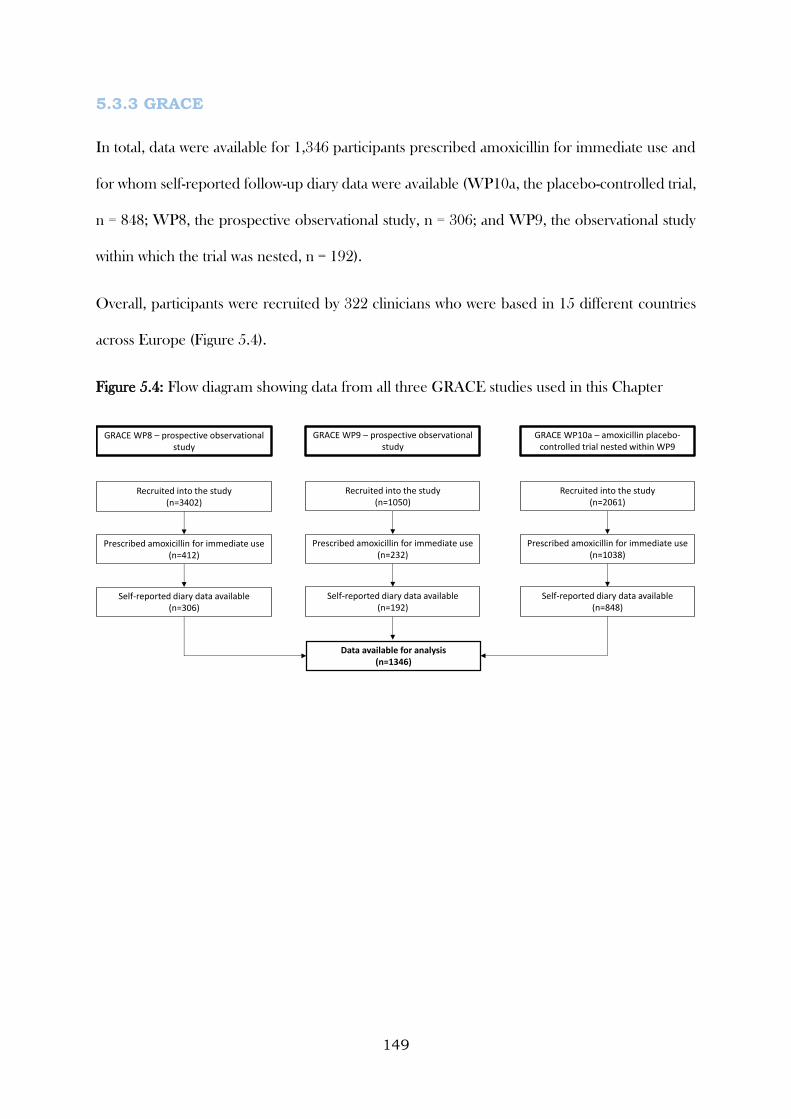
149
5.3.3 GRACE
In total, data were available for 1,346 participants prescribed amoxicillin for immediate use and
for whom self-reported follow-up diary data were available (WP10a, the placebo-controlled trial,
n = 848; WP8, the prospective observational study, n = 306; and WP9, the observational study
within which the trial was nested, n = 192).
Overall, participants were recruited by 322 clinicians who were based in 15 different countries
across Europe (Figure 5.4).
Figure 5.4: Flow diagram showing data from all three GRACE studies used in this Chapter
Recruited into the study(n=3402)
Prescribed amoxicillin for immediate use(n=412)
Self-reported diary data available(n=306)
Recruited into the study(n=2061)
Prescribed amoxicillin for immediate use(n=1038)
Self-reported diary data available(n=848)
Recruited into the study(n=1050)
Prescribed amoxicillin for immediate use(n=232)
Self-reported diary data available(n=192)
Data available for analysis(n=1346)
GRACE WP8 – prospective observational study
GRACE WP10a – amoxicillin placebo-controlled trial nested within WP9
GRACE WP9 – prospective observational study
150
5.3.3.1 Characteristics of participants in the GRACE studies
Participants were aged between 18 and 88 years (median 51, IQR: 38 to 62). While the age
distributions in WP8 and WP10a were similar, those recruited into WP9 tended to be slightly
older (median 58, IQR: 45 to 65). Overall, 540 participants were men (40.1%), and 372
participants had at least one of the listed co-morbidities (27.7%). WP9 contained a higher
percentage of participants with co-morbidities (36.5%) (Table 5.9).
5.3.3.2 Illness characteristics of participants in the GRACE studies
Other than cough, which was part of the inclusion criteria for all three studies, the five most
frequently reported symptoms were phlegm (81.3%), feeling generally unwell (79.8%),
interference with normal activities (69.6%), disturbed sleep (64.5%), and shortness of breath
(59.0%). Fever and headache were most frequently reported by participants in WP8, and coryza
by participants in WP10a. Phlegm, shortness of breath, wheeze, disturbed sleep, feeling generally
unwell, and diarrhoea were symptoms most frequently reported by participants in WP9 (Table
5.9).
Overall, the median clinician-rated symptom severity score at recruitment was 36 (IQR: 25 to
46), with participants from WP9 reporting the highest average symptom severity (median = 38,
IQR: 26 to 48) and those from WP10a the lowest (median = 35, IQR: 25 to 46). Abnormal
findings on auscultation examination were found in 652 participants (48.5%), with participants in
WP10a least likely to have abnormal findings (34.3%). Discoloured phlegm was reported by 680
participants (53.2%) (Table 5.9).
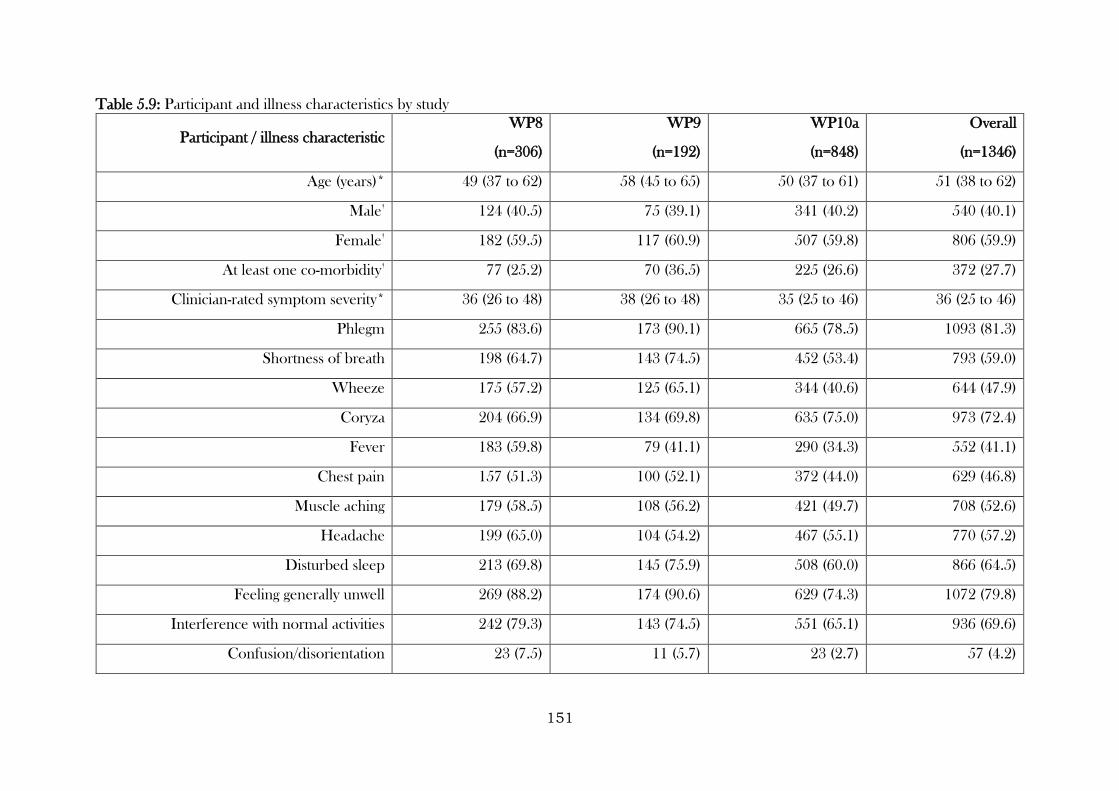
151
Table 5.9: Participant and illness characteristics by study
Participant / illness characteristic WP8
(n=306)
WP9
(n=192)
WP10a
(n=848)
Overall
(n=1346)
Age (years)* 49 (37 to 62) 58 (45 to 65) 50 (37 to 61) 51 (38 to 62)
Male†
124 (40.5) 75 (39.1) 341 (40.2) 540 (40.1)
Female†
182 (59.5) 117 (60.9) 507 (59.8) 806 (59.9)
At least one co-morbidity†
77 (25.2) 70 (36.5) 225 (26.6) 372 (27.7)
Clinician-rated symptom severity* 36 (26 to 48) 38 (26 to 48) 35 (25 to 46) 36 (25 to 46)
Phlegm 255 (83.6) 173 (90.1) 665 (78.5) 1093 (81.3)
Shortness of breath 198 (64.7) 143 (74.5) 452 (53.4) 793 (59.0)
Wheeze 175 (57.2) 125 (65.1) 344 (40.6) 644 (47.9)
Coryza 204 (66.9) 134 (69.8) 635 (75.0) 973 (72.4)
Fever 183 (59.8) 79 (41.1) 290 (34.3) 552 (41.1)
Chest pain 157 (51.3) 100 (52.1) 372 (44.0) 629 (46.8)
Muscle aching 179 (58.5) 108 (56.2) 421 (49.7) 708 (52.6)
Headache 199 (65.0) 104 (54.2) 467 (55.1) 770 (57.2)
Disturbed sleep 213 (69.8) 145 (75.9) 508 (60.0) 866 (64.5)
Feeling generally unwell 269 (88.2) 174 (90.6) 629 (74.3) 1072 (79.8)
Interference with normal activities 242 (79.3) 143 (74.5) 551 (65.1) 936 (69.6)
Confusion/disorientation 23 (7.5) 11 (5.7) 23 (2.7) 57 (4.2)
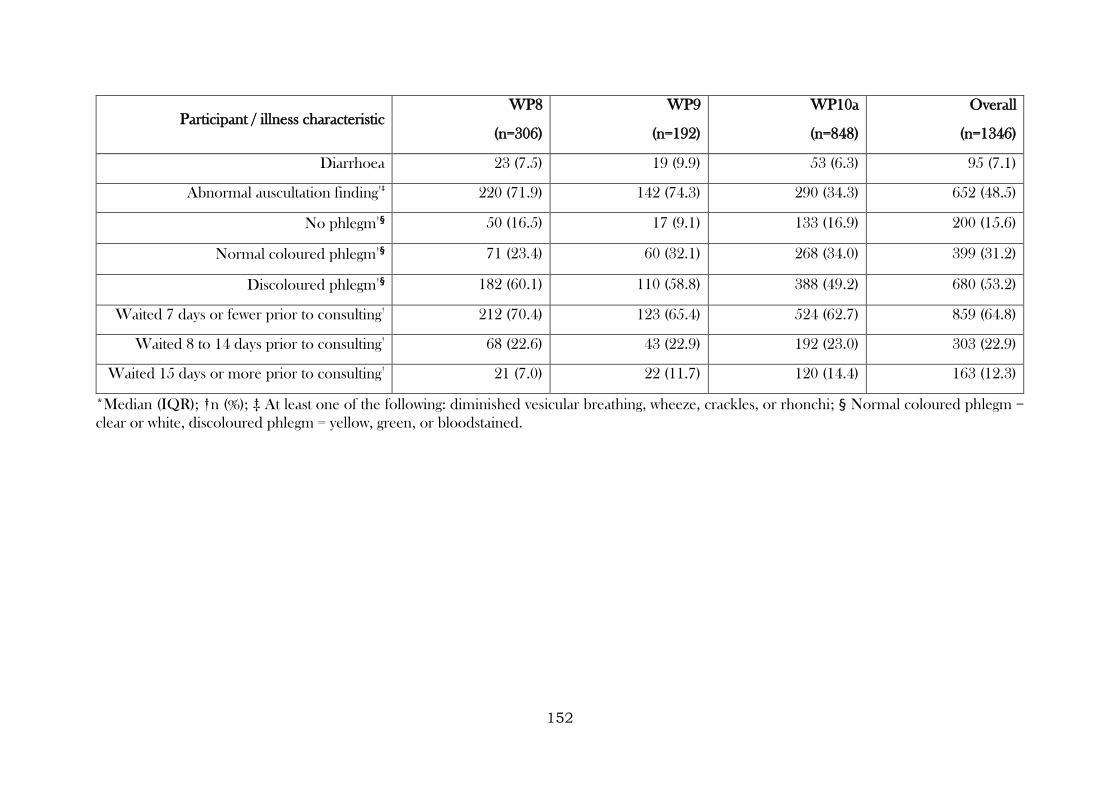
152
Participant / illness characteristic WP8
(n=306)
WP9
(n=192)
WP10a
(n=848)
Overall
(n=1346)
Diarrhoea 23 (7.5) 19 (9.9) 53 (6.3) 95 (7.1)
Abnormal auscultation finding†‡
220 (71.9) 142 (74.3) 290 (34.3) 652 (48.5)
No phlegm†§ 50 (16.5) 17 (9.1) 133 (16.9) 200 (15.6)
Normal coloured phlegm†§ 71 (23.4) 60 (32.1) 268 (34.0) 399 (31.2)
Discoloured phlegm†§ 182 (60.1) 110 (58.8) 388 (49.2) 680 (53.2)
Waited 7 days or fewer prior to consulting†
212 (70.4) 123 (65.4) 524 (62.7) 859 (64.8)
Waited 8 to 14 days prior to consulting†
68 (22.6) 43 (22.9) 192 (23.0) 303 (22.9)
Waited 15 days or more prior to consulting†
21 (7.0) 22 (11.7) 120 (14.4) 163 (12.3)
*Median (IQR); †n (%); ‡ At least one of the following: diminished vesicular breathing, wheeze, crackles, or rhonchi; § Normal coloured phlegm =
clear or white, discoloured phlegm = yellow, green, or bloodstained.
153
5.3.3.3 Prescription characteristics of participants in the GRACE studies
While participants in WP10a were prescribed a fixed dose, frequency, and duration of
amoxicillin, it was not fixed for participants in the other two studies. For these participants, the
most frequently prescribed dose was 500mg (218, or 44.2% of all participants were prescribed
this dose), with 393 instructed to take their medication three or more times a day (79.2%), and
339 prescribed a six or seven day course (68.3%). Participants in WP8 were more likely to be
prescribed higher doses to be taken less frequently and for a shorter duration, than those in WP9
(Table 5.10).
5.3.3.4 Healthcare setting characteristics of participants in the GRACE studies
Of the 15 countries included, single handed practices were common in six (40.0%), campaigns
around antibiotic use had recently been conducted in seven (46.7%), patients were required to
pay to see a GP at the point of delivery of care in seven (46.7%), and a doctor-issued sick
certificate was required for certifying people off work for less than seven days in three (20.0%).
Amoxicillin was the first-line choice of antibiotic in the national guidelines of six of the countries
(40.0%), and antibiotic prescribing rates ranged from 11.2 DDDs per 1000 inhabitants/day (The
Netherlands) to 28.6 DDDs per 1000 inhabitants/day (France), with six countries categorised as
low prescribers (The Netherlands, Sweden, Germany, Slovenia, Norway, and Hungary), five as
moderate (England, Wales, Finland, Spain, and Poland), and four as high prescribers (Slovakia,
Belgium, Italy, and France) (Table 5.11).
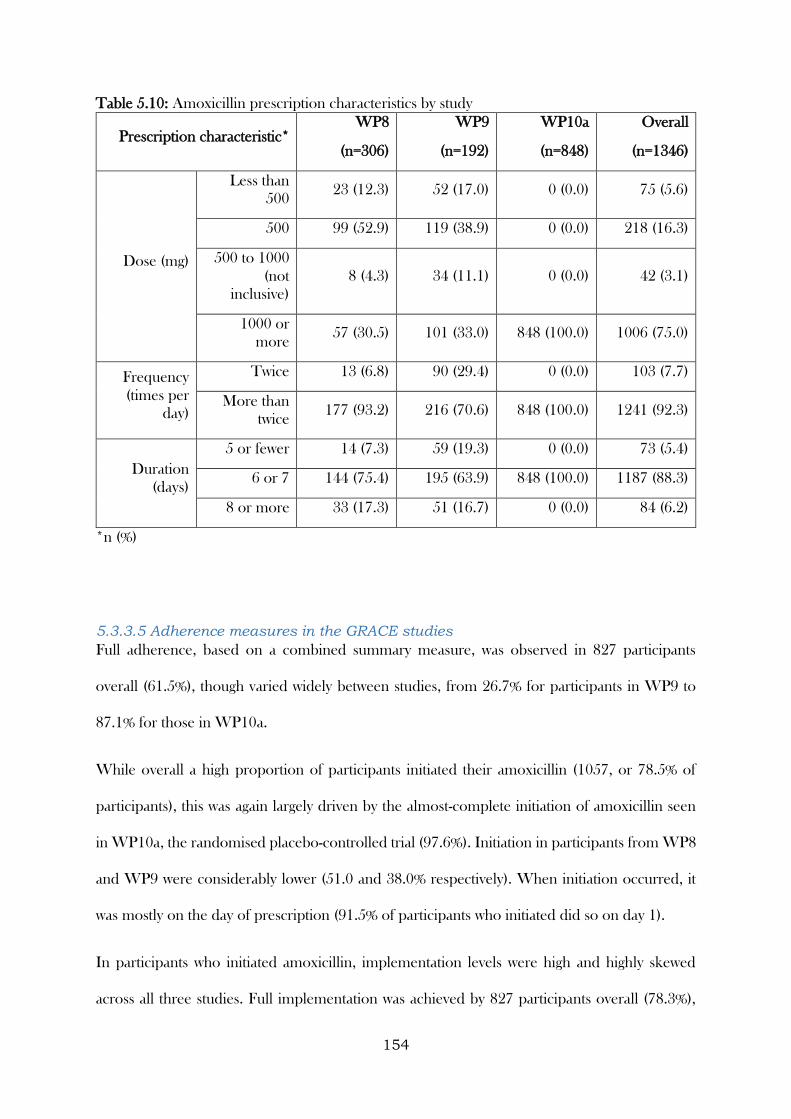
154
Table 5.10: Amoxicillin prescription characteristics by study
Prescription characteristic* WP8
(n=306)
WP9
(n=192)
WP10a
(n=848)
Overall
(n=1346)
Dose (mg)
Less than
500 23 (12.3) 52 (17.0) 0 (0.0) 75 (5.6)
500 99 (52.9) 119 (38.9) 0 (0.0) 218 (16.3)
500 to 1000
(not
inclusive)
8 (4.3) 34 (11.1) 0 (0.0) 42 (3.1)
1000 or
more 57 (30.5) 101 (33.0) 848 (100.0) 1006 (75.0)
Frequency
(times per
day)
Twice 13 (6.8) 90 (29.4) 0 (0.0) 103 (7.7)
More than
twice 177 (93.2) 216 (70.6) 848 (100.0) 1241 (92.3)
Duration
(days)
5 or fewer 14 (7.3) 59 (19.3) 0 (0.0) 73 (5.4)
6 or 7 144 (75.4) 195 (63.9) 848 (100.0) 1187 (88.3)
8 or more 33 (17.3) 51 (16.7) 0 (0.0) 84 (6.2)
*n (%)
5.3.3.5 Adherence measures in the GRACE studies
Full adherence, based on a combined summary measure, was observed in 827 participants
overall (61.5%), though varied widely between studies, from 26.7% for participants in WP9 to
87.1% for those in WP10a.
While overall a high proportion of participants initiated their amoxicillin (1057, or 78.5% of
participants), this was again largely driven by the almost-complete initiation of amoxicillin seen
in WP10a, the randomised placebo-controlled trial (97.6%). Initiation in participants from WP8
and WP9 were considerably lower (51.0 and 38.0% respectively). When initiation occurred, it
was mostly on the day of prescription (91.5% of participants who initiated did so on day 1).
In participants who initiated amoxicillin, implementation levels were high and highly skewed
across all three studies. Full implementation was achieved by 827 participants overall (78.3%),

155
with full implementation across studies ranging from 70.8% of participants in WP9 (51/72) to
80.0% in WP10a (662/828).
The median time from initiation to discontinuation of amoxicillin was seven days across all three
studies (overall IQR: 7 to 8 days).
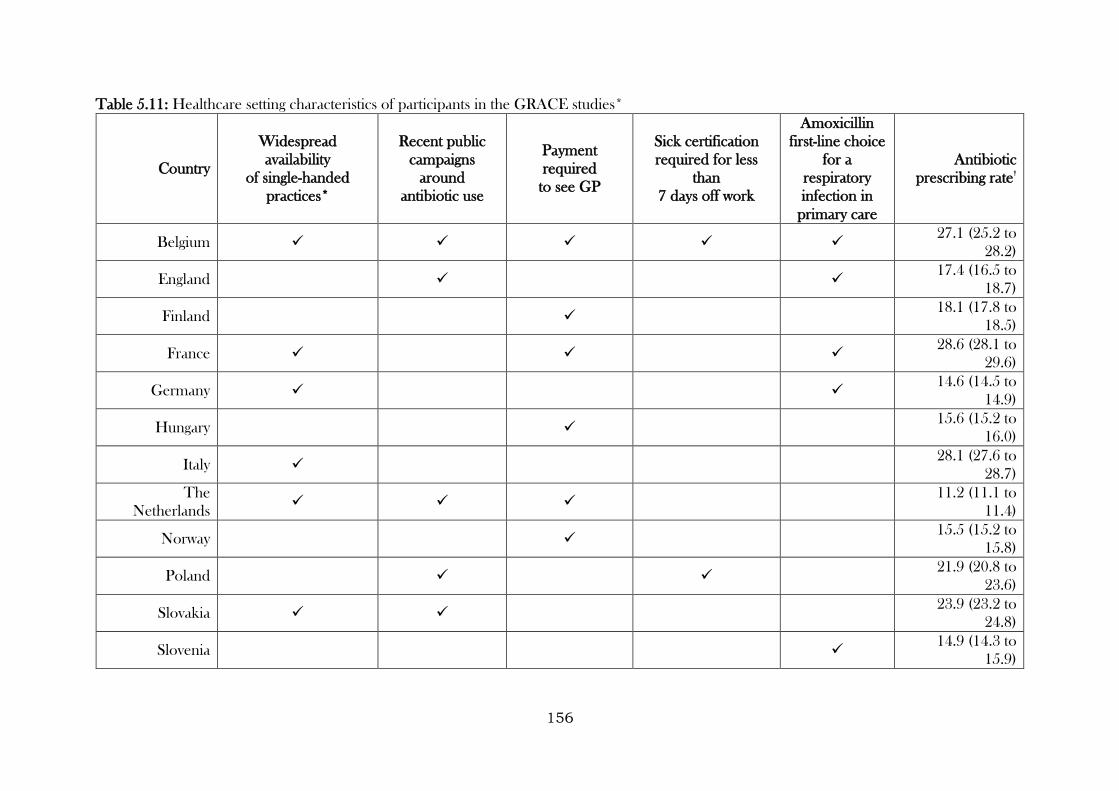
156
Table 5.11: Healthcare setting characteristics of participants in the GRACE studies*
Country
Widespread
availability
of single-handed
practices*
Recent public
campaigns
around
antibiotic use
Payment
required
to see GP
Sick certification
required for less
than
7 days off work
Amoxicillin
first-line choice
for a
respiratory
infection in
primary care
Antibiotic
prescribing rate†
Belgium 27.1 (25.2 to
28.2)
England
17.4 (16.5 to
18.7)
Finland 18.1 (17.8 to
18.5)
France
28.6 (28.1 to
29.6)
Germany
14.6 (14.5 to
14.9)
Hungary 15.6 (15.2 to
16.0)
Italy 28.1 (27.6 to
28.7)
The
Netherlands 11.2 (11.1 to
11.4)
Norway 15.5 (15.2 to
15.8)
Poland
21.9 (20.8 to
23.6)
Slovakia 23.9 (23.2 to
24.8)
Slovenia 14.9 (14.3 to
15.9)
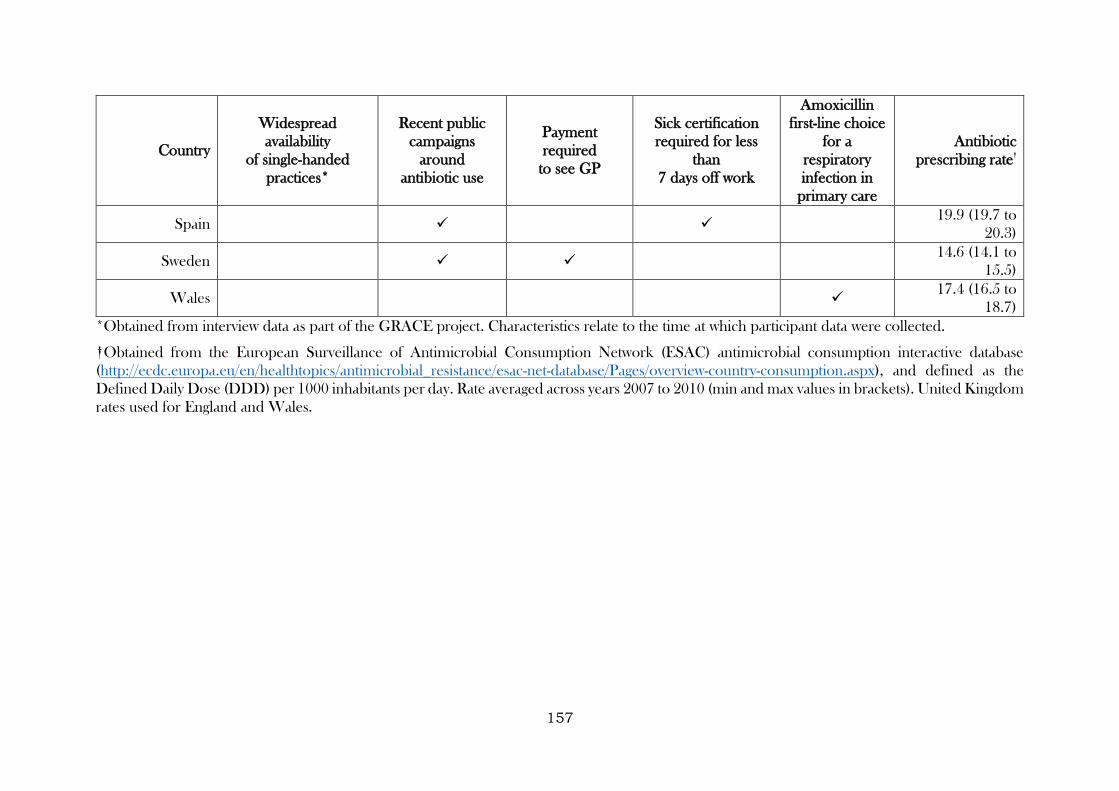
157
Country
Widespread
availability
of single-handed
practices*
Recent public
campaigns
around
antibiotic use
Payment
required
to see GP
Sick certification
required for less
than
7 days off work
Amoxicillin
first-line choice
for a
respiratory
infection in
primary care
Antibiotic
prescribing rate†
Spain
19.9 (19.7 to
20.3)
Sweden 14.6 (14.1 to
15.5)
Wales
17.4 (16.5 to
18.7)
*Obtained from interview data as part of the GRACE project. Characteristics relate to the time at which participant data were collected.
†Obtained from the European Surveillance of Antimicrobial Consumption Network (ESAC) antimicrobial consumption interactive database
(http://ecdc.europa.eu/en/healthtopics/antimicrobial_resistance/esac-net-database/Pages/overview-country-consumption.aspx), and defined as the
Defined Daily Dose (DDD) per 1000 inhabitants per day. Rate averaged across years 2007 to 2010 (min and max values in brackets). United Kingdom
rates used for England and Wales.
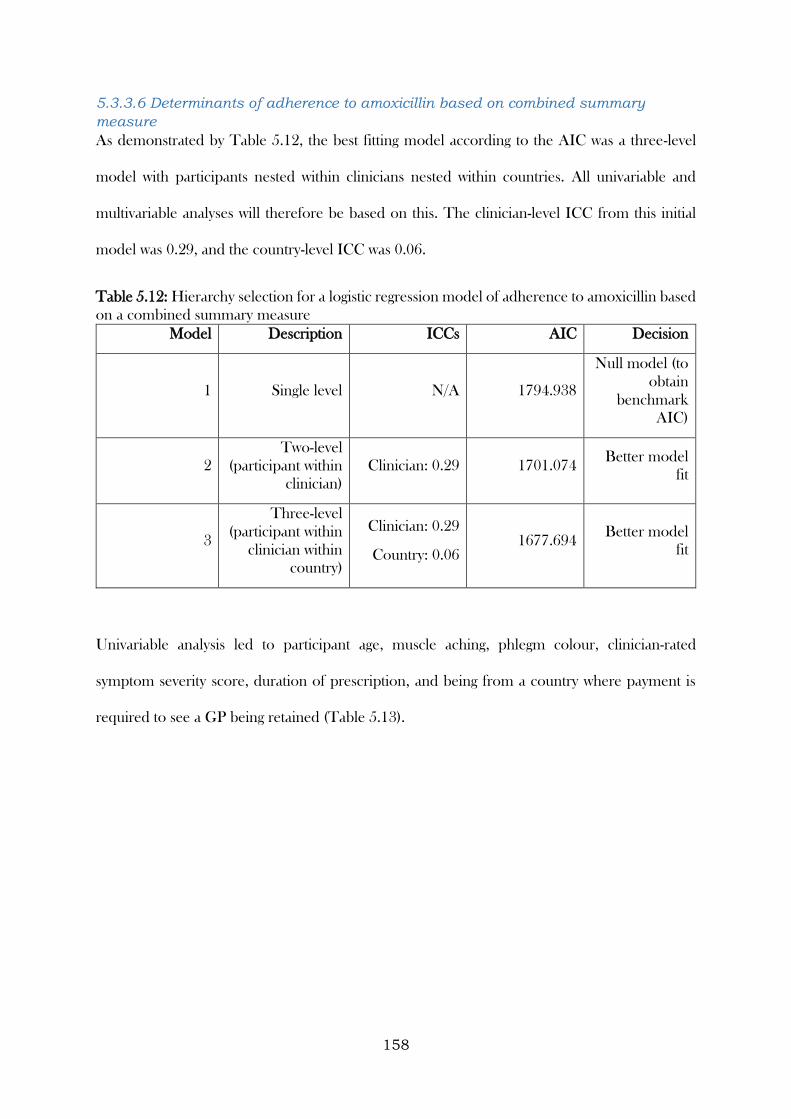
158
5.3.3.6 Determinants of adherence to amoxicillin based on combined summary
measure
As demonstrated by Table 5.12, the best fitting model according to the AIC was a three-level
model with participants nested within clinicians nested within countries. All univariable and
multivariable analyses will therefore be based on this. The clinician-level ICC from this initial
model was 0.29, and the country-level ICC was 0.06.
Table 5.12: Hierarchy selection for a logistic regression model of adherence to amoxicillin based
on a combined summary measure
Model Description ICCs AIC Decision
1 Single level N/A 1794.938
Null model (to
obtain
benchmark
AIC)
2
Two-level
(participant within
clinician)
Clinician: 0.29 1701.074 Better model
fit
3
Three-level
(participant within
clinician within
country)
Clinician: 0.29
Country: 0.06 1677.694
Better model
fit
Univariable analysis led to participant age, muscle aching, phlegm colour, clinician-rated
symptom severity score, duration of prescription, and being from a country where payment is
required to see a GP being retained (Table 5.13).
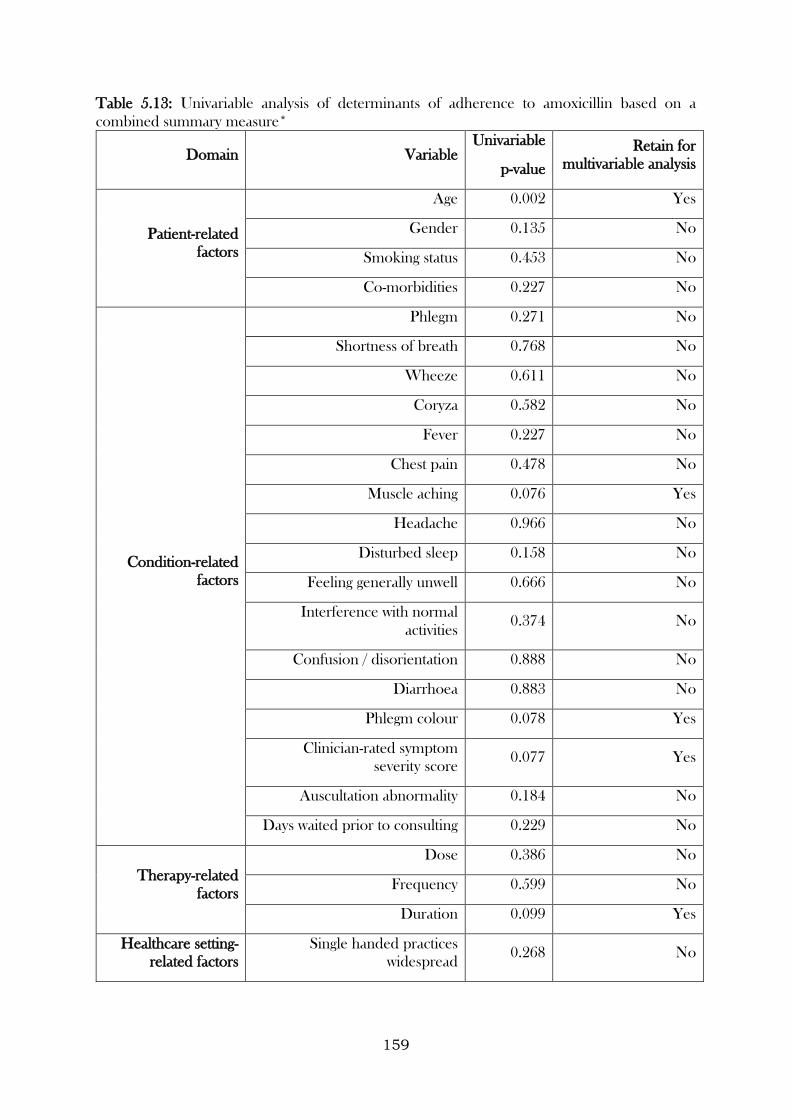
159
Table 5.13: Univariable analysis of determinants of adherence to amoxicillin based on a
combined summary measure*
Domain Variable Univariable
p-value
Retain for
multivariable analysis
Patient-related
factors
Age 0.002 Yes
Gender 0.135 No
Smoking status 0.453 No
Co-morbidities 0.227 No
Condition-related
factors
Phlegm 0.271 No
Shortness of breath 0.768 No
Wheeze 0.611 No
Coryza 0.582 No
Fever 0.227 No
Chest pain 0.478 No
Muscle aching 0.076 Yes
Headache 0.966 No
Disturbed sleep 0.158 No
Feeling generally unwell 0.666 No
Interference with normal
activities 0.374 No
Confusion / disorientation 0.888 No
Diarrhoea 0.883 No
Phlegm colour 0.078 Yes
Clinician-rated symptom
severity score 0.077 Yes
Auscultation abnormality 0.184 No
Days waited prior to consulting 0.229 No
Therapy-related
factors
Dose 0.386 No
Frequency 0.599 No
Duration 0.099 Yes
Healthcare setting-
related factors
Single handed practices
widespread 0.268 No
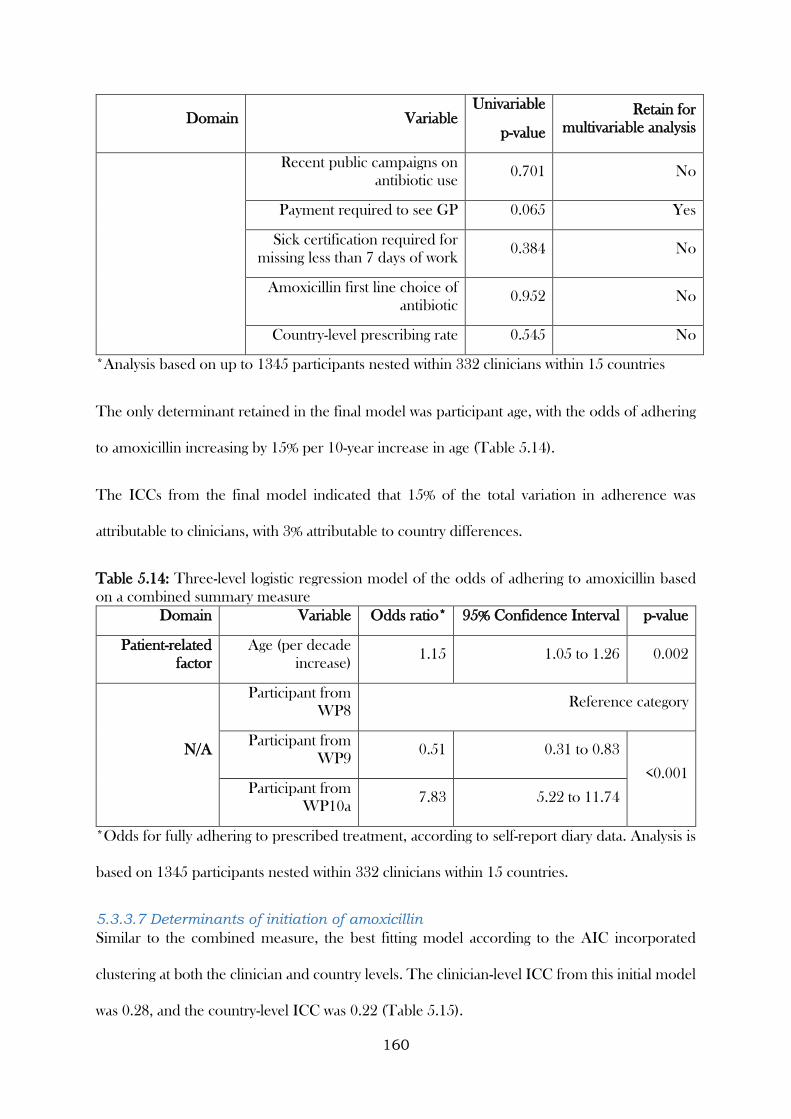
160
Domain Variable Univariable
p-value
Retain for
multivariable analysis
Recent public campaigns on
antibiotic use 0.701 No
Payment required to see GP 0.065 Yes
Sick certification required for
missing less than 7 days of work 0.384 No
Amoxicillin first line choice of
antibiotic 0.952 No
Country-level prescribing rate 0.545 No
*Analysis based on up to 1345 participants nested within 332 clinicians within 15 countries
The only determinant retained in the final model was participant age, with the odds of adhering
to amoxicillin increasing by 15% per 10-year increase in age (Table 5.14).
The ICCs from the final model indicated that 15% of the total variation in adherence was
attributable to clinicians, with 3% attributable to country differences.
Table 5.14: Three-level logistic regression model of the odds of adhering to amoxicillin based
on a combined summary measure
Domain Variable Odds ratio* 95% Confidence Interval p-value
Patient-related
factor
Age (per decade
increase) 1.15 1.05 to 1.26 0.002
N/A
Participant from
WP8 Reference category
Participant from
WP9 0.51 0.31 to 0.83
<0.001 Participant from
WP10a 7.83 5.22 to 11.74
*Odds for fully adhering to prescribed treatment, according to self-report diary data. Analysis is
based on 1345 participants nested within 332 clinicians within 15 countries.
5.3.3.7 Determinants of initiation of amoxicillin
Similar to the combined measure, the best fitting model according to the AIC incorporated
clustering at both the clinician and country levels. The clinician-level ICC from this initial model
was 0.28, and the country-level ICC was 0.22 (Table 5.15).
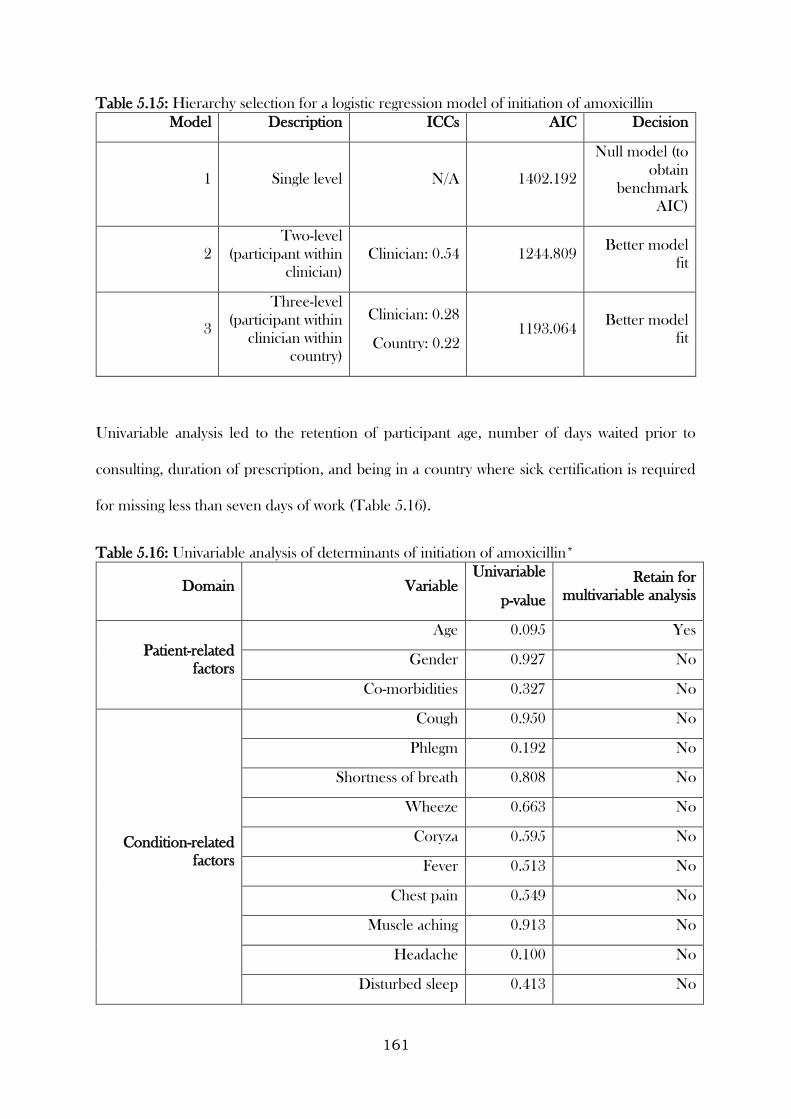
161
Table 5.15: Hierarchy selection for a logistic regression model of initiation of amoxicillin
Model Description ICCs AIC Decision
1 Single level N/A 1402.192
Null model (to
obtain
benchmark
AIC)
2
Two-level
(participant within
clinician)
Clinician: 0.54 1244.809 Better model
fit
3
Three-level
(participant within
clinician within
country)
Clinician: 0.28
Country: 0.22 1193.064
Better model
fit
Univariable analysis led to the retention of participant age, number of days waited prior to
consulting, duration of prescription, and being in a country where sick certification is required
for missing less than seven days of work (Table 5.16).
Table 5.16: Univariable analysis of determinants of initiation of amoxicillin*
Domain Variable Univariable
p-value
Retain for
multivariable analysis
Patient-related
factors
Age 0.095 Yes
Gender 0.927 No
Co-morbidities 0.327 No
Condition-related
factors
Cough 0.950 No
Phlegm 0.192 No
Shortness of breath 0.808 No
Wheeze 0.663 No
Coryza 0.595 No
Fever 0.513 No
Chest pain 0.549 No
Muscle aching 0.913 No
Headache 0.100 No
Disturbed sleep 0.413 No
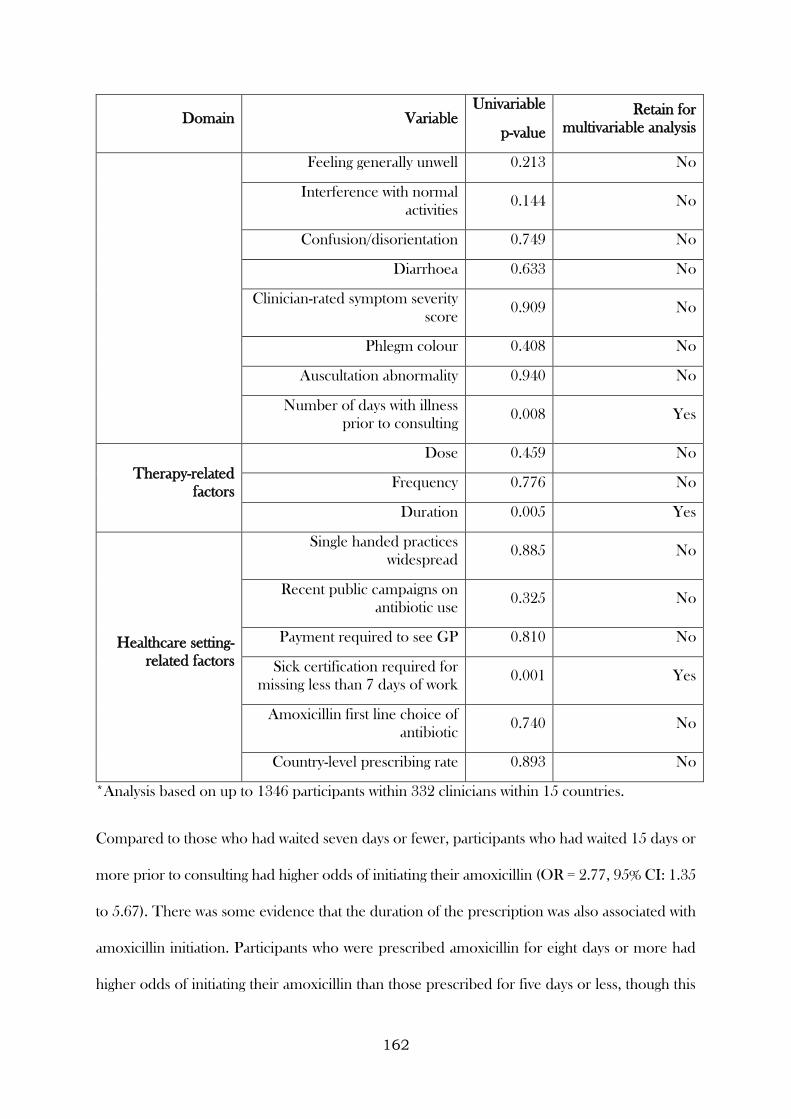
162
Domain Variable Univariable
p-value
Retain for
multivariable analysis
Feeling generally unwell 0.213 No
Interference with normal
activities 0.144 No
Confusion/disorientation 0.749 No
Diarrhoea 0.633 No
Clinician-rated symptom severity
score 0.909 No
Phlegm colour 0.408 No
Auscultation abnormality 0.940 No
Number of days with illness
prior to consulting 0.008 Yes
Therapy-related
factors
Dose 0.459 No
Frequency 0.776 No
Duration 0.005 Yes
Healthcare setting-
related factors
Single handed practices
widespread 0.885 No
Recent public campaigns on
antibiotic use 0.325 No
Payment required to see GP 0.810 No
Sick certification required for
missing less than 7 days of work 0.001 Yes
Amoxicillin first line choice of
antibiotic 0.740 No
Country-level prescribing rate 0.893 No
*Analysis based on up to 1346 participants within 332 clinicians within 15 countries.
Compared to those who had waited seven days or fewer, participants who had waited 15 days or
more prior to consulting had higher odds of initiating their amoxicillin (OR = 2.77, 95% CI: 1.35
to 5.67). There was some evidence that the duration of the prescription was also associated with
amoxicillin initiation. Participants who were prescribed amoxicillin for eight days or more had
higher odds of initiating their amoxicillin than those prescribed for five days or less, though this
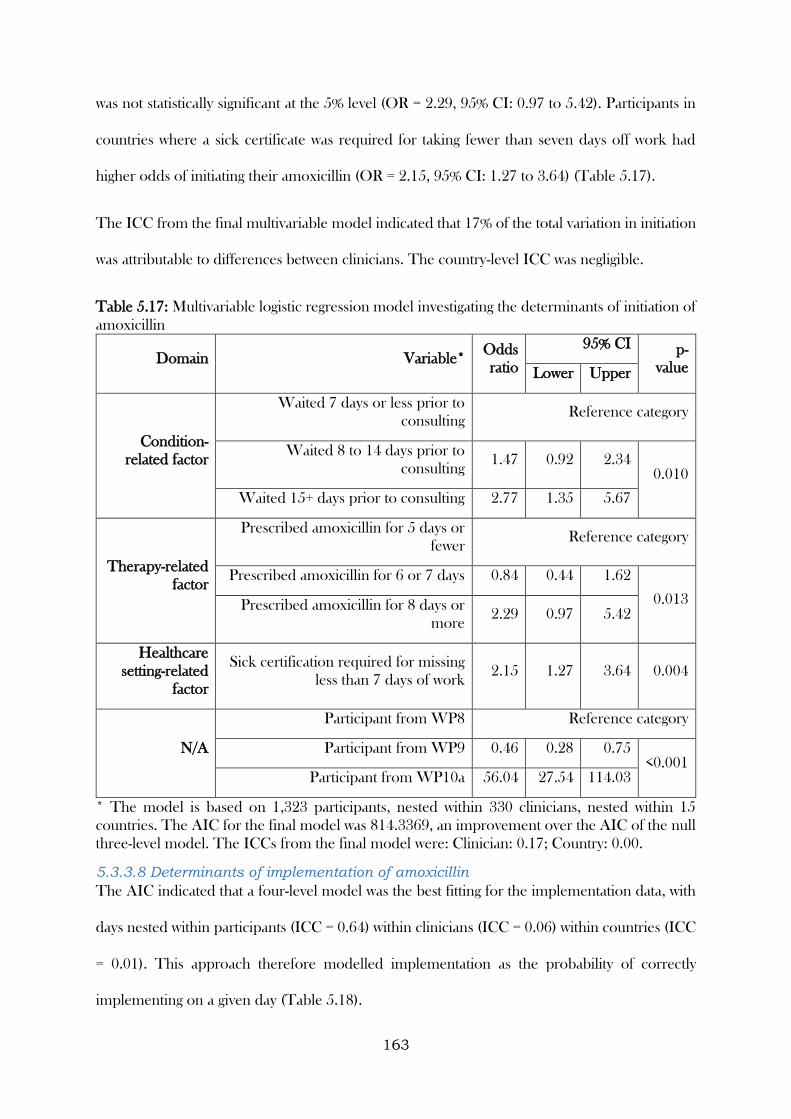
163
was not statistically significant at the 5% level (OR = 2.29, 95% CI: 0.97 to 5.42). Participants in
countries where a sick certificate was required for taking fewer than seven days off work had
higher odds of initiating their amoxicillin (OR = 2.15, 95% CI: 1.27 to 3.64) (Table 5.17).
The ICC from the final multivariable model indicated that 17% of the total variation in initiation
was attributable to differences between clinicians. The country-level ICC was negligible.
Table 5.17: Multivariable logistic regression model investigating the determinants of initiation of
amoxicillin
Domain Variable* Odds
ratio
95% CI p-
value Lower Upper
Condition-
related factor
Waited 7 days or less prior to
consulting Reference category
Waited 8 to 14 days prior to
consulting 1.47 0.92 2.34
0.010
Waited 15+ days prior to consulting 2.77 1.35 5.67
Therapy-related
factor
Prescribed amoxicillin for 5 days or
fewer Reference category
Prescribed amoxicillin for 6 or 7 days 0.84 0.44 1.62
0.013 Prescribed amoxicillin for 8 days or
more 2.29 0.97 5.42
Healthcare
setting-related
factor
Sick certification required for missing
less than 7 days of work 2.15 1.27 3.64 0.004
N/A
Participant from WP8 Reference category
Participant from WP9 0.46 0.28 0.75 <0.001
Participant from WP10a 56.04 27.54 114.03
* The model is based on 1,323 participants, nested within 330 clinicians, nested within 15
countries. The AIC for the final model was 814.3369, an improvement over the AIC of the null
three-level model. The ICCs from the final model were: Clinician: 0.17; Country: 0.00.
5.3.3.8 Determinants of implementation of amoxicillin
The AIC indicated that a four-level model was the best fitting for the implementation data, with
days nested within participants (ICC = 0.64) within clinicians (ICC = 0.06) within countries (ICC
= 0.01). This approach therefore modelled implementation as the probability of correctly
implementing on a given day (Table 5.18).
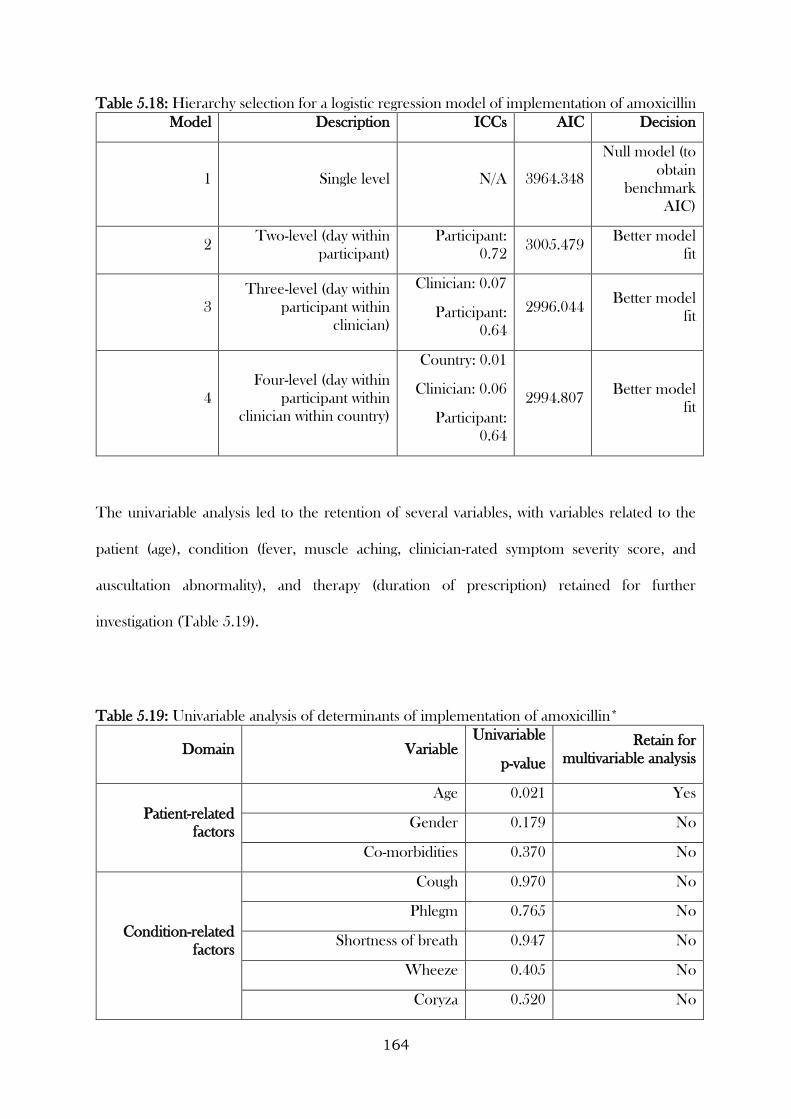
164
Table 5.18: Hierarchy selection for a logistic regression model of implementation of amoxicillin
Model Description ICCs AIC Decision
1 Single level N/A 3964.348
Null model (to
obtain
benchmark
AIC)
2 Two-level (day within
participant)
Participant:
0.72 3005.479
Better model
fit
3
Three-level (day within
participant within
clinician)
Clinician: 0.07
Participant:
0.64
2996.044 Better model
fit
4
Four-level (day within
participant within
clinician within country)
Country: 0.01
Clinician: 0.06
Participant:
0.64
2994.807 Better model
fit
The univariable analysis led to the retention of several variables, with variables related to the
patient (age), condition (fever, muscle aching, clinician-rated symptom severity score, and
auscultation abnormality), and therapy (duration of prescription) retained for further
investigation (Table 5.19).
Table 5.19: Univariable analysis of determinants of implementation of amoxicillin*
Domain Variable Univariable
p-value
Retain for
multivariable analysis
Patient-related
factors
Age 0.021 Yes
Gender 0.179 No
Co-morbidities 0.370 No
Condition-related
factors
Cough 0.970 No
Phlegm 0.765 No
Shortness of breath 0.947 No
Wheeze 0.405 No
Coryza 0.520 No
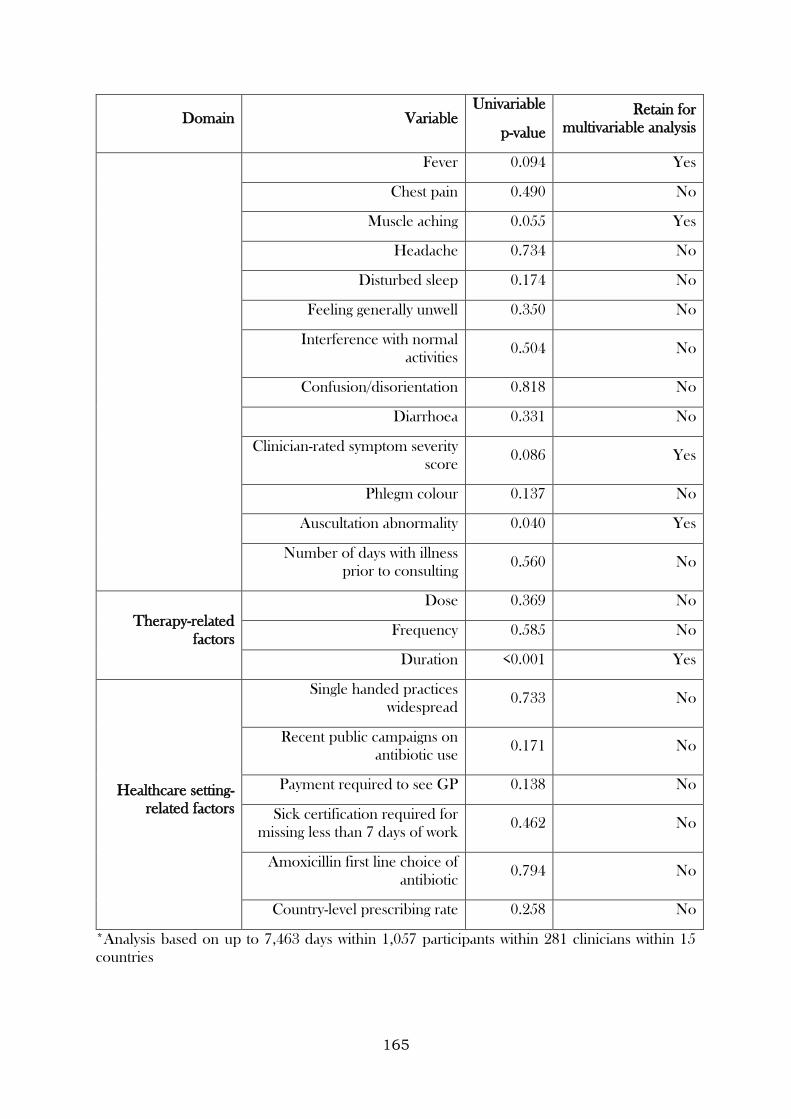
165
Domain Variable Univariable
p-value
Retain for
multivariable analysis
Fever 0.094 Yes
Chest pain 0.490 No
Muscle aching 0.055 Yes
Headache 0.734 No
Disturbed sleep 0.174 No
Feeling generally unwell 0.350 No
Interference with normal
activities 0.504 No
Confusion/disorientation 0.818 No
Diarrhoea 0.331 No
Clinician-rated symptom severity
score 0.086 Yes
Phlegm colour 0.137 No
Auscultation abnormality 0.040 Yes
Number of days with illness
prior to consulting 0.560 No
Therapy-related
factors
Dose 0.369 No
Frequency 0.585 No
Duration <0.001 Yes
Healthcare setting-
related factors
Single handed practices
widespread 0.733 No
Recent public campaigns on
antibiotic use 0.171 No
Payment required to see GP 0.138 No
Sick certification required for
missing less than 7 days of work 0.462 No
Amoxicillin first line choice of
antibiotic 0.794 No
Country-level prescribing rate 0.258 No
*Analysis based on up to 7,463 days within 1,057 participants within 281 clinicians within 15
countries
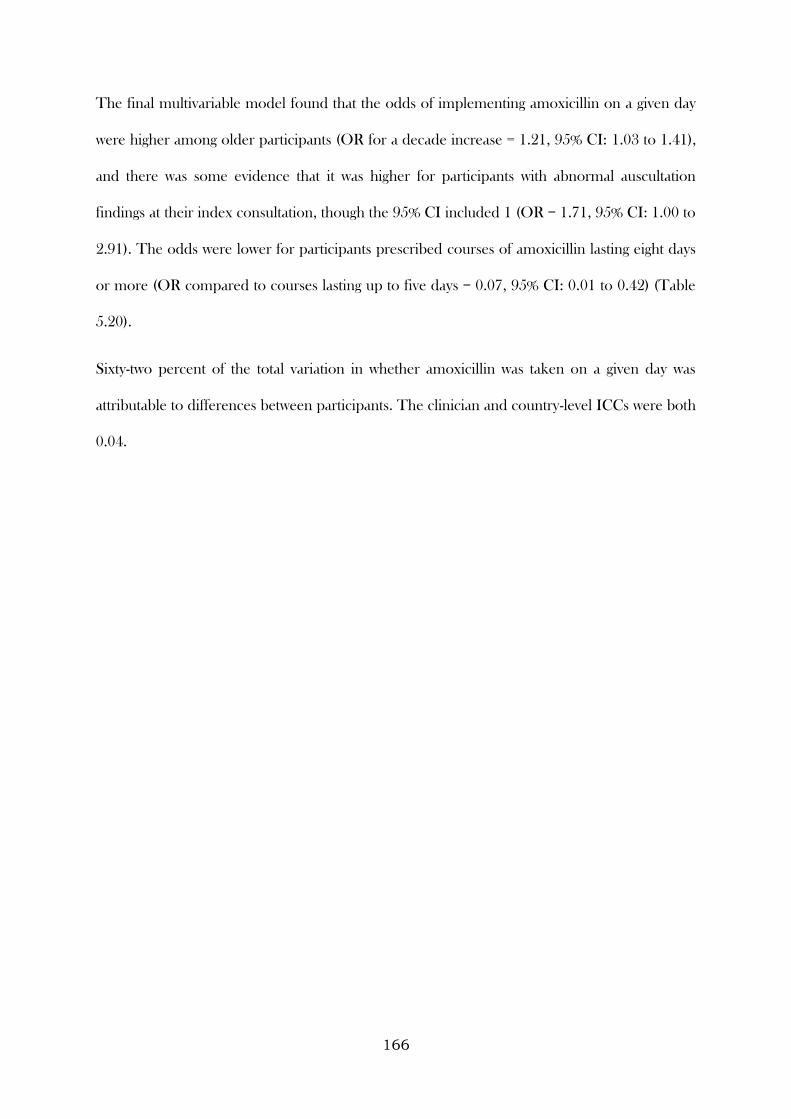
166
The final multivariable model found that the odds of implementing amoxicillin on a given day
were higher among older participants (OR for a decade increase = 1.21, 95% CI: 1.03 to 1.41),
and there was some evidence that it was higher for participants with abnormal auscultation
findings at their index consultation, though the 95% CI included 1 (OR = 1.71, 95% CI: 1.00 to
2.91). The odds were lower for participants prescribed courses of amoxicillin lasting eight days
or more (OR compared to courses lasting up to five days = 0.07, 95% CI: 0.01 to 0.42) (Table
5.20).
Sixty-two percent of the total variation in whether amoxicillin was taken on a given day was
attributable to differences between participants. The clinician and country-level ICCs were both
0.04.
167
Table 5.20: Four-level logistic regression model investigating the determinants of implementation
of amoxicillin
Variable* Odds ratio 95% CI
p-value Lower Upper
Age (per decade increase) 1.21 1.03 1.41 0.019
Auscultation abnormality† 1.71 1.00 2.91 0.050
Prescribed amoxicillin for 5 days or less Reference category
Prescribed amoxicillin for 6 or 7 days 1.18 0.22 6.25 <0.001
Prescribed amoxicillin for 8 days or more 0.07 0.01 0.42
Participant from WP8 Reference category
Participant from WP9 1.23 0.42 3.64 0.909
Participant from WP10a 1.18 0.48 2.88
* The model is based on 7,421 days nested within 1,054 participants, nested within 281 clinicians,
nested within 15 countries. The ICCs from the final model were: Participant: 0.62; Clinician:
0.04; Country: 0.04. † At least one of the following: diminished vesicular breathing, wheeze,
crackles, or rhonchi.
5.3.3.9 Determinants of time to discontinuation of amoxicillin
Attempts were made to conduct survival analyses that explicitly modelled the multilevel structure
of the data (i.e. frailty models). However, these models failed to converge for the majority of
candidate determinants. These analyses are therefore based on single-level Cox proportional
hazards models with standard errors corrected for clustering of participants within clinicians. In
addition, the final model was also fitted correcting for the clustering of participants within
countries, to explore the robustness of findings to alterations in how the standard errors were
corrected.
The univariable analysis led to the retention of determinants related to therapy factors (dose and
duration of prescription) and healthcare setting factors (participants from countries where single
handed practices were widespread and where recent public campaigns on antibiotic use had
taken place) (Table 5.21).
168
Findings from the final multivariable model indicated that longer courses were associated with a
longer time to discontinuation (HR for six to seven days compared to five days or less = 0.30,
95% CI: 0.17 to 0.55, HR for 8 days or more compared to five days or less = 0.19, 95% CI: 0.10
to 0.36). Participants from countries where single-handed practices were widespread were
associated with a shorter time until discontinuation (HR = 1.15, 95% CI: 1.03 to 1.28) (Table
5.22). These results persisted when the standard errors were corrected for clustering of
participants within countries (Table 5.23).
5.3.3.10 Differences across studies
As indicated by the forest plots, there was insufficient evidence to suggest that the determinants
found in the models for initiation, implementation, and discontinuation differed within the
individual studies (Figures 5.5, 5.6, and 5.7).
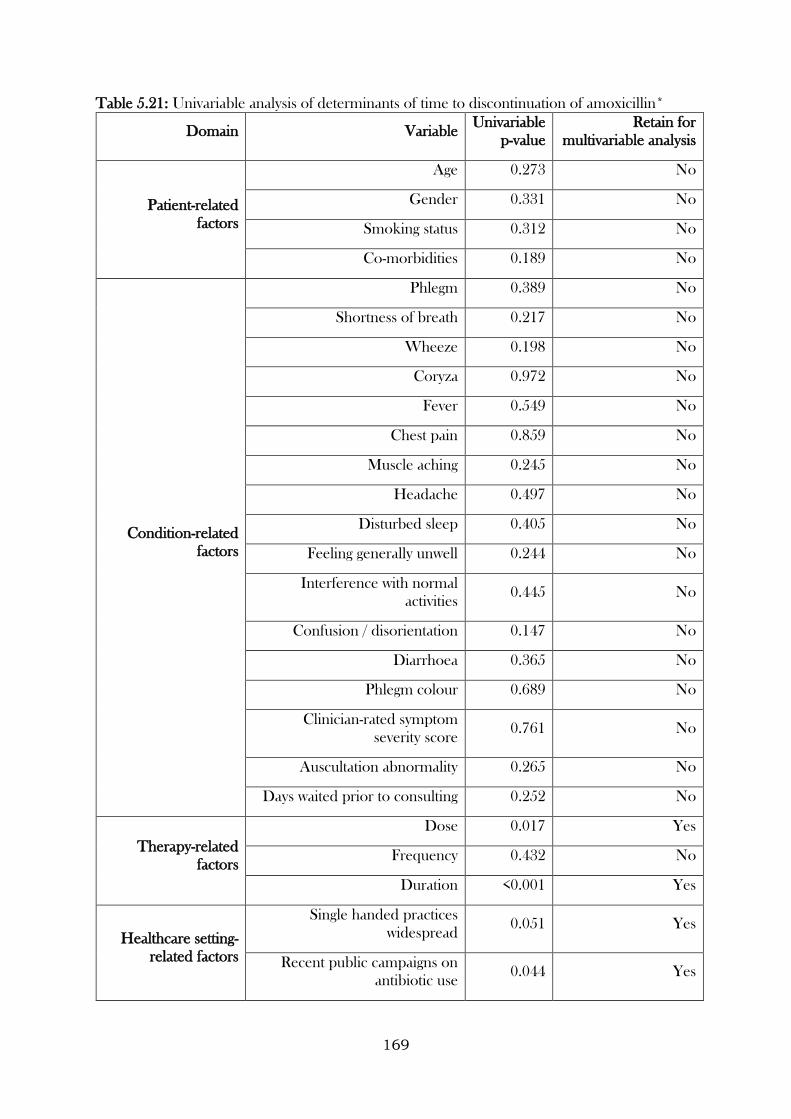
169
Table 5.21: Univariable analysis of determinants of time to discontinuation of amoxicillin*
Domain Variable Univariable
p-value
Retain for
multivariable analysis
Patient-related
factors
Age 0.273 No
Gender 0.331 No
Smoking status 0.312 No
Co-morbidities 0.189 No
Condition-related
factors
Phlegm 0.389 No
Shortness of breath 0.217 No
Wheeze 0.198 No
Coryza 0.972 No
Fever 0.549 No
Chest pain 0.859 No
Muscle aching 0.245 No
Headache 0.497 No
Disturbed sleep 0.405 No
Feeling generally unwell 0.244 No
Interference with normal
activities 0.445 No
Confusion / disorientation 0.147 No
Diarrhoea 0.365 No
Phlegm colour 0.689 No
Clinician-rated symptom
severity score 0.761 No
Auscultation abnormality 0.265 No
Days waited prior to consulting 0.252 No
Therapy-related
factors
Dose 0.017 Yes
Frequency 0.432 No
Duration <0.001 Yes
Healthcare setting-
related factors
Single handed practices
widespread 0.051 Yes
Recent public campaigns on
antibiotic use 0.044 Yes
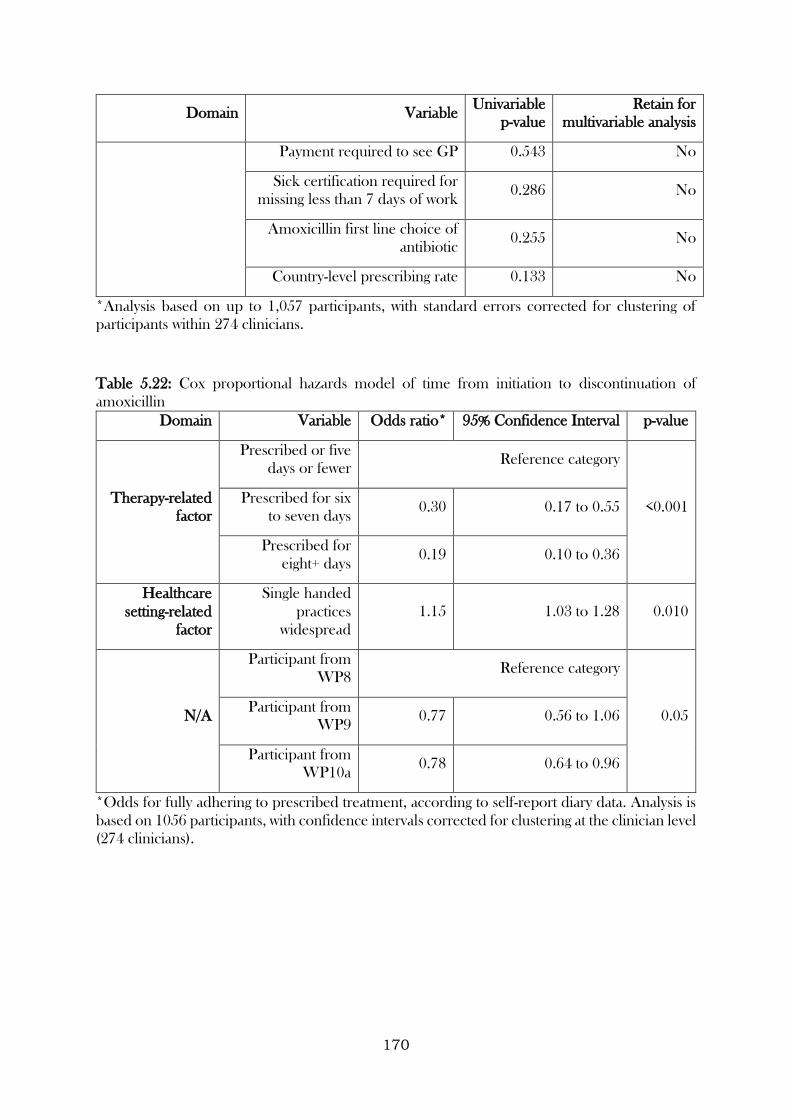
170
Domain Variable Univariable
p-value
Retain for
multivariable analysis
Payment required to see GP 0.543 No
Sick certification required for
missing less than 7 days of work 0.286 No
Amoxicillin first line choice of
antibiotic 0.255 No
Country-level prescribing rate 0.133 No
*Analysis based on up to 1,057 participants, with standard errors corrected for clustering of
participants within 274 clinicians.
Table 5.22: Cox proportional hazards model of time from initiation to discontinuation of
amoxicillin
Domain Variable Odds ratio* 95% Confidence Interval p-value
Therapy-related
factor
Prescribed or five
days or fewer Reference category
<0.001 Prescribed for six
to seven days 0.30 0.17 to 0.55
Prescribed for
eight+ days 0.19 0.10 to 0.36
Healthcare
setting-related
factor
Single handed
practices
widespread
1.15 1.03 to 1.28 0.010
N/A
Participant from
WP8 Reference category
0.05 Participant from
WP9 0.77 0.56 to 1.06
Participant from
WP10a 0.78 0.64 to 0.96
*Odds for fully adhering to prescribed treatment, according to self-report diary data. Analysis is
based on 1056 participants, with confidence intervals corrected for clustering at the clinician level
(274 clinicians).
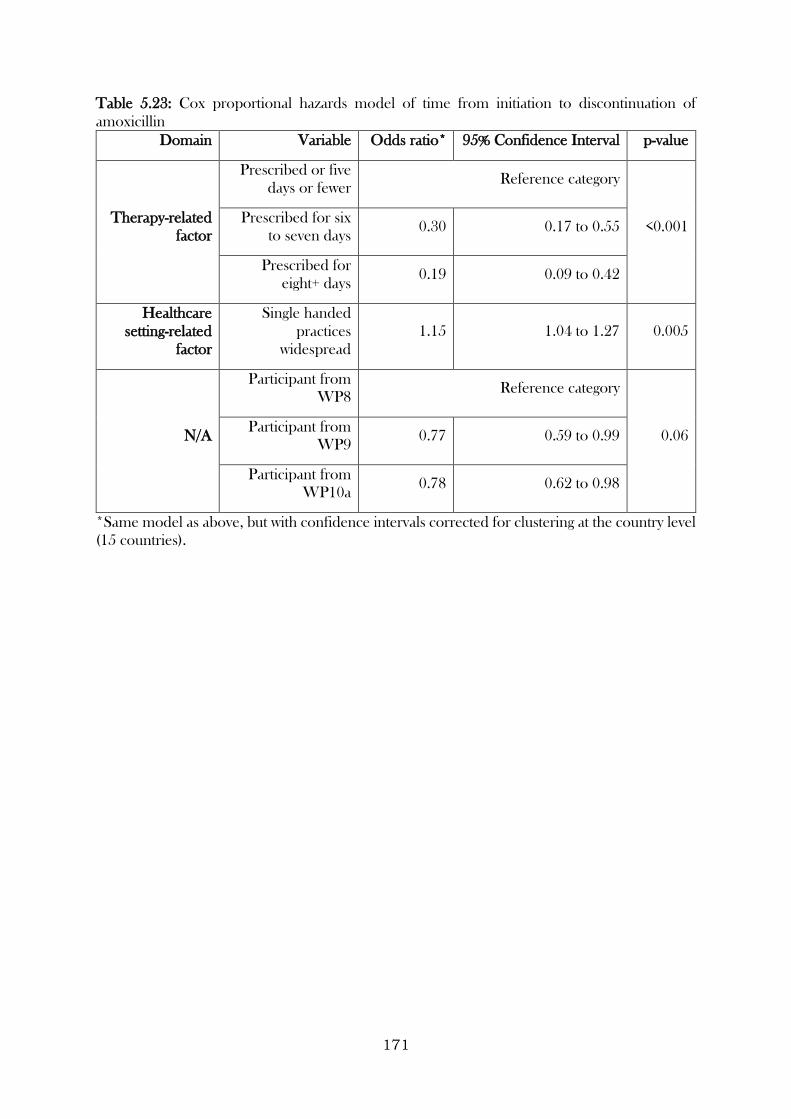
171
Table 5.23: Cox proportional hazards model of time from initiation to discontinuation of
amoxicillin
Domain Variable Odds ratio* 95% Confidence Interval p-value
Therapy-related
factor
Prescribed or five
days or fewer Reference category
<0.001 Prescribed for six
to seven days 0.30 0.17 to 0.55
Prescribed for
eight+ days 0.19 0.09 to 0.42
Healthcare
setting-related
factor
Single handed
practices
widespread
1.15 1.04 to 1.27 0.005
N/A
Participant from
WP8 Reference category
0.06 Participant from
WP9 0.77 0.59 to 0.99
Participant from
WP10a 0.78 0.62 to 0.98
*Same model as above, but with confidence intervals corrected for clustering at the country level
(15 countries).
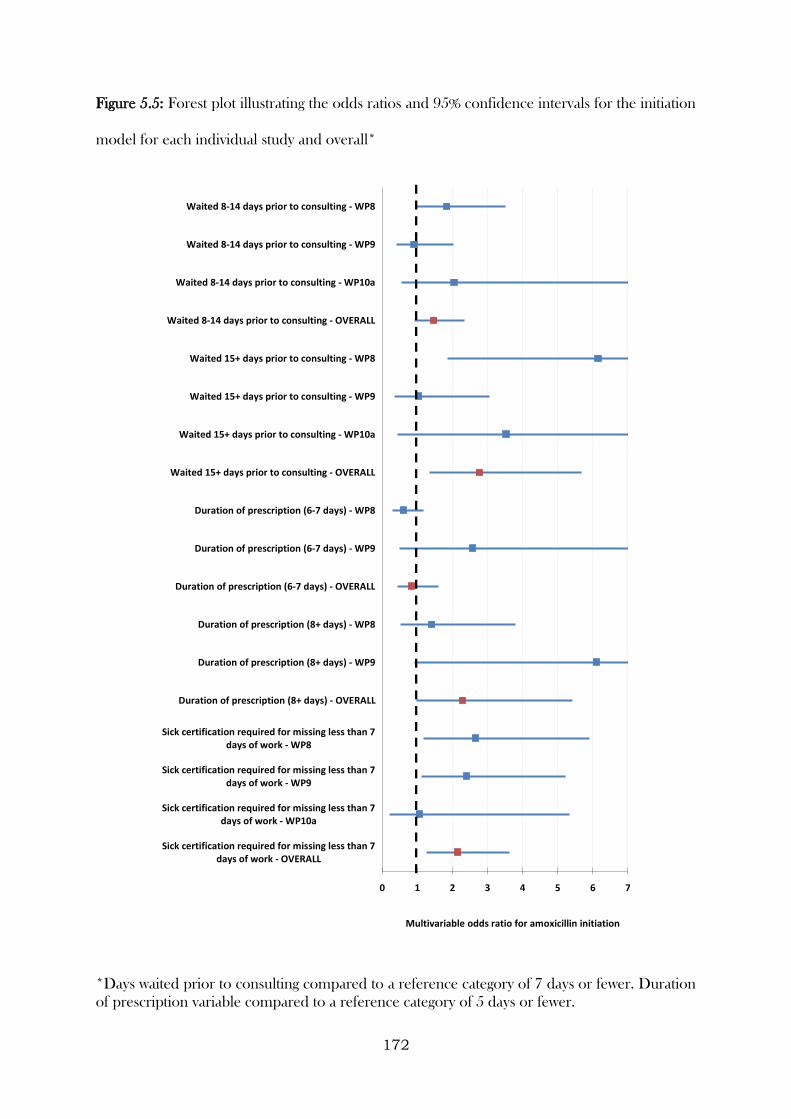
172
Figure 5.5: Forest plot illustrating the odds ratios and 95% confidence intervals for the initiation
model for each individual study and overall*
*Days waited prior to consulting compared to a reference category of 7 days or fewer. Duration
of prescription variable compared to a reference category of 5 days or fewer.
0 1 2 3 4 5 6 7
Sick certification required for missing less than 7days of work - OVERALL
Sick certification required for missing less than 7days of work - WP10a
Sick certification required for missing less than 7days of work - WP9
Sick certification required for missing less than 7days of work - WP8
Duration of prescription (8+ days) - OVERALL
Duration of prescription (8+ days) - WP9
Duration of prescription (8+ days) - WP8
Duration of prescription (6-7 days) - OVERALL
Duration of prescription (6-7 days) - WP9
Duration of prescription (6-7 days) - WP8
Waited 15+ days prior to consulting - OVERALL
Waited 15+ days prior to consulting - WP10a
Waited 15+ days prior to consulting - WP9
Waited 15+ days prior to consulting - WP8
Waited 8-14 days prior to consulting - OVERALL
Waited 8-14 days prior to consulting - WP10a
Waited 8-14 days prior to consulting - WP9
Waited 8-14 days prior to consulting - WP8
Multivariable odds ratio for amoxicillin initiation
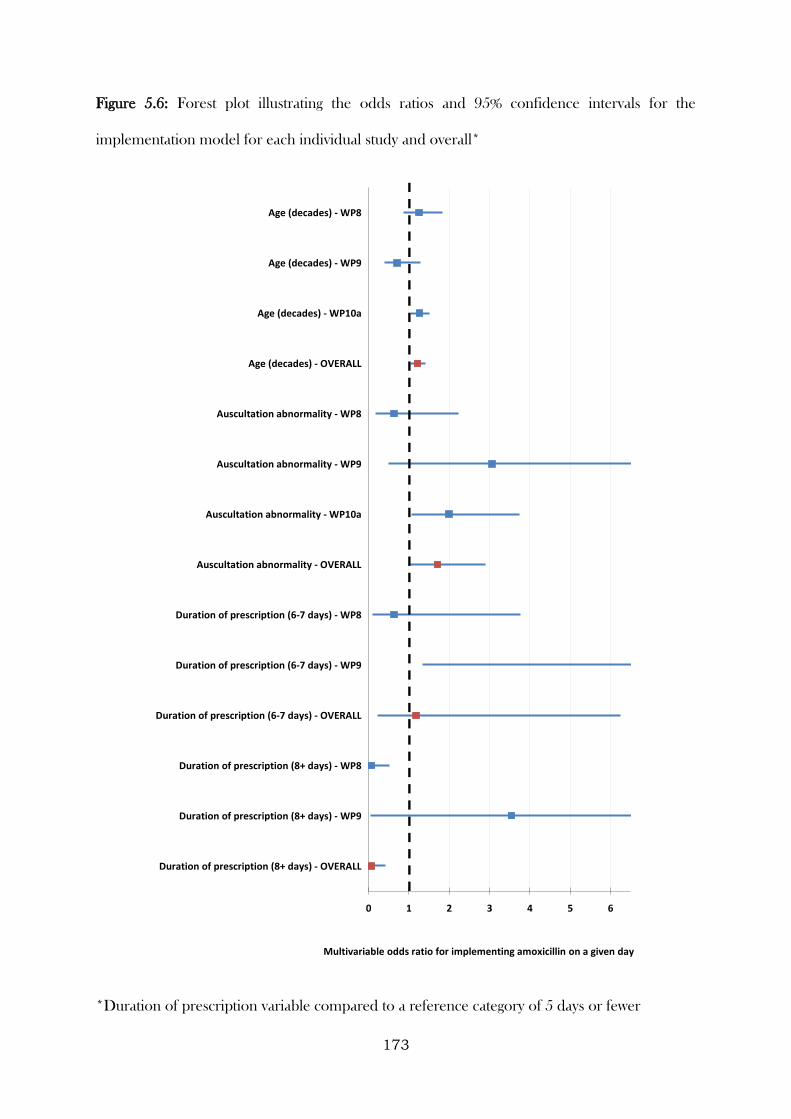
173
Figure 5.6: Forest plot illustrating the odds ratios and 95% confidence intervals for the
implementation model for each individual study and overall*
*Duration of prescription variable compared to a reference category of 5 days or fewer
0 1 2 3 4 5 6
Duration of prescription (8+ days) - OVERALL
Duration of prescription (8+ days) - WP9
Duration of prescription (8+ days) - WP8
Duration of prescription (6-7 days) - OVERALL
Duration of prescription (6-7 days) - WP9
Duration of prescription (6-7 days) - WP8
Auscultation abnormality - OVERALL
Auscultation abnormality - WP10a
Auscultation abnormality - WP9
Auscultation abnormality - WP8
Age (decades) - OVERALL
Age (decades) - WP10a
Age (decades) - WP9
Age (decades) - WP8
Multivariable odds ratio for implementing amoxicillin on a given day
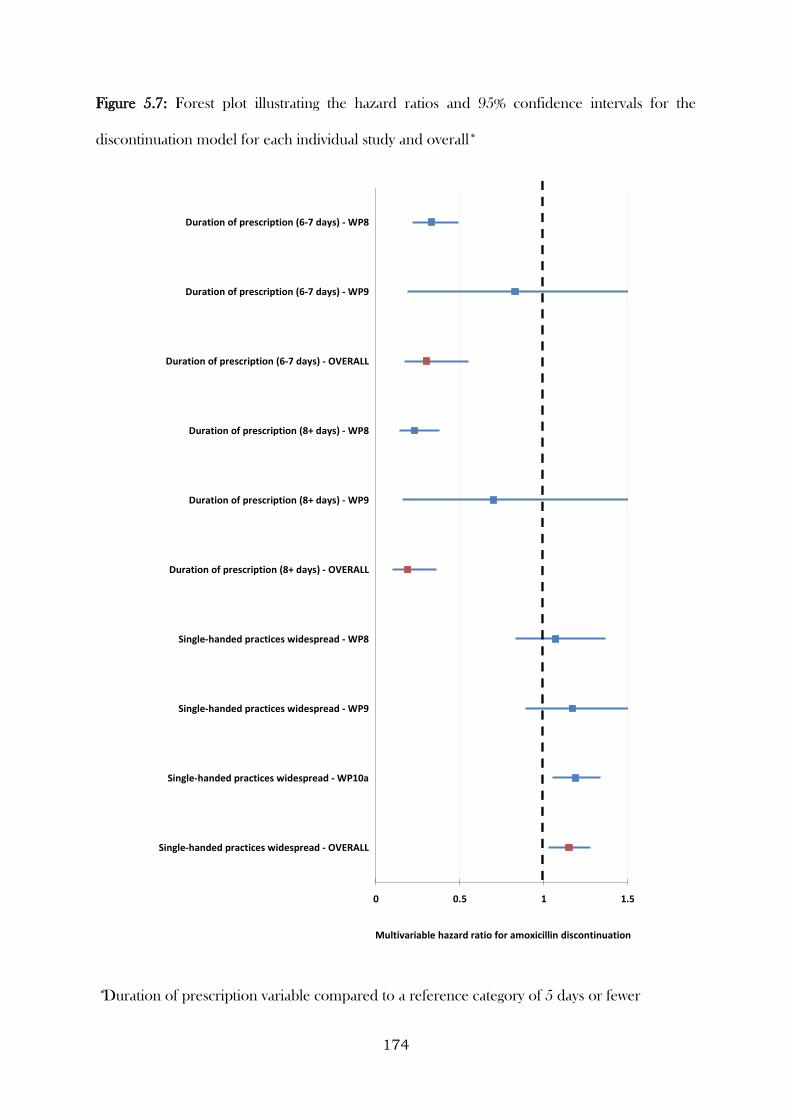
174
Figure 5.7: Forest plot illustrating the hazard ratios and 95% confidence intervals for the
discontinuation model for each individual study and overall*
*Duration of prescription variable compared to a reference category of 5 days or fewer
0 0.5 1 1.5
Single-handed practices widespread - OVERALL
Single-handed practices widespread - WP10a
Single-handed practices widespread - WP9
Single-handed practices widespread - WP8
Duration of prescription (8+ days) - OVERALL
Duration of prescription (8+ days) - WP9
Duration of prescription (8+ days) - WP8
Duration of prescription (6-7 days) - OVERALL
Duration of prescription (6-7 days) - WP9
Duration of prescription (6-7 days) - WP8
Multivariable hazard ratio for amoxicillin discontinuation
175
5.4 Discussion
5.4.1 Summary
In this Chapter, several methods for modelling the determinants of adherence to medication
were investigated. Data from the CODA study were used to compare the determinants of
adherence to treatment across self-report, tablet count, and electronic monitoring data. Three
clinical conditions were considered. One short-term condition (lower-respiratory-tract infection),
and two long-term conditions (ulcerative colitis and breast cancer with bone metastases). Data
from three studies, two observational and one trial, were compared and combined in order to
investigate whether (and how) determinants differed across study designs. Several domains of
determinants of medication adherence were also considered throughout the Chapter. Where
domains were included at a healthcare professional or healthcare setting-level, modelling
approaches were considered that appropriately accounted for this. Finally, for the GRACE and
ZICE studies, a comparison was made between modelling adherence as a single combined
variable and modelling it based on distinct processes (e.g. initiation, implementation, and
discontinuation).
5.4.2 Learning points
1. Using the CODA study to compare the determinants of adherence across different types
of measures highlighted the importance of considering the uses and limitations of the
choice of measure, and how that should depend on the treatment under consideration.
Using the CODA data, adherence was found to be strongly associated with allocated
regimen for both self-report and electronic monitoring data, but not for tablet count data.
As the regimens were three tablets once daily or three tablets in divided doses (therefore
both groups are required to take the same number of tablets overall), this is hardly
surprising. Self-report and electronic monitoring data can inform us about patterns in
adherence, from which we can infer consumption, but tablet count data can only do the
176
latter. While it still may be useful to record consumption using tablet count data in
instances such as this, it is inadvisable for such a measure to be the primary adherence
measure, particularly if the aim is for participants to maintain the regimen to which they
were allocated.
2. The complexity of treatment was the one determinant that was consistently associated
with adherence across all studies. Participants in the CODA study were less likely to
adhere when allocated to take their medication in divided doses (rather than at one point
during the day), those in the ZICE study were less likely to adhere when allocated to
intravenous zoledronic acid that required hospital attendance to maintain (rather than
daily oral medication that could be consumed at home), and those in the GRACE studies
were less likely to adhere if they were prescribed long courses of amoxicillin.
3. While the previous learning point may indicate that treatments should be as simple as
possible, this needs to be balanced against the consequence of non-adherence and how
this may be amplified in treatments that are simplified. An example of this can be seen
in the ZICE study, where despite implementation being worse for those prescribed
intravenous zoledronic acid (compared to those prescribed oral ibandronic acid), the
latter was still inferior to the former (as I will describe in the next Chapter).
4. While the three GRACE studies comprised two observational studies and the active arm
of a double blind placebo-controlled trial, and it was found that the samples differed
according to their participant, illness, and prescribing characteristics, and adherence
differed between studies considerably (ranging from 27% to 87%), the mechanisms by
which adherence / initiation / implementation / time to discontinuation occurred were
generally consistent across studies. Indeed, all models controlled for study as a fixed
effect, and determinants of adherence and each of the elements were found that were
therefore independent of study/ study type.
177
5. Multilevel analysis enabled determinants related to individual characteristics (e.g. the
person, their condition, their treatment) to be simultaneously account for with
determinants related to healthcare professionals and healthcare settings. By appropriately
accounting for the data hierarchy, correct inferences could be drawn regarding the
magnitude of the influence that each determinant had. In the GRACE studies, the
amount of clustering at the clinician-level was high, perhaps a quantitative indication of
therapeutic alliance so often reported in qualitative research as important for achieving
high levels of adherence (see Chapter 2). Prescribers, and their relationship and
interaction with patients, would appear to be an important area for further investigation
with regards to how this influences adherence to medication.
6. Separating out adherence into distinct processes enabled different sets of determinants
to be considered. The processes are distinct, and indeed different determinants were
associated with each. Such nuances would have been missed, had adherence been
considered as a single variable. While the analysis of initiation and implementation were
performed separately, in essence the approach taken can be viewed as a hurdle model
(Mullahy, 1986), where initiation was considered first as a binary variable, and then in
those who initiate, implementation was considered consequently. This approach made
fuller use of the available data, and allowed for a better assessment of where the variability
in the data lie. The distinction between adherence when considered as a single variable
and when it was separated out into its elements was clearer for the GRACE study than it
was for ZICE, as almost all participants in the ZICE study initiated treatment. Clearly,
the level of adherence and each adherence element needs inspecting before determining
the necessity of this approach.
7. Following from the previous point, while I could see the value of investigating the
determinants of initiation and implementation of amoxicillin (that is, they are elements

178
that are desirable to intervene on), there was arguably less necessity in investigating the
determinants of time from initiation to discontinuation (regardless of how well the
amoxicillin was implemented). There needs to be a clear rationale behind the decision
around which elements are of interest.
179
CHAPTER 6: Adjusting Findings of Randomised
Controlled Trials for Medication Non-Adherence: The
Use of Randomisation-Based Efficacy Estimators
6.1 Introduction
Chapters 4 and 5 of this thesis focused on the investigation of different modes of medication
adherence measurement, and methods for modelling the determinants of medication non-
adherence, in clinical research. While these topics are crucial in the study of medication
adherence, the consumption of the majority of medicine relies on individual decision making,
and inevitably non-adherence will occur, even in clinical research. When there is interest in the
relationship between use of medication and clinical outcomes (e.g. use of antidepressants and
incidents of self-harm, use of antibiotics and time to recovery from pneumonia, etc.), this interest
generally centres on determining the causative nature of the relationship. Determining the causal
nature of a treatment is not straightforward even in randomised controlled trials (RCTs), where
participants are allocated to treatment groups at random, as the choice to consume the allocated
treatment is unlikely to be determined at random (i.e. independent of both observed and
unobserved confounders). While this is an issue for all RCTs, the problem is compounded for
RCTs that are designed to evaluate whether a new treatment is equivalent to (or no worse than)
an existing treatment. Traditional approaches for investigating these relationships in RCTs make
implicit assumptions (e.g. medication non-adherence occurs completely at random) which are
likely implausible in practice. Approaches that are randomisation-respecting exist, and are
becoming increasingly popular, but are generally only reported in specialist methodological
journals.
The aims of this Chapter, therefore, is to explore the use of randomisation-based efficacy
estimators for adjusting findings of RCTs for medication non-adherence, and the feasibility of
their implementation for different trial designs.
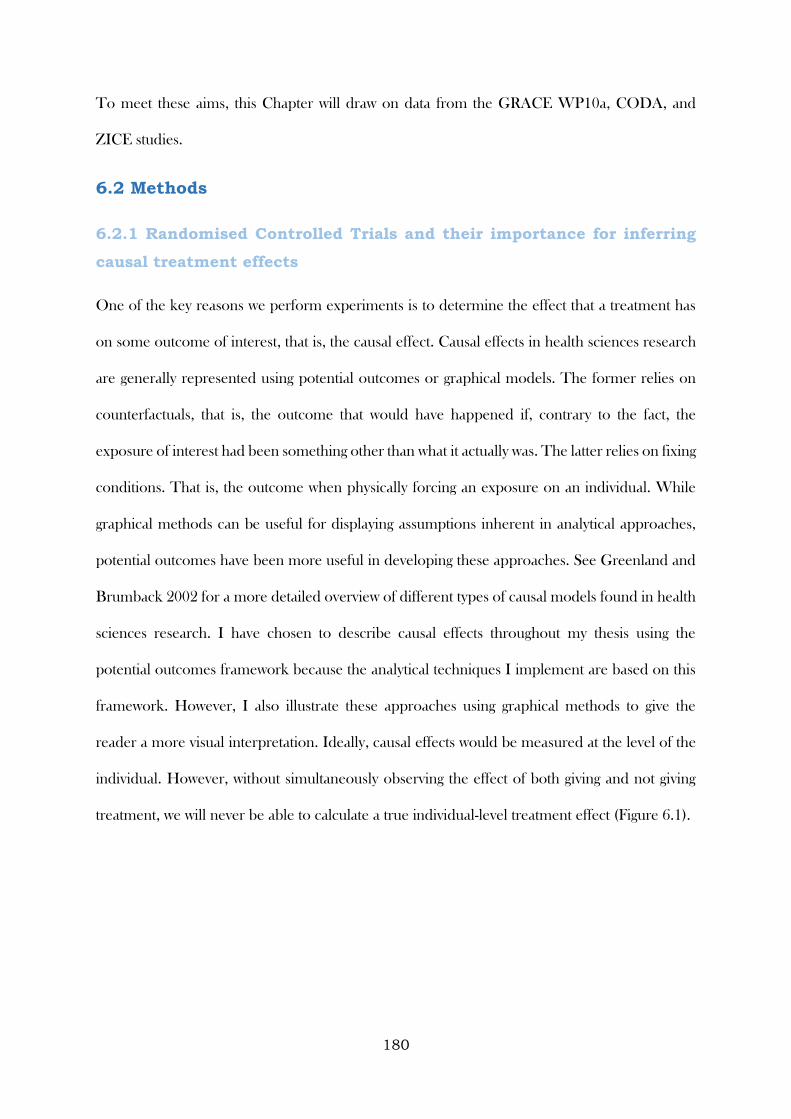
180
To meet these aims, this Chapter will draw on data from the GRACE WP10a, CODA, and
ZICE studies.
6.2 Methods
6.2.1 Randomised Controlled Trials and their importance for inferring
causal treatment effects
One of the key reasons we perform experiments is to determine the effect that a treatment has
on some outcome of interest, that is, the causal effect. Causal effects in health sciences research
are generally represented using potential outcomes or graphical models. The former relies on
counterfactuals, that is, the outcome that would have happened if, contrary to the fact, the
exposure of interest had been something other than what it actually was. The latter relies on fixing
conditions. That is, the outcome when physically forcing an exposure on an individual. While
graphical methods can be useful for displaying assumptions inherent in analytical approaches,
potential outcomes have been more useful in developing these approaches. See Greenland and
Brumback 2002 for a more detailed overview of different types of causal models found in health
sciences research. I have chosen to describe causal effects throughout my thesis using the
potential outcomes framework because the analytical techniques I implement are based on this
framework. However, I also illustrate these approaches using graphical methods to give the
reader a more visual interpretation. Ideally, causal effects would be measured at the level of the
individual. However, without simultaneously observing the effect of both giving and not giving
treatment, we will never be able to calculate a true individual-level treatment effect (Figure 6.1).

181
Figure 6.1: Illustration of an individual-level treatment effect
Instead of striving to directly calculate these individual-level effects, we instead calculate
population-level (or average) treatment effects, where the average outcomes of individuals in the
treated group are compared to those in the untreated group, and we use this calculation as an
estimate for the individual-level effects. For this estimate to be valid, the choice to be in the
treated / untreated group must be made at random (Figure 6.2). If the choice is not made at
random, the estimate is likely to be biased unless the decision to choose one group over another
(i.e. the selection mechanism) is measured and adjusted for. This is unlikely in most
circumstances, where typically some variables that contribute to the selection mechanism will
remain unmeasured. (Lewis, 1999)
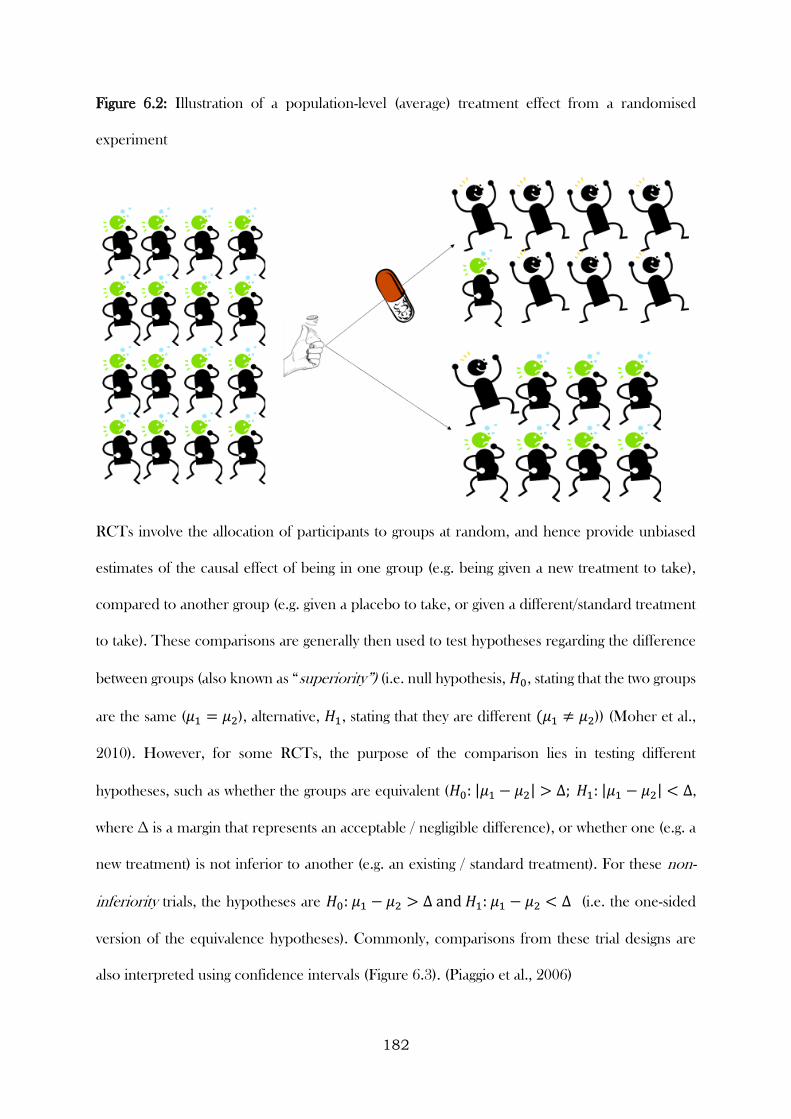
182
Figure 6.2: Illustration of a population-level (average) treatment effect from a randomised
experiment
RCTs involve the allocation of participants to groups at random, and hence provide unbiased
estimates of the causal effect of being in one group (e.g. being given a new treatment to take),
compared to another group (e.g. given a placebo to take, or given a different/standard treatment
to take). These comparisons are generally then used to test hypotheses regarding the difference
between groups (also known as “superiority”) (i.e. null hypothesis, 𝐻0, stating that the two groups
are the same (𝜇1 = 𝜇2), alternative, 𝐻1, stating that they are different (𝜇1 ≠ 𝜇2)) (Moher et al.,
2010). However, for some RCTs, the purpose of the comparison lies in testing different
hypotheses, such as whether the groups are equivalent (𝐻0: |𝜇1 − 𝜇2| > ∆; 𝐻1: |𝜇1 − 𝜇2| < ∆,
where ∆ is a margin that represents an acceptable / negligible difference), or whether one (e.g. a
new treatment) is not inferior to another (e.g. an existing / standard treatment). For these non-
inferiority trials, the hypotheses are 𝐻0: 𝜇1 − 𝜇2 > ∆ and 𝐻1: 𝜇1 − 𝜇2 < ∆ (i.e. the one-sided
version of the equivalence hypotheses). Commonly, comparisons from these trial designs are
also interpreted using confidence intervals (Figure 6.3). (Piaggio et al., 2006)
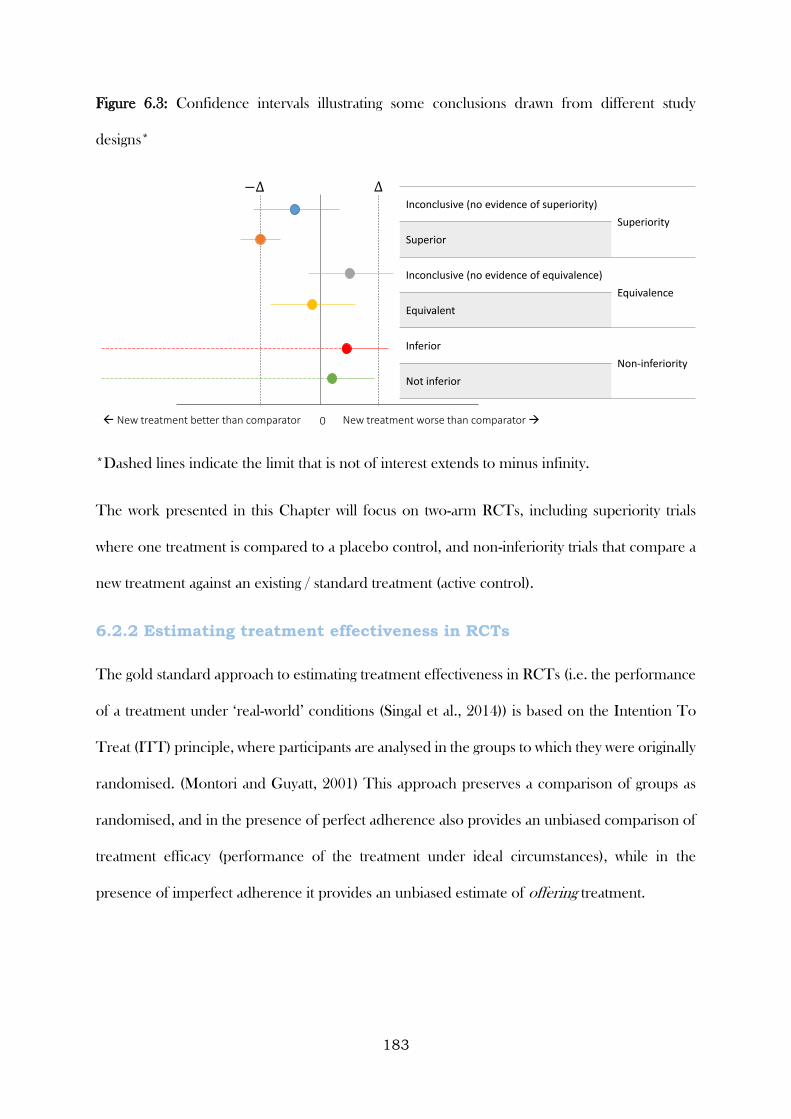
183
Figure 6.3: Confidence intervals illustrating some conclusions drawn from different study
designs*
*Dashed lines indicate the limit that is not of interest extends to minus infinity.
The work presented in this Chapter will focus on two-arm RCTs, including superiority trials
where one treatment is compared to a placebo control, and non-inferiority trials that compare a
new treatment against an existing / standard treatment (active control).
6.2.2 Estimating treatment effectiveness in RCTs
The gold standard approach to estimating treatment effectiveness in RCTs (i.e. the performance
of a treatment under ‘real-world’ conditions (Singal et al., 2014)) is based on the Intention To
Treat (ITT) principle, where participants are analysed in the groups to which they were originally
randomised. (Montori and Guyatt, 2001) This approach preserves a comparison of groups as
randomised, and in the presence of perfect adherence also provides an unbiased comparison of
treatment efficacy (performance of the treatment under ideal circumstances), while in the
presence of imperfect adherence it provides an unbiased estimate of offering treatment.
0 New treatment worse than comparator New treatment better than comparator
Inconclusive (no evidence of superiority)
Superiority
Superior
Inconclusive (no evidence of equivalence)
Equivalence
Equivalent
Inferior
Non-inferiority
Not inferior
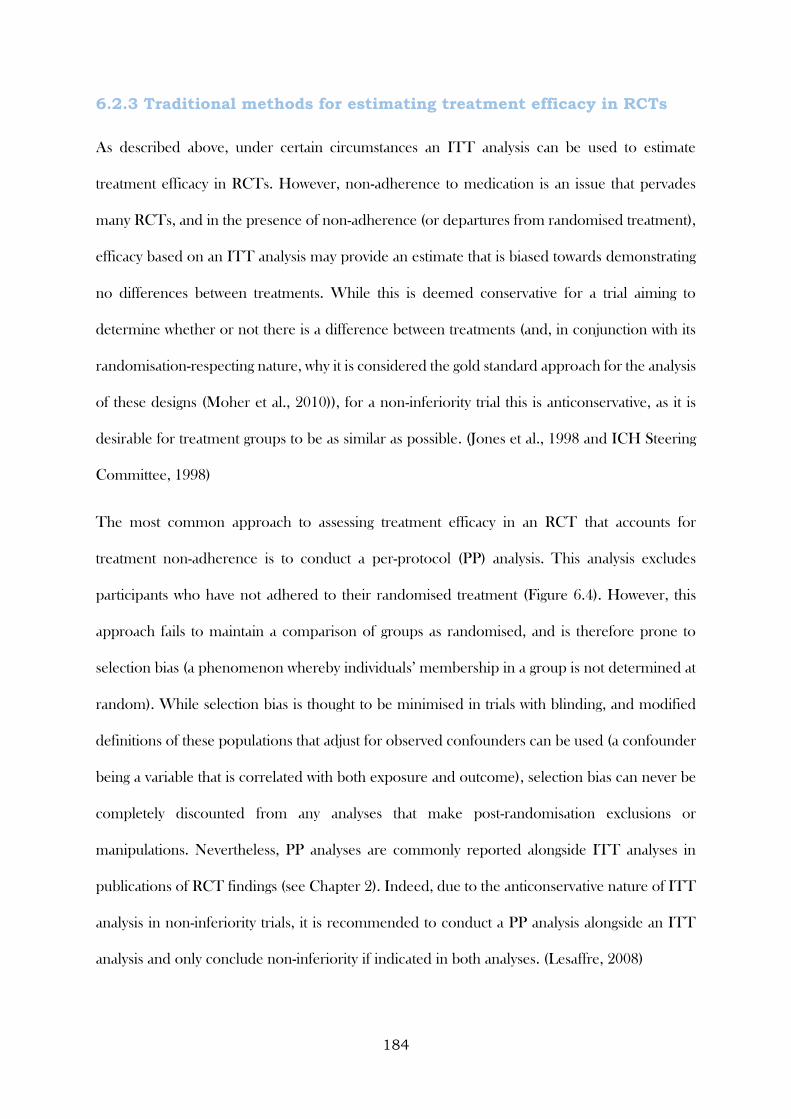
184
6.2.3 Traditional methods for estimating treatment efficacy in RCTs
As described above, under certain circumstances an ITT analysis can be used to estimate
treatment efficacy in RCTs. However, non-adherence to medication is an issue that pervades
many RCTs, and in the presence of non-adherence (or departures from randomised treatment),
efficacy based on an ITT analysis may provide an estimate that is biased towards demonstrating
no differences between treatments. While this is deemed conservative for a trial aiming to
determine whether or not there is a difference between treatments (and, in conjunction with its
randomisation-respecting nature, why it is considered the gold standard approach for the analysis
of these designs (Moher et al., 2010)), for a non-inferiority trial this is anticonservative, as it is
desirable for treatment groups to be as similar as possible. (Jones et al., 1998 and ICH Steering
Committee, 1998)
The most common approach to assessing treatment efficacy in an RCT that accounts for
treatment non-adherence is to conduct a per-protocol (PP) analysis. This analysis excludes
participants who have not adhered to their randomised treatment (Figure 6.4). However, this
approach fails to maintain a comparison of groups as randomised, and is therefore prone to
selection bias (a phenomenon whereby individuals’ membership in a group is not determined at
random). While selection bias is thought to be minimised in trials with blinding, and modified
definitions of these populations that adjust for observed confounders can be used (a confounder
being a variable that is correlated with both exposure and outcome), selection bias can never be
completely discounted from any analyses that make post-randomisation exclusions or
manipulations. Nevertheless, PP analyses are commonly reported alongside ITT analyses in
publications of RCT findings (see Chapter 2). Indeed, due to the anticonservative nature of ITT
analysis in non-inferiority trials, it is recommended to conduct a PP analysis alongside an ITT
analysis and only conclude non-inferiority if indicated in both analyses. (Lesaffre, 2008)
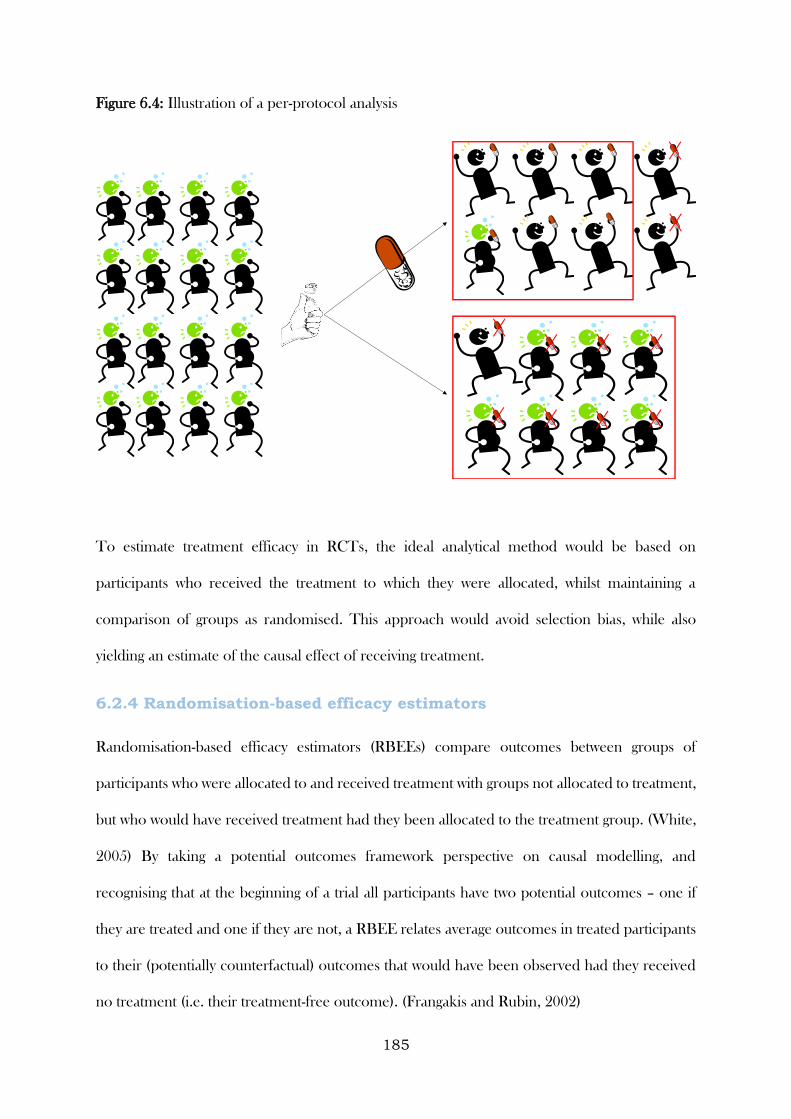
185
Figure 6.4: Illustration of a per-protocol analysis
To estimate treatment efficacy in RCTs, the ideal analytical method would be based on
participants who received the treatment to which they were allocated, whilst maintaining a
comparison of groups as randomised. This approach would avoid selection bias, while also
yielding an estimate of the causal effect of receiving treatment.
6.2.4 Randomisation-based efficacy estimators
Randomisation-based efficacy estimators (RBEEs) compare outcomes between groups of
participants who were allocated to and received treatment with groups not allocated to treatment,
but who would have received treatment had they been allocated to the treatment group. (White,
2005) By taking a potential outcomes framework perspective on causal modelling, and
recognising that at the beginning of a trial all participants have two potential outcomes – one if
they are treated and one if they are not, a RBEE relates average outcomes in treated participants
to their (potentially counterfactual) outcomes that would have been observed had they received
no treatment (i.e. their treatment-free outcome). (Frangakis and Rubin, 2002)
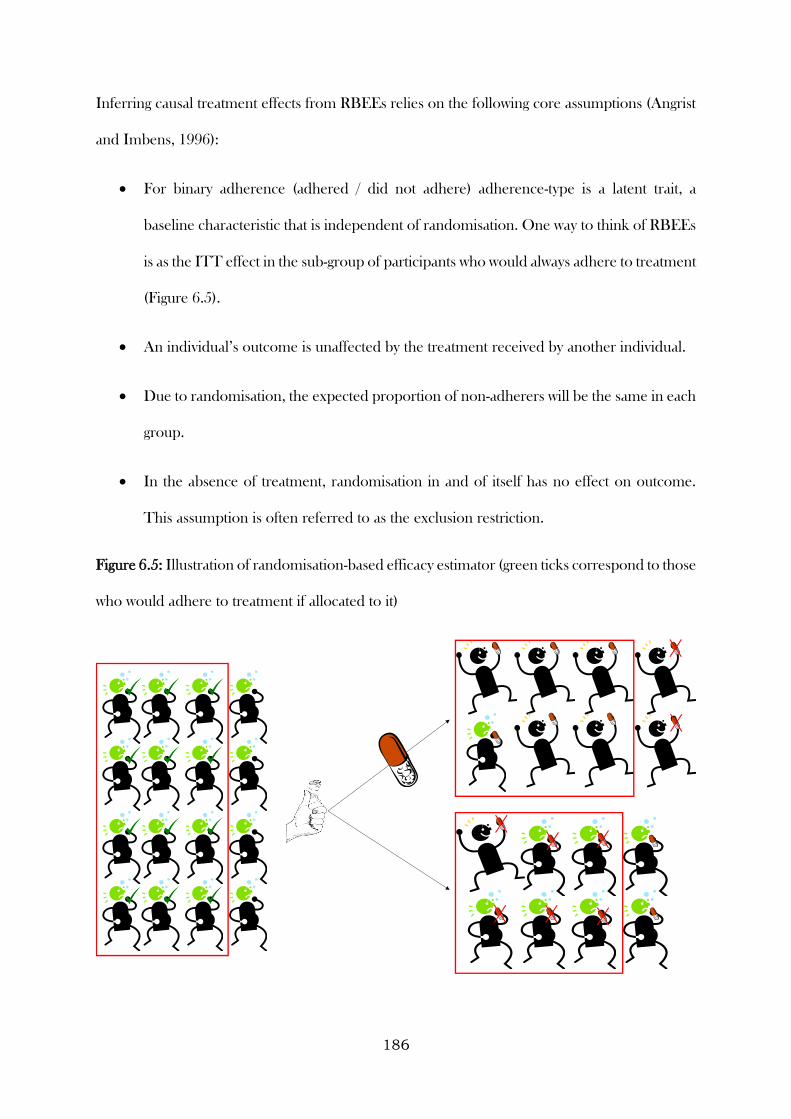
186
Inferring causal treatment effects from RBEEs relies on the following core assumptions (Angrist
and Imbens, 1996):
For binary adherence (adhered / did not adhere) adherence-type is a latent trait, a
baseline characteristic that is independent of randomisation. One way to think of RBEEs
is as the ITT effect in the sub-group of participants who would always adhere to treatment
(Figure 6.5).
An individual’s outcome is unaffected by the treatment received by another individual.
Due to randomisation, the expected proportion of non-adherers will be the same in each
group.
In the absence of treatment, randomisation in and of itself has no effect on outcome.
This assumption is often referred to as the exclusion restriction.
Figure 6.5: Illustration of randomisation-based efficacy estimator (green ticks correspond to those
who would adhere to treatment if allocated to it)
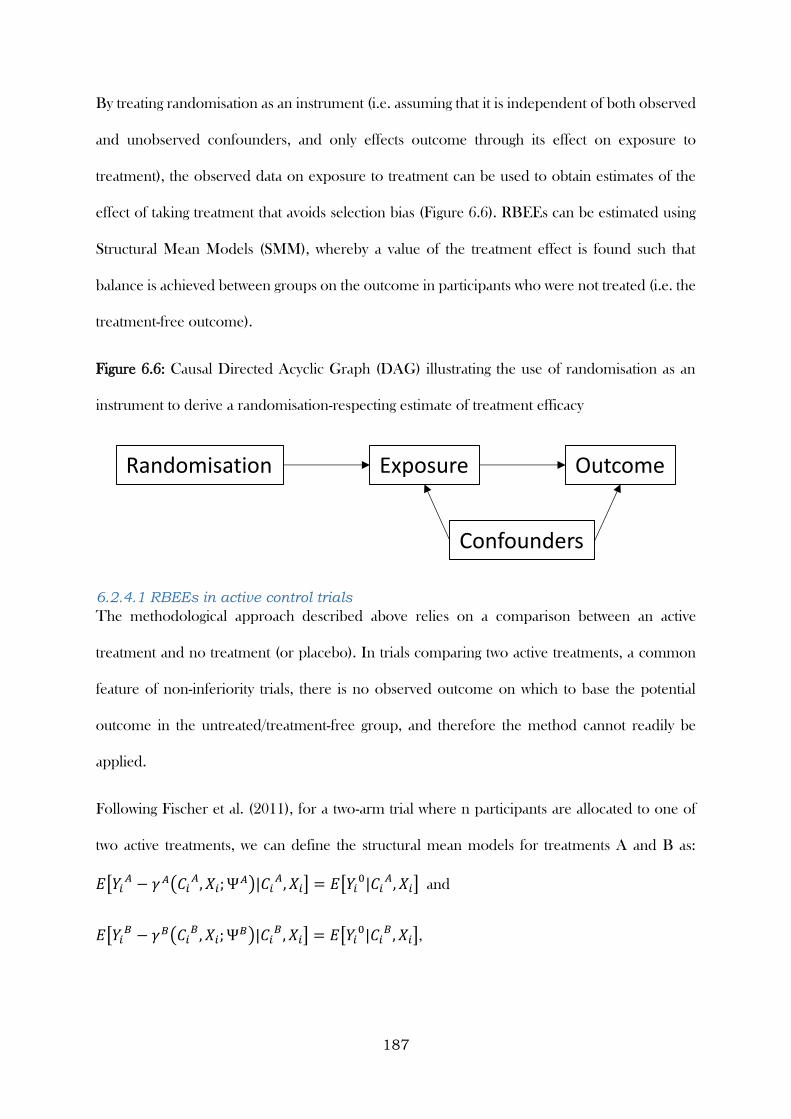
187
By treating randomisation as an instrument (i.e. assuming that it is independent of both observed
and unobserved confounders, and only effects outcome through its effect on exposure to
treatment), the observed data on exposure to treatment can be used to obtain estimates of the
effect of taking treatment that avoids selection bias (Figure 6.6). RBEEs can be estimated using
Structural Mean Models (SMM), whereby a value of the treatment effect is found such that
balance is achieved between groups on the outcome in participants who were not treated (i.e. the
treatment-free outcome).
Figure 6.6: Causal Directed Acyclic Graph (DAG) illustrating the use of randomisation as an
instrument to derive a randomisation-respecting estimate of treatment efficacy
6.2.4.1 RBEEs in active control trials
The methodological approach described above relies on a comparison between an active
treatment and no treatment (or placebo). In trials comparing two active treatments, a common
feature of non-inferiority trials, there is no observed outcome on which to base the potential
outcome in the untreated/treatment-free group, and therefore the method cannot readily be
applied.
Following Fischer et al. (2011), for a two-arm trial where n participants are allocated to one of
two active treatments, we can define the structural mean models for treatments A and B as:
𝐸[𝑌𝑖𝐴 − 𝛾 𝐴(𝐶𝑖
𝐴, 𝑋𝑖; Ψ𝐴)|𝐶𝑖𝐴, 𝑋𝑖] = 𝐸[𝑌𝑖
0|𝐶𝑖𝐴, 𝑋𝑖] and
𝐸[𝑌𝑖𝐵 − 𝛾𝐵(𝐶𝑖
𝐵, 𝑋𝑖; Ψ𝐵)|𝐶𝑖𝐵, 𝑋𝑖] = 𝐸[𝑌𝑖
0|𝐶𝑖𝐵, 𝑋𝑖],
Randomisation Exposure
Confounders
Outcome

188
where 𝑖 = 1, … , 𝑛, 𝑌𝑖𝐴, 𝑌𝑖
𝐵 are (potential) outcomes under assignment to A or B respectively,
𝑌𝑖0 is the potential treatment-free outcome, 𝐶𝑖
𝐴, 𝐶𝑖𝐵
are (potential) vectors of treatment
adherence summaries observed under assignment to A or B respectively, 𝑋𝑖 is a vector of
baseline covariates, 𝑅𝑖𝐴, 𝑅𝑖
𝐵 are randomisation indicators with value 1 when a participants is
allocated to A (B, respectively) and 0 otherwise (and where the observed outcome, 𝑌𝑖 =
𝑌𝑖𝐴𝑅𝑖
𝐴 + 𝑌𝑖𝐵𝑅𝑖
𝐵), and assumes that the average effects of allocation to A and B are known
functions 𝛾 𝐴 and 𝛾𝐵 of adherence, baseline characteristics and unknown parameter vectors Ψ𝐴
or Ψ𝐵, respectively. (Goetghebeur and Lapp, 1997) The exclusion restrictions 𝛾 𝐴(0, 𝑋𝑖; Ψ𝐴) =
0 and 𝛾𝐵(0, 𝑋𝑖; Ψ𝐵) = 0 state that if no active treatment is received, the expected outcome
equals the expected treatment-free outcome. However, as the distribution of the potential
treatment-free outcome is not observed for trials with two active treatments, this estimator is not
directly applicable.
One approach that attempts to address this issue is based on identifying baseline covariates that
are differentially associated with exposure to treatment (or treatment adherence) for each of the
treatments. The method enables distinct causal estimators to be derived, from which a contrast
can be made (the contrast between the two treatments generally being of primary interest). These
baseline covariates must also be independent of outcome, therefore allowing separate sets of
instruments to be derived for each treatment and a potential treatment-free response to be
estimated (Figure 6.7).
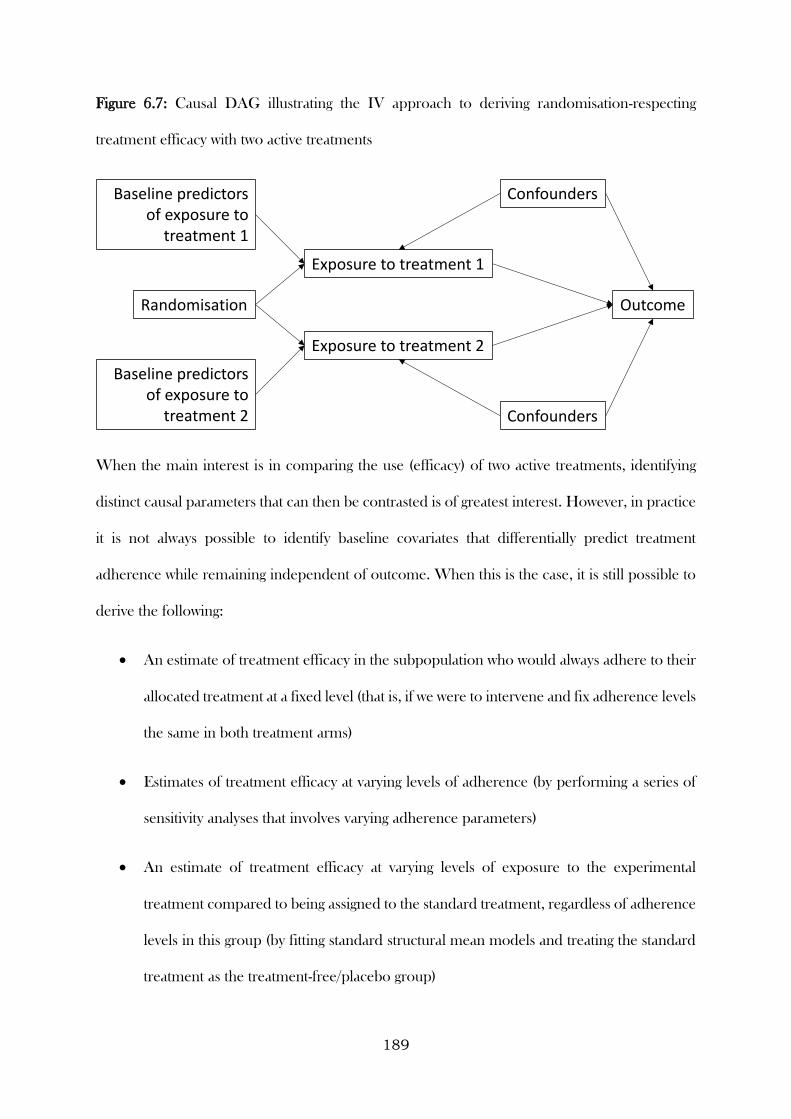
189
Figure 6.7: Causal DAG illustrating the IV approach to deriving randomisation-respecting
treatment efficacy with two active treatments
When the main interest is in comparing the use (efficacy) of two active treatments, identifying
distinct causal parameters that can then be contrasted is of greatest interest. However, in practice
it is not always possible to identify baseline covariates that differentially predict treatment
adherence while remaining independent of outcome. When this is the case, it is still possible to
derive the following:
An estimate of treatment efficacy in the subpopulation who would always adhere to their
allocated treatment at a fixed level (that is, if we were to intervene and fix adherence levels
the same in both treatment arms)
Estimates of treatment efficacy at varying levels of adherence (by performing a series of
sensitivity analyses that involves varying adherence parameters)
An estimate of treatment efficacy at varying levels of exposure to the experimental
treatment compared to being assigned to the standard treatment, regardless of adherence
levels in this group (by fitting standard structural mean models and treating the standard
treatment as the treatment-free/placebo group)
Randomisation
Exposure to treatment 1
Confounders
Outcome
Baseline predictors of exposure to
treatment 1
Exposure to treatment 2
Baseline predictors of exposure to
treatment 2
Confounders

190
6.2.5 Modelling RBEEs in a two-arm placebo-controlled superiority trial
Data from the GRACE WP10a trial was used to produce adherence-adjusted estimates of the
benefits and harms of amoxicillin for adults consulting in primary care with an acute
uncomplicated LRTI, whilst preserving a comparison of groups as randomised.
As reported in previous Chapters, adherence was measured in three ways during this trial: using
self-reported diaries, via tablet counts, and over the telephone (usually for participants who did
not return a diary). In Chapter 4 it was shown that while agreement between different types of
measures was generally good, some discrepancies did occur. During this Chapter, where multiple
types of measure are available, the minimum reported adherence value was used for analysis.
Randomised participants were prescribed 42 tablets. Adherence to study medication was defined
as the percentage of the correct number of tablets taken during the first seven days of the follow-
up period (i.e. the period for which the medication was prescribed). Three binary definitions of
adherence were also constructed in order to provide sensitivity analyses around the
continuous/quantitative definition. The three binary definitions were full (100%) adherence
versus not full adherence, at least the equivalent of a five-day course (approx. 71.4%) versus less
and at least one tablet versus no tablets (i.e. initiated/did not initiate).
To demonstrate the benefits and harms of taking amoxicillin in this population, the analysis
focused on the following three clinical outcomes. The first was the mean clinician-rated symptom
severity between days two and four after initial presentation. The second was the development
of new or worsening symptoms, defined as returning to the clinician with new or worsening
symptoms, new signs or an illness requiring admission to hospital within the four week follow-up
period. The third outcome was the presence of any non-respiratory symptoms (diarrhoea, skin
rash or vomiting) during the four week follow-up period. These specific symptoms were recorded
as they are known side effects of amoxicillin. The first two outcomes were used to demonstrate
191
the clinical benefits of amoxicillin for patients with an acute uncomplicated LRTI in primary
care, with the third used to demonstrate harms.
Two-stage instrumental variables regression was used to fit SMMs to the above outcomes.
(Fischer-Lapp and Goetghebeur, 1999) This procedure involved regressing the exposure variable
onto the instrument/s during the first stage, saving the predicted values from this regression, and
then, in the second stage, regressing the outcome onto the predicted values. A correction is made
during the second stage in order to obtain correct standard errors. The between-group mean
difference in symptom severity on days two to four was estimated using a two-stage least squares
instrumental variables regression model. To compare the odds of developing new or worsening
symptoms and reporting any non-respiratory symptoms, a generalised linear (double logistic)
SMM was estimated via a generalised method of moments procedure. The double logistic SMM
involves an additional stage, whereby the association between outcome (development of new or
worsening symptoms or reporting of side effects), trial arm and adherence was modelled first,
with estimates from this model used in the SMM in order to obtain correct standard errors (and
hence correct 95% confidence intervals). (Vansteelandt and Goetghebeur, 2003) As the main
adherence measure is on a scale ranging from 0 to 100 (i.e. the percentage of the correct number
of tablets taken during the first seven days of the follow-up period), the coefficient from the
SMMs are interpreted as the effect per percentage point increase in adherence. These effects are
then multiplied by 100 to give an interpretation for those who completely adhere to study
medication. See Box 6.1 for an outline and further description of the syntax used for these
models.
6.2.6 Modelling RBEEs in non-inferiority trials with two active
treatments
Data from the CODA and ZICE trials were used to illustrate how RBEEs can be fitted for non-
inferiority trials with two active treatments, including their utility and limitations. These trials
192
differed in terms of the nature of the interventions being compared, with CODA comparing the
same treatment prescribed with different regimens, and ZICE comparing two different
treatments with different modes of administration. These examples, while contrasting, are typical
of the types of non-inferiority trials conducted, and will therefore provide useful insight into the
methods proposed.
As described in Chapter 5, adherence to study medication in the original CODA trial analysis
was defined as participants consuming at least 75% of their issued medication. This definition
will also be used for the analysis presented in this Chapter. For the ZICE trial, adherence will be
based on the combined summary measure, also described in Chapter 5.
For the CODA trial, the outcome of interest was the proportion of participants relapsing during
the 12 month study period. The OD regimen was considered to be non-inferior to the TDS
regimen as long as the lower bound of the 95% confidence interval of the difference in the
proportion of participants in each arm relapsing (OD minus TDS) did not include minus 0.1
(i.e. the difference in the proportion of participants relapsing, between participants allocated to
OD compared to those allocated to TDS, had to be less than 10 percentage points). For the
ZICE trial, the outcome of interest for this analysis was the proportion of participants
experiencing a skeletal-related event (SRE) during the first 12 months of the study. This is a
simplified version of the primary outcome from the main trial analysis (which was based on the
time and frequency of SREs and analysed using an Andersen-Gill model (Andersen and Gill,
1982)), and used for illustration purposes only. There was therefore no pre-specified non-
inferiority margin for this outcome.
Deriving distinct causal estimators for each treatment arm relied on identifying baseline variables
that predicted adherence to treatment differently in each arm, whilst not predicting clinical
outcome (that is, they are used as instruments for the separate treatments). Determining these
predictors involved two main steps. First, multivariable logistic regression was used to determine
193
the factors that predicted clinical outcome. Variables that were identified univariably at the 20%
significance level were entered into the multivariable model, with backward selection used to
retain variables independently associated at the 10% significance level. Following this,
multivariable logistic regression was used, with the binary adherence variable as the outcome of
interest. Predictors of adherence were entered one-by-one into a regression model that included
trial arm, and interaction between candidate predictor and trial arm, and the predictors of clinical
outcome that were identified during the previous step. Any variables that were associated with
adherence at the 20% significance level, as either a main effect or as an interaction with trial arm,
were retained in the multivariable regression model. Predictors that remained associated at the
10% significance level were then retained in the final regression model.
For the CODA trial, the candidate baseline predictors used in the outcome and adherence
models were age (<65, ≥65), age at diagnosis (≤25, 26-45, 46-64, ≥65), gender, length of remission
(<12 months, ≥12 months), calprotectin concentration (<60mg/kg stool, ≥60 mg/kg stool),
smoking status (never smoker, current smoker, ex-smoker), employment status (unemployed,
employed), maximum documented extent of colitis (extensive, left-sided or sigmoid, proctitis),
disease duration (≤10 years, 11 to 20 years, >20years), number of relapses during the past two
years (1, 2, 3, ≥4), and endoscopy findings (normal, not normal).
For the ZICE trial, the candidate predictors were age, gender, Body Mass Index (BMI), the
modified Brief Pain Inventory severity score, Quality of Life (EORTC QLQ-C30 score version
3.0 (Fayers et al., 2001)), SRE within the previous three months, previous use of
bisphosphonates, treatments being received (including painkilling drugs, chemotherapy,
hormone therapy, and trastuzumab).
The SMM models were fitted using a two-stage least squares instrumental variables regression
approach. Using this procedure, the trial arm (the instrument), predictors of outcome, and
differential predictors of adherence were used to estimate values of the adherence variables in
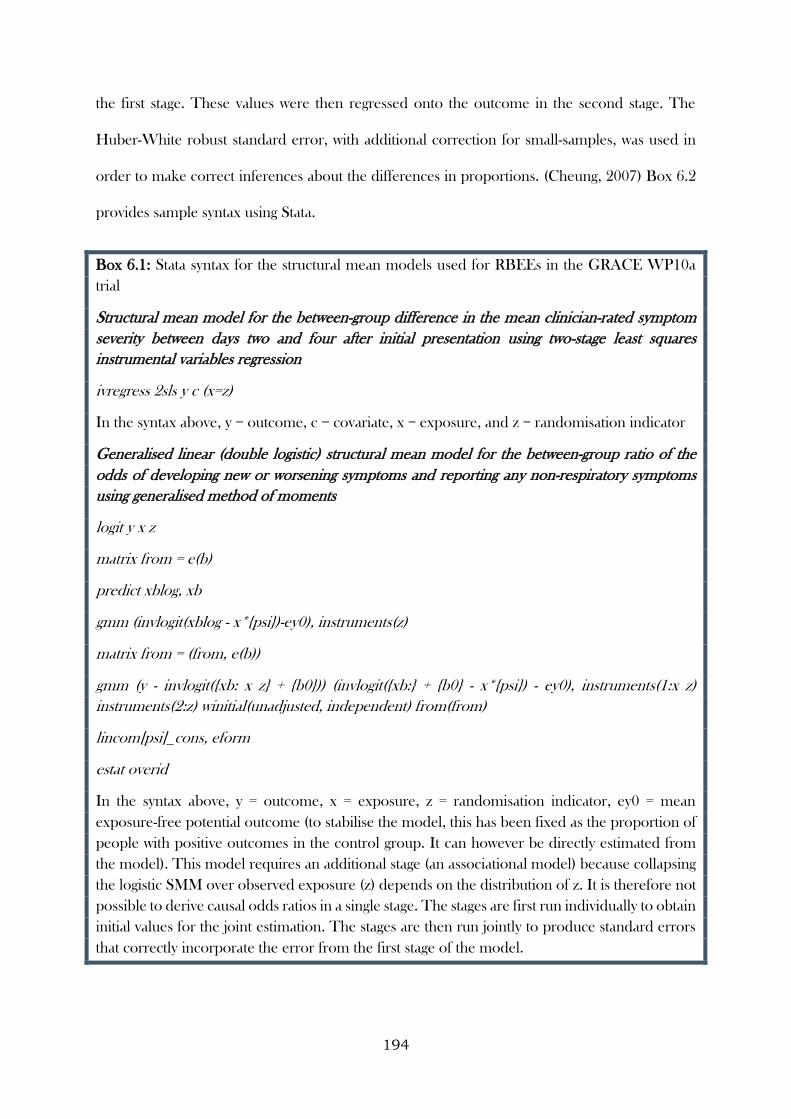
194
the first stage. These values were then regressed onto the outcome in the second stage. The
Huber-White robust standard error, with additional correction for small-samples, was used in
order to make correct inferences about the differences in proportions. (Cheung, 2007) Box 6.2
provides sample syntax using Stata.
Box 6.1: Stata syntax for the structural mean models used for RBEEs in the GRACE WP10a
trial
Structural mean model for the between-group difference in the mean clinician-rated symptom
severity between days two and four after initial presentation using two-stage least squares
instrumental variables regression
ivregress 2sls y c (x=z)
In the syntax above, y = outcome, c = covariate, x = exposure, and z = randomisation indicator
Generalised linear (double logistic) structural mean model for the between-group ratio of the
odds of developing new or worsening symptoms and reporting any non-respiratory symptoms
using generalised method of moments
logit y x z
matrix from = e(b)
predict xblog, xb
gmm (invlogit(xblog - x*{psi})-ey0), instruments(z)
matrix from = (from, e(b))
gmm (y - invlogit({xb: x z} + {b0})) (invlogit({xb:} + {b0} - x*{psi}) - ey0), instruments(1:x z)
instruments(2:z) winitial(unadjusted, independent) from(from)
lincom[psi]_cons, eform
estat overid
In the syntax above, y = outcome, x = exposure, z = randomisation indicator, ey0 = mean
exposure-free potential outcome (to stabilise the model, this has been fixed as the proportion of
people with positive outcomes in the control group. It can however be directly estimated from
the model). This model requires an additional stage (an associational model) because collapsing
the logistic SMM over observed exposure (z) depends on the distribution of z. It is therefore not
possible to derive causal odds ratios in a single stage. The stages are first run individually to obtain
initial values for the joint estimation. The stages are then run jointly to produce standard errors
that correctly incorporate the error from the first stage of the model.
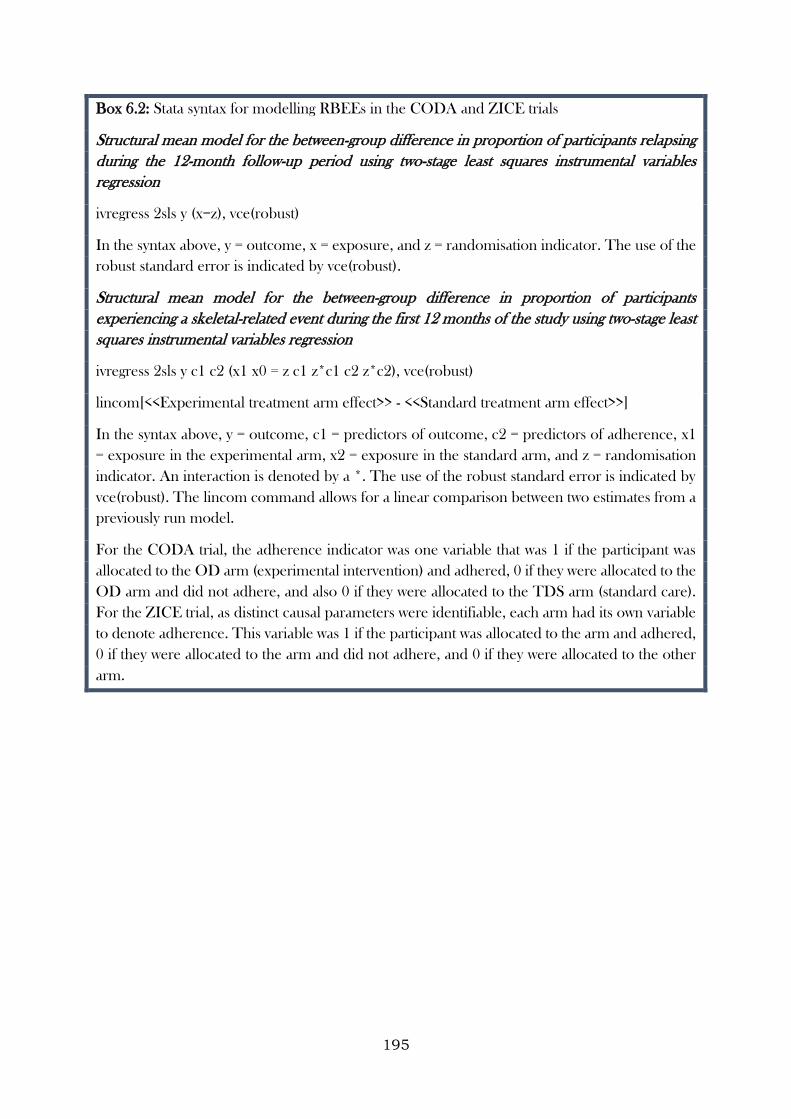
195
Box 6.2: Stata syntax for modelling RBEEs in the CODA and ZICE trials
Structural mean model for the between-group difference in proportion of participants relapsing
during the 12-month follow-up period using two-stage least squares instrumental variables
regression
ivregress 2sls y (x=z), vce(robust)
In the syntax above, y = outcome, x = exposure, and z = randomisation indicator. The use of the
robust standard error is indicated by vce(robust).
Structural mean model for the between-group difference in proportion of participants
experiencing a skeletal-related event during the first 12 months of the study using two-stage least
squares instrumental variables regression
ivregress 2sls y c1 c2 (x1 x0 = z c1 z*c1 c2 z*c2), vce(robust)
lincom[<<Experimental treatment arm effect>> - <<Standard treatment arm effect>>]
In the syntax above, y = outcome, c1 = predictors of outcome, c2 = predictors of adherence, x1
= exposure in the experimental arm, x2 = exposure in the standard arm, and z = randomisation
indicator. An interaction is denoted by a *. The use of the robust standard error is indicated by
vce(robust). The lincom command allows for a linear comparison between two estimates from a
previously run model.
For the CODA trial, the adherence indicator was one variable that was 1 if the participant was
allocated to the OD arm (experimental intervention) and adhered, 0 if they were allocated to the
OD arm and did not adhere, and also 0 if they were allocated to the TDS arm (standard care).
For the ZICE trial, as distinct causal parameters were identifiable, each arm had its own variable
to denote adherence. This variable was 1 if the participant was allocated to the arm and adhered,
0 if they were allocated to the arm and did not adhere, and 0 if they were allocated to the other
arm.
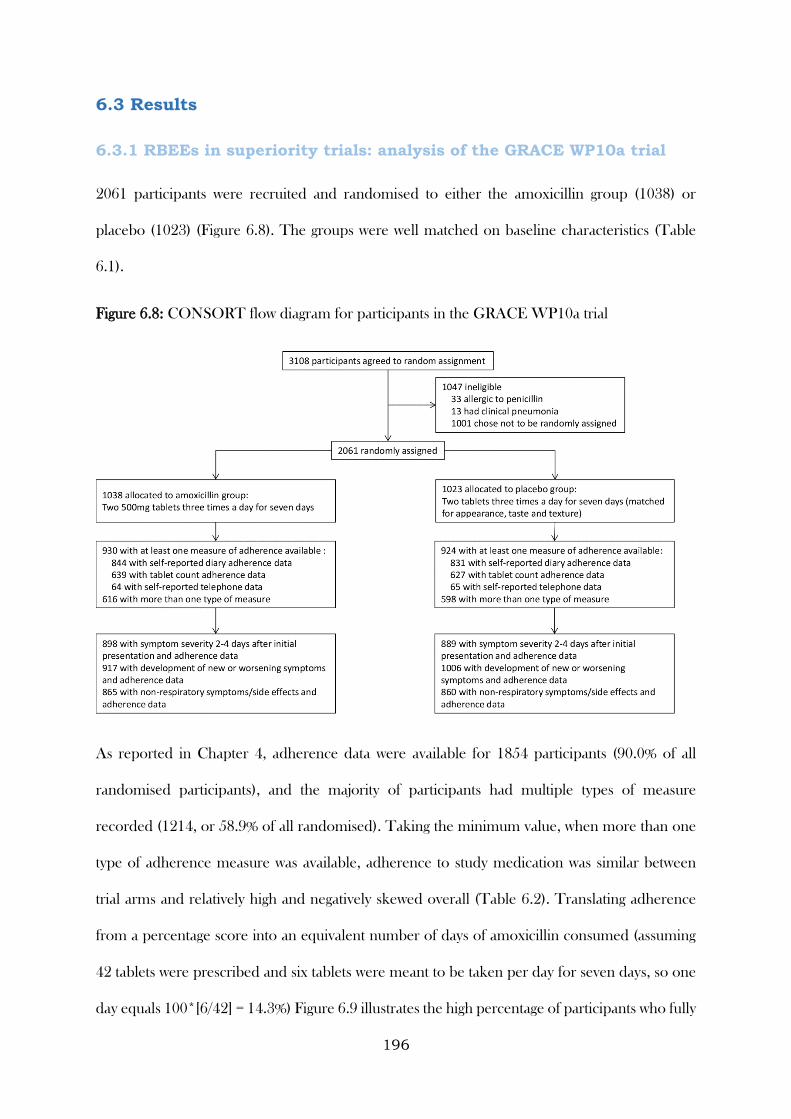
196
6.3 Results
6.3.1 RBEEs in superiority trials: analysis of the GRACE WP10a trial
2061 participants were recruited and randomised to either the amoxicillin group (1038) or
placebo (1023) (Figure 6.8). The groups were well matched on baseline characteristics (Table
6.1).
Figure 6.8: CONSORT flow diagram for participants in the GRACE WP10a trial
As reported in Chapter 4, adherence data were available for 1854 participants (90.0% of all
randomised participants), and the majority of participants had multiple types of measure
recorded (1214, or 58.9% of all randomised). Taking the minimum value, when more than one
type of adherence measure was available, adherence to study medication was similar between
trial arms and relatively high and negatively skewed overall (Table 6.2). Translating adherence
from a percentage score into an equivalent number of days of amoxicillin consumed (assuming
42 tablets were prescribed and six tablets were meant to be taken per day for seven days, so one
day equals 100*[6/42] = 14.3%) Figure 6.9 illustrates the high percentage of participants who fully
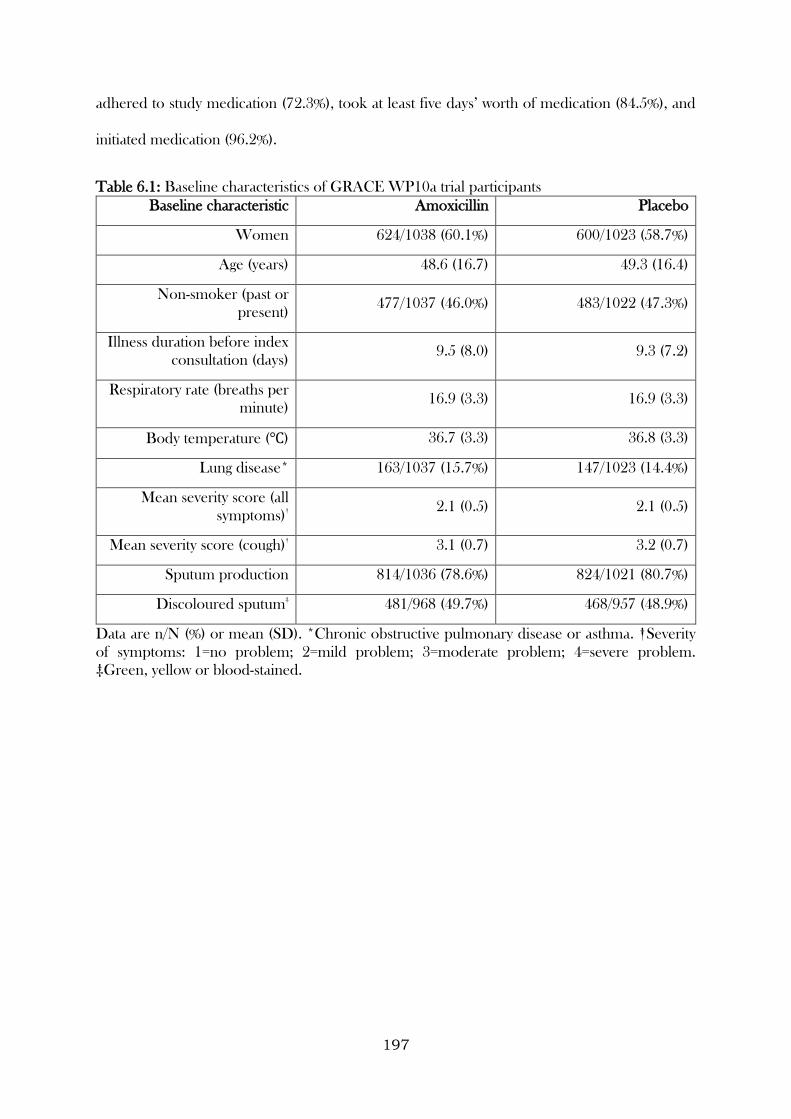
197
adhered to study medication (72.3%), took at least five days’ worth of medication (84.5%), and
initiated medication (96.2%).
Table 6.1: Baseline characteristics of GRACE WP10a trial participants
Baseline characteristic Amoxicillin Placebo
Women 624/1038 (60.1%) 600/1023 (58.7%)
Age (years) 48.6 (16.7) 49.3 (16.4)
Non-smoker (past or
present) 477/1037 (46.0%) 483/1022 (47.3%)
Illness duration before index
consultation (days) 9.5 (8.0) 9.3 (7.2)
Respiratory rate (breaths per
minute) 16.9 (3.3) 16.9 (3.3)
Body temperature (℃) 36.7 (3.3) 36.8 (3.3)
Lung disease* 163/1037 (15.7%) 147/1023 (14.4%)
Mean severity score (all
symptoms)†
2.1 (0.5) 2.1 (0.5)
Mean severity score (cough)†
3.1 (0.7) 3.2 (0.7)
Sputum production 814/1036 (78.6%) 824/1021 (80.7%)
Discoloured sputum‡
481/968 (49.7%) 468/957 (48.9%)
Data are n/N (%) or mean (SD). *Chronic obstructive pulmonary disease or asthma. †Severity
of symptoms: 1=no problem; 2=mild problem; 3=moderate problem; 4=severe problem.
‡Green, yellow or blood-stained.
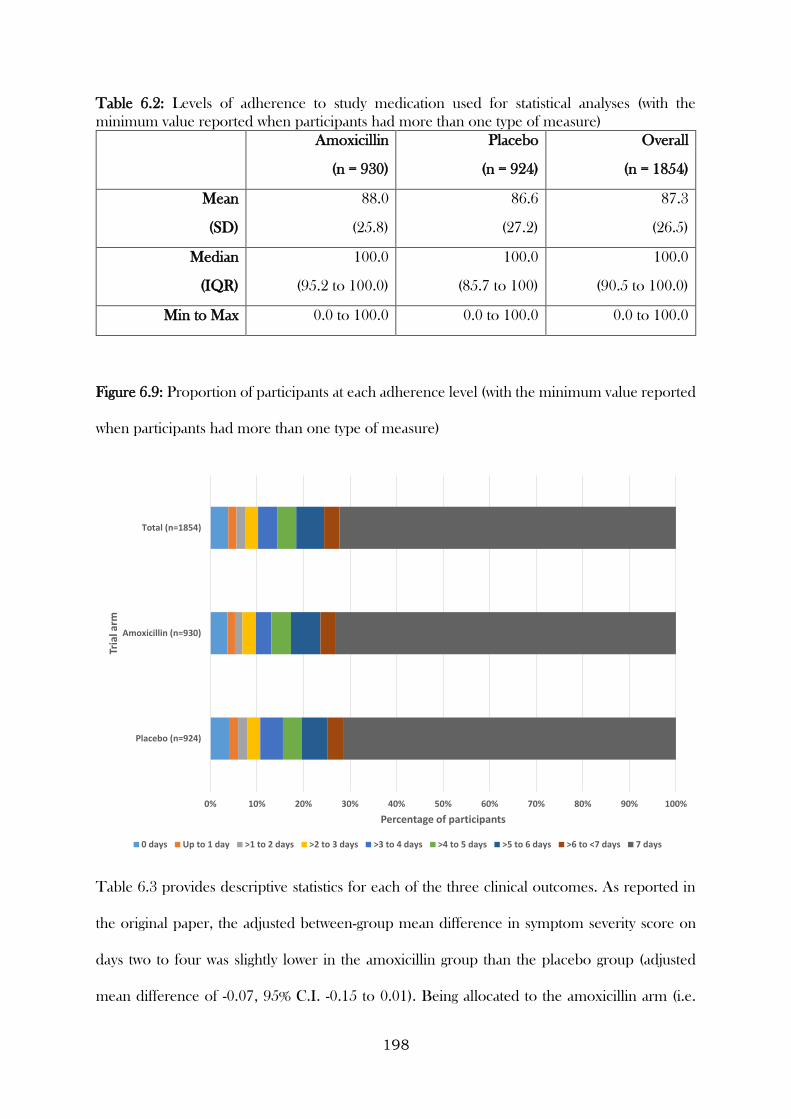
198
Table 6.2: Levels of adherence to study medication used for statistical analyses (with the
minimum value reported when participants had more than one type of measure)
Amoxicillin
(n = 930)
Placebo
(n = 924)
Overall
(n = 1854)
Mean
(SD)
88.0
(25.8)
86.6
(27.2)
87.3
(26.5)
Median
(IQR)
100.0
(95.2 to 100.0)
100.0
(85.7 to 100)
100.0
(90.5 to 100.0)
Min to Max 0.0 to 100.0 0.0 to 100.0 0.0 to 100.0
Figure 6.9: Proportion of participants at each adherence level (with the minimum value reported
when participants had more than one type of measure)
Table 6.3 provides descriptive statistics for each of the three clinical outcomes. As reported in
the original paper, the adjusted between-group mean difference in symptom severity score on
days two to four was slightly lower in the amoxicillin group than the placebo group (adjusted
mean difference of -0.07, 95% C.I. -0.15 to 0.01). Being allocated to the amoxicillin arm (i.e.
0% 10% 20% 30% 40% 50% 60% 70% 80% 90% 100%
Placebo (n=924)
Amoxicillin (n=930)
Total (n=1854)
Percentage of participants
Tria
l arm
0 days Up to 1 day >1 to 2 days >2 to 3 days >3 to 4 days >4 to 5 days >5 to 6 days >6 to <7 days 7 days
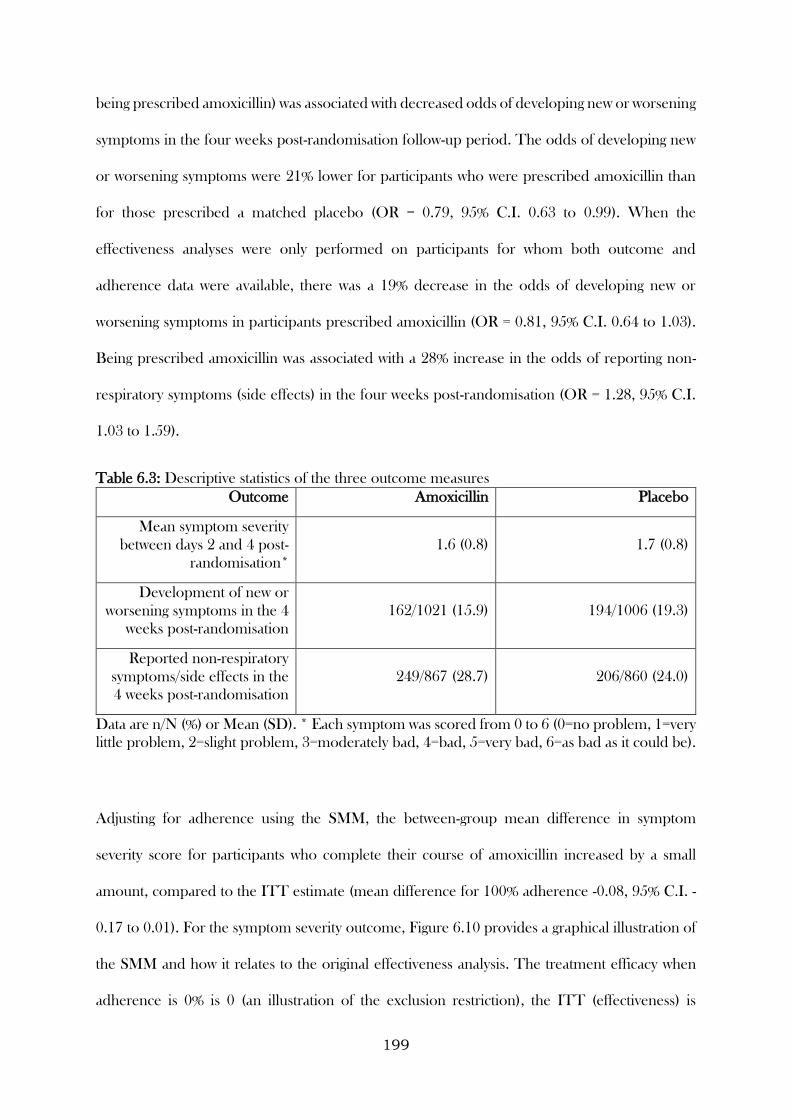
199
being prescribed amoxicillin) was associated with decreased odds of developing new or worsening
symptoms in the four weeks post-randomisation follow-up period. The odds of developing new
or worsening symptoms were 21% lower for participants who were prescribed amoxicillin than
for those prescribed a matched placebo (OR = 0.79, 95% C.I. 0.63 to 0.99). When the
effectiveness analyses were only performed on participants for whom both outcome and
adherence data were available, there was a 19% decrease in the odds of developing new or
worsening symptoms in participants prescribed amoxicillin (OR = 0.81, 95% C.I. 0.64 to 1.03).
Being prescribed amoxicillin was associated with a 28% increase in the odds of reporting non-
respiratory symptoms (side effects) in the four weeks post-randomisation (OR = 1.28, 95% C.I.
1.03 to 1.59).
Table 6.3: Descriptive statistics of the three outcome measures
Outcome Amoxicillin Placebo
Mean symptom severity
between days 2 and 4 post-
randomisation*
1.6 (0.8) 1.7 (0.8)
Development of new or
worsening symptoms in the 4
weeks post-randomisation
162/1021 (15.9) 194/1006 (19.3)
Reported non-respiratory
symptoms/side effects in the
4 weeks post-randomisation
249/867 (28.7) 206/860 (24.0)
Data are n/N (%) or Mean (SD). * Each symptom was scored from 0 to 6 (0=no problem, 1=very
little problem, 2=slight problem, 3=moderately bad, 4=bad, 5=very bad, 6=as bad as it could be).
Adjusting for adherence using the SMM, the between-group mean difference in symptom
severity score for participants who complete their course of amoxicillin increased by a small
amount, compared to the ITT estimate (mean difference for 100% adherence -0.08, 95% C.I. -
0.17 to 0.01). For the symptom severity outcome, Figure 6.10 provides a graphical illustration of
the SMM and how it relates to the original effectiveness analysis. The treatment efficacy when
adherence is 0% is 0 (an illustration of the exclusion restriction), the ITT (effectiveness) is

200
illustrated by the diamonds (positioned at an adherence level of 88% - the patient-average), and
the maximum efficacy when adherence is 100% (circles).
The odds of developing new or worsening symptoms remained lower in participants who took
their full course of amoxicillin (OR for 100% adherence to amoxicillin = 0.81, 95% C.I. 0.66 to
0.98). A small increase in the odds of reporting non-respiratory symptoms was found when
adjusting for adherence (OR for 100% adherence = 1.32, 95% C.I. 1.12 to 1.57) (Table 6.4).
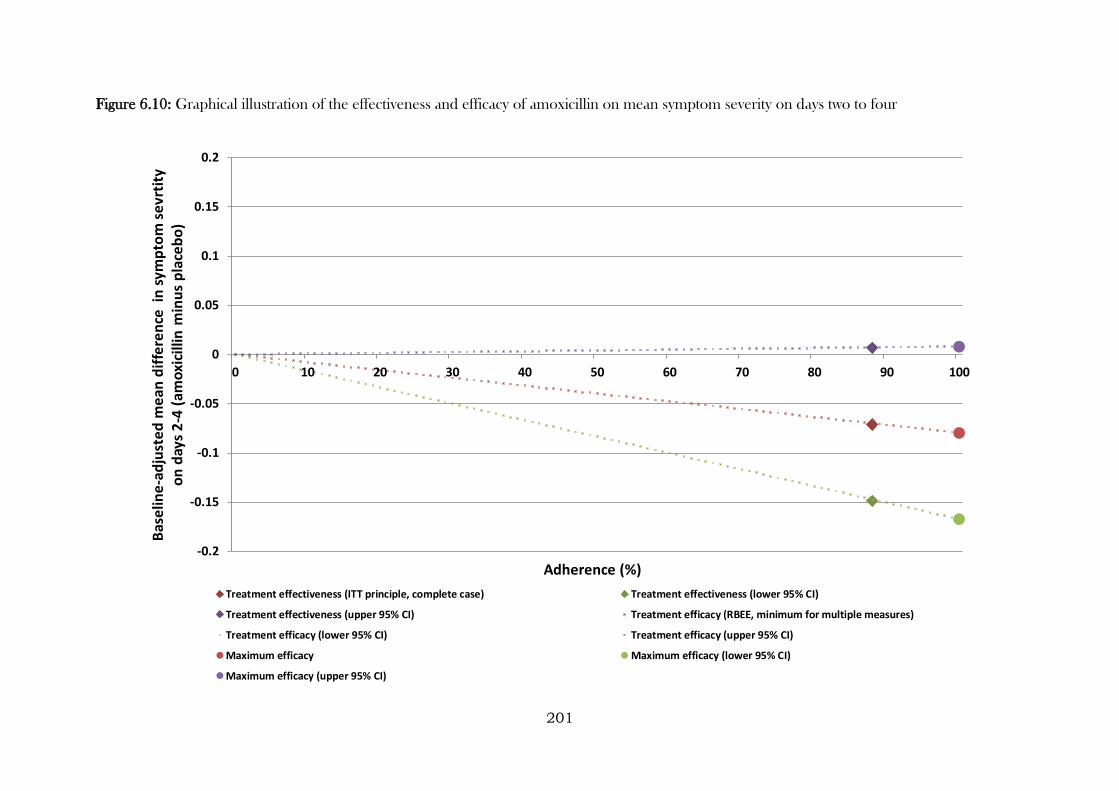
201
Figure 6.10: Graphical illustration of the effectiveness and efficacy of amoxicillin on mean symptom severity on days two to four
-0.2
-0.15
-0.1
-0.05
0
0.05
0.1
0.15
0.2
0 10 20 30 40 50 60 70 80 90 100
Bas
elin
e-a
dju
ste
d m
ean
dif
fere
nce
in
sym
pto
m s
evr
tity
o
n d
ays
2-4
(am
oxi
cilli
n m
inu
s p
lace
bo
)
Adherence (%)
Treatment effectiveness (ITT principle, complete case) Treatment effectiveness (lower 95% CI)
Treatment effectiveness (upper 95% CI) Treatment efficacy (RBEE, minimum for multiple measures)
Treatment efficacy (lower 95% CI) Treatment efficacy (upper 95% CI)
Maximum efficacy Maximum efficacy (lower 95% CI)
Maximum efficacy (upper 95% CI)
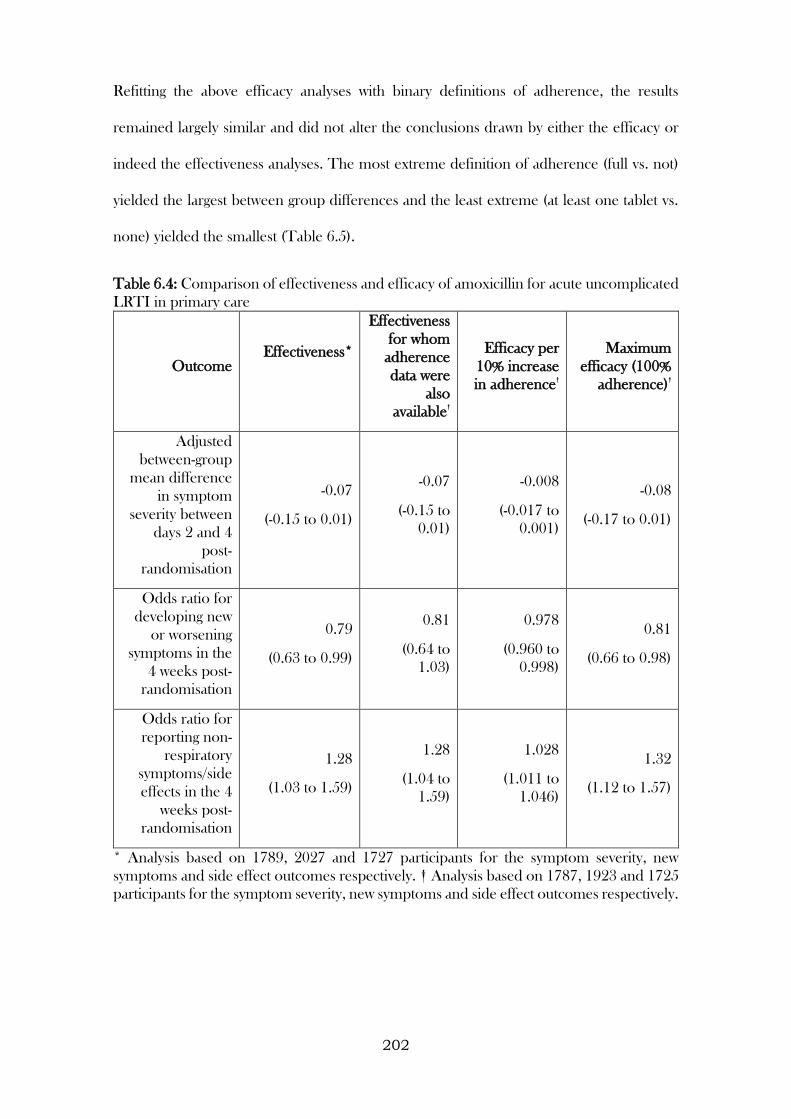
202
Refitting the above efficacy analyses with binary definitions of adherence, the results
remained largely similar and did not alter the conclusions drawn by either the efficacy or
indeed the effectiveness analyses. The most extreme definition of adherence (full vs. not)
yielded the largest between group differences and the least extreme (at least one tablet vs.
none) yielded the smallest (Table 6.5).
Table 6.4: Comparison of effectiveness and efficacy of amoxicillin for acute uncomplicated
LRTI in primary care
Outcome Effectiveness*
Effectiveness
for whom
adherence
data were
also
available†
Efficacy per
10% increase
in adherence†
Maximum
efficacy (100%
adherence)†
Adjusted
between-group
mean difference
in symptom
severity between
days 2 and 4
post-
randomisation
-0.07
(-0.15 to 0.01)
-0.07
(-0.15 to
0.01)
-0.008
(-0.017 to
0.001)
-0.08
(-0.17 to 0.01)
Odds ratio for
developing new
or worsening
symptoms in the
4 weeks post-
randomisation
0.79
(0.63 to 0.99)
0.81
(0.64 to
1.03)
0.978
(0.960 to
0.998)
0.81
(0.66 to 0.98)
Odds ratio for
reporting non-
respiratory
symptoms/side
effects in the 4
weeks post-
randomisation
1.28
(1.03 to 1.59)
1.28
(1.04 to
1.59)
1.028
(1.011 to
1.046)
1.32
(1.12 to 1.57)
* Analysis based on 1789, 2027 and 1727 participants for the symptom severity, new
symptoms and side effect outcomes respectively. † Analysis based on 1787, 1923 and 1725
participants for the symptom severity, new symptoms and side effect outcomes respectively.
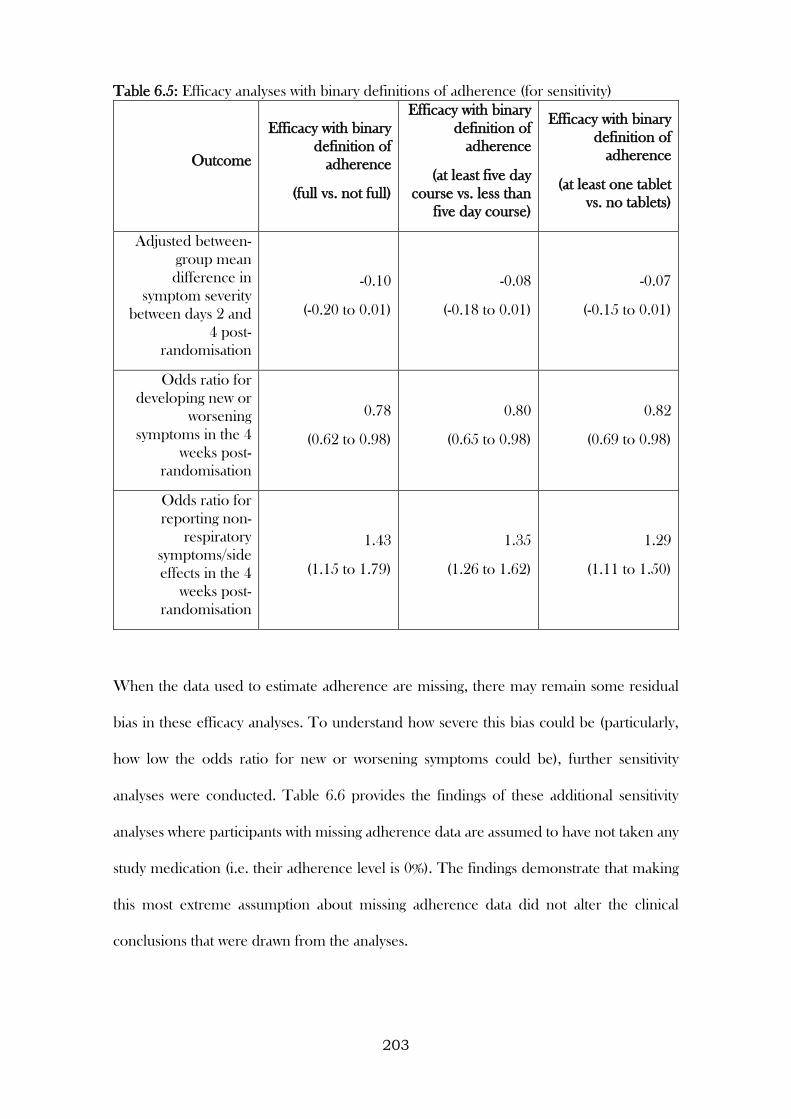
203
Table 6.5: Efficacy analyses with binary definitions of adherence (for sensitivity)
Outcome
Efficacy with binary
definition of
adherence
(full vs. not full)
Efficacy with binary
definition of
adherence
(at least five day
course vs. less than
five day course)
Efficacy with binary
definition of
adherence
(at least one tablet
vs. no tablets)
Adjusted between-
group mean
difference in
symptom severity
between days 2 and
4 post-
randomisation
-0.10
(-0.20 to 0.01)
-0.08
(-0.18 to 0.01)
-0.07
(-0.15 to 0.01)
Odds ratio for
developing new or
worsening
symptoms in the 4
weeks post-
randomisation
0.78
(0.62 to 0.98)
0.80
(0.65 to 0.98)
0.82
(0.69 to 0.98)
Odds ratio for
reporting non-
respiratory
symptoms/side
effects in the 4
weeks post-
randomisation
1.43
(1.15 to 1.79)
1.35
(1.26 to 1.62)
1.29
(1.11 to 1.50)
When the data used to estimate adherence are missing, there may remain some residual
bias in these efficacy analyses. To understand how severe this bias could be (particularly,
how low the odds ratio for new or worsening symptoms could be), further sensitivity
analyses were conducted. Table 6.6 provides the findings of these additional sensitivity
analyses where participants with missing adherence data are assumed to have not taken any
study medication (i.e. their adherence level is 0%). The findings demonstrate that making
this most extreme assumption about missing adherence data did not alter the clinical
conclusions that were drawn from the analyses.
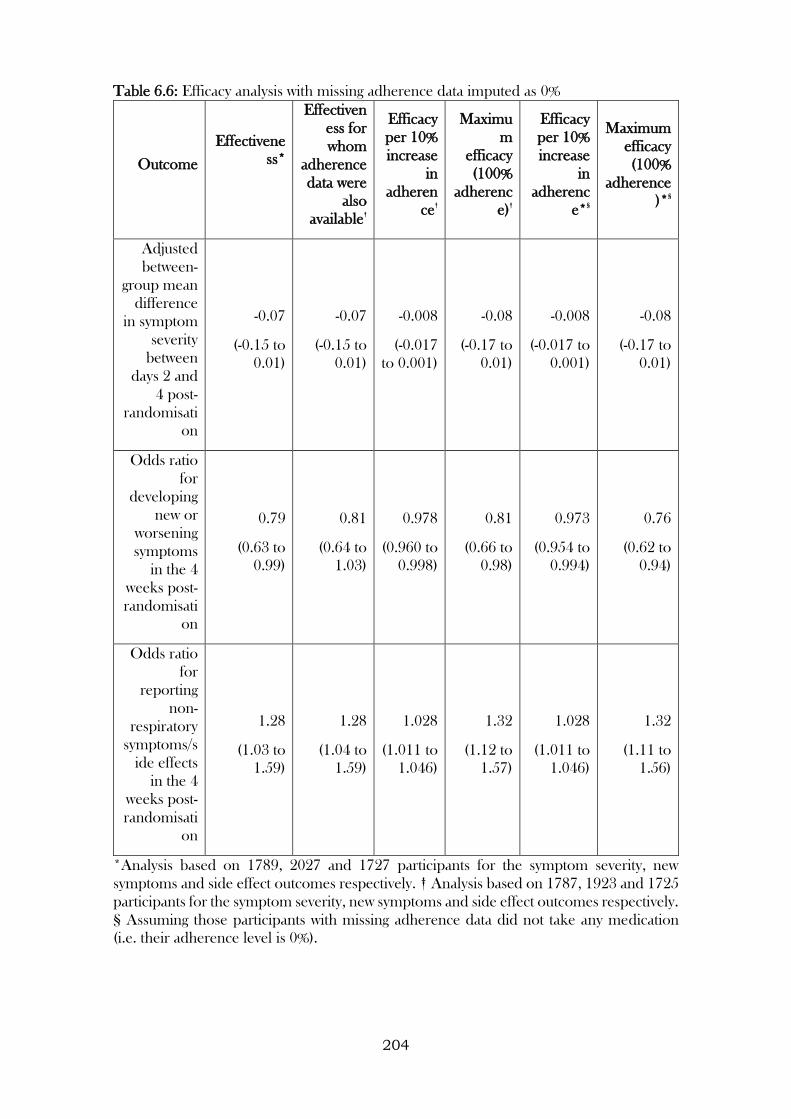
204
Table 6.6: Efficacy analysis with missing adherence data imputed as 0%
Outcome
Effectivene
ss*
Effectiven
ess for
whom
adherence
data were
also
available†
Efficacy
per 10%
increase
in
adheren
ce†
Maximu
m
efficacy
(100%
adherenc
e)†
Efficacy
per 10%
increase
in
adherenc
e*§
Maximum
efficacy
(100%
adherence
)*§
Adjusted
between-
group mean
difference
in symptom
severity
between
days 2 and
4 post-
randomisati
on
-0.07
(-0.15 to
0.01)
-0.07
(-0.15 to
0.01)
-0.008
(-0.017
to 0.001)
-0.08
(-0.17 to
0.01)
-0.008
(-0.017 to
0.001)
-0.08
(-0.17 to
0.01)
Odds ratio
for
developing
new or
worsening
symptoms
in the 4
weeks post-
randomisati
on
0.79
(0.63 to
0.99)
0.81
(0.64 to
1.03)
0.978
(0.960 to
0.998)
0.81
(0.66 to
0.98)
0.973
(0.954 to
0.994)
0.76
(0.62 to
0.94)
Odds ratio
for
reporting
non-
respiratory
symptoms/s
ide effects
in the 4
weeks post-
randomisati
on
1.28
(1.03 to
1.59)
1.28
(1.04 to
1.59)
1.028
(1.011 to
1.046)
1.32
(1.12 to
1.57)
1.028
(1.011 to
1.046)
1.32
(1.11 to
1.56)
*Analysis based on 1789, 2027 and 1727 participants for the symptom severity, new
symptoms and side effect outcomes respectively. † Analysis based on 1787, 1923 and 1725
participants for the symptom severity, new symptoms and side effect outcomes respectively.
§ Assuming those participants with missing adherence data did not take any medication
(i.e. their adherence level is 0%).
205
6.3.2 RBEEs in non-inferiority / active control trials
6.3.2.1 Analysis of the CODA trial
The analysis using data from the CODA trial was based on 188 randomised participants
with outcome data.
In total, 174 participants adhered to their study medication (92.6%), with these making up
the per-protocol population (Figure 6.11). The percentage of participants adhering to study
medication was higher in those randomised to the intervention arm compared to the active
control arm (95.7% and 89.4% respectively).
Overall, 56 participants relapsed within the 12 month follow-up period (29.8% of all
participants). The percentage of participants who relapsed was lower in the intervention
arm compared to the active control arm (24.5% and 35.1% respectively). The main trial
analysis based on complete cases demonstrated that the relapse rate was 10.6 percentage
points higher in those randomised to the TDS arm compared to in the OD (95%
confidence interval (CI): -2.5 to 23.8 percentage points). As the lower limit of the 95% CI
did not include -10%, and this was also found in the PP analysis, the findings confirmed the
non-inferiority of the OD regimen compared to the TDS regimen.
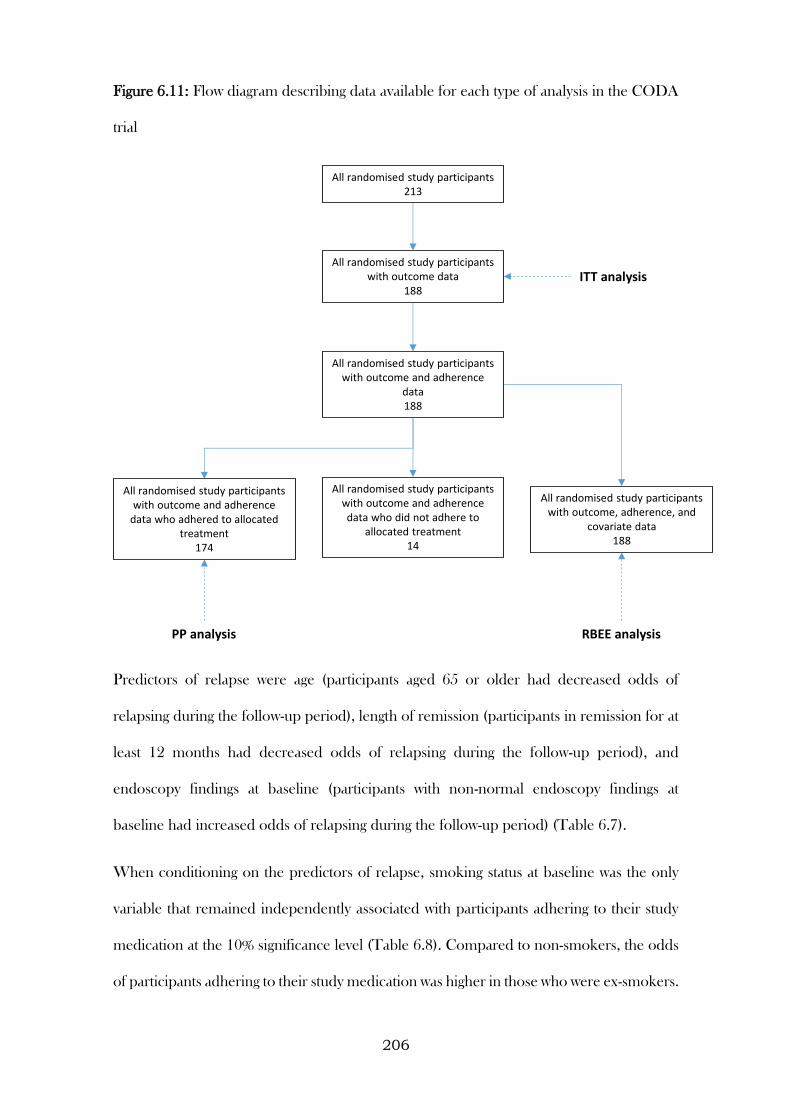
206
Figure 6.11: Flow diagram describing data available for each type of analysis in the CODA
trial
Predictors of relapse were age (participants aged 65 or older had decreased odds of
relapsing during the follow-up period), length of remission (participants in remission for at
least 12 months had decreased odds of relapsing during the follow-up period), and
endoscopy findings at baseline (participants with non-normal endoscopy findings at
baseline had increased odds of relapsing during the follow-up period) (Table 6.7).
When conditioning on the predictors of relapse, smoking status at baseline was the only
variable that remained independently associated with participants adhering to their study
medication at the 10% significance level (Table 6.8). Compared to non-smokers, the odds
of participants adhering to their study medication was higher in those who were ex-smokers.
All randomised study participants with outcome data
188
All randomised study participants213
All randomised study participants with outcome and adherence
data188
All randomised study participants with outcome and adherence
data who adhered to allocated treatment
174
All randomised study participants with outcome, adherence, and
covariate data188
All randomised study participants with outcome and adherence data who did not adhere to
allocated treatment14
ITT analysis
PP analysis RBEE analysis
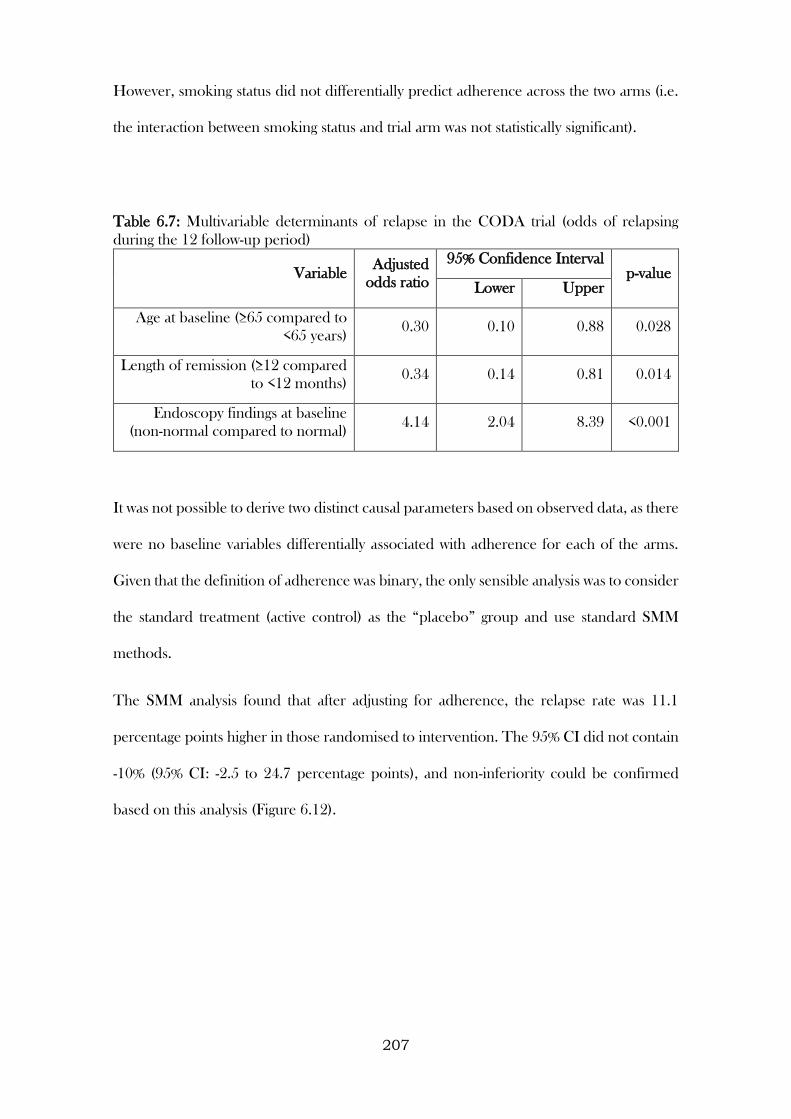
207
However, smoking status did not differentially predict adherence across the two arms (i.e.
the interaction between smoking status and trial arm was not statistically significant).
Table 6.7: Multivariable determinants of relapse in the CODA trial (odds of relapsing
during the 12 follow-up period)
Variable Adjusted
odds ratio
95% Confidence Interval p-value
Lower Upper
Age at baseline (≥65 compared to
<65 years) 0.30 0.10 0.88 0.028
Length of remission (≥12 compared
to <12 months) 0.34 0.14 0.81 0.014
Endoscopy findings at baseline
(non-normal compared to normal) 4.14 2.04 8.39 <0.001
It was not possible to derive two distinct causal parameters based on observed data, as there
were no baseline variables differentially associated with adherence for each of the arms.
Given that the definition of adherence was binary, the only sensible analysis was to consider
the standard treatment (active control) as the “placebo” group and use standard SMM
methods.
The SMM analysis found that after adjusting for adherence, the relapse rate was 11.1
percentage points higher in those randomised to intervention. The 95% CI did not contain
-10% (95% CI: -2.5 to 24.7 percentage points), and non-inferiority could be confirmed
based on this analysis (Figure 6.12).
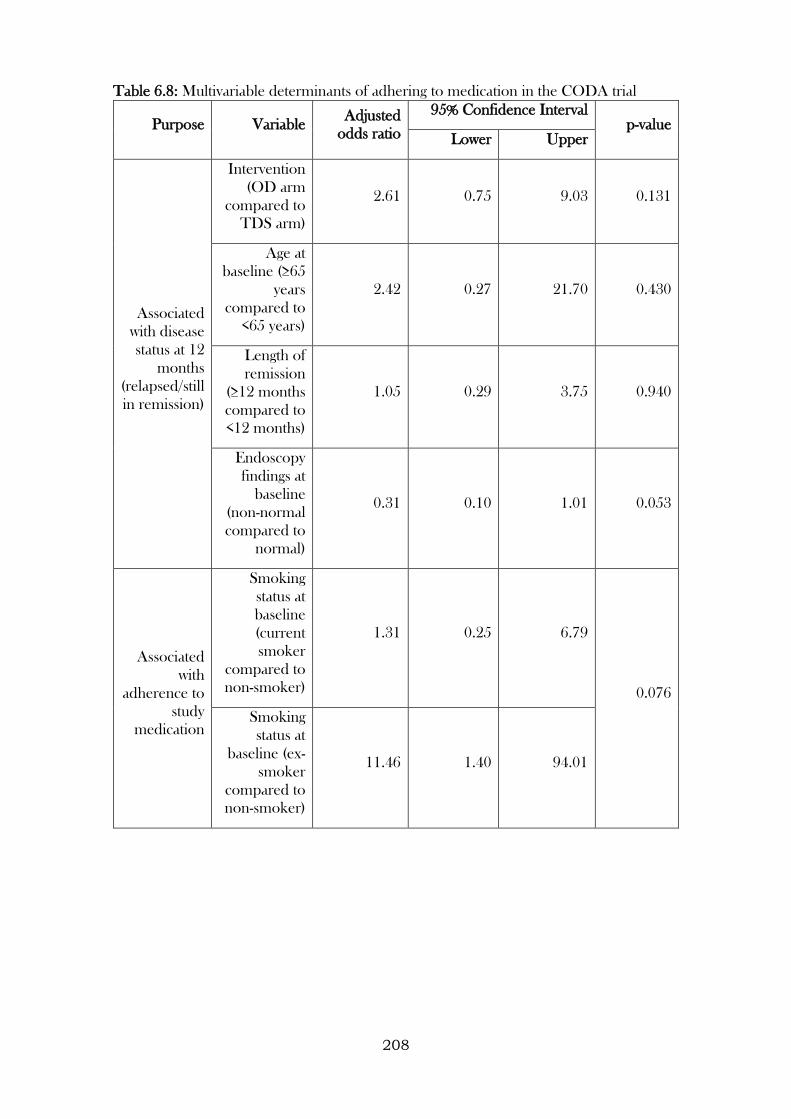
208
Table 6.8: Multivariable determinants of adhering to medication in the CODA trial
Purpose Variable Adjusted
odds ratio
95% Confidence Interval p-value
Lower Upper
Associated
with disease
status at 12
months
(relapsed/still
in remission)
Intervention
(OD arm
compared to
TDS arm)
2.61 0.75 9.03 0.131
Age at
baseline (≥65
years
compared to
<65 years)
2.42 0.27 21.70 0.430
Length of
remission
(≥12 months
compared to
<12 months)
1.05 0.29 3.75 0.940
Endoscopy
findings at
baseline
(non-normal
compared to
normal)
0.31 0.10 1.01 0.053
Associated
with
adherence to
study
medication
Smoking
status at
baseline
(current
smoker
compared to
non-smoker)
1.31 0.25 6.79
0.076
Smoking
status at
baseline (ex-
smoker
compared to
non-smoker)
11.46 1.40 94.01
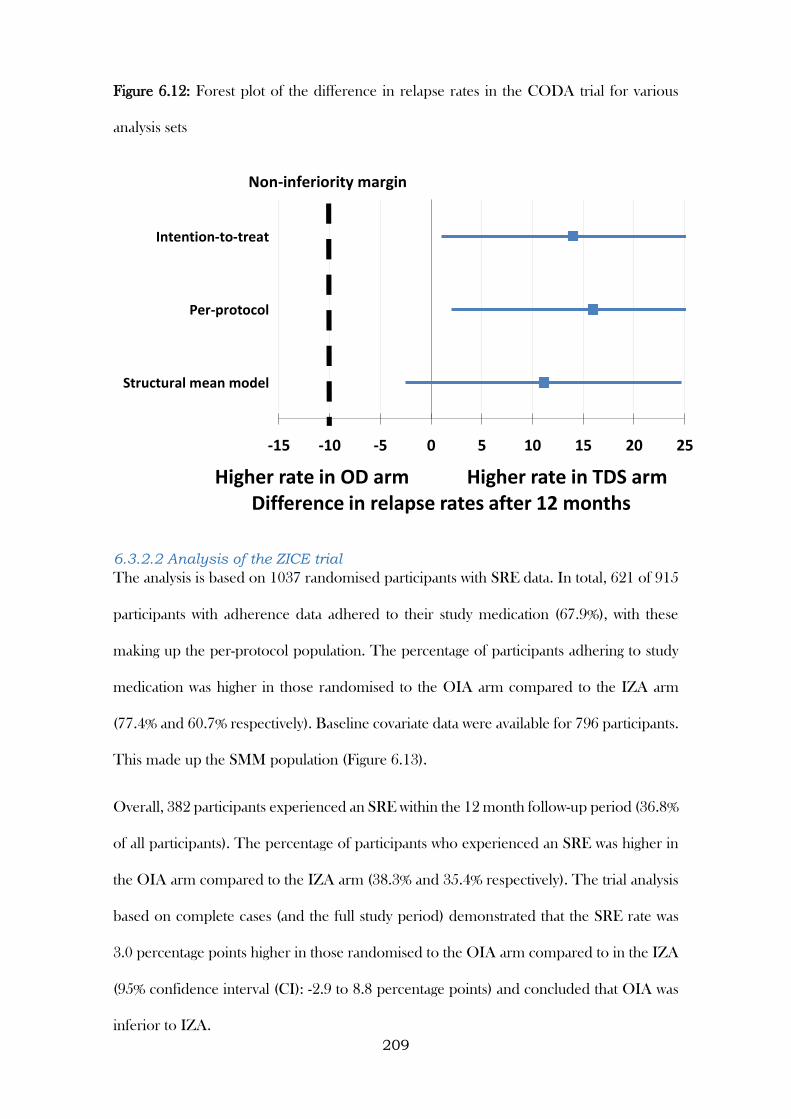
209
Figure 6.12: Forest plot of the difference in relapse rates in the CODA trial for various
analysis sets
6.3.2.2 Analysis of the ZICE trial
The analysis is based on 1037 randomised participants with SRE data. In total, 621 of 915
participants with adherence data adhered to their study medication (67.9%), with these
making up the per-protocol population. The percentage of participants adhering to study
medication was higher in those randomised to the OIA arm compared to the IZA arm
(77.4% and 60.7% respectively). Baseline covariate data were available for 796 participants.
This made up the SMM population (Figure 6.13).
Overall, 382 participants experienced an SRE within the 12 month follow-up period (36.8%
of all participants). The percentage of participants who experienced an SRE was higher in
the OIA arm compared to the IZA arm (38.3% and 35.4% respectively). The trial analysis
based on complete cases (and the full study period) demonstrated that the SRE rate was
3.0 percentage points higher in those randomised to the OIA arm compared to in the IZA
(95% confidence interval (CI): -2.9 to 8.8 percentage points) and concluded that OIA was
inferior to IZA.
-15 -10 -5 0 5 10 15 20 25
Structural mean model
Per-protocol
Intention-to-treat
Higher rate in OD arm Higher rate in TDS armDifference in relapse rates after 12 months
Non-inferiority margin
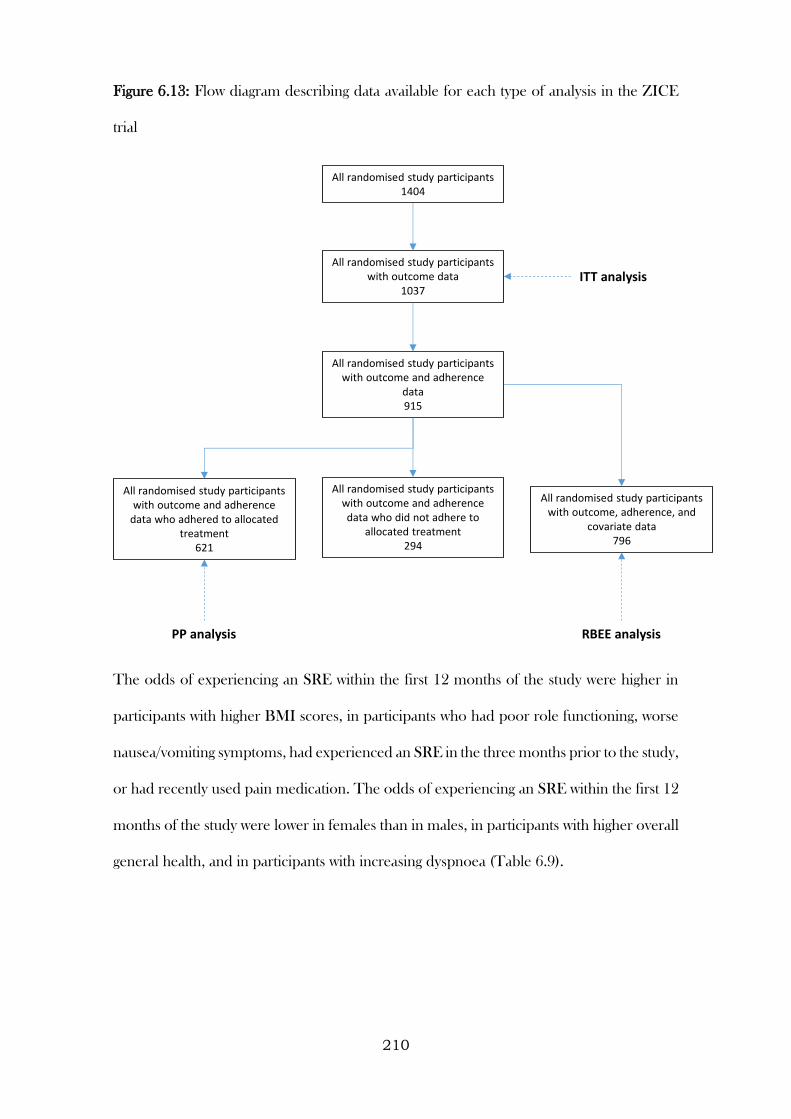
210
Figure 6.13: Flow diagram describing data available for each type of analysis in the ZICE
trial
The odds of experiencing an SRE within the first 12 months of the study were higher in
participants with higher BMI scores, in participants who had poor role functioning, worse
nausea/vomiting symptoms, had experienced an SRE in the three months prior to the study,
or had recently used pain medication. The odds of experiencing an SRE within the first 12
months of the study were lower in females than in males, in participants with higher overall
general health, and in participants with increasing dyspnoea (Table 6.9).
All randomised study participants with outcome data
1037
All randomised study participants1404
All randomised study participants with outcome and adherence
data915
All randomised study participants with outcome and adherence
data who adhered to allocated treatment
621
All randomised study participants with outcome, adherence, and
covariate data796
All randomised study participants with outcome and adherence data who did not adhere to
allocated treatment294
ITT analysis
PP analysis RBEE analysis
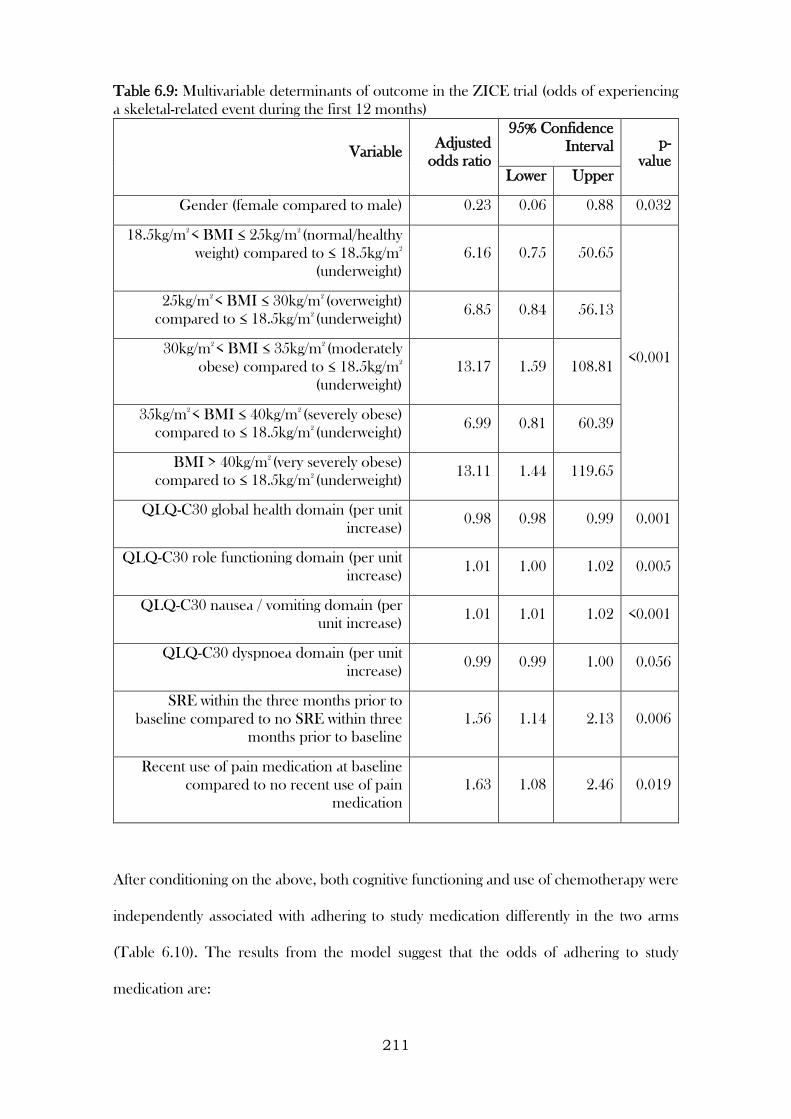
211
Table 6.9: Multivariable determinants of outcome in the ZICE trial (odds of experiencing
a skeletal-related event during the first 12 months)
Variable Adjusted
odds ratio
95% Confidence
Interval p-
value Lower Upper
Gender (female compared to male) 0.23 0.06 0.88 0.032
18.5kg/m2
< BMI ≤ 25kg/m2
(normal/healthy
weight) compared to ≤ 18.5kg/m2
(underweight)
6.16 0.75 50.65
<0.001
25kg/m2
< BMI ≤ 30kg/m2
(overweight)
compared to ≤ 18.5kg/m2
(underweight) 6.85 0.84 56.13
30kg/m2
< BMI ≤ 35kg/m2
(moderately
obese) compared to ≤ 18.5kg/m2
(underweight)
13.17 1.59 108.81
35kg/m2
< BMI ≤ 40kg/m2
(severely obese)
compared to ≤ 18.5kg/m2
(underweight) 6.99 0.81 60.39
BMI > 40kg/m2
(very severely obese)
compared to ≤ 18.5kg/m2
(underweight) 13.11 1.44 119.65
QLQ-C30 global health domain (per unit
increase) 0.98 0.98 0.99 0.001
QLQ-C30 role functioning domain (per unit
increase) 1.01 1.00 1.02 0.005
QLQ-C30 nausea / vomiting domain (per
unit increase) 1.01 1.01 1.02 <0.001
QLQ-C30 dyspnoea domain (per unit
increase) 0.99 0.99 1.00 0.056
SRE within the three months prior to
baseline compared to no SRE within three
months prior to baseline
1.56 1.14 2.13 0.006
Recent use of pain medication at baseline
compared to no recent use of pain
medication
1.63 1.08 2.46 0.019
After conditioning on the above, both cognitive functioning and use of chemotherapy were
independently associated with adhering to study medication differently in the two arms
(Table 6.10). The results from the model suggest that the odds of adhering to study
medication are:
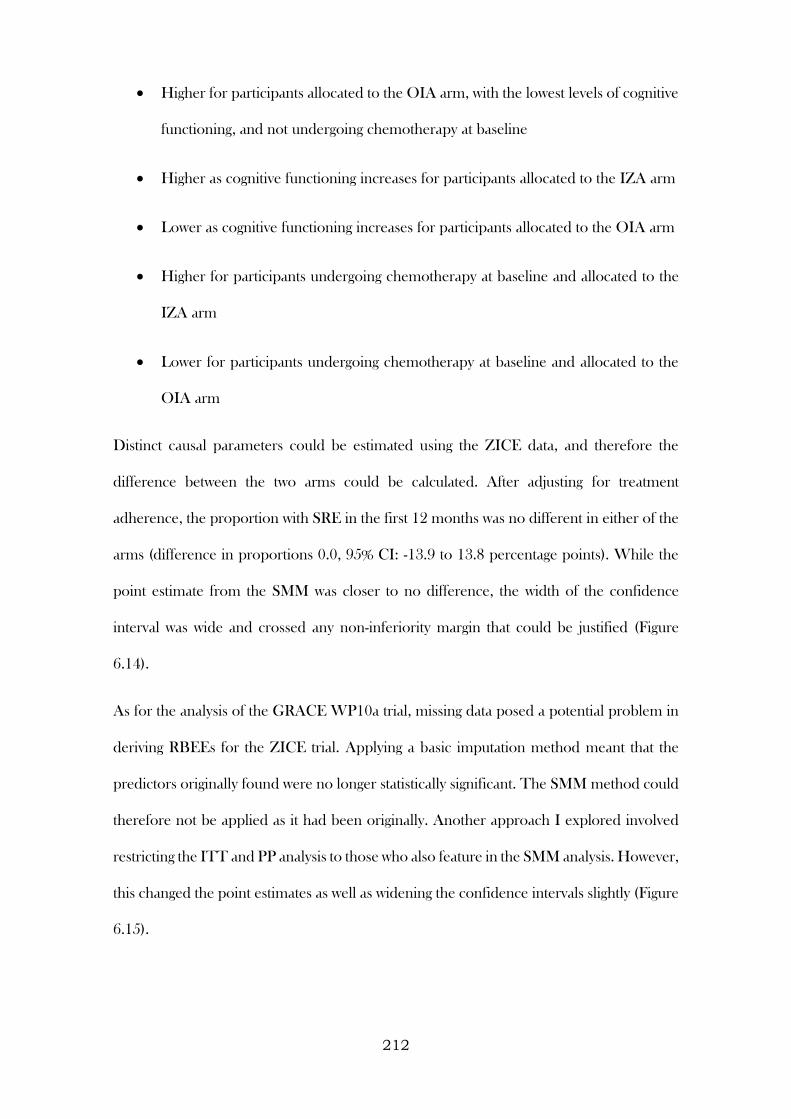
212
Higher for participants allocated to the OIA arm, with the lowest levels of cognitive
functioning, and not undergoing chemotherapy at baseline
Higher as cognitive functioning increases for participants allocated to the IZA arm
Lower as cognitive functioning increases for participants allocated to the OIA arm
Higher for participants undergoing chemotherapy at baseline and allocated to the
IZA arm
Lower for participants undergoing chemotherapy at baseline and allocated to the
OIA arm
Distinct causal parameters could be estimated using the ZICE data, and therefore the
difference between the two arms could be calculated. After adjusting for treatment
adherence, the proportion with SRE in the first 12 months was no different in either of the
arms (difference in proportions 0.0, 95% CI: -13.9 to 13.8 percentage points). While the
point estimate from the SMM was closer to no difference, the width of the confidence
interval was wide and crossed any non-inferiority margin that could be justified (Figure
6.14).
As for the analysis of the GRACE WP10a trial, missing data posed a potential problem in
deriving RBEEs for the ZICE trial. Applying a basic imputation method meant that the
predictors originally found were no longer statistically significant. The SMM method could
therefore not be applied as it had been originally. Another approach I explored involved
restricting the ITT and PP analysis to those who also feature in the SMM analysis. However,
this changed the point estimates as well as widening the confidence intervals slightly (Figure
6.15).
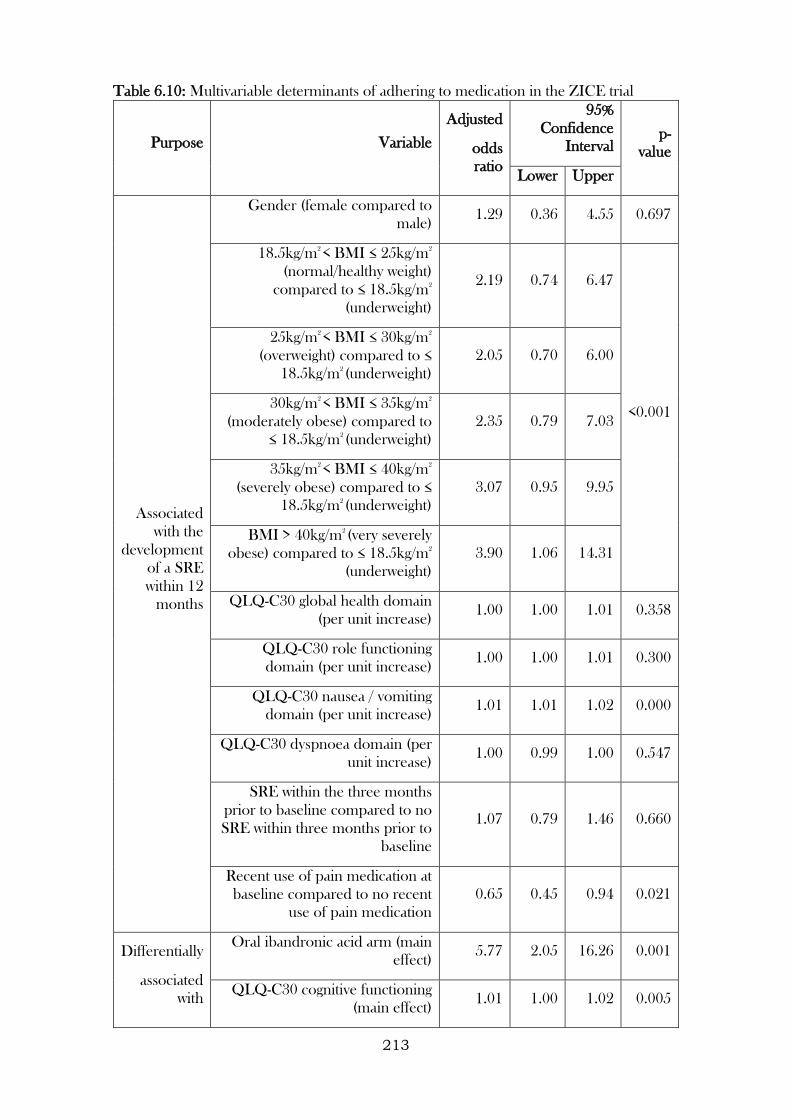
213
Table 6.10: Multivariable determinants of adhering to medication in the ZICE trial
Purpose Variable
Adjusted
odds
ratio
95%
Confidence
Interval p-
value
Lower Upper
Associated
with the
development
of a SRE
within 12
months
Gender (female compared to
male) 1.29 0.36 4.55 0.697
18.5kg/m2
< BMI ≤ 25kg/m2
(normal/healthy weight)
compared to ≤ 18.5kg/m2
(underweight)
2.19 0.74 6.47
<0.001
25kg/m2
< BMI ≤ 30kg/m2
(overweight) compared to ≤
18.5kg/m2
(underweight)
2.05 0.70 6.00
30kg/m2
< BMI ≤ 35kg/m2
(moderately obese) compared to
≤ 18.5kg/m2
(underweight)
2.35 0.79 7.03
35kg/m2
< BMI ≤ 40kg/m2
(severely obese) compared to ≤
18.5kg/m2
(underweight)
3.07 0.95 9.95
BMI > 40kg/m2
(very severely
obese) compared to ≤ 18.5kg/m2
(underweight)
3.90 1.06 14.31
QLQ-C30 global health domain
(per unit increase) 1.00 1.00 1.01 0.358
QLQ-C30 role functioning
domain (per unit increase) 1.00 1.00 1.01 0.300
QLQ-C30 nausea / vomiting
domain (per unit increase) 1.01 1.01 1.02 0.000
QLQ-C30 dyspnoea domain (per
unit increase) 1.00 0.99 1.00 0.547
SRE within the three months
prior to baseline compared to no
SRE within three months prior to
baseline
1.07 0.79 1.46 0.660
Recent use of pain medication at
baseline compared to no recent
use of pain medication
0.65 0.45 0.94 0.021
Differentially
associated
with
Oral ibandronic acid arm (main
effect) 5.77 2.05 16.26 0.001
QLQ-C30 cognitive functioning
(main effect) 1.01 1.00 1.02 0.005
214
Purpose Variable
Adjusted
odds
ratio
95%
Confidence
Interval p-
value
Lower Upper
adherence
by
trial arm
Oral ibandronic acid arm *
QLQ-C30 cognitive functioning
(interaction)
0.99 0.98 1.00 0.061
Use of chemotherapy at baseline
(main effect) 2.12 1.28 3.53 0.004
Oral ibandronic acid arm * Use
of chemotherapy at baseline
(interaction)
0.47 0.22 1.02 0.057
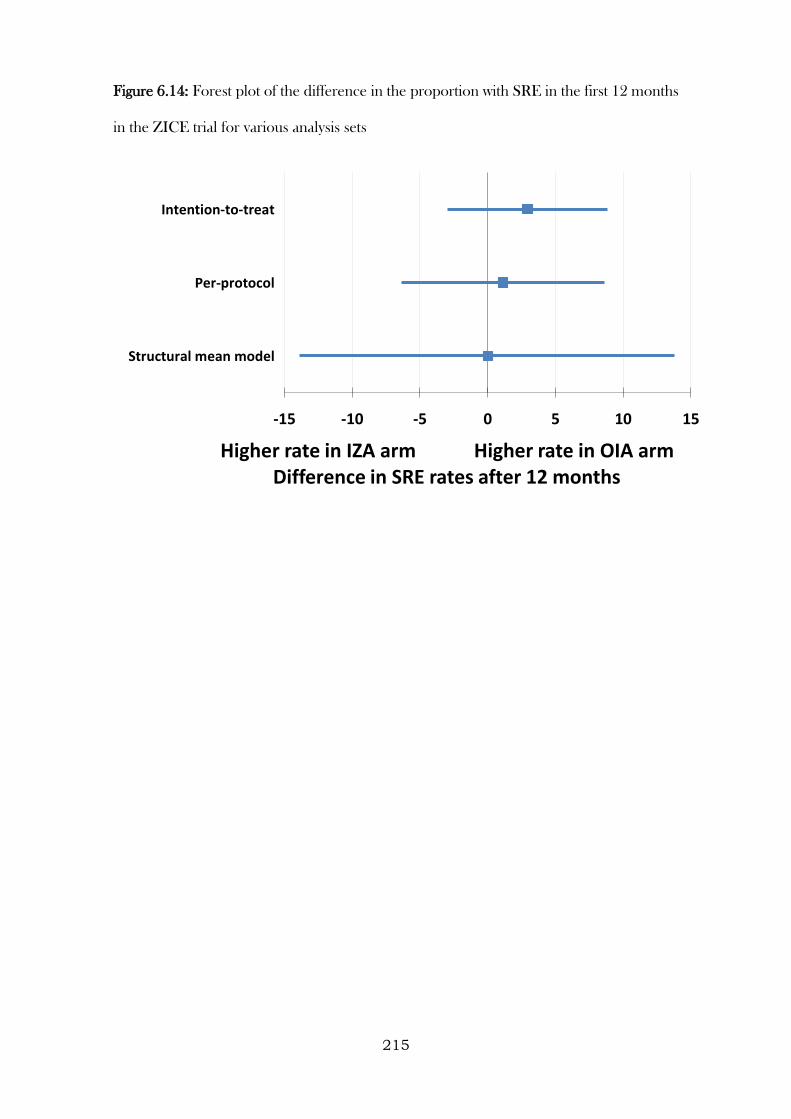
215
Figure 6.14: Forest plot of the difference in the proportion with SRE in the first 12 months
in the ZICE trial for various analysis sets
-15 -10 -5 0 5 10 15
Structural mean model
Per-protocol
Intention-to-treat
Higher rate in IZA arm Higher rate in OIA armDifference in SRE rates after 12 months
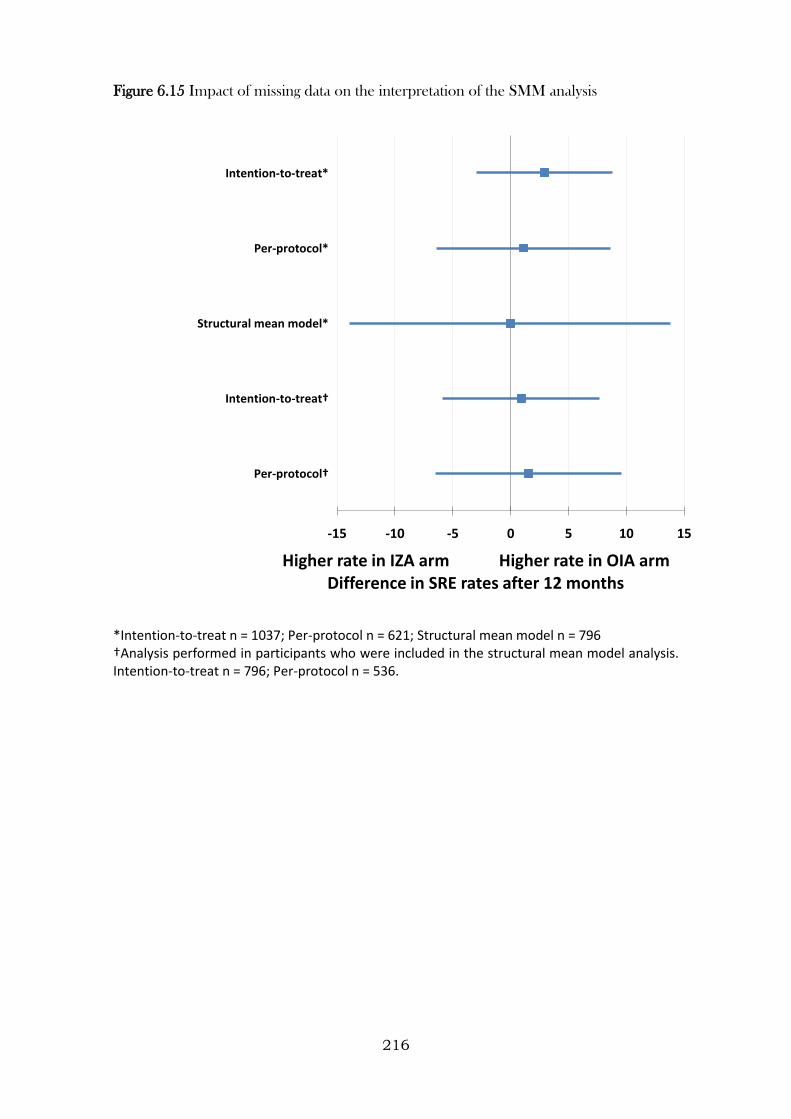
216
Figure 6.15 Impact of missing data on the interpretation of the SMM analysis
*Intention-to-treat n = 1037; Per-protocol n = 621; Structural mean model n = 796 †Analysis performed in participants who were included in the structural mean model analysis. Intention-to-treat n = 796; Per-protocol n = 536.
-15 -10 -5 0 5 10 15
Per-protocol†
Intention-to-treat†
Structural mean model*
Per-protocol*
Intention-to-treat*
Higher rate in IZA arm Higher rate in OIA armDifference in SRE rates after 12 months
217
6.4 Discussion
6.4.1 Summary
In this Chapter, the feasibility of implementing RBEEs to adjust findings of RCTs for
medication non-adherence was explored using data from three clinical trials. Several design
considerations were investigated, including whether the trial was designed to investigate the
superiority or non-inferiority of one treatment to a comparator, whether a placebo or active
treatment was used as a comparator, and what the comparison of interest was (e.g.
difference in means, difference in proportions, odds ratio). Sensitivity analyses were also
conducted to examine the robustness of the methods under a various assumptions,
including assumptions related to missing adherence and outcome data.
6.4.2 Learning points
1. Clinically:
a. The findings from the GRACE WP10a trial suggest that taking amoxicillin
improved (i.e. further reduced) symptom severity on days 2-4 (compared to
the effect of it merely being prescribed, regardless of the extent to which
participants adhered to treatment), further decreased the odds of
developing new or worsening symptoms, and further increased the odds of
reporting side effects. Nevertheless, due to the high levels of adherence to
study medication, the findings of the original effectiveness analyses were
reasonably robust to departures from randomised treatment.
b. In the CODA trial, it was not possible to derive distinct estimators, and
standard SMM methods were applied instead, treating the active control
arm in the same way that a placebo arm would be treated. This analysis was
consistent with the ITT and PP findings (i.e. there was evidence to suggest
that OD was not inferior to TDS in terms of preventing relapse). The
218
reasons for this are likely threefold: (1) a limited set of baseline predictors
that were not selected with the different treatment regimens in mind; (2) a
small sample size, limiting the probability of detecting differences where
they exist (i.e. power); (3) the lack of an adherence measure on all
participants that adequately captured patterns in adherence, rather than just
overall consumption. As the two treatments being compared were identical,
and the only difference was their prescribed regimen, it would be difficult
to find discernible differences between arms (as already indicated during
Chapters 4 and 5).
c. In the ZICE trial, it was possible to derive distinct estimators, and when
comparing the arms the point estimate implied no difference in SRE rates
between the arms, but the confidence intervals were considerably wider than
the intention-to-treat and per-protocol analyses.
2. Methodologically, the use of SMMs to adjust trial findings for non-adherence is
attractive, as it allows for a comparison of groups that is independent of measured
and unmeasured confounders. It is also straightforward to apply these techniques
with minimal programming skills, and I have created a graph to depict a linear SMM
– something that illustrates the technique, its assumptions, and how the efficacy
estimate relates to effectiveness. However, for these approaches to be valid, they
rely on the key assumption that for participants who were categorised as non-
adherers, merely being allocated to receive treatment had no effect on outcome (the
so-called ‘exclusion restriction’). While this was likely to be a valid assumption for
the GRACE WP10a trial, as participants and clinicians were blinded to allocation,
this is less likely to be valid for non-blinded studies (for example, a two-arm
randomised controlled trial of a weight loss intervention (versus no intervention),
where participants are aware that the focus is on bodyweight).
219
3. Treating adherence as a continuous measure in the GRACE WP10a trial (and
generally) made the exclusion restriction more plausible, as the lowest level of
adherence could be defined as receiving no treatment, a level at which being
allocated to either treatment group should really have no effect on outcome.
However, this approach made the additional assumption that the effect of receiving
an increasing amount of treatment on outcome increased linearly, which for a trial
involving medication is unlikely to be true. Sensitivity analyses were conducted using
various binary definitions of adherence, ranging from one or more tablets (versus
no tablets) to full course (versus less than full course). While the former increased
the plausibility of the exclusion restriction, the estimated treatment efficacy was too
conservative. The latter analysis combined participants who would have taken 99%
of their medication with participants who would have taken no medication and
considered them all as not adhering (and therefore assumed they would have
received no benefit from being allocated to the amoxicillin arm). This clearly
violated the exclusion restriction. However, the findings from the sensitivity analyses
largely agreed with the main findings (where adherence was measured
continuously), adding further strength to the conclusions drawn in this Chapter.
Similar issues were present in the CODA and ZICE trials.
4. While these methods are particularly desirable for NI trials, as neither of ITT or
PP analysis provide both a conservative and unbiased comparison of treatments,
this work highlights the increase in variance when fitting these models, something
that can only be reduced when the models include strong predictors of adherence
and outcome. Use of the method is more accurate in terms of reducing selection
bias, but the reduced precision necessitates the collection of relevant and complete
baseline variables. To do this, the research team must have a good understanding
of the predictors of outcome, and also the barriers and facilitators to adhering to
220
the randomised treatments. Studies with feasibility or pilot stages could explore
these aspects, as well as how best to capture this data, before progressing onto more
definitive studies. The significance thresholds for inclusion of variables in this paper
were higher than current practice. Future studies that collect strong baseline
predictors of adherence need not use such high significance levels.
5. By modelling the determinants of differential adherence in the different treatment
arms, researchers will also gain an understanding of the circumstances under which
the treatments will be better received by patients, and therefore more likely to work.
For example, in the ZICE study, we were able to demonstrate that for participants
allocated to the intravenous zoledronic acid arm, adherence was higher for patients
with higher cognitive function and for those receiving chemotherapy at baseline,
whereas for those allocated to the oral ibandronic acid arm adherence was lower
for patients with lower cognitive function and for those receiving chemotherapy at
baseline. One explanation for this could be that patients with low cognitive function
could have their medicines dispensed by a care giver, which is likely to reduce
forgetfulness and increase adherence. Patients receiving chemotherapy at baseline
will be attending hospital regularly for these visits, and the delivery of IZA often
coincided with other hospital visits for cancer therapy, thereby increasing their
chances of receiving IZA treatment. The implications of this, regardless of the
comparative efficacy of the treatments themselves, could be that IZA should be
offered to those undergoing additional cancer treatments (or any other treatments
that require regular hospital visits). OIA could be offered along with an additional
intervention to increase adherence (e.g. a reminder or monitoring system), or in
instances where patients were not in control of their own medication dispensing
(e.g. elderly nursing home residents).
221
6. Despite the fact that incomplete outcome and adherence data were minimal, their
impact on findings remains unknown. However, for the GRACE WP10a trial, as
the condition under investigation is generally self-limiting, and outcome data
included worsening of illness (a composite outcome collected from medical notes
that included hospitalisation), we do not believe that the small amount of missing
data would have severely impacted on the findings or conclusions drawn from this
study. Indeed, the further sensitivity analyses conducted, where missing data were
taken into account, demonstrated that clinical conclusions remained largely
unaltered, even when taking an extreme assumption about missing adherence data.
Similarly for the ZICE trial, an assessment of the impact of missing data on the
interpretation of the SMM analysis was performed as a sensitivity analysis with
conclusions remaining largely the same.
222
CHAPTER 7: Discussion
7.1 Summary and interpretation of findings
The aim of this thesis was to investigate various methodological challenges encountered
when studying medication adherence in clinical research, generating new evidence that
would advance the field, and indicating areas in which further developments are warranted.
During my literature review in Chapter 2, I identified gaps and deficiencies in knowledge
pertaining to the measurement of medication adherence, modelling of electronic
monitoring data over time, considerations when multiple types of measure are used (and
disagree), approaches to modelling determinants of medication adherence, and the
feasibility of implementing randomisation-based efficacy estimators in randomised trials
with non-adherence.
I explored these areas using data from three studies, described in detail in Chapter 3. These
studies were chosen as they encompassed contrasting clinical conditions (ranging from short
to long-term conditions), study designs (randomised controlled trials and observational
studies), had multiple types of measures (self-report, tablet counts, electronic monitoring),
and the randomised controlled trials varied in their comparators (placebo, same drug but
different regimen, and different drug and different route of administration). Substantive, as
opposed to synthetic data were used, as the new evidence generated would be of clinical
relevance, and it was my intention to demonstrate the utility and limitations that can be
encountered when investigating these methods in practice.
In Chapter 4, I compared several types of methods used to measure adherence to
medication in clinical research, using a variety of correlational and agreement approaches.
I explored the use of advanced modelling techniques to maximise the utility of electronic
monitoring data collected over a 12-month time period. I also considered other ways in
which studies could make use of adherence data when captured via multiple routes, namely

223
the development of prediction models for disagreement, and several approaches to creating
a calibrated adherence measure. I used generalised linear mixed models, accounting for
the correlated nature of repeated observations within individuals, and modelled non-linear
time effects using splines, to investigate patterns in adherence over time using electronic
monitoring data. This made better use of the data, compared to summarising adherence
over the study period, as it enabled differences between and within individuals to be
described, and allowed behavioural patterns to be investigated (e.g. white coat adherence
and different patterns during the week compared to at weekends). I found that, according
to electronic monitors, patients on more complex dosing regimens adhered less well, and
were considerably more variable, than those on simpler regimens. Nevertheless, for both
regimens, adherence decreased over time similarly (on average). This may reflect treatment
fatigue (patients struggling to maintain the constant routine of taking medication over a long
time period) or perhaps treatment optimisation (patients developing an understanding on
what works for them in terms of how they take their medication). There was evidence to
suggest adherence improved around clinic visit dates, a hypothesised indicator of white coat
adherence. In addition, there was evidence to suggest that adherence was worse on
weekends than on weekdays. This comparison was chosen as, for the majority of people,
routines tend to be different during weekdays than during weekends, largely down to
patterns in work (e.g. the Monday to Friday 9-5 routine). It was therefore suggested that this
break in routine may impact on levels of adherence. This was also found in the seminal
paper by Vrijens et al., 2008. The absence of differential effects by regimen for these two
behavioural patterns adds weight to these being naturally occurring behaviours, rather than
artefacts of the regimen a person was on.
I found that, like other method comparison research, correlations can provide misleading
evidence of the performance of two measures that aim to measure the same phenomena.
Analytical approaches for measuring agreement exist, and depending on whether
224
adherence can be summarised as a binary or continuous scale different approaches can
provide information on the extent and nature of disagreement. Where agreement was a
focal point in the previously identified literature, most relied on taking an arbitrary cut-off
of adherence and reporting kappa statistics. My thesis aimed to move beyond that,
providing visual and quantitative representations of agreement, using both binary and
continuous measures. Bangdiwala observed agreement plots provided this for binary
adherence measures. I considered ways of enhancing these plots, for example by overlaying
them with reference lines to indicate agreement that would be expected by chance (akin to
a visual representation of a kappa statistics). Bland-Altman plots and limits of agreement in
particular can provide a wealth of information about the level of agreement between two
types of adherence measures, provided they can both be summarised on a continuous scale.
I identified a nuance with the Bland-Altman approach that, to my knowledge, has not been
remarked upon previously. When plotted on its full scale (i.e. both axes spanning the entire
range of possible values), the data points are bounded within a restricted space. For
example, when comparing two measures, both on a scale from 0 to 100, they can be as
extreme as [50, -100], but nothing beyond this (e.g. they cannot be [60, -100] or [20, 100]).
This may have implications for the 95% confidence intervals and limits of agreement
around the bias (e.g. it may be more appropriate to fit non-linear confidence intervals or
limits of agreement to these data). Clinically, I found that when comparing adherence as
measured via tablet counts and electronic monitoring, disagreement largely occurred for
participants on the three times daily dosing regimen, with adherence consistently higher
when measured by tablet counts than when measured by electronic monitoring. There is a
wealth of literature devoted to describing the biases that may occur from measuring
medication adherence using tablet counts (e.g. so-called “pill dumping”). However, the fact
that this disagreement is overwhelmingly seen in patients on the three times daily regimen
is intriguing. One plausible explanation for this finding is that patients opened their

225
container once and took all three tablets out (for example, so they did not have to carry the
medication bottle with them throughout the day). If this were true, it would highlight a
deficiency in the use of electronic monitoring for patients on complex regimens, on the
grounds of both validity and acceptability. In practice, using several types of adherence
measures implies a lack of trust of any one type of measure.
While the vast majority of work to date correlates or assesses agreement between the
different measures, I felt it was important to exploit this even further, and explore different
ways of predicting disagreement and deriving calibrated adherence measures. I used several
regression models to investigate predictors of disagreement. Each model provided different
information (predicting agreement or disagreement, direction of disagreement, and
direction and extent of disagreement), and while different contexts could mean any of the
models could be beneficial, in the context used in this thesis, I found that while certain
variables predicted disagreement and the direction of disagreement, the extent of
disagreement (and arguably the importance of the disagreement) was minimal. A
description of the predictors of disagreement will be described in more detail later on in
the Chapter. The different calibration approaches I explored made only minor differences
to reported summary measures of adherence. However, this will not be the case in all
instances. Using a calibrated adherence measure allows a researcher to maximise the
amount of adherence data available and/or report a measure that has some correction for
potential misreporting, depending on the approach used and purposes of using the
adherence estimate.
In Chapter 5, I investigated various methods for modelling the determinants of adherence.
The determinants of adherence were compared across different types of methods used to
measure adherence within the same study, different clinical conditions (acute lower-
respiratory-tract infection, ulcerative colitis, and breast cancer with bone metastases),
different study designs (observational study and RCT), and using different
226
conceptualisations of adherence (a single summary measure or as distinct processes). I
found that different types of adherence measures can have an influence on the determinants
that can be found. This strengthens the importance of considering appropriate adherence
measures prior to conducting a study. For example, in a trial of two different dosing
regimens (but where participants in both groups were expected to consume the same
quantity of tablets), tablet count data will provide a measure of consumption, but will not
be able to provide particularly sensitive data on patterns of adherence. This work has led
me to consider adherence more in line with the general framework around the
development and validation of outcome measures. This is something I will write about in
more detail later on in this Chapter.
The complexity of the treatment was one determinant that was consistently associated with
adherence across all clinical conditions. Other determinants found to be associated with
adherence, but not consistently across conditions, were age, gender, social functioning (the
ability to interact with others in a normal way in society), days waited prior to consulting,
clinical signs (both for the acute condition), as well as some country or structural
determinants (countries in which a sick certification is required for missing fewer than seven
days of work or in which single-handed practices (i.e. one clinician treating all patients) were
widespread). Through the use of multilevel analysis, I was also able to quantify the extent
to which the treating clinician influenced whether a patient adhered to their treatment. This
is a determinant of medication adherence often reported in the literature, but only using
qualitative data. The approach I have taken is novel and important, as it goes further than
an acknowledgement that clinicians can influence medication taking behaviour and
provides estimates of the extent to which they do influence this behaviour. I also
demonstrated that separating adherence out into distinct processes is not only useful when
summarising the extent to which patients took their medicine, but also for investigating the

227
determinants of adherence. Indeed, I found different determinants for each of the
processes. I will provide further detail of the implications of this later in this Chapter.
While initiation and implementation are vital processes for all medication taking (both
short and long-term treatments), my investigations left me unconvinced of the necessity of
investigating the determinants of time from initiation to discontinuation for short-term
conditions. This is not necessarily a process that would become a target for improvements,
particularly for treatments such as antibiotics where sub-optimal implementation, for a
prolonged period of time, could heighten the risk of carrying antibiotic resistant organisms.
Despite this, depending on the type of adherence measure available, time from initiation
to discontinuation may be the only metric that can be reliably estimated. Determinants were
grouped into five dimensions, following the framework laid out in Sabaté, 2003. What
became clear when looking at the variables available in my datasets, and grouping them into
these dimensions, was that while factors related to patients, conditions, and therapies were
often available, factors related to social/economic or healthcare professionals/systems were
rarely present. This may be due to a perception that they are likely to be less associated
with clinical outcomes than other dimensions and due to a balance between measuring
everything that is of interest and minimising response burden. Nevertheless, where a
treatment is efficacious, poor adherence will have an impact on clinical outcomes
(adherence is clearly on the causal pathway to clinical outcome), so a consideration of
variables to collect that are related to both adherence and outcomes is needed. I make
recommendations based on this at the end of this Chapter.
An interesting observation is that there was considerable overlap when comparing the
determinants of adherence in Chapter 5 and the determinants of disagreement between
different types of adherence measures in Chapter 4 (Table 7.1). The three determinants
that were found to be associated in both Chapters all went in the same direction. That is,
participants were more likely to provide adherence measures that agreed and more likely
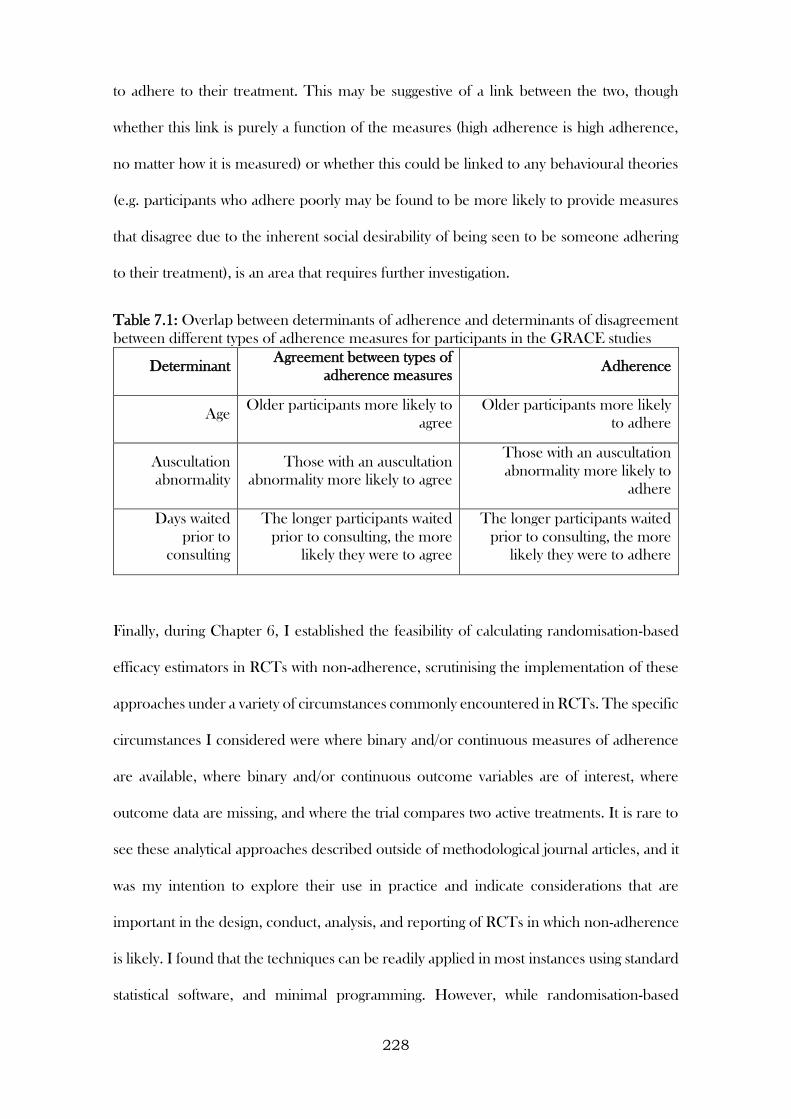
228
to adhere to their treatment. This may be suggestive of a link between the two, though
whether this link is purely a function of the measures (high adherence is high adherence,
no matter how it is measured) or whether this could be linked to any behavioural theories
(e.g. participants who adhere poorly may be found to be more likely to provide measures
that disagree due to the inherent social desirability of being seen to be someone adhering
to their treatment), is an area that requires further investigation.
Table 7.1: Overlap between determinants of adherence and determinants of disagreement
between different types of adherence measures for participants in the GRACE studies
Determinant Agreement between types of
adherence measures Adherence
Age Older participants more likely to
agree
Older participants more likely
to adhere
Auscultation
abnormality
Those with an auscultation
abnormality more likely to agree
Those with an auscultation
abnormality more likely to
adhere
Days waited
prior to
consulting
The longer participants waited
prior to consulting, the more
likely they were to agree
The longer participants waited
prior to consulting, the more
likely they were to adhere
Finally, during Chapter 6, I established the feasibility of calculating randomisation-based
efficacy estimators in RCTs with non-adherence, scrutinising the implementation of these
approaches under a variety of circumstances commonly encountered in RCTs. The specific
circumstances I considered were where binary and/or continuous measures of adherence
are available, where binary and/or continuous outcome variables are of interest, where
outcome data are missing, and where the trial compares two active treatments. It is rare to
see these analytical approaches described outside of methodological journal articles, and it
was my intention to explore their use in practice and indicate considerations that are
important in the design, conduct, analysis, and reporting of RCTs in which non-adherence
is likely. I found that the techniques can be readily applied in most instances using standard
statistical software, and minimal programming. However, while randomisation-based
229
efficacy estimators are an attractive prospect, in terms of their ability to eliminate selection
bias, this generally comes at a cost of increased variance (i.e. less precision around
estimates), and additional assumptions that may not always be possible to satisfy. For
example, one of the core assumptions (the exclusion restriction), relies on there being no
benefit gained from being allocated to receive treatment for non-adherers. When
adherence is all-or-nothing (e.g. a single tablet), this assumption is rather plausible.
However, when adherence is not all-or-nothing (e.g. two tablets, three times a day, for seven
days), how you summarise the measure of adherence influences the plausibility of this
assumption. Taking a cut-off at 100% for example (i.e. all medication consumed as
prescribed), makes the assumption that anyone who would adhere less than this (anywhere
between no medication consumed to 99% of medication consumed accurately) would
receive no benefit from being allocated to receive treatment. Options I explored to
circumvent this issue involved creating different cut-offs (initiated treatment versus not;
adhered for the first five days versus not) and treating adherence as a continuous measure,
the latter of which relied on the additional assumption that the effect of treatment was
linearly related to the level of adherence, an assumption that is also unlikely to be plausible,
given that log dose-response curves are generally sigmoidal.
I constructed a graph of a randomisation-based efficacy estimator that used a continuous
adherence measure, illustrating the increasing efficacy as adherence increased, and how
these estimates related to the original effectiveness estimates. Under the assumption of
linearity, this is a valuable way of presenting the findings from this analysis, as it shows the
exclusion restriction assumption clearly (at the co-ordinate [0, 0]), the increase in efficacy
as adherence increases, the effectiveness estimate (at the level of adherence achieved during
the trial), and the potential effect of treatment in those who fully adhered (Figure 7.1).
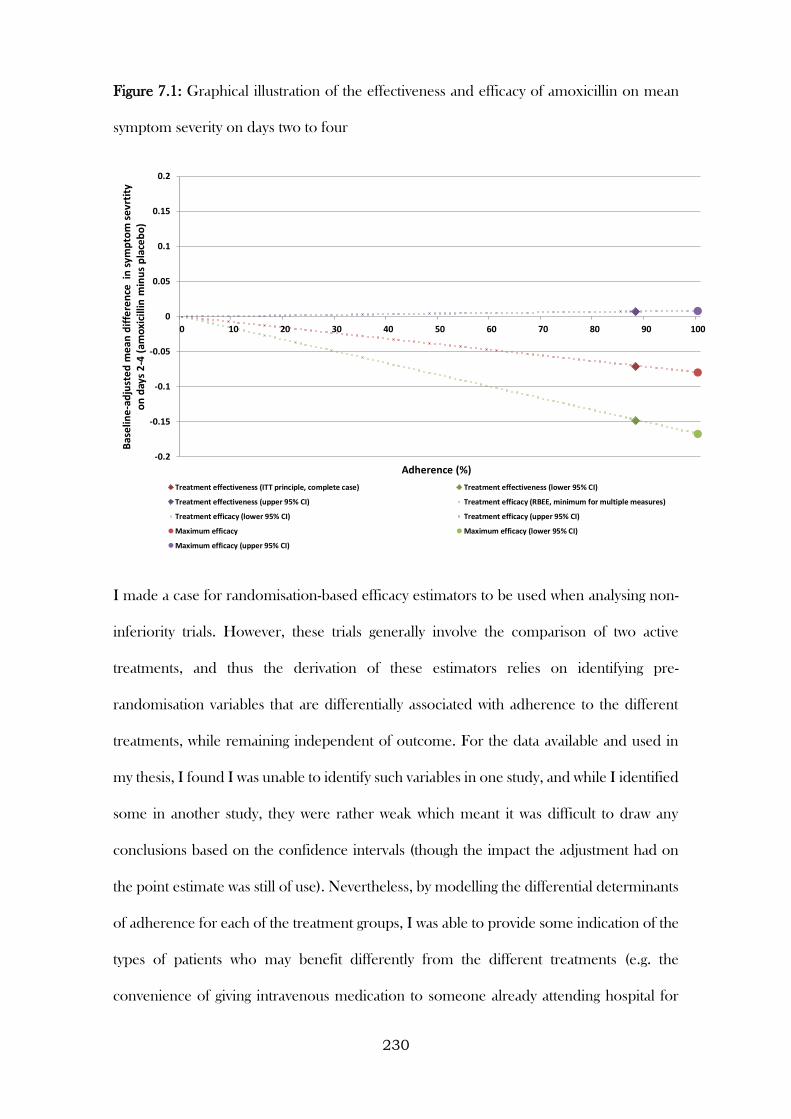
230
Figure 7.1: Graphical illustration of the effectiveness and efficacy of amoxicillin on mean
symptom severity on days two to four
I made a case for randomisation-based efficacy estimators to be used when analysing non-
inferiority trials. However, these trials generally involve the comparison of two active
treatments, and thus the derivation of these estimators relies on identifying pre-
randomisation variables that are differentially associated with adherence to the different
treatments, while remaining independent of outcome. For the data available and used in
my thesis, I found I was unable to identify such variables in one study, and while I identified
some in another study, they were rather weak which meant it was difficult to draw any
conclusions based on the confidence intervals (though the impact the adjustment had on
the point estimate was still of use). Nevertheless, by modelling the differential determinants
of adherence for each of the treatment groups, I was able to provide some indication of the
types of patients who may benefit differently from the different treatments (e.g. the
convenience of giving intravenous medication to someone already attending hospital for
-0.2
-0.15
-0.1
-0.05
0
0.05
0.1
0.15
0.2
0 10 20 30 40 50 60 70 80 90 100
Bas
elin
e-a
dju
ste
d m
ean
dif
fere
nce
in
sym
pto
m s
evr
tity
o
n d
ays
2-4
(am
oxi
cilli
n m
inu
s p
lace
bo
)
Adherence (%)
Treatment effectiveness (ITT principle, complete case) Treatment effectiveness (lower 95% CI)
Treatment effectiveness (upper 95% CI) Treatment efficacy (RBEE, minimum for multiple measures)
Treatment efficacy (lower 95% CI) Treatment efficacy (upper 95% CI)
Maximum efficacy Maximum efficacy (lower 95% CI)
Maximum efficacy (upper 95% CI)

231
another reason). In addition, I considered the impact of missing adherence data on these
analytical methods, conducting several sensitivity analyses to explore the impact of varying
assumptions regarding missing mechanisms on the findings.
7.2 Novel aspects of this work
The work presented in this thesis is both clinically and methodologically novel.
Methodologically, I have demonstrated an approach to modelling and graphically
illustrating electronic monitoring data of daily medication adherence that is innovative.
Certainly, plotting the predicted probability of adherence curves for each individual and
overlaying this with their raw data is something rather unique. When investigating
agreement, I have considered a useful extension to the Bangdiwala observer agreement
plots by overlaying these with reference domains that indicate chance agreement. I have
identified bounded regions within the Bland-Altman plots that may have implications for
how confidence intervals and limits of agreement are constructed in future method
comparison studies. I have produced a graphical illustration of the randomisation-based
efficacy estimator, when adherence is treated as a continuous measure. This is a convenient
way of illustrating a concept that is difficult to grasp for both applied researchers and
clinicians alike. I have also implemented randomisation-based efficacy estimators in non-
inferiority trials, critically considering the uses and limitations of these methods on real
world data. To date, this is something that has only been considered in theory, so the work
presented in this thesis is the first of its kind.
Clinically, I have reported on the first study to electronically monitor medication adherence
in adults in remission with ulcerative colitis. Adherence is a major concern for this
condition, hence the move to evaluating simplified dosing regimens. By modelling
adherence in patients over time and considering behaviour patterns of non-adherence, this
study provided significant advances in this clinical area. I have also conducted the first study
232
that separately investigated the determinants of initiation, implementation, and
discontinuation of antibiotic treatment. Within this work, I have also provided estimates of
variation in initiation and implementation that is attributable to differences between
clinicians (and countries / healthcare settings). That is, a quantitative (rather than qualitative)
estimate of the amount influence clinicians / healthcare settings have on an individual’s
propensity to initiate treatment or implement their treatment correctly on a given day. This
work is not only of clinical importance, but also provides a framework for future studies
aiming to measure this quantitatively.
The findings presented in Chapters 4, 5, and 6 of this thesis have formed the basis of four
publications, each of which have been published in peer-reviewed journals (Inflammatory
Bowel Diseases, BMJ Open, BMC Trials, and Patient Preference and Adherence). This
adds further strength to this body of work, demonstrating that the contributions I have made
are of importance and value to the scientific community. See Appendix IV for the papers,
as well as a diagram illustrating how they link to Chapters 4, 5, and 6. In addition, I have
presented work related to my PhD at various national and international conferences, in
order to increase awareness of the medication adherence field more generally (but
specifically the methodological challenges herein). See Appendix V for more details.
Alongside this, I have also discussed and piloted some of these ideas with colleagues in the
Centre for Trials Research. The feedback I have received to date has been positive, with
the figures seen as useful visualisations of either complex or abstract methodological topics.
For example, the variability displayed by the spaghetti plot (Figure 4.8 in Section 4.3.3) was
something not immediately apparent when reading the parameter estimates from the
preceding Table (Table 4.5). This plot therefore enhanced the understanding of the
findings from merely a difference between regimens for the fixed effects (averaged across
participants) to also a higher degree of variability for participants allocated to the TDS
233
regimen, something that would be an important consideration for a prescriber / healthcare
professional.
7.3 Limitations
While I discussed the rationale for using real world data earlier in this Chapter, there are
some limitations to taking this approach. Being limited by the sample size of the original
study meant that extra care was required when interpreting a lack of evidence of any
association examined. This could indeed imply there was no (or limited) association, or
could be due to a lack of power to detect an association. As the data used throughout this
thesis came from previously conducted studies, I had no influence on the variables that
were collected, or types of adherence measures used, at the time I began my studies. There
are several examples of these limitations.
In the CODA study, an OD regimen was compared against a TDS regimen, with the TDS
regimen chosen as the comparator, as it was deemed the most logical way to divide 3 tablets
over the course of the day and is still used by a substantial number of gastroenterologists.
(Sandborn et al., 2010) Although there is evidence of medication adherence issues for TDS
regimens, less pronounced differences have been shown when comparing OD regimens
with BD regimens. (Eisen et al., 1990)
In the GRACE studies, the analysis of determinants focused on adherence to amoxicillin
prescriptions for immediate use only. While this reduces the potential number of
participants (other antibiotics were prescribed and delayed prescriptions were given in the
included observational studies), it allowed for the investigation of the impact of the dose,
frequency, and duration without being confounded by type of antibiotic prescribed. Since
Amoxicillin is the most commonly prescribed and recommended antibiotic for acute
respiratory infections across Europe, (Butler et al., 2009, Wood et al., 2011) the results
retain wide applicability. Advice regarding delayed prescriptions, while also recommended
234
for this condition, (Francis et al., 2012) are often vague (for example, “here is a prescription
if you get any worse”), and may have been issued with the intention that the patient would
never actually take antibiotic treatment. The work presented in this thesis assumes that
amoxicillin was prescribed for immediate use by a clinician with the intention that it would
be taken as prescribed.
I used a simplified version of the original primary outcome in the ZICE study in order to
illustrate the use of randomisation-based efficacy estimators in non-inferiority trials. One
consequence of this is that while a non-inferiority margin was defined for the original
primary outcome, one was not defined for the simplified version. While this could have
limited the interpretation of this analysis, the confidence intervals were too wide for any NI
margin to be justified, even post hoc (given that the original trial analysis suggested
inferiority, this was a simplified outcome that would have had lower power than a recurrent
event outcome, and the confidence interval of the SMM analysis was over twice as wide as
the ITT and PP analyses).
In terms of the types of adherence measures that were used, although self-reports are
simple, cheap, and convenient to implement, particularly when regular follow-up visits are
scheduled and the study runs over a long time period, recall is not always perfect, and
participants are not always accurate. A participant who forgot to take his medication may
have had no conscious recollection that he forgot his medication. (Cramer and Spilker,
1991) The use of a validated questionnaire to capture self-reported adherence may have
also provided a greater level of understanding of the circumstances around any non-
adherence (e.g. intentional or unintentional) than the self-report questions that were asked
in these studies. (Horne and Weinman, 2002) In the GRACE studies, adherence was
primarily measured using prospective self-report diaries. While this type of measure
remains prone to similar biases, collecting these data prospectively and frequently may
improve recall biases and hence be an improvement over retrospectively collected self-
235
report data with a longer recall period (Lu et al., 2008) where unintentional non-adherence
is an issue. However, questions in the diary only asked about daily use of treatment. We
have therefore had to assume that if a participant reported that they consumed amoxicillin
on a given day, they consumed the correct number of doses and these doses were spread
evenly throughout the day – an assumption that could have been checked with a measure
such as electronic monitoring. Similarly, adherence measured through tablet counts is
simple, cheap, and convenient. However, mistakes in counting, intentional increases in
medication around follow-up visits (so-called “white coat” adherence), and intentional tablet
misrepresentation (e.g., by not bringing all medication to follow-up visits) (Vermeire et al.,
2001) may have distorted the true number of tablets taken. There may have been social
desirability factors that influenced participants to intentionally misrepresent their level of
adherence. (Farmer, 1999) Electronically monitored adherence yields data that have a high
level of granularity, though it remains difficult to determine whether the correct numbers
of tablets are removed and ingested at each dosing event. (Kenna et al., 2005) Coupled with
the increased bulk of the bottle (compared to a standard bottle), there remains
disadvantages to their implementation, particularly for patients taking several doses of
medication a day. Variables that might have been important to capture were omitted from
the studies considered. For example, social / economic determinants were missing from
most of the studies, as were structural determinants. No study collected data on
medication/illness concerns, beliefs, or preferences prior to being prescribed medication.
This has been shown to be a powerful predictor of intentional non-adherence. (Horne and
Weinman, 1999, Benedetti et al., 2011) Without simulated data, and hence knowledge
about the truth (in our case, the real adherence level of a participant), it is difficult to assess
the performance of some of the methods used during the thesis. Finally, use of real world
data means that it is difficult to generalise some of these findings beyond the clinical setting
in which the studies were conducted, or indeed specific type of measure that was used (e.g.

236
it would be difficult to extrapolate the findings based on prospective self-report diaries to
other forms of self-report, such as retrospective validates self-report questionnaires).
However, while this is true for the specific clinical findings (for example: prospective self-
report diaries and tablet count adherence data had high levels of agreement, clinicians
accounted for approximately 20% of the total variation in whether a patient initiated their
amoxicillin, fully adhering to a seven-day prescription of amoxicillin lowers your odds of
developing new or worsening symptoms within four weeks, but increases your odds of
reporting non-respiratory symptoms also), the general principles that I have discussed in
detail throughout this Chapter can be generalised.
Throughout my thesis, multivariable regression models have been built using a single
standardised approach. That is, first by considering candidate predictors and whether they
had a sound basis for consideration, second by screening chosen variables in univariable
analyses, and then, depending on the outcome of these, building a multivariable model
using a backward selection process. While this approach is criticised for overfitting (that is,
yielding estimates that do not reflect the overall population), there is no universally agreed
approach to selecting variables in a multivariable regression model. The rationale behind
the approach I have taken is that I wanted to develop simple models, with unnecessary
predictors removed, in order to reduce the risk of finding spurious relationships to random
error. Other approaches exist for selecting variables (e.g. forward selection, ridge
regression, lasso, etc.). However, when developing these models, the purpose was to
develop a set of predictors that succinctly described the relationship they had with the
outcome of interest (usually a measure of adherence), rather than to compare the
performance of different variable selection methods. Overfitting is an ever-present concern
when developing and generalising the findings from a model beyond the data in which it
was developed. The associations found in the models developed throughout my thesis
237
require further understanding (and validating on external data). This is something I also
indicate in the next section.
7.4 Comparisons to existing literature
Levels of medication adherence in the CODA study were generally high, as found in other
trials measuring adherence in UC. (Farup et al., 2001, Prantera et al., 2005) Indeed,
adherence levels were higher than those reported in prospective community-based studies
of patients with UC, (Kane et al., 2001) which is to be expected given both the increased
motivation and monitoring generally seen in participants in clinical trials. Similarly,
adherence to amoxicillin in the GRACE trial was considerably higher than that reported in
the GRACE observational studies, despite the participants recruited into the trial appearing
reasonably similar to those recruited into the aforementioned observational study in terms
of their baseline characteristics. (Butler et al., 2009, Francis et al., 2012)
The finding in the CODA study that adherence deteriorated over the 12-month study
period is also consistent with previous literature. Indeed, a study conducted in Canada
found a 1-year persistence rate of 50% for people diagnosed with UC, (Lachaine et al.,
2013) with another study conducted in the USA finding that 55% of participants continued
to take their UC medication. (Kane et al., 2009)
Instances of poor agreement between the adherence measures, with more traditional
methods providing higher estimates than those provided by the MEMS, particularly when
adherence was poor, is consistent with the findings of a study conducted in young patients
with inflammatory bowel disease. (Greenley et al., 2012) This pattern has also been found
in other settings. (Daniels et al., 2011)
An inverse relationship between the complexity of a dosing regimen and the adherence has
long been established. (Cockburn et al., 1987, Claxton et al., 2001, Pechère et al., 2007,
D’inca et al., 2008, Saini et al., 2009, Llor et al., 2009) However, the less frequent dosing
238
of intravenous bisphosphonates (compared to a daily oral regimen) has previously been
cited as contributing to improved levels of adherence. (Conte and Guarneri, 2004)
Females having lower odds of adhering to maintenance treatment for ulcerative colitis
concurs with the findings of Lachine et al., 2014, but other studies have found the opposite
relationship. (Kane et al., 2001)
Approaches for adjusting treatment effects for non-adherence while preserving
randomisation have been in existence for approximately 20 years. (Angrist et al., 1996)
However, they have largely been consigned to specialist methodological journals, rarely
used in practice and when used, generally focussed on non-pharmacological treatments.
(Dunn et al., 2003)
A recently published paper investigating the comparative efficacy of two different
antidepressants was the first to demonstrate the practical implementation of the SMM
approach as outlined by Fischer et al. (Wiles et al., 2014) One other study has reportedly
implemented this approach on a non-inferiority trial. (Taylor et al,. 2012) However, as this
was a placebo-controlled trial, and the paper detail of the approach was lacking, it was
unclear whether they applied standard SMM methodology or the extended work described
by Fischer et al.
7.5 Methodological and clinical implications
There are several implications arising from this work, primarily for researchers and applied
statisticians working in clinical areas, but also for healthcare professionals who monitor
medication adherence in their patients.
We, as researchers, should always strive to use the data we have collected to its maximum
potential. Often in research, we are too quick to take a set of data and summarise it as a
single value that, on the surface, has face value, but when considered more critically does
239
not provide much useful information. This point is exemplified in two places in my thesis.
First, where I took adherence collected via electronic monitors in participants over a 12-
month period and modelled daily adherence within individuals. This allowed me to
describe adherence patterns over time, variation between and within individuals, and
explore behavioural patterns. Had I combined these data into a single summary measure,
none of this would have been possible. Second, where I investigated the determinants of
different elements of adherence (i.e. initiation, implementation, and discontinuation).
Traditional approaches to investigating factors associated with adherence/non-adherence
involved regressing onto a single summary measure (e.g. adhered/did not adhere, an
adherence ‘score’). By investigating factors for different adherence processes, I was able to
uncover certain characteristics that were more associated with these different processes (e.g.
initiation but not implementation, or vice versa). This again is something that would have
(and indeed was) missed when condensing adherence into a single summary measure.
In terms of implications for healthcare professionals, these findings indicate that for patients
on long-term treatments adherence may decline over time, and behaviour may change
around clinic visit dates/during breaks in an individual’s normal routine. The former point
requires further exploration into why this is occurring. As discussed earlier in this Chapter,
this could be down to treatment fatigue or treatment optimisation. It should be
acknowledged that patient behaviour may change around clinic visits (both before and
afterwards), and this should be taken into account if monitoring adherence. Gaining an
understanding of an individual’s daily routine, how much it varies day-to-day, and whether
it is generally consistent or there are distinct disruptions (such as at weekends) would seem
important when it comes to understanding how to integrate medication into an individual’s
life. Where disruptions in routine are present, alternative strategies may be required, and
these should be devised in advance of commencing treatment.
240
The work presented in Chapters 4 and 5 has led me to conclude that when considering
methods for measuring medication adherence in clinical research, this should be
approached in a way analogous to the selection of appropriate outcome measures. There
needs to be an understanding of the phenomena that is of importance. This will be context-
specific. For example, when interest lies in the extent to which patients take their medication
as prescribed, and two different dosing regimens are compared (where the same amount
of medication is consumed, but the regimen differs), using tablet counts as your primary
means of describing medication adherence would not be recommended. Electronic
monitoring is better suited for this purpose, as dose patterns and timings can be collected.
For this reason, it is a more valid means of measuring adherence in this situation. This does
not mean that tablet count data should be discarded however, even in the scenario
described. Assessing agreement between tablet counts and electronic monitoring during
Chapter 4, I suggested that for patients on complex dosing regimens, electronic monitoring
may not necessarily be an acceptable or reliable way of measuring adherence. Tablet count
data could provide a useful reliability check in this instance. The ability for a measure to
detect change (i.e. responsiveness), is a related and another desirable property of an
adherence measure. During Chapter 5 I demonstrated that adherence as measured using
self-reported data and electronic monitors were able to distinguish between regimens,
whereas tablet counts were not. In addition, understanding the types of people or
circumstances that are likely to result in disagreement between measures could aid in
choosing appropriate adherence measures in future research, or even tailoring types of
adherence measures (certain types or single/multiple types for certain individuals).
It is difficult to interpret the determinants found during Chapter 5, and further work would
still be required prior to implementing any interventions to improve adherence in reaction
to these determinants. That said, the general lack of consistency across setting would imply
that adherence to treatment is context-specific, and this context is likely to entail the types

241
of patients being treated and types of treatment being given. The types of determinants
found to be associated with adherence suggest, however, that addressing cultural
perceptions of illness and medication taking behaviour could be a pathway to improving
adherence. The therapeutic alliance between treating clinician and patient is acknowledged
as vital for achieving good clinical outcomes, and this would indeed appear to be the case
if they influence the extent to which a patient takes their medication as prescribed. Different
determinants were associated with different adherence processes. The implication of this is
that depending on where the adherence problem lies for a specific condition (i.e. people
are not initiating, or are initiating but not implementing correctly, or initiation is sufficient
to achieve positive clinical outcomes, or what matters most is the length of time you’re on
treatment, regardless of how well you take it, so time to discontinuation is important) the
intervention to improve this (with the ultimate goal of improving clinical outcomes), may
differ.
The drawbacks of using randomisation-based efficacy estimators in RCTs with non-
adherence can be largely addressed by ensuring studies are designed to appropriately
answer the question of treatment efficacy from the start. Retrofitting randomisation-based
efficacy estimators to studies is fraught with compromises that are likely to lead to imprecise
estimates and/or the employment of questionable assumptions that are difficult to verify.
Considering the use of these analytical approaches from the outset requires building non-
adherence into the sample size calculation, thinking about how adherence will be defined,
the type or types of measures that will be used, and ensuring that variables that are likely to
be associated with adherence (in both arms, if there are two active treatments) are collected.
When determining the type of measure (or measures) to monitor adherence, the findings
and implications from the work I carried out during Chapter 4 will be particularly relevant.
The dimensions described in Chapter 5 can be used as a framework for deciding on
important variables to measure for this work.

242
The increase in variance that is observed when fitting randomisation-based efficacy
estimators might be seen unacceptable when the key question of interest is related to the
effectiveness (or population-level) effect of treatment. However, this increase in variance
represents real uncertainty, and therefore where the question of treatment efficacy is of
interest, this needs considering during the design phase. A simple sample size adjustment
would inflate for the reciprocal of the proportion of participants estimated to adhere to
treatment, but may also increase the effect size, as there would be an expectation that an
efficacy effect (effect in participants who take their treatment) would be larger than an
effectiveness effect (effect in participants regardless of whether or not they take treatment).
Finally, a theme running throughout my work has been that adherence is more difficult for
patients on complex treatments. The natural reaction to this is to simplify treatments. For
example, prescribe treatment for a shorter duration, have patients take all medication at
one point during a day, or let patients have treatments they can take at home rather than
having to travel to hospital for each dose. While to a large degree I agree with this idea,
what is often overlooked is the consequence of non-adherence and how this can be
exacerbated for patients on simple regimens (compared to them being on more complex
regimens). For example, one of the studies I focused on during my thesis comprised two
groups of patients: both groups were prescribed three tablets a day, but one group were
told to take all three tablets at the same time and the other were told to take the tablets in
three divided doses throughout the day. An individual was defined as having not adhered
to their regimen on a given day if they did not take the correct number of doses. An
individual in one group could be described as not adhering to their regimen even if they
took two out of the three tablets, whereas if an individual in the other group did not adhere
this was because they took no tablets on that day. For individuals on a treatment for a long
time period, several instances of non-adherence could amount to a considerable lack of
treatment in one group and could potentially be quite clinically harmful, whereas an
243
individual could be perceived to be as non-adherent to a more complex regimen, but at a
reduced risk of harm due to them still consuming some medication. This insight leads to
the implication that it is not as straightforward as simplifying treatment regimens in all
circumstances. There will be instances where complex regimens remain the only safe
option while non-adherence is still a possibility.
7.6 Further areas for research
There are various strands of work that can be taken forward, following the work presented
in my thesis. These are summarised below:
1. Joint modelling of electronic monitoring data and pharmacology data (e.g. data
from pharmacokinetic / pharmacodynamic studies): By combining these rich data
sources, models could be developed that described patterns in adherence, and how
they related to treatment response. These models could then be used to refine
medication use (for example, they could be used to determine the number of doses
a patient could safely miss, and this could be built into their prescribing strategy to
minimise side effects caused by taking medication for a prolonged duration). One
area in which this may be important is in the prescribing of antibiotics, as the risk
that poor adherence poses is not just clinical failure, but also development of
antibiotic resistant organisms, and this would be a concern at a society-level (rather
than purely a problem for the individual).
2. Calibration techniques: Extensions could be made to the hierarchy calibration
technique I explored during Chapter 4. This technique could be improved by
accounting for the different variances associated with the different types of measures
considered, or even the number of measures considered. More complex calibration
techniques, for example using latent variable approaches (e.g. structural equation
modelling), are also worthy of further investigation. The use of nested study designs

244
for informing calibrated measures may be provide an efficient way of carrying out
research in this area. Another approach to calibrating could also be to use one
measure that captures overall consumption (e.g. tablet counts), use another that
captures patterns (e.g. prospective self-report diaries or electronic monitoring) and
calibrate the patterned data with the overall consumption data.
3. Further exploration of the limits of agreement and confidence intervals around
them are needed for bounded measures such as the ones encountered when
measuring adherence.
4. Development of a model that incorporates all adherence processes without
amalgamating them as a single summary measure: This is the natural progression
from separating the elements out, and attempts I have made at combining them (for
example, using hurdle models). The utility of such a model, however, will depend
on the approach or approaches used to monitor adherence.
5. Further extensions to randomisation-based efficacy estimators: deficiencies in the
application of these approaches on real datasets has been described throughout my
thesis. Methodological work in this area that would be of immediate practical
importance, focuses on the extension of these techniques to more complex
outcomes (for example, recurrent events that are usually modelled using the
Anderson-Gill Cox regression model), empirical guidance on situations when
assuming a linear relationship between adherence and treatment effect or the
exclusion restriction is most appropriate, and, following on from this, methods to
account for non-linear relationships between adherence and treatment effects.
6. Finally, the development of standardised approaches when a key goal of research is
to study medication adherence. The work presented throughout my thesis, but
particularly in Chapters 5 and 6, highlight the need for the development of core
245
measure sets for research where adherence is the focus. These sets may be generic,
condition-specific, perhaps only separate for short and long-term treatments, but
would contain guidance on items that are vitally important to collect when
medication adherence is a focus (primary or key secondary) during a study. This
might lead to a requirement to collect more data in a study, something that on the
surface may seem to conflict with other initiatives (such as Trial Forge (Treweek et
al., 2015)), however for studies that plan to focus on medication adherence, this
additional data will be important.
7.7 Concluding remarks
I have investigated various methodological challenges that are encountered when studying
medication adherence in clinical research. The new evidence I have generated will advance
the field, and I have indicated areas in which further developments are warranted.
It is my hope that this work and recommendations herein will be seized upon by applied
medical researchers, and that moving forward medication adherence will be a key
consideration during the design, conduct, analysis, and reporting of all research where the
use of medication is being investigated.
246
REFERENCES
Akaike, H. A new look at the statistical model identification. Automatic Control, IEEE
Transactions on. 1974; 19(6):716-23.
Almeida, E.D., Rodrigues, L.C.S. and Vieira, J.L.F., 2014. Estimates of adherence to
treatment of vivax malaria. Malaria journal, 13(1), p.1.
Altman, D.G., 1990. Practical statistics for medical research. CRC press.
Anastasio, G.D., Little, J.M., Robinson, M.D., Pettice, Y.L., Leitch, B.B. and Norton, H.J.,
1994. Impact of compliance and side effects on the clinical outcome of patients treated with
oral erythromycin. Pharmacotherapy: The Journal of Human Pharmacology and Drug
Therapy, 14(2), pp.229-234.
Andersen, P.K. and Gill, R.D., 1982. Cox's regression model for counting processes: a large
sample study. The annals of statistics, pp.1100-1120.
Andy, U.U., Harvie, H.S., Smith, A.L., Propert, K.J., Bogner, H.R. and Arya, L.A., 2015.
Validation of a self‐administered instrument to measure adherence to anticholinergic drugs
in women with overactive bladder. Neurourology and urodynamics, 34(5), pp.424-428.
Angrist, J.D., Imbens, G.W. and Rubin, D.B., 1996. Identification of causal effects using
instrumental variables. Journal of the American statistical Association, 91(434), pp.444-455.
Ardizzone S. Ulcerative Colitis. Orphanet Encylcopedia 2003. Available at:
http://www.orpha.net/data/patho/GB/uk-UC.pdf. Last accessed November 2016.
Ayoade, A. and Oladipo, I., 2012. Evaluation of the correlation between self-report and
electronic monitoring of adherence to hypertension therapy. Blood pressure, 21(3),
pp.161-166.
247
Azizi, M., Sapoval, M., Gosse, P., Monge, M., Bobrie, G., Delsart, P., Midulla, M.,
Mounier-Véhier, C., Courand, P.Y., Lantelme, P. and Denolle, T., 2015. Optimum and
stepped care standardised antihypertensive treatment with or without renal denervation for
resistant hypertension (DENERHTN): a multicentre, open-label, randomised controlled
trial. The Lancet, 385(9981), pp.1957-1965.
Bachelez, H., van de Kerkhof, P.C., Strohal, R., Kubanov, A., Valenzuela, F., Lee, J.H.,
Yakusevich, V., Chimenti, S., Papacharalambous, J., Proulx, J. and Gupta, P., 2015.
Tofacitinib versus etanercept or placebo in moderate-to-severe chronic plaque psoriasis: a
phase 3 randomised non-inferiority trial. The Lancet, 386(9993), pp.552-561.
Bagchi, A.D., Esposito, D., Kim, M., Verdier, J. and Bencio, D., 2007. Utilization of, and
adherence to, drug therapy among Medicaid beneficiaries with congestive heart failure.
Clinical therapeutics, 29(8), pp.1771-1783.
Bakris, G.L., Agarwal, R., Chan, J.C., Cooper, M.E., Gansevoort, R.T., Haller, H.,
Remuzzi, G., Rossing, P., Schmieder, R.E., Nowack, C. and Kolkhof, P., 2015. Effect of
finerenone on albuminuria in patients with diabetic nephropathy: a randomized clinical
trial. Jama, 314(9), pp.884-894.
Banek, K., Lalani, M., Staedke, S.G. and Chandramohan, D., 2014. Adherence to
artemisinin-based combination therapy for the treatment of malaria: a systematic review of
the evidence. Malaria journal, 13(1), p.1.
Bangdiwala, S. I. 1988. The Agreement Chart. Department of Biostatistics, University of
North Carolina at Chapel Hill, Institute of Statistics Mimeo Series No. 1859.
Bangsberg, D.R., Hecht, F.M., Charlebois, E.D., Zolopa, A.R., Holodniy, M., Sheiner, L.,
Bamberger, J.D., Chesney, M.A. and Moss, A., 2000. Adherence to protease inhibitors,
248
HIV-1 viral load, and development of drug resistance in an indigent population. Aids,
14(4), pp.357-366.
Bangsberg, D.R., Perry, S., Charlebois, E.D., Clark, R.A., Roberston, M., Zolopa, A.R.
and Moss, A., 2001. Non-adherence to highly active antiretroviral therapy predicts
progression to AIDS. Aids, 15(9), pp.1181-1183.
Barrett-Lee, P., Casbard, A., Abraham, J., Hood, K., Coleman, R., Simmonds, P.,
Timmins, H., Wheatley, D., Grieve, R., Griffiths, G. and Murray, N., 2014. Oral
ibandronic acid versus intravenous zoledronic acid in treatment of bone metastases from
breast cancer: a randomised, open label, non-inferiority phase 3 trial. The Lancet
Oncology, 15(1), pp.114-122.
Baxi, S.M., Liu, A., Bacchetti, P., Mutua, G., Sanders, E.J., Kibengo, F.M., Haberer, J.E.,
Rooney, J., Hendrix, C.W., Anderson, P.L. and Huang, Y., 2015. Comparing the novel
method of assessing PrEP adherence/exposure using hair samples to other pharmacologic
and traditional measures. JAIDS Journal of Acquired Immune Deficiency Syndromes,
68(1), pp.13-20.
Beni, J.B., 2011. Technology and the healthcare system: implications for patient
adherence. International journal of electronic healthcare, 6(2-4), pp.117-137.
Benedetti, F., Carlino, E. and Pollo, A., 2011. How placebos change the patient's brain.
Neuropsychopharmacology, 36(1), pp.339-354.
Berg, J., Dunbar-Jacob, J. and Rohay, J.M., 1998. Compliance with inhaled medications:
the relationship between diary and electronic monitor. Annals of Behavioral Medicine,
20(1), pp.36-38.
Berk, M., Berk, L. and Castle, D., 2004. A collaborative approach to the treatment alliance
in bipolar disorder. Bipolar disorders, 6(6), pp.504-518.
249
Bland, M.J., Altman, D.G. Statistical methods for assessing agreement between two
methods of clinical measurement. Lancet. 1986; 327:307–310.
Bofill, L.M., Lopez, M., Dorigo, A., Bordato, A., Lucas, M., Cabanillas, G.F., Sued, O.,
Cahn, P., Cassetti, I., Weiss, S. and Jones, D., 2014. Patient–provider perceptions on
engagement in HIV care in Argentina. AIDS care, 26(5), pp.602-607.
Bogner, H.R., de Vries, H.F., O’Donnell, A.J. and Morales, K.H., 2013. Measuring
concurrent oral hypoglycemic and antidepressant adherence and clinical outcomes. The
American journal of managed care, 19(3), p.e85.
Boland, M.V., Chang, D.S., Frazier, T., Plyler, R., Jefferys, J.L. and Friedman, D.S., 2014.
Automated telecommunication-based reminders and adherence with once-daily glaucoma
medication dosing: the automated dosing reminder study. JAMA ophthalmology, 132(7),
pp.845-850.
Brain, C., Sameby, B., Allerby, K., Lindström, E., Eberhard, J., Burns, T. and Waern, M.,
2014. Twelve months of electronic monitoring (MEMS®) in the Swedish COAST-study:
a comparison of methods for the measurement of adherence in schizophrenia. European
Neuropsychopharmacology, 24(2), pp.215-222.
Brask-Lindemann, D., Cadarette, S.M., Eskildsen, P. and Abrahamsen, B., 2011.
Osteoporosis pharmacotherapy following bone densitometry: importance of patient beliefs
and understanding of DXA results. Osteoporosis international, 22(5), pp.1493-1501.
Brilleman, S.L., Metcalfe, C., Peters, T.J. and Hollingworth, W., 2016. The Reporting of
Treatment Nonadherence and Its Associated Impact on Economic Evaluations Conducted
Alongside Randomized Trials: A Systematic Review. Value in Health, 19(1), pp.99-108.
250
Browne, T. and Merighi, J.R., 2010. Barriers to adult hemodialysis patients' self-
management of oral medications. American Journal of Kidney Diseases, 56(3), pp.547-
557.
Buscher, A., Hartman, C., Kallen, M.A. and Giordano, T.P., 2015. Validity of self-report
measures in assessing antiretroviral adherence of newly diagnosed, HAART-naive, HIV
patients. HIV clinical trials.
Butler, C.C., Hood, K., Verheij, T., Little, P., Melbye, H., Nuttall, J., Kelly, M.J., Mölstad,
S., Godycki-Cwirko, M., Almirall, J. and Torres, A., 2009. Variation in antibiotic
prescribing and its impact on recovery in patients with acute cough in primary care:
prospective study in 13 countries. Bmj, 338, p.b2242.
Butler, J.A., Peveler, R.C., Roderick, P., Horne, R. and Mason, J.C., 2004. Measuring
compliance with drug regimens after renal transplantation: comparison of self-report and
clinician rating with electronic monitoring. Transplantation, 77(5), pp.786-789.
Butz, A.M., Donithan, M., Bollinger, M.E., Rand, C. and Thompson, R.E., 2005.
Monitoring nebulizer use in children: comparison of electronic and asthma diary data.
Annals of Allergy, Asthma & Immunology, 94(3), pp.360-365.
Byerly, M.J., Thompson, A., Carmody, T., Bugno, R., Erwin, T., Kashner, M. and Rush,
A.J., 2007. Validity of electronically monitored medication adherence and conventional
adherence measures in schizophrenia. Psychiatric Services, 58(6), pp.844-847.
Cannon, C.P., Blazing, M.A., Giugliano, R.P., McCagg, A., White, J.A., Theroux, P.,
Darius, H., Lewis, B.S., Ophuis, T.O., Jukema, J.W. and De Ferrari, G.M., 2015.
Ezetimibe added to statin therapy after acute coronary syndromes. New England Journal
of Medicine, 372(25), pp.2387-2397.
251
Casey, J.R., Block, S.L., Hedrick, J., Almudevar, A. and Pichichero, M.E., 2012.
Comparison of amoxicillin/clavulanic acid high dose with cefdinir in the treatment of acute
otitis media. Drugs, 72(15), pp.1991-1997.
Cassidy, C.M., Rabinovitch, M., Schmitz, N., Joober, R. and Malla, A., 2010. A comparison
study of multiple measures of adherence to antipsychotic medication in first-episode
psychosis. Journal of clinical psychopharmacology, 30(1), pp.64-67.
Chen, L.C., Chen, T.C., Huang, Y.B. and Chang, C.S., 2014. Disease acceptance and
adherence to imatinib in Taiwanese chronic myeloid leukaemia outpatients. International
journal of clinical pharmacy, 36(1), pp.120-127.
Chesney, M., 2003. Adherence to HAART regimens. AIDS patient care and STDs, 17(4),
pp.169-177.
Chesney, M.A., Ickovics, J.R., Chambers, D.B., Gifford, A.L., Neidig, J., Zwickl, B., Wu,
A.W. and PATIENT CARE COMMITTEE & ADHERENCE WORKING GROUP
OF THE OUTCOMES COMMITTEE OF THE ADULT AIDS CLINICAL TRIALS
GROUP (AACTG), 2000. Self-reported adherence to antiretroviral medications among
participants in HIV clinical trials: the AACTG adherence instruments. AIDS care, 12(3),
pp.255-266.
Cheung, Y.B., 2007. A modified least-squares regression approach to the estimation of risk
difference. American journal of epidemiology, 166(11), pp.1337-1344.
Choo, P.W., Rand, C.S., Inui, T.S., Lee, M.L.T., Cain, E., Cordeiro-Breault, M., Canning,
C. and Platt, R., 1999. Validation of patient reports, automated pharmacy records, and pill
counts with electronic monitoring of adherence to antihypertensive therapy. Medical care,
37(9), pp.846-857.
252
Chui, M.A., Deer, M., Bennett, S.J., Tu, W., Oury, S., Brater, D.C. and Murray, M.D.,
2003. Association between adherence to diuretic therapy and health care utilization in
patients with heart failure. Pharmacotherapy: The Journal of Human Pharmacology and
Drug Therapy, 23(3), pp.326-332.
Claxton, A.J., Cramer, J. and Pierce, C., 2001. A systematic review of the associations
between dose regimens and medication compliance. Clinical therapeutics, 23(8), pp.1296-
1310.
Clifford, S., Perez-Nieves, M., Skalicky, A.M., Reaney, M. and Coyne, K.S., 2014. A
systematic literature review of methodologies used to assess medication adherence in
patients with diabetes. Current medical research and opinion, 30(6), pp.1071-1085.
Cockburn J, Gibberd RW, Reid AL, Sanson-Fisher RW. Determinants of non-compliance
with short term antibiotic regimens. Br Med J (Clin Res Ed). 1987;295(6602):814–818
Cogo-Moreira, H., de Avila, C.R.B., Ploubidis, G.B. and de Jesus Mari, J., 2013.
Effectiveness of music education for the improvement of reading skills and academic
achievement in young poor readers: a pragmatic cluster-randomized, controlled clinical
trial. PloS one, 8(3), p.e59984.
Cohen, J., 1960. A coefficient of agreement for nominal scales. Educational and
Psychosocial Measurement, 20, 37-46.
Coletti, D.J., Pappadopulos, E., Katsiotas, N.J., Berest, A., Jensen, P.S. and Kafantaris, V.,
2012. Parent perspectives on the decision to initiate medication treatment of attention-
deficit/hyperactivity disorder. Journal of child and adolescent psychopharmacology, 22(3),
pp.226-237.
Conte, P. and Guarneri, V., 2004. Safety of intravenous and oral bisphosphonates and
compliance with dosing regimens. The Oncologist, 9(Supplement 4), pp.28-37.
253
Cooper, G.A., Allen, D.L., Scott, K.S., Oliver, J.S., Ditton, J. and Smith, I.D., 2000. Hair
analysis: self-reported use of “speed” and “ecstasy” compared with laboratory findings.
Journal of Forensic Science, 45(2), pp.400-406.
Costelloe, C., Metcalfe, C., Lovering, A., Mant, D. and Hay, A.D., 2010. Effect of antibiotic
prescribing in primary care on antimicrobial resistance in individual patients: systematic
review and meta-analysis. Bmj, 340, p.c2096.
Cox, D.R., Regression models and life-tables. Journal of the Royal Statistical Society. Series
B (Methodological), 1972: p. 187-220.
Craig, P., Dieppe, P., Macintyre, S., Michie, S., Nazareth, I. and Petticrew, M., 2008.
Developing and evaluating complex interventions: the new Medical Research Council
guidance. Bmj, 337, p.a1655.
Cramer, J.A. and Mattson, R.H., 1991. Monitoring compliance with antiepileptic drug
therapy. Patient compliance in medical practice and clinical trials, pp.123-137.
Cramer, J.A. and Spilker, B., 1991. Patient compliance in medical practice and clinical
trials.
Cramer, J.A., Glassman, M. and Rienzi, V., 2002. The relationship between poor
medication compliance and seizures. Epilepsy & Behavior, 3(4), pp.338-342.
Cung, T.T., Morel, O., Cayla, G., Rioufol, G., Garcia-Dorado, D., Angoulvant, D.,
Bonnefoy-Cudraz, E., Guérin, P., Elbaz, M., Delarche, N. and Coste, P., 2015.
Cyclosporine before PCI in patients with acute myocardial infarction. New England Journal
of Medicine, 373(11), pp.1021-1031.
Currie, C.J., Berni, E., Jenkins-Jones, S., Poole, C.D., Ouwens, M., Driessen, S., de Voogd,
H., Butler, C.C. and Morgan, C.L., 2014. Antibiotic treatment failure in four common
infections in UK primary care 1991-2012: longitudinal analysis.
254
D’inca, R., Bertomoro, P., Mazzocco, K., Vettorato, M.G., Rumiati, R. and Sturniolo,
G.C., 2008. Risk factors for non‐adherence to medication in inflammatory bowel disease
patients. Alimentary pharmacology & therapeutics, 27(2), pp.166-172.
Dalbeth, N., Petrie, K.J., House, M., Chong, J., Leung, W., Chegudi, R., Horne, A.,
Gamble, G., McQueen, F.M. and Taylor, W.J., 2011. Illness perceptions in patients with
gout and the relationship with progression of musculoskeletal disability. Arthritis care &
research, 63(11), pp.1605-1612.
Daniels, T., Goodacre, L., Sutton, C., Pollard, K., Conway, S. and Peckham, D., 2011.
Accurate assessment of adherence: self-report and clinician report vs electronic monitoring
of nebulizers. CHEST Journal, 140(2), pp.425-432.
Daschner, F. and Marget, W., 1975. Treatment of recurrent urinary tract infection in
children. Acta Paediatrica, 64(1), pp.105-108.
Davies, M.J., Bergenstal, R., Bode, B., Kushner, R.F., Lewin, A., Skjøth, T.V., Andreasen,
A.H., Jensen, C.B. and DeFronzo, R.A., 2015. Efficacy of liraglutide for weight loss among
patients with type 2 diabetes: the SCALE diabetes randomized clinical trial. Jama, 314(7),
pp.687-699.
Dawson, R., Diacon, A.H., Everitt, D., van Niekerk, C., Donald, P.R., Burger, D.A., Schall,
R., Spigelman, M., Conradie, A., Eisenach, K. and Venter, A., 2015. Efficiency and safety
of the combination of moxifloxacin, pretomanid (PA-824), and pyrazinamide during the
first 8 weeks of antituberculosis treatment: a phase 2b, open-label, partly randomised trial
in patients with drug-susceptible or drug-resistant pulmonary tuberculosis. The Lancet,
385(9979), pp.1738-1747.
255
De Klerk, E., Van der Heijde, D., Van der Tempel, H. and Van Der Linden, S., 1999.
Development of a questionnaire to investigate patient compliance with antirheumatic drug
therapy. The Journal of rheumatology, 26(12), pp.2635-2641.
De las Cuevas, C., Peñate, W. and Sanz, E.J., 2014. Risk factors for non-adherence to
antidepressant treatment in patients with mood disorders. European journal of clinical
pharmacology, 70(1), pp.89-98.
Dean, A.J., Wragg, J., Draper, J. and McDermott, B.M., 2011. Predictors of medication
adherence in children receiving psychotropic medication. Journal of paediatrics and child
health, 47(6), pp.350-355.
Desai, M., Gutman, J., L'lanziva, A., Otieno, K., Juma, E., Kariuki, S., Ouma, P., Were,
V., Laserson, K., Katana, A. and Williamson, J., 2016. Intermittent screening and treatment
or intermittent preventive treatment with dihydroartemisinin–piperaquine versus
intermittent preventive treatment with sulfadoxine–pyrimethamine for the control of
malaria during pregnancy in western Kenya: an open-label, three-group, randomised
controlled superiority trial. The Lancet, 386(10012), pp.2507-2519.
DeVincenzo, J.P., McClure, M.W., Symons, J.A., Fathi, H., Westland, C., Chanda, S.,
Lambkin-Williams, R., Smith, P., Zhang, Q., Beigelman, L. and Blatt, L.M., 2015. Activity
of oral ALS-008176 in a respiratory syncytial virus challenge study. New England Journal
of Medicine, 373(21), pp.2048-2058.
Dharmapuri, S., Best, D., Kind, T., Silber, T.J., Simpson, P. and D'Angelo, L., 2015.
Health literacy and medication adherence in adolescents. The Journal of pediatrics, 166(2),
pp.378-382.
256
Digiusto, E., Seres, V., Bibby, A. and Batey, R., 1996. Concordance between urinalysis
results and self-reported drug use by applicants for methadone maintenance in Australia.
Addictive behaviors, 21(3), pp.319-329.
DiMatteo, M.R., 2004. Variations in patients’ adherence to medical recommendations: a
quantitative review of 50 years of research. Medical care, 42(3), pp.200-209.
Dlamini, P.S., Wantland, D., Makoae, L.N., Chirwa, M., Kohi, T.W., Greeff, M., Naidoo,
J., Mullan, J., Uys, L.R. and Holzemer, W.L., 2009. HIV stigma and missed medications
in HIV-positive people in five African countries. AIDS patient care and STDs, 23(5),
pp.377-387.
Dolder, C.R., Lacro, J.P., Warren, K.A., Golshan, S., Perkins, D.O. and Jeste, D.V., 2004.
Brief evaluation of medication influences and beliefs: development and testing of a brief
scale for medication adherence. Journal of clinical psychopharmacology, 24(4), pp.404-
409.
Donny, E.C., Denlinger, R.L., Tidey, J.W., Koopmeiners, J.S., Benowitz, N.L., Vandrey,
R.G., al’Absi, M., Carmella, S.G., Cinciripini, P.M., Dermody, S.S. and Drobes, D.J.,
2015. Randomized trial of reduced-nicotine standards for cigarettes. New England Journal
of Medicine, 373(14), pp.1340-1349.
Dorz, S., Lazzarini, L., Cattelan, A., Meneghetti, F., Novara, C., Concia, E., Sica, C. and
Sanavio, E., 2003. Evaluation of adherence to antiretroviral therapy in Italian HIV patients.
AIDS patient care and STDs, 17(1), pp.33-41.
Drotar, D. and Bonner, M.S., 2009. Influences on adherence to pediatric asthma
treatment: a review of correlates and predictors. Journal of Developmental & Behavioral
Pediatrics, 30(6), pp.574-582.
257
Drummond, M.F., Sculpher, M.J., Claxton, K., Stoddart, G.L. and Torrance, G.W., 2015.
Methods for the economic evaluation of health care programmes. Oxford university press.
Dukic, V.M., Niessner, M., Benowitz, N., Hans, S. and Wakschlag, L., 2007. Modeling
the relationship of cotinine and self-reported measures of maternal smoking during
pregnancy: a deterministic approach. Nicotine & tobacco research, 9(4), pp.453-465.
Dunn, G., Maracy, M., Dowrick, C., Ayuso-Mateos, J.L., Dalgard, O.S., Page, H.,
Lehtinen, V., Casey, P., Wilkinson, C., Vázquez-Barquero, J.L. and Wilkinson, G., 2003.
Estimating psychological treatment effects from a randomised controlled trial with both
non-compliance and loss to follow-up. The British Journal of Psychiatry, 183(4), pp.323-
331.
Eisen, S.A., Miller, D.K., Woodward, R.S., Spitznagel, E. and Przybeck, T.R., 1990. The
effect of prescribed daily dose frequency on patient medication compliance. Archives of
Internal Medicine, 150(9), pp.1881-1884.
El Zubier, A.G., 2000. Drug compliance among hypertensive patients in Kassala, eastern
Sudan.
Elm, J.J., Kamp, C., Tilley, B.C., Guimaraes, P., Fraser, D., Deppen, P., Brocht, A.,
Weaver, C. and Bennett, S., 2007. Self‐reported adherence versus pill count in Parkinson's
disease: The NET‐PD experience. Movement disorders, 22(6), pp.822-827.
Escalada, P. and Griffiths, P., 2006. Do people with cancer comply with oral chemotherapy
treatments?. British journal of community nursing, 11(12).
Esposito, D., Schone, E., Williams, T., Liu, S., CyBulski, K., Stapulonis, R. and Clusen,
N., 2008. Prevalence of unclaimed prescriptions at military pharmacies. Journal of
Managed Care Pharmacy, 14(6), pp.541-552.
258
Farmer, A., Kinmonth, A.L. and Sutton, S., 2006. Measuring beliefs about taking
hypoglycaemic medication among people with Type 2 diabetes. Diabetic Medicine, 23(3),
pp.265-270.
Farmer, K.C., 1999. Methods for measuring and monitoring medication regimen
adherence in clinical trials and clinical practice. Clinical therapeutics, 21(6), pp.1074-1090.
Farup, P.G., Hinterleitner, T.A., Lukáš, M., Hébuterne, X., Rachmilewitz, D., Campieri,
M., Meier, R., Keller, R., Rathbone, B. and Oddsson, E., 2001. Mesalazine 4 g daily given
as prolonged‐release granules twice daily and four times daily is at least as effective as
prolonged‐release tablets four times daily in patients with ulcerative colitis. Inflammatory
bowel diseases, 7(3), pp.237-242.
Fayers, P.M., Aaronson, N.K., Bjordal, K., Grønvold, M., Curran, D. and Bottomley, A.,
2001. EORTC QLQ-C30 scoring manual.
Feinn, R., Tennen, H., Cramer, J. and Kranzler, H.R., 2003. Measurement and prediction
of medication compliance in problem drinkers. Alcoholism: Clinical and Experimental
Research, 27(8), pp.1286-1292.
Few, S., 2009. Now you see it: simple visualization techniques for quantitative analysis.
Analytics Press.
Fischer, K., Goetghebeur, E., Vrijens, B. and White, I.R., 2011. A structural mean model
to allow for noncompliance in a randomized trial comparing 2 active treatments.
Biostatistics, 12(2), pp.247-257.
Fischer-Lapp, K. and Goetghebeur, E., 1999. Practical properties of some structural mean
analyses of the effect of compliance in randomized trials. Controlled clinical trials, 20(6),
pp.531-546.
259
Flourie, B., Hagege, H., Tucat, G., Maetz, D., Hébuterne, X., Kuyvenhoven, J.P., Tan,
T.G., Pierik, M.J., Masclee, A.A.M., Dewit, O. and Probert, C.S., 2013. Randomised
clinical trial: once‐vs. twice‐daily prolonged‐release mesalazine for active ulcerative colitis.
Alimentary pharmacology & therapeutics, 37(8), pp.767-775.
Francis, N.A., Gillespie, D., Nuttall, J., Hood, K., Little, P., Verheij, T., Coenen, S., Cals,
J.W., Goossens, H. and Butler, C.C., 2012. Antibiotics for acute cough: an international
observational study of patient adherence in primary care. Br J Gen Pract, 62(599), pp.e429-
e437.
Francis, N.A., Gillespie, D., Nuttall, J., Hood, K., Little, P., Verheij, T., Goossens, H.,
Coenen, S. and Butler, C.C., 2012. Delayed antibiotic prescribing and associated antibiotic
consumption in adults with acute cough. Br J Gen Pract, 62(602), pp.e639-e646.
Frangakis, C.E. and Rubin, D.B., Principal stratification in causal inference. Biometrics,
2002. 58(1): p. 21-29.
Frangou, S., Sachpazidis, I., Stassinakis, A. and Sakas, G., 2005. Telemonitoring of
medication adherence in patients with schizophrenia. Telemedicine Journal & E-Health,
11(6), pp.675-683.
French, D.P. and Sutton, S., 2010. Reactivity of measurement in health psychology: how
much of a problem is it? What can be done about it?. British journal of health psychology,
15(3), pp.453-468.
Gabriel, A. and Violato, C., 2010. Knowledge of and attitudes towards depression and
adherence to treatment: The Antidepressant Adherence Scale (AAS). Journal of affective
disorders, 126(3), pp.388-394.
260
Gadkari, A.S. and McHorney, C.A., 2012. Unintentional non-adherence to chronic
prescription medications: how unintentional is it really?. BMC health services research,
12(1), p.1.
Gágyor, I., Bleidorn, J., Kochen, M.M., Schmiemann, G., Wegscheider, K. and Hummers-
Pradier, E., 2015. Ibuprofen versus fosfomycin for uncomplicated urinary tract infection in
women: randomised controlled trial. bmj, 351, p.h6544.
Gandia, P., Idier, I. and Houin, G., 2007. Is once‐daily mesalazine equivalent to the
currently used twice‐daily regimen? A study performed in 30 healthy volunteers. The
Journal of Clinical Pharmacology, 47(3), pp.334-342.
Garavan, J., Browne, S., Gervin, M., Lane, A., Larkin, C. and O'callaghan, E., 1998.
Compliance with neuroleptic medication in outpatients with schizophrenia; relationship to
subjective response to neuroleptics; attitudes to medication and insight. Comprehensive
psychiatry, 39(4), pp.215-219.
Garber, M.C., Nau, D.P., Erickson, S.R., Aikens, J.E. and Lawrence, J.B., 2004. The
concordance of self-report with other measures of medication adherence: a summary of
the literature. Medical care, 42(7), pp.649-652.
Garway-Heath, D.F., Crabb, D.P., Bunce, C., Lascaratos, G., Amalfitano, F., Anand, N.,
Azuara-Blanco, A., Bourne, R.R., Broadway, D.C., Cunliffe, I.A. and Diamond, J.P., 2015.
Latanoprost for open-angle glaucoma (UKGTS): a randomised, multicentre, placebo-
controlled trial. The Lancet, 385(9975), pp.1295-1304.
Gaudet, D., Alexander, V.J., Baker, B.F., Brisson, D., Tremblay, K., Singleton, W., Geary,
R.S., Hughes, S.G., Viney, N.J., Graham, M.J. and Crooke, R.M., 2015. Antisense
inhibition of apolipoprotein C-III in patients with hypertriglyceridemia. New England
Journal of Medicine, 373(5), pp.438-447.
261
Gerding, D.N., Meyer, T., Lee, C., Cohen, S.H., Murthy, U.K., Poirier, A., Van
Schooneveld, T.C., Pardi, D.S., Ramos, A., Barron, M.A. and Chen, H., 2015.
Administration of spores of nontoxigenic Clostridium difficile strain m3 for prevention of
recurrent c difficile infection: A randomized clinical trial. Jama, 313(17), pp.1719-1727.
Gerson, A.C., Furth, S.L., Neu, A.M. and Fivush, B.A., 2004. Assessing associations
between medication adherence and potentially modifiable psychosocial variables in
pediatric kidney transplant recipients and their families. Pediatric transplantation, 8(6),
pp.543-550.
Gheorghiade, M., Greene, S.J., Butler, J., Filippatos, G., Lam, C.S., Maggioni, A.P.,
Ponikowski, P., Shah, S.J., Solomon, S.D., Kraigher-Krainer, E. and Samano, E.T., 2015.
Effect of vericiguat, a soluble guanylate cyclase stimulator, on natriuretic peptide levels in
patients with worsening chronic heart failure and reduced ejection fraction: the
SOCRATES-REDUCED randomized trial. JAMA, 314(21), pp.2251-2262.
Glass, G.V. and Hopkins, K.D., 1970. Statistical methods in education and psychology (pp.
501-509). Englewood Cliffs, NJ: Prentice-Hall.
Gnant, M., Pfeiler, G., Dubsky, P.C., Hubalek, M., Greil, R., Jakesz, R., Wette, V., Balic,
M., Haslbauer, F., Melbinger, E. and Bjelic-Radisic, V., 2015. Adjuvant denosumab in
breast cancer (ABCSG-18): a multicentre, randomised, double-blind, placebo-controlled
trial. The Lancet, 386(9992), pp.433-443.
Goetghebeur, E. and Lapp, K., 1997. The Effect of Treatment Compliance in a Placebo‐
controlled Trial: Regression with Unpaired Data. Journal of the Royal Statistical Society:
Series C (Applied Statistics), 46(3), pp.351-364.
262
Goossens, H., Ferech, M., Vander Stichele, R., Elseviers, M. and ESAC Project Group,
2005. Outpatient antibiotic use in Europe and association with resistance: a cross-national
database study. The Lancet, 365(9459), pp.579-587.
Grainger, J.D., Locatelli, F., Chotsampancharoen, T., Donyush, E., Pongtanakul, B.,
Komvilaisak, P., Sosothikul, D., Drelichman, G., Sirachainan, N., Holzhauer, S. and
Lebedev, V., 2015. Eltrombopag for children with chronic immune thrombocytopenia
(PETIT2): a randomised, multicentre, placebo-controlled trial. The Lancet, 386(10004),
pp.1649-1658.
Grant, E., Logie, D., Masura, M., Gorman, D. and Murray, S.A., 2008. Factors facilitating
and challenging access and adherence to antiretroviral therapy in a township in the Zambian
Copperbelt: a qualitative study. AIDS care, 20(10), pp.1155-1160.
Grant, R.W., O’Leary, K.M., Weilburg, J.B., Singer, D.E. and Meigs, J.B., 2004. Impact
of concurrent medication use on statin adherence and refill persistence. Archives of internal
medicine, 164(21), pp.2343-2348.
Greenland, S. and Brumback, B., 2002. An overview of relations among causal modelling
methods. International journal of epidemiology, 31(5), pp.1030-1037.
Greenley, R.N., Kunz, J.H., Biank, V., Martinez, A., Miranda, A., Noe, J., Telega, G.,
Tipnis, N.A., Werlin, S. and Stephens, M.C., 2012. Identifying youth nonadherence in
clinical settings: data‐based recommendations for children and adolescents with
inflammatory bowel disease. Inflammatory bowel diseases, 18(7), pp.1254-1259.
Haberer, J.E., Cook, A., Walker, A.S., Ngambi, M., Ferrier, A., Mulenga, V., Kityo, C.,
Thomason, M., Kabamba, D., Chintu, C. and Gibb, D.M., 2011. Excellent adherence to
antiretrovirals in HIV+ Zambian children is compromised by disrupted routine, HIV
nondisclosure, and paradoxical income effects. PloS one, 6(4), p.e18505.
263
Hartling, L., Featherstone, R., Nuspl, M., Shave, K., Dryden, D.M. and Vandermeer, B.,
2016. The contribution of databases to the results of systematic reviews: a cross-sectional
study. BMC Medical Research Methodology, 16(1), p.127.
Harvey, K.M., Carrington, D., Duncan, J., Figueroa, J.P., Hirschorn, L., Manning, D. and
Jackson, S., 2008. Evaluation of adherence to highly active antiretroviral therapy in adults
in Jamaica. West Indian Medical Journal, 57(3), pp.293-297.
Hawthorne, A.B., Stenson, R., Gillespie, D., Swarbrick, E.T., Dhar, A., Kapur, K.C.,
Hood, K. and Probert, C.S., 2012. One‐year investigator‐blind randomized multicenter
trial comparing asacol 2.4 g once daily with 800 mg three times daily for maintenance of
remission in ulcerative colitis. Inflammatory bowel diseases, 18(10), pp.1885-1893.
Henriques, M.A., Costa, M.A. and Cabrita, J., 2012. Adherence and medication
management by the elderly. Journal of clinical nursing, 21(21-22), pp.3096-3105.
Hernán, M.A. and Hernández-Díaz, S., 2012. Beyond the intention-to-treat in comparative
effectiveness research. Clinical Trials, 9(1), pp.48-55.
Hershman, D.L., Shao, T., Kushi, L.H., Buono, D., Tsai, W.Y., Fehrenbacher, L., Kwan,
M., Gomez, S.L. and Neugut, A.I., 2011. Early discontinuation and non-adherence to
adjuvant hormonal therapy are associated with increased mortality in women with breast
cancer. Breast cancer research and treatment, 126(2), pp.529-537.
Hézode, C., Asselah, T., Reddy, K.R., Hassanein, T., Berenguer, M., Fleischer-
Stepniewska, K., Marcellin, P., Hall, C., Schnell, G., Pilot-Matias, T. and Mobashery, N.,
2015. Ombitasvir plus paritaprevir plus ritonavir with or without ribavirin in treatment-naive
and treatment-experienced patients with genotype 4 chronic hepatitis C virus infection
(PEARL-I): a randomised, open-label trial. The Lancet, 385(9986), pp.2502-2509.
264
Hinkle, D.E., Wiersma, W., Jurs, S.G. Applied Statistics for the Behavioral Sciences. 5th
ed. Boston: Houghton Mifflin; 2003.
Hogan, T.P., Awad, A.G. and Eastwood, R., 1983. A self-report scale predictive of drug
compliance in schizophrenics: reliability and discriminative validity. Psychological
medicine, 13(01), pp.177-183.
Holmes, E.A., Hughes, D.A. and Morrison, V.L., 2014. Predicting adherence to
medications using health psychology theories: a systematic review of 20 years of empirical
research. Value in Health, 17(8), pp.863-876.
Hood, K., Robling, M., Ingledew, D., Gillespie, D., Greene, G., Ivins, R., Russell, I.,
Sayers, A., Shaw, C. and Williams, J., 2012. Mode of data elicitation, acquisition and
response to surveys: a systematic review.
Horne, R. and Weinman, J., 1999. Patients' beliefs about prescribed medicines and their
role in adherence to treatment in chronic physical illness. Journal of psychosomatic
research, 47(6), pp.555-567.
Horne, R., Chapman, S.C., Parham, R., Freemantle, N., Forbes, A. and Cooper, V., 2013.
Understanding patients’ adherence-related beliefs about medicines prescribed for long-
term conditions: a meta-analytic review of the Necessity-Concerns Framework. PloS one,
8(12), p.e80633.
Horne, R., Clatworthy, J. and Hankins, M., 2010. High adherence and concordance within
a clinical trial of antihypertensives. Chronic Illness.
Horne, R. and Weinman, J., 2002. Self-regulation and self-management in asthma:
exploring the role of illness perceptions and treatment beliefs in explaining non-adherence
to preventer medication. Psychology and Health, 17(1), pp.17-32.
265
Hussain, F.N., Ajjan, R.A., Kapur, K., Moustafa, M. and Riley, S.A., 2001. Once versus
divided daily dosing with delayed‐release mesalazine: a study of tissue drug concentrations
and standard pharmacokinetic parameters. Alimentary pharmacology & therapeutics,
15(1), pp.53-62.
ICH Steering Committee, Statistical Principles for Clinical Trials (E9). Geneva,
Switzerland: International Conference on Harmonisation of Technical Requirements for
Registration of Pharmaceuticals for Human Use 1998.
Jago, R., Edwards, M.J., Sebire, S.J., Tomkinson, K., Bird, E.L., Banfield, K., May, T.,
Kesten, J.M., Cooper, A.R., Powell, J.E. and Blair, P.S., 2015. Effect and cost of an after-
school dance programme on the physical activity of 11–12 year old girls: The Bristol Girls
Dance Project, a school-based cluster randomised controlled trial. International Journal of
Behavioral Nutrition and Physical Activity, 12(1), p.128.
Jerant, A., DiMatteo, R., Arnsten, J., Moore-Hill, M. and Franks, P., 2008. Self-report
adherence measures in chronic illness: retest reliability and predictive validity. Medical care,
46(11), pp.1134-1139.
Johnson, F.R., Özdemir, S., Manjunath, R., Hauber, A.B., Burch, S.P. and Thompson,
T.R., 2007. Factors that affect adherence to bipolar disorder treatments: a stated-preference
approach. Medical care, 45(6), pp.545-552.
Joint Formulary Committee. British National Formulary (online). London: BMJ Group
and Pharmaceutical Press; 2013 [21/03/2013]; Available from:
http://www.medicinescomplete.com.
Jones, B., Jarvis, P., Lewis, J.A. and Ebbutt, A.F., 1996. Trials to assess equivalence: the
importance of rigorous methods. BMJ: British Medical Journal, 313(7048), p.36.
266
Kalkan, K., Bacciogly, K. and Kalpakliogly, A.F., 2013. Allergic rhinitis: can we identify
nonadherence to therapy and its predictors easily in daily practice. J Investig Allergol Clin
Immunol, 23(5), pp.315-322.
Kane, S.V., Cohen, R.D., Aikens, J.E. and Hanauer, S.B., 2001. Prevalence of
nonadherence with maintenance mesalamine in quiescent ulcerative colitis. The American
journal of gastroenterology, 96(10), pp.2929-2933.
Kane, S.V., 2006. Systematic review: adherence issues in the treatment of ulcerative colitis.
Alimentary pharmacology & therapeutics, 23(5), pp.577-585.
Kane, S.V., Accortt, N.A., Magowan, S. and Brixner, D., 2009. Predictors of persistence
with 5‐aminosalicylic acid therapy for ulcerative colitis. Alimentary pharmacology &
therapeutics, 29(8), pp.855-862.
Kardas, P., Devine, S., Golembesky, A. and Roberts, C., 2005. A systematic review and
meta-analysis of misuse of antibiotic therapies in the community. International journal of
antimicrobial agents, 26(2), pp.106-113.
Kastelein, J.J., Besseling, J., Shah, S., Bergeron, J., Langslet, G., Hovingh, G.K., Al-Saady,
N., Koeijvoets, M., Hunter, J., Johnson-Levonas, A.O. and Fable, J., 2015. Anacetrapib as
lipid-modifying therapy in patients with heterozygous familial hypercholesterolaemia
(REALIZE): a randomised, double-blind, placebo-controlled, phase 3 study. The Lancet,
385(9983), pp.2153-2161.
Kenna, L.A., Labbé, L., Barrett, J.S. and Pfister, M., 2005. Modeling and simulation of
adherence: approaches and applications in therapeutics. The AAPS journal, 7(2), pp.E390-
E407.
Kereiakes, D.J., Yeh, R.W., Massaro, J.M., Driscoll-Shempp, P., Cutlip, D.E., Steg, P.G.,
Gershlick, A.H., Darius, H., Meredith, I.T., Ormiston, J. and Tanguay, J.F., 2015.
267
Antiplatelet therapy duration following bare metal or drug-eluting coronary stents: the dual
antiplatelet therapy randomized clinical trial. Jama, 313(11), pp.1113-1121.
Khangura, S., Konnyu, K., Cushman, R., Grimshaw, J. and Moher, D., 2012. Evidence
summaries: the evolution of a rapid review approach. Systematic reviews, 1(1), p.1.
Khanna, R., Bressler, B., Levesque, B.G., Zou, G., Stitt, L.W., Greenberg, G.R.,
Panaccione, R., Bitton, A., Paré, P., Vermeire, S. and D'Haens, G., 2015. Early combined
immunosuppression for the management of Crohn's disease (REACT): a cluster
randomised controlled trial. The Lancet, 386(10006), pp.1825-1834.
Kjellgren, K., Ring, L., Lindblad, A.K., Maroti, M. and Serup, J., 2004. To Follow
Dermatological Treatment Regimens- Patients' and Providers' Views. Acta dermato-
venereologica, 84(6), pp.445-450.
Knox, C.R., Lall, R., Hansen, Z. and Lamb, S.E., 2014. Treatment compliance and
effectiveness of a cognitive behavioural intervention for low back pain: a complier average
causal effect approach to the BeST data set. BMC musculoskeletal disorders, 15(1), p.17.
Kogan, S.M., Lei, M.K., Brody, G.H., Futris, T.G., Sperr, M. and Anderson, T., 2016.
Implementing family-centered prevention in rural African American communities: a
randomized effectiveness trial of the strong African American families program. Prevention
Science, 17(2), pp.248-258.
Krug, N., Hohlfeld, J.M., Kirsten, A.M., Kornmann, O., Beeh, K.M., Kappeler, D., Korn,
S., Ignatenko, S., Timmer, W., Rogon, C. and Zeitvogel, J., 2015. Allergen-induced
asthmatic responses modified by a GATA3-specific DNAzyme. New England Journal of
Medicine, 372(21), pp.1987-1995.
Kubo, Y., Sterling, L.R., Parfrey, P.S., Gill, K., Mahaffey, K.W., Gioni, I., Trotman, M.L.,
Dehmel, B. and Chertow, G.M., 2015. Assessing the treatment effect in a randomized
268
controlled trial with extensive non‐adherence: the EVOLVE trial. Pharmaceutical statistics,
14(3), pp.242-251.
Kuyken, W., Hayes, R., Barrett, B., Byng, R., Dalgleish, T., Kessler, D., Lewis, G.,
Watkins, E., Brejcha, C., Cardy, J. and Causley, A., 2015. Effectiveness and cost-
effectiveness of mindfulness-based cognitive therapy compared with maintenance
antidepressant treatment in the prevention of depressive relapse or recurrence
(PREVENT): a randomised controlled trial. The Lancet, 386(9988), pp.63-73.
Lachaine, J., Yen, L., Beauchemin, C. and Hodgkins, P., 2013. Medication adherence and
persistence in the treatment of Canadian ulcerative colitis patients: analyses with the RAMQ
database. BMC gastroenterology, 13(1), p.23.
Lam, W.Y. and Fresco, P., 2015. Medication adherence measures: an overview. BioMed
Res Int, 2015, p.217047.
Langendonk, J.G., Balwani, M., Anderson, K.E., Bonkovsky, H.L., Anstey, A.V., Bissell,
D.M., Bloomer, J., Edwards, C., Neumann, N.J., Parker, C. and Phillips, J.D., 2015.
Afamelanotide for erythropoietic protoporphyria. New England Journal of Medicine,
373(1), pp.48-59.
Leder, B.Z., Tsai, J.N., Uihlein, A.V., Wallace, P.M., Lee, H., Neer, R.M. and Burnett-
Bowie, S.A.M., 2015. Denosumab and teriparatide transitions in postmenopausal
osteoporosis (the DATA-Switch study): extension of a randomised controlled trial. The
Lancet, 386(9999), pp.1147-1155.
Lee, A.Y., Kamphuisen, P.W., Meyer, G., Bauersachs, R., Janas, M.S., Jarner, M.F. and
Khorana, A.A., 2015. Tinzaparin vs warfarin for treatment of acute venous
thromboembolism in patients with active cancer: a randomized clinical trial. Jama, 314(7),
pp.677-686.
269
Lehane, E. and McCarthy, G., 2009. Medication non‐adherence—exploring the conceptual
mire. International journal of nursing practice, 15(1), pp.25-31.
Lesaffre, E., Superiority, equivalence, and non-inferiority trials. Bulletin of the NYU
hospital for joint diseases, 2008. 66(2): p. 150-154.
Lewis, J.A., 1999. Statistical principles for clinical trials (ICH E9): an introductory note on
an international guideline. Statistics in medicine, 18(15), pp.1903-1942.
Li, W.W., Stotts, N.A. and Froelicher, E.S., 2007. Compliance with antihypertensive
medication in Chinese immigrants: cultural specific issues and theoretical application.
Research and theory for nursing practice, 21(4), pp.236-254.
Lin, C.W., Karaca-Mandic, P., McCullough, J.S. and Weaver, L., 2014. Access to Oral
Osteoporosis Drugs Among Female Medicare Part D Beneficiaries. Women's Health
Issues, 24(4), pp.e435-e445.
Lin, W.S., Yang, W.S. and Lin, H.Y., 1995. Prednisolone non-compliance and its related
factors in patients with systemic lupus erythematosus. Zhonghua yi xue za zhi= Chinese
medical journal; Free China ed, 56(4), pp.244-251.
Little, P., Stuart, B., Moore, M., Coenen, S., Butler, C.C., Godycki-Cwirko, M., Mierzecki,
A., Chlabicz, S., Torres, A., Almirall, J. and Davies, M., 2013. Amoxicillin for acute lower-
respiratory-tract infection in primary care when pneumonia is not suspected: a 12-country,
randomised, placebo-controlled trial. The Lancet Infectious Diseases, 13(2), pp.123-129.
Llor C, Sierra N, Hernandez S, et al. The higher the number of daily doses of antibiotic
treatment in lower respiratory tract infection the worse the compliance. J Antimicrob
Chemother. 2009;63(2):396–399.
Loudon, K., Treweek, S., Sullivan F., et al. The PRECIS-2 tool: designing trials that are fit
for purpose BMJ 2015; 350:h2147.
270
Louviere, J.J., Hensher, D.A. and Swait, J.D., 2000. Stated choice methods: analysis and
applications. Cambridge University Press.
Lu M, Safren SA, Skolnik PR, et al. Optimal recall period and response task for self-
reported HIV medication adherence. AIDS Behav. 2008;12(1):86–94.
Mackey, K., Parchman, M.L., Leykum, L.K., Lanham, H.J., Noël, P.H. and Zeber, J.E.,
2012. Impact of the Chronic Care Model on medication adherence when patients perceive
cost as a barrier. Primary care diabetes, 6(2), pp.137-142.
Mahler, C., Hermann, K., Horne, R., Ludt, S., Haefeli, W.E., Szecsenyi, J. and Jank, S.,
2010. Assessing reported adherence to pharmacological treatment recommendations.
Translation and evaluation of the Medication Adherence Report Scale (MARS) in
Germany. Journal of evaluation in clinical practice, 16(3), pp.574-579.
Marrazzo, J.M., Ramjee, G., Richardson, B.A., Gomez, K., Mgodi, N., Nair, G., Palanee,
T., Nakabiito, C., Van Der Straten, A., Noguchi, L. and Hendrix, C.W., 2015. Tenofovir-
based preexposure prophylaxis for HIV infection among African women. New England
Journal of Medicine, 372(6), pp.509-518.
Marsh, L.C., Cormier D.R. Spline Regression Models. Thousand Oaks: Sage; 2001.
Matsui, D., Hermann, C., Klein, J., Berkovitch, M., Olivieri, N. and Koren, G., 1994.
Critical comparison of novel and existing methods of compliance assessment during a
clinical trial of an oral iron chelator. The Journal of Clinical Pharmacology, 34(9), pp.944-
949.
McCambridge, J., Butor-Bhavsar, K., Witton, J. and Elbourne, D., 2011. Can research
assessments themselves cause bias in behaviour change trials? A systematic review of
evidence from Solomon 4-group studies. PLoS One, 6(10), p.e25223.
271
McCann, D.J., Petry, N.M., Bresell, A., Isacsson, E., Wilson, E. and Alexander, R.C.,
2015. Medication Nonadherence," Professional Subjects," and Apparent Placebo
Responders: Overlapping Challenges for Medications Development. Journal of clinical
psychopharmacology, 35(5), p.566.
McCullagh, P. and Nelder, J.A., 1989. Generalized linear models (Vol. 37). CRC press.
McDonnell, P.J. and Jacobs, M.R., 2002. Hospital admissions resulting from preventable
adverse drug reactions. Annals of Pharmacotherapy, 36(9), pp.1331-1336.
Mock, V., Frangakis, C., Davidson, N.E., Ropka, M.E., Pickett, M., Poniatowski, B.,
Stewart, K.J., Cameron, L., Zawacki, K., Podewils, L.J. and Cohen, G., 2005. Exercise
manages fatigue during breast cancer treatment: a randomized controlled trial. Psycho‐
Oncology, 14(6), pp.464-477.
Moher, D., Hopewell, S., Schulz, K.F., Montori, V., Gøtzsche, P.C., Devereaux, P.J.,
Elbourne, D., Egger, M. and Altman, D.G., 2010. CONSORT 2010 explanation and
elaboration: updated guidelines for reporting parallel group randomised trials. Journal of
clinical epidemiology, 63(8), pp.e1-e37.
Montori, V.M. and Guyatt, G.H., 2001. Intention-to-treat principle. Canadian Medical
Association Journal, 165(10), pp.1339-1341.
Morisky, D.E., Green, L.W. and Levine, D.M., 1986. Concurrent and predictive validity
of a self-reported measure of medication adherence. Medical care, 24(1), pp.67-74.
Mullahy, J., 1986. Specification and testing of some modified count data models. Journal
of econometrics, 33(3), pp.341-365.
Munro, S., Lewin, S., Swart, T. and Volmink, J., 2007. A review of health behaviour
theories: how useful are these for developing interventions to promote long-term
medication adherence for TB and HIV/AIDS?. BMC public health, 7(1), p.104.
272
National Institute for Health and Clinical Excellence (November 2012) The guidelines
manual. London: National Institute for Health and Clinical Excellence. Available from:
www.nice.org.uk
Nguyen, Q.C., Schmidt, N.M., Glymour, M.M., Rehkopf, D.H. and Osypuk, T.L., 2013.
Were the mental health benefits of a housing mobility intervention larger for adolescents
in higher socioeconomic status families?. Health & place, 23, pp.79-88.
Nieuwlaat, R., Wilczynski, N., Navarro, T., Hobson, N., Jeffery, R., Keepanasseril, A.,
Agoritsas, T., Mistry, N., Iorio, A., Jack, S. and Sivaramalingam, B., 2014. Interventions
for enhancing medication adherence. The Cochrane Library.
Nischal, K.C., Khopkar, U. and Saple, D.G., 2005. Improving adherence to antiretroviral
therapy. Indian Journal of Dermatology, Venereology, and Leprology, 71(5), p.316.
Norell, S.E., 1981. Accuracy of patient interviews and estimates by clinical staff in
determining medication compliance. Social Science & Medicine. Part E: Medical
Psychology, 15(1), pp.57-61.
Osterberg, L. and Blaschke, T., 2005. Adherence to medication. New England Journal of
Medicine, 353(5), pp.487-497.
Osypuk, T.L., Schmidt, N.M., Bates, L.M., Tchetgen-Tchetgen, E.J., Earls, F.J. and
Glymour, M.M., 2012. Gender and crime victimization modify neighborhood effects on
adolescent mental health. Pediatrics, pp.peds-2011.
Paterson, D.L., Swindells, S., Mohr, J., Brester, M., Vergis, E.N., Squier, C., Wagener,
M.M. and Singh, N., 2000. Adherence to protease inhibitor therapy and outcomes in
patients with HIV infection. Annals of internal medicine, 133(1), pp.21-30.
273
Patton, D.E., Hughes, C.M., Cadogan, C.A. and Ryan, C.A., 2016. Theory-Based
Interventions to Improve Medication Adherence in Older Adults Prescribed
Polypharmacy: A Systematic Review. Drugs & Aging, pp.1-17.
Pearson, K., 1895. Note on regression and inheritance in the case of two parents.
Proceedings of the Royal Society of London, 58, pp.240-242.
Pechère, J.C., Hughes, D., Kardas, P. and Cornaglia, G., 2007. Non-compliance with
antibiotic therapy for acute community infections: a global survey. International journal of
antimicrobial agents, 29(3), pp.245-253.
Pelouchova, J., 2015. Adherence from the Patient Perspective. Oral presentation given at
the European Society for Patient Adherence, Compliance, and Persistence, Prague, Czech
Republic.
Piaggio, G., Elbourne, D.R., Altman, D.G., Pocock, S.J., Evans, S.J., and Group, C.,
Reporting of noninferiority and equivalence randomized trials: an extension of the
CONSORT statement. Jama, 456 2006. 295(10): p. 1152-1160.
Picardi, A., Lega, I., Tarsitani, L., Caredda, M., Matteucci, G., Zerella, M.P., Miglio, R.,
Gigantesco, A., Cerbo, M., Gaddini, A. and Spandonaro, F., 2016. A randomised
controlled trial of the effectiveness of a program for early detection and treatment of
depression in primary care. Journal of affective disorders, 198, pp.96-101.
Postow, M.A., Chesney, J., Pavlick, A.C., Robert, C., Grossmann, K., McDermott, D.,
Linette, G.P., Meyer, N., Giguere, J.K., Agarwala, S.S. and Shaheen, M., 2015. Nivolumab
and ipilimumab versus ipilimumab in untreated melanoma. New England Journal of
Medicine, 372(21), pp.2006-2017.
274
Prantera, C., Viscido, A., Biancone, L., Francavilla, A., Giglio, L. and Campieri, M., 2005.
A new oral delivery system for 5‐ASA: preliminary clinical findings for MMx. Inflammatory
bowel diseases, 11(5), pp.421-427.
Raal, F.J., Honarpour, N., Blom, D.J., Hovingh, G.K., Xu, F., Scott, R., Wasserman, S.M.,
Stein, E.A. and TESLA Investigators, 2015. Inhibition of PCSK9 with evolocumab in
homozygous familial hypercholesterolaemia (TESLA Part B): a randomised, double-blind,
placebo-controlled trial. The Lancet, 385(9965), pp.341-350.
Raal, F.J., Stein, E.A., Dufour, R., Turner, T., Civeira, F., Burgess, L., Langslet, G., Scott,
R., Olsson, A.G., Sullivan, D. and Hovingh, G.K., 2015. PCSK9 inhibition with
evolocumab (AMG 145) in heterozygous familial hypercholesterolaemia
(RUTHERFORD-2): a randomised, double-blind, placebo-controlled trial. The Lancet,
385(9965), pp.331-340.
Rahman, N.M., Pepperell, J., Rehal, S., Saba, T., Tang, A., Ali, N., West, A.,
Hettiarachchi, G., Mukherjee, D., Samuel, J. and Bentley, A., 2015. Effect of opioids vs
NSAIDs and larger vs smaller chest tube size on pain control and pleurodesis efficacy
among patients with malignant pleural effusion: the TIME1 randomized clinical trial. Jama,
314(24), pp.2641-2653.
Robert, C., Karaszewska, B., Schachter, J., Rutkowski, P., Mackiewicz, A., Stroiakovski,
D., Lichinitser, M., Dummer, R., Grange, F., Mortier, L. and Chiarion-Sileni, V., 2015.
Improved overall survival in melanoma with combined dabrafenib and trametinib. New
England Journal of Medicine, 372(1), pp.30-39.
Robert, C., Long, G.V., Brady, B., Dutriaux, C., Maio, M., Mortier, L., Hassel, J.C.,
Rutkowski, P., McNeil, C., Kalinka-Warzocha, E. and Savage, K.J., 2015. Nivolumab in
previously untreated melanoma without BRAF mutation. New England journal of
medicine, 372(4), pp.320-330.
275
Rosen, L.S., Gordon, D., Kaminski, M., Howell, A., Belch, A., Mackey, J., Apffelstaedt,
J., Hussein, M.A., Coleman, R.E., Reitsma, D.J. and Chen, B.L., 2003. Long‐term efficacy
and safety of zoledronic acid compared with pamidronate disodium in the treatment of
skeletal complications in patients with advanced multiple myeloma or breast carcinoma.
Cancer, 98(8), pp.1735-1744.
Royston, P., Altman, D.G. Regression using fractional polynomials of continuous
covariates – parsimonious parametric modeling. Appl Statist. 1994; 43:429–467.
Rudd, P., Byyny, R.L., Zachary, V., LoVerde, M.E., Titus, C., Mitchell, W.D. and
Marshall, G., 1989. The natural history of medication compliance in a drug trial: limitations
of pill counts. Clinical Pharmacology & Therapeutics, 46(2), pp.169-176.
Ruff, C.T., Giugliano, R.P., Braunwald, E., Morrow, D.A., Murphy, S.A., Kuder, J.F.,
Deenadayalu, N., Jarolim, P., Betcher, J., Shi, M. and Brown, K., 2015. Association
between edoxaban dose, concentration, anti-Factor Xa activity, and outcomes: an analysis
of data from the randomised, double-blind ENGAGE AF-TIMI 48 trial. The Lancet,
385(9984), pp.2288-2295.
Sabaté, E., Adherence to long-term therapies: evidence for action. 2003: World Health
Organization.
Saini, S.D., Schoenfeld, P., Kaulback, K. and Dubinsky, M.C., 2009. Effect of medication
dosing frequency on adherence in chronic diseases. The American journal of managed
care, 15(6), pp.e22-33.
Sandborn, W.J., Korzenik, J., Lashner, B., Leighton, J.A., Mahadevan, U., Marion, J.F.,
Safdi, M., Sninsky, C.A., Patel, R.M., Friedenberg, K.A. and Dunnmon, P., 2010. Once-
daily dosing of delayed-release oral mesalamine (400-mg tablet) is as effective as twice-daily
276
dosing for maintenance of remission of ulcerative colitis. Gastroenterology, 138(4),
pp.1286-1296.
Saver, J.L., Starkman, S., Eckstein, M., Stratton, S.J., Pratt, F.D., Hamilton, S., Conwit, R.,
Liebeskind, D.S., Sung, G., Kramer, I. and Moreau, G., 2015. Prehospital use of
magnesium sulfate as neuroprotection in acute stroke. New England Journal of Medicine,
372(6), pp.528-536.
Sax, P.E., Wohl, D., Yin, M.T., Post, F., DeJesus, E., Saag, M., Pozniak, A., Thompson,
M., Podzamczer, D., Molina, J.M. and Oka, S., 2015. Tenofovir alafenamide versus
tenofovir disoproxil fumarate, coformulated with elvitegravir, cobicistat, and emtricitabine,
for initial treatment of HIV-1 infection: two randomised, double-blind, phase 3, non-
inferiority trials. The Lancet, 385(9987), pp.2606-2615.
Schlumberger, M., Tahara, M., Wirth, L.J., Robinson, B., Brose, M.S., Elisei, R., Habra,
M.A., Newbold, K., Shah, M.H., Hoff, A.O. and Gianoukakis, A.G., 2015. Lenvatinib
versus placebo in radioiodine-refractory thyroid cancer. New England Journal of Medicine,
372(7), pp.621-630.
Scott, D.L., Ibrahim, F., Farewell, V., O’Keeffe, A.G., Walker, D., Kelly, C., Birrell, F.,
Chakravarty, K., Maddison, P., Heslin, M. and Patel, A., 2015. Tumour necrosis factor
inhibitors versus combination intensive therapy with conventional disease modifying anti-
rheumatic drugs in established rheumatoid arthritis: TACIT non-inferiority randomised
controlled trial. bmj, 350, p.h1046.
Senn, S.J., 2005. Dichotomania: an obsessive compulsive disorder that is badly affecting
the quality of analysis of pharmaceutical trials. Proceedings of the International Statistical
Institute, 55th Session, Sydney.
277
Shale, M.J. and Riley, S.A., 2003. Studies of compliance with delayed‐release mesalazine
therapy in patients with inflammatory bowel disease. Alimentary pharmacology &
therapeutics, 18(2), pp.191-198.
Shea, B.J., Grimshaw, J.M., Wells, G.A., Boers, M., Andersson, N., Hamel, C., Porter,
A.C., Tugwell, P., Moher, D. and Bouter, L.M., 2007. Development of AMSTAR: a
measurement tool to assess the methodological quality of systematic reviews. BMC medical
research methodology, 7(1), p.1.
Shope, J.T., 1987. Compliance in children and adults: review of studies. Epilepsy Research.
Supplement, 1, pp.23-47.
Singal, A.G., Higgins, P.D. and Waljee, A.K., 2014. A primer on effectiveness and efficacy
trials. Clinical and translational gastroenterology, 5(1), p.e45.
Smith, L.J., Kalhan, R., Wise, R.A., Sugar, E.A., Lima, J.J., Irvin, C.G., Dozor, A.J. and
Holbrook, J.T., 2015. Effect of a soy isoflavone supplement on lung function and clinical
outcomes in patients with poorly controlled asthma: a randomized clinical trial. Jama,
313(20), pp.2033-2043.
Stanger, C., Ryan, S.R., Fu, H. and Budney, A.J., 2011. Parent training plus contingency
management for substance abusing families: A Complier Average Causal Effects (CACE)
analysis. Drug and alcohol dependence, 118(2), pp.119-126.
Steiner, J.F. and Prochazka, A.V., 1997. The assessment of refill compliance using
pharmacy records: methods, validity, and applications. Journal of clinical epidemiology,
50(1), pp.105-116.
Steiner, J.F., Koepsell, T.D., Fihn, S.D. and Inui, T.S., 1988. A general method of
compliance assessment using centralized pharmacy records: description and validation.
Medical care, 26(8), pp.814-823.
278
Streiner, D.L., Norman, G.R. and Cairney, J., 2014. Health measurement scales: a practical
guide to their development and use. Oxford University Press, USA.
Sutherland, L.R. and MacDonald, J.K., 2006. Oral 5‐aminosalicylic acid for maintenance
of remission in ulcerative colitis. The Cochrane Library.
Sutton, S., Kinmonth, A.L., Hardeman, W., Hughes, D., Boase, S., Prevost, A.T., Kellar,
I., Graffy, J., Griffin, S. and Farmer, A., 2014. Does electronic monitoring influence
adherence to medication? Randomized controlled trial of measurement reactivity. Annals
of Behavioral Medicine, 48(3), pp.293-299.
Svarstad, B.L., Chewning, B.A., Sleath, B.L. and Claesson, C., 1999. The Brief Medication
Questionnaire: a tool for screening patient adherence and barriers to adherence. Patient
education and counseling, 37(2), pp.113-124.
Swain, S.M., Baselga, J., Kim, S.B., Ro, J., Semiglazov, V., Campone, M., Ciruelos, E.,
Ferrero, J.M., Schneeweiss, A., Heeson, S. and Clark, E., 2015. Pertuzumab, trastuzumab,
and docetaxel in HER2-positive metastatic breast cancer. New England Journal of
Medicine, 372(8), pp.724-734.
Taylor TH, Mecchella JN, Larson RJ, Kerin KD, MacKenzie TA. Initiation of allopurinol
at first medical contact for acute attacks of gout: a randomized clinical trial. Am J Med.
2012;125(11):1126–34. e7
Thurstone, L.L., 1927. A law of comparative judgment. Psychological review, 34(4), p.273.
Tilbrook, H.E., Hewitt, C.E., Aplin, J.D., Semlyen, A., Trewhela, A., Watt, I. and
Torgerson, D.J., 2014. Compliance effects in a randomised controlled trial of yoga for
chronic low back pain: a methodological study. Physiotherapy, 100(3), pp.256-262.
279
Tilling, K., Macdonald-Wallis, C., Lawlor, D.A., et al., 2014. Modelling childhood growth
using fractional polynomials and linear splines. Annals of Nutrition and Metabolism, 65(2-
3), pp.129-138.
Treweek, S., Altman, D.G., Bower, P., Campbell, M., Chalmers, I., Cotton, S., Craig, P.,
Crosby, D., Davidson, P., Devane, D. and Duley, L., 2015. Making randomised trials more
efficient: report of the first meeting to discuss the Trial Forge platform. Trials, 16(1), p.1.
Trueman, P., Taylor, D.G., Lowson, K., Bligh, A., Meszaros, A., Wright, D., Glanville, J.,
Newbould, J., Bury, M., Barber, N. and Jani, Y.H., 2010. Evaluation of the scale, causes
and costs of waste medicines. Report of DH funded national project.
Tshefu, A., Lokangaka, A., Ngaima, S., Engmann, C., Esamai, F., Gisore, P., Ayede, A.I.,
Falade, A.G., Adejuyigbe, E.A., Anyabolu, C.H. and Wammanda, R.D., 2015. Oral
amoxicillin compared with injectable procaine benzylpenicillin plus gentamicin for
treatment of neonates and young infants with fast breathing when referral is not possible: a
randomised, open-label, equivalence trial. The Lancet, 385(9979), pp.1758-1766.
van Vugt, S.F., Broekhuizen, B.D., Lammens, C., Zuithoff, N.P., de Jong, P.A., Coenen,
S., Ieven, M., Butler, C.C., Goossens, H., Little, P. and Verheij, T.J., 2013. Use of serum
C reactive protein and procalcitonin concentrations in addition to symptoms and signs to
predict pneumonia in patients presenting to primary care with acute cough: diagnostic
study.
Vansteelandt, S. and Goetghebeur, E., 2003. Causal inference with generalized structural
mean models. Journal of the Royal Statistical Society: Series B (Statistical Methodology),
65(4), pp.817-835.
Verbeke, G., 2005. Models for Discrete Longitudinal Data. Springer Series in Statistics.
Springer.
280
Vermeire, E., Hearnshaw, H., Van Royen, P. and Denekens, J., 2001. Patient adherence
to treatment: three decades of research. A comprehensive review. Journal of clinical
pharmacy and therapeutics, 26(5), pp.331-342.
Vitolins, M.Z., Rand, C.S., Rapp, S.R., Ribisl, P.M. and Sevick, M.A., 2000. Measuring
adherence to behavioral and medical interventions. Controlled clinical trials, 21(5),
pp.S188-S194.
Vrijens, B. and Urquhart, J., 2005. Patient adherence to prescribed antimicrobial drug
dosing regimens. Journal of Antimicrobial Chemotherapy, 55(5), pp.616-627.
Vrijens, B., De Geest, S., Hughes, D.A., Przemyslaw, K., Demonceau, J., Ruppar, T.,
Dobbels, F., Fargher, E., Morrison, V., Lewek, P. and Matyjaszczyk, M., 2012. A new
taxonomy for describing and defining adherence to medications. British journal of clinical
pharmacology, 73(5), pp.691-705.
Vrijens, B., Vincze, G., Kristanto, P., Urquhart, J. and Burnier, M., 2008. Adherence to
prescribed antihypertensive drug treatments: longitudinal study of electronically compiled
dosing histories. Bmj, 336(7653), pp.1114-1117.
Wainberg, M.A. and Friedland, G., 1998. Public health implications of antiretroviral
therapy and HIV drug resistance. Jama, 279(24), pp.1977-1983.
Wainwright, C.E., Elborn, J.S., Ramsey, B.W., Marigowda, G., Huang, X., Cipolli, M.,
Colombo, C., Davies, J.C., De Boeck, K., Flume, P.A. and Konstan, M.W., 2015.
Lumacaftor–ivacaftor in patients with cystic fibrosis homozygous for Phe508del CFTR.
New England Journal of Medicine, 373(3), pp.220-231.
Walsh, J.C., Mandalia, S. and Gazzard, B.G., 2002. Responses to a 1 month self-report on
adherence to antiretroviral therapy are consistent with electronic data and virological
treatment outcome. Aids, 16(2), pp.269-277.
281
Wechsler, M.E., Yawn, B.P., Fuhlbrigge, A.L., Pace, W.D., Pencina, M.J., Doros, G.,
Kazani, S., Raby, B.A., Lanzillotti, J., Madison, S. and Israel, E., 2015. Anticholinergic vs
long-acting β-agonist in combination with inhaled corticosteroids in black adults with
asthma: The BELT randomized clinical trial. JAMA, 314(16), pp.1720-1730.
Weisstein, E.W. "B-Spline." From MathWorld--A Wolfram Web Resource.
http://mathworld.wolfram.com/B-Spline.html.
White, I.R., Uses and limitations of randomization-based efficacy estimators. Statistical
Methods in Medical Research, 2005. 14(4): p. 327-347.
Wiles, N.J., Fischer, K., Cowen, P., Nutt, D., Peters, T.J., Lewis, G. and White, I.R., 2014.
Allowing for non-adherence to treatment in a randomized controlled trial of two
antidepressants (citalopram versus reboxetine): an example from the GENPOD trial.
Psychological medicine, 44(13), pp.2855-2866.
Williams, B., MacDonald, T.M., Morant, S., Webb, D.J., Sever, P., McInnes, G., Ford, I.,
Cruickshank, J.K., Caulfield, M.J., Salsbury, J. and Mackenzie, I., 2015. Spironolactone
versus placebo, bisoprolol, and doxazosin to determine the optimal treatment for drug-
resistant hypertension (PATHWAY-2): a randomised, double-blind, crossover trial. The
Lancet, 386(10008), pp.2059-2068.
Williams, R.L., 2000. A note on robust variance estimation for cluster‐correlated data.
Biometrics, 56(2), pp.645-646.
Wong, M.H., Stockler, M.R. and Pavlakis, N., 2012. Bisphosphonates and other bone
agents for breast cancer. The Cochrane Library.
Wood, J., Butler, C.C., Hood, K., Kelly, M.J., Verheij, T., Little, P., Torres, A., Blasi, F.,
Schaberg, T., Goossens, H. and Nuttall, J., 2011. Antibiotic prescribing for adults with
282
acute cough/lower respiratory tract infection: congruence with guidelines. European
Respiratory Journal, 38(1), pp.112-118.
World Health Organization, 2014. Antimicrobial resistance global report on surveillance:
2014 summary.
Wyles, D.L., Ruane, P.J., Sulkowski, M.S., Dieterich, D., Luetkemeyer, A., Morgan, T.R.,
Sherman, K.E., Dretler, R., Fishbein, D., Gathe Jr, J.C. and Henn, S., 2015. Daclatasvir
plus sofosbuvir for HCV in patients coinfected with HIV-1. New England Journal of
Medicine, 373(8), pp.714-725.
Zinman, B., Wanner, C., Lachin, J.M., Fitchett, D., Bluhmki, E., Hantel, S., Mattheus, M.,
Devins, T., Johansen, O.E., Woerle, H.J. and Broedl, U.C., 2015. Empagliflozin,
cardiovascular outcomes, and mortality in type 2 diabetes. New England Journal of
Medicine, 373(22), pp.2117-2128.
Appendices
Appendix I – Description of variables collected as part of the
GRACE studies
I. GRACE WP8 CRF
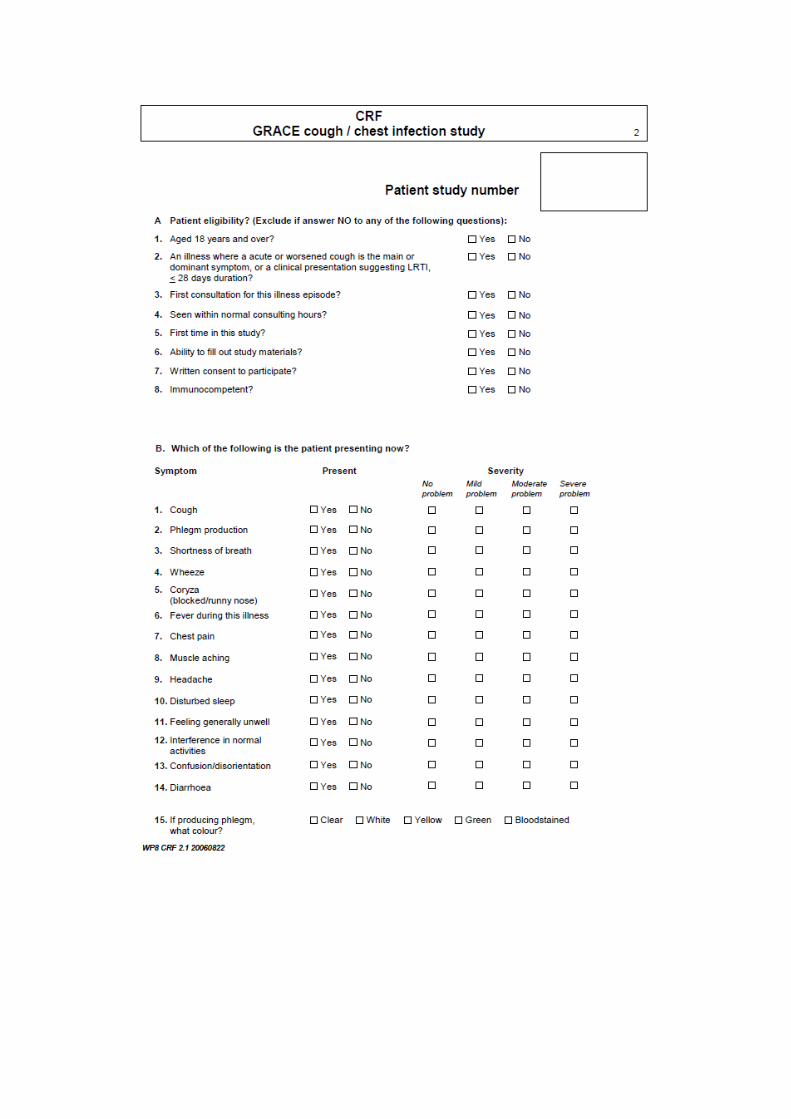
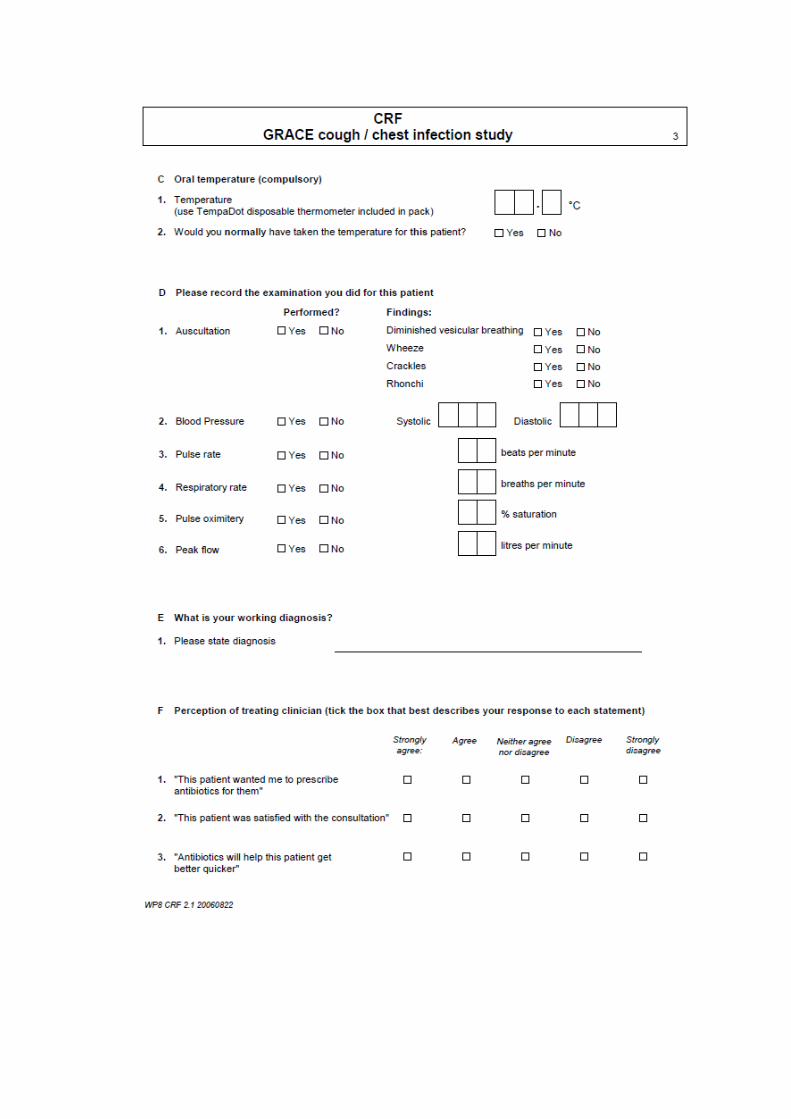

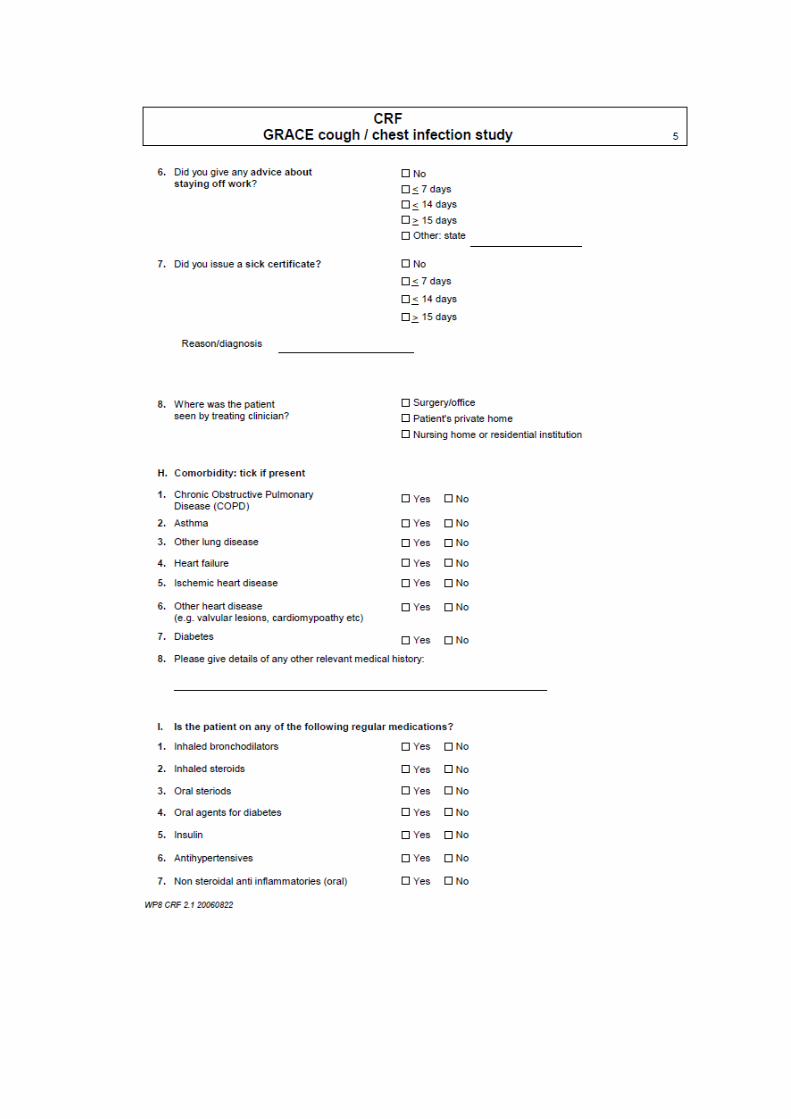
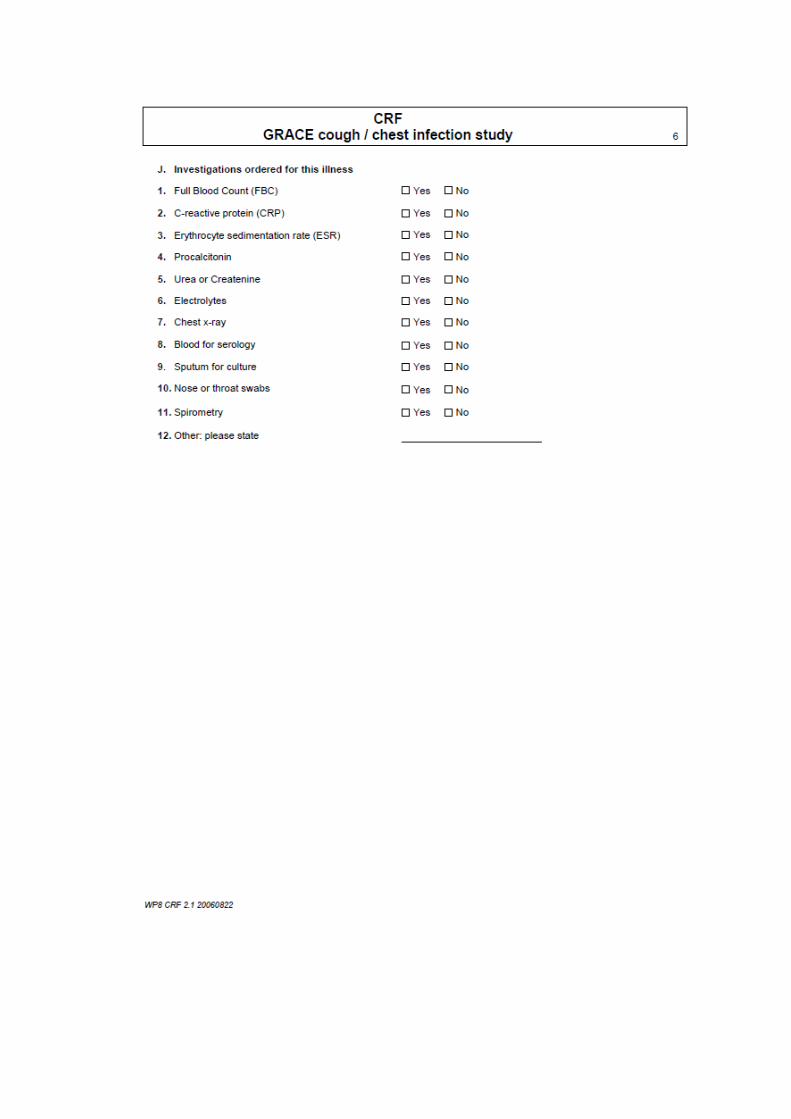
II. GRACE WP8 Diary
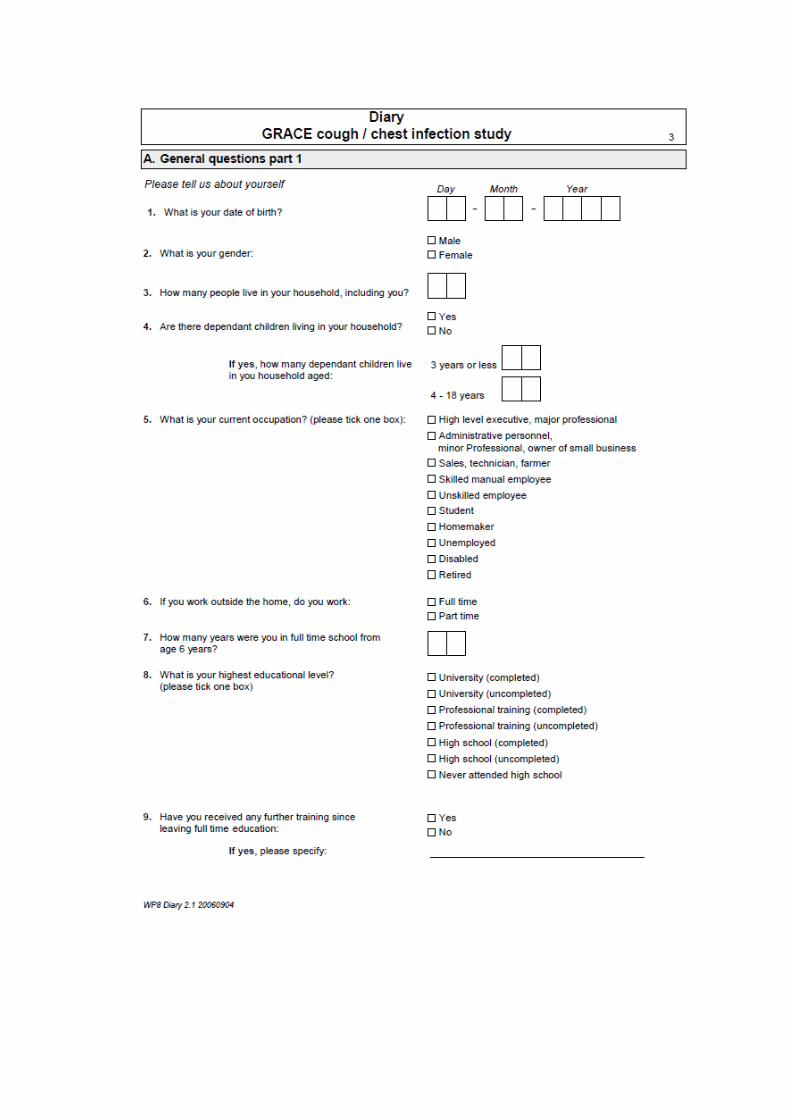
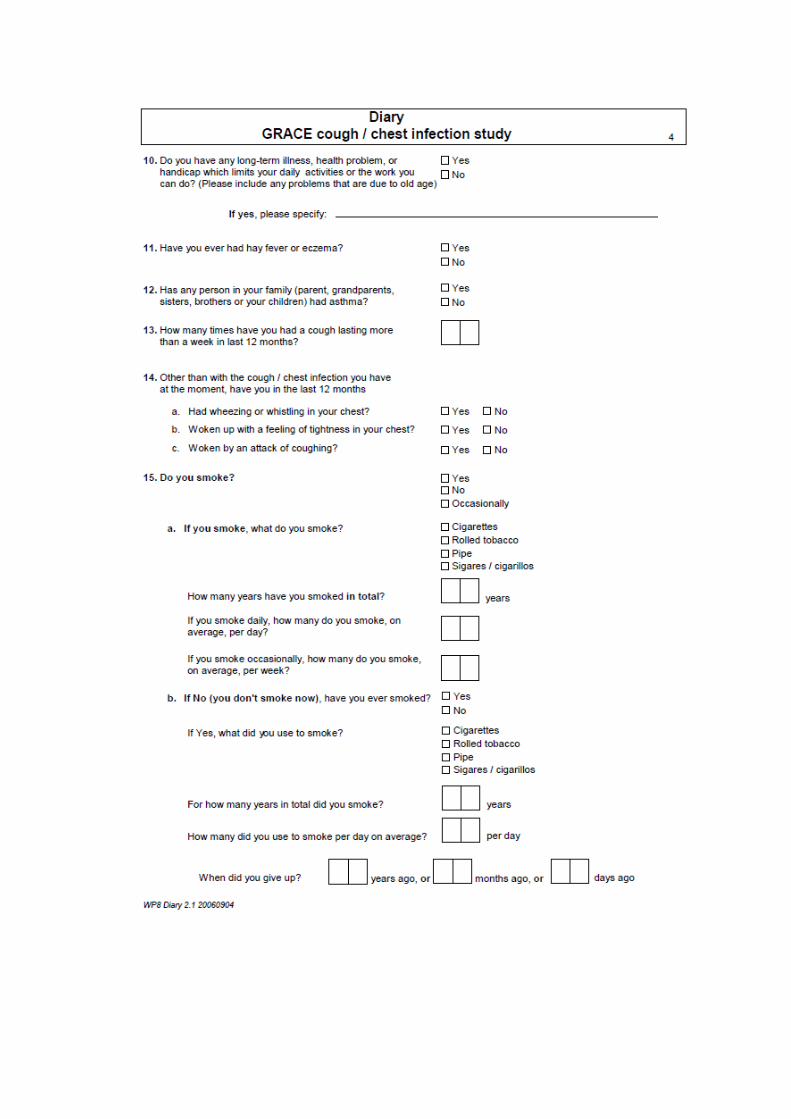

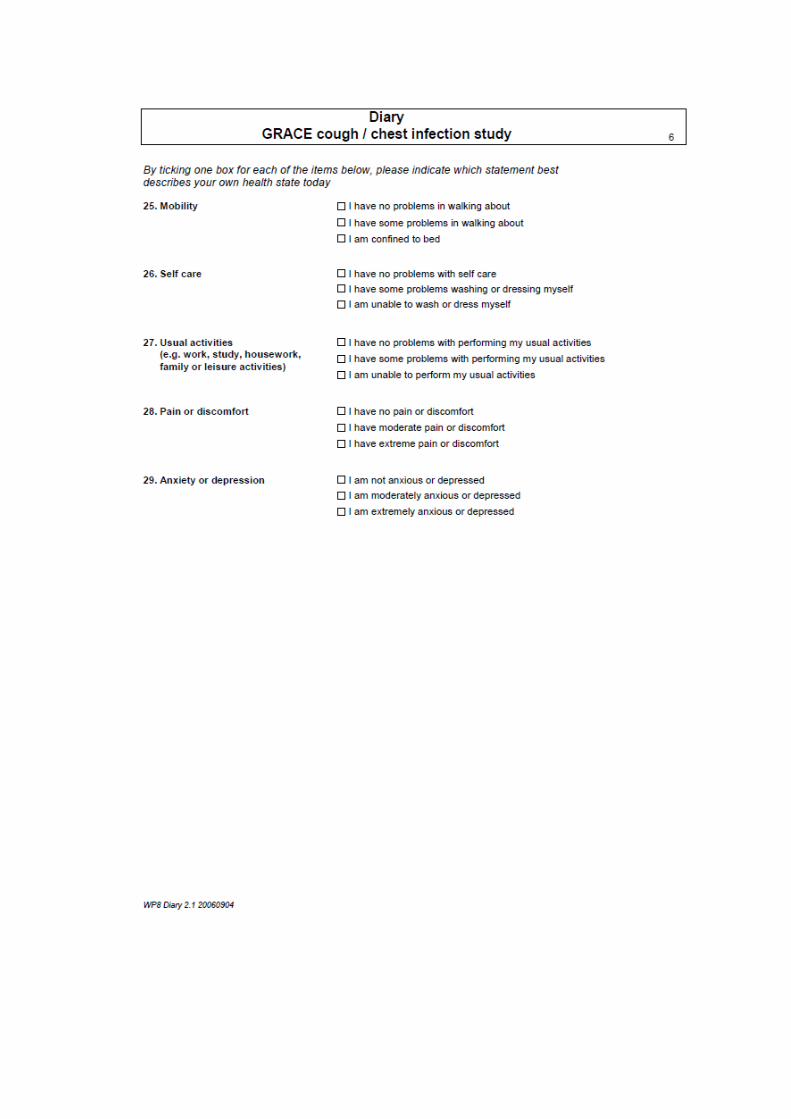
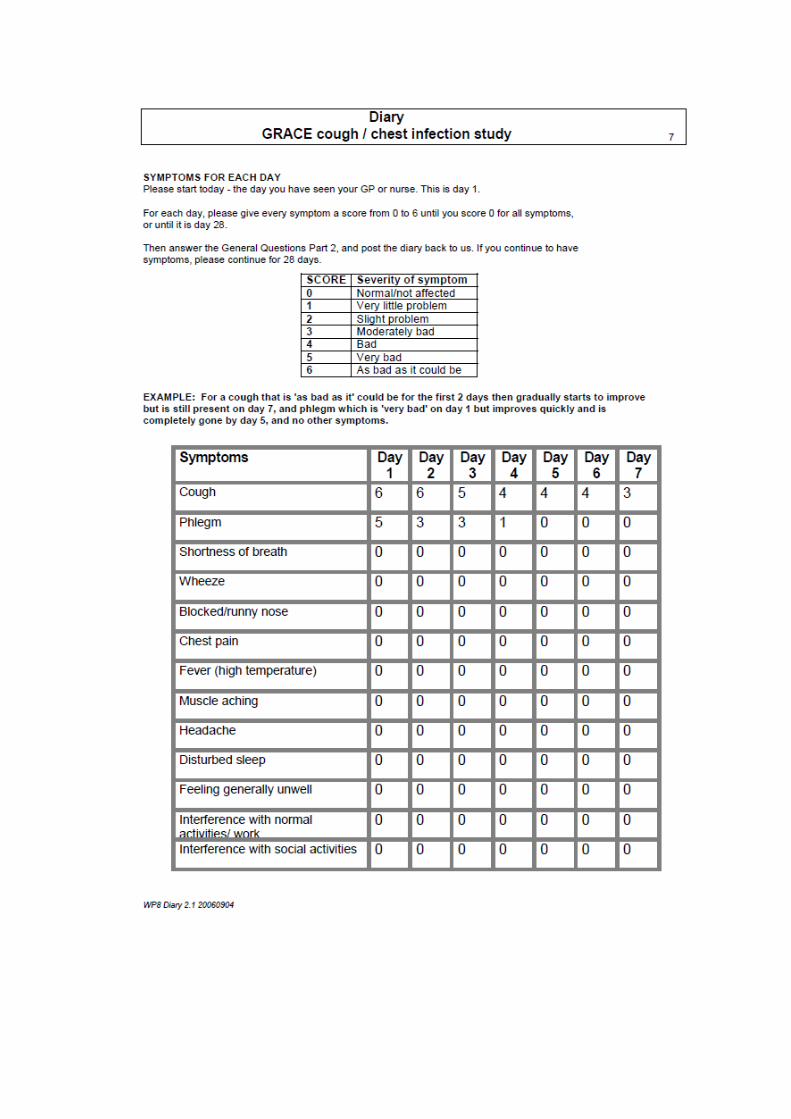
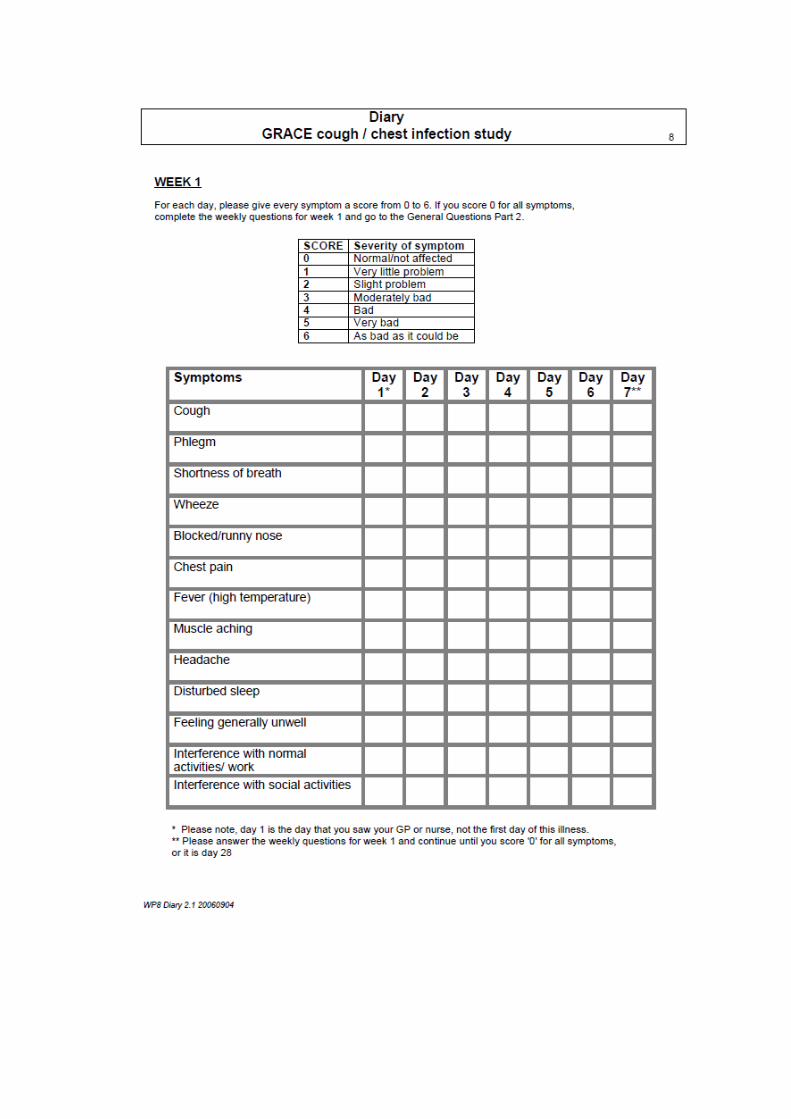

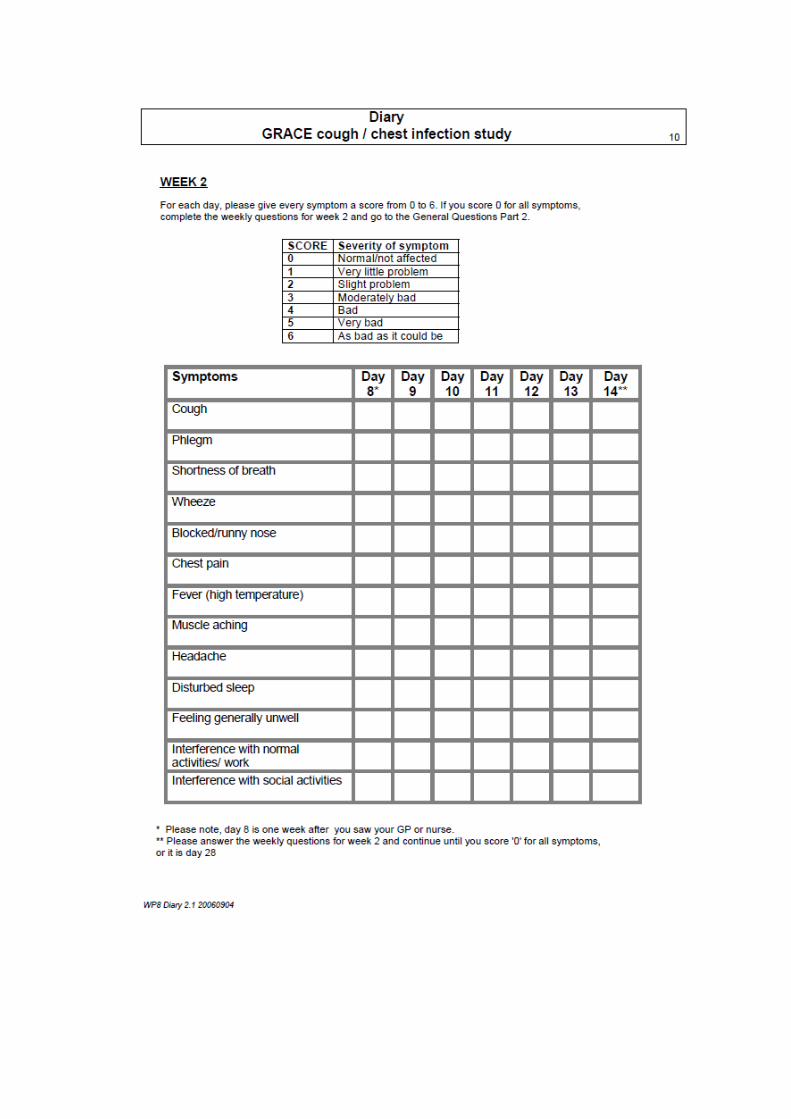

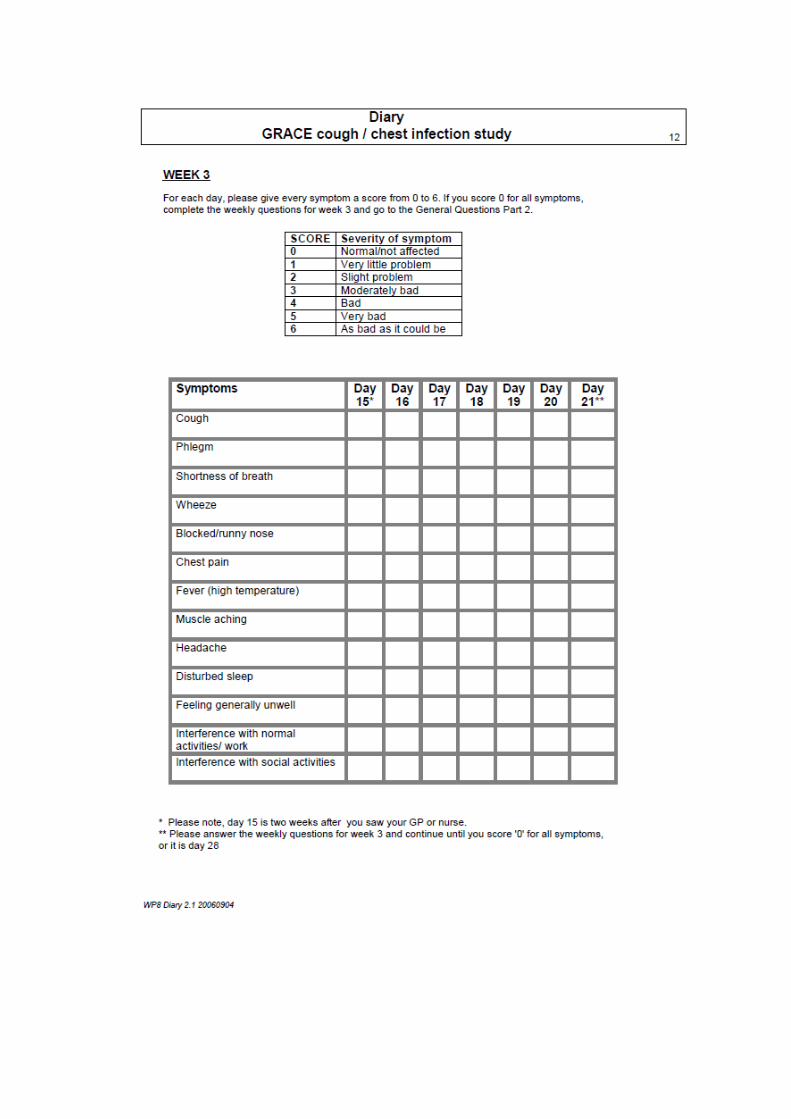
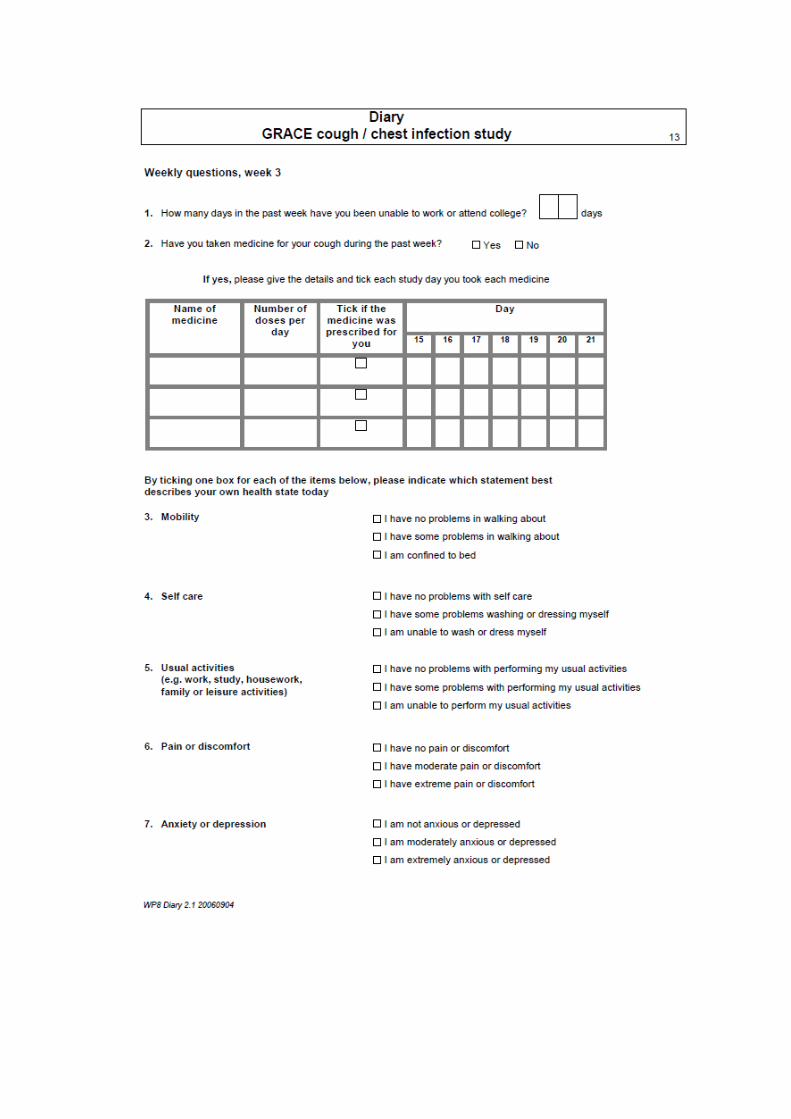
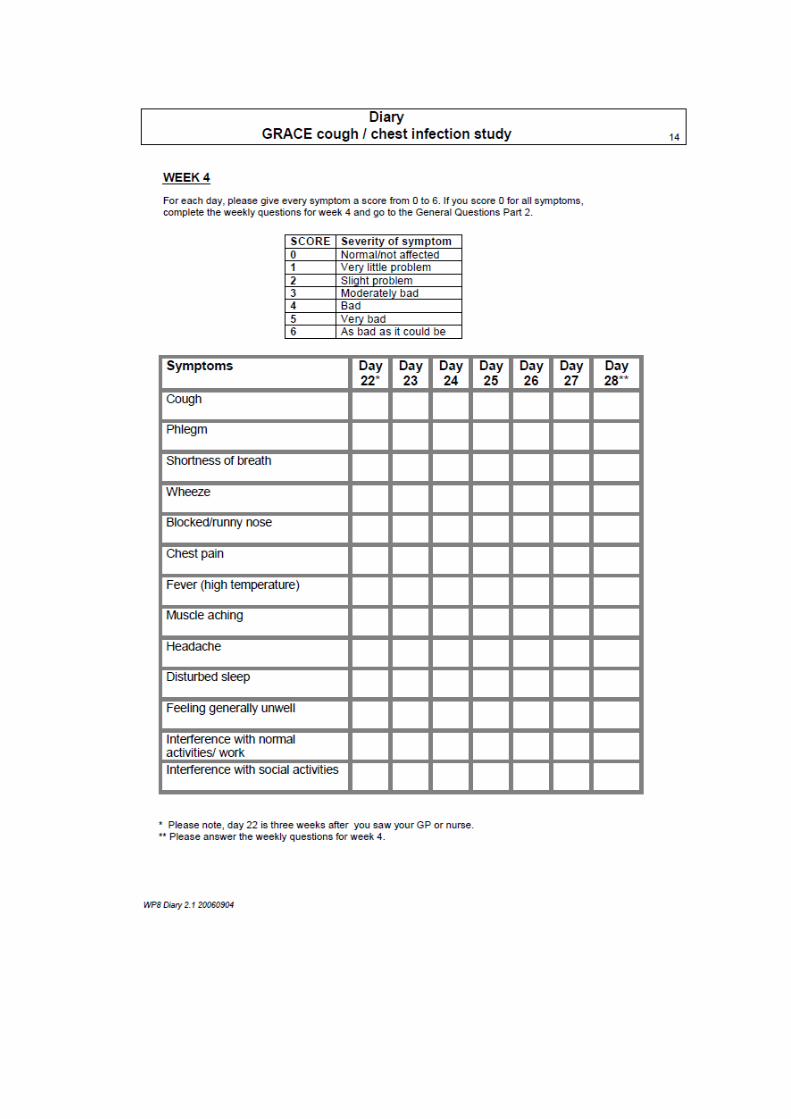
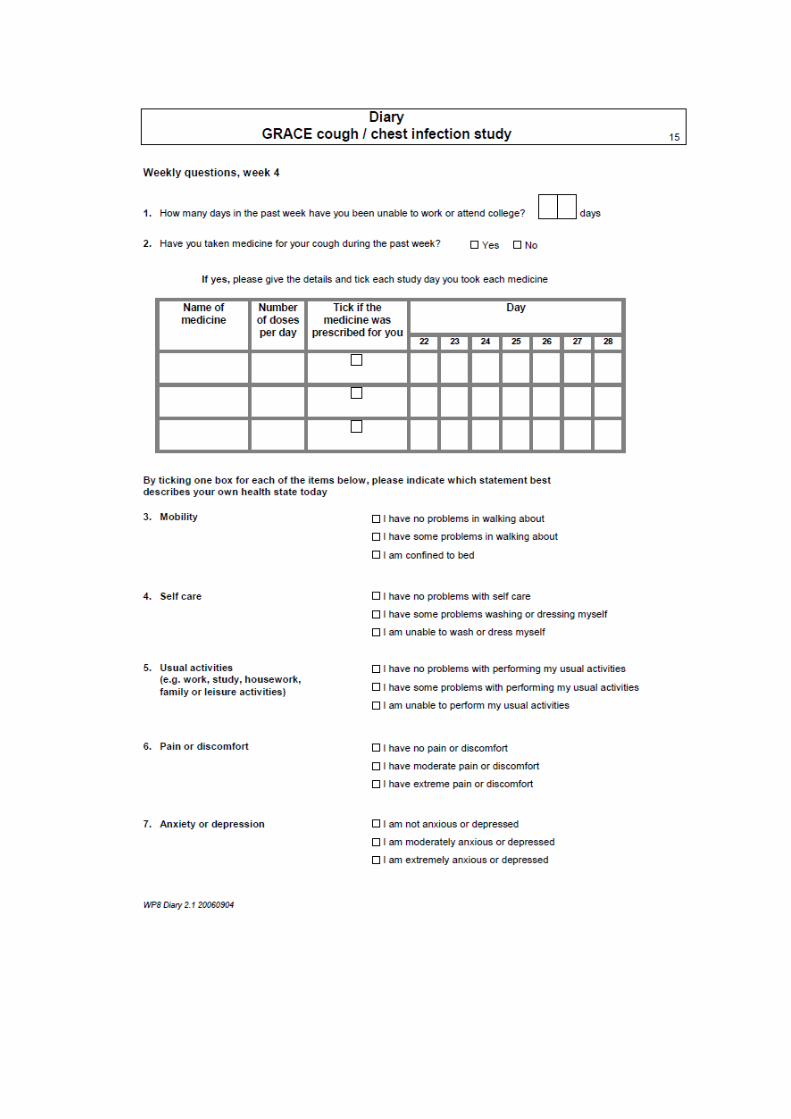
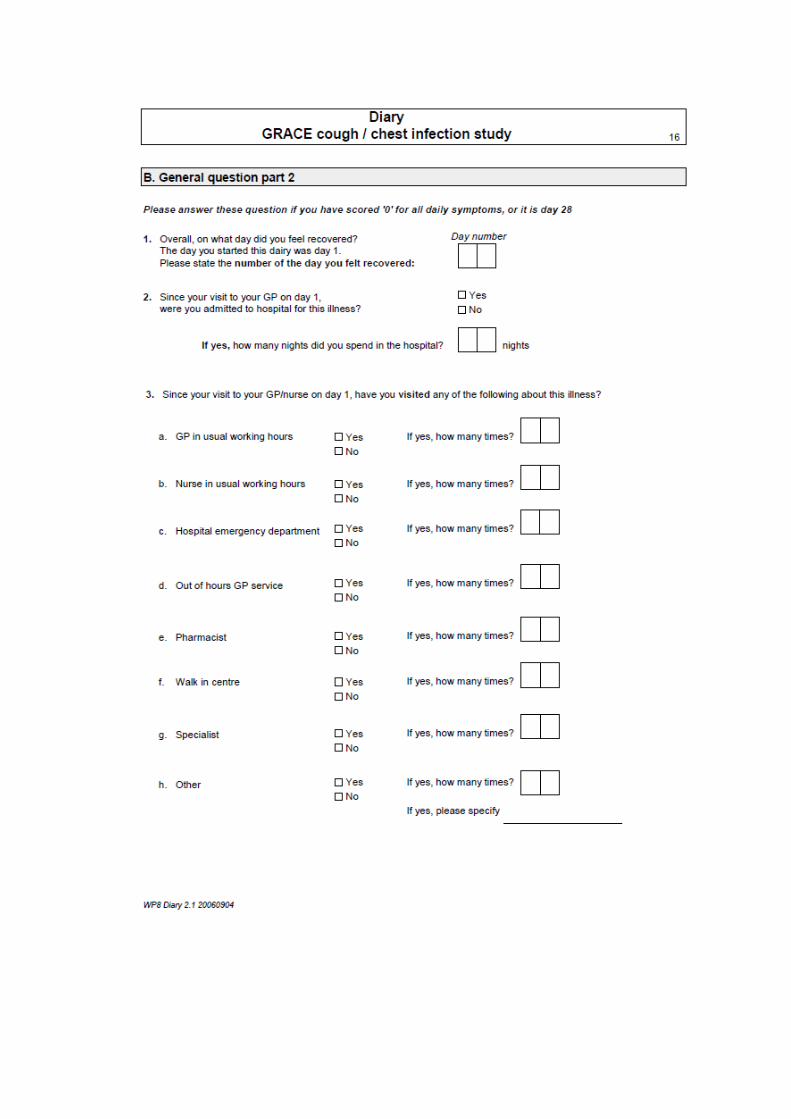
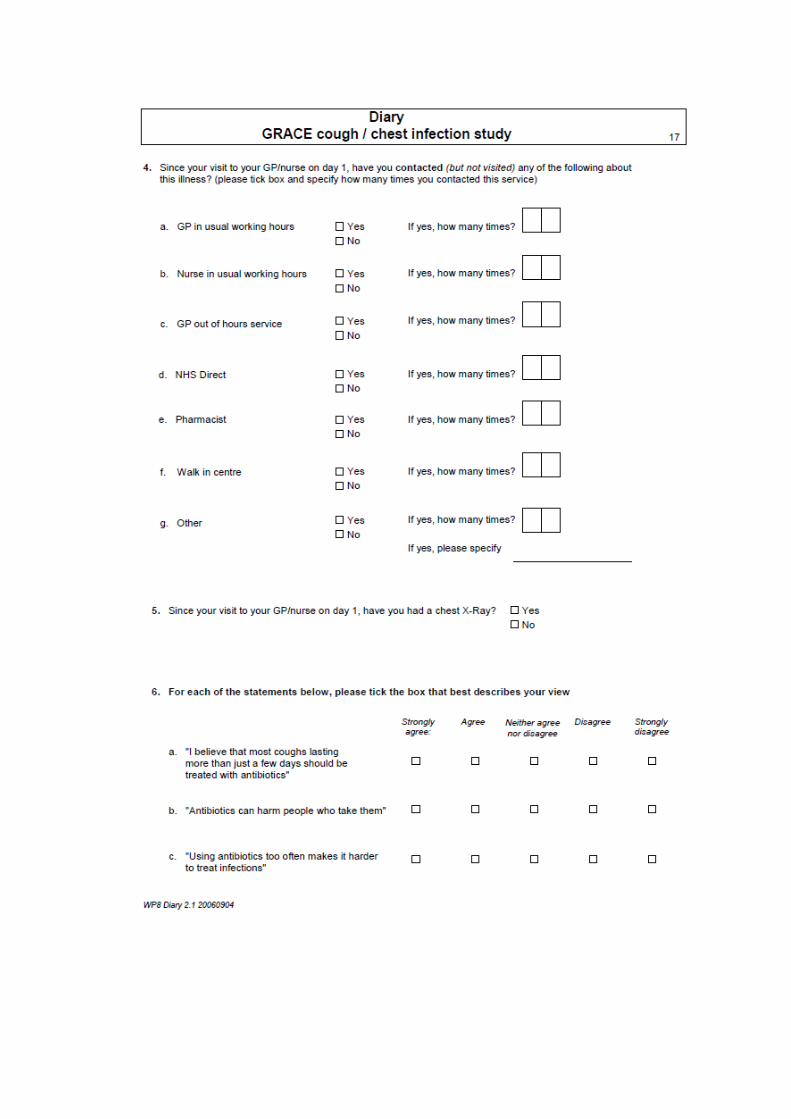
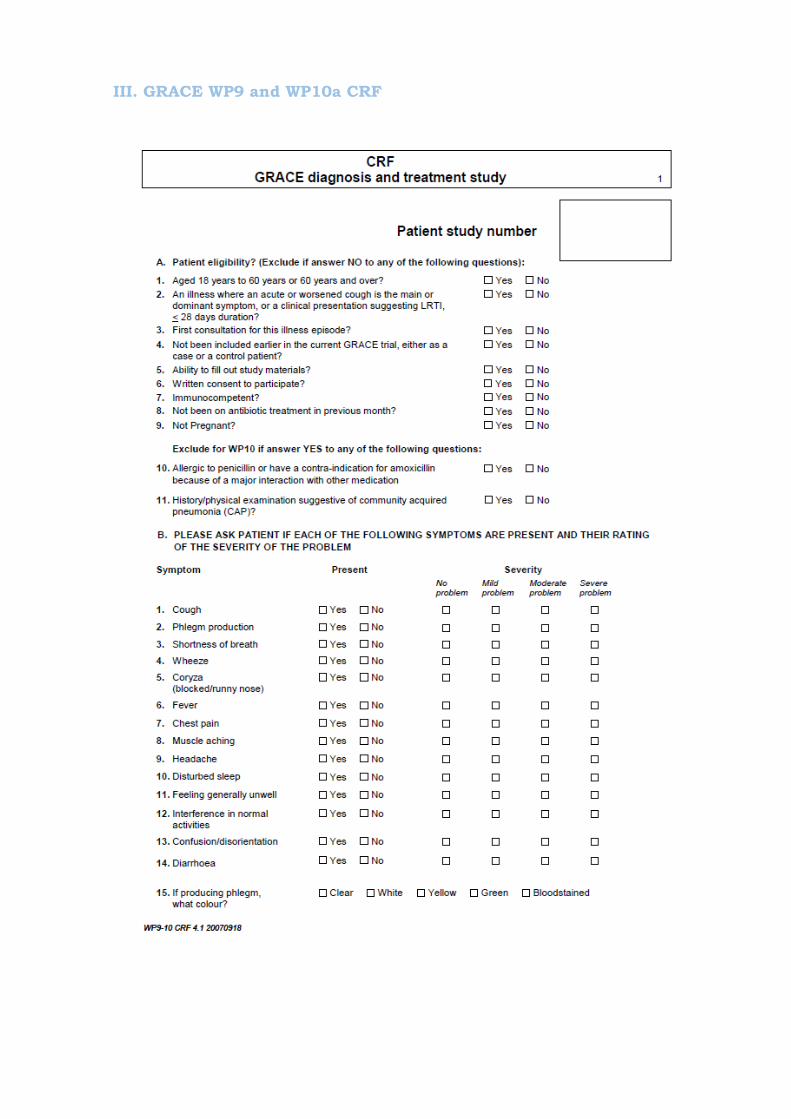
III. GRACE WP9 and WP10a CRF


IV: GRACE WP9 and WP10a Diary
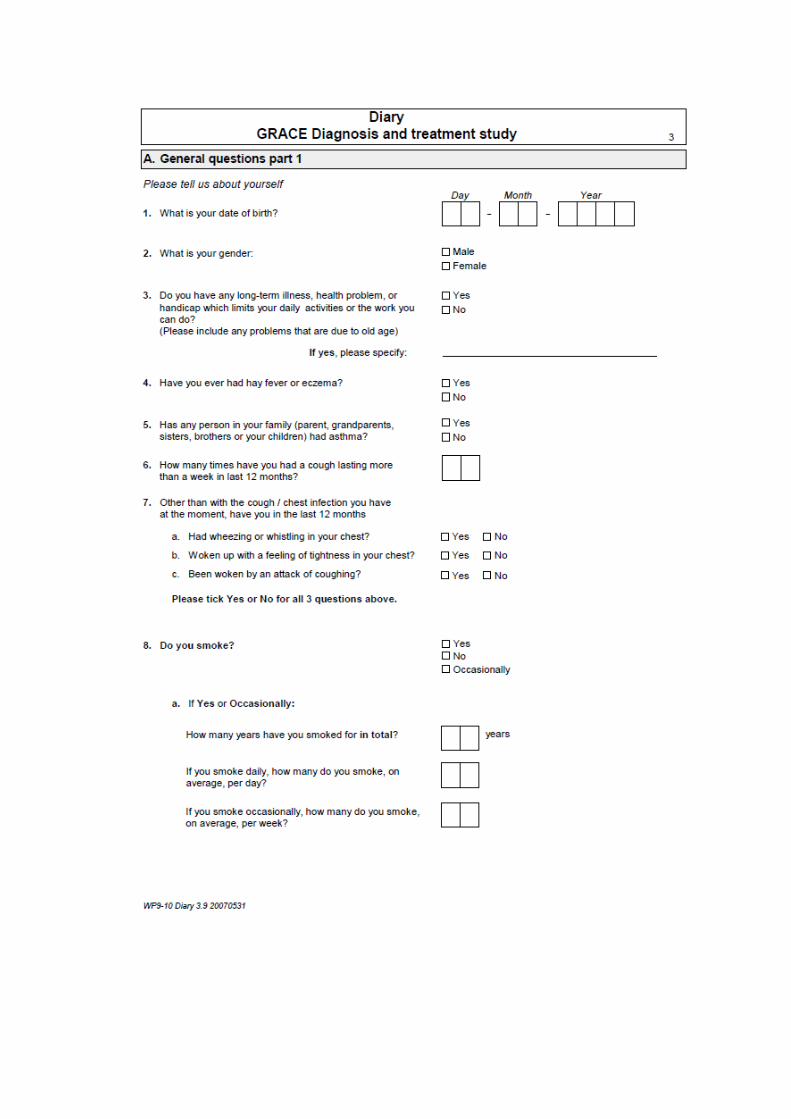
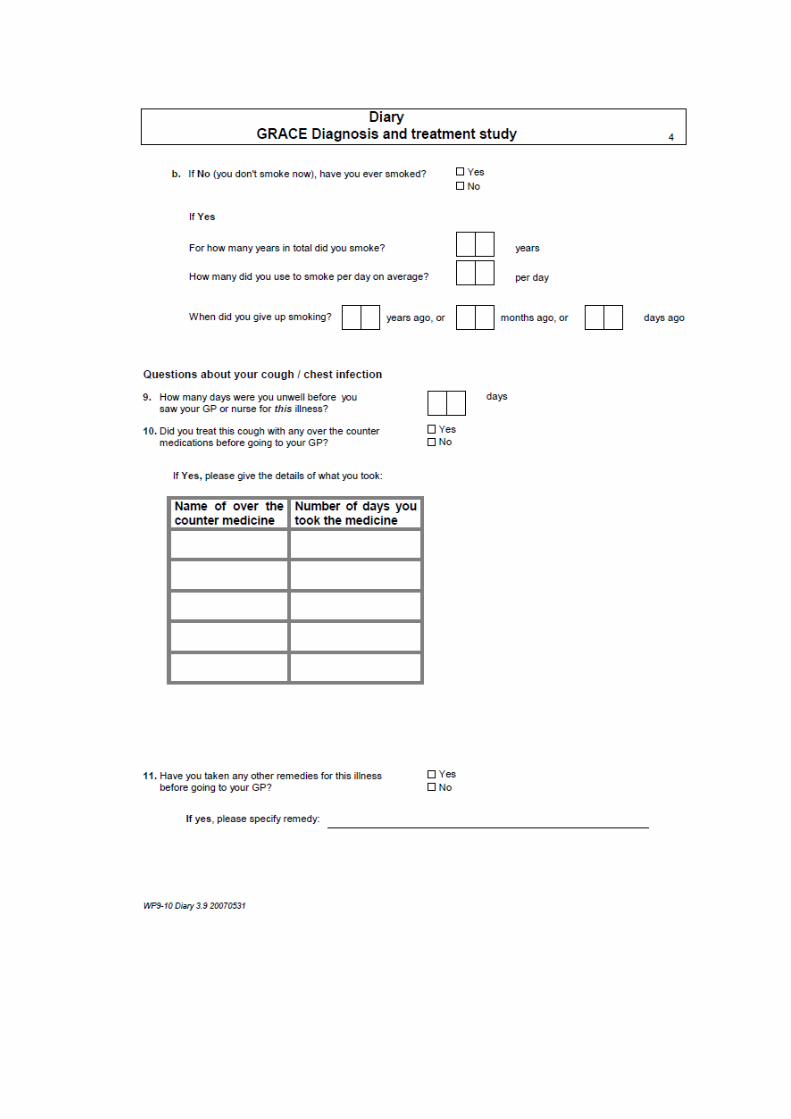
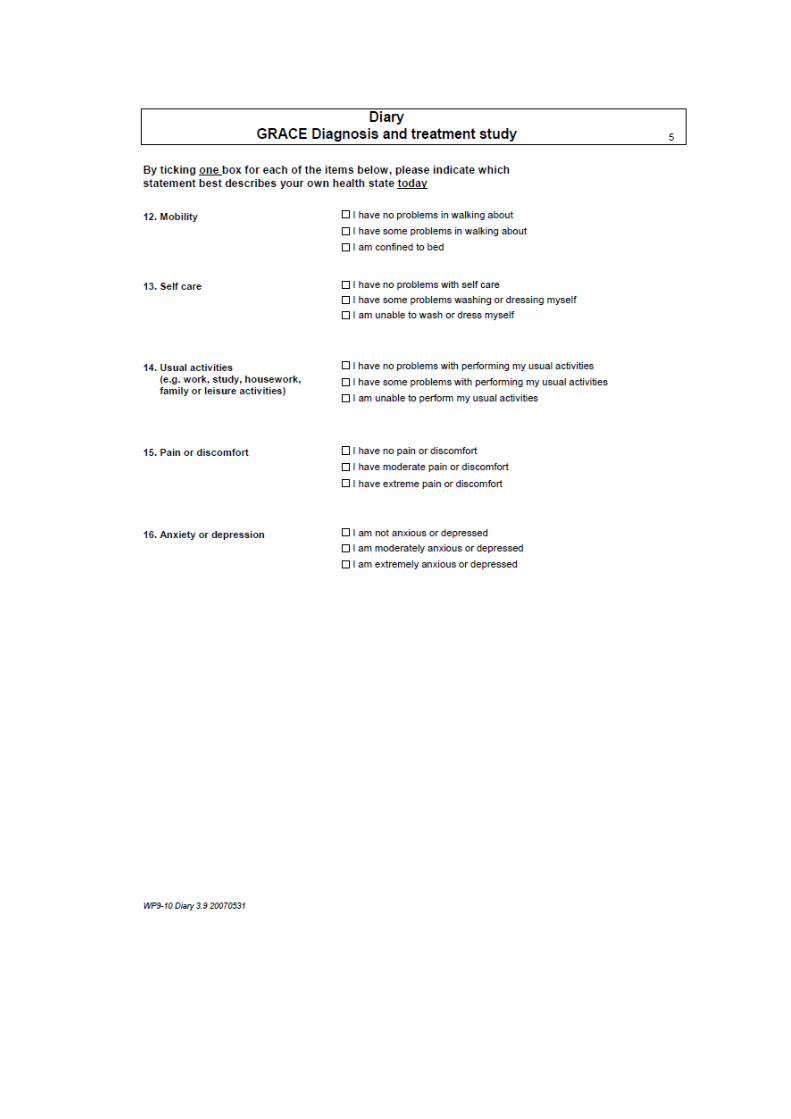
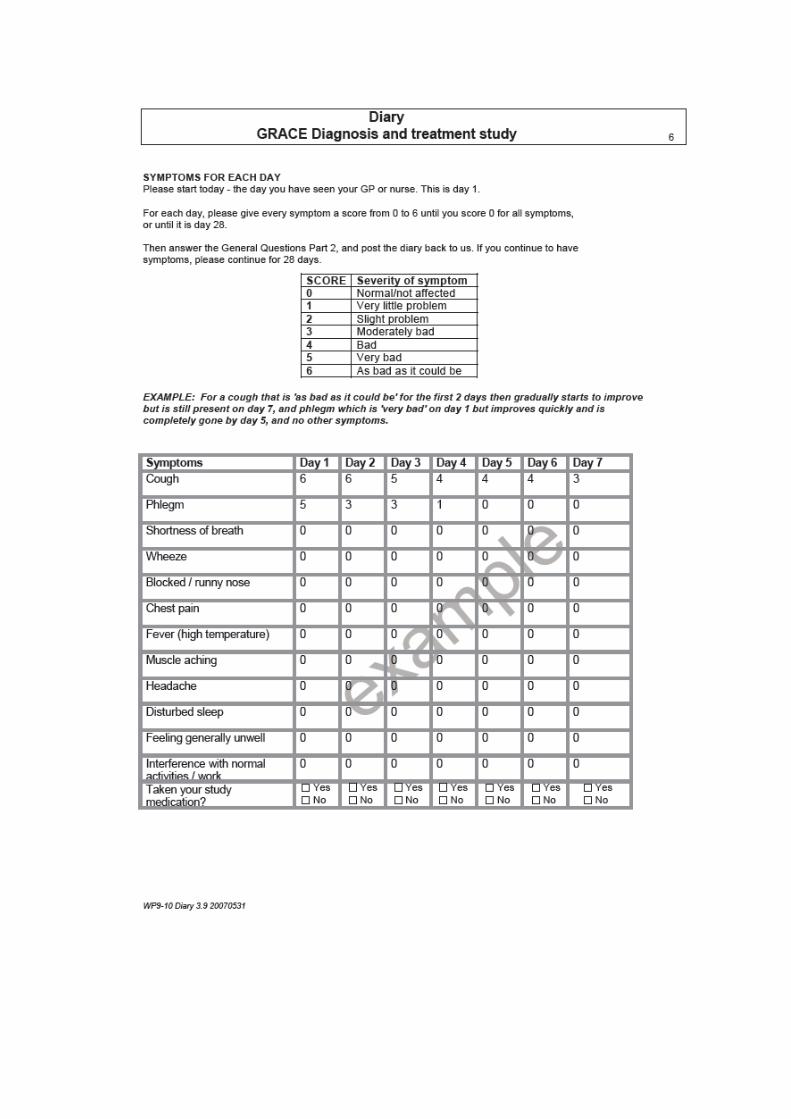
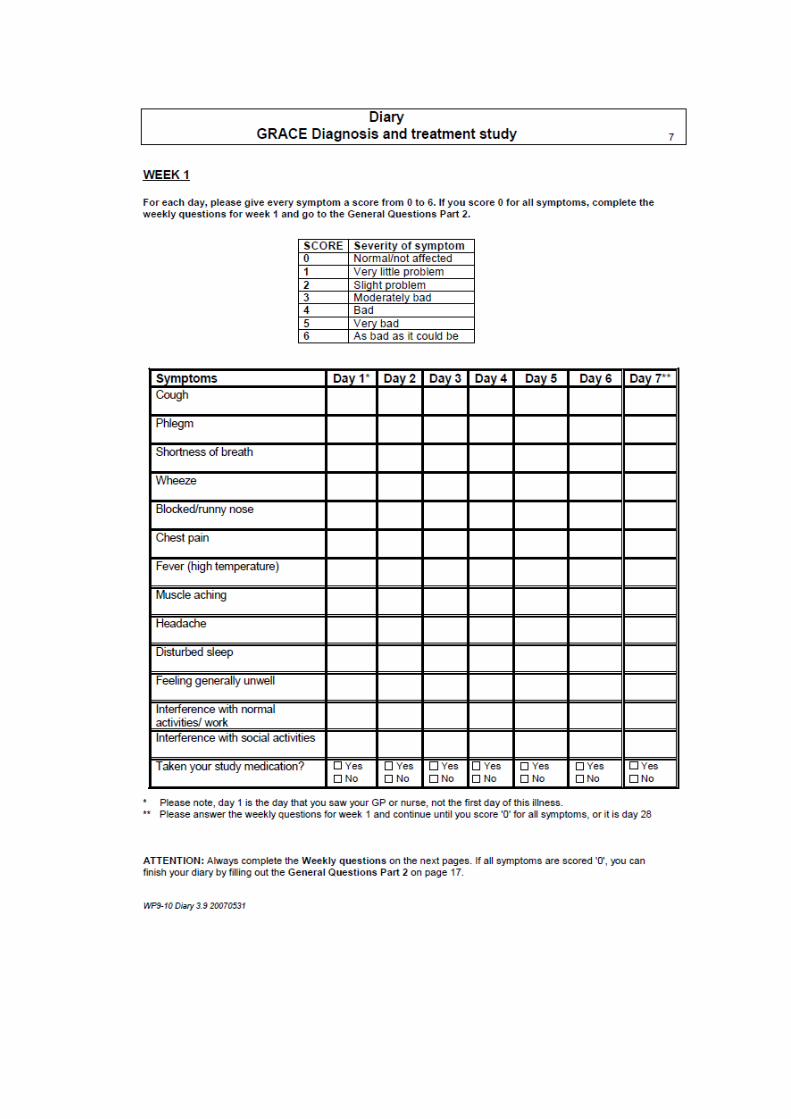
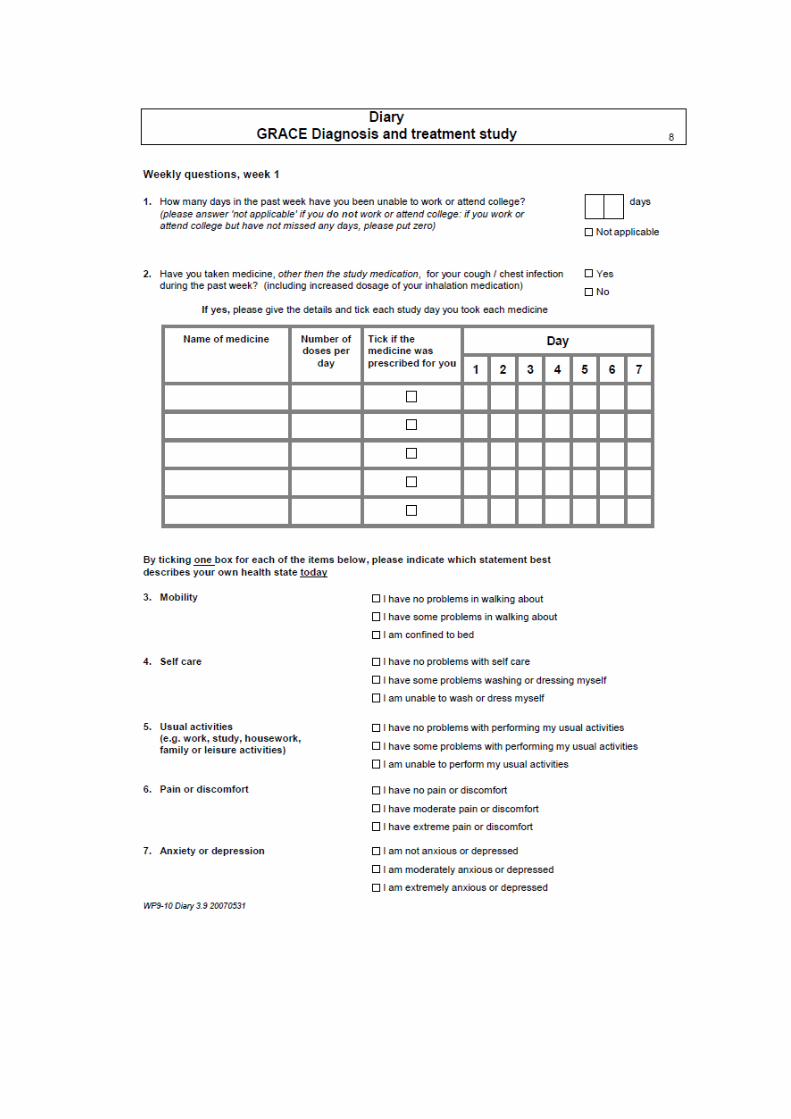
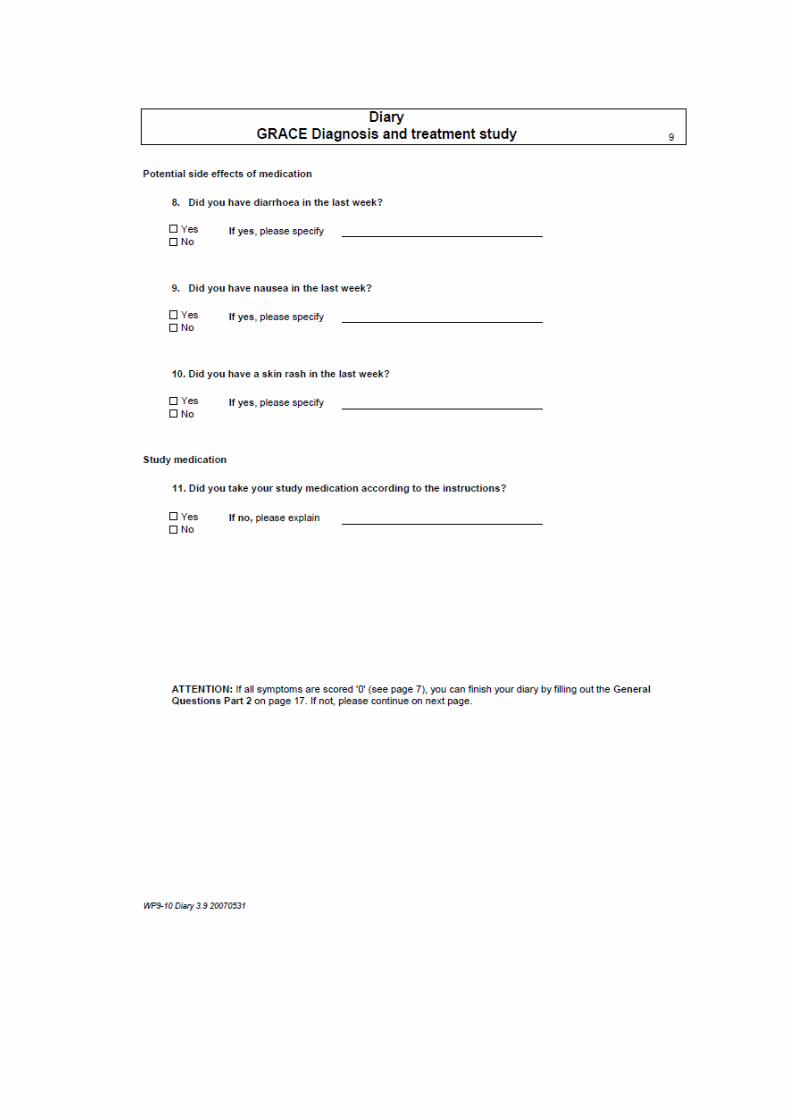
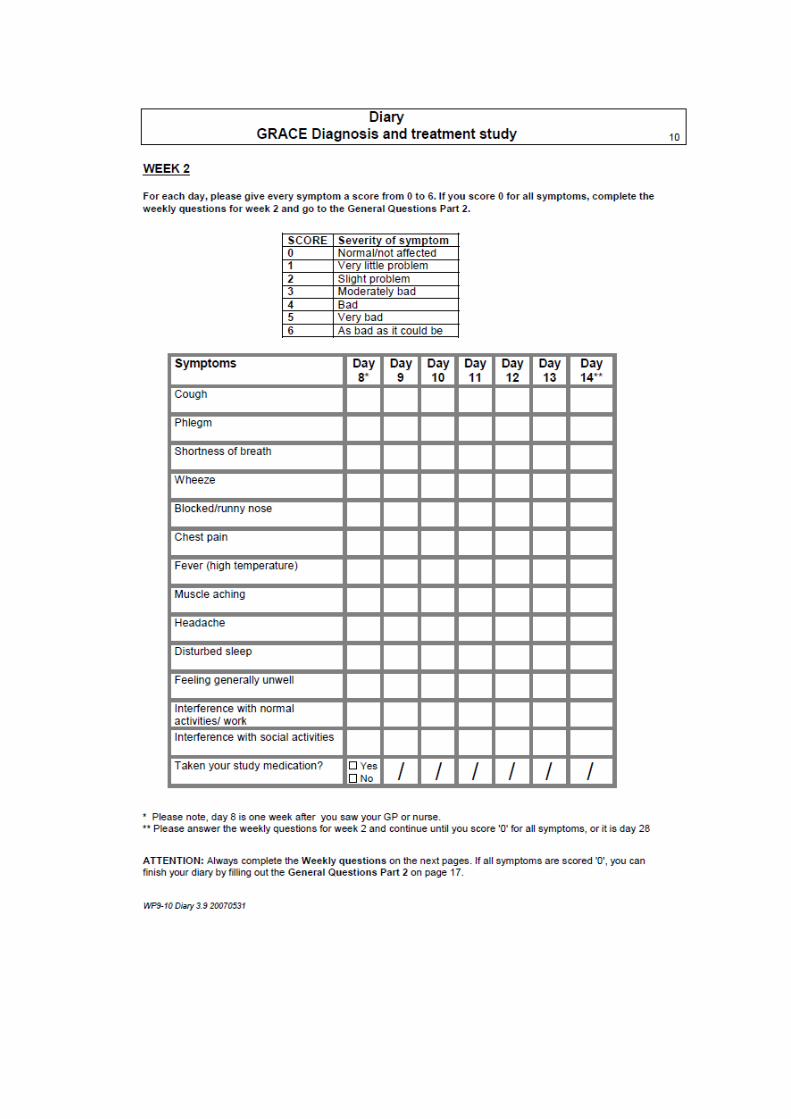
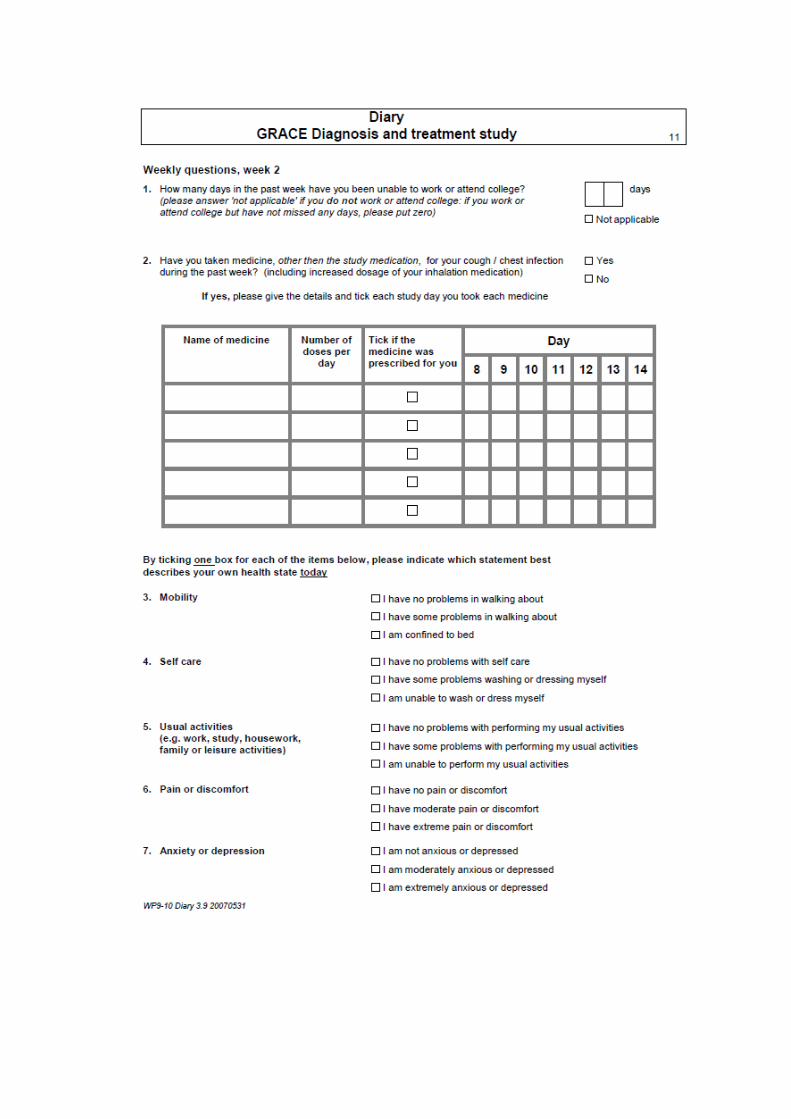
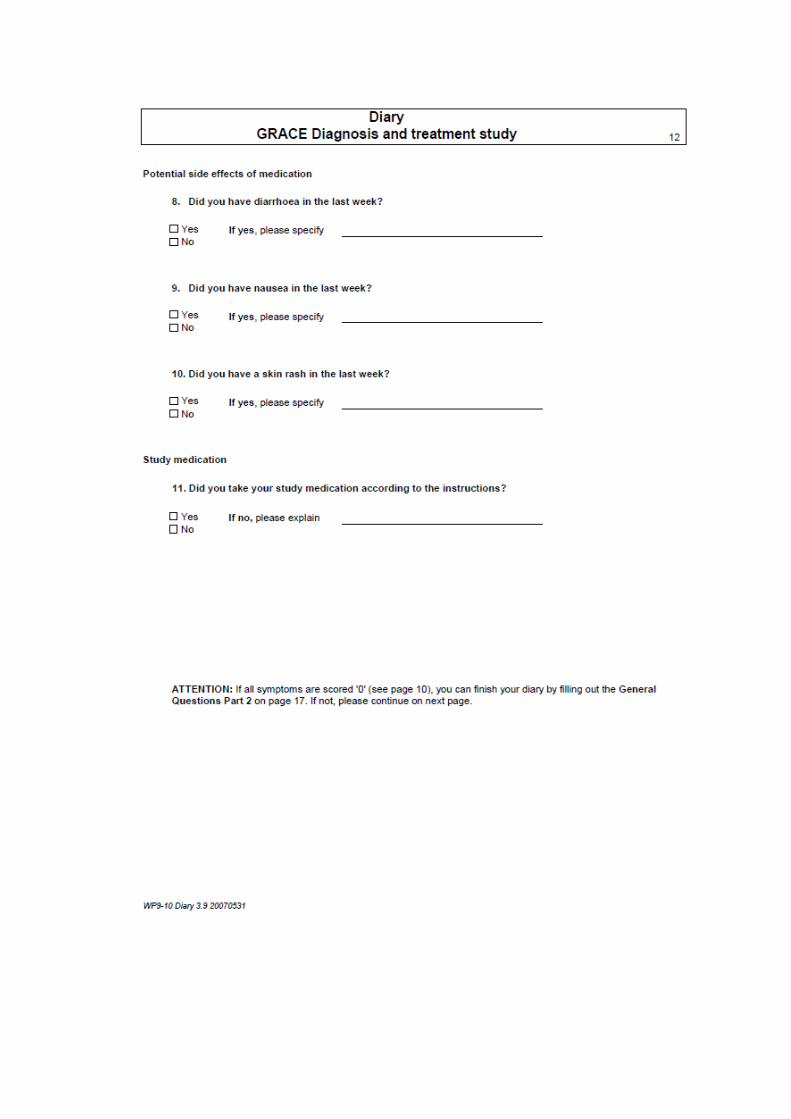
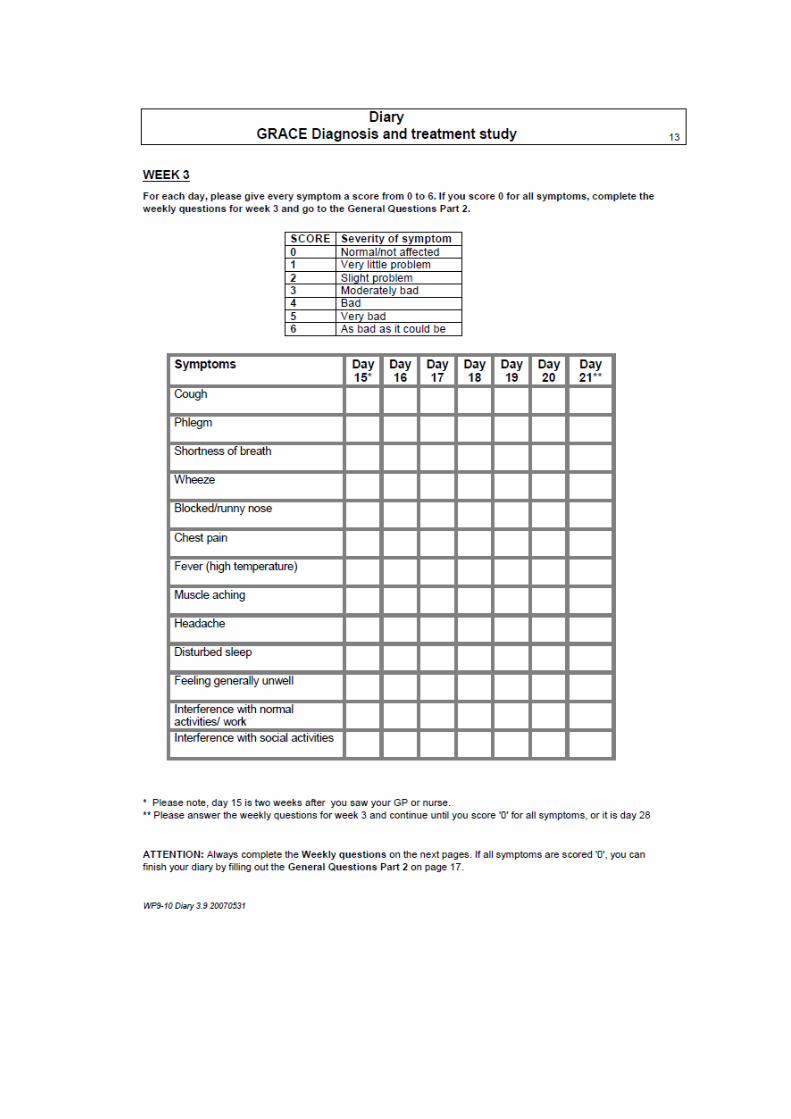
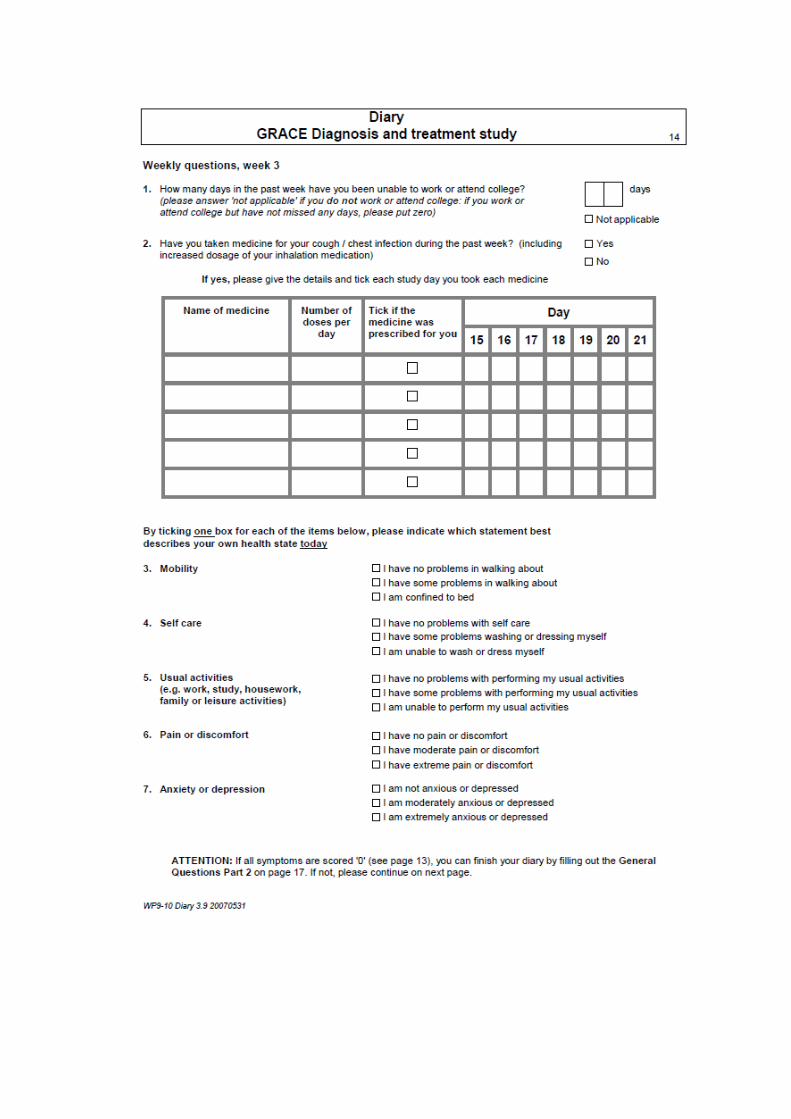
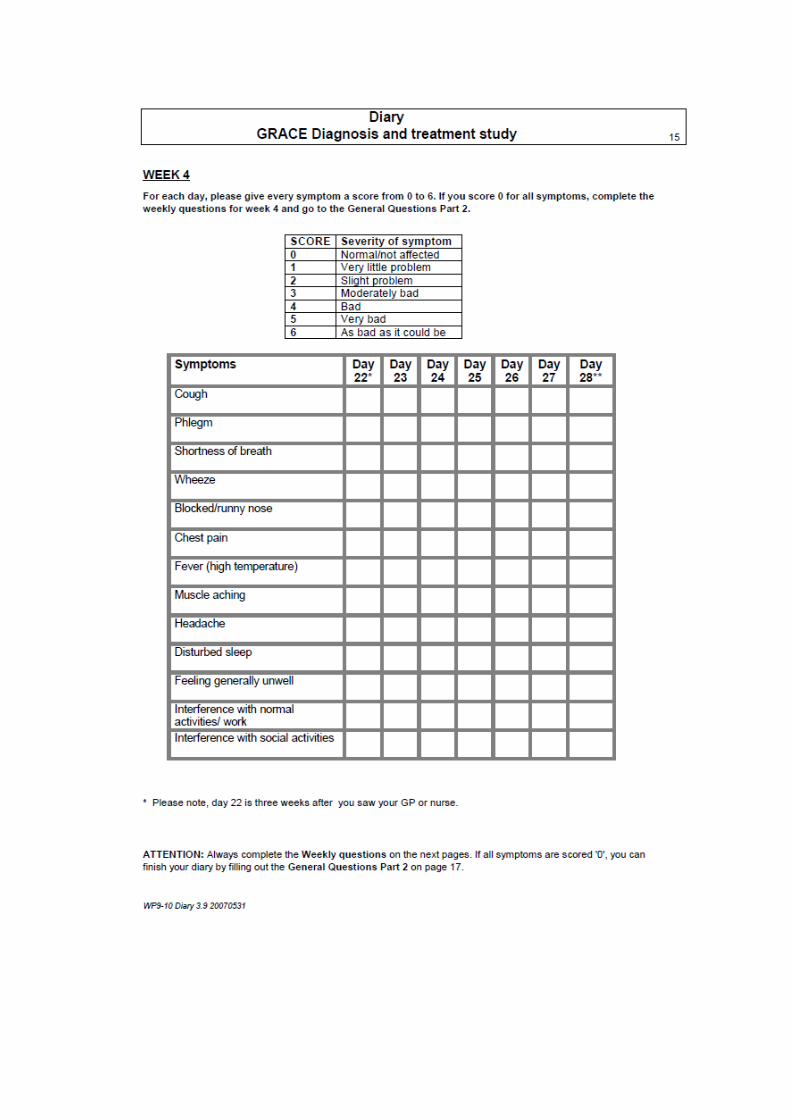
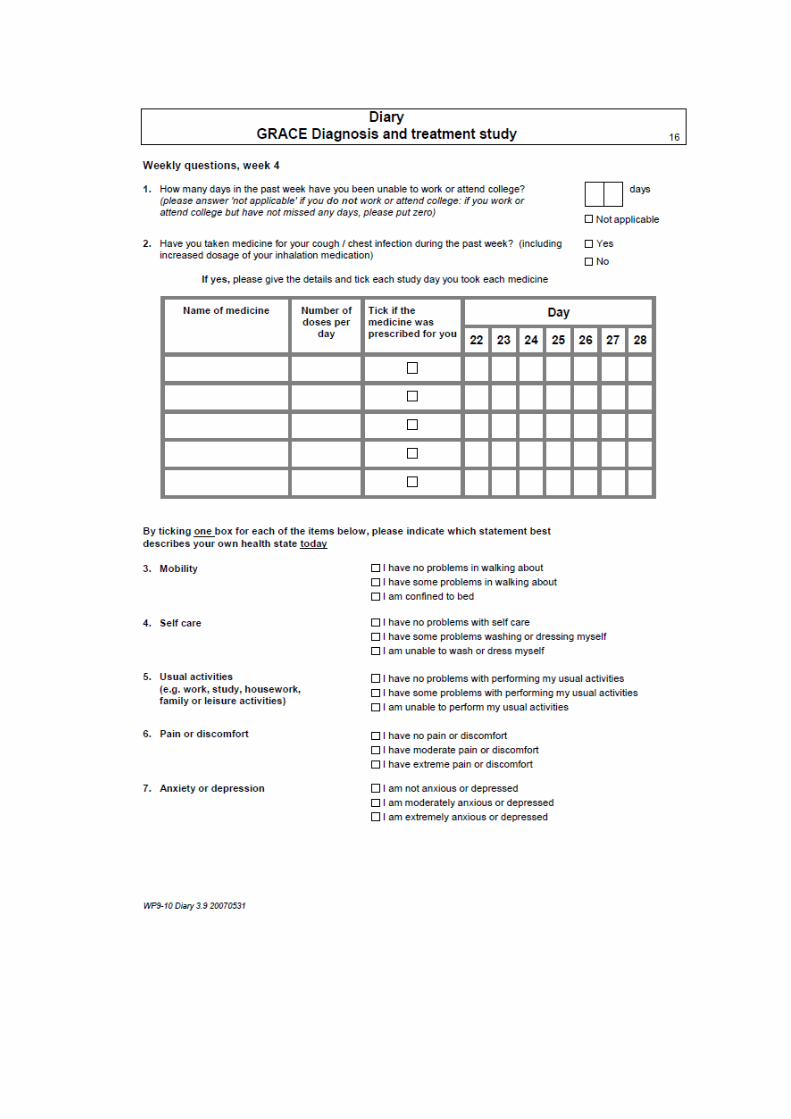

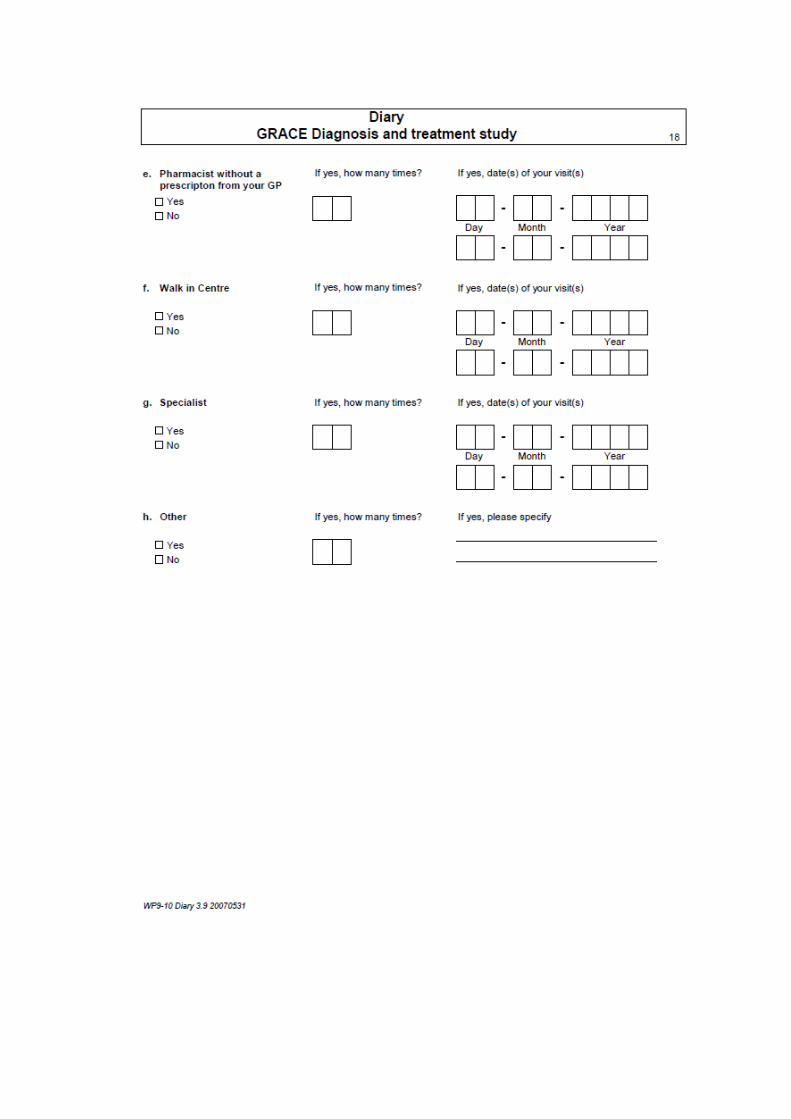
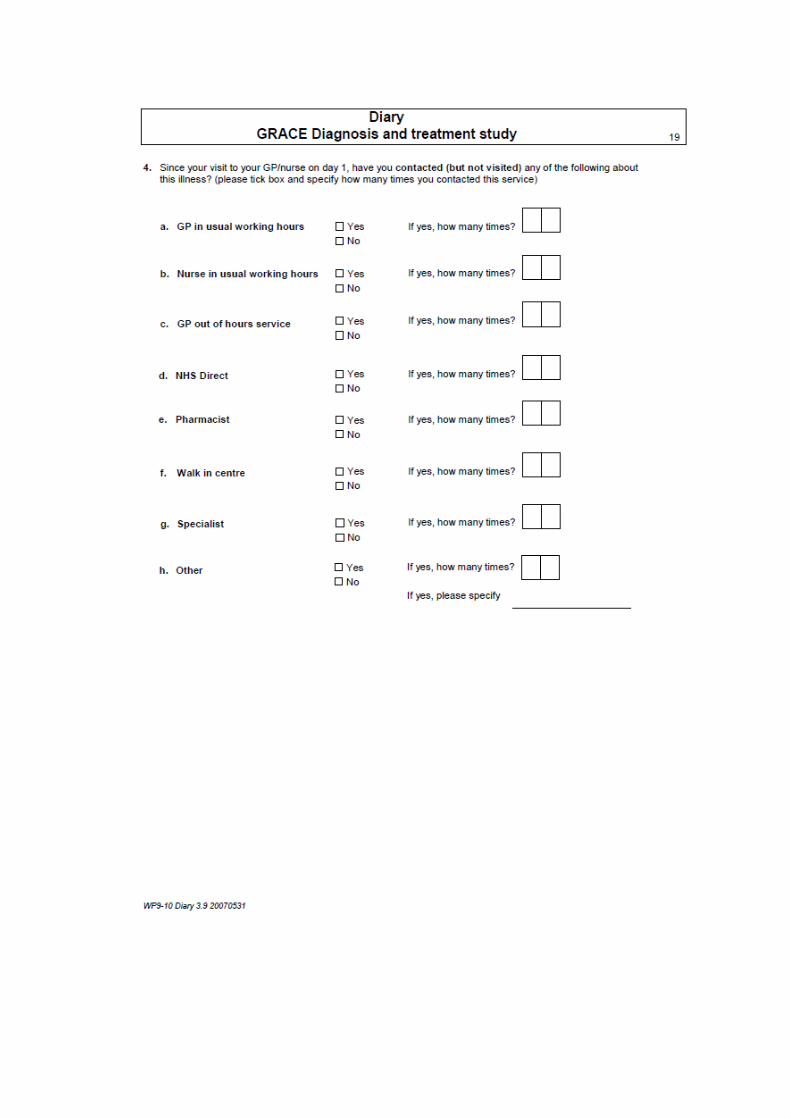

Appendix II – Description of variables collected as part of the
CODA study
CODA Study
Colitis: Once Daily Asacol
A Randomized, Multicentre, Parallel Group Single-
Blind Study to Assess the Efficacy and Safety of
Dosing Mesalazine 800mg Tablets (Asacol®) at 2.4g
Once Daily versus Divided Doses Three Times Daily
for 12 months in the Maintenance of Remission of
Ulcerative Colitis
Case Report Form
CONTENTS Section Page Screening assessment………………………………………………………3 Baseline assessment………………………………………………………..9 Week 6 assessment………………………………………………………..12 3 month telephone contact………………………………………………...15 6 month assessment……………………………………………………….16 9 month telephone contact………………………………………………...19 12 month assessment……………………………………………………...20 Unscheduled assessment…………………………………………….........24 Relapse assessment……………………………………………………….26 End of study……………………………………………………………….29 Concomitant medication…………………………………………………..30 Medication changes……………………………………………………….31 Laboratory results…………………………………………………………32 Adverse events……………………………………………………………33 Serious adverse events……………………………………………………36
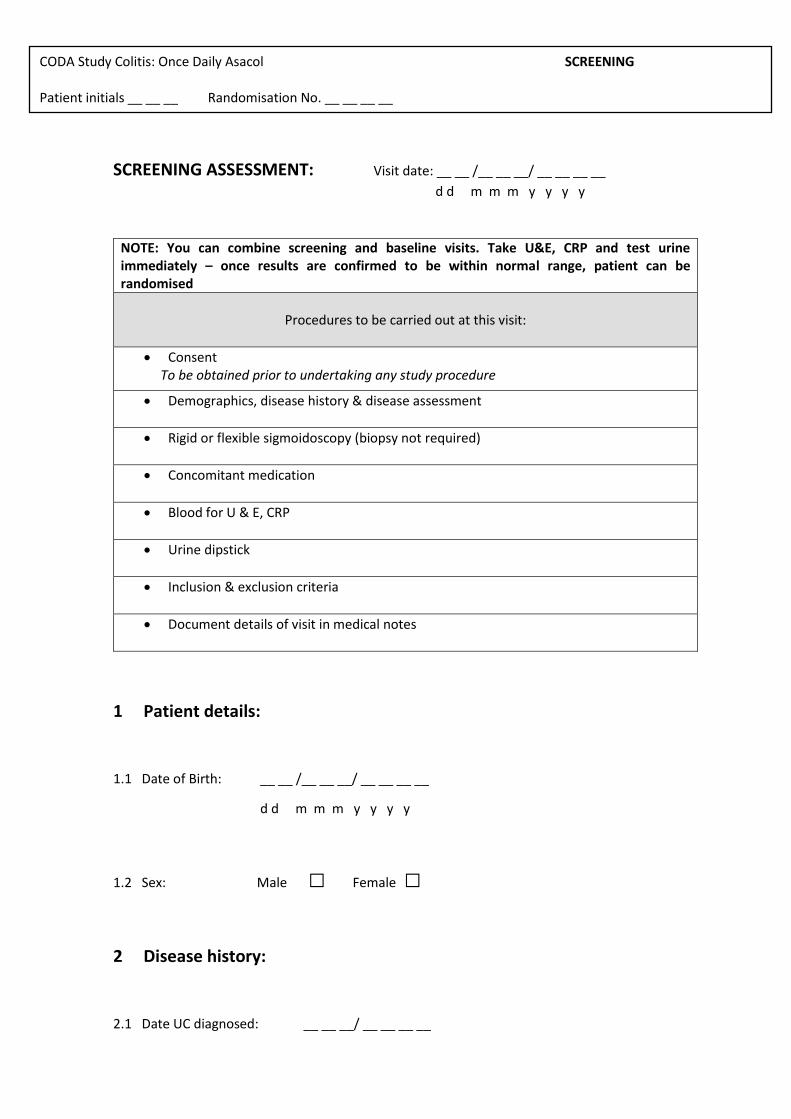
CODA Study Colitis: Once Daily Asacol SCREENING Patient initials __ __ __ Randomisation No. __ __ __ __
SCREENING ASSESSMENT: Visit date: __ __ /__ __ __/ __ __ __ __
d d m m m y y y y
NOTE: You can combine screening and baseline visits. Take U&E, CRP and test urine immediately – once results are confirmed to be within normal range, patient can be randomised
Procedures to be carried out at this visit:
Consent To be obtained prior to undertaking any study procedure
Demographics, disease history & disease assessment
Rigid or flexible sigmoidoscopy (biopsy not required)
Concomitant medication
Blood for U & E, CRP
Urine dipstick
Inclusion & exclusion criteria
Document details of visit in medical notes
1 Patient details:
1.1 Date of Birth: __ __ /__ __ __/ __ __ __ __
d d m m m y y y y
1.2 Sex: Male □ Female □
2 Disease history:
2.1 Date UC diagnosed: __ __ __/ __ __ __ __

CODA Study Colitis: Once Daily Asacol SCREENING Patient initials __ __ __ Randomisation No. __ __ __ __
m m m y y y y
2.2 Maximum Documented Extent of UC:
Extensive □ Left-sided or sigmoid □ Proctitis □
3 Relapse history:
Patient must be in remission, and have had a relapse in the past two years - Relapse definition:
symptoms of colitis requiring treatment
3.1 When did the patient finish treatment for the last episode of active colitis?
__ __ /__ __ __/ __ __ __ __
d d m m m y y y y
3.2 How many relapses has the patient had in the past two years? ___ ___
4 Which 5-ASA containing drug is currently being used:
This will be stopped when trial medication is started
Drug name Dose Frequency Route Date
started
(year only)
5 Other Current Drug Therapy for Ulcerative Colitis:
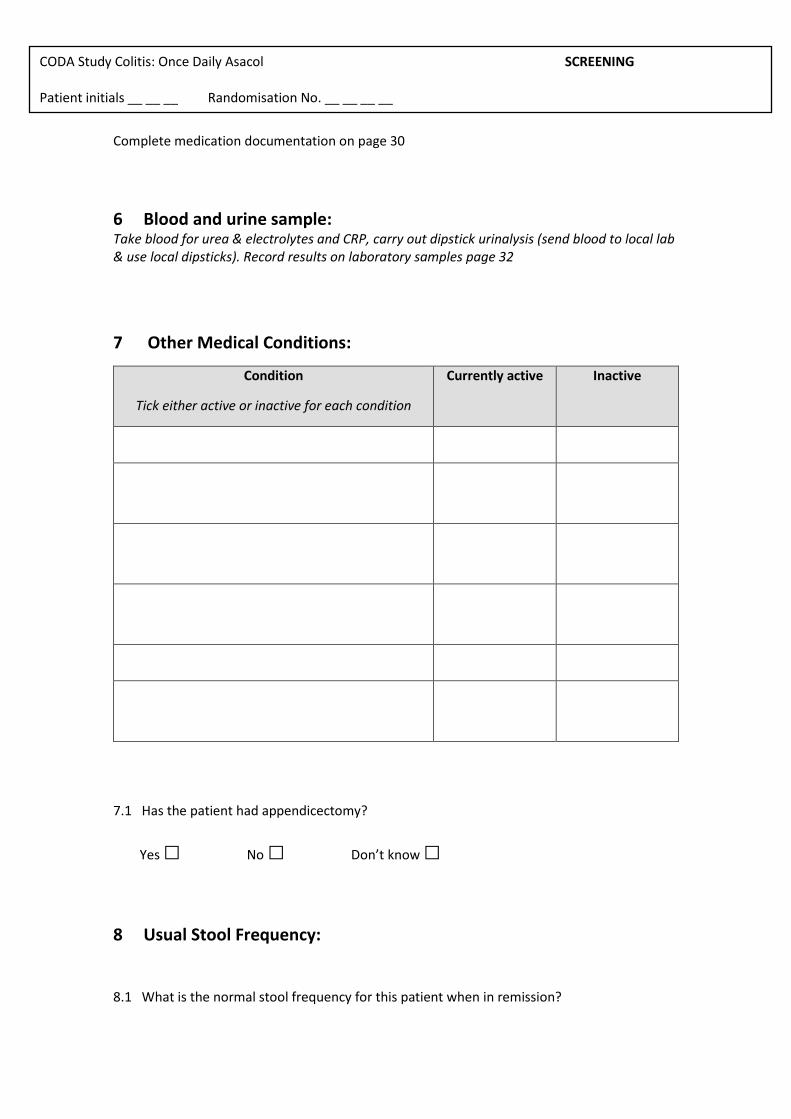
CODA Study Colitis: Once Daily Asacol SCREENING Patient initials __ __ __ Randomisation No. __ __ __ __
Complete medication documentation on page 30
6 Blood and urine sample: Take blood for urea & electrolytes and CRP, carry out dipstick urinalysis (send blood to local lab & use local dipsticks). Record results on laboratory samples page 32
7 Other Medical Conditions:
Condition
Tick either active or inactive for each condition
Currently active Inactive
7.1 Has the patient had appendicectomy?
Yes □ No □ Don’t know □
8 Usual Stool Frequency:
8.1 What is the normal stool frequency for this patient when in remission?
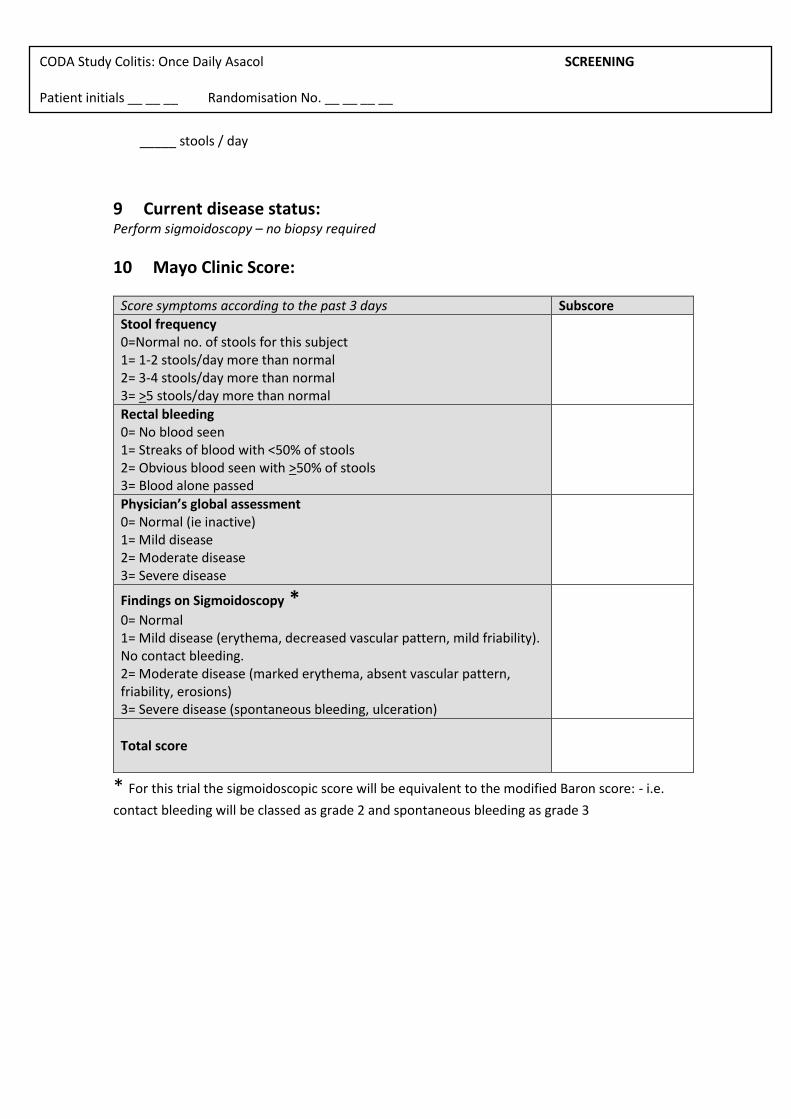
CODA Study Colitis: Once Daily Asacol SCREENING Patient initials __ __ __ Randomisation No. __ __ __ __
_____ stools / day
9 Current disease status: Perform sigmoidoscopy – no biopsy required
10 Mayo Clinic Score:
Score symptoms according to the past 3 days Subscore
Stool frequency 0=Normal no. of stools for this subject 1= 1-2 stools/day more than normal 2= 3-4 stools/day more than normal 3= >5 stools/day more than normal
Rectal bleeding 0= No blood seen 1= Streaks of blood with <50% of stools 2= Obvious blood seen with >50% of stools 3= Blood alone passed
Physician’s global assessment 0= Normal (ie inactive) 1= Mild disease 2= Moderate disease 3= Severe disease
Findings on Sigmoidoscopy *
0= Normal 1= Mild disease (erythema, decreased vascular pattern, mild friability). No contact bleeding. 2= Moderate disease (marked erythema, absent vascular pattern, friability, erosions) 3= Severe disease (spontaneous bleeding, ulceration)
Total score
* For this trial the sigmoidoscopic score will be equivalent to the modified Baron score: - i.e.
contact bleeding will be classed as grade 2 and spontaneous bleeding as grade 3
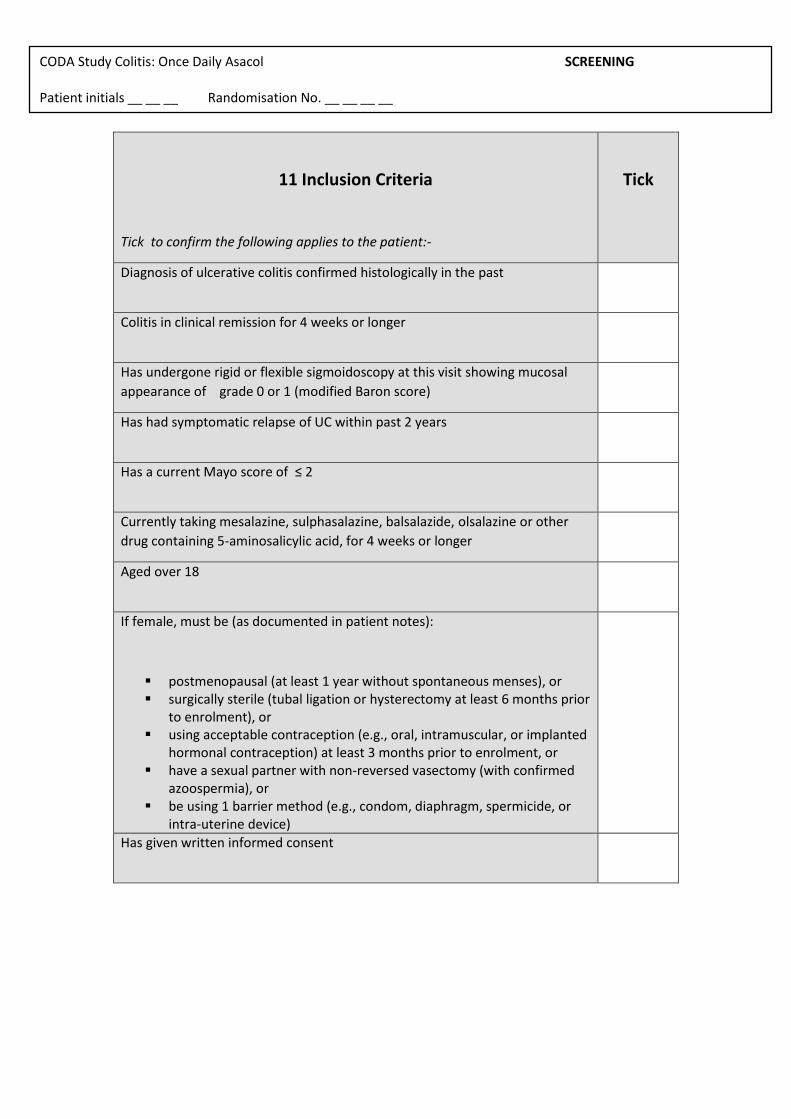
CODA Study Colitis: Once Daily Asacol SCREENING Patient initials __ __ __ Randomisation No. __ __ __ __
11 Inclusion Criteria
Tick to confirm the following applies to the patient:-
Tick
Diagnosis of ulcerative colitis confirmed histologically in the past Colitis in clinical remission for 4 weeks or longer Has undergone rigid or flexible sigmoidoscopy at this visit showing mucosal
appearance of grade 0 or 1 (modified Baron score) Has had symptomatic relapse of UC within past 2 years Has a current Mayo score of ≤ 2 Currently taking mesalazine, sulphasalazine, balsalazide, olsalazine or other
drug containing 5-aminosalicylic acid, for 4 weeks or longer Aged over 18 If female, must be (as documented in patient notes):
postmenopausal (at least 1 year without spontaneous menses), or surgically sterile (tubal ligation or hysterectomy at least 6 months prior
to enrolment), or using acceptable contraception (e.g., oral, intramuscular, or implanted
hormonal contraception) at least 3 months prior to enrolment, or have a sexual partner with non-reversed vasectomy (with confirmed
azoospermia), or be using 1 barrier method (e.g., condom, diaphragm, spermicide, or
intra-uterine device)
Has given written informed consent
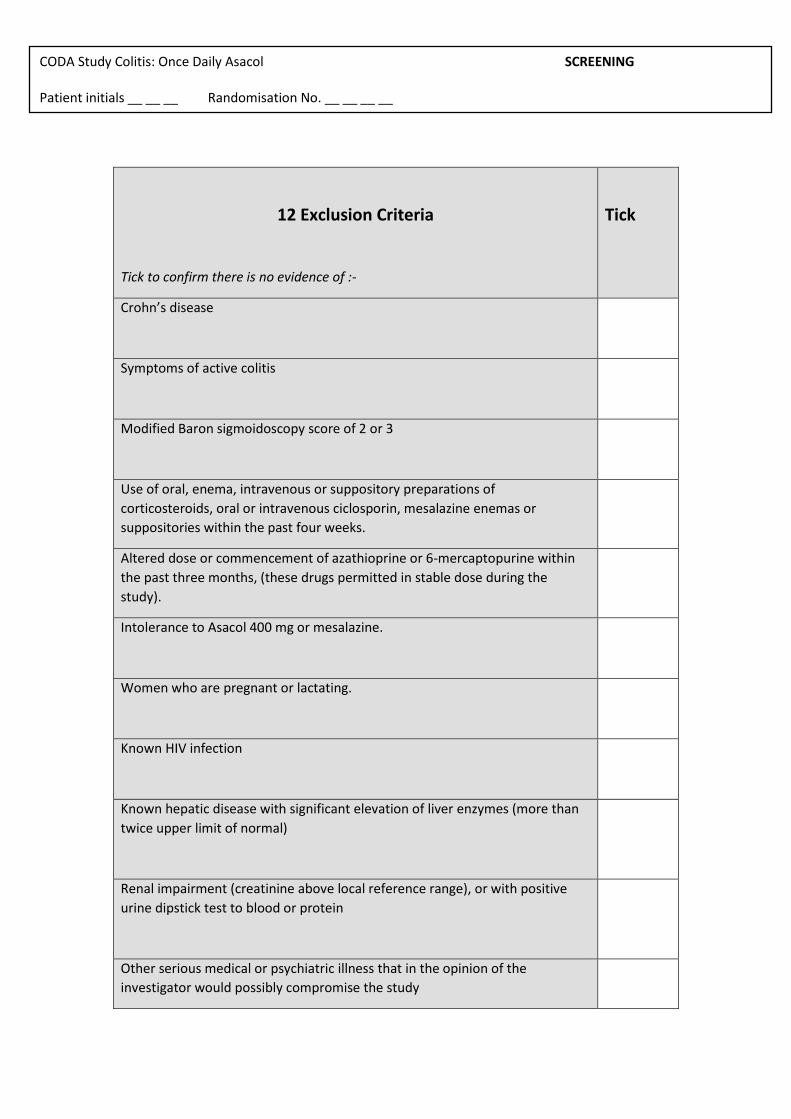
CODA Study Colitis: Once Daily Asacol SCREENING Patient initials __ __ __ Randomisation No. __ __ __ __
12 Exclusion Criteria
Tick to confirm there is no evidence of :-
Tick
Crohn’s disease
Symptoms of active colitis
Modified Baron sigmoidoscopy score of 2 or 3
Use of oral, enema, intravenous or suppository preparations of
corticosteroids, oral or intravenous ciclosporin, mesalazine enemas or
suppositories within the past four weeks.
Altered dose or commencement of azathioprine or 6-mercaptopurine within
the past three months, (these drugs permitted in stable dose during the
study).
Intolerance to Asacol 400 mg or mesalazine.
Women who are pregnant or lactating.
Known HIV infection
Known hepatic disease with significant elevation of liver enzymes (more than
twice upper limit of normal)
Renal impairment (creatinine above local reference range), or with positive
urine dipstick test to blood or protein
Other serious medical or psychiatric illness that in the opinion of the
investigator would possibly compromise the study

CODA Study Colitis: Once Daily Asacol SCREENING Patient initials __ __ __ Randomisation No. __ __ __ __
Problem alcohol excess or drug abuse that in the opinion of the investigator
would possibly compromise the study
This patients fits the study criteria and is suitable for inclusion Yes □ No □
If no, please retain screening documents
Signature: _____________________________ Date __ __ /__ __ __/ __ __ __ __
d d m m m y y y y
Name:
(in capitals) ___________________________ Designation_____________________
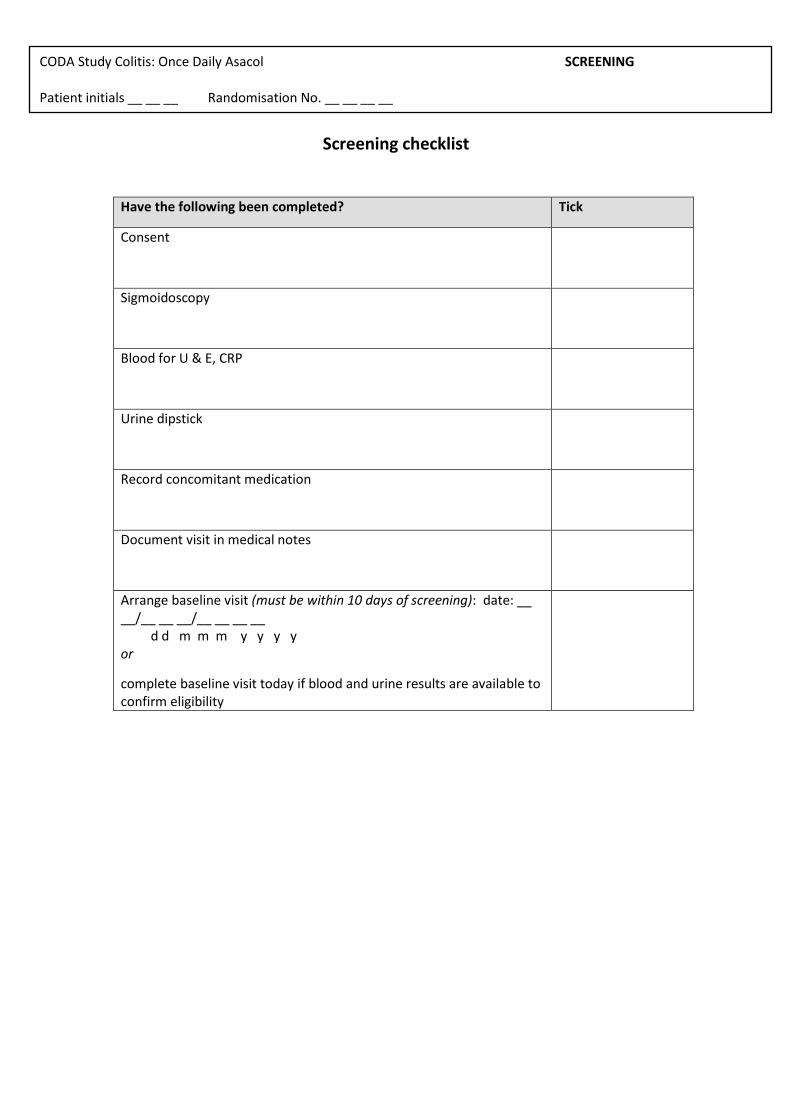
CODA Study Colitis: Once Daily Asacol SCREENING Patient initials __ __ __ Randomisation No. __ __ __ __
Screening checklist
Have the following been completed? Tick
Consent
Sigmoidoscopy
Blood for U & E, CRP
Urine dipstick
Record concomitant medication
Document visit in medical notes
Arrange baseline visit (must be within 10 days of screening): date: __ __/__ __ __/__ __ __ __ d d m m m y y y y or
complete baseline visit today if blood and urine results are available to confirm eligibility

CODA Study Colitis: Once Daily Asacol BASELINE Patient initials __ __ __ Randomisation No. __ __ __ __
BASELINE ASSESSMENT: Visit date: __ __ /__ __ __/ __ __ __ __
d d m m m y y y y
Procedures to be carried out at this visit:
Randomisation
Dispense medication
Faecal calprotectin
Other medical history
Document details of visit in medical notes
Fax Clinical Trial Coordinator to inform of recruitment
Send GP letter
1 Extra-intestinal Complications (current or previous)
Tick all that apply
Tick
Arthritis (swollen or deformed joints)
Arthralgia
Sacro-iliitis
Ankylosing spondylitis
Pyoderma gangrenosum

CODA Study Colitis: Once Daily Asacol BASELINE Patient initials __ __ __ Randomisation No. __ __ __ __
Erythema nodosum
Aphthous ulcers or stomatitis
Primary sclerosing cholangitis
Auto-immune hepatitis
Uveitis or iritis
None of the above
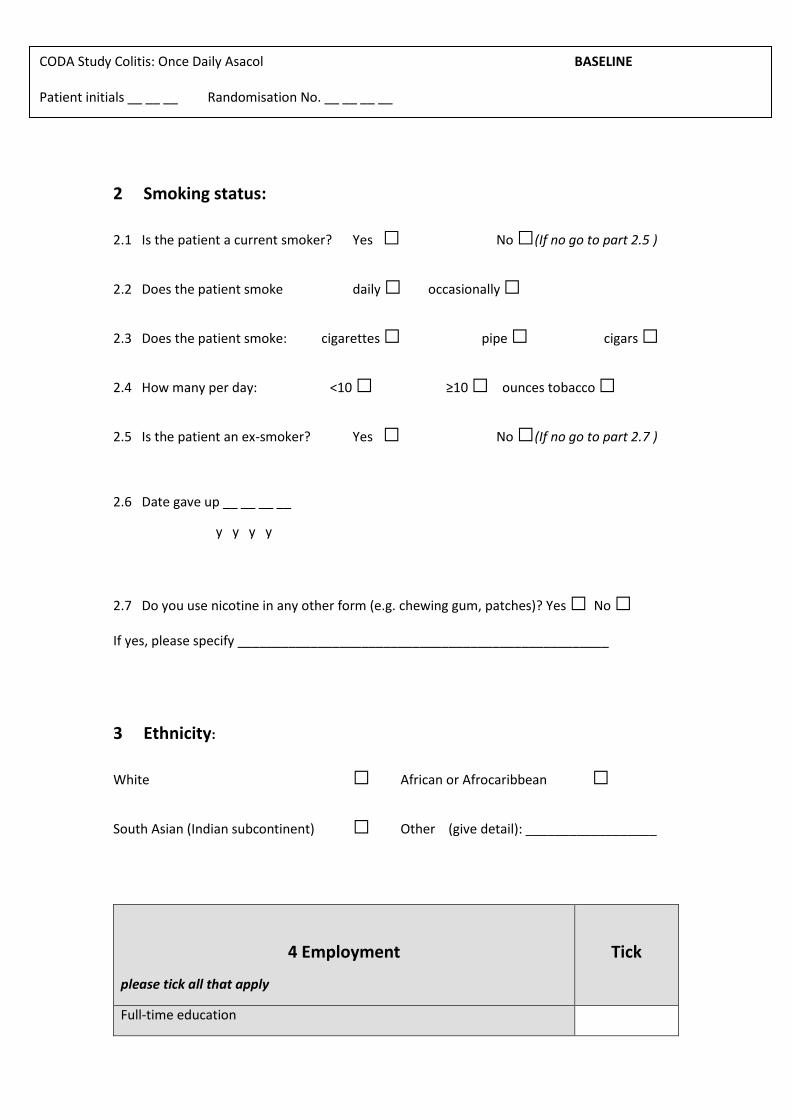
CODA Study Colitis: Once Daily Asacol BASELINE Patient initials __ __ __ Randomisation No. __ __ __ __
2 Smoking status:
2.1 Is the patient a current smoker? Yes □ No □(If no go to part 2.5 )
2.2 Does the patient smoke daily □ occasionally □
2.3 Does the patient smoke: cigarettes □ pipe □ cigars □
2.4 How many per day: <10 □ ≥10 □ ounces tobacco □
2.5 Is the patient an ex-smoker? Yes □ No □(If no go to part 2.7 )
2.6 Date gave up __ __ __ __
y y y y
2.7 Do you use nicotine in any other form (e.g. chewing gum, patches)? Yes □ No □
If yes, please specify ___________________________________________________
3 Ethnicity:
White □ African or Afrocaribbean □
South Asian (Indian subcontinent) □ Other (give detail): __________________
4 Employment
please tick all that apply
Tick
Full-time education

CODA Study Colitis: Once Daily Asacol BASELINE Patient initials __ __ __ Randomisation No. __ __ __ __
Part-time education
Full-time employment
Part-time employment
Homemaker or not in paid employment
Unemployed or seeking work
Not working due to disability
Retired
CODA Study Colitis: Once Daily Asacol BASELINE Patient initials __ __ __ Randomisation No. __ __ __ __
5 Faecal calprotectin:
Collect stool sample for faecal calprotectin as per instructions on enclosed sheet
5.1 Was the stool sample obtained: at this visit □ or pot given to patient □
6 Study medication:
Complete prescription for study medication. Remind patient not to open a new bottle of
medication until the opened one is empty and to return unused medication and empty bottles
at next visit.
Obtain randomisation number from pharmacy, once the patient has collected their trial
medication.
CODA Study Colitis: Once Daily Asacol BASELINE Patient initials __ __ __ Randomisation No. __ __ __ __
Baseline checklist
Have the following been completed? Tick
Randomisation - Pharmacy will assign the randomisation number. You need
to obtain the number from pharmacy (or the patient) to complete the CRF
and calprotectin sample documents
Dispense medication
Faecal calprotectin sample
Document details of visit in medical notes
Give patient trial card
Write to GP – trial participation
Fax Clinical Trial Coordinator to inform of recruitment
Arrange next visit (6 weeks +/-1 week) date __ __/__ __ __/__ __ __ __
d d m m m y y y y
Remind patient to bring remaining study medication & empty bottles to next
visit
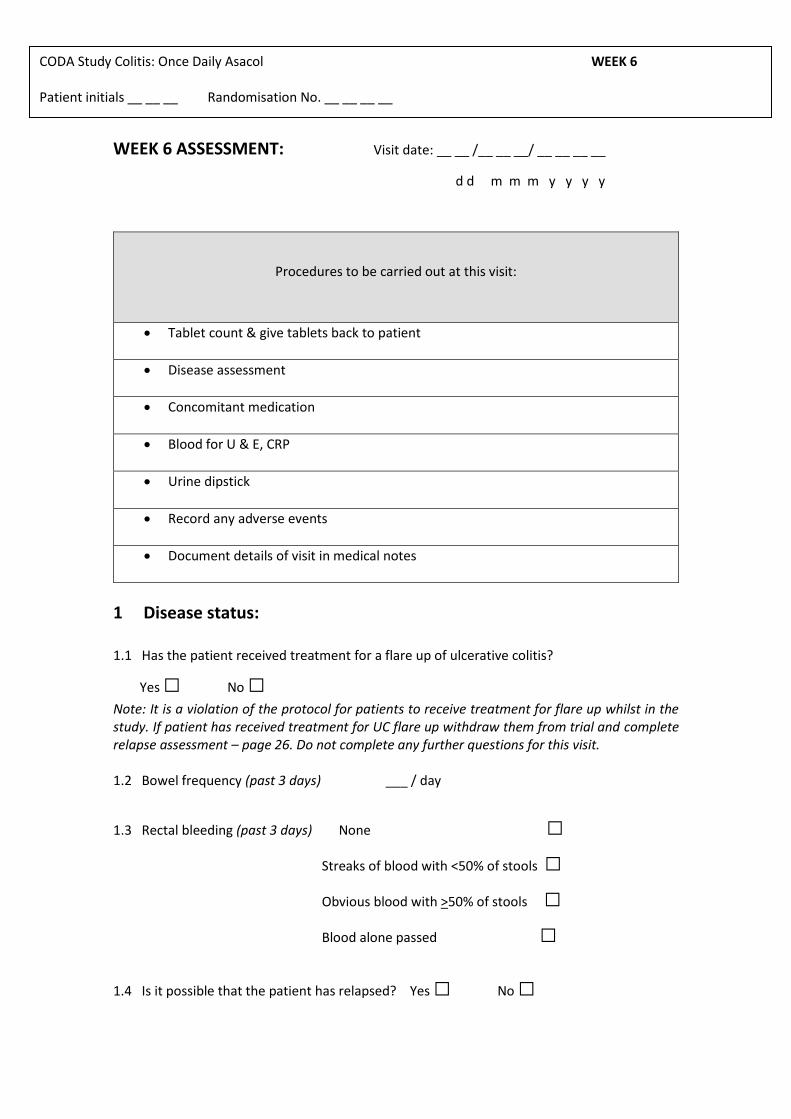
CODA Study Colitis: Once Daily Asacol WEEK 6 Patient initials __ __ __ Randomisation No. __ __ __ __
WEEK 6 ASSESSMENT: Visit date: __ __ /__ __ __/ __ __ __ __
d d m m m y y y y
Procedures to be carried out at this visit:
Tablet count & give tablets back to patient
Disease assessment
Concomitant medication
Blood for U & E, CRP
Urine dipstick
Record any adverse events
Document details of visit in medical notes
1 Disease status: 1.1 Has the patient received treatment for a flare up of ulcerative colitis?
Yes □ No □
Note: It is a violation of the protocol for patients to receive treatment for flare up whilst in the study. If patient has received treatment for UC flare up withdraw them from trial and complete relapse assessment – page 26. Do not complete any further questions for this visit. 1.2 Bowel frequency (past 3 days) ___ / day
1.3 Rectal bleeding (past 3 days) None □
Streaks of blood with <50% of stools □
Obvious blood with >50% of stools □
Blood alone passed □
1.4 Is it possible that the patient has relapsed? Yes □ No □
CODA Study Colitis: Once Daily Asacol WEEK 6 Patient initials __ __ __ Randomisation No. __ __ __ __
If yes, do not complete any further questions for this visit. Complete relapse assessment page 26 and withdraw from study if relapse confirmed
2 Trial medication: Remind patient not to open a new bottle of medication until the opened one is empty and to
return unused medication and empty bottles at next visit
2.1 Record how many trial tablets are left in the medication pack: ________ There are 180 tablets in an unopened bottle. 2.2 According to the patient have they taken their study tablets as prescribed?
Yes (≥ 90% of the time)□ No (< 90% of the time)□
2.3 According to the patient how easy was it remembering to take the trial tablets:
Very easy □ Fairly easy □ Fairly difficult □ Very difficult □
3 Concomitant medication: 3.1 Have there been any changes in medication?
Yes □ No □
Record any changes on the changes to concomitant medication page 31
4 Adverse events: 4.1 Has the patient experienced any adverse events since the last visit?
Yes □ No □
If yes, complete adverse events page 33
5 Blood and urine sample: Take blood for urea & electrolytes and CRP, carry out dipstick urinalysis (send blood to local lab & use local dipsticks). Record results on laboratory samples page 32
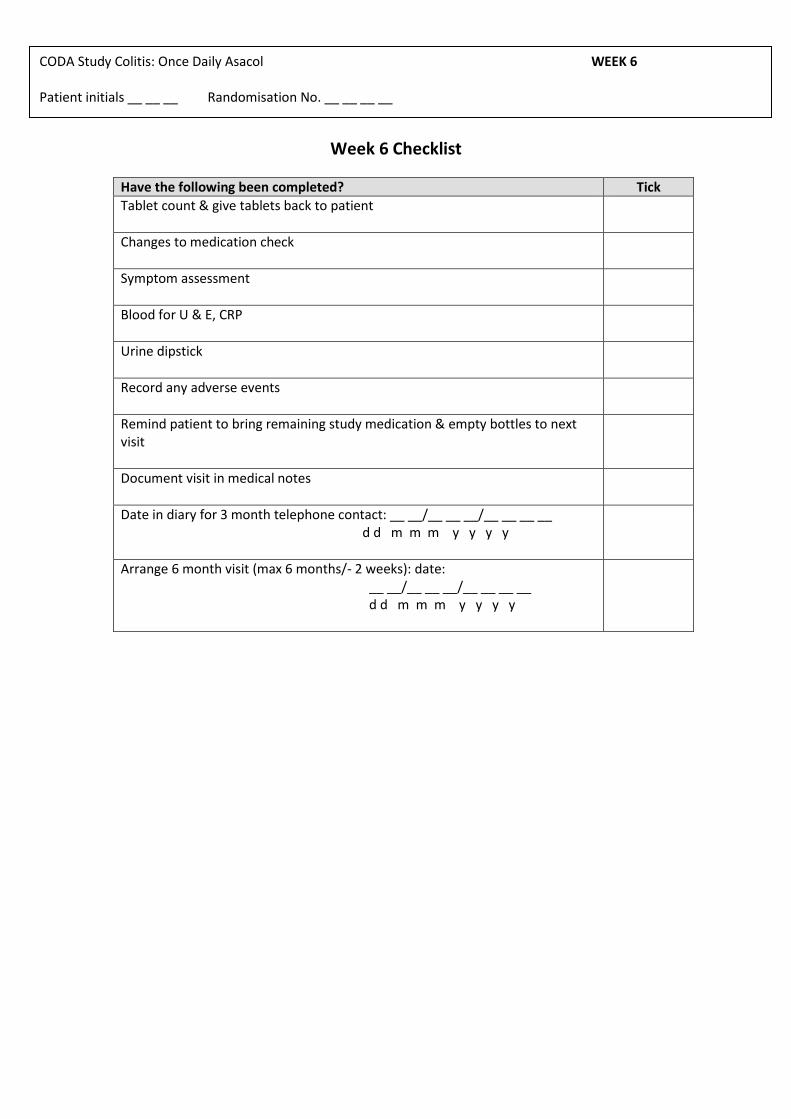
CODA Study Colitis: Once Daily Asacol WEEK 6 Patient initials __ __ __ Randomisation No. __ __ __ __
Week 6 Checklist
Have the following been completed? Tick
Tablet count & give tablets back to patient
Changes to medication check
Symptom assessment
Blood for U & E, CRP
Urine dipstick
Record any adverse events
Remind patient to bring remaining study medication & empty bottles to next visit
Document visit in medical notes
Date in diary for 3 month telephone contact: __ __/__ __ __/__ __ __ __ d d m m m y y y y
Arrange 6 month visit (max 6 months/- 2 weeks): date: __ __/__ __ __/__ __ __ __ d d m m m y y y y
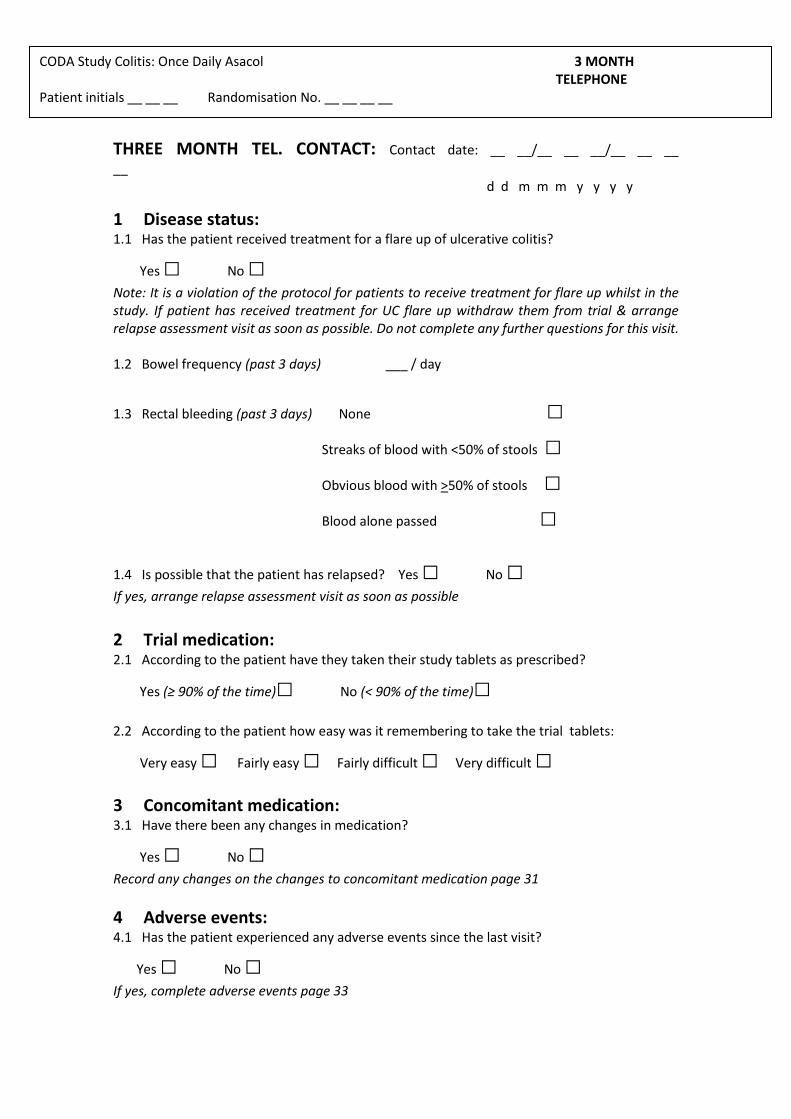
CODA Study Colitis: Once Daily Asacol 3 MONTH TELEPHONE Patient initials __ __ __ Randomisation No. __ __ __ __
THREE MONTH TEL. CONTACT: Contact date: __ __/__ __ __/__ __ __
__ d d m m m y y y y
1 Disease status: 1.1 Has the patient received treatment for a flare up of ulcerative colitis?
Yes □ No □
Note: It is a violation of the protocol for patients to receive treatment for flare up whilst in the study. If patient has received treatment for UC flare up withdraw them from trial & arrange relapse assessment visit as soon as possible. Do not complete any further questions for this visit. 1.2 Bowel frequency (past 3 days) ___ / day
1.3 Rectal bleeding (past 3 days) None □
Streaks of blood with <50% of stools □
Obvious blood with >50% of stools □
Blood alone passed □
1.4 Is possible that the patient has relapsed? Yes □ No □
If yes, arrange relapse assessment visit as soon as possible
2 Trial medication: 2.1 According to the patient have they taken their study tablets as prescribed?
Yes (≥ 90% of the time)□ No (< 90% of the time)□
2.2 According to the patient how easy was it remembering to take the trial tablets:
Very easy □ Fairly easy □ Fairly difficult □ Very difficult □
3 Concomitant medication: 3.1 Have there been any changes in medication?
Yes □ No □
Record any changes on the changes to concomitant medication page 31
4 Adverse events: 4.1 Has the patient experienced any adverse events since the last visit?
Yes □ No □
If yes, complete adverse events page 33
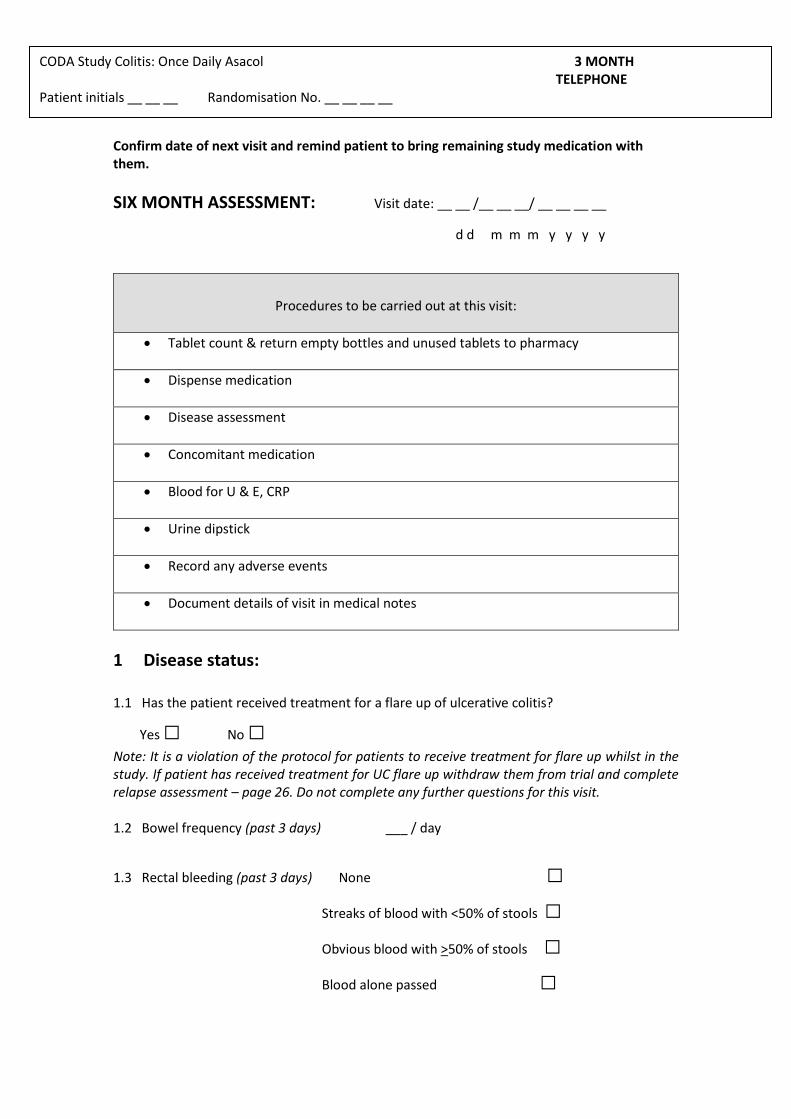
CODA Study Colitis: Once Daily Asacol 3 MONTH TELEPHONE Patient initials __ __ __ Randomisation No. __ __ __ __
Confirm date of next visit and remind patient to bring remaining study medication with them.
SIX MONTH ASSESSMENT: Visit date: __ __ /__ __ __/ __ __ __ __
d d m m m y y y y
Procedures to be carried out at this visit:
Tablet count & return empty bottles and unused tablets to pharmacy
Dispense medication
Disease assessment
Concomitant medication
Blood for U & E, CRP
Urine dipstick
Record any adverse events
Document details of visit in medical notes
1 Disease status: 1.1 Has the patient received treatment for a flare up of ulcerative colitis?
Yes □ No □
Note: It is a violation of the protocol for patients to receive treatment for flare up whilst in the study. If patient has received treatment for UC flare up withdraw them from trial and complete relapse assessment – page 26. Do not complete any further questions for this visit. 1.2 Bowel frequency (past 3 days) ___ / day
1.3 Rectal bleeding (past 3 days) None □
Streaks of blood with <50% of stools □
Obvious blood with >50% of stools □
Blood alone passed □
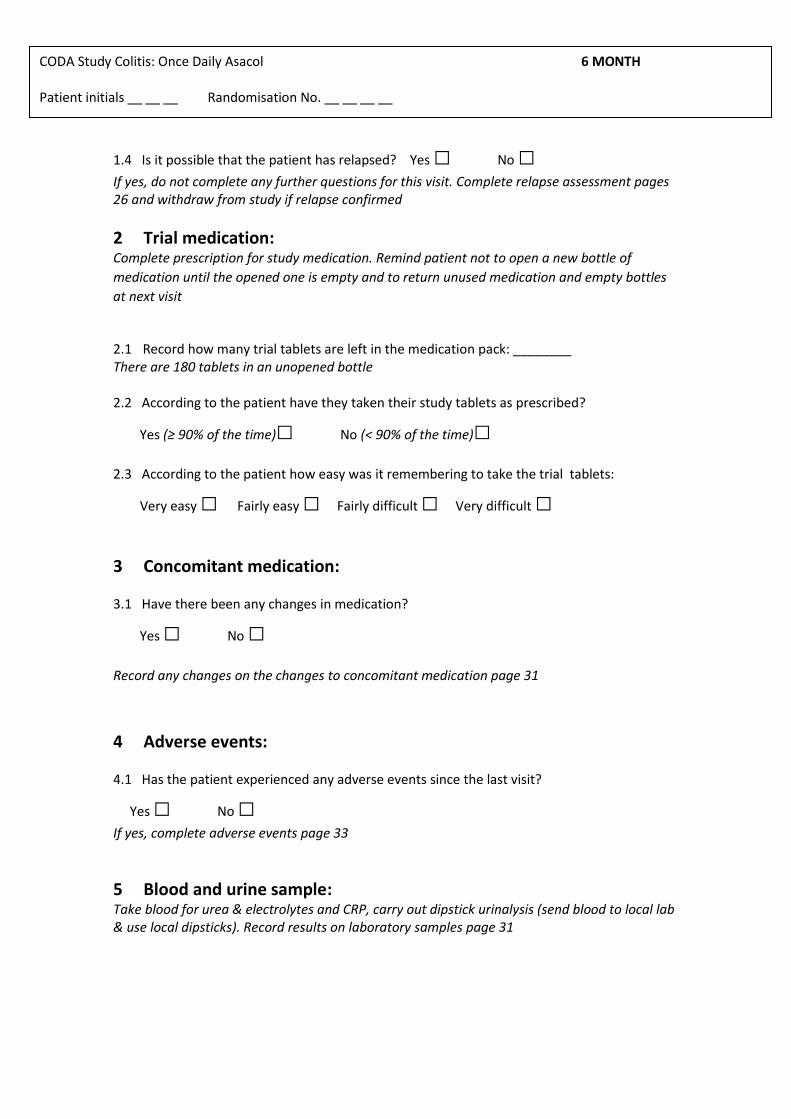
CODA Study Colitis: Once Daily Asacol 6 MONTH Patient initials __ __ __ Randomisation No. __ __ __ __
1.4 Is it possible that the patient has relapsed? Yes □ No □
If yes, do not complete any further questions for this visit. Complete relapse assessment pages 26 and withdraw from study if relapse confirmed
2 Trial medication: Complete prescription for study medication. Remind patient not to open a new bottle of
medication until the opened one is empty and to return unused medication and empty bottles
at next visit
2.1 Record how many trial tablets are left in the medication pack: ________ There are 180 tablets in an unopened bottle 2.2 According to the patient have they taken their study tablets as prescribed?
Yes (≥ 90% of the time)□ No (< 90% of the time)□
2.3 According to the patient how easy was it remembering to take the trial tablets:
Very easy □ Fairly easy □ Fairly difficult □ Very difficult □
3 Concomitant medication: 3.1 Have there been any changes in medication?
Yes □ No □
Record any changes on the changes to concomitant medication page 31
4 Adverse events: 4.1 Has the patient experienced any adverse events since the last visit?
Yes □ No □
If yes, complete adverse events page 33
5 Blood and urine sample: Take blood for urea & electrolytes and CRP, carry out dipstick urinalysis (send blood to local lab & use local dipsticks). Record results on laboratory samples page 31
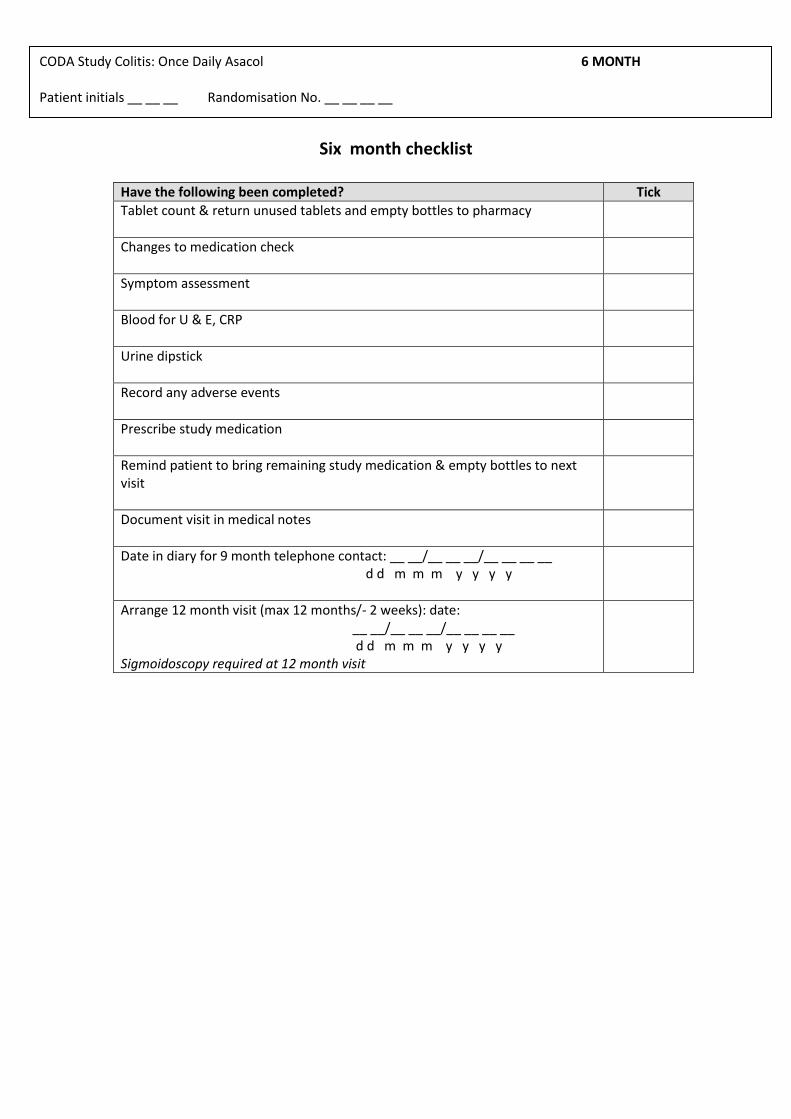
CODA Study Colitis: Once Daily Asacol 6 MONTH Patient initials __ __ __ Randomisation No. __ __ __ __
Six month checklist
Have the following been completed? Tick
Tablet count & return unused tablets and empty bottles to pharmacy
Changes to medication check
Symptom assessment
Blood for U & E, CRP
Urine dipstick
Record any adverse events
Prescribe study medication
Remind patient to bring remaining study medication & empty bottles to next visit
Document visit in medical notes
Date in diary for 9 month telephone contact: __ __/__ __ __/__ __ __ __ d d m m m y y y y
Arrange 12 month visit (max 12 months/- 2 weeks): date: __ __/__ __ __/__ __ __ __ d d m m m y y y y Sigmoidoscopy required at 12 month visit
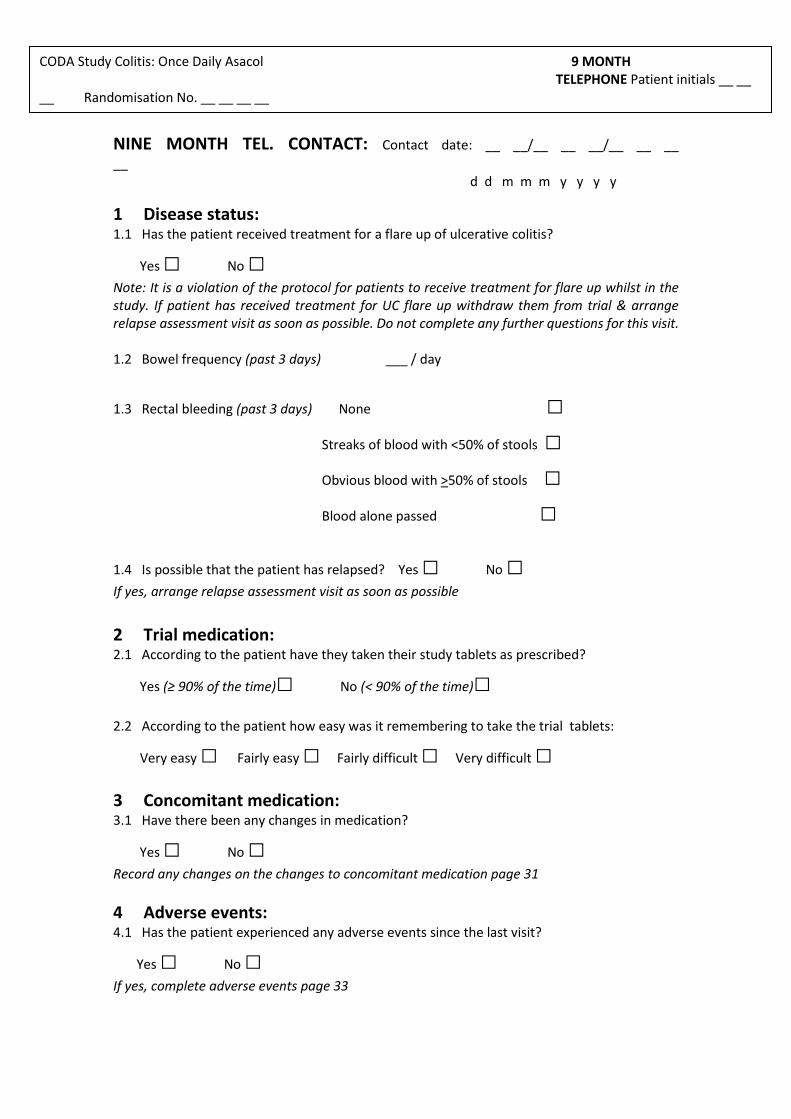
CODA Study Colitis: Once Daily Asacol 9 MONTH TELEPHONE Patient initials __ __ __ Randomisation No. __ __ __ __
NINE MONTH TEL. CONTACT: Contact date: __ __/__ __ __/__ __ __
__ d d m m m y y y y
1 Disease status: 1.1 Has the patient received treatment for a flare up of ulcerative colitis?
Yes □ No □
Note: It is a violation of the protocol for patients to receive treatment for flare up whilst in the study. If patient has received treatment for UC flare up withdraw them from trial & arrange relapse assessment visit as soon as possible. Do not complete any further questions for this visit. 1.2 Bowel frequency (past 3 days) ___ / day
1.3 Rectal bleeding (past 3 days) None □
Streaks of blood with <50% of stools □
Obvious blood with >50% of stools □
Blood alone passed □
1.4 Is possible that the patient has relapsed? Yes □ No □
If yes, arrange relapse assessment visit as soon as possible
2 Trial medication: 2.1 According to the patient have they taken their study tablets as prescribed?
Yes (≥ 90% of the time)□ No (< 90% of the time)□
2.2 According to the patient how easy was it remembering to take the trial tablets:
Very easy □ Fairly easy □ Fairly difficult □ Very difficult □
3 Concomitant medication: 3.1 Have there been any changes in medication?
Yes □ No □
Record any changes on the changes to concomitant medication page 31
4 Adverse events: 4.1 Has the patient experienced any adverse events since the last visit?
Yes □ No □
If yes, complete adverse events page 33
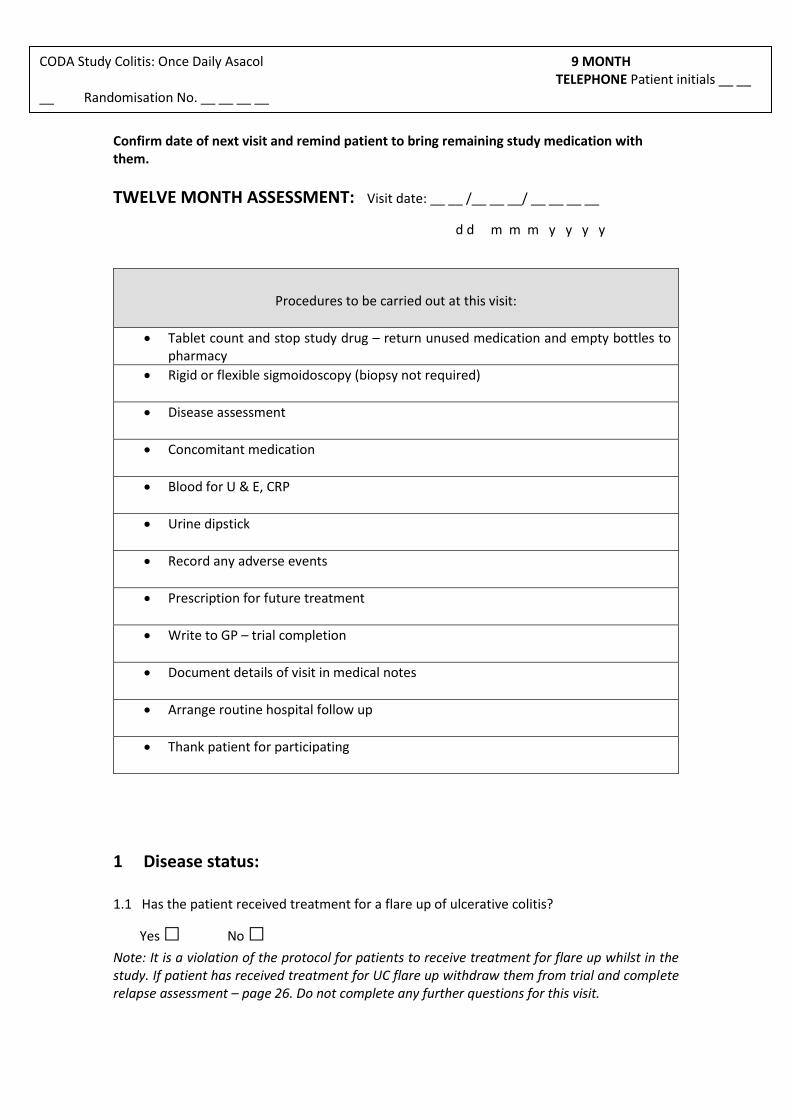
CODA Study Colitis: Once Daily Asacol 9 MONTH TELEPHONE Patient initials __ __ __ Randomisation No. __ __ __ __
Confirm date of next visit and remind patient to bring remaining study medication with them.
TWELVE MONTH ASSESSMENT: Visit date: __ __ /__ __ __/ __ __ __ __
d d m m m y y y y
Procedures to be carried out at this visit:
Tablet count and stop study drug – return unused medication and empty bottles to pharmacy
Rigid or flexible sigmoidoscopy (biopsy not required)
Disease assessment
Concomitant medication
Blood for U & E, CRP
Urine dipstick
Record any adverse events
Prescription for future treatment
Write to GP – trial completion
Document details of visit in medical notes
Arrange routine hospital follow up
Thank patient for participating
1 Disease status: 1.1 Has the patient received treatment for a flare up of ulcerative colitis?
Yes □ No □
Note: It is a violation of the protocol for patients to receive treatment for flare up whilst in the study. If patient has received treatment for UC flare up withdraw them from trial and complete relapse assessment – page 26. Do not complete any further questions for this visit.
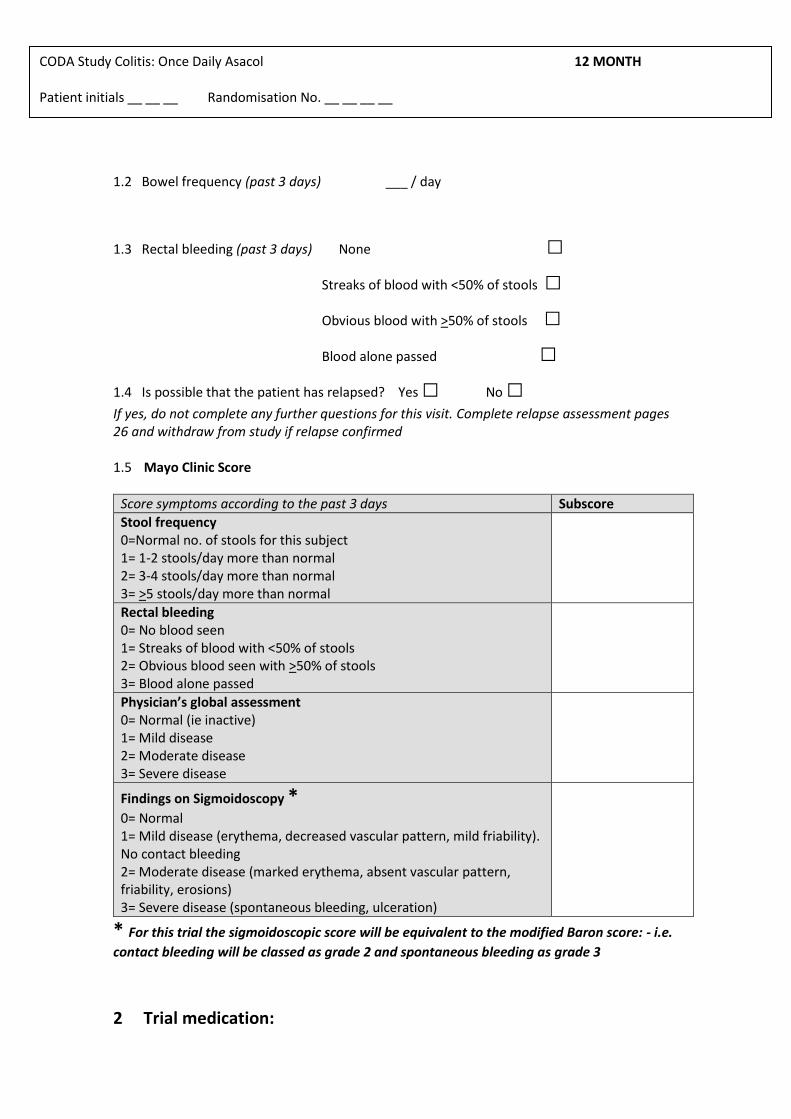
CODA Study Colitis: Once Daily Asacol 12 MONTH Patient initials __ __ __ Randomisation No. __ __ __ __
1.2 Bowel frequency (past 3 days) ___ / day
1.3 Rectal bleeding (past 3 days) None □
Streaks of blood with <50% of stools □
Obvious blood with >50% of stools □
Blood alone passed □
1.4 Is possible that the patient has relapsed? Yes □ No □
If yes, do not complete any further questions for this visit. Complete relapse assessment pages 26 and withdraw from study if relapse confirmed 1.5 Mayo Clinic Score
Score symptoms according to the past 3 days Subscore
Stool frequency 0=Normal no. of stools for this subject 1= 1-2 stools/day more than normal 2= 3-4 stools/day more than normal 3= >5 stools/day more than normal
Rectal bleeding 0= No blood seen 1= Streaks of blood with <50% of stools 2= Obvious blood seen with >50% of stools 3= Blood alone passed
Physician’s global assessment 0= Normal (ie inactive) 1= Mild disease 2= Moderate disease 3= Severe disease
Findings on Sigmoidoscopy *
0= Normal 1= Mild disease (erythema, decreased vascular pattern, mild friability). No contact bleeding 2= Moderate disease (marked erythema, absent vascular pattern, friability, erosions) 3= Severe disease (spontaneous bleeding, ulceration)
* For this trial the sigmoidoscopic score will be equivalent to the modified Baron score: - i.e.
contact bleeding will be classed as grade 2 and spontaneous bleeding as grade 3
2 Trial medication:
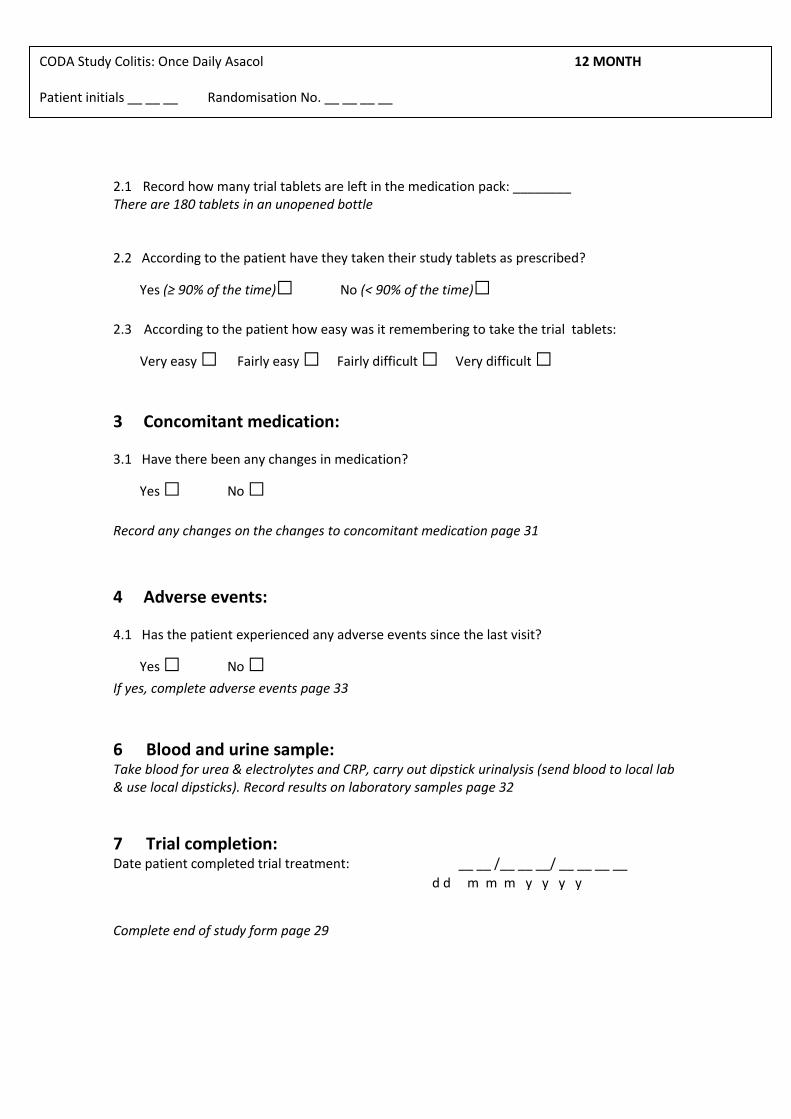
CODA Study Colitis: Once Daily Asacol 12 MONTH Patient initials __ __ __ Randomisation No. __ __ __ __
2.1 Record how many trial tablets are left in the medication pack: ________ There are 180 tablets in an unopened bottle 2.2 According to the patient have they taken their study tablets as prescribed?
Yes (≥ 90% of the time)□ No (< 90% of the time)□
2.3 According to the patient how easy was it remembering to take the trial tablets:
Very easy □ Fairly easy □ Fairly difficult □ Very difficult □
3 Concomitant medication: 3.1 Have there been any changes in medication?
Yes □ No □
Record any changes on the changes to concomitant medication page 31
4 Adverse events: 4.1 Has the patient experienced any adverse events since the last visit?
Yes □ No □
If yes, complete adverse events page 33
6 Blood and urine sample: Take blood for urea & electrolytes and CRP, carry out dipstick urinalysis (send blood to local lab & use local dipsticks). Record results on laboratory samples page 32
7 Trial completion: Date patient completed trial treatment: __ __ /__ __ __/ __ __ __ __
d d m m m y y y y
Complete end of study form page 29
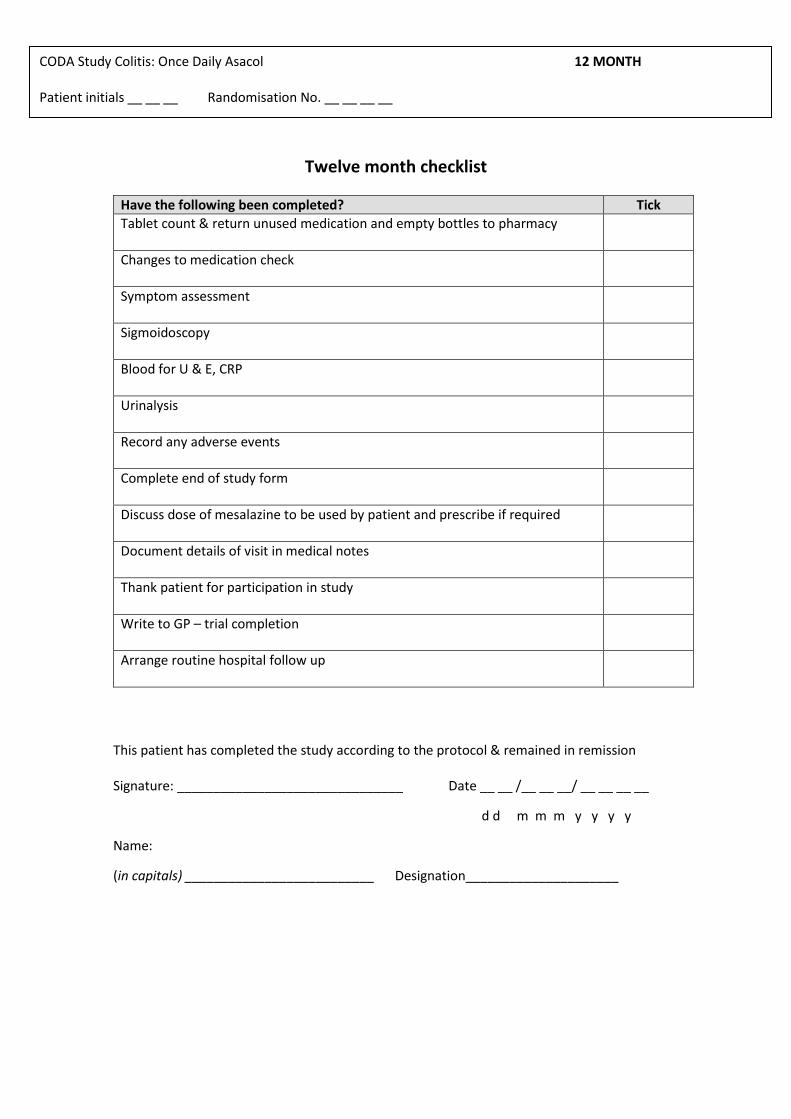
CODA Study Colitis: Once Daily Asacol 12 MONTH Patient initials __ __ __ Randomisation No. __ __ __ __
Twelve month checklist
Have the following been completed? Tick
Tablet count & return unused medication and empty bottles to pharmacy
Changes to medication check
Symptom assessment
Sigmoidoscopy
Blood for U & E, CRP
Urinalysis
Record any adverse events
Complete end of study form
Discuss dose of mesalazine to be used by patient and prescribe if required
Document details of visit in medical notes
Thank patient for participation in study
Write to GP – trial completion
Arrange routine hospital follow up
This patient has completed the study according to the protocol & remained in remission Signature: _______________________________ Date __ __ /__ __ __/ __ __ __ __
d d m m m y y y y
Name:
(in capitals) __________________________ Designation_____________________

CODA Study Colitis: Once Daily Asacol UNSCHEDULED Patient initials __ __ __ Randomisation No. __ __ __ __
UNSCHEDULED ASSESSMENT: Visit date: __ __ /__ __ __/ __ __ __ __
d d m m m y y y y
Procedures to be carried out at this visit:
Tablet count
Disease assessment
Concomitant medication
Record any adverse events
Document details of visit in medical notes
1 Reason for visit:
NOTE: a) If the reason for this visit is suspected relapse do not complete these pages, go to relapse assessment page 26 b) If unscheduled visit falls within time window of routine visits, do not complete these pages, complete relevant visit pages 1.1 State reason for visit: _________________________________________________
2 Disease status: 2.1 Bowel frequency (past 3 days) ___ / day
2.2 Rectal bleeding (past 3 days) None □
Streaks of blood with <50% of stools □
Obvious blood with >50% of stools □
Blood alone passed □
2.3 Is the patient still in remission? Yes □ No □
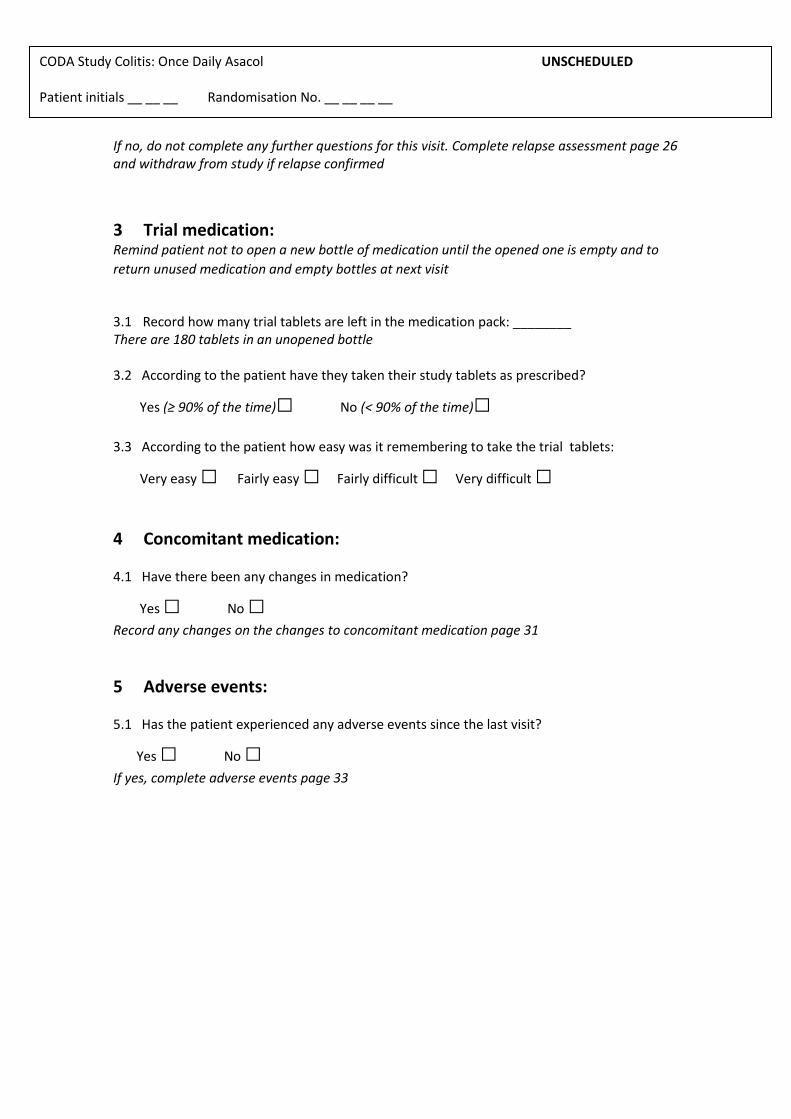
CODA Study Colitis: Once Daily Asacol UNSCHEDULED Patient initials __ __ __ Randomisation No. __ __ __ __
If no, do not complete any further questions for this visit. Complete relapse assessment page 26 and withdraw from study if relapse confirmed
3 Trial medication: Remind patient not to open a new bottle of medication until the opened one is empty and to
return unused medication and empty bottles at next visit
3.1 Record how many trial tablets are left in the medication pack: ________ There are 180 tablets in an unopened bottle 3.2 According to the patient have they taken their study tablets as prescribed?
Yes (≥ 90% of the time)□ No (< 90% of the time)□
3.3 According to the patient how easy was it remembering to take the trial tablets:
Very easy □ Fairly easy □ Fairly difficult □ Very difficult □
4 Concomitant medication: 4.1 Have there been any changes in medication?
Yes □ No □
Record any changes on the changes to concomitant medication page 31
5 Adverse events: 5.1 Has the patient experienced any adverse events since the last visit?
Yes □ No □
If yes, complete adverse events page 33
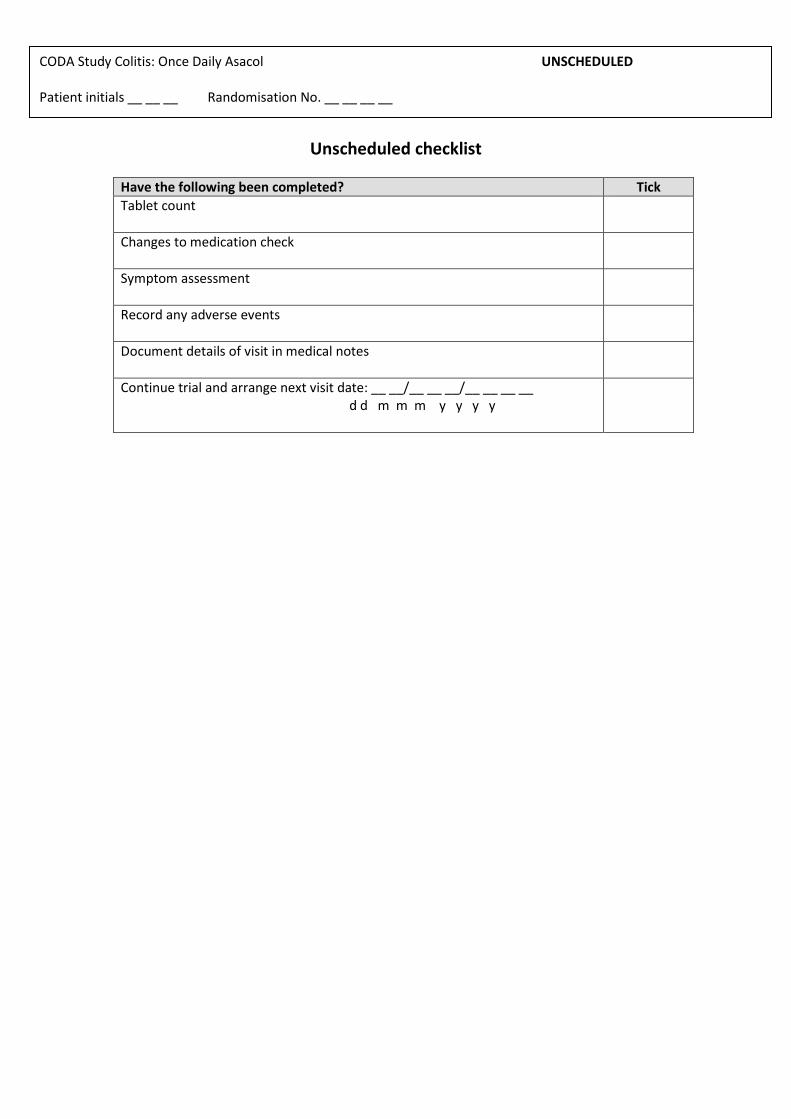
CODA Study Colitis: Once Daily Asacol UNSCHEDULED Patient initials __ __ __ Randomisation No. __ __ __ __
Unscheduled checklist
Have the following been completed? Tick
Tablet count
Changes to medication check
Symptom assessment
Record any adverse events
Document details of visit in medical notes
Continue trial and arrange next visit date: __ __/__ __ __/__ __ __ __ d d m m m y y y y

CODA Study Colitis: Once Daily Asacol RELAPSE ASSESSMENT Patient initials __ __ __ Randomisation No. __ __ __ __
RELAPSE ASSESSMENT DATE: __ __ /__ __ __/ __ __ __ __
d d m m m y y y y
1 Disease status: 1.1 Has the patient received treatment for flare up of UC?
Yes □ No □ if no, go to part 1.3
1.2 If yes, what date did the treatment for flare up start?
__ __ /__ __ __/ __ __ __ __ go to part 3
d d m m m y y y y Note: It is a violation of the protocol for patients to receive treatment for flare up whilst in the study. If patient has received treatment for UC flare up withdraw them from trial. 1.3 Has the patient got symptoms of active disease? Symptoms of relapse are defined as:
Bloody diarrhoea or rectal bleeding lasting 3 days or more
Non-bloody diarrhoea or increase in stool frequency lasting 3 days or more
Other symptoms the patient associates with relapse of his/her ulcerative colitis
Yes □ No □ If no, go to section 3 - patient continues in trial.
1.4 Perform sigmoidoscopy Date of sigmoidoscopy: __ __ /__ __ __/ __ __ __ __
d d m m m y y y y
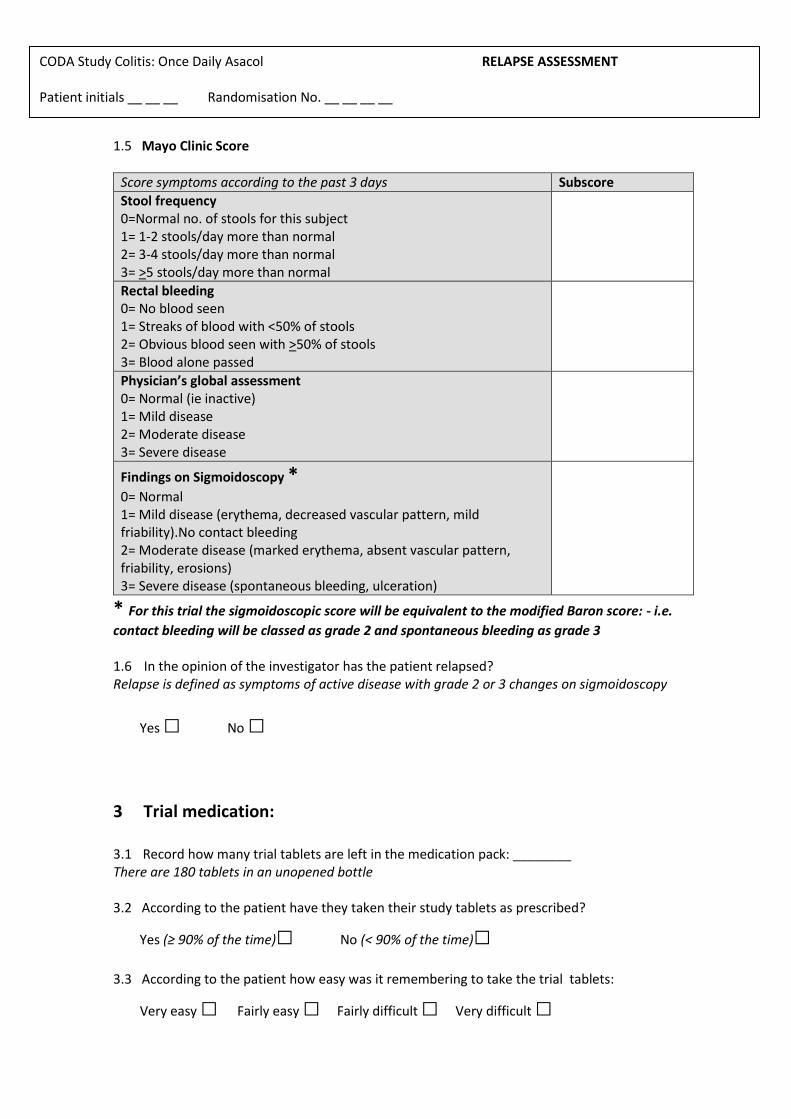
CODA Study Colitis: Once Daily Asacol RELAPSE ASSESSMENT Patient initials __ __ __ Randomisation No. __ __ __ __
1.5 Mayo Clinic Score
Score symptoms according to the past 3 days Subscore
Stool frequency 0=Normal no. of stools for this subject 1= 1-2 stools/day more than normal 2= 3-4 stools/day more than normal 3= >5 stools/day more than normal
Rectal bleeding 0= No blood seen 1= Streaks of blood with <50% of stools 2= Obvious blood seen with >50% of stools 3= Blood alone passed
Physician’s global assessment 0= Normal (ie inactive) 1= Mild disease 2= Moderate disease 3= Severe disease
Findings on Sigmoidoscopy *
0= Normal 1= Mild disease (erythema, decreased vascular pattern, mild friability).No contact bleeding 2= Moderate disease (marked erythema, absent vascular pattern, friability, erosions) 3= Severe disease (spontaneous bleeding, ulceration)
* For this trial the sigmoidoscopic score will be equivalent to the modified Baron score: - i.e.
contact bleeding will be classed as grade 2 and spontaneous bleeding as grade 3 1.6 In the opinion of the investigator has the patient relapsed? Relapse is defined as symptoms of active disease with grade 2 or 3 changes on sigmoidoscopy
Yes □ No □
3 Trial medication: 3.1 Record how many trial tablets are left in the medication pack: ________ There are 180 tablets in an unopened bottle 3.2 According to the patient have they taken their study tablets as prescribed?
Yes (≥ 90% of the time)□ No (< 90% of the time)□
3.3 According to the patient how easy was it remembering to take the trial tablets:
Very easy □ Fairly easy □ Fairly difficult □ Very difficult □
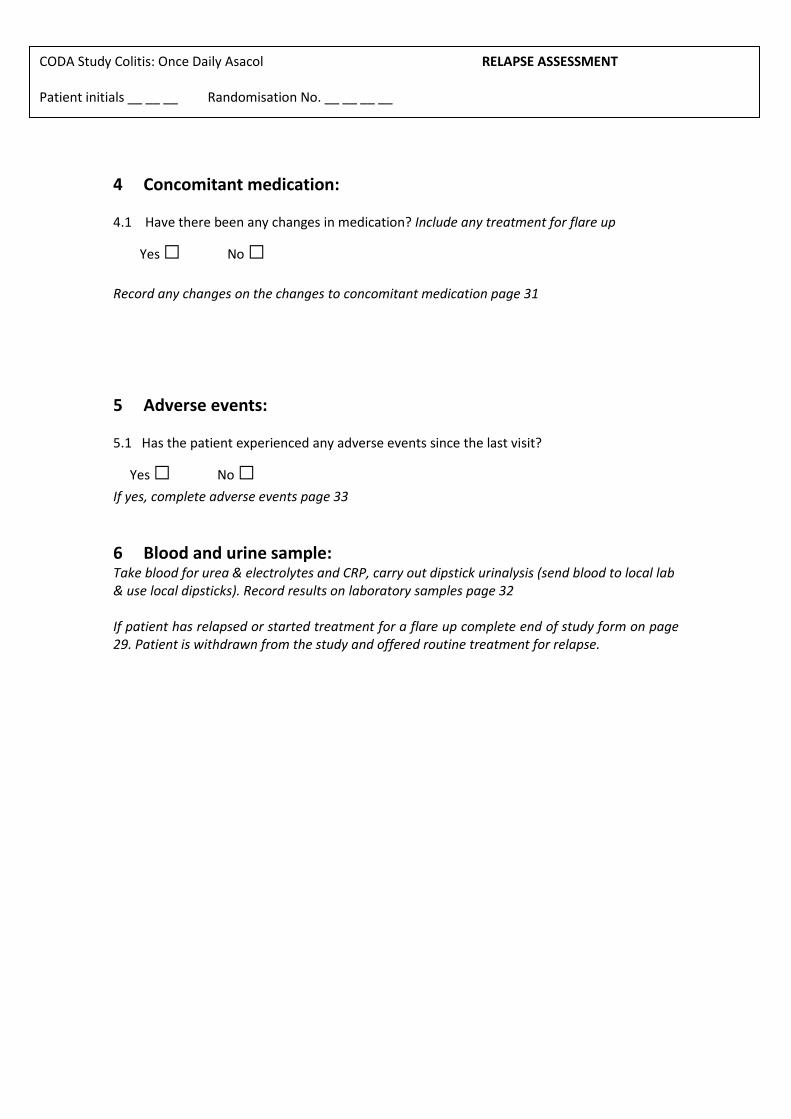
CODA Study Colitis: Once Daily Asacol RELAPSE ASSESSMENT Patient initials __ __ __ Randomisation No. __ __ __ __
4 Concomitant medication: 4.1 Have there been any changes in medication? Include any treatment for flare up
Yes □ No □
Record any changes on the changes to concomitant medication page 31
5 Adverse events: 5.1 Has the patient experienced any adverse events since the last visit?
Yes □ No □
If yes, complete adverse events page 33
6 Blood and urine sample: Take blood for urea & electrolytes and CRP, carry out dipstick urinalysis (send blood to local lab & use local dipsticks). Record results on laboratory samples page 32 If patient has relapsed or started treatment for a flare up complete end of study form on page 29. Patient is withdrawn from the study and offered routine treatment for relapse.
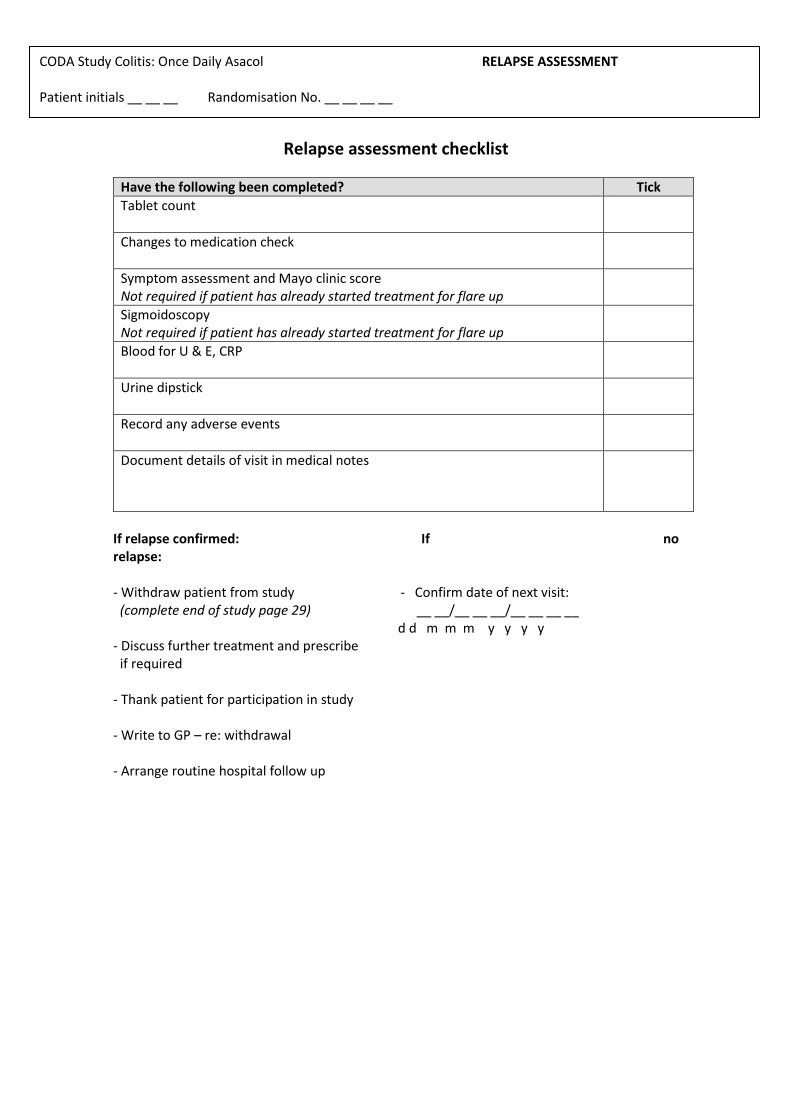
CODA Study Colitis: Once Daily Asacol RELAPSE ASSESSMENT Patient initials __ __ __ Randomisation No. __ __ __ __
Relapse assessment checklist
Have the following been completed? Tick
Tablet count
Changes to medication check
Symptom assessment and Mayo clinic score Not required if patient has already started treatment for flare up
Sigmoidoscopy Not required if patient has already started treatment for flare up
Blood for U & E, CRP
Urine dipstick
Record any adverse events
Document details of visit in medical notes
If relapse confirmed: If no relapse: - Withdraw patient from study - Confirm date of next visit: (complete end of study page 29) __ __/__ __ __/__ __ __ __ d d m m m y y y y - Discuss further treatment and prescribe if required
- Thank patient for participation in study - Write to GP – re: withdrawal - Arrange routine hospital follow up

CODA Study Colitis: Once Daily Asacol END OF STUDY Patient initials __ __ __ Randomisation No. __ __ __ __
END OF STUDY:
1 What date did the patient stop taking trial treatment: __ __ /__ __ __/ __ __ __ __
d d m m m y y y y
2 Did the patient complete the 12 month trial period in remission:
Yes □ No □
If yes go to part 4
3 Withdrawal: 3.1 Was the patient withdrawn from the study during the trial period?
Yes □ No □
3.2 What was the principal reason for withdrawal from trial treatment?
Relapse of colitis □
Drug side-effects □
Patient preference □
Other □ please state: ___________________________
4 Signature: _________________________ Date __ __ /__ __ __/ __ __ __ __
d d m m m y y y y
Name:
(in capitals) __________________________ Designation_____________________
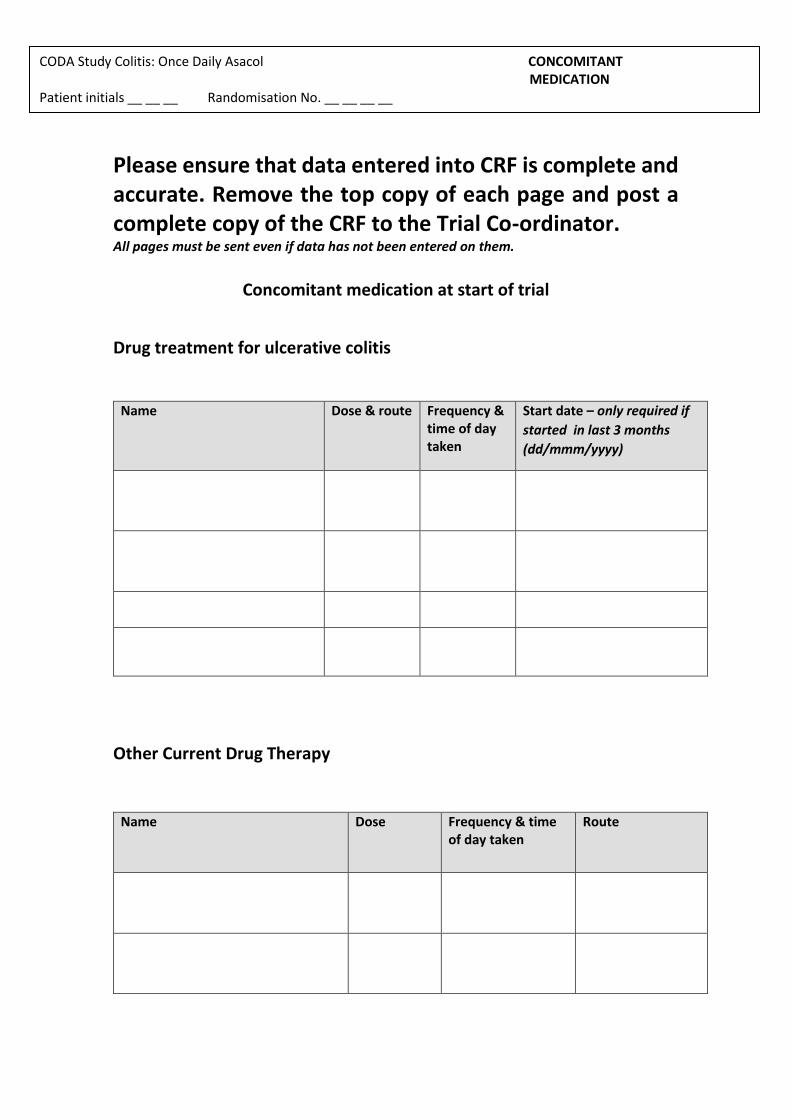
CODA Study Colitis: Once Daily Asacol CONCOMITANT MEDICATION Patient initials __ __ __ Randomisation No. __ __ __ __
Please ensure that data entered into CRF is complete and accurate. Remove the top copy of each page and post a complete copy of the CRF to the Trial Co-ordinator. All pages must be sent even if data has not been entered on them.
Concomitant medication at start of trial
Drug treatment for ulcerative colitis
Name
Dose & route Frequency & time of day taken
Start date – only required if
started in last 3 months
(dd/mmm/yyyy)
Other Current Drug Therapy
Name
Dose Frequency & time of day taken
Route

CODA Study Colitis: Once Daily Asacol CONCOMITANT MEDICATION Patient initials __ __ __ Randomisation No. __ __ __ __

CODA Study Colitis: Once Daily Asacol MEDICATION CHANGES Patient initials __ __ __ Randomisation No. __ __ __ __
Changes to Concomitant Medication during trial (including study drug if stopped)
Drug Date of change (dd/mmm/yyyy)
Dose & route
Frequency & time of day taken
Date stopped - leave blank if ongoing
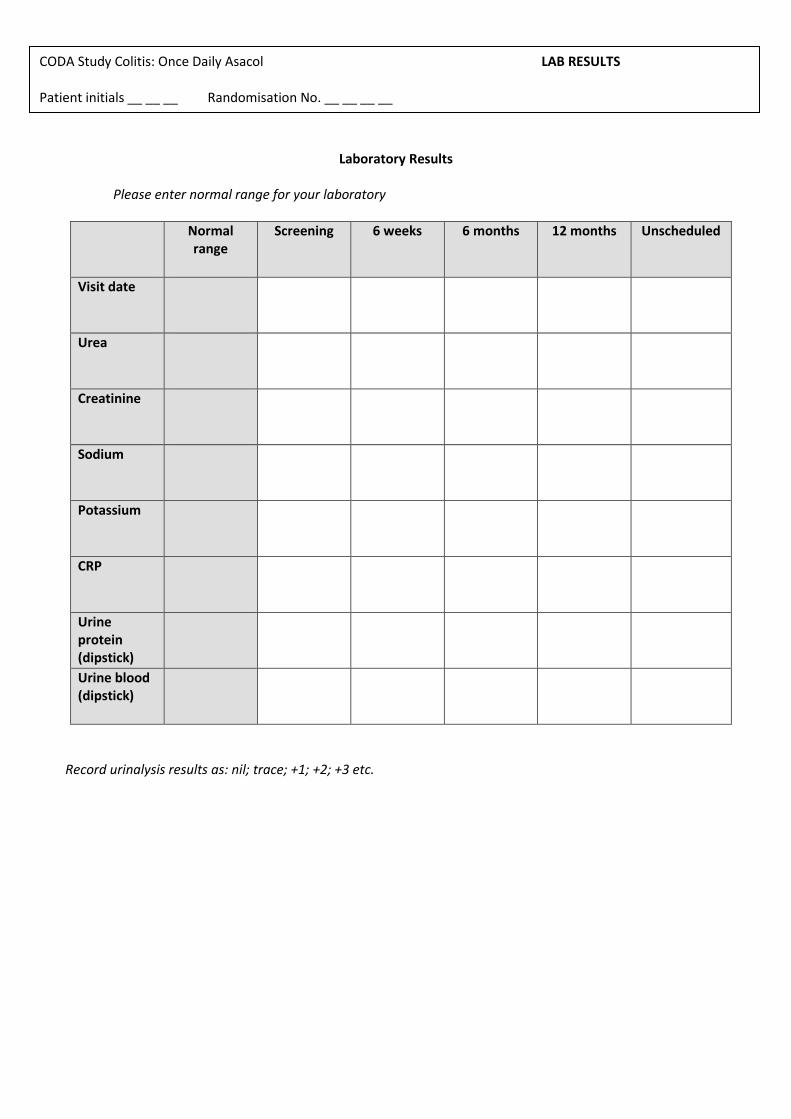
CODA Study Colitis: Once Daily Asacol LAB RESULTS Patient initials __ __ __ Randomisation No. __ __ __ __
Laboratory Results
Please enter normal range for your laboratory
Normal range
Screening 6 weeks 6 months 12 months Unscheduled
Visit date
Urea
Creatinine
Sodium
Potassium
CRP
Urine protein (dipstick)
Urine blood (dipstick)
Record urinalysis results as: nil; trace; +1; +2; +3 etc.
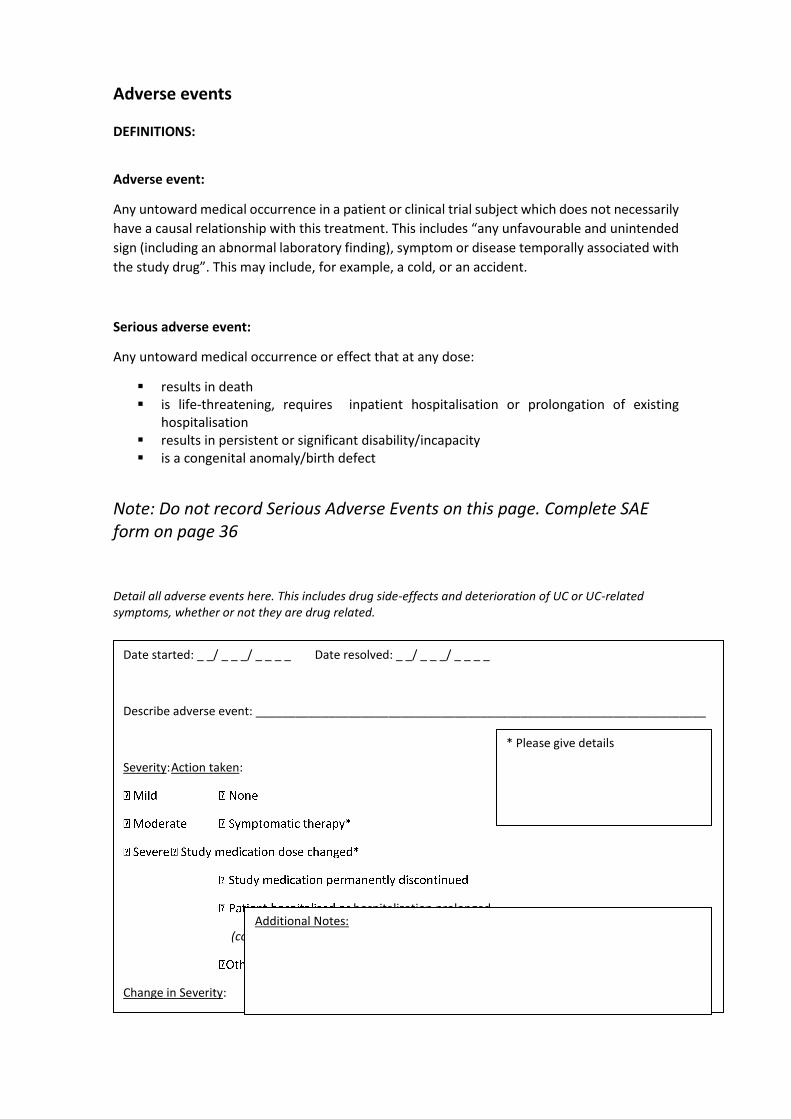
Adverse events
DEFINITIONS:
Adverse event:
Any untoward medical occurrence in a patient or clinical trial subject which does not necessarily
have a causal relationship with this treatment. This includes “any unfavourable and unintended
sign (including an abnormal laboratory finding), symptom or disease temporally associated with
the study drug”. This may include, for example, a cold, or an accident.
Serious adverse event:
Any untoward medical occurrence or effect that at any dose:
results in death is life-threatening, requires inpatient hospitalisation or prolongation of existing
hospitalisation results in persistent or significant disability/incapacity is a congenital anomaly/birth defect
Note: Do not record Serious Adverse Events on this page. Complete SAE form on page 36 Detail all adverse events here. This includes drug side-effects and deterioration of UC or UC-related symptoms, whether or not they are drug related.
Date started: _ _/ _ _ _/ _ _ _ _ Date resolved: _ _/ _ _ _/ _ _ _ _
Describe adverse event: ____________________________________________________________________
Severity: Action taken:
hospitalization prolonged
(complete SAE form)
Change in Severity:
Date changed: _ _/ _ _ _/ _ _ _ _ Date changed: _ _/ _ _ _/ _ _ _ _
Relationship to
* Please give details
Additional Notes:

Adverse events Detail all adverse events here. This includes drug side-effects and deterioration of UC or UC-related symptoms, whether or not they are drug related.
Date started: _ _/ _ _ _/ _ _ _ _ Date resolved: _ _/ _ _ _/ _ _ _ _
Describe adverse event: ____________________________________________________________________
Severity: Action taken:
lized or hospitalization prolonged
(complete SAE form)
Change in Severity:
Date changed: _ _/ _ _ _/ _ _ _ _ Date changed: _ _/ _ _ _/ _ _ _ _
Relationship to
trial treatment: Outcome:
Effect
* Please give details
Additional Notes:
Date started: _ _/ _ _ _/ _ _ _ _ Date resolved: _ _/ _ _ _/ _ _ _ _
Describe adverse event: ____________________________________________________________________
Severity: Action taken:
Study medication dose changed*
(complete SAE form)
Change in Severity:
Date changed: _ _/ _ _ _/ _ _ _ _ Date changed: _ _/ _ _ _/ _ _ _ _
Relationship to
trial treatment: Outcome:
* Please give details
Additional Notes:
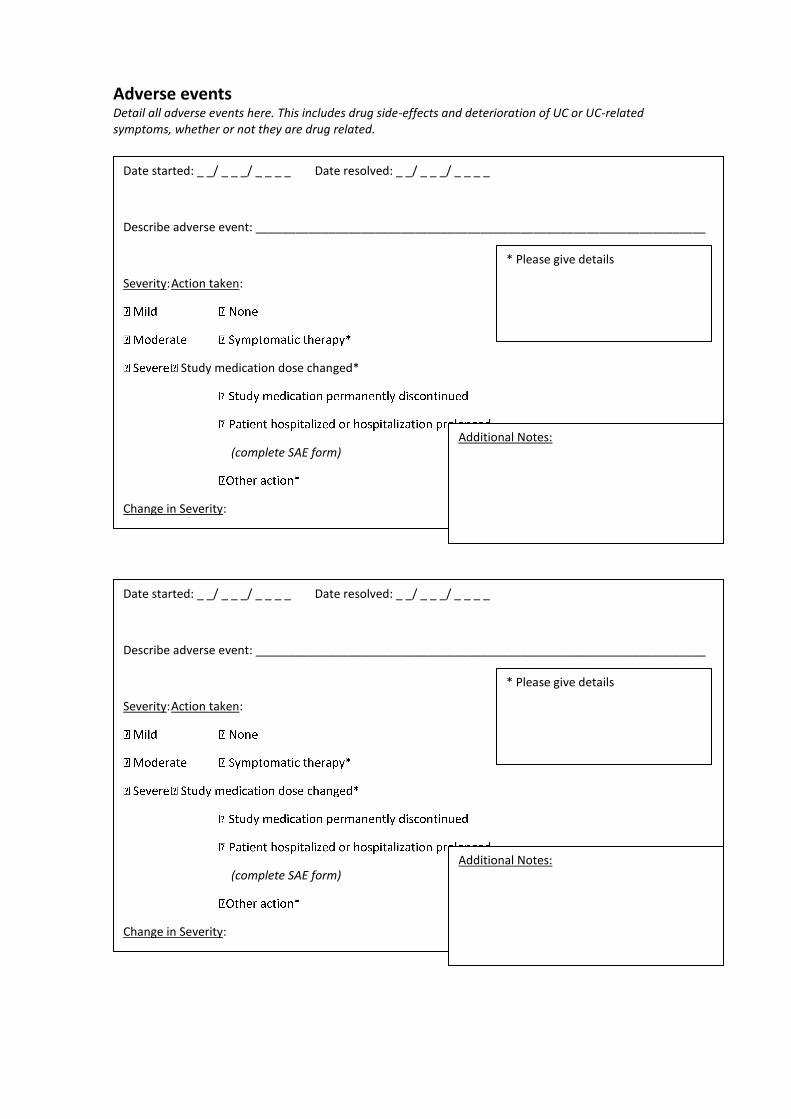
Adverse events Detail all adverse events here. This includes drug side-effects and deterioration of UC or UC-related symptoms, whether or not they are drug related.
Date started: _ _/ _ _ _/ _ _ _ _ Date resolved: _ _/ _ _ _/ _ _ _ _
Describe adverse event: ____________________________________________________________________
Severity: Action taken:
Study medication dose changed*
(complete SAE form)
Change in Severity:
Date changed: _ _/ _ _ _/ _ _ _ _ Date changed: _ _/ _ _ _/ _ _ _ _
Relationship to
trial treatment: Outcome:
Effect
* Please give details
Additional Notes:
Date started: _ _/ _ _ _/ _ _ _ _ Date resolved: _ _/ _ _ _/ _ _ _ _
Describe adverse event: ____________________________________________________________________
Severity: Action taken:
(complete SAE form)
Change in Severity:
Date changed: _ _/ _ _ _/ _ _ _ _ Date changed: _ _/ _ _ _/ _ _ _ _
Relationship to
trial treatment: Outcome:
* Please give details
Additional Notes:
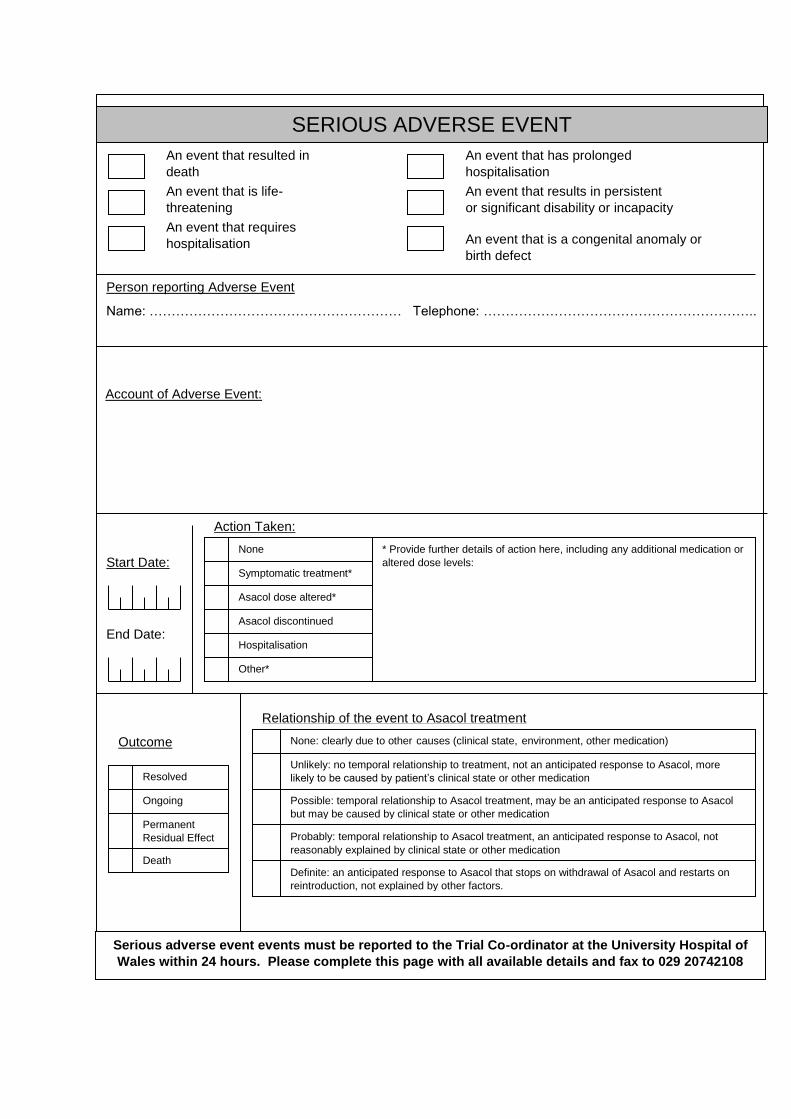
SERIOUS ADVERSE EVENT
Action Taken:
Relationship of the event to Asacol treatment
None: clearly due to other causes (clinical state, environment, other medication)
Unlikely: no temporal relationship to treatment, not an anticipated response to Asacol, more
likely to be caused by patient’s clinical state or other medication
Possible: temporal relationship to Asacol treatment, may be an anticipated response to Asacol
but may be caused by clinical state or other medication
Probably: temporal relationship to Asacol treatment, an anticipated response to Asacol, not
reasonably explained by clinical state or other medication
Definite: an anticipated response to Asacol that stops on withdrawal of Asacol and restarts on
reintroduction, not explained by other factors.
Ongoing
Permanent
Residual Effect
Death
None
Symptomatic treatment*
Asacol dose altered*
Asacol discontinued
Hospitalisation
Other*
An event that resulted in
death
An event that is life-
threatening
An event that requires
hospitalisation
An event that has prolonged
hospitalisation
An event that results in persistent
or significant disability or incapacity
An event that is a congenital anomaly or
birth defect
Person reporting Adverse Event
Name: ………………………………………………… Telephone: ……………………………………………………..
Outcome
Start Date:
End Date:
Resolved
* Provide further details of action here, including any additional medication or
altered dose levels:
Account of Adverse Event:
Serious adverse event events must be reported to the Trial Co-ordinator at the University Hospital of
Wales within 24 hours. Please complete this page with all available details and fax to 029 20742108

Appendix III – Description of variables collected as part of the ZICE
study
Registration:
doreg Registration Date
rptini Patient Initials
rdob Date of Birth
rpatid Patient Trial No
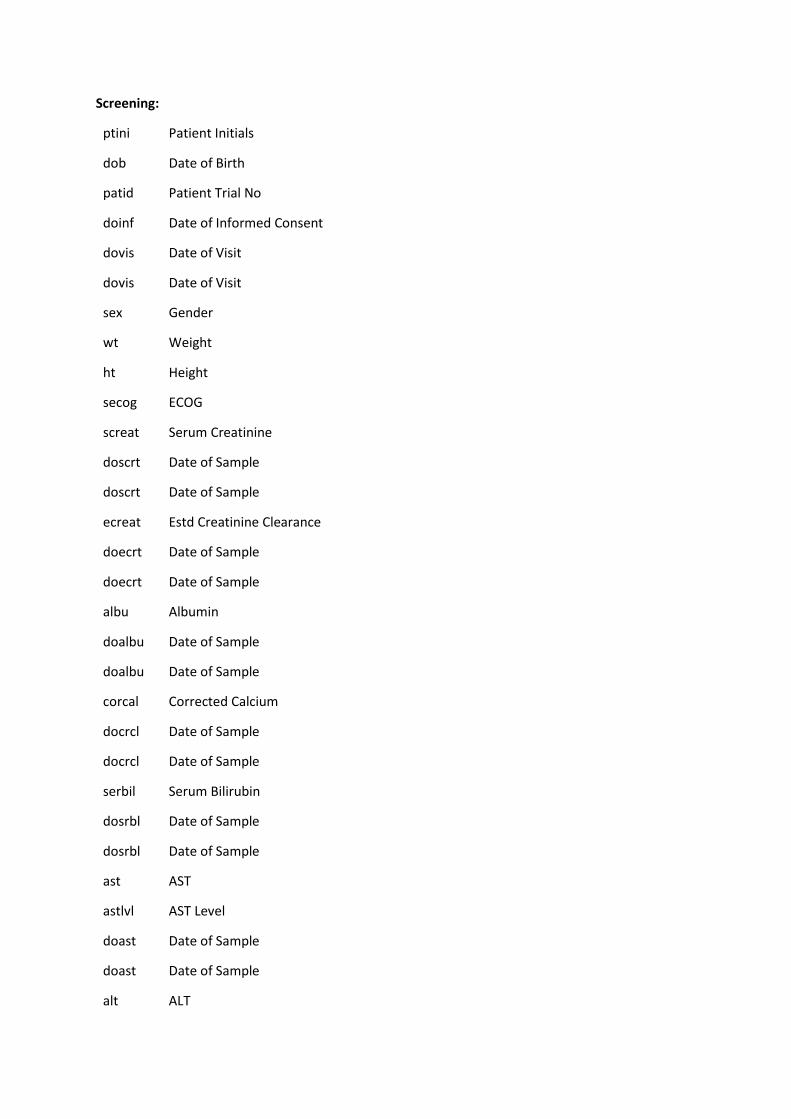
Screening:
ptini Patient Initials
dob Date of Birth
patid Patient Trial No
doinf Date of Informed Consent
dovis Date of Visit
dovis Date of Visit
sex Gender
wt Weight
ht Height
secog ECOG
screat Serum Creatinine
doscrt Date of Sample
doscrt Date of Sample
ecreat Estd Creatinine Clearance
doecrt Date of Sample
doecrt Date of Sample
albu Albumin
doalbu Date of Sample
doalbu Date of Sample
corcal Corrected Calcium
docrcl Date of Sample
docrcl Date of Sample
serbil Serum Bilirubin
dosrbl Date of Sample
dosrbl Date of Sample
ast AST
astlvl AST Level
doast Date of Sample
doast Date of Sample
alt ALT
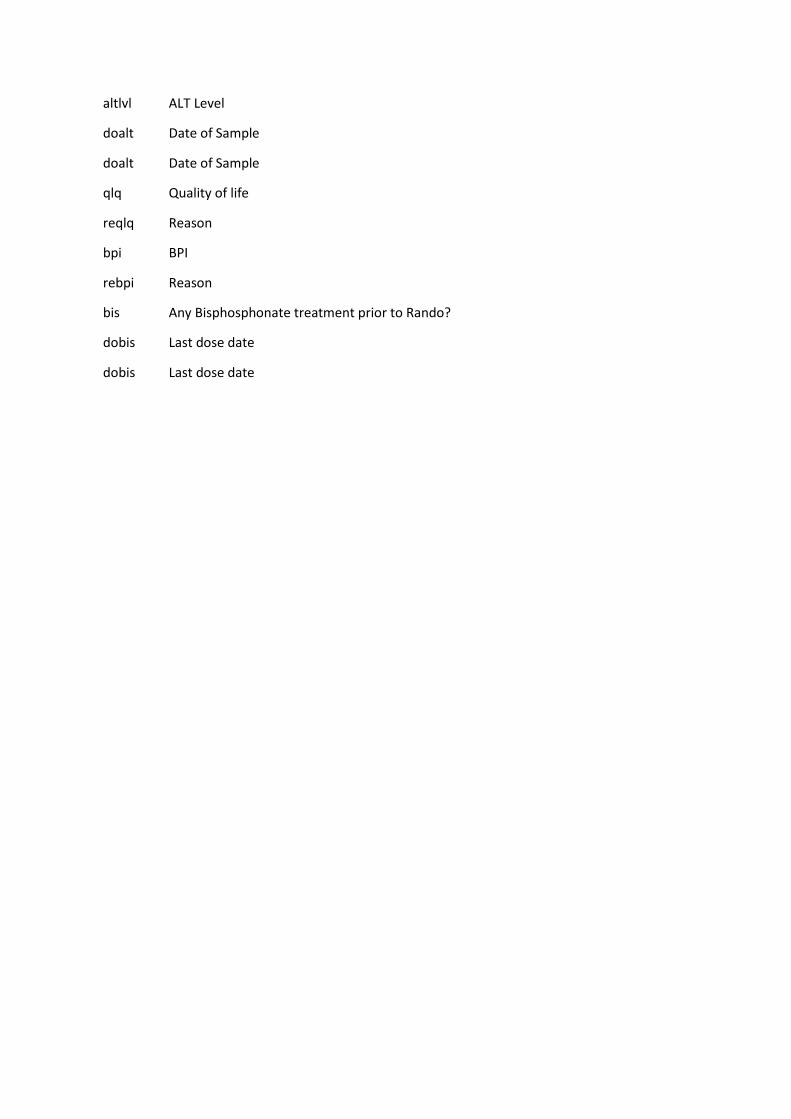
altlvl ALT Level
doalt Date of Sample
doalt Date of Sample
qlq Quality of life
reqlq Reason
bpi BPI
rebpi Reason
bis Any Bisphosphonate treatment prior to Rando?
dobis Last dose date
dobis Last dose date
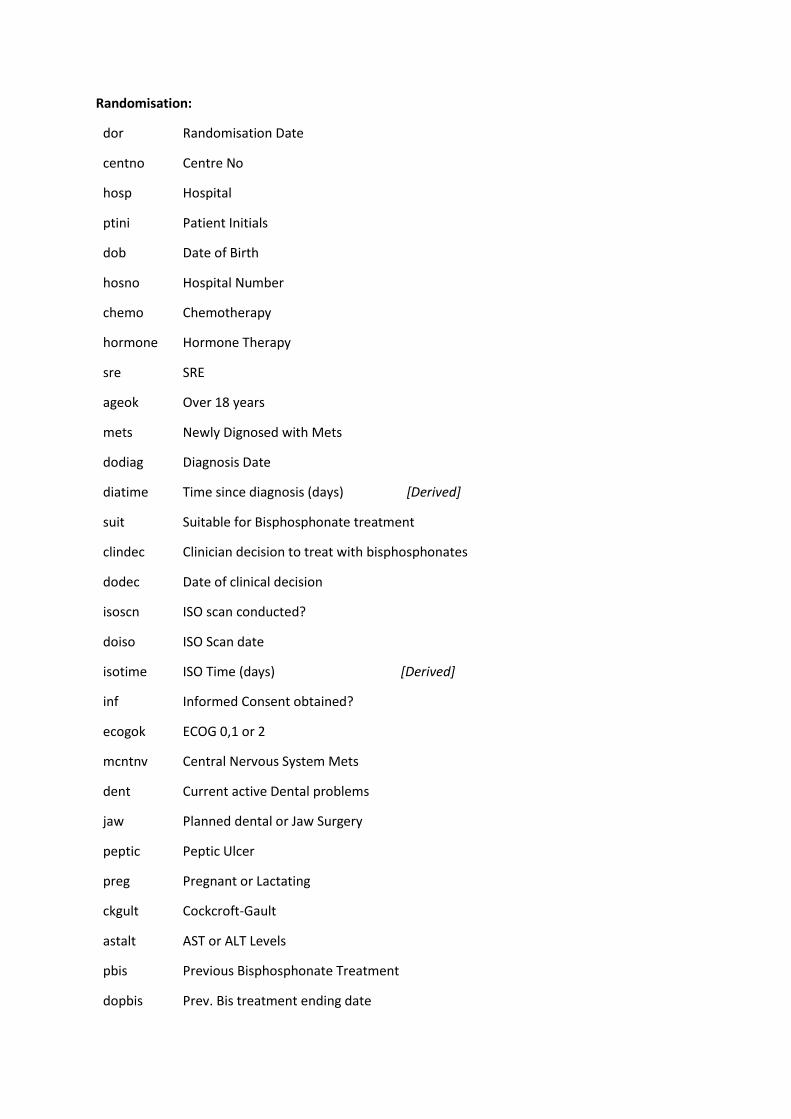
Randomisation:
dor Randomisation Date
centno Centre No
hosp Hospital
ptini Patient Initials
dob Date of Birth
hosno Hospital Number
chemo Chemotherapy
hormone Hormone Therapy
sre SRE
ageok Over 18 years
mets Newly Dignosed with Mets
dodiag Diagnosis Date
diatime Time since diagnosis (days) [Derived]
suit Suitable for Bisphosphonate treatment
clindec Clinician decision to treat with bisphosphonates
dodec Date of clinical decision
isoscn ISO scan conducted?
doiso ISO Scan date
isotime ISO Time (days) [Derived]
inf Informed Consent obtained?
ecogok ECOG 0,1 or 2
mcntnv Central Nervous System Mets
dent Current active Dental problems
jaw Planned dental or Jaw Surgery
peptic Peptic Ulcer
preg Pregnant or Lactating
ckgult Cockcroft-Gault
astalt AST or ALT Levels
pbis Previous Bisphosphonate Treatment
dopbis Prev. Bis treatment ending date

dopbis Prev. Bis treatment ending date
pbistime Prv.Bis.treatment ending time (days) [Derived]
uncomp Unable to comply with instructions to study med
hypbis Hypersensitivity to bisphosphonates
patid Patient Trial No
treat Treatment allocated

Baseline and disease history:
patid Patient Trial No
dobrst Date of diagnosis of Breast Cancer
dobrst Date of diagnosis of Breast Cancer
dobrst Date of diagnosis of Breast Cancer
erstat ER Status
prstat PR Status
herstat HER-2 Status
menstat Current menstrual status
ajchmo Adjuvant chemotherapy
ajendo Adjuvant endocrine therapy
ajtras Adjuvant Trastuzumab
locrec Local recurrence
recsite If Yes, first site
recspec Specify
dorec Date of diagnosis
pmets Previous history of mets
dopmet Date of Diagnosis
dopmet Date of Diagnosis
frsite First Site(s) [Repeated]
othsite Specify [Repeated]
metcur Current Bone Mets [Repeated]
metoth Specify [Repeated]
bassre Any SRE(s) in previous 3 months
radpln Previous or planned radiotherapy for bone mets
ortsur Orthopaedic surgery for bone mets
symfrac Symptomatic vertebral fracture
patfrac Pathological non-vertebral fracture
spicom Spinal cord compression
hyper Hypercalcaemia
dothxy Date of Thoracic Spine Xray
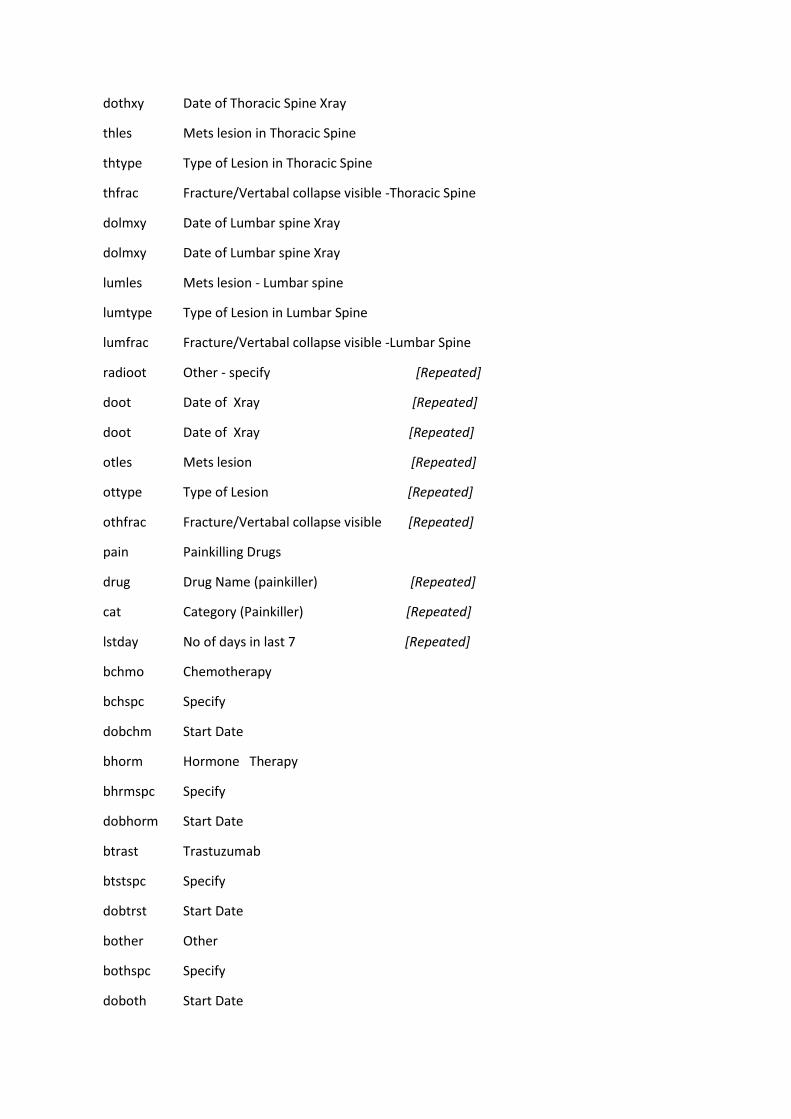
dothxy Date of Thoracic Spine Xray
thles Mets lesion in Thoracic Spine
thtype Type of Lesion in Thoracic Spine
thfrac Fracture/Vertabal collapse visible -Thoracic Spine
dolmxy Date of Lumbar spine Xray
dolmxy Date of Lumbar spine Xray
lumles Mets lesion - Lumbar spine
lumtype Type of Lesion in Lumbar Spine
lumfrac Fracture/Vertabal collapse visible -Lumbar Spine
radioot Other - specify [Repeated]
doot Date of Xray [Repeated]
doot Date of Xray [Repeated]
otles Mets lesion [Repeated]
ottype Type of Lesion [Repeated]
othfrac Fracture/Vertabal collapse visible [Repeated]
pain Painkilling Drugs
drug Drug Name (painkiller) [Repeated]
cat Category (Painkiller) [Repeated]
lstday No of days in last 7 [Repeated]
bchmo Chemotherapy
bchspc Specify
dobchm Start Date
bhorm Hormone Therapy
bhrmspc Specify
dobhorm Start Date
btrast Trastuzumab
btstspc Specify
dobtrst Start Date
bother Other
bothspc Specify
doboth Start Date

otdrug Patient on any other medication inc antiemetics
bdrug Drug Name [Repeated]
dobdrug Start Date [Repeated]
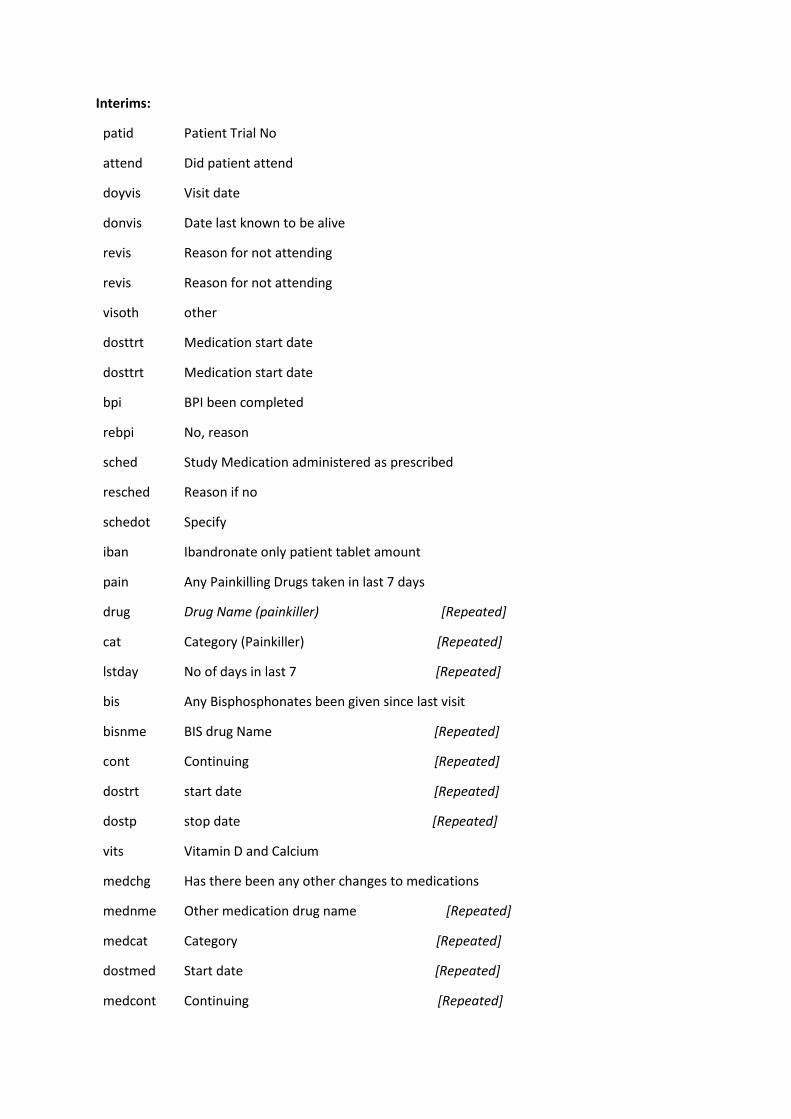
Interims:
patid Patient Trial No
attend Did patient attend
doyvis Visit date
donvis Date last known to be alive
revis Reason for not attending
revis Reason for not attending
visoth other
dosttrt Medication start date
dosttrt Medication start date
bpi BPI been completed
rebpi No, reason
sched Study Medication administered as prescribed
resched Reason if no
schedot Specify
iban Ibandronate only patient tablet amount
pain Any Painkilling Drugs taken in last 7 days
drug Drug Name (painkiller) [Repeated]
cat Category (Painkiller) [Repeated]
lstday No of days in last 7 [Repeated]
bis Any Bisphosphonates been given since last visit
bisnme BIS drug Name [Repeated]
cont Continuing [Repeated]
dostrt start date [Repeated]
dostp stop date [Repeated]
vits Vitamin D and Calcium
medchg Has there been any other changes to medications
mednme Other medication drug name [Repeated]
medcat Category [Repeated]
dostmed Start date [Repeated]
medcont Continuing [Repeated]
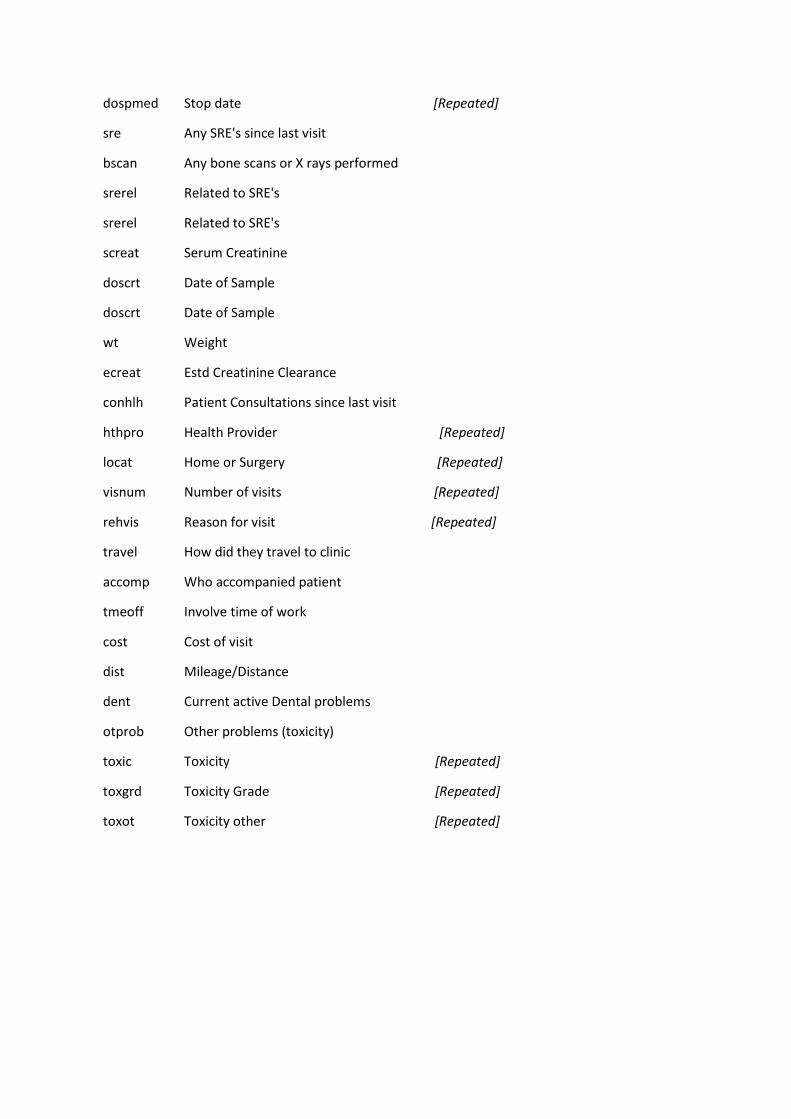
dospmed Stop date [Repeated]
sre Any SRE's since last visit
bscan Any bone scans or X rays performed
srerel Related to SRE's
srerel Related to SRE's
screat Serum Creatinine
doscrt Date of Sample
doscrt Date of Sample
wt Weight
ecreat Estd Creatinine Clearance
conhlh Patient Consultations since last visit
hthpro Health Provider [Repeated]
locat Home or Surgery [Repeated]
visnum Number of visits [Repeated]
rehvis Reason for visit [Repeated]
travel How did they travel to clinic
accomp Who accompanied patient
tmeoff Involve time of work
cost Cost of visit
dist Mileage/Distance
dent Current active Dental problems
otprob Other problems (toxicity)
toxic Toxicity [Repeated]
toxgrd Toxicity Grade [Repeated]
toxot Toxicity other [Repeated]
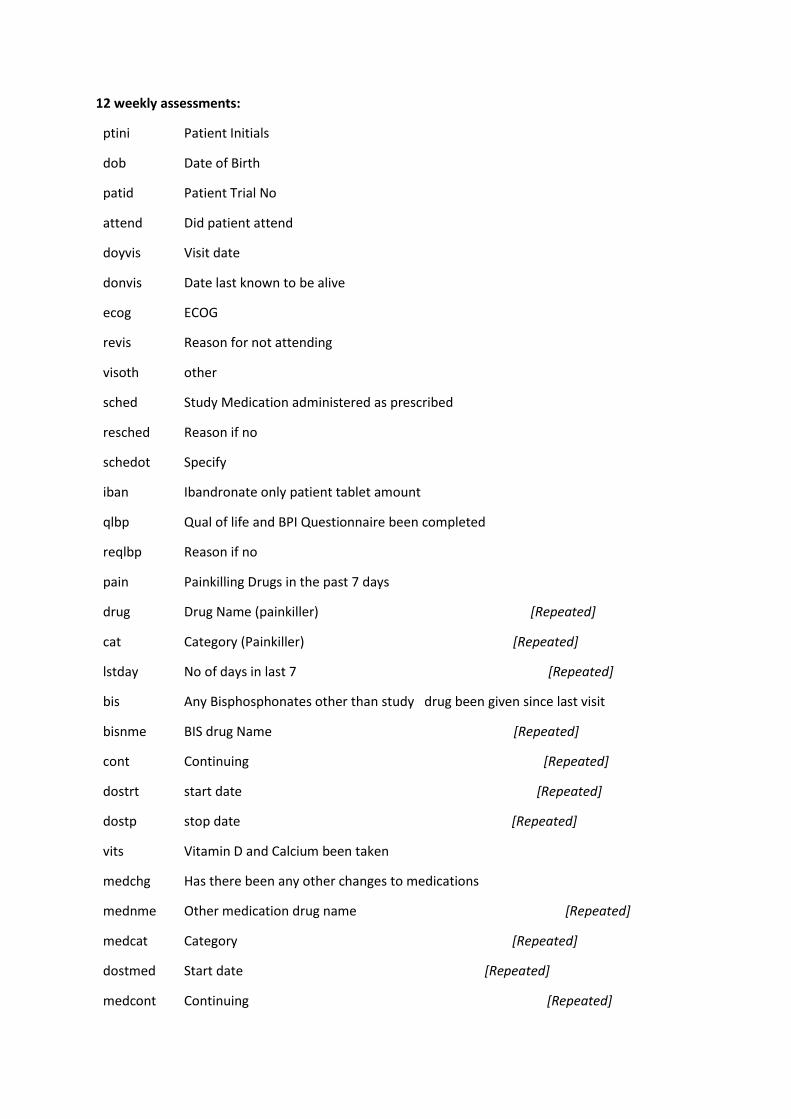
12 weekly assessments:
ptini Patient Initials
dob Date of Birth
patid Patient Trial No
attend Did patient attend
doyvis Visit date
donvis Date last known to be alive
ecog ECOG
revis Reason for not attending
visoth other
sched Study Medication administered as prescribed
resched Reason if no
schedot Specify
iban Ibandronate only patient tablet amount
qlbp Qual of life and BPI Questionnaire been completed
reqlbp Reason if no
pain Painkilling Drugs in the past 7 days
drug Drug Name (painkiller) [Repeated]
cat Category (Painkiller) [Repeated]
lstday No of days in last 7 [Repeated]
bis Any Bisphosphonates other than study drug been given since last visit
bisnme BIS drug Name [Repeated]
cont Continuing [Repeated]
dostrt start date [Repeated]
dostp stop date [Repeated]
vits Vitamin D and Calcium been taken
medchg Has there been any other changes to medications
mednme Other medication drug name [Repeated]
medcat Category [Repeated]
dostmed Start date [Repeated]
medcont Continuing [Repeated]
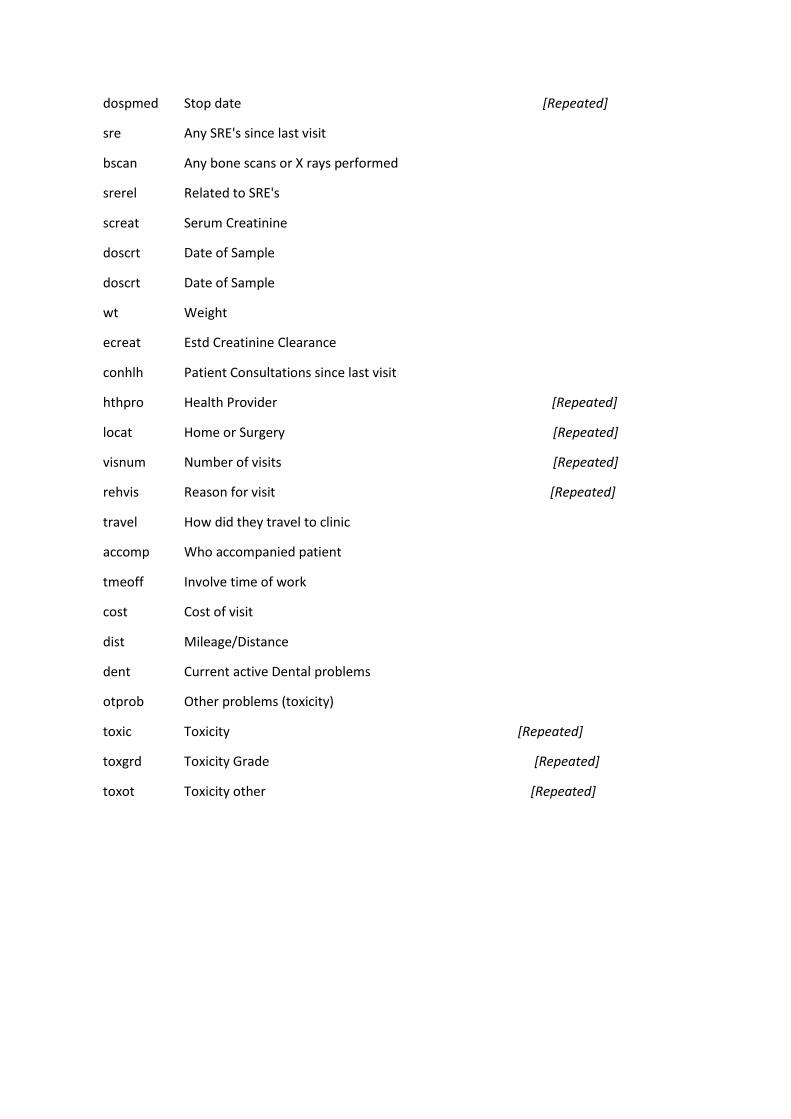
dospmed Stop date [Repeated]
sre Any SRE's since last visit
bscan Any bone scans or X rays performed
srerel Related to SRE's
screat Serum Creatinine
doscrt Date of Sample
doscrt Date of Sample
wt Weight
ecreat Estd Creatinine Clearance
conhlh Patient Consultations since last visit
hthpro Health Provider [Repeated]
locat Home or Surgery [Repeated]
visnum Number of visits [Repeated]
rehvis Reason for visit [Repeated]
travel How did they travel to clinic
accomp Who accompanied patient
tmeoff Involve time of work
cost Cost of visit
dist Mileage/Distance
dent Current active Dental problems
otprob Other problems (toxicity)
toxic Toxicity [Repeated]
toxgrd Toxicity Grade [Repeated]
toxot Toxicity other [Repeated]
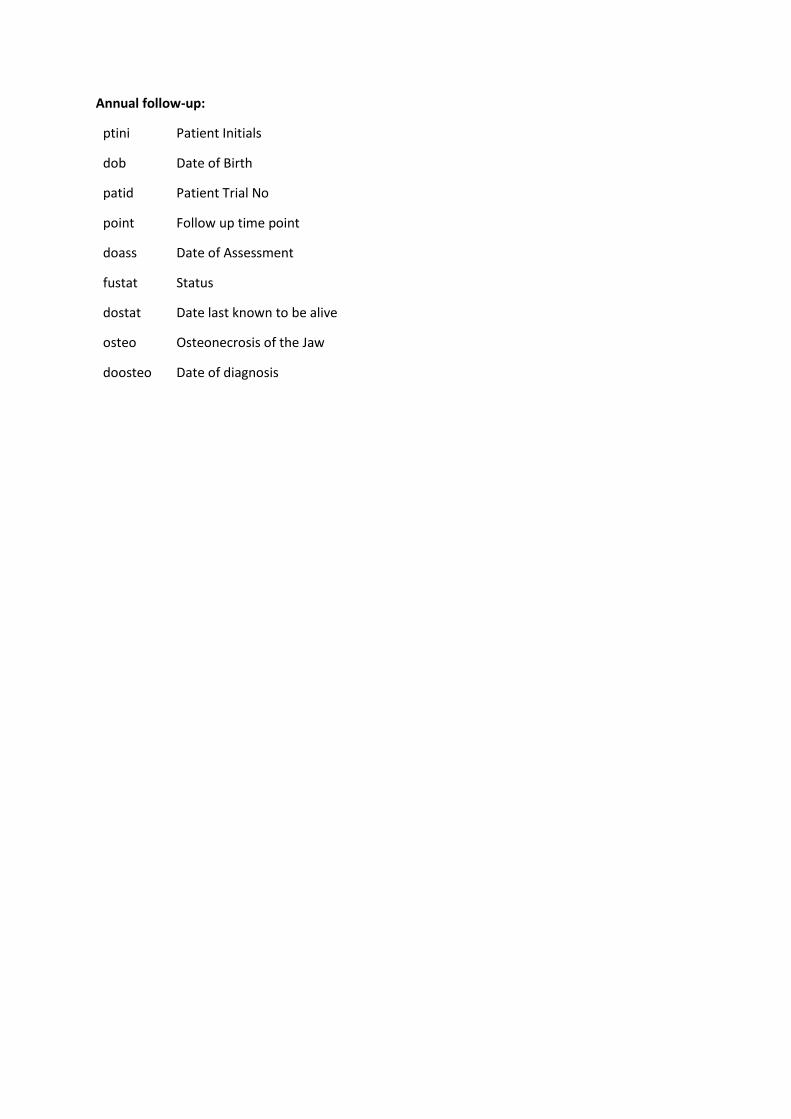
Annual follow-up:
ptini Patient Initials
dob Date of Birth
patid Patient Trial No
point Follow up time point
doass Date of Assessment
fustat Status
dostat Date last known to be alive
osteo Osteonecrosis of the Jaw
doosteo Date of diagnosis
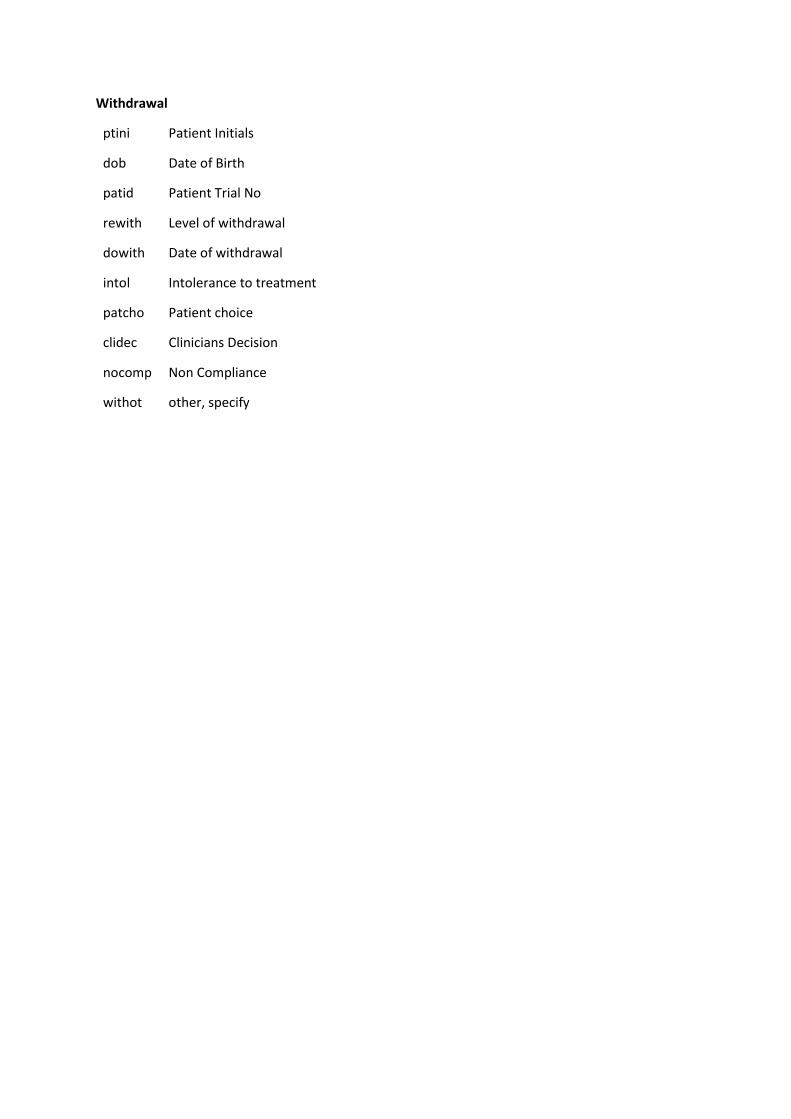
Withdrawal
ptini Patient Initials
dob Date of Birth
patid Patient Trial No
rewith Level of withdrawal
dowith Date of withdrawal
intol Intolerance to treatment
patcho Patient choice
clidec Clinicians Decision
nocomp Non Compliance
withot other, specify
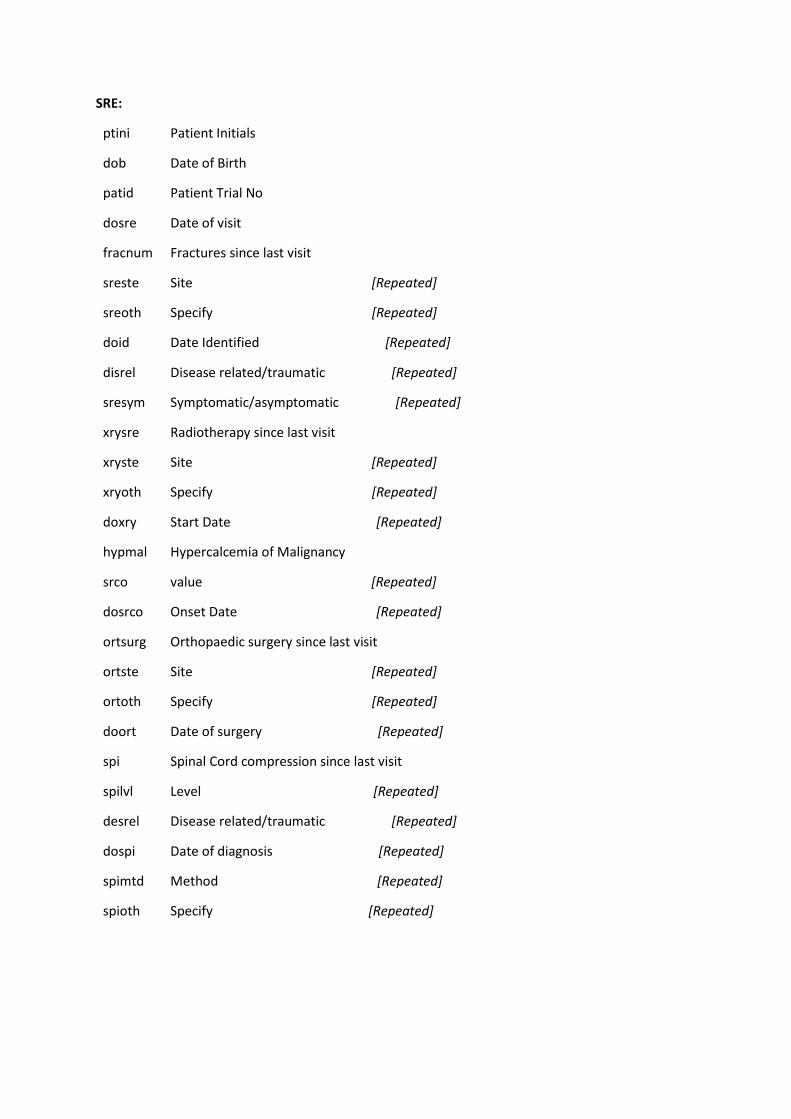
SRE:
ptini Patient Initials
dob Date of Birth
patid Patient Trial No
dosre Date of visit
fracnum Fractures since last visit
sreste Site [Repeated]
sreoth Specify [Repeated]
doid Date Identified [Repeated]
disrel Disease related/traumatic [Repeated]
sresym Symptomatic/asymptomatic [Repeated]
xrysre Radiotherapy since last visit
xryste Site [Repeated]
xryoth Specify [Repeated]
doxry Start Date [Repeated]
hypmal Hypercalcemia of Malignancy
srco value [Repeated]
dosrco Onset Date [Repeated]
ortsurg Orthopaedic surgery since last visit
ortste Site [Repeated]
ortoth Specify [Repeated]
doort Date of surgery [Repeated]
spi Spinal Cord compression since last visit
spilvl Level [Repeated]
desrel Disease related/traumatic [Repeated]
dospi Date of diagnosis [Repeated]
spimtd Method [Repeated]
spioth Specify [Repeated]
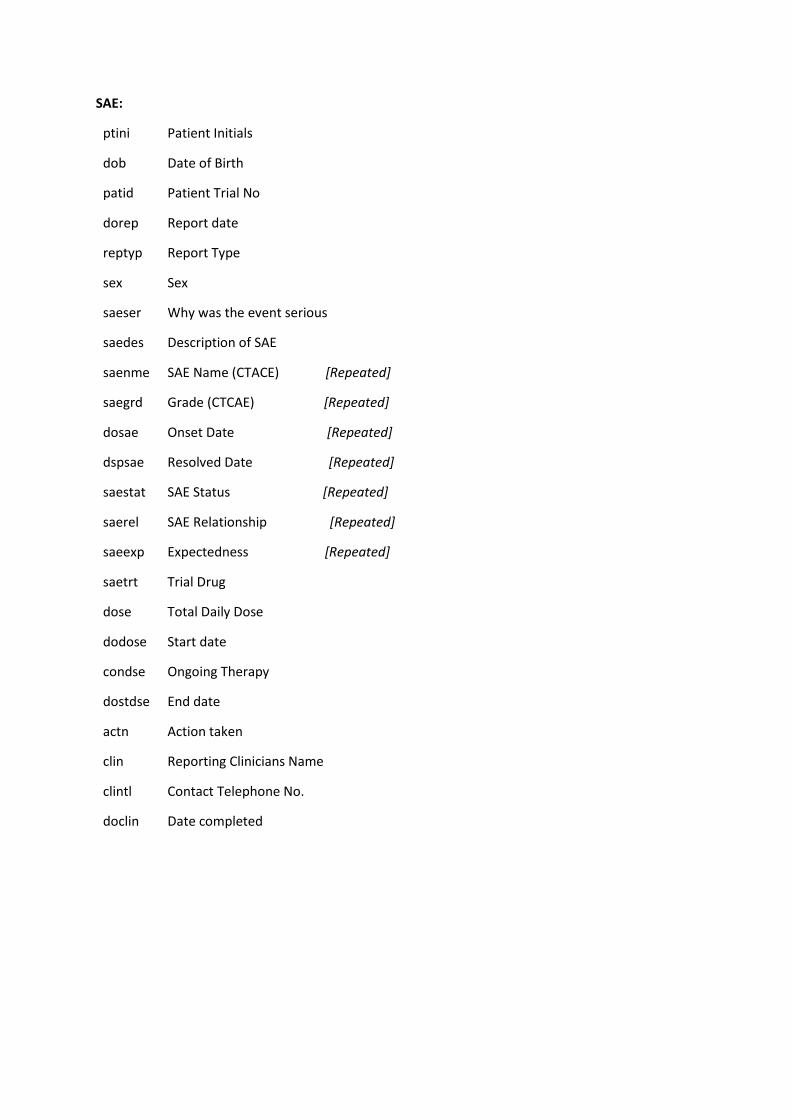
SAE:
ptini Patient Initials
dob Date of Birth
patid Patient Trial No
dorep Report date
reptyp Report Type
sex Sex
saeser Why was the event serious
saedes Description of SAE
saenme SAE Name (CTACE) [Repeated]
saegrd Grade (CTCAE) [Repeated]
dosae Onset Date [Repeated]
dspsae Resolved Date [Repeated]
saestat SAE Status [Repeated]
saerel SAE Relationship [Repeated]
saeexp Expectedness [Repeated]
saetrt Trial Drug
dose Total Daily Dose
dodose Start date
condse Ongoing Therapy
dostdse End date
actn Action taken
clin Reporting Clinicians Name
clintl Contact Telephone No.
doclin Date completed
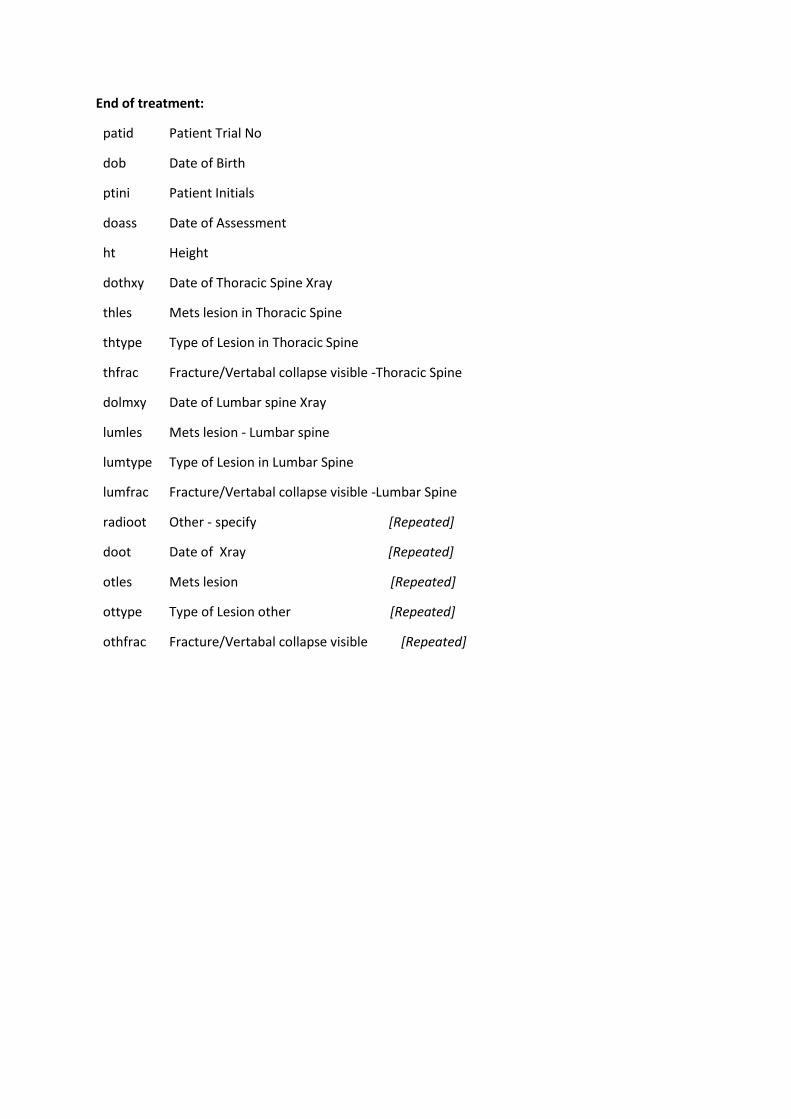
End of treatment:
patid Patient Trial No
dob Date of Birth
ptini Patient Initials
doass Date of Assessment
ht Height
dothxy Date of Thoracic Spine Xray
thles Mets lesion in Thoracic Spine
thtype Type of Lesion in Thoracic Spine
thfrac Fracture/Vertabal collapse visible -Thoracic Spine
dolmxy Date of Lumbar spine Xray
lumles Mets lesion - Lumbar spine
lumtype Type of Lesion in Lumbar Spine
lumfrac Fracture/Vertabal collapse visible -Lumbar Spine
radioot Other - specify [Repeated]
doot Date of Xray [Repeated]
otles Mets lesion [Repeated]
ottype Type of Lesion other [Repeated]
othfrac Fracture/Vertabal collapse visible [Repeated]

Death:
ptini Patient Initials
dob Date of Birth
patid Patient Trial No
dod Date of death
cause Primary Cause of death
cseoth Specify
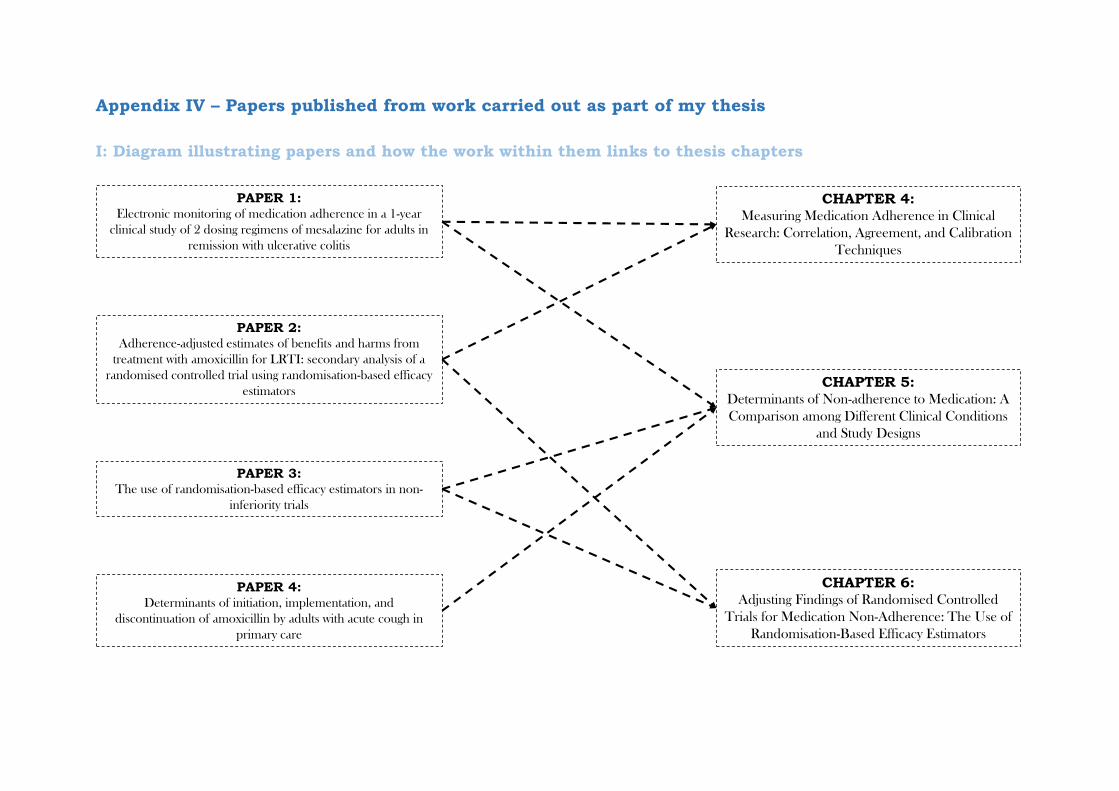
Appendix IV – Papers published from work carried out as part of my thesis
I: Diagram illustrating papers and how the work within them links to thesis chapters
CHAPTER 4: Measuring Medication Adherence in Clinical
Research: Correlation, Agreement, and Calibration
Techniques
CHAPTER 5: Determinants of Non-adherence to Medication: A
Comparison among Different Clinical Conditions
and Study Designs
CHAPTER 6: Adjusting Findings of Randomised Controlled
Trials for Medication Non-Adherence: The Use of
Randomisation-Based Efficacy Estimators
PAPER 1: Electronic monitoring of medication adherence in a 1-year
clinical study of 2 dosing regimens of mesalazine for adults in
remission with ulcerative colitis
PAPER 2: Adherence-adjusted estimates of benefits and harms from
treatment with amoxicillin for LRTI: secondary analysis of a
randomised controlled trial using randomisation-based efficacy
estimators
PAPER 3: The use of randomisation-based efficacy estimators in non-
inferiority trials
PAPER 4: Determinants of initiation, implementation, and
discontinuation of amoxicillin by adults with acute cough in
primary care
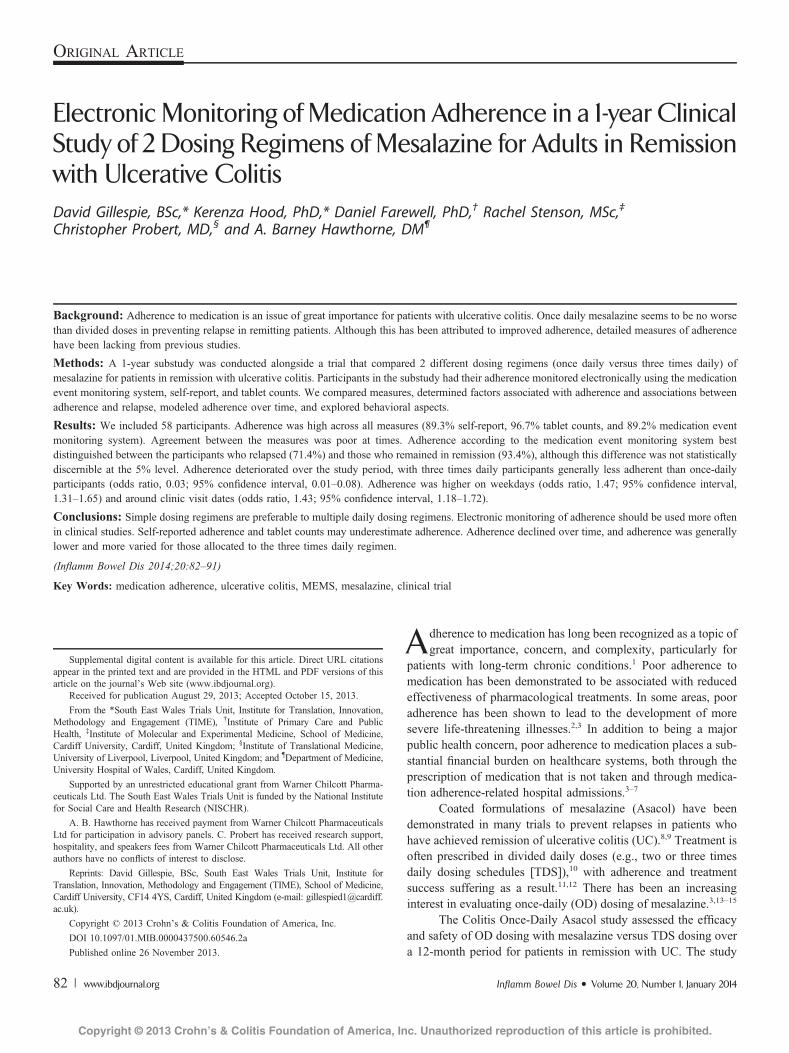
ORIGINAL ARTICLE
Electronic Monitoring of Medication Adherence in a 1-year ClinicalStudy of 2 Dosing Regimens of Mesalazine for Adults in Remissionwith Ulcerative ColitisDavid Gillespie, BSc,* Kerenza Hood, PhD,* Daniel Farewell, PhD,† Rachel Stenson, MSc,‡
Christopher Probert, MD,§ and A. Barney Hawthorne, DM¶
Background: Adherence to medication is an issue of great importance for patients with ulcerative colitis. Once daily mesalazine seems to be no worsethan divided doses in preventing relapse in remitting patients. Although this has been attributed to improved adherence, detailed measures of adherencehave been lacking from previous studies.
Methods: A 1-year substudy was conducted alongside a trial that compared 2 different dosing regimens (once daily versus three times daily) ofmesalazine for patients in remission with ulcerative colitis. Participants in the substudy had their adherence monitored electronically using the medicationevent monitoring system, self-report, and tablet counts. We compared measures, determined factors associated with adherence and associations betweenadherence and relapse, modeled adherence over time, and explored behavioral aspects.
Results: We included 58 participants. Adherence was high across all measures (89.3% self-report, 96.7% tablet counts, and 89.2% medication eventmonitoring system). Agreement between the measures was poor at times. Adherence according to the medication event monitoring system bestdistinguished between the participants who relapsed (71.4%) and those who remained in remission (93.4%), although this difference was not statisticallydiscernible at the 5% level. Adherence deteriorated over the study period, with three times daily participants generally less adherent than once-dailyparticipants (odds ratio, 0.03; 95% confidence interval, 0.01–0.08). Adherence was higher on weekdays (odds ratio, 1.47; 95% confidence interval,1.31–1.65) and around clinic visit dates (odds ratio, 1.43; 95% confidence interval, 1.18–1.72).
Conclusions: Simple dosing regimens are preferable to multiple daily dosing regimens. Electronic monitoring of adherence should be used more oftenin clinical studies. Self-reported adherence and tablet counts may underestimate adherence. Adherence declined over time, and adherence was generallylower and more varied for those allocated to the three times daily regimen.
(Inflamm Bowel Dis 2014;20:82–91)
Key Words: medication adherence, ulcerative colitis, MEMS, mesalazine, clinical trial
A dherence to medication has long been recognized as a topic ofgreat importance, concern, and complexity, particularly for
patients with long-term chronic conditions.1 Poor adherence tomedication has been demonstrated to be associated with reducedeffectiveness of pharmacological treatments. In some areas, pooradherence has been shown to lead to the development of moresevere life-threatening illnesses.2,3 In addition to being a majorpublic health concern, poor adherence to medication places a sub-stantial financial burden on healthcare systems, both through theprescription of medication that is not taken and through medica-tion adherence-related hospital admissions.3–7
Coated formulations of mesalazine (Asacol) have beendemonstrated in many trials to prevent relapses in patients whohave achieved remission of ulcerative colitis (UC).8,9 Treatment isoften prescribed in divided daily doses (e.g., two or three timesdaily dosing schedules [TDS]),10 with adherence and treatmentsuccess suffering as a result.11,12 There has been an increasinginterest in evaluating once-daily (OD) dosing of mesalazine.3,13–15
The Colitis Once-Daily Asacol study assessed the efficacyand safety of OD dosing with mesalazine versus TDS dosing overa 12-month period for patients in remission with UC. The study
Supplemental digital content is available for this article. Direct URL citationsappear in the printed text and are provided in the HTML and PDF versions of thisarticle on the journal’s Web site (www.ibdjournal.org).
Received for publication August 29, 2013; Accepted October 15, 2013.
From the *South East Wales Trials Unit, Institute for Translation, Innovation,Methodology and Engagement (TIME), †Institute of Primary Care and PublicHealth, ‡Institute of Molecular and Experimental Medicine, School of Medicine,Cardiff University, Cardiff, United Kingdom; §Institute of Translational Medicine,University of Liverpool, Liverpool, United Kingdom; and ¶Department of Medicine,University Hospital of Wales, Cardiff, United Kingdom.
Supported by an unrestricted educational grant from Warner Chilcott Pharma-ceuticals Ltd. The South East Wales Trials Unit is funded by the National Institutefor Social Care and Health Research (NISCHR).
A. B. Hawthorne has received payment from Warner Chilcott PharmaceuticalsLtd for participation in advisory panels. C. Probert has received research support,hospitality, and speakers fees from Warner Chilcott Pharmaceuticals Ltd. All otherauthors have no conflicts of interest to disclose.
Reprints: David Gillespie, BSc, South East Wales Trials Unit, Institute forTranslation, Innovation, Methodology and Engagement (TIME), School of Medicine,Cardiff University, CF14 4YS, Cardiff, United Kingdom (e-mail: [email protected]).
Copyright © 2013 Crohn’s & Colitis Foundation of America, Inc.
DOI 10.1097/01.MIB.0000437500.60546.2a
Published online 26 November 2013.
82 | www.ibdjournal.org Inflamm Bowel Dis � Volume 20, Number 1, January 2014
Copyright © 2013 Crohn’s & Colitis Foundation of America, Inc. Unauthorized reproduction of this article is prohibited.
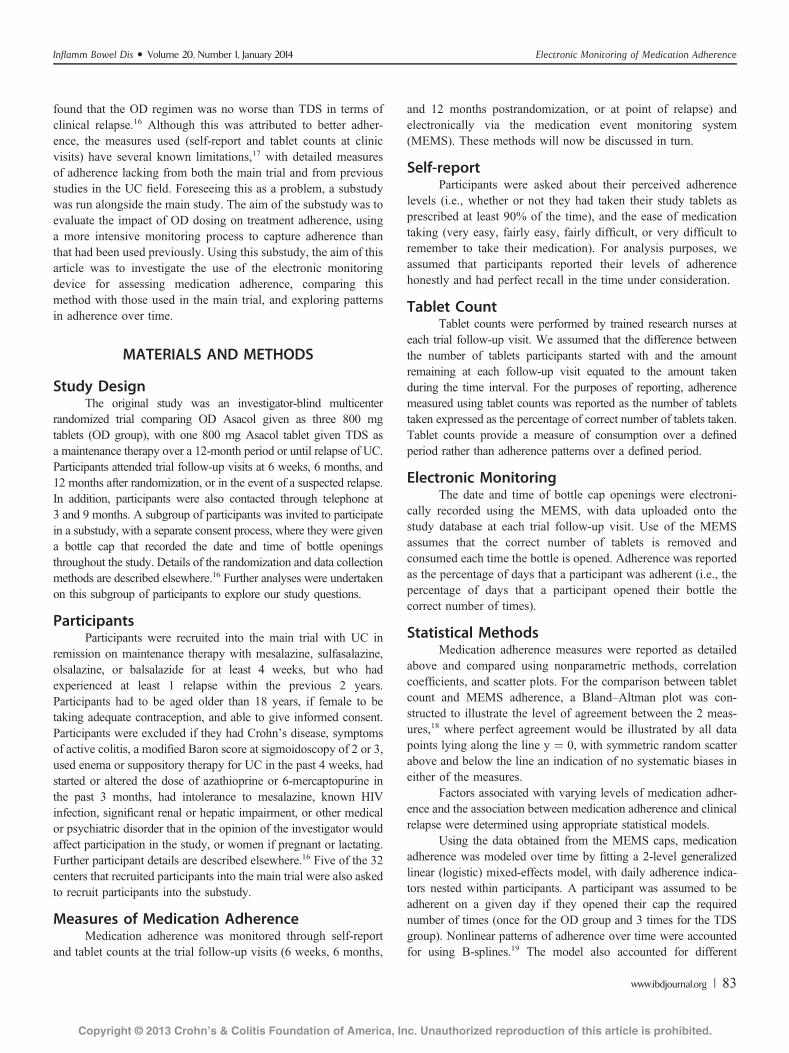
found that the OD regimen was no worse than TDS in terms ofclinical relapse.16 Although this was attributed to better adher-ence, the measures used (self-report and tablet counts at clinicvisits) have several known limitations,17 with detailed measuresof adherence lacking from both the main trial and from previousstudies in the UC field. Foreseeing this as a problem, a substudywas run alongside the main study. The aim of the substudy was toevaluate the impact of OD dosing on treatment adherence, usinga more intensive monitoring process to capture adherence thanthat had been used previously. Using this substudy, the aim of thisarticle was to investigate the use of the electronic monitoringdevice for assessing medication adherence, comparing thismethod with those used in the main trial, and exploring patternsin adherence over time.
MATERIALS AND METHODS
Study DesignThe original study was an investigator-blind multicenter
randomized trial comparing OD Asacol given as three 800 mgtablets (OD group), with one 800 mg Asacol tablet given TDS asa maintenance therapy over a 12-month period or until relapse of UC.Participants attended trial follow-up visits at 6 weeks, 6 months, and12 months after randomization, or in the event of a suspected relapse.In addition, participants were also contacted through telephone at3 and 9 months. A subgroup of participants was invited to participatein a substudy, with a separate consent process, where they were givena bottle cap that recorded the date and time of bottle openingsthroughout the study. Details of the randomization and data collectionmethods are described elsewhere.16 Further analyses were undertakenon this subgroup of participants to explore our study questions.
ParticipantsParticipants were recruited into the main trial with UC in
remission on maintenance therapy with mesalazine, sulfasalazine,olsalazine, or balsalazide for at least 4 weeks, but who hadexperienced at least 1 relapse within the previous 2 years.Participants had to be aged older than 18 years, if female to betaking adequate contraception, and able to give informed consent.Participants were excluded if they had Crohn’s disease, symptomsof active colitis, a modified Baron score at sigmoidoscopy of 2 or 3,used enema or suppository therapy for UC in the past 4 weeks, hadstarted or altered the dose of azathioprine or 6-mercaptopurine inthe past 3 months, had intolerance to mesalazine, known HIVinfection, significant renal or hepatic impairment, or other medicalor psychiatric disorder that in the opinion of the investigator wouldaffect participation in the study, or women if pregnant or lactating.Further participant details are described elsewhere.16 Five of the 32centers that recruited participants into the main trial were also askedto recruit participants into the substudy.
Measures of Medication AdherenceMedication adherence was monitored through self-report
and tablet counts at the trial follow-up visits (6 weeks, 6 months,
and 12 months postrandomization, or at point of relapse) andelectronically via the medication event monitoring system(MEMS). These methods will now be discussed in turn.
Self-reportParticipants were asked about their perceived adherence
levels (i.e., whether or not they had taken their study tablets asprescribed at least 90% of the time), and the ease of medicationtaking (very easy, fairly easy, fairly difficult, or very difficult toremember to take their medication). For analysis purposes, weassumed that participants reported their levels of adherencehonestly and had perfect recall in the time under consideration.
Tablet CountTablet counts were performed by trained research nurses at
each trial follow-up visit. We assumed that the difference betweenthe number of tablets participants started with and the amountremaining at each follow-up visit equated to the amount takenduring the time interval. For the purposes of reporting, adherencemeasured using tablet counts was reported as the number of tabletstaken expressed as the percentage of correct number of tablets taken.Tablet counts provide a measure of consumption over a definedperiod rather than adherence patterns over a defined period.
Electronic MonitoringThe date and time of bottle cap openings were electroni-
cally recorded using the MEMS, with data uploaded onto thestudy database at each trial follow-up visit. Use of the MEMSassumes that the correct number of tablets is removed andconsumed each time the bottle is opened. Adherence was reportedas the percentage of days that a participant was adherent (i.e., thepercentage of days that a participant opened their bottle thecorrect number of times).
Statistical MethodsMedication adherence measures were reported as detailed
above and compared using nonparametric methods, correlationcoefficients, and scatter plots. For the comparison between tabletcount and MEMS adherence, a Bland–Altman plot was con-structed to illustrate the level of agreement between the 2 meas-ures,18 where perfect agreement would be illustrated by all datapoints lying along the line y ¼ 0, with symmetric random scatterabove and below the line an indication of no systematic biases ineither of the measures.
Factors associated with varying levels of medication adher-ence and the association between medication adherence and clinicalrelapse were determined using appropriate statistical models.
Using the data obtained from the MEMS caps, medicationadherence was modeled over time by fitting a 2-level generalizedlinear (logistic) mixed-effects model, with daily adherence indica-tors nested within participants. A participant was assumed to beadherent on a given day if they opened their cap the requirednumber of times (once for the OD group and 3 times for the TDSgroup). Nonlinear patterns of adherence over time were accountedfor using B-splines.19 The model also accounted for different
Inflamm Bowel Dis � Volume 20, Number 1, January 2014 Electronic Monitoring of Medication Adherence
www.ibdjournal.org | 83
Copyright © 2013 Crohn’s & Colitis Foundation of America, Inc. Unauthorized reproduction of this article is prohibited.
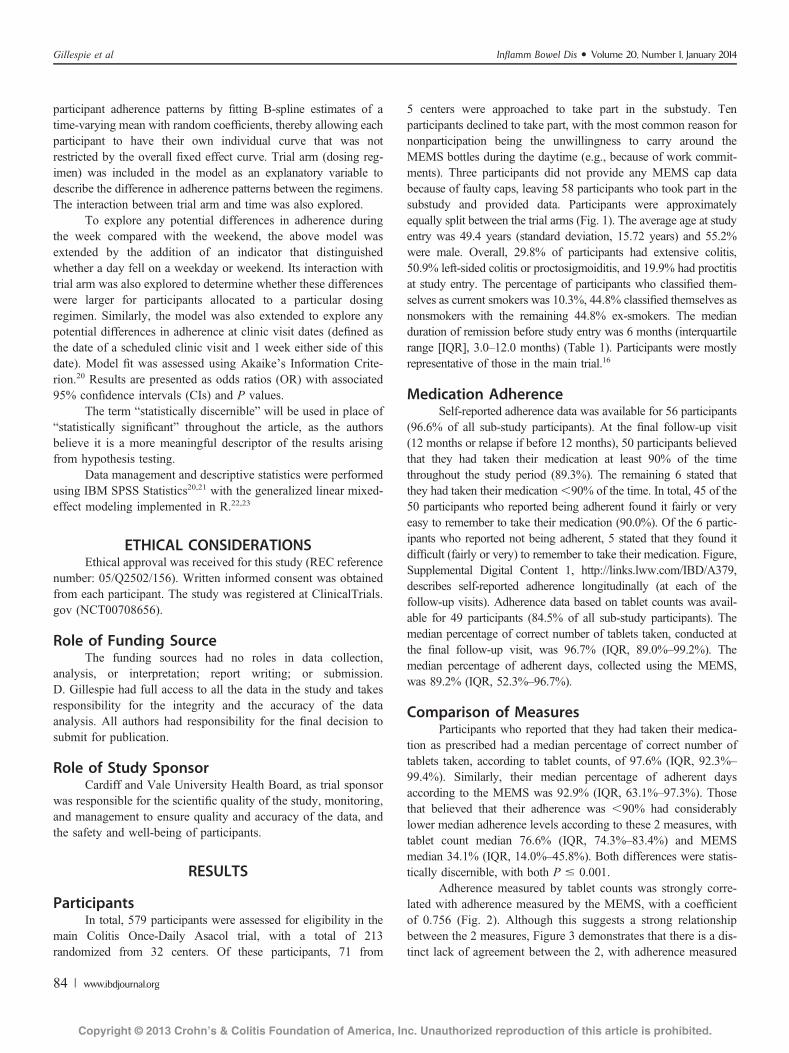
participant adherence patterns by fitting B-spline estimates of atime-varying mean with random coefficients, thereby allowing eachparticipant to have their own individual curve that was notrestricted by the overall fixed effect curve. Trial arm (dosing reg-imen) was included in the model as an explanatory variable todescribe the difference in adherence patterns between the regimens.The interaction between trial arm and time was also explored.
To explore any potential differences in adherence duringthe week compared with the weekend, the above model wasextended by the addition of an indicator that distinguishedwhether a day fell on a weekday or weekend. Its interaction withtrial arm was also explored to determine whether these differenceswere larger for participants allocated to a particular dosingregimen. Similarly, the model was also extended to explore anypotential differences in adherence at clinic visit dates (defined asthe date of a scheduled clinic visit and 1 week either side of thisdate). Model fit was assessed using Akaike’s Information Crite-rion.20 Results are presented as odds ratios (OR) with associated95% confidence intervals (CIs) and P values.
The term “statistically discernible” will be used in place of“statistically significant” throughout the article, as the authorsbelieve it is a more meaningful descriptor of the results arisingfrom hypothesis testing.
Data management and descriptive statistics were performedusing IBM SPSS Statistics20,21 with the generalized linear mixed-effect modeling implemented in R.22,23
ETHICAL CONSIDERATIONSEthical approval was received for this study (REC reference
number: 05/Q2502/156). Written informed consent was obtainedfrom each participant. The study was registered at ClinicalTrials.gov (NCT00708656).
Role of Funding SourceThe funding sources had no roles in data collection,
analysis, or interpretation; report writing; or submission.D. Gillespie had full access to all the data in the study and takesresponsibility for the integrity and the accuracy of the dataanalysis. All authors had responsibility for the final decision tosubmit for publication.
Role of Study SponsorCardiff and Vale University Health Board, as trial sponsor
was responsible for the scientific quality of the study, monitoring,and management to ensure quality and accuracy of the data, andthe safety and well-being of participants.
RESULTS
ParticipantsIn total, 579 participants were assessed for eligibility in the
main Colitis Once-Daily Asacol trial, with a total of 213randomized from 32 centers. Of these participants, 71 from
5 centers were approached to take part in the substudy. Tenparticipants declined to take part, with the most common reason fornonparticipation being the unwillingness to carry around theMEMS bottles during the daytime (e.g., because of work commit-ments). Three participants did not provide any MEMS cap databecause of faulty caps, leaving 58 participants who took part in thesubstudy and provided data. Participants were approximatelyequally split between the trial arms (Fig. 1). The average age at studyentry was 49.4 years (standard deviation, 15.72 years) and 55.2%were male. Overall, 29.8% of participants had extensive colitis,50.9% left-sided colitis or proctosigmoiditis, and 19.9% had proctitisat study entry. The percentage of participants who classified them-selves as current smokers was 10.3%, 44.8% classified themselves asnonsmokers with the remaining 44.8% ex-smokers. The medianduration of remission before study entry was 6 months (interquartilerange [IQR], 3.0–12.0 months) (Table 1). Participants were mostlyrepresentative of those in the main trial.16
Medication AdherenceSelf-reported adherence data was available for 56 participants
(96.6% of all sub-study participants). At the final follow-up visit(12 months or relapse if before 12 months), 50 participants believedthat they had taken their medication at least 90% of the timethroughout the study period (89.3%). The remaining 6 stated thatthey had taken their medication,90% of the time. In total, 45 of the50 participants who reported being adherent found it fairly or veryeasy to remember to take their medication (90.0%). Of the 6 partic-ipants who reported not being adherent, 5 stated that they found itdifficult (fairly or very) to remember to take their medication. Figure,Supplemental Digital Content 1, http://links.lww.com/IBD/A379,describes self-reported adherence longitudinally (at each of thefollow-up visits). Adherence data based on tablet counts was avail-able for 49 participants (84.5% of all sub-study participants). Themedian percentage of correct number of tablets taken, conducted atthe final follow-up visit, was 96.7% (IQR, 89.0%–99.2%). Themedian percentage of adherent days, collected using the MEMS,was 89.2% (IQR, 52.3%–96.7%).
Comparison of MeasuresParticipants who reported that they had taken their medica-
tion as prescribed had a median percentage of correct number oftablets taken, according to tablet counts, of 97.6% (IQR, 92.3%–
99.4%). Similarly, their median percentage of adherent daysaccording to the MEMS was 92.9% (IQR, 63.1%–97.3%). Thosethat believed that their adherence was ,90% had considerablylower median adherence levels according to these 2 measures, withtablet count median 76.6% (IQR, 74.3%–83.4%) and MEMSmedian 34.1% (IQR, 14.0%–45.8%). Both differences were statis-tically discernible, with both P # 0.001.
Adherence measured by tablet counts was strongly corre-lated with adherence measured by the MEMS, with a coefficientof 0.756 (Fig. 2). Although this suggests a strong relationshipbetween the 2 measures, Figure 3 demonstrates that there is a dis-tinct lack of agreement between the 2, with adherence measured
Gillespie et al Inflamm Bowel Dis � Volume 20, Number 1, January 2014
84 | www.ibdjournal.org
Copyright © 2013 Crohn’s & Colitis Foundation of America, Inc. Unauthorized reproduction of this article is prohibited.
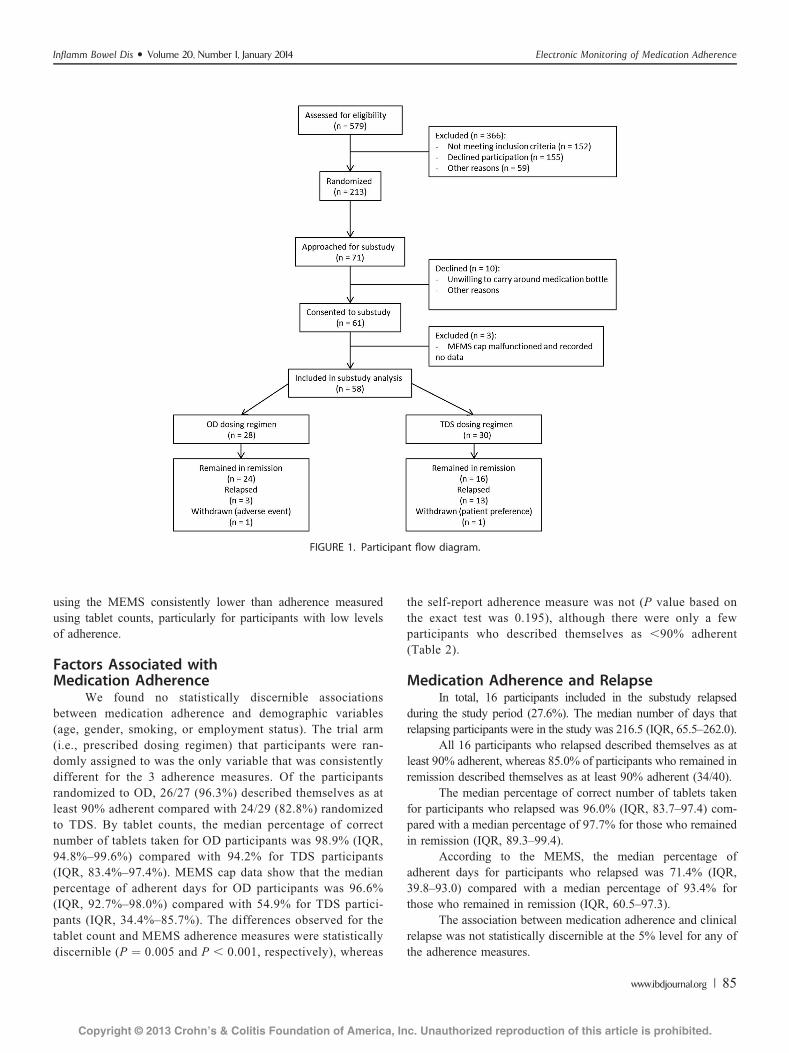
using the MEMS consistently lower than adherence measuredusing tablet counts, particularly for participants with low levelsof adherence.
Factors Associated withMedication Adherence
We found no statistically discernible associationsbetween medication adherence and demographic variables(age, gender, smoking, or employment status). The trial arm(i.e., prescribed dosing regimen) that participants were ran-domly assigned to was the only variable that was consistentlydifferent for the 3 adherence measures. Of the participantsrandomized to OD, 26/27 (96.3%) described themselves as atleast 90% adherent compared with 24/29 (82.8%) randomizedto TDS. By tablet counts, the median percentage of correctnumber of tablets taken for OD participants was 98.9% (IQR,94.8%–99.6%) compared with 94.2% for TDS participants(IQR, 83.4%–97.4%). MEMS cap data show that the medianpercentage of adherent days for OD participants was 96.6%(IQR, 92.7%–98.0%) compared with 54.9% for TDS partici-pants (IQR, 34.4%–85.7%). The differences observed for thetablet count and MEMS adherence measures were statisticallydiscernible (P ¼ 0.005 and P , 0.001, respectively), whereas
the self-report adherence measure was not (P value based onthe exact test was 0.195), although there were only a fewparticipants who described themselves as ,90% adherent(Table 2).
Medication Adherence and RelapseIn total, 16 participants included in the substudy relapsed
during the study period (27.6%). The median number of days thatrelapsing participants were in the study was 216.5 (IQR, 65.5–262.0).
All 16 participants who relapsed described themselves as atleast 90% adherent, whereas 85.0% of participants who remained inremission described themselves as at least 90% adherent (34/40).
The median percentage of correct number of tablets takenfor participants who relapsed was 96.0% (IQR, 83.7–97.4) com-pared with a median percentage of 97.7% for those who remainedin remission (IQR, 89.3–99.4).
According to the MEMS, the median percentage ofadherent days for participants who relapsed was 71.4% (IQR,39.8–93.0) compared with a median percentage of 93.4% forthose who remained in remission (IQR, 60.5–97.3).
The association between medication adherence and clinicalrelapse was not statistically discernible at the 5% level for any ofthe adherence measures.
FIGURE 1. Participant flow diagram.
Inflamm Bowel Dis � Volume 20, Number 1, January 2014 Electronic Monitoring of Medication Adherence
www.ibdjournal.org | 85
Copyright © 2013 Crohn’s & Colitis Foundation of America, Inc. Unauthorized reproduction of this article is prohibited.
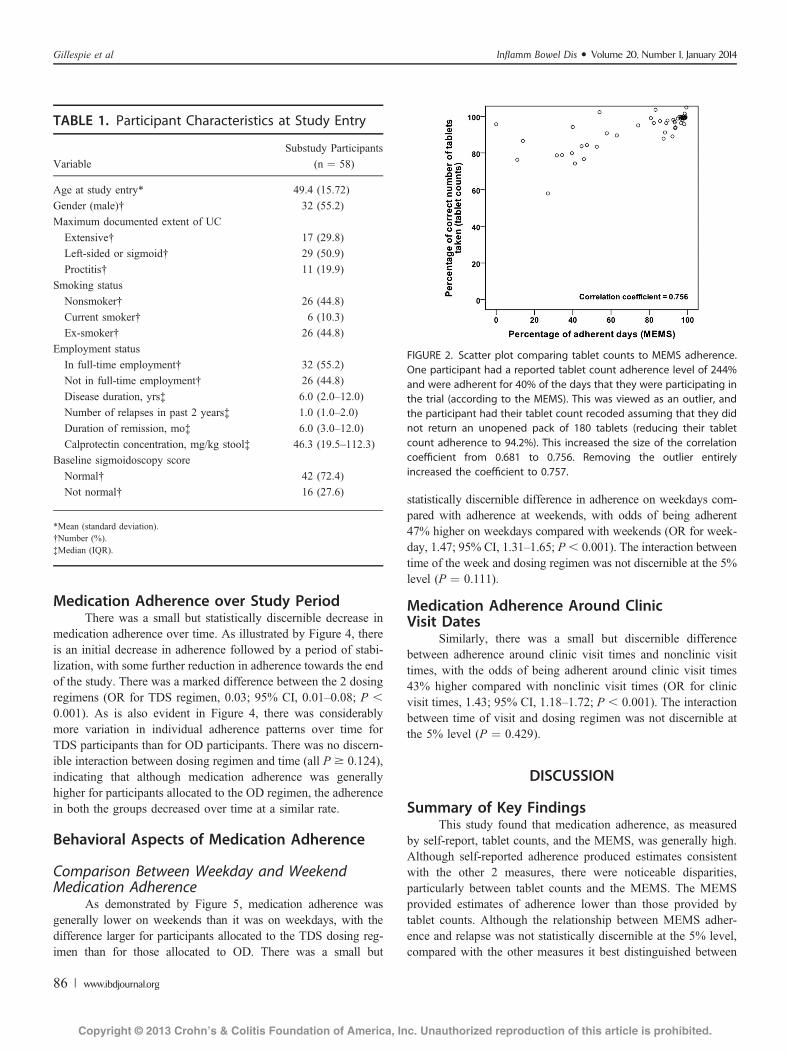
Medication Adherence over Study PeriodThere was a small but statistically discernible decrease in
medication adherence over time. As illustrated by Figure 4, thereis an initial decrease in adherence followed by a period of stabi-lization, with some further reduction in adherence towards the endof the study. There was a marked difference between the 2 dosingregimens (OR for TDS regimen, 0.03; 95% CI, 0.01–0.08; P ,0.001). As is also evident in Figure 4, there was considerablymore variation in individual adherence patterns over time forTDS participants than for OD participants. There was no discern-ible interaction between dosing regimen and time (all P $ 0.124),indicating that although medication adherence was generallyhigher for participants allocated to the OD regimen, the adherencein both the groups decreased over time at a similar rate.
Behavioral Aspects of Medication Adherence
Comparison Between Weekday and WeekendMedication Adherence
As demonstrated by Figure 5, medication adherence wasgenerally lower on weekends than it was on weekdays, with thedifference larger for participants allocated to the TDS dosing reg-imen than for those allocated to OD. There was a small but
statistically discernible difference in adherence on weekdays com-pared with adherence at weekends, with odds of being adherent47% higher on weekdays compared with weekends (OR for week-day, 1.47; 95% CI, 1.31–1.65; P, 0.001). The interaction betweentime of the week and dosing regimen was not discernible at the 5%level (P ¼ 0.111).
Medication Adherence Around ClinicVisit Dates
Similarly, there was a small but discernible differencebetween adherence around clinic visit times and nonclinic visittimes, with the odds of being adherent around clinic visit times43% higher compared with nonclinic visit times (OR for clinicvisit times, 1.43; 95% CI, 1.18–1.72; P , 0.001). The interactionbetween time of visit and dosing regimen was not discernible atthe 5% level (P ¼ 0.429).
DISCUSSION
Summary of Key FindingsThis study found that medication adherence, as measured
by self-report, tablet counts, and the MEMS, was generally high.Although self-reported adherence produced estimates consistentwith the other 2 measures, there were noticeable disparities,particularly between tablet counts and the MEMS. The MEMSprovided estimates of adherence lower than those provided bytablet counts. Although the relationship between MEMS adher-ence and relapse was not statistically discernible at the 5% level,compared with the other measures it best distinguished between
TABLE 1. Participant Characteristics at Study Entry
Variable
Substudy Participants
(n ¼ 58)
Age at study entry* 49.4 (15.72)Gender (male)† 32 (55.2)
Maximum documented extent of UC
Extensive† 17 (29.8)
Left-sided or sigmoid† 29 (50.9)
Proctitis† 11 (19.9)
Smoking status
Nonsmoker† 26 (44.8)
Current smoker† 6 (10.3)Ex-smoker† 26 (44.8)
Employment status
In full-time employment† 32 (55.2)
Not in full-time employment† 26 (44.8)
Disease duration, yrs‡ 6.0 (2.0–12.0)
Number of relapses in past 2 years‡ 1.0 (1.0–2.0)
Duration of remission, mo‡ 6.0 (3.0–12.0)
Calprotectin concentration, mg/kg stool‡ 46.3 (19.5–112.3)Baseline sigmoidoscopy score
Normal† 42 (72.4)
Not normal† 16 (27.6)
*Mean (standard deviation).†Number (%).‡Median (IQR).
FIGURE 2. Scatter plot comparing tablet counts to MEMS adherence.One participant had a reported tablet count adherence level of 244%and were adherent for 40% of the days that they were participating inthe trial (according to the MEMS). This was viewed as an outlier, andthe participant had their tablet count recoded assuming that they didnot return an unopened pack of 180 tablets (reducing their tabletcount adherence to 94.2%). This increased the size of the correlationcoefficient from 0.681 to 0.756. Removing the outlier entirelyincreased the coefficient to 0.757.
Gillespie et al Inflamm Bowel Dis � Volume 20, Number 1, January 2014
86 | www.ibdjournal.org
Copyright © 2013 Crohn’s & Colitis Foundation of America, Inc. Unauthorized reproduction of this article is prohibited.
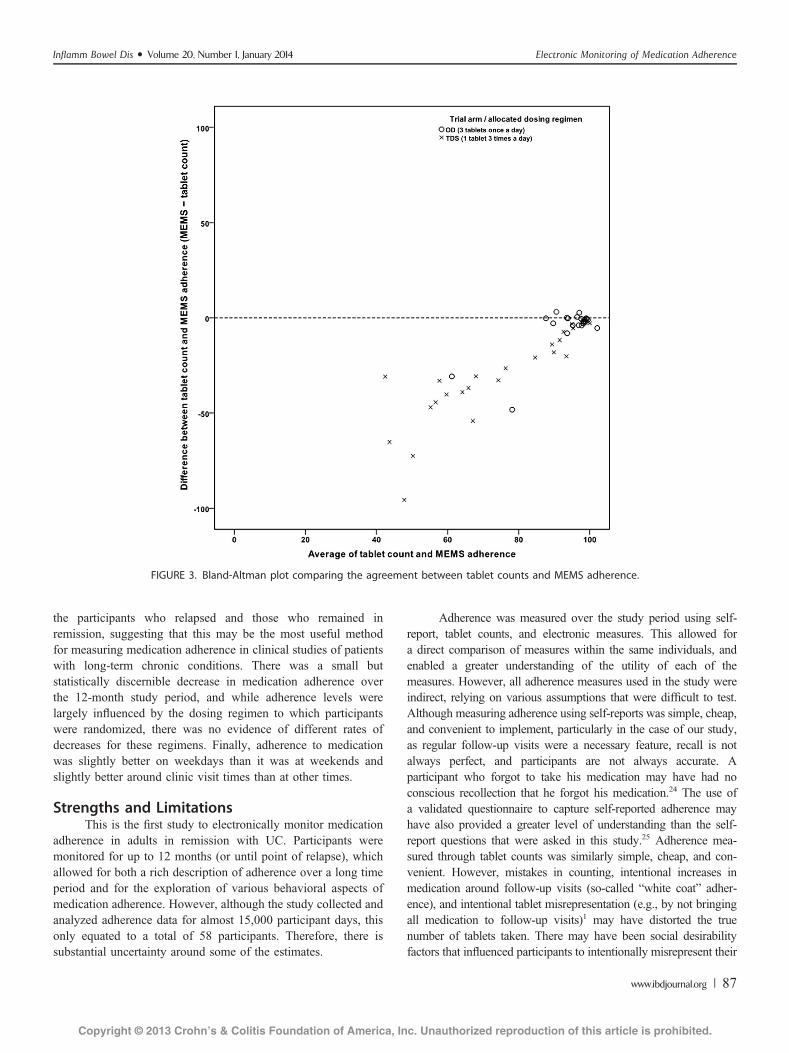
the participants who relapsed and those who remained inremission, suggesting that this may be the most useful methodfor measuring medication adherence in clinical studies of patientswith long-term chronic conditions. There was a small butstatistically discernible decrease in medication adherence overthe 12-month study period, and while adherence levels werelargely influenced by the dosing regimen to which participantswere randomized, there was no evidence of different rates ofdecreases for these regimens. Finally, adherence to medicationwas slightly better on weekdays than it was at weekends andslightly better around clinic visit times than at other times.
Strengths and LimitationsThis is the first study to electronically monitor medication
adherence in adults in remission with UC. Participants weremonitored for up to 12 months (or until point of relapse), whichallowed for both a rich description of adherence over a long timeperiod and for the exploration of various behavioral aspects ofmedication adherence. However, although the study collected andanalyzed adherence data for almost 15,000 participant days, thisonly equated to a total of 58 participants. Therefore, there issubstantial uncertainty around some of the estimates.
Adherence was measured over the study period using self-report, tablet counts, and electronic measures. This allowed fora direct comparison of measures within the same individuals, andenabled a greater understanding of the utility of each of themeasures. However, all adherence measures used in the study wereindirect, relying on various assumptions that were difficult to test.Although measuring adherence using self-reports was simple, cheap,and convenient to implement, particularly in the case of our study,as regular follow-up visits were a necessary feature, recall is notalways perfect, and participants are not always accurate. Aparticipant who forgot to take his medication may have had noconscious recollection that he forgot his medication.24 The use ofa validated questionnaire to capture self-reported adherence mayhave also provided a greater level of understanding than the self-report questions that were asked in this study.25 Adherence mea-sured through tablet counts was similarly simple, cheap, and con-venient. However, mistakes in counting, intentional increases inmedication around follow-up visits (so-called “white coat” adher-ence), and intentional tablet misrepresentation (e.g., by not bringingall medication to follow-up visits)1 may have distorted the truenumber of tablets taken. There may have been social desirabilityfactors that influenced participants to intentionally misrepresent their
FIGURE 3. Bland-Altman plot comparing the agreement between tablet counts and MEMS adherence.
Inflamm Bowel Dis � Volume 20, Number 1, January 2014 Electronic Monitoring of Medication Adherence
www.ibdjournal.org | 87
Copyright © 2013 Crohn’s & Colitis Foundation of America, Inc. Unauthorized reproduction of this article is prohibited.
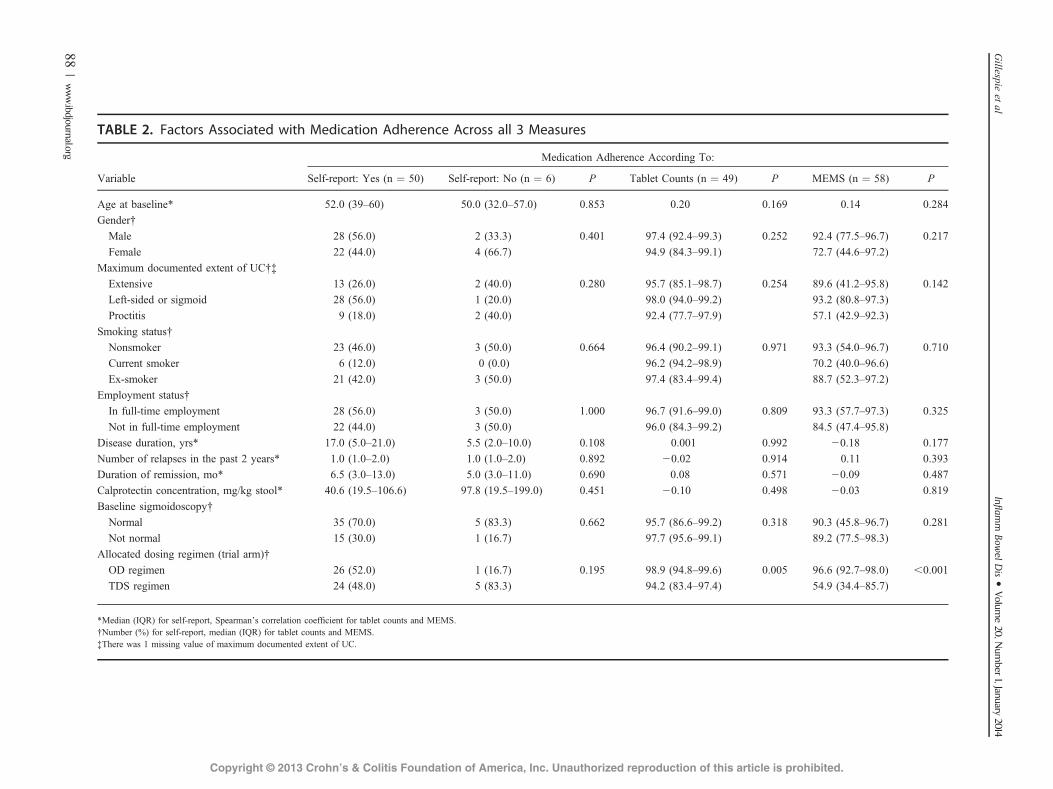
TABLE 2. Factors Associated with Medication Adherence Across all 3 Measures
Variable
Medication Adherence According To:
Self-report: Yes (n ¼ 50) Self-report: No (n ¼ 6) P Tablet Counts (n ¼ 49) P MEMS (n ¼ 58) P
Age at baseline* 52.0 (39–60) 50.0 (32.0–57.0) 0.853 0.20 0.169 0.14 0.284Gender†
Male 28 (56.0) 2 (33.3) 0.401 97.4 (92.4–99.3) 0.252 92.4 (77.5–96.7) 0.217
Female 22 (44.0) 4 (66.7) 94.9 (84.3–99.1) 72.7 (44.6–97.2)
Maximum documented extent of UC†‡
Extensive 13 (26.0) 2 (40.0) 0.280 95.7 (85.1–98.7) 0.254 89.6 (41.2–95.8) 0.142
Left-sided or sigmoid 28 (56.0) 1 (20.0) 98.0 (94.0–99.2) 93.2 (80.8–97.3)
Proctitis 9 (18.0) 2 (40.0) 92.4 (77.7–97.9) 57.1 (42.9–92.3)
Smoking status†Nonsmoker 23 (46.0) 3 (50.0) 0.664 96.4 (90.2–99.1) 0.971 93.3 (54.0–96.7) 0.710
Current smoker 6 (12.0) 0 (0.0) 96.2 (94.2–98.9) 70.2 (40.0–96.6)
Ex-smoker 21 (42.0) 3 (50.0) 97.4 (83.4–99.4) 88.7 (52.3–97.2)
Employment status†
In full-time employment 28 (56.0) 3 (50.0) 1.000 96.7 (91.6–99.0) 0.809 93.3 (57.7–97.3) 0.325
Not in full-time employment 22 (44.0) 3 (50.0) 96.0 (84.3–99.2) 84.5 (47.4–95.8)
Disease duration, yrs* 17.0 (5.0–21.0) 5.5 (2.0–10.0) 0.108 0.001 0.992 20.18 0.177
Number of relapses in the past 2 years* 1.0 (1.0–2.0) 1.0 (1.0–2.0) 0.892 20.02 0.914 0.11 0.393Duration of remission, mo* 6.5 (3.0–13.0) 5.0 (3.0–11.0) 0.690 0.08 0.571 20.09 0.487
Calprotectin concentration, mg/kg stool* 40.6 (19.5–106.6) 97.8 (19.5–199.0) 0.451 20.10 0.498 20.03 0.819
Baseline sigmoidoscopy†
Normal 35 (70.0) 5 (83.3) 0.662 95.7 (86.6–99.2) 0.318 90.3 (45.8–96.7) 0.281
Not normal 15 (30.0) 1 (16.7) 97.7 (95.6–99.1) 89.2 (77.5–98.3)
Allocated dosing regimen (trial arm)†
OD regimen 26 (52.0) 1 (16.7) 0.195 98.9 (94.8–99.6) 0.005 96.6 (92.7–98.0) ,0.001
TDS regimen 24 (48.0) 5 (83.3) 94.2 (83.4–97.4) 54.9 (34.4–85.7)
*Median (IQR) for self-report, Spearman’s correlation coefficient for tablet counts and MEMS.†Number (%) for self-report, median (IQR) for tablet counts and MEMS.‡There was 1 missing value of maximum documented extent of UC.
Gillespie
etal
Inflam
mBow
elDis �
Volume20,N
umber
1,January2014
88|www.ibdjournal.org
Copyright © 2013 Crohn’s & Colitis Foundation of America, Inc. Unauthorized reproduction of this article is prohibited.
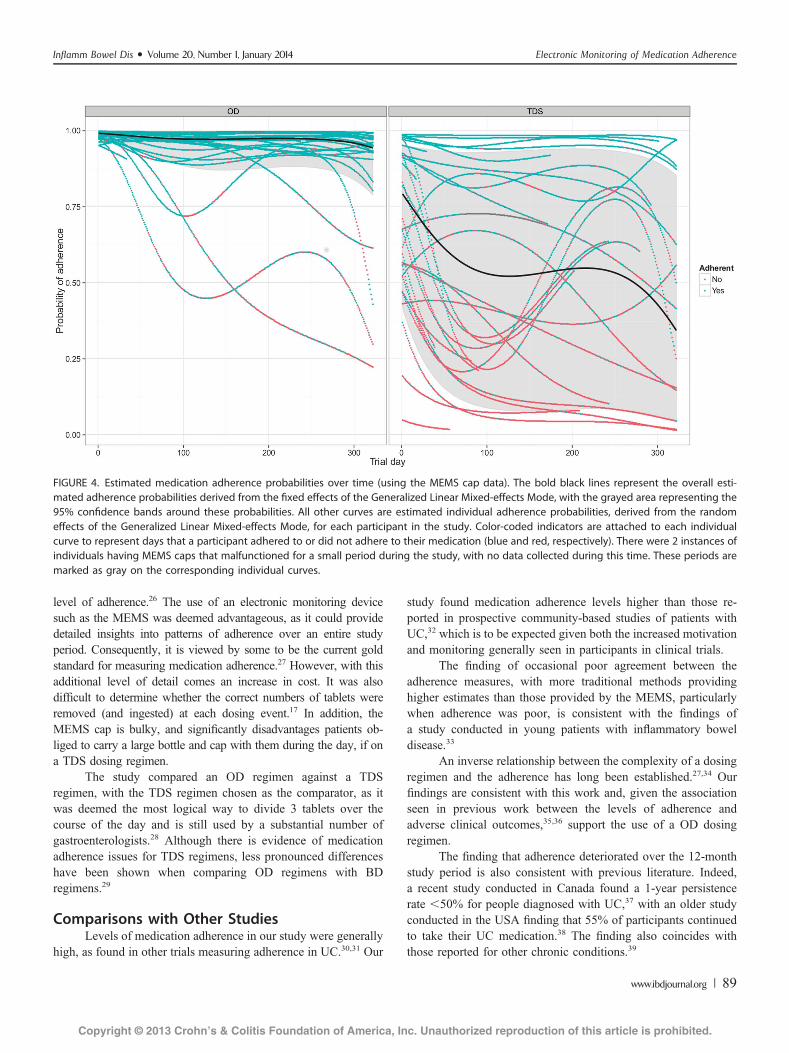
level of adherence.26 The use of an electronic monitoring devicesuch as the MEMS was deemed advantageous, as it could providedetailed insights into patterns of adherence over an entire studyperiod. Consequently, it is viewed by some to be the current goldstandard for measuring medication adherence.27 However, with thisadditional level of detail comes an increase in cost. It was alsodifficult to determine whether the correct numbers of tablets wereremoved (and ingested) at each dosing event.17 In addition, theMEMS cap is bulky, and significantly disadvantages patients ob-liged to carry a large bottle and cap with them during the day, if ona TDS dosing regimen.
The study compared an OD regimen against a TDSregimen, with the TDS regimen chosen as the comparator, as itwas deemed the most logical way to divide 3 tablets over thecourse of the day and is still used by a substantial number ofgastroenterologists.28 Although there is evidence of medicationadherence issues for TDS regimens, less pronounced differenceshave been shown when comparing OD regimens with BDregimens.29
Comparisons with Other StudiesLevels of medication adherence in our study were generally
high, as found in other trials measuring adherence in UC.30,31 Our
study found medication adherence levels higher than those re-ported in prospective community-based studies of patients withUC,32 which is to be expected given both the increased motivationand monitoring generally seen in participants in clinical trials.
The finding of occasional poor agreement between theadherence measures, with more traditional methods providinghigher estimates than those provided by the MEMS, particularlywhen adherence was poor, is consistent with the findings ofa study conducted in young patients with inflammatory boweldisease.33
An inverse relationship between the complexity of a dosingregimen and the adherence has long been established.27,34 Ourfindings are consistent with this work and, given the associationseen in previous work between the levels of adherence andadverse clinical outcomes,35,36 support the use of a OD dosingregimen.
The finding that adherence deteriorated over the 12-monthstudy period is also consistent with previous literature. Indeed,a recent study conducted in Canada found a 1-year persistencerate ,50% for people diagnosed with UC,37 with an older studyconducted in the USA finding that 55% of participants continuedto take their UC medication.38 The finding also coincides withthose reported for other chronic conditions.39
FIGURE 4. Estimated medication adherence probabilities over time (using the MEMS cap data). The bold black lines represent the overall esti-mated adherence probabilities derived from the fixed effects of the Generalized Linear Mixed-effects Mode, with the grayed area representing the95% confidence bands around these probabilities. All other curves are estimated individual adherence probabilities, derived from the randomeffects of the Generalized Linear Mixed-effects Mode, for each participant in the study. Color-coded indicators are attached to each individualcurve to represent days that a participant adhered to or did not adhere to their medication (blue and red, respectively). There were 2 instances ofindividuals having MEMS caps that malfunctioned for a small period during the study, with no data collected during this time. These periods aremarked as gray on the corresponding individual curves.
Inflamm Bowel Dis � Volume 20, Number 1, January 2014 Electronic Monitoring of Medication Adherence
www.ibdjournal.org | 89
Copyright © 2013 Crohn’s & Colitis Foundation of America, Inc. Unauthorized reproduction of this article is prohibited.
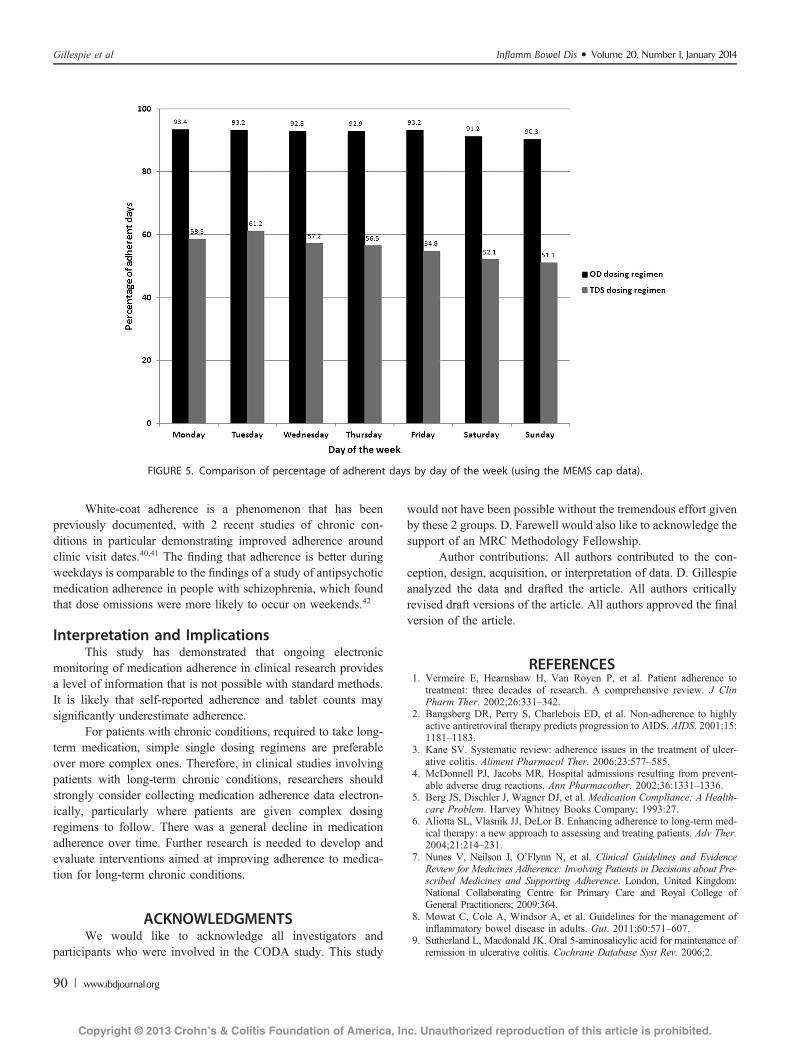
White-coat adherence is a phenomenon that has beenpreviously documented, with 2 recent studies of chronic con-ditions in particular demonstrating improved adherence aroundclinic visit dates.40,41 The finding that adherence is better duringweekdays is comparable to the findings of a study of antipsychoticmedication adherence in people with schizophrenia, which foundthat dose omissions were more likely to occur on weekends.42
Interpretation and ImplicationsThis study has demonstrated that ongoing electronic
monitoring of medication adherence in clinical research providesa level of information that is not possible with standard methods.It is likely that self-reported adherence and tablet counts maysignificantly underestimate adherence.
For patients with chronic conditions, required to take long-term medication, simple single dosing regimens are preferableover more complex ones. Therefore, in clinical studies involvingpatients with long-term chronic conditions, researchers shouldstrongly consider collecting medication adherence data electron-ically, particularly where patients are given complex dosingregimens to follow. There was a general decline in medicationadherence over time. Further research is needed to develop andevaluate interventions aimed at improving adherence to medica-tion for long-term chronic conditions.
ACKNOWLEDGMENTSWe would like to acknowledge all investigators and
participants who were involved in the CODA study. This study
would not have been possible without the tremendous effort givenby these 2 groups. D. Farewell would also like to acknowledge thesupport of an MRC Methodology Fellowship.
Author contributions: All authors contributed to the con-ception, design, acquisition, or interpretation of data. D. Gillespieanalyzed the data and drafted the article. All authors criticallyrevised draft versions of the article. All authors approved the finalversion of the article.
REFERENCES1. Vermeire E, Hearnshaw H, Van Royen P, et al. Patient adherence to
treatment: three decades of research. A comprehensive review. J ClinPharm Ther. 2002;26:331–342.
2. Bangsberg DR, Perry S, Charlebois ED, et al. Non-adherence to highlyactive antiretroviral therapy predicts progression to AIDS. AIDS. 2001;15:1181–1183.
3. Kane SV. Systematic review: adherence issues in the treatment of ulcer-ative colitis. Aliment Pharmacol Ther. 2006;23:577–585.
4. McDonnell PJ, Jacobs MR. Hospital admissions resulting from prevent-able adverse drug reactions. Ann Pharmacother. 2002;36:1331–1336.
5. Berg JS, Dischler J, Wagner DJ, et al. Medication Compliance: A Health-care Problem. Harvey Whitney Books Company; 1993:27.
6. Aliotta SL, Vlasnik JJ, DeLor B. Enhancing adherence to long-term med-ical therapy: a new approach to assessing and treating patients. Adv Ther.2004;21:214–231.
7. Nunes V, Neilson J, O’Flynn N, et al. Clinical Guidelines and EvidenceReview for Medicines Adherence: Involving Patients in Decisions about Pre-scribed Medicines and Supporting Adherence. London, United Kingdom:National Collaborating Centre for Primary Care and Royal College ofGeneral Practitioners; 2009:364.
8. Mowat C, Cole A, Windsor A, et al. Guidelines for the management ofinflammatory bowel disease in adults. Gut. 2011;60:571–607.
9. Sutherland L, Macdonald JK. Oral 5-aminosalicylic acid for maintenance ofremission in ulcerative colitis. Cochrane Database Syst Rev. 2006;2.
FIGURE 5. Comparison of percentage of adherent days by day of the week (using the MEMS cap data).
Gillespie et al Inflamm Bowel Dis � Volume 20, Number 1, January 2014
90 | www.ibdjournal.org
Copyright © 2013 Crohn’s & Colitis Foundation of America, Inc. Unauthorized reproduction of this article is prohibited.
10. Joint Formulary Committee. British National Formulary (Online). London,United Kingdom: BMJ Group and Pharmaceutical Press; 2013. Availableat: http://www.medicinescomplete.com. Accessed March 21, 2013.
11. D’IncÀ R, Bertomoro P, Mazzocco K, et al. Risk factors for non‐adherenceto medication in inflammatory bowel disease patients. Aliment PharmacolTher. 2008;27:166–172.
12. Shale MJ, Riley SA. Studies of compliance with delayed‐release mesala-zine therapy in patients with inflammatory bowel disease. Aliment Phar-macol Ther. 2003;18:191–198.
13. Flourié B, Hagège H, Tucat G, et al. Randomised clinical trial: once‐vs.twice‐daily prolonged‐release mesalazine for active ulcerative colitis. Ali-ment Pharmacol Ther. 2013;37:767–775.
14. Gandia P, Idier I, Houin G. Is once‐daily mesalazine equivalent to thecurrently used twice‐daily regimen? A study performed in 30 healthyvolunteers. J Clin Pharmacol. 2007;47:334–342.
15. Hussain FN, Ajjan RA, Kapur K, et al. Once versus divided daily dosingwith delayed‐release mesalazine: a study of tissue drug concentrations andstandard pharmacokinetic parameters. Aliment Pharmacol Ther. 2001;15:53–62.
16. Hawthorne AB, Stenson R, Gillespie D, et al. One‐year investigator‐blindrandomized multicenter trial comparing asacol 2.4 g once daily with800 mg three times daily for maintenance of remission in ulcerativecolitis. Inflamm Bowel Dis. 2012;18:1885–1893.
17. Kenna LA, Labbé L, Barrett JS, et al. Modeling and simulation ofadherence: approaches and applications in therapeutics. AAPS J. 2005;7:E390–E407.
18. Bland MJ, Altman DG. Statistical methods for assessing agreement betweentwo methods of clinical measurement. Lancet. 1986;327:307–310.
19. Harre FE, Lee KL, Pollock BG. Regression models in clinical studies:determining relationships between predictors and response. J Natl CancerInst. 1988;80:1198–1202.
20. Akaike H. A new look at the statistical model identification. IEEE Trans-actions on Automatic Control. 1974;19:716–723.
21. IBM Corp. IBM SPSS Statistics for Windows. 20.0 ed. Armonk, NY:IBM Corp. 2011.
22. R Core Team. R: A Language and Environment for Statistical Computing.Vienna, Austria: R Foundation for Statistical Computing, 2012.
23. Bates D, Maechler M, Bolker B, et al. lme4: linear mixed-effects modelsusing S4 classes. R package version 0.999999-0. Available at: http://CRAN.R-project.org/package¼lme4.
24. Cramer JA, Spilker B. Patient Compliance in Medical Practice and Clin-ical Trials: New York, NY: Raven Press; 1991.
25. Horne R, Weinman J. Self-regulation and self-management in asthma:exploring the role of illness perceptions and treatment beliefs in explain-ing non-adherence to preventer medication. Psychol Health. 2002;17:17–32.
26. Farmer KC. Methods for measuring and monitoring medication regimen adher-ence in clinical trials and clinical practice. Clin Ther. 1999;21:1074–1090.
27. Claxton AJ, Cramer J, Pierce C. A systematic review of the associationsbetween dose regimens and medication compliance. Clin Ther. 2001;23:1296–1310.
28. Sandborn WJ, Korzenik J, Lashner B, et al. Once-daily dosing of delayed-release oral mesalamine (400-mg tablet) is as effective as twice-dailydosing for maintenance of remission of ulcerative colitis. Gastroenterol-ogy. 2010;138:1286–1296.e3.
29. Eisen SA, Miller DK, Woodward RS, et al. The effect of prescribed dailydose frequency on patient medication compliance. Arch Intern Med. 1990;150:1881–1884.
30. Farup PG, Hinterleitner TA, Luká�s M, et al. Mesalazine 4 g daily given asprolonged‐release granules twice daily and four times daily is at least aseffective as prolonged‐release tablets four times daily in patients withulcerative colitis. Inflamm Bowel Dis. 2001;7:237–242.
31. Prantera C, Viscido A, Biancone L, et al. A new oral delivery system for5‐ASA: preliminary clinical findings for MMx. Inflamm Bowel Dis. 2005;11:421–427.
32. Kane SV, Cohen RD, Aikens JE, et al. Prevalence of nonadherence withmaintenance mesalamine in quiescent ulcerative colitis. Am J Gastroen-terol. 2001;96:2929–2933.
33. Greenley RN, Kunz JH, Biank V, et al. Identifying youth nonadherence inclinical settings: data‐based recommendations for children and adolescentswith inflammatory bowel disease. Inflamm Bowel Dis. 2012;18:1254–1259. doi: 10.002/ibd.21859.
34. Saini SD, Schoenfeld P, Kaulback K, et al. Effect of medication dosingfrequency on adherence in chronic diseases. Am J Manag Care. 2009;15:e22–e33.
35. Bresci G, Parisi G, Bertoni M, et al. Long-term maintenance treatment inulcerative colitis: a 10-year follow-up. Dig Liver Dis. 2002;34:419–423.
36. Kane S, Huo D, Aikens J, et al. Medication nonadherence and the outcomesof patients with quiescent ulcerative colitis. Am J Med. 2003;114:39–43.
37. Lachaine J, Yen L, Beauchemin C, et al. Medication adherence and per-sistence in the treatment of Canadian ulcerative colitis patients: analyseswith the RAMQ database. BMC Gastroenterol. 2013;13:23.
38. Kane SV, Accortt NA, Magowan S, et al. Predictors of persistence with5‐aminosalicylic acid therapy for ulcerative colitis. Aliment PharmacolTher. 2009;29:855–862.
39. Evon DM, Esserman DA, Bonner JE, et al. Adherence to PEG/ribavirintreatment for chronic hepatitis C: prevalence, patterns, and predictors ofmissed doses and nonpersistence. J Viral Hepat. 2013;20:536–549.
40. Feldman SR, Camacho FT, Krejci-Manwaring J, et al. Adherence totopical therapy increases around the time of office visits. J Am AcadDermatol. 2007;57:81–83.
41. Modi AC, Ingerski LM, Rausch JR, et al. White coat adherence over thefirst year of therapy in pediatric epilepsy. J Pediatr. 2012;161:695–699.
42. Acosta FJ, Ramallo-Fariña Y, Bosch E, et al. Antipsychotic treatmentdosing profile in patients with schizophrenia evaluated with electronicmonitoring (MEMS�). Schizophr Res. 2013;146:196–200.
Inflamm Bowel Dis � Volume 20, Number 1, January 2014 Electronic Monitoring of Medication Adherence
www.ibdjournal.org | 91
Copyright © 2013 Crohn’s & Colitis Foundation of America, Inc. Unauthorized reproduction of this article is prohibited.
Adherence-adjusted estimates ofbenefits and harms from treatment withamoxicillin for LRTI: secondary analysisof a 12-country randomised placebo-controlled trial using randomisation-based efficacy estimators
David Gillespie,1 Kerenza Hood,1 Daniel Farewell,2 Christopher C Butler,2,3
Theo Verheij,4 Herman Goossens,5 Beth Stuart,6 Mark Mullee,6 Paul Little,7
On behalf of the GRACE consortium
To cite: Gillespie D, Hood K,Farewell D, et al. Adherence-adjusted estimates of benefitsand harms from treatmentwith amoxicillin for LRTI:secondary analysis of a 12-country randomised placebo-controlled trial usingrandomisation-based efficacyestimators. BMJ Open2015;5:e006160.doi:10.1136/bmjopen-2014-006160
▸ Prepublication history andadditional material isavailable. To view please visitthe journal (http://dx.doi.org/10.1136/bmjopen-2014-006160).
Received 18 July 2014Revised 27 January 2015Accepted 28 January 2015
For numbered affiliations seeend of article.
Correspondence toDavid Gillespie;[email protected]
ABSTRACTObjectives: Estimate the efficacy of amoxicillin for acuteuncomplicated lower-respiratory-tract infection (LRTI) inprimary care and demonstrate the use of randomisation-based efficacy estimators.Design: Secondary analysis of a two-arm individually-randomised placebo-controlled trial.Setting: Primary care practices in 12 Europeancountries.Participants: Patients aged 18 or older consulting withan acute LRTI in whom pneumonia was not suspected bythe clinician.Interventions: Amoxicillin (two 500 mg tablets threetimes a day for 7 days) or matched placebo.Main outcome measures: Clinician-rated symptomseverity between days 2–4; new/worsening symptomsand presence of side effects at 4-weeks. Adherence wascaptured using self-report and tablet counts.Results: 2061 participants were randomised to theamoxicillin or placebo group. On average, 88% of theprescribed amoxicillin was taken. The original analysisdemonstrated small increases in both benefits and harmsfrom amoxicillin. Minor improvements in the benefits ofamoxicillin were observed when an adjustments foradherence were made (mean difference in symptomseverity −0.08, 95% CI −0.17 to 0.01, OR for new/worsening symptoms 0.81, 95% CI 0.66 to 0.98) as wellas minor increases in harms (OR for side effects 1.32,95% CI 1.12 to 1.57).Conclusions: Adherence to amoxicillin was high, andthe findings from the original analysis were robust tonon-adherence. Participants consulting to primary carewith an acute uncomplicated LRTI can on average expectminor improvements in outcome from taking amoxicillin.However, they are also at an increased risk ofexperiencing side effects.Trial registration numbers: Eudract-CT 2007-001586-15 and ISRCTN52261229.The trial was registered at EudraCT in 2007 due to an
administrative misunderstanding that EudraCT was a
suitable registry—which it was not in 2007, but hasbecome since. On discovery of this error, the trial wasalso registered at ISRCTN ( January 2009). Trialprocedures did not change between the two registrations.
INTRODUCTIONAcute uncomplicated lower-respiratory-tractinfection (LRTI) is one of the most commonreasons for patients consulting in primarycare.1 2 Antibiotics are prescribed to themajority of consulting patients, with amoxicil-lin being the most common across Europe.3
Evidence for the benefits and harms of anti-biotic treatment has been unclear, primarily
Strengths and limitations of this study
▪ This is the largest randomised placebo-controlledtrial evaluating amoxicillin for acute, uncomplicatedlower-respiratory-tract infection in primary care todate.
▪ Consideration of the benefits and harms ofamoxicillin allowed for a balanced assessment ofthis treatment.
▪ Multiple types of adherence measures meant thatagreement between measures could be assessed.
▪ As is often the case in research, indirect measuresof medication adherence were collected. These relyheavily on their inherent assumptions (eg, accuratepatient recall, returning of all unused medication).Direct measures (eg, direct observation) are prefer-able, but often not feasible in practice.
▪ Structural mean models enabled an adjustmentfor treatment non-adherence while maintaining acomparison of groups as randomised.
Gillespie D, et al. BMJ Open 2015;5:e006160. doi:10.1136/bmjopen-2014-006160 1
Open Access Research
group.bmj.com on March 29, 2017 - Published by http://bmjopen.bmj.com/Downloaded from
due to underpowered and inappropriately designedstudies.4 With antibiotic resistance becoming a growingproblem worldwide, the need for clear evidence for thebenefits and harms of antibiotics for this condition hasnever been more of a priority.5 6
A recently published trial of amoxicillin for acuteuncomplicated LRTI in primary care concluded thatamoxicillin provides little clinical benefit and causes slightharms.7 The findings of this trial were based on a compari-son of participants in the arm to which they were originallyrandomised (ie, using the intention to treat (ITT) prin-ciple). While an ITT analysis is an important part of theanalysis of any trial, as it reflects the design of the trial anduses randomisation to avoid selection bias,8 this approachdoes not take into account deviations that occur followingrandomisation, such as lack of adherence to treatment.Adherence to antibiotic treatment in primary care is
poor.9 Less than 60% of patients prescribed an antibioticfor an acute cough/LRTI in primary care initiated theirtreatment, and less than half took the full course.10 Poorlevels of adherence to antibiotics wastes healthcareresources, could negatively impact on clinical outcomesand could increase the selective pressures for antibioticresistance. When issues with adherence are present in atrial, analysis based on the ITT principle underestimatestreatment effects, and can only provide an unbiased esti-mate of the effect of prescribing treatment (effectiveness),rather than the effect of treatment itself (efficacy).11
Two traditional approaches to estimating treatmentefficacy include per-protocol analysis, where participantswho do not adhere to their allocated treatment areexcluded from analyses, and on-treatment analysis,where participants are analysed in the group corre-sponding to the treatment they took (regardless of thegroup they were allocated to).12 Both methods make theimplicit assumption that the groups of participants areequivalent with respect to observed and unobserved vari-ables, something that is implausible in practice.13
Approaches to estimating efficacy without making thiskey assumption exist, and are becoming increasinglypopular.14 15 However, these approaches are generallyreported in specialist methodological journals, ratherthan the general medical literature and as such therestill remains a reliance on more traditional and arguablyinadequate methods.The aim of this paper is to use the data set from the
largest placebo-controlled trial of amoxicillin for acuteuncomplicated LRTI in primary care to produceadherence-adjusted estimates of the benefits and harmsfrom amoxicillin for adults consulting in primary carewith an acute uncomplicated LRTI, while preserving acomparison of groups as randomised.
METHODSStudy design and participantsA two-arm individually-randomised placebo-controlledtrial was conducted between November 2007 and
April 2010. Patients were recruited consecutively fromprimary care practices from 12 European countries(Belgium, England, France, Germany, Italy, theNetherlands, Poland, Slovakia, Slovenia, Spain,Sweden and Wales).The trial has previously been described in detail else-
where.7 A brief description about recruitment, random-isation, blinding, the interventions, data collection andfollow-up are given below. Further analyses were per-formed in order to investigate our study question.
Recruitment, randomisation, blinding and interventionsParticipants were eligible for inclusion if they were aged18 years or older and consulting for the first time witheither an acute cough (≤28 days’ duration) as theirmain symptom, for which non-infective diagnoses werejudged very unlikely, or an illness in which cough wasnot the most prominent symptom but the clinicianthought acute LRTI the most probable diagnosis.Participants were deemed ineligible if their initial
diagnosis was community-acquired pneumonia (ie, com-plicated LRTI) on the basis of focal chest signs (focalcrepitations, bronchial breathing) and systemic features(high fever, vomiting, severe diarrhoea). Participantswere also ineligible if their working diagnosis was coughof a non-infective cause (eg, pulmonary embolus, leftventricular failure, oesophageal reflux, allergy), theyhad used antibiotics in the previous month, were unableto provide informed consent or complete the diary(eg, they had dementia, psychosis or severe depression),were pregnant, allergic to penicillin or had immuno-logical deficiencies.Participants were allocated to groups on a 1:1 basis
using block randomisation. As this was a double-blindedtrial, clinicians and participants were blinded to the ran-domisation sequence and allocation. All outcome datawere also collected without prior knowledge of thegroup to which participants were allocated.Randomised participants received a prescription for
amoxicillin, to be taken as two 500 mg tablets threetimes a day for 7 days, or a placebo identical in appear-ance, taste and texture.
Data collection and participant follow-upConsenting participants had their comorbidities, clinicalsigns and symptoms recorded by the recruiting clinician.Following recruitment, consent and randomisation,
participants were given a daily symptom diary to com-plete for up to 28 days. The diary recorded the durationand severity of 12 symptoms (cough, phlegm, shortnessof breath, wheeze, blocked or runny nose, chest pain,muscle aches, headaches, disturbed sleep, general feelingof being unwell, fever and interference with normal activ-ities). Severity was scored on a scale from 0 to 6 (0=noproblem, 1=very little problem, 2=slight problem, 3=mod-erately bad, 4=bad, 5=very bad, 6=as bad as it could be).Patients also recorded non-respiratory symptoms, such asdiarrhoea, skin rash and vomiting.
2 Gillespie D, et al. BMJ Open 2015;5:e006160. doi:10.1136/bmjopen-2014-006160
Open Access
group.bmj.com on March 29, 2017 - Published by http://bmjopen.bmj.com/Downloaded from
Members of the research team telephoned partici-pants after 4 days to offer support and answer questionsabout the completion of the diary. If the diary was notreturned after 4 weeks, brief information was collectedabout symptom duration and severity. This informationwas collected with either a short questionnaire or a stan-dardised telephone call.
Measures of adherenceUsing their daily symptom diary, participants recordedwhether or not they took their study medication on agiven day, and whether they took their study medicationaccording to the instructions. Where it was indicatedthat participants did not take their study medicationaccording to the instructions, space was given to providemore detail. Participants for whom a diary was notreturned were asked to state the number of days thatthey took their study medication. This information wascollected using the short questionnaire/telephone calldescribed in the previous section. Participants were alsoinstructed to return their study medication bottles, com-plete with any unused medication, at the end of thetrial. The number of tablets returned was recorded bymembers of the research team.Randomised participants were prescribed 42 tablets.
Adherence to study medication was defined as the per-centage of the correct number of tablets taken duringthe first 7 days of the follow-up period (ie, the periodfor which the medication was prescribed). Three binarydefinitions of adherence were also constructed in orderto provide sensitivity analyses around the continuous def-inition. The three binary definitions were full (100%)adherence versus not full adherence, at least the equiva-lent of a 5-day course (approximately 71.4%) versus lessand at least one tablet versus no tablets.Where participants indicated that they had taken
medication on a particular day, in the absence of infor-mation to the contrary (eg, stating that they only tookone tablet three times a day instead of two tablets), theassumption was made that a participant consumed allstudy medication as instructed. Where medicationbottles were returned, it was assumed that the differencebetween the number of tablets prescribed and thenumber returned equated to the number of tablets con-sumed. We also assumed that all tablets were consumedduring the first 7 days of the follow-up period. Where ashort questionnaire or telephone call was conducted, itwas assumed that the correct numbers of tabletswere taken for the number of days medication wasreportedly taken.Where multiple types of adherence measures were
available for a participant the agreement between mea-sures, and the assumptions inherent in our definition ofadherence, were investigated.
OutcomesTo demonstrate the benefits and harms of amoxicillinin this population, and to illustrate the use of
randomisation-based efficacy estimators, the paper con-centrates on three of the outcomes described in the ori-ginal paper. The first was the mean clinician-ratedsymptom severity between days 2 and 4 after initial pres-entation. The second outcome was the development ofnew or worsening symptoms, defined as returning to theclinician with new or worsening symptoms, new signs oran illness requiring admission to hospital within the4-week follow-up period. The third outcome was thepresence of any non-respiratory symptoms (diarrhoea,skin rash or vomiting) during the 4-week follow-upperiod. These specific symptoms were recorded as theyare known side effects of amoxicillin. The first two out-comes were used to demonstrate the clinical benefits ofamoxicillin for patients with an acute uncomplicatedLRTI in primary care, with the third used to demon-strate harms. The decision to exclude the outcome“time to resolution of moderately bad symptoms” fromthe analysis was made for two reasons. First, in order toreduce the number of assumptions made when derivingthe definition of adherence (we have not made anyassumptions about adherence on individual days, butwould have to make this additional assumption toperform analysis on this outcome). The second reasonwas that standard techniques for adjusting time-to-eventoutcomes for non-adherence rely on fitting an acceler-ated failure time model. The original outcome was ana-lysed using a Cox proportional hazards model, andtherefore the outcome would initially require reanalys-ing using an accelerated failure time model before anadjustment could be made. As the results from this ana-lysis cannot be directly compared with the findings fromthe main paper, the decision to exclude this outcomefrom consideration was made.
Statistical analysisParticipants and their adherence to study medicationwere described using means (SDs), medians (IQRs) andpercentages as appropriate.Participants for whom more than one measure of
adherence was available had their agreement betweenmeasures compared using Bland and Altman limits ofagreement.16 Bland and Altman plots are presented withjittering and semitransparency to highlight overlappingdata points. Where multiple types of adherence measureswere reported and there was disagreement betweenvalues, the minimum value was used for analysis.The between-group mean difference in symptom
severity on days 2 to 4 postrandomisation was estimatedusing linear regression. The mean clinician-ratedsymptom severity at baseline was controlled for as a cov-ariate. The between-group odds of developing new orworsening symptoms and of reporting any non-respiratory symptoms in the 4 weeks following random-isation were compared using logistic regression withoutcovariates. These analyses included participants on anintention-to-treat basis. That is, they did not adjust fordeviations following randomisation. The analyses
Gillespie D, et al. BMJ Open 2015;5:e006160. doi:10.1136/bmjopen-2014-006160 3
Open Access
group.bmj.com on March 29, 2017 - Published by http://bmjopen.bmj.com/Downloaded from
therefore provide an estimate of the effectiveness ofamoxicillin for patients with an acute uncomplicatedLRTI in primary care, and as an estimate of efficacy, areviewed as being biased towards the null.To determine efficacy in a way that preserves random-
isation (ie, provides a comparison of groups ie, inde-pendent of observed and, importantly, unobservedconfounders), and is not biased towards the null, struc-tural mean models (SMM) were used to compare thebetween-group differences in the aforementioned out-comes. By recognising that at the beginning of a trial, allparticipants have two potential outcomes—one if theyare treated and one if they are not, a SMM relates atreated participant’s observed outcome to their poten-tially counterfactual outcome that would have beenobserved had they received no treatment. Standardapproaches to fitting a SMM rely on using observedlevels of exposure, and treating randomisation as aninstrument (ie, assuming that it is independent of bothobserved and unobserved confounders and only effectsoutcome through its effect on exposure). Estimationprocedures therefore rely on finding a value of the treat-ment effect such that balance is achieved betweengroups on the outcome (or potential outcome) in parti-cipants who were not treated. The between-group meandifference in symptom severity on days 2 to 4 was esti-mated using a two-stage least squares instrumental vari-ables regression model.17 To compare the odds ofdeveloping new or worsening symptoms and reportingany non-respiratory symptoms, a generalised linear(double logistic) SMM was estimated via a generalisedmethod of moments procedure.18 The double logisticSMM involved a two-step process whereby the associationbetween outcome (development of new or worseningsymptoms or reporting of side effects), trial arm andadherence was modelled first, with estimates from thismodel used in the SMM in order to obtain correct SEs(and hence correct 95% CIs). For more information onthe use of randomisation-based efficacy estimators andtheir core assumptions, including the Stata syntax usedto implement the SMMs, please see the online supple-mentary appendices 1 and 2.Results from the linear regression model are pre-
sented as adjusted mean differences with associated95% CIs. Results from the logistic regression models arepresented as ORs with associated 95% CIs. For the SMM(double logistic SMM), results are presented as both theadjusted mean difference (OR) per % increase in adher-ence and per 100% adherence, the latter of which canbe interpreted as the maximum possible efficacy.Additional analyses using the three binary definitions
of adherence were performed to investigate the sensitiv-ity of the main efficacy analyses to departures from theassumed linear relationship between adherence andoutcome.Data management and descriptive statistics were per-
formed using IBM SPSS Statistics V.20.19 All other ana-lyses were performed using Stata V.13.20
RESULTSParticipantsIn total, 2061 participants were recruited and rando-mised to either the amoxicillin group (1038) or placebo(1023; figure 1). The groups were well matched on base-line characteristics (table 1).
Adherence to study medicationAdherence data were available for 1854 participants(90% of all randomised participants). The majority ofparticipants had multiple types of measure recorded(1214, or 58.9% of all randomised; figure 2).Adherence to study medication was similar between
trial arms and relatively high overall. Average levels ofadherence were highest for responses obtained fromself-reported diaries and lowest for responses from self-reported telephone. Adherence data were highly skewedfor all three measures and spanned the entire range ofpossible responses (table 2).
Agreement between adherence measuresWhere multiple types of adherence measures were avail-able, self-reports (diary and telephone formats) providedslightly higher estimates of adherence on average com-pared to tablet counts (mean differences of 1.7 and 2.6percentage points, respectively). The limits of agreementwhen comparing diary and tablet count adherenceranged from −26.8 (self-reported diary adherence wascalculated as 26.8 percentage points lower than tabletcount adherence) to 30.2 (self-reported diary adherencewas calculated as 30.2 percentage points higher thantablet count adherence) and when comparing tele-phone and tablet count from −21.8 to 26.9 (table 3).Figure 3A, B provide an illustration of the level of agree-ment between different types of measures. What is clearfrom these figures is that adherence was high and wasgenerally good (most data points on both plots are clus-tered around the coordinate (100, 0), indicating fulladherence and no difference between measures). Forthe comparison of diary to tablet count adherence, 7%of participants were outside the limits of agreement; forthe comparison of telephone to tablet count adherence,5% of participants were outside the limits of agreement.Taking the minimum reported adherence value
(where multiple values were reported), adherence tostudy medication remained high and negatively skewed(table 4 and figure 4).
OutcomesTable 5 provides descriptive statistics for each of thethree clinical outcomes.
EffectivenessTable 6 compares the effectiveness and efficacy ofamoxicillin with respect to the various outcomes below.As reported in the original paper, the adjusted
between-group mean difference in symptom severityscore on days 2 to 4 was slightly lower in the amoxicillin
4 Gillespie D, et al. BMJ Open 2015;5:e006160. doi:10.1136/bmjopen-2014-006160
Open Access
group.bmj.com on March 29, 2017 - Published by http://bmjopen.bmj.com/Downloaded from
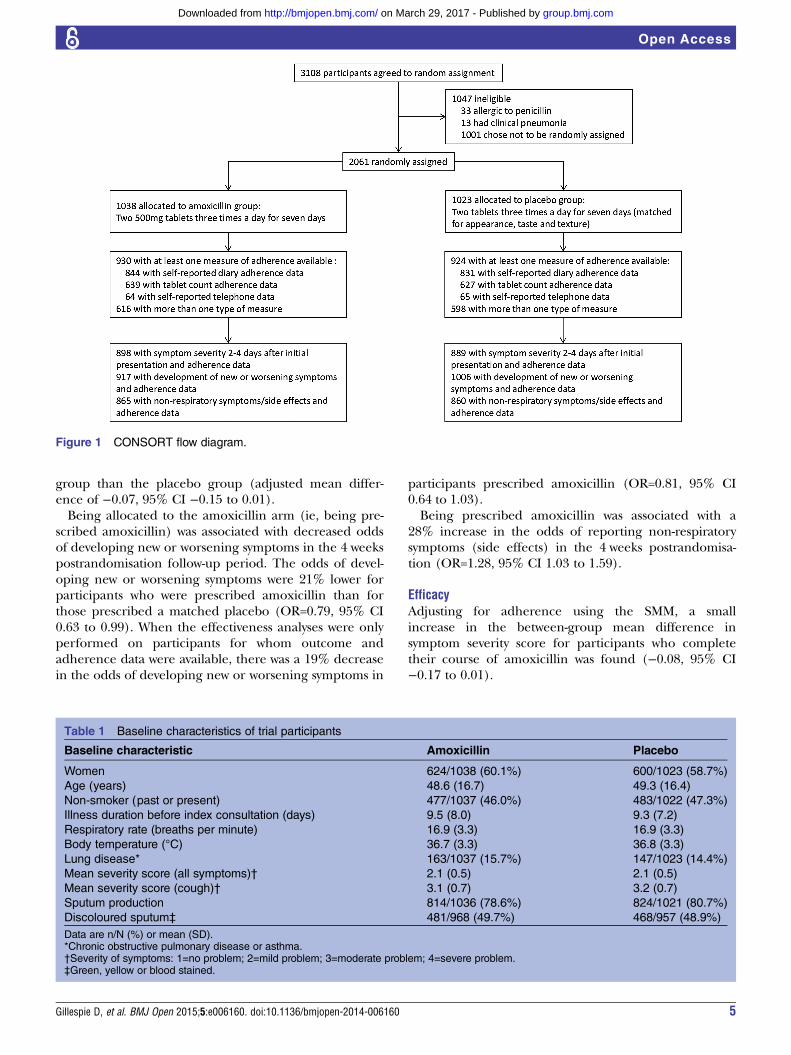
group than the placebo group (adjusted mean differ-ence of −0.07, 95% CI −0.15 to 0.01).Being allocated to the amoxicillin arm (ie, being pre-
scribed amoxicillin) was associated with decreased oddsof developing new or worsening symptoms in the 4 weekspostrandomisation follow-up period. The odds of devel-oping new or worsening symptoms were 21% lower forparticipants who were prescribed amoxicillin than forthose prescribed a matched placebo (OR=0.79, 95% CI0.63 to 0.99). When the effectiveness analyses were onlyperformed on participants for whom outcome andadherence data were available, there was a 19% decreasein the odds of developing new or worsening symptoms in
participants prescribed amoxicillin (OR=0.81, 95% CI0.64 to 1.03).Being prescribed amoxicillin was associated with a
28% increase in the odds of reporting non-respiratorysymptoms (side effects) in the 4 weeks postrandomisa-tion (OR=1.28, 95% CI 1.03 to 1.59).
EfficacyAdjusting for adherence using the SMM, a smallincrease in the between-group mean difference insymptom severity score for participants who completetheir course of amoxicillin was found (−0.08, 95% CI−0.17 to 0.01).
Figure 1 CONSORT flow diagram.
Table 1 Baseline characteristics of trial participants
Baseline characteristic Amoxicillin Placebo
Women 624/1038 (60.1%) 600/1023 (58.7%)
Age (years) 48.6 (16.7) 49.3 (16.4)
Non-smoker (past or present) 477/1037 (46.0%) 483/1022 (47.3%)
Illness duration before index consultation (days) 9.5 (8.0) 9.3 (7.2)
Respiratory rate (breaths per minute) 16.9 (3.3) 16.9 (3.3)
Body temperature (°C) 36.7 (3.3) 36.8 (3.3)
Lung disease* 163/1037 (15.7%) 147/1023 (14.4%)
Mean severity score (all symptoms)† 2.1 (0.5) 2.1 (0.5)
Mean severity score (cough)† 3.1 (0.7) 3.2 (0.7)
Sputum production 814/1036 (78.6%) 824/1021 (80.7%)
Discoloured sputum‡ 481/968 (49.7%) 468/957 (48.9%)
Data are n/N (%) or mean (SD).*Chronic obstructive pulmonary disease or asthma.†Severity of symptoms: 1=no problem; 2=mild problem; 3=moderate problem; 4=severe problem.‡Green, yellow or blood stained.
Gillespie D, et al. BMJ Open 2015;5:e006160. doi:10.1136/bmjopen-2014-006160 5
Open Access
group.bmj.com on March 29, 2017 - Published by http://bmjopen.bmj.com/Downloaded from
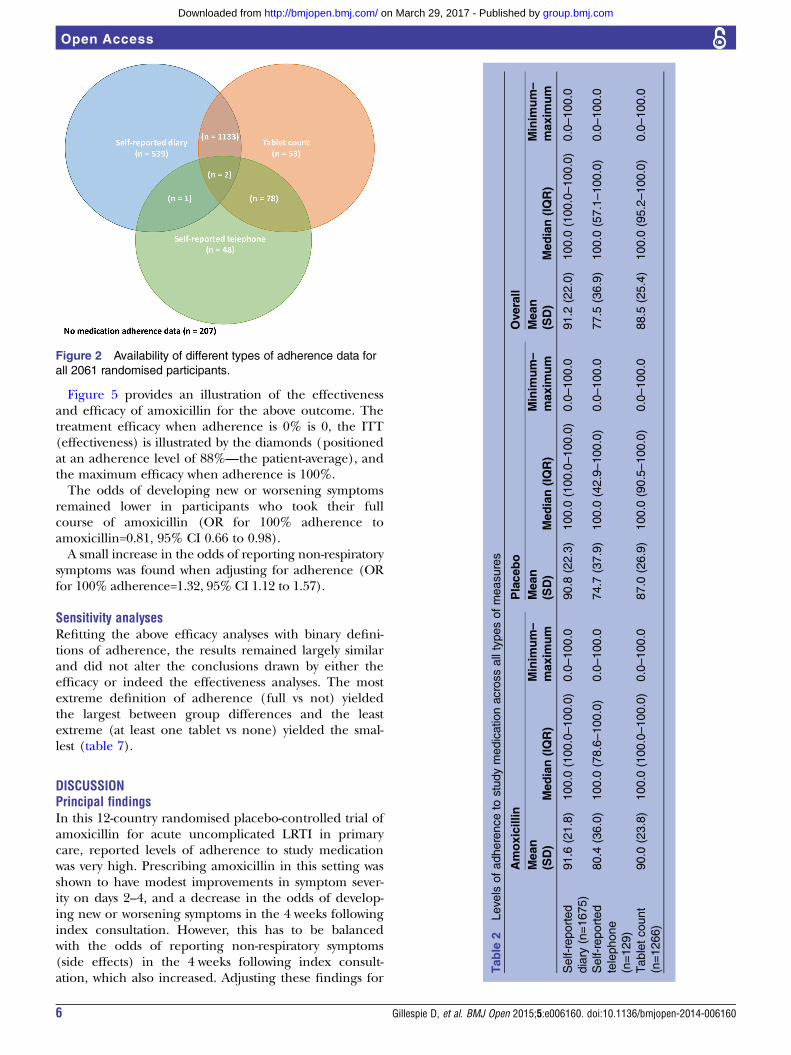
Figure 5 provides an illustration of the effectivenessand efficacy of amoxicillin for the above outcome. Thetreatment efficacy when adherence is 0% is 0, the ITT(effectiveness) is illustrated by the diamonds (positionedat an adherence level of 88%—the patient-average), andthe maximum efficacy when adherence is 100%.The odds of developing new or worsening symptoms
remained lower in participants who took their fullcourse of amoxicillin (OR for 100% adherence toamoxicillin=0.81, 95% CI 0.66 to 0.98).A small increase in the odds of reporting non-respiratory
symptoms was found when adjusting for adherence (ORfor 100% adherence=1.32, 95% CI 1.12 to 1.57).
Sensitivity analysesRefitting the above efficacy analyses with binary defini-tions of adherence, the results remained largely similarand did not alter the conclusions drawn by either theefficacy or indeed the effectiveness analyses. The mostextreme definition of adherence (full vs not) yieldedthe largest between group differences and the leastextreme (at least one tablet vs none) yielded the smal-lest (table 7).
DISCUSSIONPrincipal findingsIn this 12-country randomised placebo-controlled trial ofamoxicillin for acute uncomplicated LRTI in primarycare, reported levels of adherence to study medicationwas very high. Prescribing amoxicillin in this setting wasshown to have modest improvements in symptom sever-ity on days 2–4, and a decrease in the odds of develop-ing new or worsening symptoms in the 4 weeks followingindex consultation. However, this has to be balancedwith the odds of reporting non-respiratory symptoms(side effects) in the 4 weeks following index consult-ation, which also increased. Adjusting these findings for
Figure 2 Availability of different types of adherence data for
all 2061 randomised participants.
Table
2Levels
ofadherenceto
studymedicationacrossalltypesofmeasures
Amoxicillin
Placebo
Overall
Mean
(SD)
Median(IQR)
Minim
um–
maxim
um
Mean
(SD)
Median(IQR)
Minim
um–
maxim
um
Mean
(SD)
Median(IQR)
Minim
um–
maxim
um
Self-reported
diary
(n=1675)
91.6
(21.8)
100.0
(100.0–100.0)
0.0–100.0
90.8
(22.3)
100.0
(100.0–100.0)
0.0–100.0
91.2
(22.0)
100.0
(100.0–100.0)
0.0–100.0
Self-reported
telephone
(n=129)
80.4
(36.0)
100.0
(78.6–100.0)
0.0–100.0
74.7
(37.9)
100.0
(42.9–100.0)
0.0–100.0
77.5
(36.9)
100.0
(57.1–100.0)
0.0–100.0
Tabletcount
(n=1266)
90.0
(23.8)
100.0
(100.0–100.0)
0.0–100.0
87.0
(26.9)
100.0
(90.5–100.0)
0.0–100.0
88.5
(25.4)
100.0
(95.2–100.0)
0.0–100.0
6 Gillespie D, et al. BMJ Open 2015;5:e006160. doi:10.1136/bmjopen-2014-006160
Open Access
group.bmj.com on March 29, 2017 - Published by http://bmjopen.bmj.com/Downloaded from
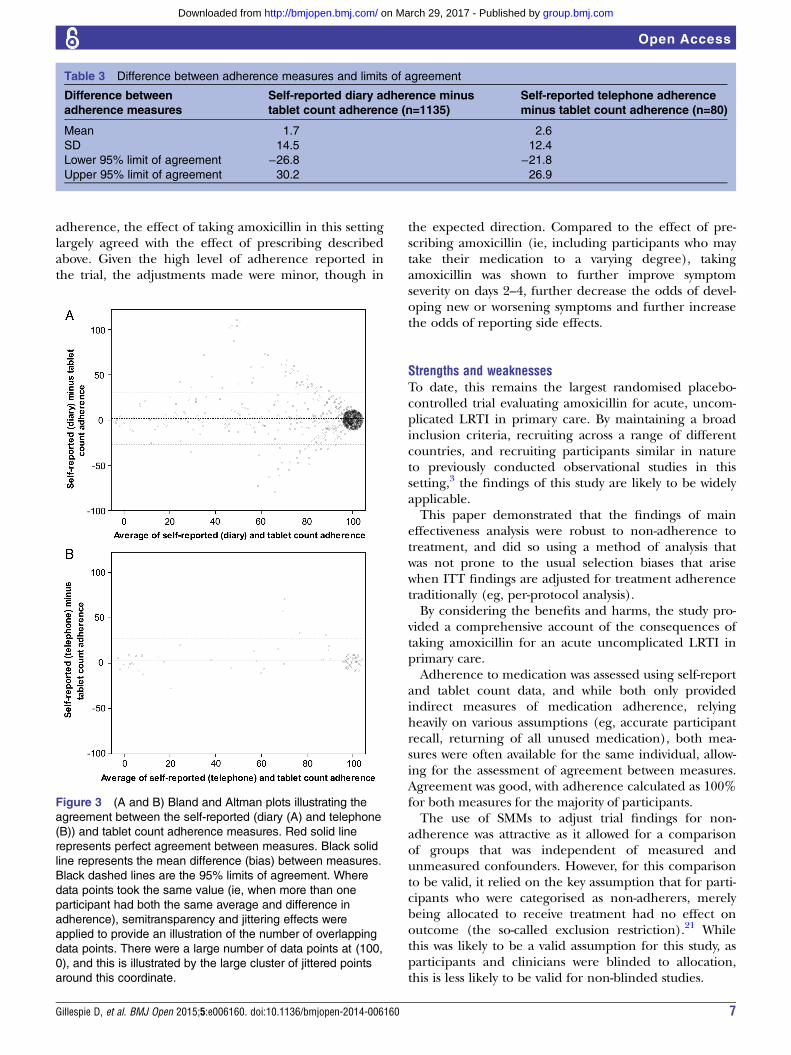
adherence, the effect of taking amoxicillin in this settinglargely agreed with the effect of prescribing describedabove. Given the high level of adherence reported inthe trial, the adjustments made were minor, though in
the expected direction. Compared to the effect of pre-scribing amoxicillin (ie, including participants who maytake their medication to a varying degree), takingamoxicillin was shown to further improve symptomseverity on days 2–4, further decrease the odds of devel-oping new or worsening symptoms and further increasethe odds of reporting side effects.
Strengths and weaknessesTo date, this remains the largest randomised placebo-controlled trial evaluating amoxicillin for acute, uncom-plicated LRTI in primary care. By maintaining a broadinclusion criteria, recruiting across a range of differentcountries, and recruiting participants similar in natureto previously conducted observational studies in thissetting,3 the findings of this study are likely to be widelyapplicable.This paper demonstrated that the findings of main
effectiveness analysis were robust to non-adherence totreatment, and did so using a method of analysis thatwas not prone to the usual selection biases that arisewhen ITT findings are adjusted for treatment adherencetraditionally (eg, per-protocol analysis).By considering the benefits and harms, the study pro-
vided a comprehensive account of the consequences oftaking amoxicillin for an acute uncomplicated LRTI inprimary care.Adherence to medication was assessed using self-report
and tablet count data, and while both only providedindirect measures of medication adherence, relyingheavily on various assumptions (eg, accurate participantrecall, returning of all unused medication), both mea-sures were often available for the same individual, allow-ing for the assessment of agreement between measures.Agreement was good, with adherence calculated as 100%for both measures for the majority of participants.The use of SMMs to adjust trial findings for non-
adherence was attractive as it allowed for a comparisonof groups that was independent of measured andunmeasured confounders. However, for this comparisonto be valid, it relied on the key assumption that for parti-cipants who were categorised as non-adherers, merelybeing allocated to receive treatment had no effect onoutcome (the so-called exclusion restriction).21 Whilethis was likely to be a valid assumption for this study, asparticipants and clinicians were blinded to allocation,this is less likely to be valid for non-blinded studies.
Table 3 Difference between adherence measures and limits of agreement
Difference between
adherence measures
Self-reported diary adherence minus
tablet count adherence (n=1135)
Self-reported telephone adherence
minus tablet count adherence (n=80)
Mean 1.7 2.6
SD 14.5 12.4
Lower 95% limit of agreement −26.8 −21.8Upper 95% limit of agreement 30.2 26.9
Figure 3 (A and B) Bland and Altman plots illustrating the
agreement between the self-reported (diary (A) and telephone
(B)) and tablet count adherence measures. Red solid line
represents perfect agreement between measures. Black solid
line represents the mean difference (bias) between measures.
Black dashed lines are the 95% limits of agreement. Where
data points took the same value (ie, when more than one
participant had both the same average and difference in
adherence), semitransparency and jittering effects were
applied to provide an illustration of the number of overlapping
data points. There were a large number of data points at (100,
0), and this is illustrated by the large cluster of jittered points
around this coordinate.
Gillespie D, et al. BMJ Open 2015;5:e006160. doi:10.1136/bmjopen-2014-006160 7
Open Access
group.bmj.com on March 29, 2017 - Published by http://bmjopen.bmj.com/Downloaded from
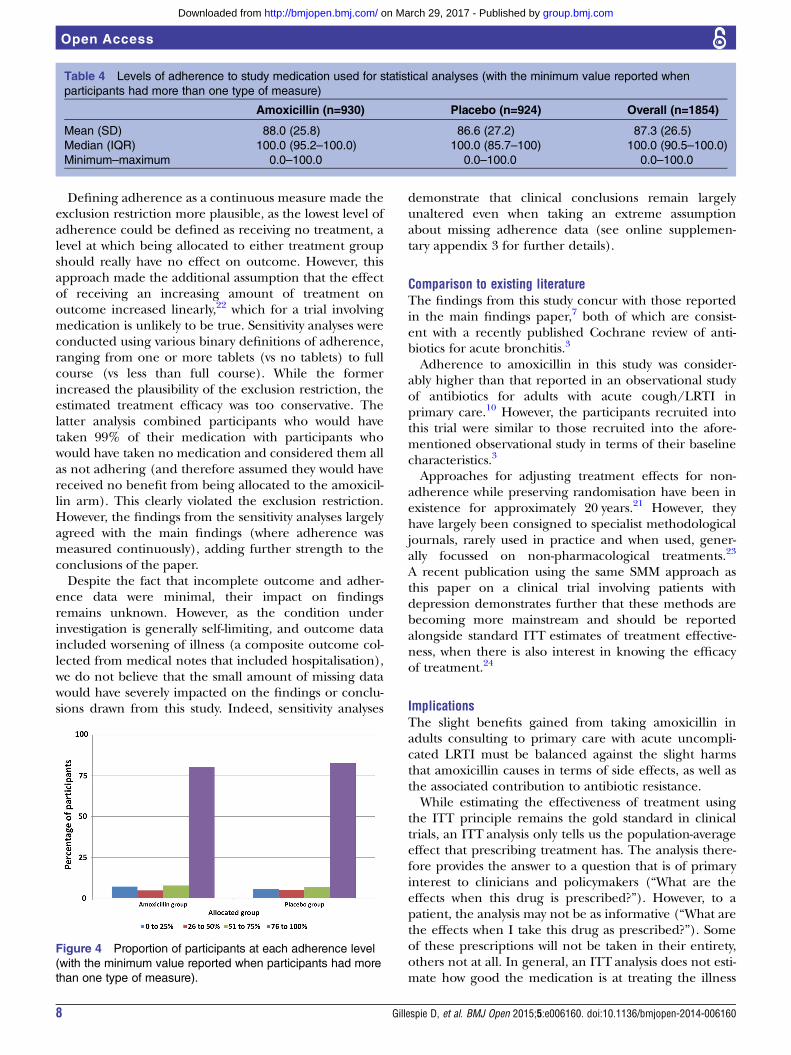
Defining adherence as a continuous measure made theexclusion restriction more plausible, as the lowest level ofadherence could be defined as receiving no treatment, alevel at which being allocated to either treatment groupshould really have no effect on outcome. However, thisapproach made the additional assumption that the effectof receiving an increasing amount of treatment onoutcome increased linearly,22 which for a trial involvingmedication is unlikely to be true. Sensitivity analyses wereconducted using various binary definitions of adherence,ranging from one or more tablets (vs no tablets) to fullcourse (vs less than full course). While the formerincreased the plausibility of the exclusion restriction, theestimated treatment efficacy was too conservative. Thelatter analysis combined participants who would havetaken 99% of their medication with participants whowould have taken no medication and considered them allas not adhering (and therefore assumed they would havereceived no benefit from being allocated to the amoxicil-lin arm). This clearly violated the exclusion restriction.However, the findings from the sensitivity analyses largelyagreed with the main findings (where adherence wasmeasured continuously), adding further strength to theconclusions of the paper.Despite the fact that incomplete outcome and adher-
ence data were minimal, their impact on findingsremains unknown. However, as the condition underinvestigation is generally self-limiting, and outcome dataincluded worsening of illness (a composite outcome col-lected from medical notes that included hospitalisation),we do not believe that the small amount of missing datawould have severely impacted on the findings or conclu-sions drawn from this study. Indeed, sensitivity analyses
demonstrate that clinical conclusions remain largelyunaltered even when taking an extreme assumptionabout missing adherence data (see online supplemen-tary appendix 3 for further details).
Comparison to existing literatureThe findings from this study concur with those reportedin the main findings paper,7 both of which are consist-ent with a recently published Cochrane review of anti-biotics for acute bronchitis.3
Adherence to amoxicillin in this study was consider-ably higher than that reported in an observational studyof antibiotics for adults with acute cough/LRTI inprimary care.10 However, the participants recruited intothis trial were similar to those recruited into the afore-mentioned observational study in terms of their baselinecharacteristics.3
Approaches for adjusting treatment effects for non-adherence while preserving randomisation have been inexistence for approximately 20 years.21 However, theyhave largely been consigned to specialist methodologicaljournals, rarely used in practice and when used, gener-ally focussed on non-pharmacological treatments.23
A recent publication using the same SMM approach asthis paper on a clinical trial involving patients withdepression demonstrates further that these methods arebecoming more mainstream and should be reportedalongside standard ITT estimates of treatment effective-ness, when there is also interest in knowing the efficacyof treatment.24
ImplicationsThe slight benefits gained from taking amoxicillin inadults consulting to primary care with acute uncompli-cated LRTI must be balanced against the slight harmsthat amoxicillin causes in terms of side effects, as well asthe associated contribution to antibiotic resistance.While estimating the effectiveness of treatment using
the ITT principle remains the gold standard in clinicaltrials, an ITT analysis only tells us the population-averageeffect that prescribing treatment has. The analysis there-fore provides the answer to a question that is of primaryinterest to clinicians and policymakers (“What are theeffects when this drug is prescribed?”). However, to apatient, the analysis may not be as informative (“What arethe effects when I take this drug as prescribed?”). Someof these prescriptions will not be taken in their entirety,others not at all. In general, an ITT analysis does not esti-mate how good the medication is at treating the illness
Table 4 Levels of adherence to study medication used for statistical analyses (with the minimum value reported when
participants had more than one type of measure)
Amoxicillin (n=930) Placebo (n=924) Overall (n=1854)
Mean (SD) 88.0 (25.8) 86.6 (27.2) 87.3 (26.5)
Median (IQR) 100.0 (95.2–100.0) 100.0 (85.7–100) 100.0 (90.5–100.0)
Minimum–maximum 0.0–100.0 0.0–100.0 0.0–100.0
Figure 4 Proportion of participants at each adherence level
(with the minimum value reported when participants had more
than one type of measure).
8 Gillespie D, et al. BMJ Open 2015;5:e006160. doi:10.1136/bmjopen-2014-006160
Open Access
group.bmj.com on March 29, 2017 - Published by http://bmjopen.bmj.com/Downloaded from
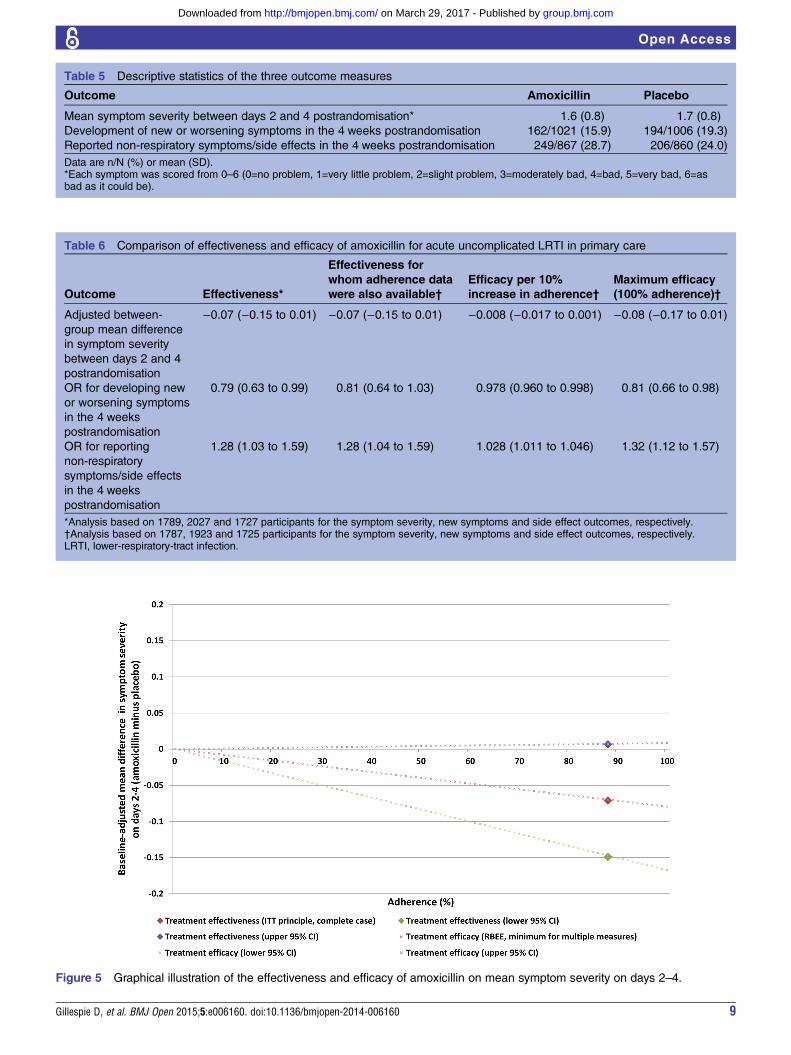
Table 6 Comparison of effectiveness and efficacy of amoxicillin for acute uncomplicated LRTI in primary care
Outcome Effectiveness*
Effectiveness for
whom adherence data
were also available†
Efficacy per 10%
increase in adherence†
Maximum efficacy
(100% adherence)†
Adjusted between-
group mean difference
in symptom severity
between days 2 and 4
postrandomisation
−0.07 (−0.15 to 0.01) −0.07 (−0.15 to 0.01) −0.008 (−0.017 to 0.001) −0.08 (−0.17 to 0.01)
OR for developing new
or worsening symptoms
in the 4 weeks
postrandomisation
0.79 (0.63 to 0.99) 0.81 (0.64 to 1.03) 0.978 (0.960 to 0.998) 0.81 (0.66 to 0.98)
OR for reporting
non-respiratory
symptoms/side effects
in the 4 weeks
postrandomisation
1.28 (1.03 to 1.59) 1.28 (1.04 to 1.59) 1.028 (1.011 to 1.046) 1.32 (1.12 to 1.57)
*Analysis based on 1789, 2027 and 1727 participants for the symptom severity, new symptoms and side effect outcomes, respectively.†Analysis based on 1787, 1923 and 1725 participants for the symptom severity, new symptoms and side effect outcomes, respectively.LRTI, lower-respiratory-tract infection.
Table 5 Descriptive statistics of the three outcome measures
Outcome Amoxicillin Placebo
Mean symptom severity between days 2 and 4 postrandomisation* 1.6 (0.8) 1.7 (0.8)
Development of new or worsening symptoms in the 4 weeks postrandomisation 162/1021 (15.9) 194/1006 (19.3)
Reported non-respiratory symptoms/side effects in the 4 weeks postrandomisation 249/867 (28.7) 206/860 (24.0)
Data are n/N (%) or mean (SD).*Each symptom was scored from 0–6 (0=no problem, 1=very little problem, 2=slight problem, 3=moderately bad, 4=bad, 5=very bad, 6=asbad as it could be).
Figure 5 Graphical illustration of the effectiveness and efficacy of amoxicillin on mean symptom severity on days 2–4.
Gillespie D, et al. BMJ Open 2015;5:e006160. doi:10.1136/bmjopen-2014-006160 9
Open Access
group.bmj.com on March 29, 2017 - Published by http://bmjopen.bmj.com/Downloaded from
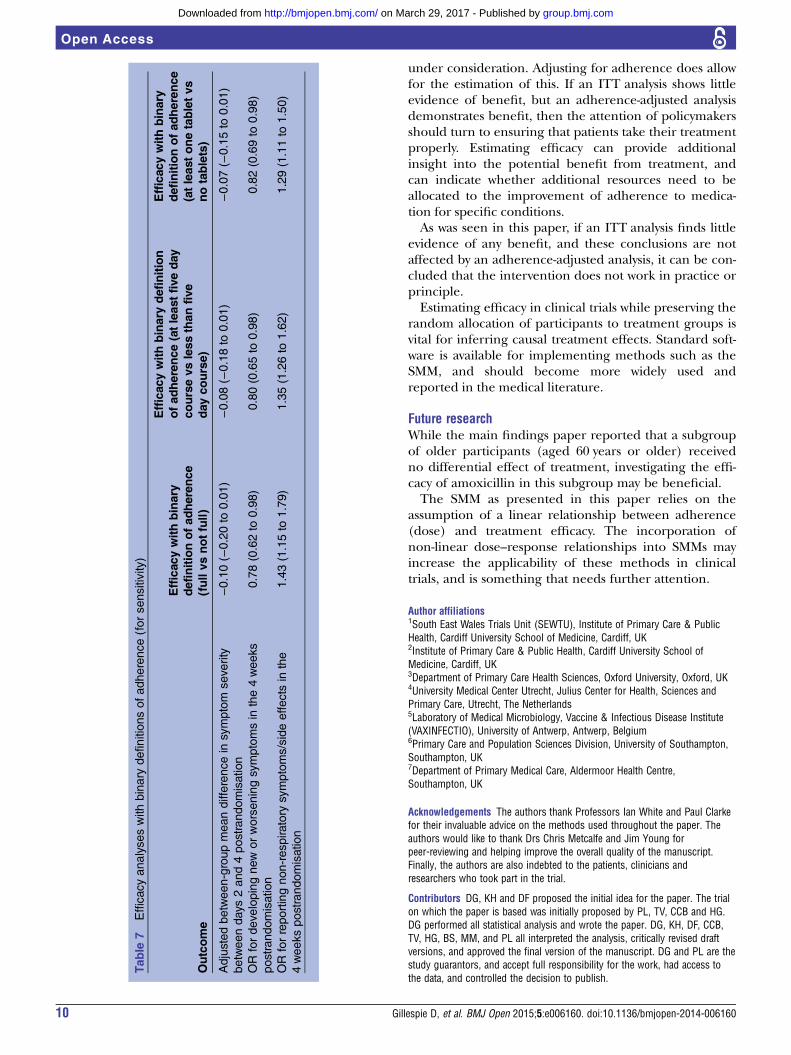
under consideration. Adjusting for adherence does allowfor the estimation of this. If an ITT analysis shows littleevidence of benefit, but an adherence-adjusted analysisdemonstrates benefit, then the attention of policymakersshould turn to ensuring that patients take their treatmentproperly. Estimating efficacy can provide additionalinsight into the potential benefit from treatment, andcan indicate whether additional resources need to beallocated to the improvement of adherence to medica-tion for specific conditions.As was seen in this paper, if an ITT analysis finds little
evidence of any benefit, and these conclusions are notaffected by an adherence-adjusted analysis, it can be con-cluded that the intervention does not work in practice orprinciple.Estimating efficacy in clinical trials while preserving the
random allocation of participants to treatment groups isvital for inferring causal treatment effects. Standard soft-ware is available for implementing methods such as theSMM, and should become more widely used andreported in the medical literature.
Future researchWhile the main findings paper reported that a subgroupof older participants (aged 60 years or older) receivedno differential effect of treatment, investigating the effi-cacy of amoxicillin in this subgroup may be beneficial.The SMM as presented in this paper relies on the
assumption of a linear relationship between adherence(dose) and treatment efficacy. The incorporation ofnon-linear dose–response relationships into SMMs mayincrease the applicability of these methods in clinicaltrials, and is something that needs further attention.
Author affiliations1South East Wales Trials Unit (SEWTU), Institute of Primary Care & PublicHealth, Cardiff University School of Medicine, Cardiff, UK2Institute of Primary Care & Public Health, Cardiff University School ofMedicine, Cardiff, UK3Department of Primary Care Health Sciences, Oxford University, Oxford, UK4University Medical Center Utrecht, Julius Center for Health, Sciences andPrimary Care, Utrecht, The Netherlands5Laboratory of Medical Microbiology, Vaccine & Infectious Disease Institute(VAXINFECTIO), University of Antwerp, Antwerp, Belgium6Primary Care and Population Sciences Division, University of Southampton,Southampton, UK7Department of Primary Medical Care, Aldermoor Health Centre,Southampton, UK
Acknowledgements The authors thank Professors Ian White and Paul Clarkefor their invaluable advice on the methods used throughout the paper. Theauthors would like to thank Drs Chris Metcalfe and Jim Young forpeer-reviewing and helping improve the overall quality of the manuscript.Finally, the authors are also indebted to the patients, clinicians andresearchers who took part in the trial.
Contributors DG, KH and DF proposed the initial idea for the paper. The trialon which the paper is based was initially proposed by PL, TV, CCB and HG.DG performed all statistical analysis and wrote the paper. DG, KH, DF, CCB,TV, HG, BS, MM, and PL all interpreted the analysis, critically revised draftversions, and approved the final version of the manuscript. DG and PL are thestudy guarantors, and accept full responsibility for the work, had access tothe data, and controlled the decision to publish.
Table
7Efficacyanalyseswithbinary
definitionsofadherence(forsensitivity)
Outcome
Efficacywithbinary
definitionofadherence
(fullvsnotfull)
Efficacywithbinary
definition
ofadherence(atleastfiveday
coursevslessthanfive
daycourse)
Efficacywithbinary
definitionofadherence
(atleastonetabletvs
notablets)
Adjustedbetween-groupmeandifferencein
symptom
severity
betweendays2and4postrandomisation
−0.10(−0.20to
0.01)
−0.08(−
0.18to
0.01)
−0.07(−
0.15to
0.01)
OR
fordevelopingnew
orworseningsymptomsin
the4weeks
postrandomisation
0.78(0.62to
0.98)
0.80(0.65to
0.98)
0.82(0.69to
0.98)
OR
forreportingnon-respiratory
symptoms/sideeffects
inthe
4weekspostrandomisation
1.43(1.15to
1.79)
1.35(1.26to
1.62)
1.29(1.11to
1.50)
10 Gillespie D, et al. BMJ Open 2015;5:e006160. doi:10.1136/bmjopen-2014-006160
Open Access
group.bmj.com on March 29, 2017 - Published by http://bmjopen.bmj.com/Downloaded from
Funding Funding was from the European Commission FrameworkProgramme 6 (LSHM-CT-2005-518226). Eudract-CT 2007-001586-15 UKCRNPortfolio ID 4175 ISRCTN52261229 FWO G.0274.08N. The researchers areindependent of all funders. The work in the UK was also supported by theNational Institute for Health Research. In Barcelona, the work was supportedby: 2009 SGR 911, Ciber de Enfermedades Respiratorias (Ciberes CB06/06/0028), the Ciberes is an initative of the ISCIII. In Flanders (Belgium), thiswork was supported by the Research Foundation—Flanders (FWO;G.0274.08N). The South East Wales Trials Unit is funded by the NationalInstitute for Social Care and Health Research (NISCHR).
Competing interests None.
Ethics approval Ethical approval for the UK was granted by Southampton andSouth West Hampshire Local Research Ethics Committee (B) (ref. 07/H0504/104). Competent authority approval for the UK was granted by the Medicinesand Healthcare Products Regulatory Agency. The research sites outside of theUK also obtained ethical and competent authority approval from their localorganisations. Patients who fulfilled the inclusion criteria were given writtenand verbal information on the study and asked for informed consent.
Provenance and peer review Not commissioned; externally peer reviewed.
Data sharing statement No additional data are available.
Open Access This is an Open Access article distributed in accordance withthe Creative Commons Attribution Non Commercial (CC BY-NC 4.0) license,which permits others to distribute, remix, adapt, build upon this work non-commercially, and license their derivative works on different terms, providedthe original work is properly cited and the use is non-commercial. See: http://creativecommons.org/licenses/by-nc/4.0/
REFERENCES1. Hansell A, Hollowell J, Nichols T, et al. Use of the General Practice
Research Database (GPRD) for respiratory epidemiology:a comparison with the 4th Morbidity Survey in General Practice(MSGP4). Thorax 1999;54:413–19.
2. Ashworth M, Latinovic R, Charlton J, et al. Why has antibioticprescribing for respiratory illness declined in primary care?A longitudinal study using the General Practice Research Database.J Public Health (Oxf) 2004;26:268–74.
3. Butler CC, Hood K, Verheij T, et al. Variation in antibiotic prescribingand its impact on recovery in patients with acute cough in primarycare: prospective study in 13 countries. BMJ 2009;338:1545.
4. Smith SM, Fahey T, Smucny J, et al. Antibiotics for acute bronchitis.Cochrane Database Syst Rev 2014;3:CD000245.
5. Standing Medical Advisory Committee subgroup on antimicrobialresistance. The path of least resistance. London: Department of Health,1998. http://www.advisorybodies.doh.gov.uk/SMAC/SMAC1.HTM
6. World Health Organization. Antimicrobial resistance: global report onsurveillance. World Health Organization, 2014.
7. Little P, Stuart B, Moore M, et al. Amoxicillin for acute lower-respiratory-tract infection in primary care when pneumonia is notsuspected: a 12-country, randomised, placebo-controlled trial.Lancet Infect Dis 2013;3(2):123–9.
8. Montori VM, Guyatt GH. Intention-to-treat principle. CMAJ2001;165:1339–41.
9. Kardas P, Devine S, Golembesky A, et al. A systematic review andmeta-analysis of misuse of antibiotic therapies in the community.Int J Antimicrob Agents 2005;26:106–13.
10. Francis NA, Gillespie D, Nuttall J, et al. Antibiotics for acute cough:an international observational study of patient adherence in primarycare. Br J Gen Pract 2012;62:e429–37.
11. White IR. Uses and limitations of randomization-based efficacyestimators. Stat Methods Med Res 2005;14:327–47.
12. International Conference on Harmonisation E9 Expert WorkingGroup. ICH Harmonised Tripartite Guideline. Statistical principles forclinical trials. Stat Med 1999;18:1905–42.
13. White IR, Walker S, Babiker AG, et al. Impact of treatmentchanges on the interpretation of the Concorde trial. AIDS1997;11:999–1006.
14. Tilbrook HE, Hewitt CE, Aplin JD, et al. Compliance effects in arandomised controlled trial of yoga for chronic low back pain:a methodological study. Physiotherapy 2014;100:256–62.
15. Wiles NJ, Fischer K, Cowen P, et al. Allowing for non-adherence totreatment in a randomized controlled trial of two antidepressants(citalopram versus reboxetine): an example from the GENPOD trial.Psychol Med 2014;44:2855–66.
16. Bland MJ, Altman DG. Statistical methods for assessing agreementbetween two methods of clinical measurement. Lancet1986;327:307–10.
17. Fischer-Lapp K, Goetghebeur E. Practical properties of somestructural mean analyses of the effect of compliance in randomizedtrials. Control Clin Trials 1999;20:531–46.
18. Vansteelandt S, Goetghebeur E. Causal inference with generalizedstructural mean models. J R Stat Soc B 2003;65:817–35.
19. IBM Corp. IBM SPSS Statistics for Windows, Version 20.0. Armonk,NY: IBM Corp, Released 2011.
20. StataCorp. Stata Statistical Software: Release 13. College Station,TX: StataCorp LP, 2013.
21. Angrist JD, Imbens GW, Rubin DB. Identification of causaleffects using instrumental variables. J Am Stat Assoc1996;91:444–55.
22. Hernán MA, Robins JM. Instruments for causal inference:an epidemiologist’s dream? Epidemiology 2006;17:360–72.
23. Dunn G, Maracy M, Dowrick C, et al. Estimating psychologicaltreatment effects from a randomised controlled trial with bothnon-compliance and loss to follow-up. Br J Psychiatry2003;183:323–31.
24. White IR, Kalaitzaki E, Thompson SG. Allowing for missing outcomedata and incomplete uptake of randomised interventions, withapplication to an Internet-based alcohol trial. Stat Med2011;30:3192–207.
Gillespie D, et al. BMJ Open 2015;5:e006160. doi:10.1136/bmjopen-2014-006160 11
Open Access
group.bmj.com on March 29, 2017 - Published by http://bmjopen.bmj.com/Downloaded from
randomisation-based efficacy estimatorsrandomised placebo-controlled trial usingLRTI: secondary analysis of a 12-country
forand harms from treatment with amoxicillin Adherence-adjusted estimates of benefits
and On behalf of the GRACE consortiumTheo Verheij, Herman Goossens, Beth Stuart, Mark Mullee, Paul Little David Gillespie, Kerenza Hood, Daniel Farewell, Christopher C Butler,
doi: 10.1136/bmjopen-2014-0061602015 5: BMJ Open
http://bmjopen.bmj.com/content/5/3/e006160Updated information and services can be found at:
These include:
MaterialSupplementary
160.DC1http://bmjopen.bmj.com/content/suppl/2015/03/06/bmjopen-2014-006Supplementary material can be found at:
References #BIBLhttp://bmjopen.bmj.com/content/5/3/e006160
This article cites 20 articles, 6 of which you can access for free at:
Open Access
http://creativecommons.org/licenses/by-nc/4.0/non-commercial. See: provided the original work is properly cited and the use isnon-commercially, and license their derivative works on different terms, permits others to distribute, remix, adapt, build upon this workCommons Attribution Non Commercial (CC BY-NC 4.0) license, which This is an Open Access article distributed in accordance with the Creative
serviceEmail alerting
box at the top right corner of the online article. Receive free email alerts when new articles cite this article. Sign up in the
CollectionsTopic Articles on similar topics can be found in the following collections
(317)Respiratory medicine (575)Research methods
(610)General practice / Family practice (682)Evidence based practice
Notes
http://group.bmj.com/group/rights-licensing/permissionsTo request permissions go to:
http://journals.bmj.com/cgi/reprintformTo order reprints go to:
http://group.bmj.com/subscribe/To subscribe to BMJ go to:
group.bmj.com on March 29, 2017 - Published by http://bmjopen.bmj.com/Downloaded from
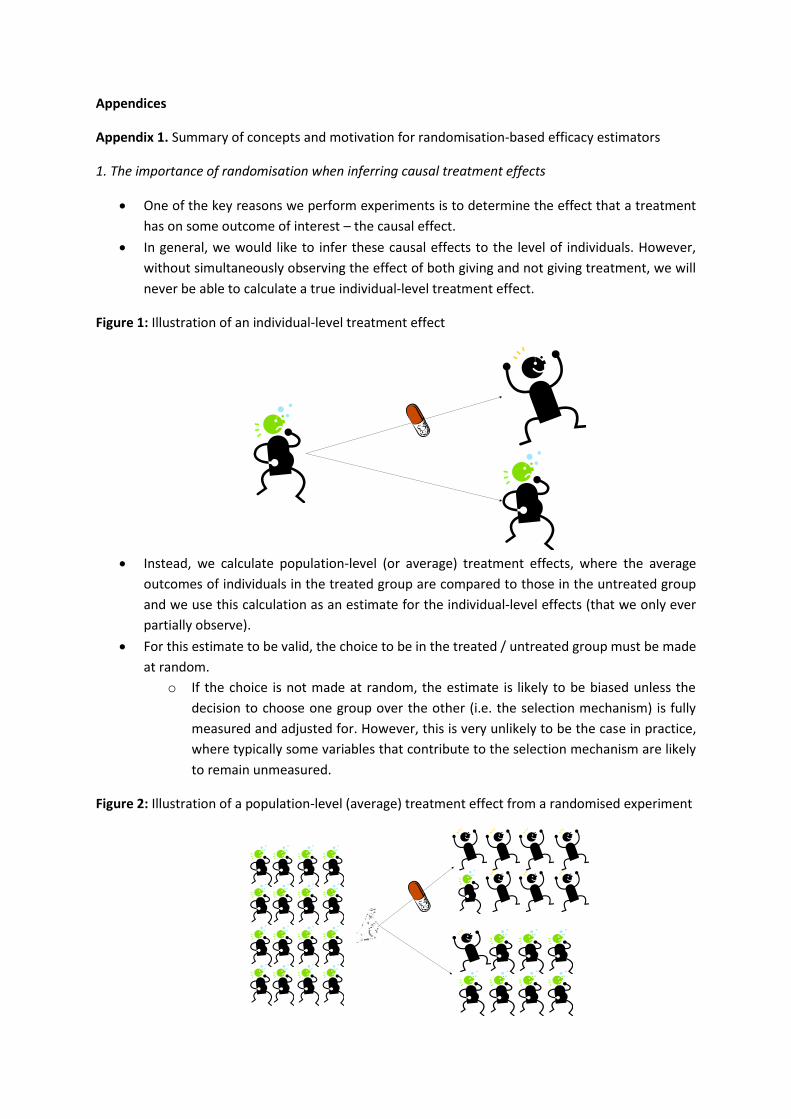
Appendices
Appendix 1. Summary of concepts and motivation for randomisation-based efficacy estimators
1. The importance of randomisation when inferring causal treatment effects
One of the key reasons we perform experiments is to determine the effect that a treatment
has on some outcome of interest – the causal effect.
In general, we would like to infer these causal effects to the level of individuals. However,
without simultaneously observing the effect of both giving and not giving treatment, we will
never be able to calculate a true individual-level treatment effect.
Figure 1: Illustration of an individual-level treatment effect
Instead, we calculate population-level (or average) treatment effects, where the average
outcomes of individuals in the treated group are compared to those in the untreated group
and we use this calculation as an estimate for the individual-level effects (that we only ever
partially observe).
For this estimate to be valid, the choice to be in the treated / untreated group must be made
at random.
o If the choice is not made at random, the estimate is likely to be biased unless the
decision to choose one group over the other (i.e. the selection mechanism) is fully
measured and adjusted for. However, this is very unlikely to be the case in practice,
where typically some variables that contribute to the selection mechanism are likely
to remain unmeasured.
Figure 2: Illustration of a population-level (average) treatment effect from a randomised experiment
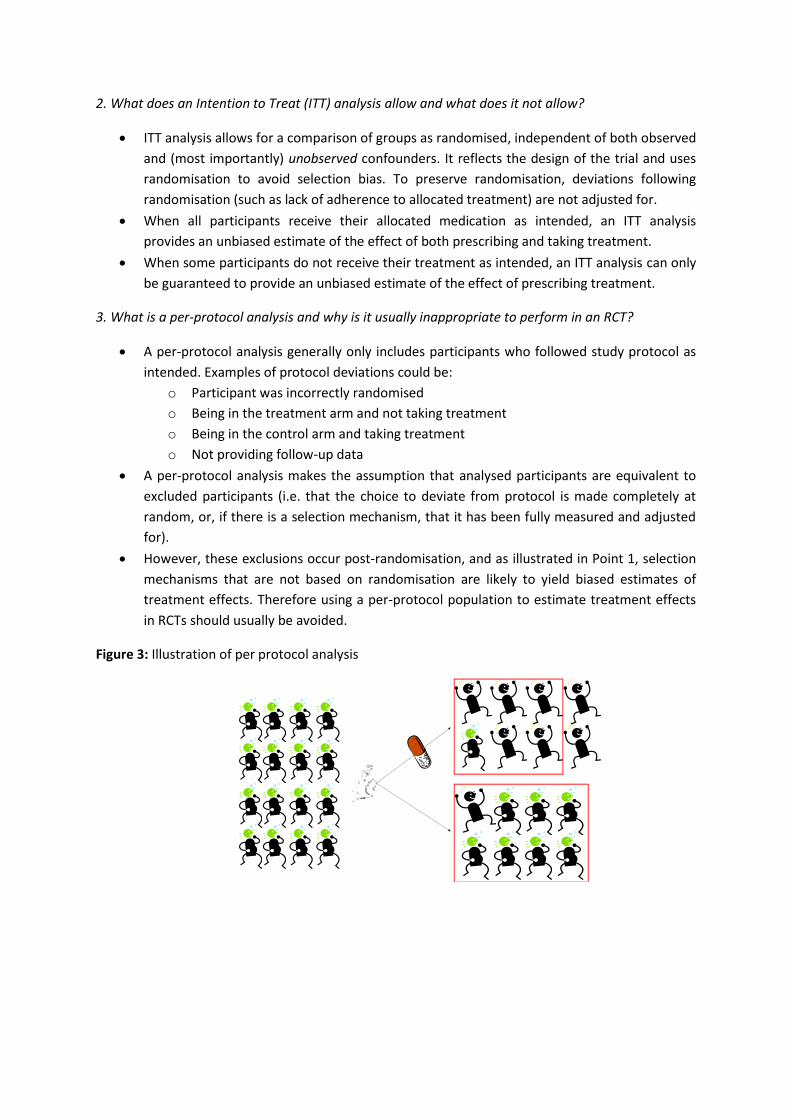
2. What does an Intention to Treat (ITT) analysis allow and what does it not allow?
ITT analysis allows for a comparison of groups as randomised, independent of both observed
and (most importantly) unobserved confounders. It reflects the design of the trial and uses
randomisation to avoid selection bias. To preserve randomisation, deviations following
randomisation (such as lack of adherence to allocated treatment) are not adjusted for.
When all participants receive their allocated medication as intended, an ITT analysis
provides an unbiased estimate of the effect of both prescribing and taking treatment.
When some participants do not receive their treatment as intended, an ITT analysis can only
be guaranteed to provide an unbiased estimate of the effect of prescribing treatment.
3. What is a per-protocol analysis and why is it usually inappropriate to perform in an RCT?
A per-protocol analysis generally only includes participants who followed study protocol as
intended. Examples of protocol deviations could be:
o Participant was incorrectly randomised
o Being in the treatment arm and not taking treatment
o Being in the control arm and taking treatment
o Not providing follow-up data
A per-protocol analysis makes the assumption that analysed participants are equivalent to
excluded participants (i.e. that the choice to deviate from protocol is made completely at
random, or, if there is a selection mechanism, that it has been fully measured and adjusted
for).
However, these exclusions occur post-randomisation, and as illustrated in Point 1, selection
mechanisms that are not based on randomisation are likely to yield biased estimates of
treatment effects. Therefore using a per-protocol population to estimate treatment effects
in RCTs should usually be avoided.
Figure 3: Illustration of per protocol analysis
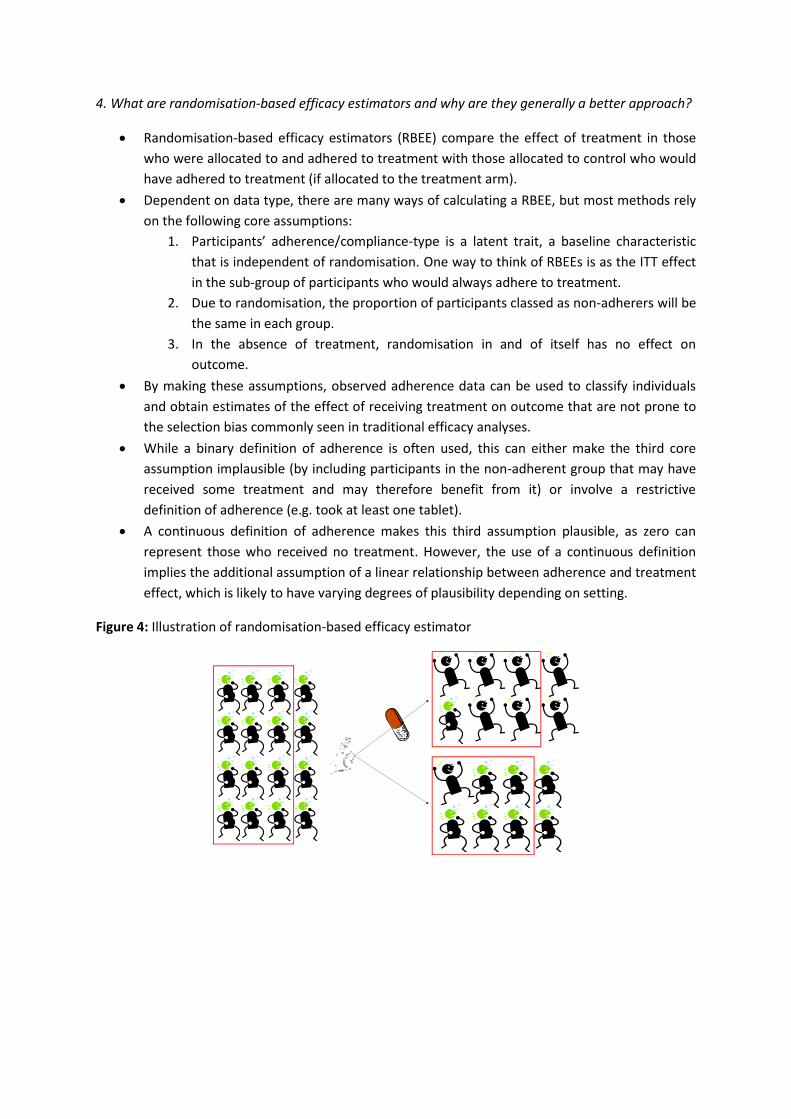
4. What are randomisation-based efficacy estimators and why are they generally a better approach?
Randomisation-based efficacy estimators (RBEE) compare the effect of treatment in those
who were allocated to and adhered to treatment with those allocated to control who would
have adhered to treatment (if allocated to the treatment arm).
Dependent on data type, there are many ways of calculating a RBEE, but most methods rely
on the following core assumptions:
1. Participants’ adherence/compliance-type is a latent trait, a baseline characteristic
that is independent of randomisation. One way to think of RBEEs is as the ITT effect
in the sub-group of participants who would always adhere to treatment.
2. Due to randomisation, the proportion of participants classed as non-adherers will be
the same in each group.
3. In the absence of treatment, randomisation in and of itself has no effect on
outcome.
By making these assumptions, observed adherence data can be used to classify individuals
and obtain estimates of the effect of receiving treatment on outcome that are not prone to
the selection bias commonly seen in traditional efficacy analyses.
While a binary definition of adherence is often used, this can either make the third core
assumption implausible (by including participants in the non-adherent group that may have
received some treatment and may therefore benefit from it) or involve a restrictive
definition of adherence (e.g. took at least one tablet).
A continuous definition of adherence makes this third assumption plausible, as zero can
represent those who received no treatment. However, the use of a continuous definition
implies the additional assumption of a linear relationship between adherence and treatment
effect, which is likely to have varying degrees of plausibility depending on setting.
Figure 4: Illustration of randomisation-based efficacy estimator
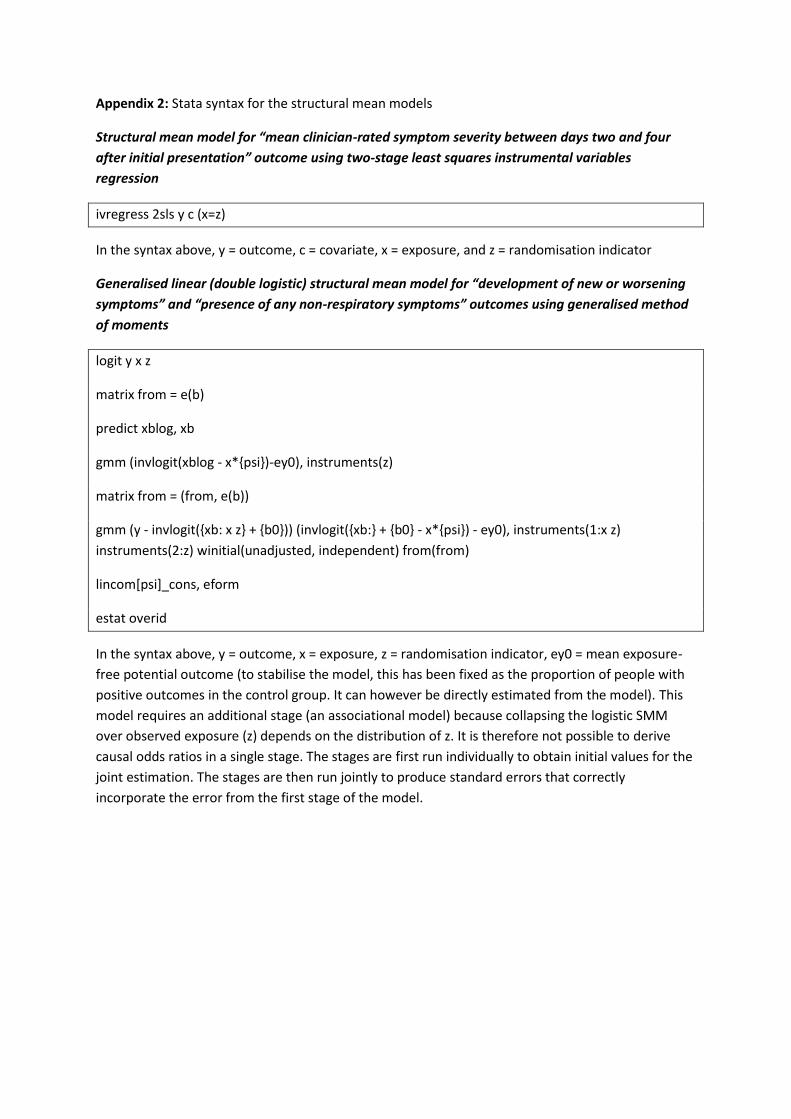
Appendix 2: Stata syntax for the structural mean models
Structural mean model for “mean clinician-rated symptom severity between days two and four
after initial presentation” outcome using two-stage least squares instrumental variables
regression
ivregress 2sls y c (x=z)
In the syntax above, y = outcome, c = covariate, x = exposure, and z = randomisation indicator
Generalised linear (double logistic) structural mean model for “development of new or worsening
symptoms” and “presence of any non-respiratory symptoms” outcomes using generalised method
of moments
logit y x z
matrix from = e(b)
predict xblog, xb
gmm (invlogit(xblog - x*{psi})-ey0), instruments(z)
matrix from = (from, e(b))
gmm (y - invlogit({xb: x z} + {b0})) (invlogit({xb:} + {b0} - x*{psi}) - ey0), instruments(1:x z)
instruments(2:z) winitial(unadjusted, independent) from(from)
lincom[psi]_cons, eform
estat overid
In the syntax above, y = outcome, x = exposure, z = randomisation indicator, ey0 = mean exposure-
free potential outcome (to stabilise the model, this has been fixed as the proportion of people with
positive outcomes in the control group. It can however be directly estimated from the model). This
model requires an additional stage (an associational model) because collapsing the logistic SMM
over observed exposure (z) depends on the distribution of z. It is therefore not possible to derive
causal odds ratios in a single stage. The stages are first run individually to obtain initial values for the
joint estimation. The stages are then run jointly to produce standard errors that correctly
incorporate the error from the first stage of the model.
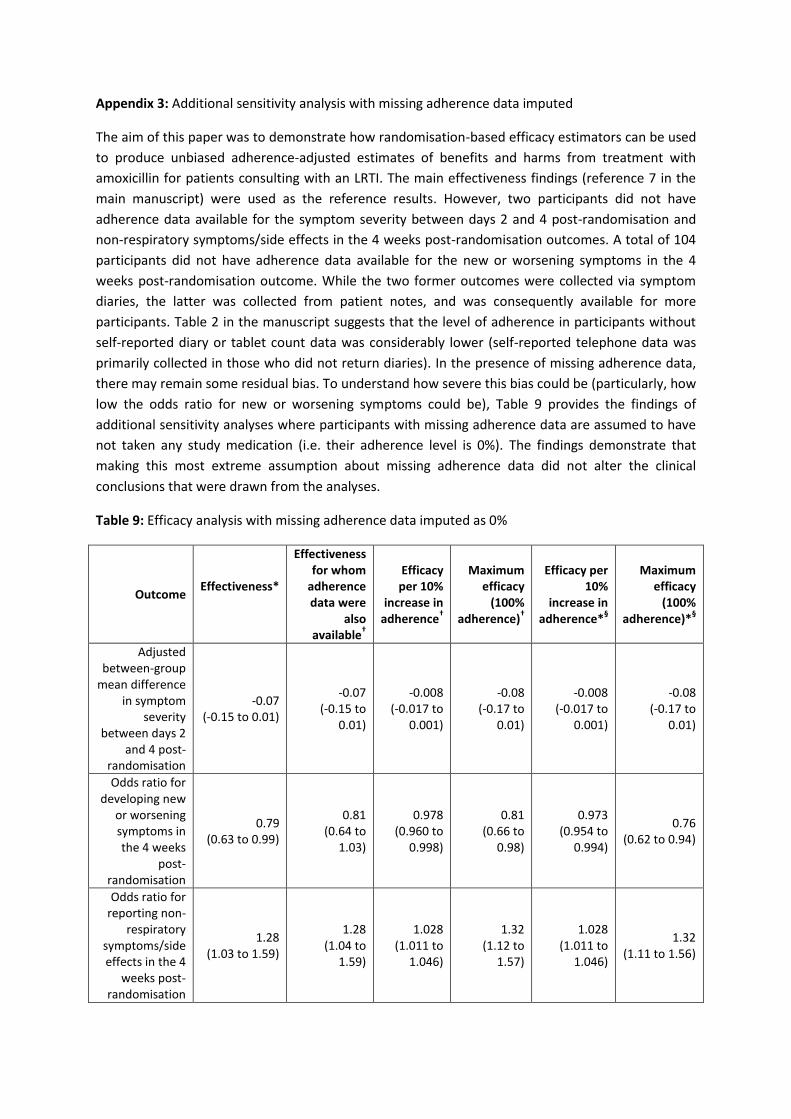
Appendix 3: Additional sensitivity analysis with missing adherence data imputed
The aim of this paper was to demonstrate how randomisation-based efficacy estimators can be used
to produce unbiased adherence-adjusted estimates of benefits and harms from treatment with
amoxicillin for patients consulting with an LRTI. The main effectiveness findings (reference 7 in the
main manuscript) were used as the reference results. However, two participants did not have
adherence data available for the symptom severity between days 2 and 4 post-randomisation and
non-respiratory symptoms/side effects in the 4 weeks post-randomisation outcomes. A total of 104
participants did not have adherence data available for the new or worsening symptoms in the 4
weeks post-randomisation outcome. While the two former outcomes were collected via symptom
diaries, the latter was collected from patient notes, and was consequently available for more
participants. Table 2 in the manuscript suggests that the level of adherence in participants without
self-reported diary or tablet count data was considerably lower (self-reported telephone data was
primarily collected in those who did not return diaries). In the presence of missing adherence data,
there may remain some residual bias. To understand how severe this bias could be (particularly, how
low the odds ratio for new or worsening symptoms could be), Table 9 provides the findings of
additional sensitivity analyses where participants with missing adherence data are assumed to have
not taken any study medication (i.e. their adherence level is 0%). The findings demonstrate that
making this most extreme assumption about missing adherence data did not alter the clinical
conclusions that were drawn from the analyses.
Table 9: Efficacy analysis with missing adherence data imputed as 0%
Outcome Effectiveness*
Effectiveness for whom
adherence data were
also available
†
Efficacy per 10%
increase in adherence
†
Maximum efficacy
(100% adherence)
†
Efficacy per 10%
increase in adherence*
§
Maximum efficacy
(100% adherence)*
§
Adjusted between-group
mean difference in symptom
severity between days 2
and 4 post-randomisation
-0.07 (-0.15 to 0.01)
-0.07 (-0.15 to
0.01)
-0.008 (-0.017 to
0.001)
-0.08 (-0.17 to
0.01)
-0.008 (-0.017 to
0.001)
-0.08 (-0.17 to
0.01)
Odds ratio for developing new
or worsening symptoms in the 4 weeks
post-randomisation
0.79 (0.63 to 0.99)
0.81 (0.64 to
1.03)
0.978 (0.960 to
0.998)
0.81 (0.66 to
0.98)
0.973 (0.954 to
0.994)
0.76 (0.62 to 0.94)
Odds ratio for reporting non-
respiratory symptoms/side effects in the 4
weeks post-randomisation
1.28 (1.03 to 1.59)
1.28 (1.04 to
1.59)
1.028 (1.011 to
1.046)
1.32 (1.12 to
1.57)
1.028 (1.011 to
1.046)
1.32 (1.11 to 1.56)

* Analysis based on 1789, 2027 and 1727 participants for the symptom severity, new symptoms and side effect outcomes
respectively. † Analysis based on 1787, 1923 and 1725 participants for the symptom severity, new symptoms and side
effect outcomes respectively. § Assuming those participants with missing adherence data did not take any medication (i.e.
their adherence level is 0%).
RESEARCH Open Access
The use of randomisation-based efficacyestimators in non-inferiority trialsDavid Gillespie1* , Daniel Farewell2, Peter Barrett-Lee3, Angela Casbard4, Anthony Barney Hawthorne5, Chris Hurt4,Nick Murray6, Chris Probert7, Rachel Stenson8 and Kerenza Hood9
Abstract
Background: In a non-inferiority (NI) trial, analysis based on the intention-to-treat (ITT) principle is anti-conservative,so current guidelines recommend analysing on a per-protocol (PP) population in addition. However, PP analysisrelies on the often implausible assumption of no confounders. Randomisation-based efficacy estimators (RBEEs)allow for treatment non-adherence while maintaining a comparison of randomised groups. Fischer et al. havedeveloped an approach for estimating RBEEs in randomised trials with two active treatments, a common feature ofNI trials. The aim of this paper was to demonstrate the use of RBEEs in NI trials using this approach, and to appraisethe feasibility of these estimators as the primary analysis in NI trials.
Methods: Two NI trials were used. One comparing two different dosing regimens for the maintenance of remissionin people with ulcerative colitis (CODA), and the other comparing an orally administered treatment to anintravenously administered treatment in preventing skeletal-related events in patients with bone metastases frombreast cancer (ZICE). Variables that predicted adherence in each of the trial arms, and were also independent ofoutcome, were sought in each of the studies. Structural mean models (SMMs) were fitted that conditioned onthese variables, and the point estimates and confidence intervals compared to that found in the corresponding ITTand PP analyses.
Results: In the CODA study, no variables were found that differentially predicted treatment adherence whileremaining independent of outcome. The SMM, using standard methodology, moved the point estimate closer to 0(no difference between arms) compared to the ITT and PP analyses, but the confidence interval was still within theNI margin, indicating that the conclusions drawn would remain the same. In the ZICE study, cognitive functioningas measured by the corresponding domain of the QLQ-C30, and use of chemotherapy at baseline were bothdifferentially associated with adherence while remaining independent of outcome. However, while the SMM againmoved the point estimate closer to 0, the confidence interval was wide, overlapping with any NI margin that couldbe justified.
Conclusion: Deriving RBEEs in NI trials with two active treatments can provide a randomisation-respecting estimateof treatment efficacy that accounts for treatment adherence, is straightforward to implement, but requires thoroughplanning during the design stage of the study to ensure that strong baseline predictors of treatment are captured.Extension of the approach to handle nonlinear outcome variables is also required.
Trial registration: The CODA study: ClinicalTrials.gov, identifier: NCT00708656. Registered on 8 April 2008. The ZICEstudy trial: ClinicalTrials.gov, identifier: NCT00326820. Registered on 16 May 2006.
Keywords: Treatment non-adherence, Non-inferiority, Efficacy, Intention-to-treat, Per-protocol, Structural mean models
* Correspondence: [email protected] East Wales Trials Unit, Centre for Trials Research, College ofBiomedical and Life Sciences, Cardiff University, Cardiff, UKFull list of author information is available at the end of the article
© The Author(s). 2017 Open Access This article is distributed under the terms of the Creative Commons Attribution 4.0International License (http://creativecommons.org/licenses/by/4.0/), which permits unrestricted use, distribution, andreproduction in any medium, provided you give appropriate credit to the original author(s) and the source, provide a link tothe Creative Commons license, and indicate if changes were made. The Creative Commons Public Domain Dedication waiver(http://creativecommons.org/publicdomain/zero/1.0/) applies to the data made available in this article, unless otherwise stated.
Gillespie et al. Trials (2017) 18:117 DOI 10.1186/s13063-017-1837-3
BackgroundIn the majority of randomised controlled trials (RCTs),the primary goal is to investigate the superiority of onetreatment over another [1]. However, in some instances,it can be sufficient to demonstrate that a treatment is noworse than another on some outcome of interest. This isparticularly true where a standard treatment is alreadyin place (a so-called ‘active control’), and the new treat-ment could offer substantial benefits on non-primaryoutcomes such as reduce side effects, reduced costs,simpler dosing regimen, etc. This is the purpose of anon-inferiority (NI) trial, where the aim is to demon-strate that a new treatment is no worse than a standardtreatment by more than an acceptable amount [2].The ‘gold standard’ approach to analysis in a superior-
ity trial is based on the intention-to-treat (ITT)principle, where participants are analysed in the groupsto which they were originally randomised [3]. This ap-proach is favoured as it preserves randomisation and, inthe case of departures from randomised treatment,makes treatment groups appear more similar; therefore,producing a conservative estimate of treatment effect.However, in a NI trial it is desirable for treatment groupsto be as similar as possible, and therefore an ITTanalysis is viewed as anti-conservative in this situation[4, 5]. Current recommendations are that a per-protocol(PP) analysis should be conducted alongside an ITT ana-lysis for NI trials [6]. A PP analysis excludes participantswith departures from randomised treatment, but as-sumes that the group of participants who are excludedare similar to those who are included on both observedand unobserved variables; an assumption that is usuallydeemed implausible [7]. The ideal analytical methodwould be based on participants who received the treat-ment to which they were allocated, while maintaining acomparison of groups as randomised (and thus notprone to the selection biases that are common with a PPanalysis).Randomisation-based efficacy estimators (RBEEs),
such as Structural Mean Models (SMMs), compare theeffect of treatment in the group of participants who wereallocated to and adhered to treatment with the group al-located to receive control (or standard treatment) butwho would have adhered to treatment (had they been al-located to the treatment group) [8]. The approach allowsfor treatment non-adherence [9] while maintaining acomparison of randomised groups. Fischer et al. havedeveloped an approach for estimating treatment efficacyin randomised trials with two active treatments, a com-mon feature of NI trials [10].The aim of this paper is to demonstrate the use of
RBEEs in NI trials using the methods outlined byFischer et al., and to appraise the feasibility of theseestimators as the primary analysis in NI trials. A brief
introduction to randomisation-based efficacy estima-tors will be given in ‘Methods section’, specificallywhere the estimators are used in trials with two ac-tive interventions. This section will also highlight gen-eral steps to fitting these models using standardstatistical software, before concluding with a descrip-tion of the studies used as examples in this paper.‘Results section’ will present worked examples usingdata from the studies described in ‘Methods section’,while ‘Discussion section’ will summarise the work ofthe previous sections and highlight the implicationsof using these methods in practice.
MethodsTraditional approaches to deriving efficacy in RCTsAn ITT analysis is used to determine treatment effect-iveness in RCTs [11, 12]. Under certain circumstances(e.g. all participants receive all of the treatment to whichthey were randomised), an ITT analysis can also be usedto estimate treatment efficacy. However, in the presenceof non-adherence, or departures from randomised treat-ment, the most common approach to assessing treat-ment efficacy in an RCT is to conduct a PP analysis.This analysis excludes participants who are determinedto have not adhered to their randomised treatment.However, it fails to maintain a comparison of groups asrandomised, and is therefore prone to selection bias[11]. While selection bias is thought to be minimised intrials with blinding, and modified definitions of thesepopulations that adjust for observed confounders can beused, selection bias can never be completely discountedfrom any analyses that make postrandomisation exclu-sions or manipulations.
Structural Mean Models to derive randomisation-basedefficacy estimatorsBy recognising that at the beginning of a trial all partici-pants have two potential outcomes – one if they aretreated and one if they are not, a SMM relates a treatedparticipant’s observed outcome to their (potentiallycounterfactual) outcome that would have been observedhad they received no treatment [13]. Standard ap-proaches to fitting a SMM rely on using observed expos-ure, treating randomisation as an instrument (i.e.assuming that it is independent of both observed andunobserved confounders and only effects outcomethrough its effect on exposure), and finding a value ofthe treatment effect such that balance is achieved be-tween groups on the outcome in participants who werenot treated [14].By doing this it becomes possible to derive an estimate
of treatment efficacy (the effect that receiving treatmenthas on outcome) that is not prone to the usual selectionbiases usually found in traditional methods (Fig. 1).
Gillespie et al. Trials (2017) 18:117 Page 2 of 11
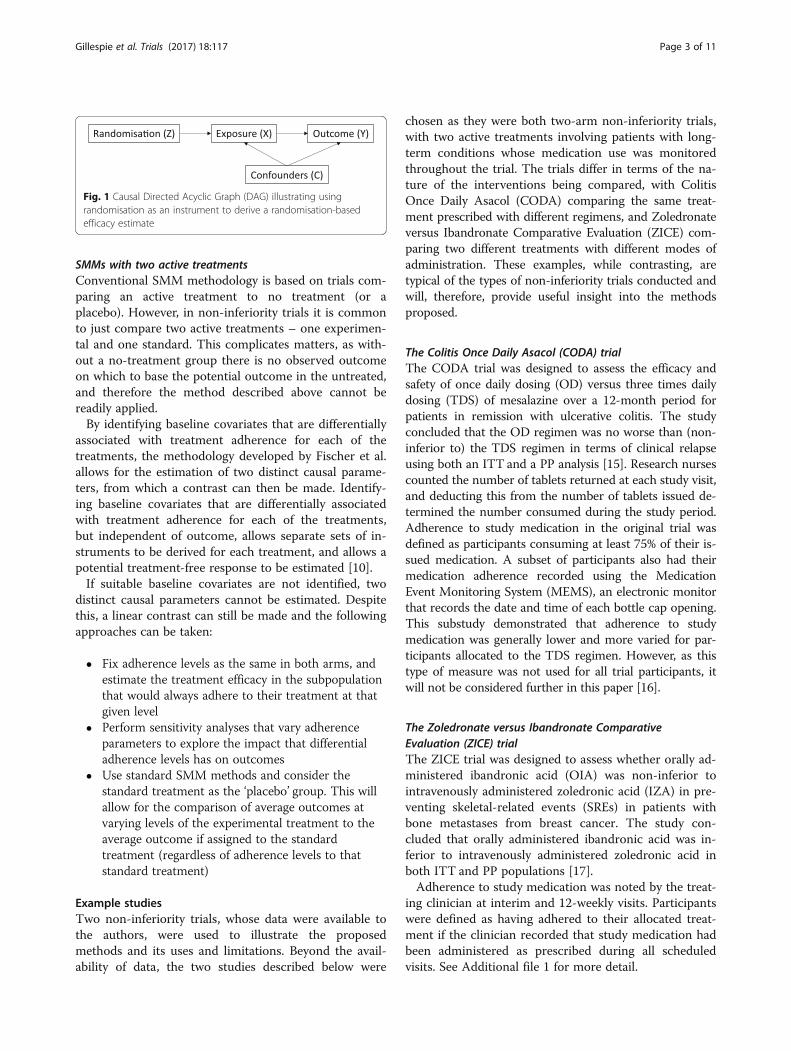
SMMs with two active treatmentsConventional SMM methodology is based on trials com-paring an active treatment to no treatment (or aplacebo). However, in non-inferiority trials it is commonto just compare two active treatments – one experimen-tal and one standard. This complicates matters, as with-out a no-treatment group there is no observed outcomeon which to base the potential outcome in the untreated,and therefore the method described above cannot bereadily applied.By identifying baseline covariates that are differentially
associated with treatment adherence for each of thetreatments, the methodology developed by Fischer et al.allows for the estimation of two distinct causal parame-ters, from which a contrast can then be made. Identify-ing baseline covariates that are differentially associatedwith treatment adherence for each of the treatments,but independent of outcome, allows separate sets of in-struments to be derived for each treatment, and allows apotential treatment-free response to be estimated [10].If suitable baseline covariates are not identified, two
distinct causal parameters cannot be estimated. Despitethis, a linear contrast can still be made and the followingapproaches can be taken:
� Fix adherence levels as the same in both arms, andestimate the treatment efficacy in the subpopulationthat would always adhere to their treatment at thatgiven level
� Perform sensitivity analyses that vary adherenceparameters to explore the impact that differentialadherence levels has on outcomes
� Use standard SMM methods and consider thestandard treatment as the ‘placebo’ group. This willallow for the comparison of average outcomes atvarying levels of the experimental treatment to theaverage outcome if assigned to the standardtreatment (regardless of adherence levels to thatstandard treatment)
Example studiesTwo non-inferiority trials, whose data were available tothe authors, were used to illustrate the proposedmethods and its uses and limitations. Beyond the avail-ability of data, the two studies described below were
chosen as they were both two-arm non-inferiority trials,with two active treatments involving patients with long-term conditions whose medication use was monitoredthroughout the trial. The trials differ in terms of the na-ture of the interventions being compared, with ColitisOnce Daily Asacol (CODA) comparing the same treat-ment prescribed with different regimens, and Zoledronateversus Ibandronate Comparative Evaluation (ZICE) com-paring two different treatments with different modes ofadministration. These examples, while contrasting, aretypical of the types of non-inferiority trials conducted andwill, therefore, provide useful insight into the methodsproposed.
The Colitis Once Daily Asacol (CODA) trialThe CODA trial was designed to assess the efficacy andsafety of once daily dosing (OD) versus three times dailydosing (TDS) of mesalazine over a 12-month period forpatients in remission with ulcerative colitis. The studyconcluded that the OD regimen was no worse than (non-inferior to) the TDS regimen in terms of clinical relapseusing both an ITT and a PP analysis [15]. Research nursescounted the number of tablets returned at each study visit,and deducting this from the number of tablets issued de-termined the number consumed during the study period.Adherence to study medication in the original trial wasdefined as participants consuming at least 75% of their is-sued medication. A subset of participants also had theirmedication adherence recorded using the MedicationEvent Monitoring System (MEMS), an electronic monitorthat records the date and time of each bottle cap opening.This substudy demonstrated that adherence to studymedication was generally lower and more varied for par-ticipants allocated to the TDS regimen. However, as thistype of measure was not used for all trial participants, itwill not be considered further in this paper [16].
The Zoledronate versus Ibandronate ComparativeEvaluation (ZICE) trialThe ZICE trial was designed to assess whether orally ad-ministered ibandronic acid (OIA) was non-inferior tointravenously administered zoledronic acid (IZA) in pre-venting skeletal-related events (SREs) in patients withbone metastases from breast cancer. The study con-cluded that orally administered ibandronic acid was in-ferior to intravenously administered zoledronic acid inboth ITT and PP populations [17].Adherence to study medication was noted by the treat-
ing clinician at interim and 12-weekly visits. Participantswere defined as having adhered to their allocated treat-ment if the clinician recorded that study medication hadbeen administered as prescribed during all scheduledvisits. See Additional file 1 for more detail.
Fig. 1 Causal Directed Acyclic Graph (DAG) illustrating usingrandomisation as an instrument to derive a randomisation-basedefficacy estimate
Gillespie et al. Trials (2017) 18:117 Page 3 of 11
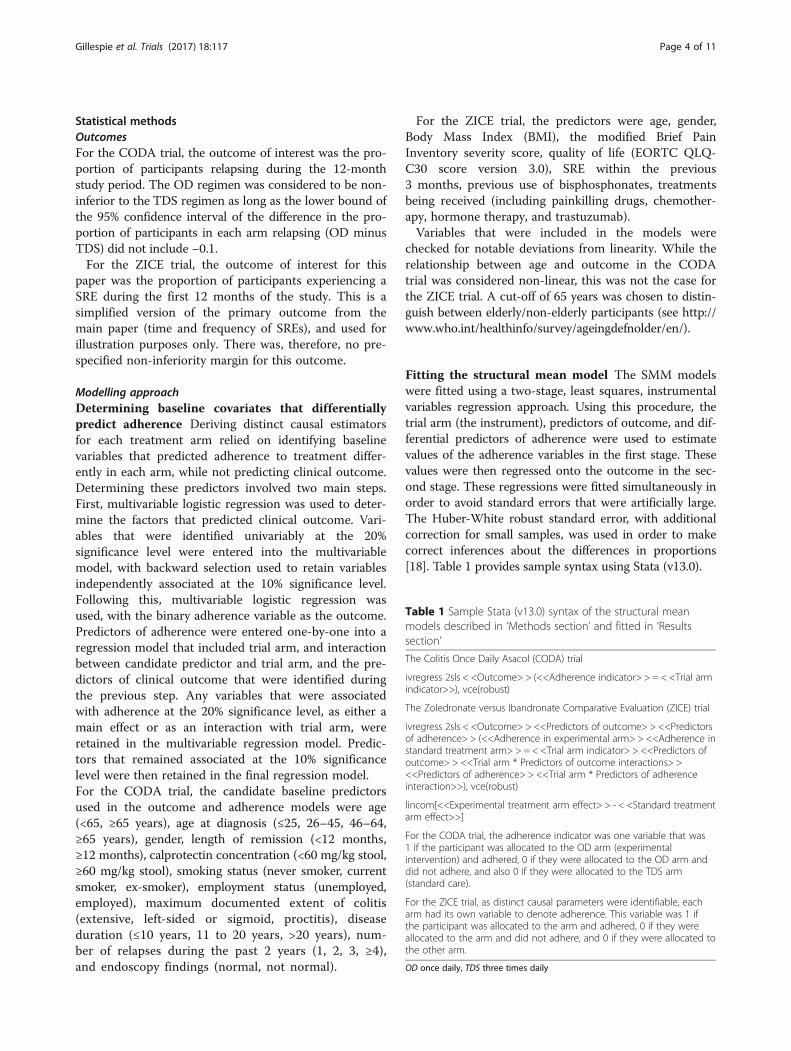
Statistical methodsOutcomesFor the CODA trial, the outcome of interest was the pro-portion of participants relapsing during the 12-monthstudy period. The OD regimen was considered to be non-inferior to the TDS regimen as long as the lower bound ofthe 95% confidence interval of the difference in the pro-portion of participants in each arm relapsing (OD minusTDS) did not include −0.1.For the ZICE trial, the outcome of interest for this
paper was the proportion of participants experiencing aSRE during the first 12 months of the study. This is asimplified version of the primary outcome from themain paper (time and frequency of SREs), and used forillustration purposes only. There was, therefore, no pre-specified non-inferiority margin for this outcome.
Modelling approachDetermining baseline covariates that differentiallypredict adherence Deriving distinct causal estimatorsfor each treatment arm relied on identifying baselinevariables that predicted adherence to treatment differ-ently in each arm, while not predicting clinical outcome.Determining these predictors involved two main steps.First, multivariable logistic regression was used to deter-mine the factors that predicted clinical outcome. Vari-ables that were identified univariably at the 20%significance level were entered into the multivariablemodel, with backward selection used to retain variablesindependently associated at the 10% significance level.Following this, multivariable logistic regression wasused, with the binary adherence variable as the outcome.Predictors of adherence were entered one-by-one into aregression model that included trial arm, and interactionbetween candidate predictor and trial arm, and the pre-dictors of clinical outcome that were identified duringthe previous step. Any variables that were associatedwith adherence at the 20% significance level, as either amain effect or as an interaction with trial arm, wereretained in the multivariable regression model. Predic-tors that remained associated at the 10% significancelevel were then retained in the final regression model.For the CODA trial, the candidate baseline predictorsused in the outcome and adherence models were age(<65, ≥65 years), age at diagnosis (≤25, 26–45, 46–64,≥65 years), gender, length of remission (<12 months,≥12 months), calprotectin concentration (<60 mg/kg stool,≥60 mg/kg stool), smoking status (never smoker, currentsmoker, ex-smoker), employment status (unemployed,employed), maximum documented extent of colitis(extensive, left-sided or sigmoid, proctitis), diseaseduration (≤10 years, 11 to 20 years, >20 years), num-ber of relapses during the past 2 years (1, 2, 3, ≥4),and endoscopy findings (normal, not normal).
For the ZICE trial, the predictors were age, gender,Body Mass Index (BMI), the modified Brief PainInventory severity score, quality of life (EORTC QLQ-C30 score version 3.0), SRE within the previous3 months, previous use of bisphosphonates, treatmentsbeing received (including painkilling drugs, chemother-apy, hormone therapy, and trastuzumab).Variables that were included in the models were
checked for notable deviations from linearity. While therelationship between age and outcome in the CODAtrial was considered non-linear, this was not the case forthe ZICE trial. A cut-off of 65 years was chosen to distin-guish between elderly/non-elderly participants (see http://www.who.int/healthinfo/survey/ageingdefnolder/en/).
Fitting the structural mean model The SMM modelswere fitted using a two-stage, least squares, instrumentalvariables regression approach. Using this procedure, thetrial arm (the instrument), predictors of outcome, and dif-ferential predictors of adherence were used to estimatevalues of the adherence variables in the first stage. Thesevalues were then regressed onto the outcome in the sec-ond stage. These regressions were fitted simultaneously inorder to avoid standard errors that were artificially large.The Huber-White robust standard error, with additionalcorrection for small samples, was used in order to makecorrect inferences about the differences in proportions[18]. Table 1 provides sample syntax using Stata (v13.0).
Table 1 Sample Stata (v13.0) syntax of the structural meanmodels described in ‘Methods section’ and fitted in ‘Resultssection’
The Colitis Once Daily Asacol (CODA) trial
ivregress 2sls < <Outcome> > (<<Adherence indicator> > = < <Trial armindicator>>), vce(robust)
The Zoledronate versus Ibandronate Comparative Evaluation (ZICE) trial
ivregress 2sls < <Outcome> > <<Predictors of outcome> > <<Predictorsof adherence> > (<<Adherence in experimental arm> > <<Adherence instandard treatment arm> > = < <Trial arm indicator> > <<Predictors ofoutcome> > <<Trial arm * Predictors of outcome interactions> ><<Predictors of adherence> > <<Trial arm * Predictors of adherenceinteraction>>), vce(robust)
lincom[<<Experimental treatment arm effect> > - < <Standard treatmentarm effect>>]
For the CODA trial, the adherence indicator was one variable that was1 if the participant was allocated to the OD arm (experimentalintervention) and adhered, 0 if they were allocated to the OD arm anddid not adhere, and also 0 if they were allocated to the TDS arm(standard care).
For the ZICE trial, as distinct causal parameters were identifiable, eacharm had its own variable to denote adherence. This variable was 1 ifthe participant was allocated to the arm and adhered, 0 if they wereallocated to the arm and did not adhere, and 0 if they were allocated tothe other arm.
OD once daily, TDS three times daily
Gillespie et al. Trials (2017) 18:117 Page 4 of 11
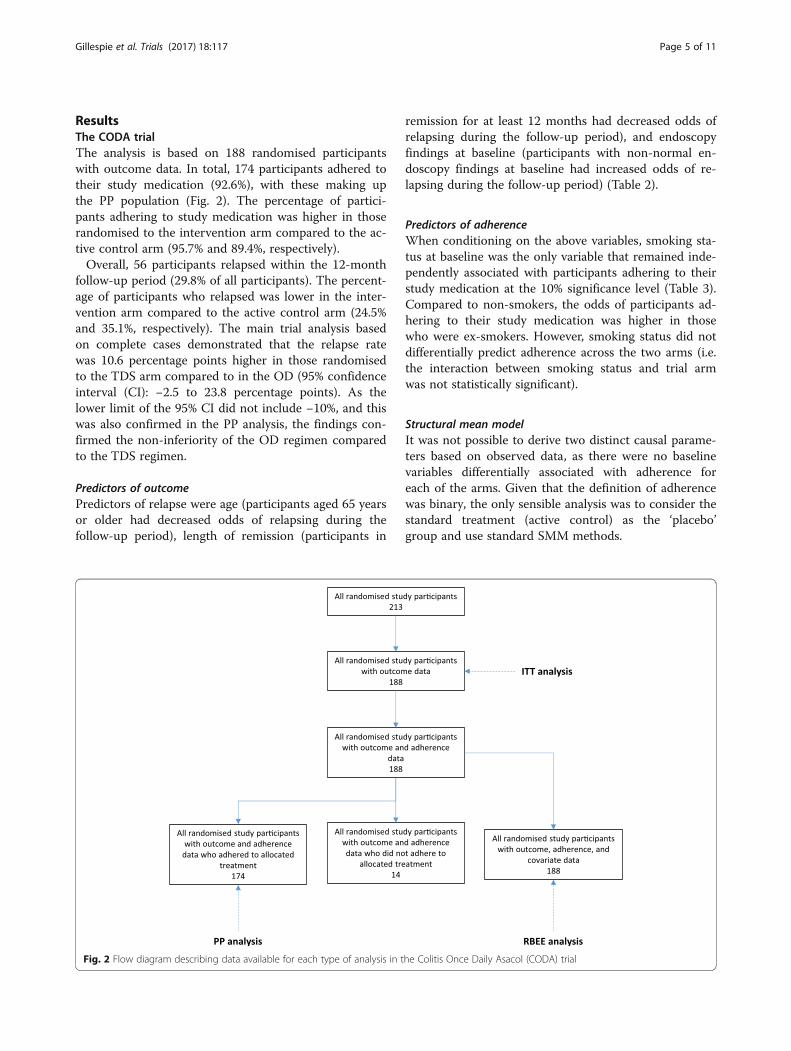
ResultsThe CODA trialThe analysis is based on 188 randomised participantswith outcome data. In total, 174 participants adhered totheir study medication (92.6%), with these making upthe PP population (Fig. 2). The percentage of partici-pants adhering to study medication was higher in thoserandomised to the intervention arm compared to the ac-tive control arm (95.7% and 89.4%, respectively).Overall, 56 participants relapsed within the 12-month
follow-up period (29.8% of all participants). The percent-age of participants who relapsed was lower in the inter-vention arm compared to the active control arm (24.5%and 35.1%, respectively). The main trial analysis basedon complete cases demonstrated that the relapse ratewas 10.6 percentage points higher in those randomisedto the TDS arm compared to in the OD (95% confidenceinterval (CI): −2.5 to 23.8 percentage points). As thelower limit of the 95% CI did not include −10%, and thiswas also confirmed in the PP analysis, the findings con-firmed the non-inferiority of the OD regimen comparedto the TDS regimen.
Predictors of outcomePredictors of relapse were age (participants aged 65 yearsor older had decreased odds of relapsing during thefollow-up period), length of remission (participants in
remission for at least 12 months had decreased odds ofrelapsing during the follow-up period), and endoscopyfindings at baseline (participants with non-normal en-doscopy findings at baseline had increased odds of re-lapsing during the follow-up period) (Table 2).
Predictors of adherenceWhen conditioning on the above variables, smoking sta-tus at baseline was the only variable that remained inde-pendently associated with participants adhering to theirstudy medication at the 10% significance level (Table 3).Compared to non-smokers, the odds of participants ad-hering to their study medication was higher in thosewho were ex-smokers. However, smoking status did notdifferentially predict adherence across the two arms (i.e.the interaction between smoking status and trial armwas not statistically significant).
Structural mean modelIt was not possible to derive two distinct causal parame-ters based on observed data, as there were no baselinevariables differentially associated with adherence foreach of the arms. Given that the definition of adherencewas binary, the only sensible analysis was to consider thestandard treatment (active control) as the ‘placebo’group and use standard SMM methods.
Fig. 2 Flow diagram describing data available for each type of analysis in the Colitis Once Daily Asacol (CODA) trial
Gillespie et al. Trials (2017) 18:117 Page 5 of 11
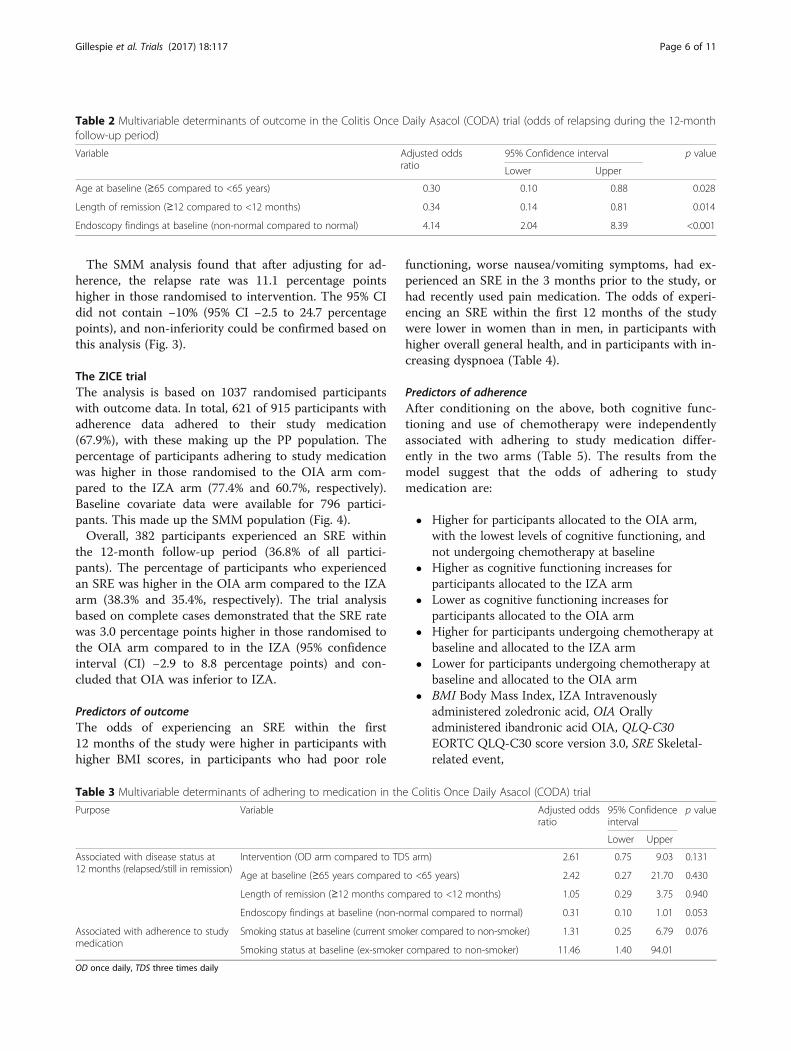
The SMM analysis found that after adjusting for ad-herence, the relapse rate was 11.1 percentage pointshigher in those randomised to intervention. The 95% CIdid not contain −10% (95% CI −2.5 to 24.7 percentagepoints), and non-inferiority could be confirmed based onthis analysis (Fig. 3).
The ZICE trialThe analysis is based on 1037 randomised participantswith outcome data. In total, 621 of 915 participants withadherence data adhered to their study medication(67.9%), with these making up the PP population. Thepercentage of participants adhering to study medicationwas higher in those randomised to the OIA arm com-pared to the IZA arm (77.4% and 60.7%, respectively).Baseline covariate data were available for 796 partici-pants. This made up the SMM population (Fig. 4).Overall, 382 participants experienced an SRE within
the 12-month follow-up period (36.8% of all partici-pants). The percentage of participants who experiencedan SRE was higher in the OIA arm compared to the IZAarm (38.3% and 35.4%, respectively). The trial analysisbased on complete cases demonstrated that the SRE ratewas 3.0 percentage points higher in those randomised tothe OIA arm compared to in the IZA (95% confidenceinterval (CI) −2.9 to 8.8 percentage points) and con-cluded that OIA was inferior to IZA.
Predictors of outcomeThe odds of experiencing an SRE within the first12 months of the study were higher in participants withhigher BMI scores, in participants who had poor role
functioning, worse nausea/vomiting symptoms, had ex-perienced an SRE in the 3 months prior to the study, orhad recently used pain medication. The odds of experi-encing an SRE within the first 12 months of the studywere lower in women than in men, in participants withhigher overall general health, and in participants with in-creasing dyspnoea (Table 4).
Predictors of adherenceAfter conditioning on the above, both cognitive func-tioning and use of chemotherapy were independentlyassociated with adhering to study medication differ-ently in the two arms (Table 5). The results from themodel suggest that the odds of adhering to studymedication are:
� Higher for participants allocated to the OIA arm,with the lowest levels of cognitive functioning, andnot undergoing chemotherapy at baseline
� Higher as cognitive functioning increases forparticipants allocated to the IZA arm
� Lower as cognitive functioning increases forparticipants allocated to the OIA arm
� Higher for participants undergoing chemotherapy atbaseline and allocated to the IZA arm
� Lower for participants undergoing chemotherapy atbaseline and allocated to the OIA arm
� BMI Body Mass Index, IZA Intravenouslyadministered zoledronic acid, OIA Orallyadministered ibandronic acid OIA, QLQ-C30EORTC QLQ-C30 score version 3.0, SRE Skeletal-related event,
Table 2 Multivariable determinants of outcome in the Colitis Once Daily Asacol (CODA) trial (odds of relapsing during the 12-monthfollow-up period)
Variable Adjusted oddsratio
95% Confidence interval p value
Lower Upper
Age at baseline (≥65 compared to <65 years) 0.30 0.10 0.88 0.028
Length of remission (≥12 compared to <12 months) 0.34 0.14 0.81 0.014
Endoscopy findings at baseline (non-normal compared to normal) 4.14 2.04 8.39 <0.001
Table 3 Multivariable determinants of adhering to medication in the Colitis Once Daily Asacol (CODA) trial
Purpose Variable Adjusted oddsratio
95% Confidenceinterval
p value
Lower Upper
Associated with disease status at12 months (relapsed/still in remission)
Intervention (OD arm compared to TDS arm) 2.61 0.75 9.03 0.131
Age at baseline (≥65 years compared to <65 years) 2.42 0.27 21.70 0.430
Length of remission (≥12 months compared to <12 months) 1.05 0.29 3.75 0.940
Endoscopy findings at baseline (non-normal compared to normal) 0.31 0.10 1.01 0.053
Associated with adherence to studymedication
Smoking status at baseline (current smoker compared to non-smoker) 1.31 0.25 6.79 0.076
Smoking status at baseline (ex-smoker compared to non-smoker) 11.46 1.40 94.01
OD once daily, TDS three times daily
Gillespie et al. Trials (2017) 18:117 Page 6 of 11
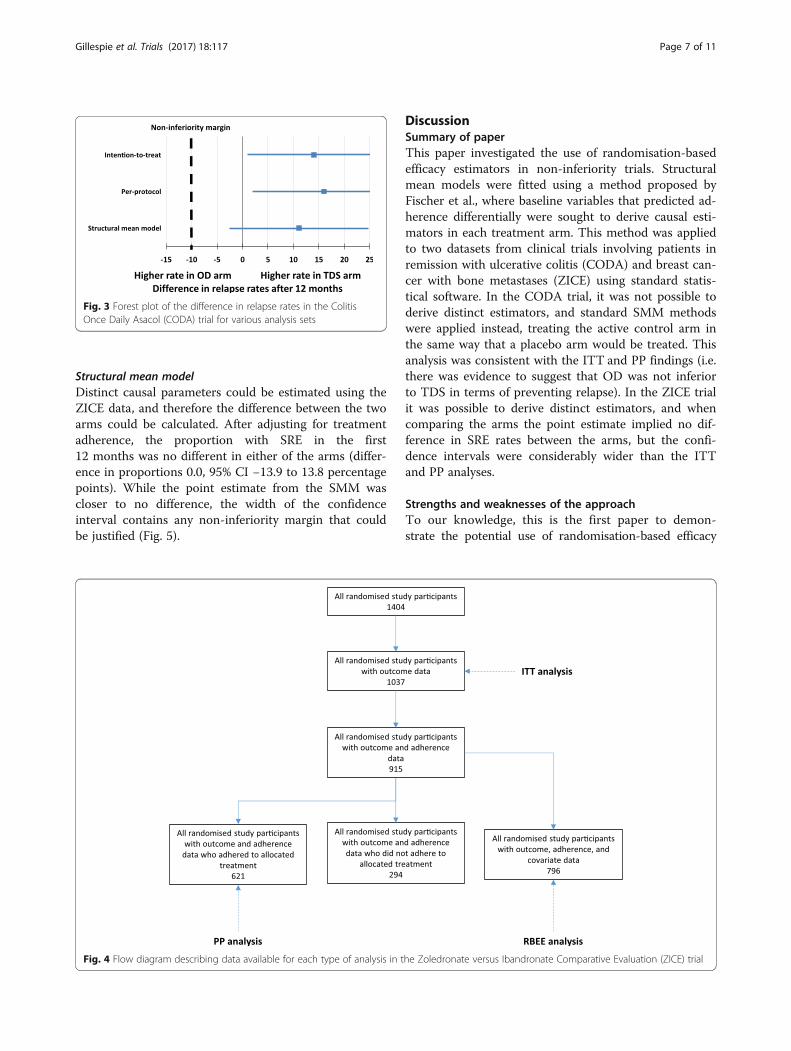
Structural mean modelDistinct causal parameters could be estimated using theZICE data, and therefore the difference between the twoarms could be calculated. After adjusting for treatmentadherence, the proportion with SRE in the first12 months was no different in either of the arms (differ-ence in proportions 0.0, 95% CI −13.9 to 13.8 percentagepoints). While the point estimate from the SMM wascloser to no difference, the width of the confidenceinterval contains any non-inferiority margin that couldbe justified (Fig. 5).
DiscussionSummary of paperThis paper investigated the use of randomisation-basedefficacy estimators in non-inferiority trials. Structuralmean models were fitted using a method proposed byFischer et al., where baseline variables that predicted ad-herence differentially were sought to derive causal esti-mators in each treatment arm. This method was appliedto two datasets from clinical trials involving patients inremission with ulcerative colitis (CODA) and breast can-cer with bone metastases (ZICE) using standard statis-tical software. In the CODA trial, it was not possible toderive distinct estimators, and standard SMM methodswere applied instead, treating the active control arm inthe same way that a placebo arm would be treated. Thisanalysis was consistent with the ITT and PP findings (i.e.there was evidence to suggest that OD was not inferiorto TDS in terms of preventing relapse). In the ZICE trialit was possible to derive distinct estimators, and whencomparing the arms the point estimate implied no dif-ference in SRE rates between the arms, but the confi-dence intervals were considerably wider than the ITTand PP analyses.
Strengths and weaknesses of the approachTo our knowledge, this is the first paper to demon-strate the potential use of randomisation-based efficacy
Fig. 3 Forest plot of the difference in relapse rates in the ColitisOnce Daily Asacol (CODA) trial for various analysis sets
Fig. 4 Flow diagram describing data available for each type of analysis in the Zoledronate versus Ibandronate Comparative Evaluation (ZICE) trial
Gillespie et al. Trials (2017) 18:117 Page 7 of 11
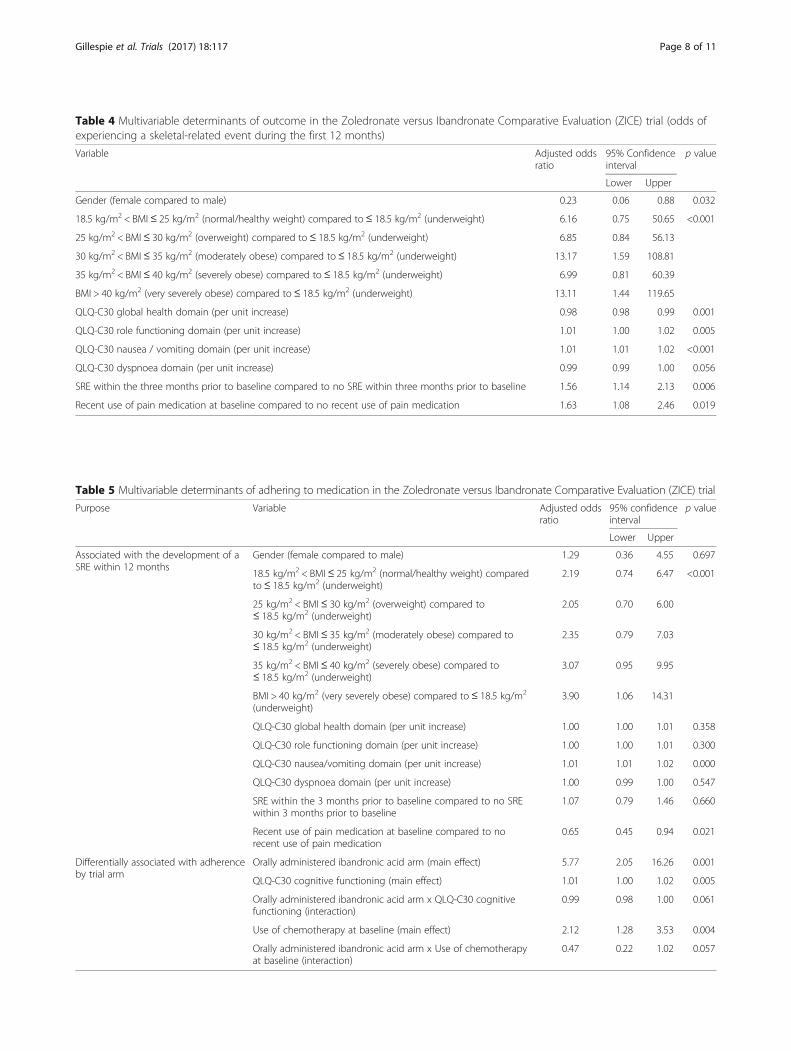
Table 4 Multivariable determinants of outcome in the Zoledronate versus Ibandronate Comparative Evaluation (ZICE) trial (odds ofexperiencing a skeletal-related event during the first 12 months)
Variable Adjusted oddsratio
95% Confidenceinterval
p value
Lower Upper
Gender (female compared to male) 0.23 0.06 0.88 0.032
18.5 kg/m2 < BMI≤ 25 kg/m2 (normal/healthy weight) compared to≤ 18.5 kg/m2 (underweight) 6.16 0.75 50.65 <0.001
25 kg/m2 < BMI≤ 30 kg/m2 (overweight) compared to≤ 18.5 kg/m2 (underweight) 6.85 0.84 56.13
30 kg/m2 < BMI≤ 35 kg/m2 (moderately obese) compared to≤ 18.5 kg/m2 (underweight) 13.17 1.59 108.81
35 kg/m2 < BMI≤ 40 kg/m2 (severely obese) compared to≤ 18.5 kg/m2 (underweight) 6.99 0.81 60.39
BMI > 40 kg/m2 (very severely obese) compared to≤ 18.5 kg/m2 (underweight) 13.11 1.44 119.65
QLQ-C30 global health domain (per unit increase) 0.98 0.98 0.99 0.001
QLQ-C30 role functioning domain (per unit increase) 1.01 1.00 1.02 0.005
QLQ-C30 nausea / vomiting domain (per unit increase) 1.01 1.01 1.02 <0.001
QLQ-C30 dyspnoea domain (per unit increase) 0.99 0.99 1.00 0.056
SRE within the three months prior to baseline compared to no SRE within three months prior to baseline 1.56 1.14 2.13 0.006
Recent use of pain medication at baseline compared to no recent use of pain medication 1.63 1.08 2.46 0.019
Table 5 Multivariable determinants of adhering to medication in the Zoledronate versus Ibandronate Comparative Evaluation (ZICE) trial
Purpose Variable Adjusted oddsratio
95% confidenceinterval
p value
Lower Upper
Associated with the development of aSRE within 12 months
Gender (female compared to male) 1.29 0.36 4.55 0.697
18.5 kg/m2 < BMI≤ 25 kg/m2 (normal/healthy weight) comparedto≤ 18.5 kg/m2 (underweight)
2.19 0.74 6.47 <0.001
25 kg/m2 < BMI≤ 30 kg/m2 (overweight) compared to≤ 18.5 kg/m2 (underweight)
2.05 0.70 6.00
30 kg/m2 < BMI≤ 35 kg/m2 (moderately obese) compared to≤ 18.5 kg/m2 (underweight)
2.35 0.79 7.03
35 kg/m2 < BMI≤ 40 kg/m2 (severely obese) compared to≤ 18.5 kg/m2 (underweight)
3.07 0.95 9.95
BMI > 40 kg/m2 (very severely obese) compared to≤ 18.5 kg/m2
(underweight)3.90 1.06 14.31
QLQ-C30 global health domain (per unit increase) 1.00 1.00 1.01 0.358
QLQ-C30 role functioning domain (per unit increase) 1.00 1.00 1.01 0.300
QLQ-C30 nausea/vomiting domain (per unit increase) 1.01 1.01 1.02 0.000
QLQ-C30 dyspnoea domain (per unit increase) 1.00 0.99 1.00 0.547
SRE within the 3 months prior to baseline compared to no SREwithin 3 months prior to baseline
1.07 0.79 1.46 0.660
Recent use of pain medication at baseline compared to norecent use of pain medication
0.65 0.45 0.94 0.021
Differentially associated with adherenceby trial arm
Orally administered ibandronic acid arm (main effect) 5.77 2.05 16.26 0.001
QLQ-C30 cognitive functioning (main effect) 1.01 1.00 1.02 0.005
Orally administered ibandronic acid arm x QLQ-C30 cognitivefunctioning (interaction)
0.99 0.98 1.00 0.061
Use of chemotherapy at baseline (main effect) 2.12 1.28 3.53 0.004
Orally administered ibandronic acid arm x Use of chemotherapyat baseline (interaction)
0.47 0.22 1.02 0.057
Gillespie et al. Trials (2017) 18:117 Page 8 of 11
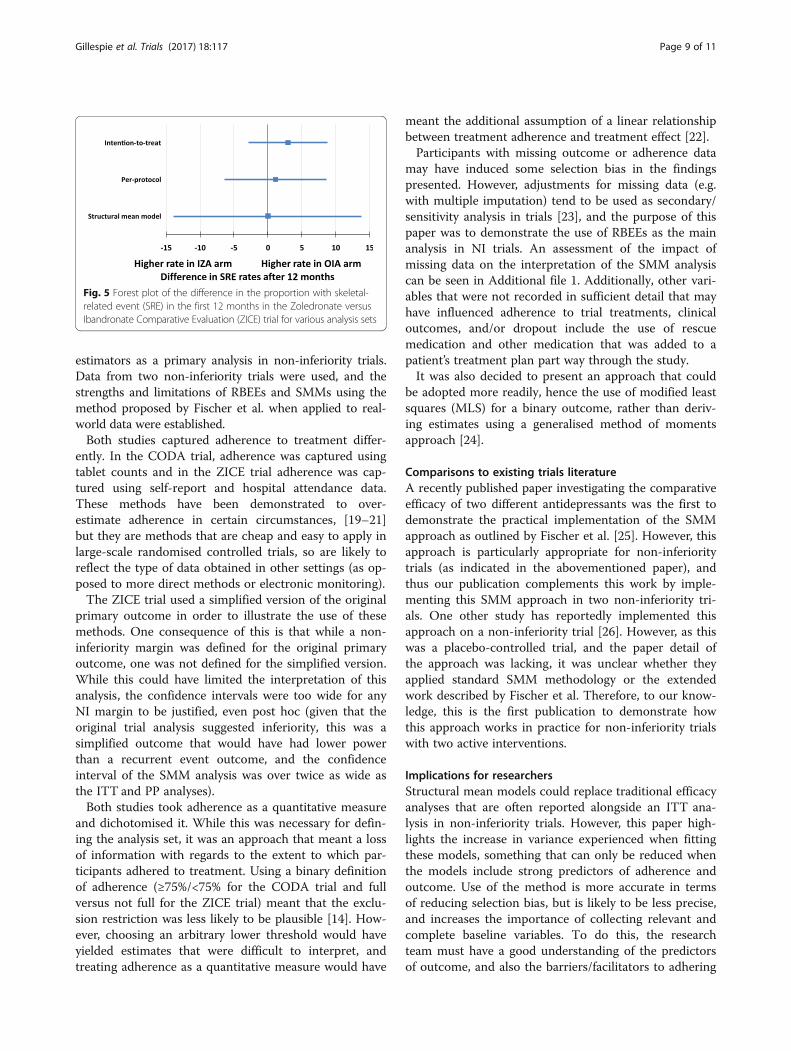
estimators as a primary analysis in non-inferiority trials.Data from two non-inferiority trials were used, and thestrengths and limitations of RBEEs and SMMs using themethod proposed by Fischer et al. when applied to real-world data were established.Both studies captured adherence to treatment differ-
ently. In the CODA trial, adherence was captured usingtablet counts and in the ZICE trial adherence was cap-tured using self-report and hospital attendance data.These methods have been demonstrated to over-estimate adherence in certain circumstances, [19–21]but they are methods that are cheap and easy to apply inlarge-scale randomised controlled trials, so are likely toreflect the type of data obtained in other settings (as op-posed to more direct methods or electronic monitoring).The ZICE trial used a simplified version of the original
primary outcome in order to illustrate the use of thesemethods. One consequence of this is that while a non-inferiority margin was defined for the original primaryoutcome, one was not defined for the simplified version.While this could have limited the interpretation of thisanalysis, the confidence intervals were too wide for anyNI margin to be justified, even post hoc (given that theoriginal trial analysis suggested inferiority, this was asimplified outcome that would have had lower powerthan a recurrent event outcome, and the confidenceinterval of the SMM analysis was over twice as wide asthe ITT and PP analyses).Both studies took adherence as a quantitative measure
and dichotomised it. While this was necessary for defin-ing the analysis set, it was an approach that meant a lossof information with regards to the extent to which par-ticipants adhered to treatment. Using a binary definitionof adherence (≥75%/<75% for the CODA trial and fullversus not full for the ZICE trial) meant that the exclu-sion restriction was less likely to be plausible [14]. How-ever, choosing an arbitrary lower threshold would haveyielded estimates that were difficult to interpret, andtreating adherence as a quantitative measure would have
meant the additional assumption of a linear relationshipbetween treatment adherence and treatment effect [22].Participants with missing outcome or adherence data
may have induced some selection bias in the findingspresented. However, adjustments for missing data (e.g.with multiple imputation) tend to be used as secondary/sensitivity analysis in trials [23], and the purpose of thispaper was to demonstrate the use of RBEEs as the mainanalysis in NI trials. An assessment of the impact ofmissing data on the interpretation of the SMM analysiscan be seen in Additional file 1. Additionally, other vari-ables that were not recorded in sufficient detail that mayhave influenced adherence to trial treatments, clinicaloutcomes, and/or dropout include the use of rescuemedication and other medication that was added to apatient’s treatment plan part way through the study.It was also decided to present an approach that could
be adopted more readily, hence the use of modified leastsquares (MLS) for a binary outcome, rather than deriv-ing estimates using a generalised method of momentsapproach [24].
Comparisons to existing trials literatureA recently published paper investigating the comparativeefficacy of two different antidepressants was the first todemonstrate the practical implementation of the SMMapproach as outlined by Fischer et al. [25]. However, thisapproach is particularly appropriate for non-inferioritytrials (as indicated in the abovementioned paper), andthus our publication complements this work by imple-menting this SMM approach in two non-inferiority tri-als. One other study has reportedly implemented thisapproach on a non-inferiority trial [26]. However, as thiswas a placebo-controlled trial, and the paper detail ofthe approach was lacking, it was unclear whether theyapplied standard SMM methodology or the extendedwork described by Fischer et al. Therefore, to our know-ledge, this is the first publication to demonstrate howthis approach works in practice for non-inferiority trialswith two active interventions.
Implications for researchersStructural mean models could replace traditional efficacyanalyses that are often reported alongside an ITT ana-lysis in non-inferiority trials. However, this paper high-lights the increase in variance experienced when fittingthese models, something that can only be reduced whenthe models include strong predictors of adherence andoutcome. Use of the method is more accurate in termsof reducing selection bias, but is likely to be less precise,and increases the importance of collecting relevant andcomplete baseline variables. To do this, the researchteam must have a good understanding of the predictorsof outcome, and also the barriers/facilitators to adhering
Fig. 5 Forest plot of the difference in the proportion with skeletal-related event (SRE) in the first 12 months in the Zoledronate versusIbandronate Comparative Evaluation (ZICE) trial for various analysis sets
Gillespie et al. Trials (2017) 18:117 Page 9 of 11
to the randomised treatments. Studies with feasibility/pilot stages could explore these aspects, as well as howbest to capture this data, before progressing onto moredefinitive studies. The significance thresholds for inclusionof variables in this paper were higher than current prac-tice. Future studies that collect strong baseline predictorsof adherence need not use such high significance levels.Estimating efficacy in randomised trials is valuable, as
it answers a more patient-centred question than can beanswered by an estimate of effectiveness. That is, “whatis the effect if I take this treatment?”, rather than themore health care professional-centred question “what isthe effect if I offer this treatment?” Both questions areuseful, but for a patient trying to understand the effectof a treatment, the more pertinent of the two questionsrelates to efficacy rather than effectiveness.By modelling the determinants of differential adher-
ence in the different treatment arms, researchers willalso gain an understanding of the circumstances underwhich the treatments will be better received by patientsand, therefore, more likely to work. For example, in theZICE study, we were able to demonstrate that for partic-ipants allocated to the intravenously administered zole-dronic acid arm, adherence was higher for patients withhigher cognitive function and for those receiving chemo-therapy at baseline. Whereas for those allocated to theorally administered ibandronic acid arm adherence waslower for patients with lower cognitive function and forthose receiving chemotherapy at baseline. One explan-ation for this could be that patients with low cognitivefunction could have their medicines dispensed by a caregiver, which is likely to reduce forgetfulness and increaseadherence. Patients receiving chemotherapy at baselinewill be attending hospital regularly for these visits, andthe delivery of IZA often coincided with other hospitalvisits for cancer therapy, thereby increasing theirchances of receiving IZA treatment. The implications ofthis, regardless of the comparative efficacy of the treat-ments themselves, could be that IZA should be offeredto those undergoing additional cancer treatments (orany other treatments that require regular hospital visits).OIA could be offered along with an additional interven-tion to increase adherence (e.g. a reminder or monitor-ing system), or in instances where patients were not incontrol of their own medication dispensing (e.g. elderlyresidents of nursing homes).
Potential extensions and future workBy extending this methodology to allow for differenttypes of outcome (e.g. binary, count, survival), thisapproach could be more widely used. For example, theprimary analysis in the ZICE trial was based on anAnderson-Gill model (survival model with recurrentevents) [27].
While not as necessary here, as a binary definition oftreatment receipt is required to define an analysis set,methods of RBEEs that allow for non-linear relationshipsbetween an increase in adherence and treatment effectswould be useful for capturing the complexity of somedose-response relationships more accurately.Finally, further work is needed in order to incorporate
necessary adjustments into sample size calculations forthe design of trials that wish to use these methods asmore than an exploratory analysis. Adjustments willlikely depend on the proportion of non-adherence, aswell as the number and strength of baseline predictors/instruments that are likely to be identified.
ConclusionsIn NI trials, RBEEs can provide a randomisation-respecting estimate of treatment efficacy that accountsfor treatment adherence, addressing the deficiencies ofboth ITT and PP analysis for this study design. For NItrials involving two active treatments, RBEEs can also bemodelled, remain straightforward to implement usingstandard statistical software, but require thorough plan-ning during the design stage of the study to ensure thatstrong baseline predictors of treatment are captured.
Additional file
Additional file 1: Data assumptions made for the ZICE trial. Descriptionsof how the adherence and outcome data were derived for the ZICEstudy. Sensitivity analysis exploring the impact of missing data on theinterpretation of the SMM analysis in the ZICE trial. (DOCX 20 kb)
AbbreviationsBMI: Body Mass Index; CODA: Colitis Once Daily Asacol; EORTC QLQ-C30: European Organisation for Research and Treatment of Cancer 30-itemQuality of Life Questionnaire developed for Cancer Patients; ITT: Intention-to-treat; IZA: Intravenously administered zoledronic acid; MEMS: MedicationEvent Monitoring System; NI: Non-inferiority; OD: Once daily; OIA: Orallyadministered ibandronic acid; PP: Per-protocol; RBEE: Randomisation-basedefficacy estimator; RCT: Randomised controlled trial; SMM: Structural MeanModel; SRE: Skeletal-related event; TDS: Three times daily; ZICE: Zoledronateversus Ibandronate Comparative Evaluation
AcknowledgementsWe are indebted to the patients and clinicians who participated in the twostudies described in this manuscript, without whom this work would nothave been possible. We would also like to acknowledge the reviewers,whose thoughtful comments added to the clarity of the manuscript.
FundingThe original CODA trial was supported by an unrestricted educational grantfrom Warner Chilcott Pharmaceuticals Ltd. The original ZICE trial was fundedby Roche Products Ltd. (educational grant), supported by the NationalInstitute for Health Research Cancer Network, following endorsement byCancer Research UK (CRUKE/04/022). No additional funding was received forthe work undertaken for this publication.
Availability of data and materialsNo additional data available.
Gillespie et al. Trials (2017) 18:117 Page 10 of 11
Authors’ contributionsDG performed all statistical analysis and drafted the manuscript. DF and KHcommented on early drafts of the manuscript. PB-L, AC, ABH, CH, NM, CP,and RS were investigators on the original studies and commented on draftversions of the manuscript. All authors read and approved the final versionof the manuscript.
Authors’ informationNo additional information provided.
Competing interestsAB Hawthorne has received payment from Warner Chilcott PharmaceuticalsLtd. for participation in advisory panels. C Probert has received researchsupport, hospitality, and speakers fees from Warner Chilcott PharmaceuticalsLtd. All other authors have no conflicts of interest to disclose.
Consent for publicationNot applicable.
Ethics approval and consent to participateFor the CODA study, ethical approval was received for this study by theLeicestershire, Northamptonshire and Rutland Research Ethics Committee 2(REC reference number: 05/Q2502/156). Written informed consent wasobtained from each participant. For the ZICE study, all patients gave writteninformed consent before study entry and the trial protocol was approved bythe UK Medicines and Health-care products Regulatory Agency and a Multi-Centre Research Ethics Committee (MREC for Wales ref: 05/MRE09/57).
Author details1South East Wales Trials Unit, Centre for Trials Research, College ofBiomedical and Life Sciences, Cardiff University, Cardiff, UK. 2Division ofPopulation Medicine, School of Medicine, College of Biomedical and LifeSciences Cardiff University, Cardiff, UK. 3Velindre Cancer Centre, Velindre Rd.,Whitchurch, Cardiff, UK. 4Wales Cancer Trials Unit, Centre for Trials Research,College of Biomedical and Life Sciences, Cardiff University, Cardiff, UK.5Department of Medicine, University Hospital of Wales, Cardiff and Vale NHSTrust, Cardiff, UK. 6North Adelaide Oncology, Kimberley House, Calvary NorthAdelaide Hospital, 89 Strangways Terrace, North Adelaide, SA, Australia.7Gastroenterology Research Unit, Department of Cellular and MolecularPhysiology, Institute of Translational Medicine, University of Liverpool, AshtonStreet, Liverpool, UK. 8Division of Infection and Immunity Research, School ofMedicine, College of Biomedical and Life Sciences, Cardiff University, Cardiff,UK. 9Centre for Trials Research, College of Biomedical and Life Sciences,Cardiff University, Cardiff, UK.
Received: 15 April 2016 Accepted: 13 February 2017
References1. Moher D, Hopewell S, Schulz KF, Montori V, Gøtzsche PC, Devereaux P,
Elbourne D, Egger M, Altman DG. CONSORT 2010 explanation andelaboration: updated guidelines for reporting parallel group randomisedtrials. J Clin Epidemiol. 2010;63(8):e1–e37.
2. Piaggio G, Elbourne DR, Altman DG, Pocock SJ, Evans SJ, Group C.Reporting of noninferiority and equivalence randomized trials: an extensionof the CONSORT statement. JAMA. 2006;295(10):1152–60.
3. Lewis J, Machin D. Intention to treat—who should use ITT? Br J Cancer.1993;68(4):647.
4. Jones B, Jarvis P, Lewis J, Ebbutt A. Trials to assess equivalence: theimportance of rigorous methods. BMJ. 1996;313(7048):36.
5. ICH Steering Committee. Statistical principles for clinical trials (E9). Geneva,Switzerland: International Conference on Harmonisation of TechnicalRequirements for Registration of Pharmaceuticals for Human Use; 1998.
6. Lesaffre E. Superiority, equivalence, and non-inferiority trials. Bull NYU HospJt Dis. 2008;66(2):150–4.
7. Lewis JA. Statistical principles for clinical trials (ICH E9): an introductory noteon an international guideline. Stat Med. 1999;18(15):1903–42.
8. White IR. Uses and limitations of randomization-based efficacy estimators.Stat Methods Med Res. 2005;14(4):327–47.
9. Osterberg L, Blaschke T. Adherence to medication. N Engl J Med.2005;353(5):487–97.
10. Fischer K, Goetghebeur E, Vrijens B, White IR. A structural mean model toallow for noncompliance in a randomized trial comparing 2 activetreatments. Biostatistics. 2011;12(2):247–57.
11. Montori VM, Guyatt GH. Intention-to-treat principle. Can Med Assoc J.2001;165(10):1339–41.
12. Singal AG, Higgins PD, Waljee AK. A primer on effectiveness and efficacytrials. Clin Transl Gastroenterol. 2014;5(1):e45.
13. Frangakis CE, Rubin DB. Principal stratification in causal inference.Biometrics. 2002;58(1):21–9.
14. Angrist JD, Imbens GW, Rubin DB. Identification of causal effects usinginstrumental variables. J Am Stat Assoc. 1996;91(434):444–55.
15. Hawthorne AB, Stenson R, Gillespie D, Swarbrick ET, Dhar A, Kapur KC,Hood K, Probert CS. One‐year investigator‐blind randomized multicentertrial comparing Asacol 2.4 g once daily with 800 mg three times dailyfor maintenance of remission in ulcerative colitis. Inflamm Bowel Dis.2012;18(10):1885–93.
16. Gillespie D, Hood K, Farewell D, Stenson R, Probert C, Hawthorne AB.Electronic monitoring of medication adherence in a 1-year clinical study of2 dosing regimens of mesalazine for adults in remission with ulcerativecolitis. Inflamm Bowel Dis. 2014;20(1):82–91.
17. Barrett-Lee P, Casbard A, Abraham J, Hood K, Coleman R, Simmonds P,Timmins H, Wheatley D, Grieve R, Griffiths G. Oral ibandronic acid versusintravenous zoledronic acid in treatment of bone metastases from breastcancer: a randomised, open label, non-inferiority phase 3 trial. Lancet Oncol.2014;15(1):114–22.
18. Cheung YB. A modified least-squares regression approach to the estimationof risk difference. Am J Epidemiol. 2007;166(11):1337–44.
19. Aikens JE, Nease DE, Nau DP, Klinkman MS, Schwenk TL. Adherence tomaintenance-phase antidepressant medication as a function of patientbeliefs about medication. Ann Fam Med. 2005;3(1):23–30.
20. Liu H, Golin CE, Miller LG, Hays RD, Beck CK, Sanandaji S, Christian J,Maldonado T, Duran D, Kaplan AH. A comparison study of multiplemeasures of adherence to HIV protease inhibitors. Ann Intern Med.2001;134(10):968–77.
21. Lu M, Safren SA, Skolnik PR, Rogers WH, Coady W, Hardy H, Wilson IB.Optimal recall period and response task for self-reported HIV medicationadherence. AIDS Behav. 2008;12(1):86–94.
22. Hernán MA, Robins JM. Instruments for causal inference: an epidemiologist’sdream? Epidemiology. 2006;17(4):360–72.
23. Bell ML, Fiero M, Horton NJ, Hsu C-H. Handling missing data in RCTs; areview of the top medical journals. BMC Med Res Methodol. 2014;14(1):1.
24. Vansteelandt S, Goetghebeur E. Causal inference with generalized structuralmean models. J R Stat Soc Ser B (Stat Methodol). 2003;65(4):817–35.
25. Wiles N, Fischer K, Cowen P, Nutt D, Peters T, Lewis G, White I. Allowing fornon-adherence to treatment in a randomized controlled trial of twoantidepressants (citalopram versus reboxetine): an example from theGENPOD trial. Psychol Med. 2014;44(13):2855–66.
26. Taylor TH, Mecchella JN, Larson RJ, Kerin KD, MacKenzie TA. Initiation ofallopurinol at first medical contact for acute attacks of gout: a randomizedclinical trial. Am J Med. 2012;125(11):1126–34. e7.
27. Anderson PK, Gill RD. Cox’s regression model for counting processes: a largesample study. Ann Stat. 1982;10:1100–20.
• We accept pre-submission inquiries
• Our selector tool helps you to find the most relevant journal
• We provide round the clock customer support
• Convenient online submission
• Thorough peer review
• Inclusion in PubMed and all major indexing services
• Maximum visibility for your research
Submit your manuscript atwww.biomedcentral.com/submit
Submit your next manuscript to BioMed Central and we will help you at every step:
Gillespie et al. Trials (2017) 18:117 Page 11 of 11
Additional material: 1
1. Full description of determining medication adherence in the ZICE study 2
Questions about adherence to study medication were asked at three initial interim visits, and then 3
subsequently at 12-weekly visits. 4
Missing visit patterns were inspected, with the view to calculate adherence levels only in those with 5
complete visit data up until the point of an event, withdrawal, death, or the end of the first 12 months. 6
For participants allocated to intravenous zoledronic acid: 7
Adherence to intravenous zoledronic acid was based on interim and 12-weekly visit data, as 8
participants were required to attend to receive intravenous medication. It was assumed that 9
participants did not adhere to study medication if they either did not attend a scheduled visit, 10
or attended but were noted as not receiving study medication as prescribed during at least 11
one visit. 12
For participants allocated to oral ibandronic acid: 13
Interim visits were primarily arranged so that participants allocated to intravenous zoledronic 14
acid could receive their medication. Participants in the oral ibandronic acid arm were also 15
invited to attend interim visits to minimise the likelihood that an increase in clinical contact in 16
one arm could impact on trial findings. However, as it was not necessary for participants in 17
this arm to attend visits to receive medication, and non-attendance at one or more interim 18
visit was high, adherence to oral ibandronic acid was based on 12-weekly visit data only. It 19
was assumed that participants did not adhere to study medication if they were noted as not 20
receiving study medication as prescribed during at least one visit. 21
Adherence data were available for 1164 participants. 22
23
2. Full description of determining outcome (a skeletal-related event within the first 12 months) in 24
the ZICE study 25
The outcome used for the ZICE study in this paper is the occurrence of a skeletal-related event (SRE) 26
by the end of the 12 month post-randomisation follow-up period. Based on the available data (up to 27
the end of the trial), participants were classed as one of the following: 28
Reported an SRE within the first 12 months (YES) 29
Reported an SRE after the first 12 months (NO) 30
Alive at the end of the follow up period, no SRE reported (NO) 31
Died after the end of the 12 month follow-up period, did not report an SRE in the first 12 32
months (NO) 33
Died before the end of the 12 month follow-up period, no SRE reported (MISSING) 34
Withdrew after the end of the 12 month follow-up period, did not report an SRE in the first 35
12 months (NO) 36
Withdrew before the end of the 12 month follow-up period, no SRE reported (MISSING) 37
SRE outcome data were available for 1037 participants. 38
39
40
41
42
43
44
45
46
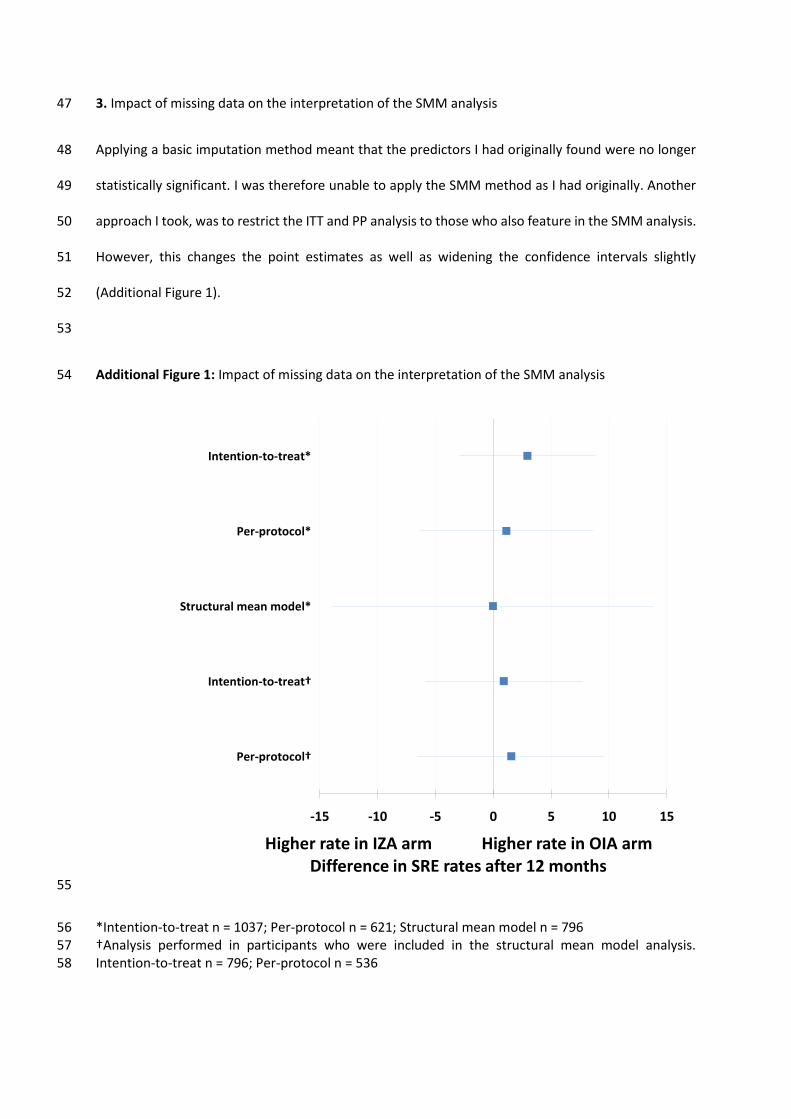
3. Impact of missing data on the interpretation of the SMM analysis 47
Applying a basic imputation method meant that the predictors I had originally found were no longer 48
statistically significant. I was therefore unable to apply the SMM method as I had originally. Another 49
approach I took, was to restrict the ITT and PP analysis to those who also feature in the SMM analysis. 50
However, this changes the point estimates as well as widening the confidence intervals slightly 51
(Additional Figure 1). 52
53
Additional Figure 1: Impact of missing data on the interpretation of the SMM analysis 54
55
*Intention-to-treat n = 1037; Per-protocol n = 621; Structural mean model n = 796 56 †Analysis performed in participants who were included in the structural mean model analysis. 57 Intention-to-treat n = 796; Per-protocol n = 536 58
-15 -10 -5 0 5 10 15
Per-protocol†
Intention-to-treat†
Structural mean model*
Per-protocol*
Intention-to-treat*
Higher rate in IZA arm Higher rate in OIA armDifference in SRE rates after 12 months
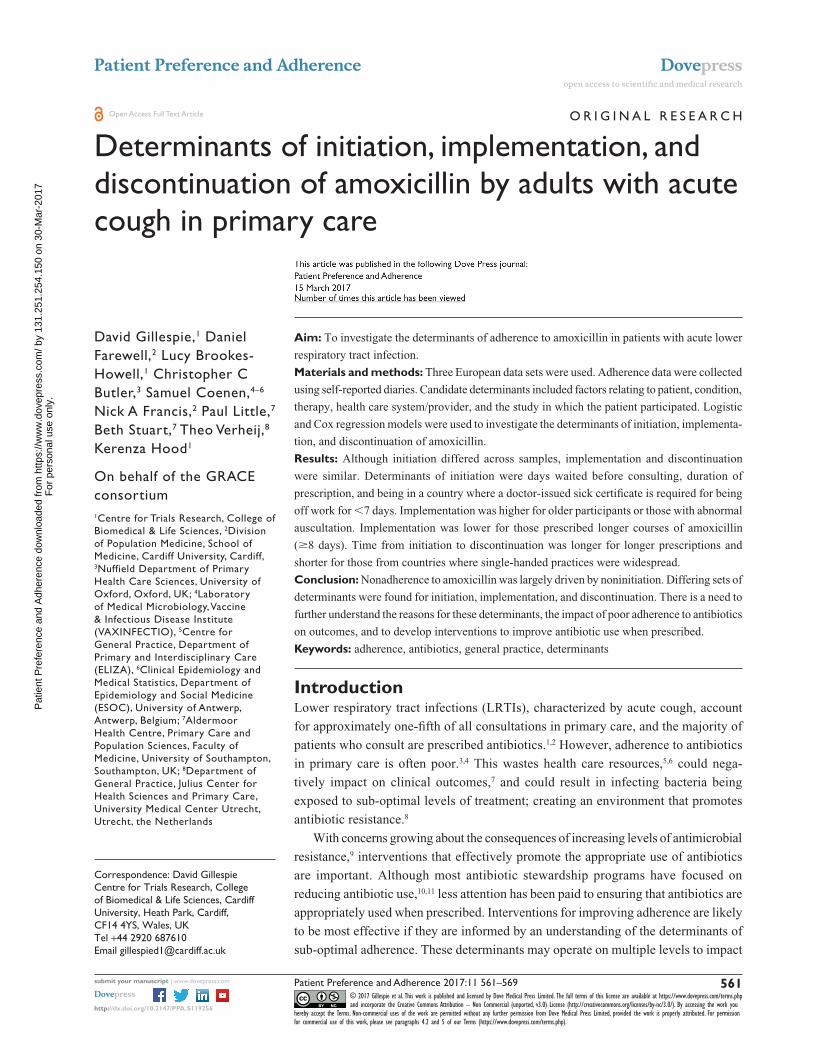
© 2017 Gillespie et al. This work is published and licensed by Dove Medical Press Limited. The full terms of this license are available at https://www.dovepress.com/terms.php and incorporate the Creative Commons Attribution – Non Commercial (unported, v3.0) License (http://creativecommons.org/licenses/by-nc/3.0/). By accessing the work you
hereby accept the Terms. Non-commercial uses of the work are permitted without any further permission from Dove Medical Press Limited, provided the work is properly attributed. For permission for commercial use of this work, please see paragraphs 4.2 and 5 of our Terms (https://www.dovepress.com/terms.php).
Patient Preference and Adherence 2017:11 561–569
Patient Preference and Adherence Dovepress
submit your manuscript | www.dovepress.com
Dovepress 561
O r i g i n A l r e s e A r c h
open access to scientific and medical research
Open Access Full Text Article
http://dx.doi.org/10.2147/PPA.S119256
Determinants of initiation, implementation, and discontinuation of amoxicillin by adults with acute cough in primary care
David gillespie,1 Daniel Farewell,2 lucy Brookes-howell,1 christopher c Butler,3 samuel coenen,4–6 nick A Francis,2 Paul little,7 Beth stuart,7 Theo Verheij,8 Kerenza hood1
On behalf of the grAce consortium1centre for Trials research, college of Biomedical & life sciences, 2Division of Population Medicine, school of Medicine, cardiff University, cardiff, 3nuffield Department of Primary health care sciences, University of Oxford, Oxford, UK; 4laboratory of Medical Microbiology, Vaccine & infectious Disease institute (VAXinFecTiO), 5centre for general Practice, Department of Primary and interdisciplinary care (eliZA), 6clinical epidemiology and Medical statistics, Department of epidemiology and social Medicine (esOc), University of Antwerp, Antwerp, Belgium; 7Aldermoor health centre, Primary care and Population sciences, Faculty of Medicine, University of southampton, southampton, UK; 8Department of general Practice, Julius center for health sciences and Primary care, University Medical center Utrecht, Utrecht, the netherlands
Aim: To investigate the determinants of adherence to amoxicillin in patients with acute lower
respiratory tract infection.
Materials and methods: Three European data sets were used. Adherence data were collected
using self-reported diaries. Candidate determinants included factors relating to patient, condition,
therapy, health care system/provider, and the study in which the patient participated. Logistic
and Cox regression models were used to investigate the determinants of initiation, implementa-
tion, and discontinuation of amoxicillin.
Results: Although initiation differed across samples, implementation and discontinuation
were similar. Determinants of initiation were days waited before consulting, duration of
prescription, and being in a country where a doctor-issued sick certificate is required for being
off work for ,7 days. Implementation was higher for older participants or those with abnormal
auscultation. Implementation was lower for those prescribed longer courses of amoxicillin
($8 days). Time from initiation to discontinuation was longer for longer prescriptions and
shorter for those from countries where single-handed practices were widespread.
Conclusion: Nonadherence to amoxicillin was largely driven by noninitiation. Differing sets of
determinants were found for initiation, implementation, and discontinuation. There is a need to
further understand the reasons for these determinants, the impact of poor adherence to antibiotics
on outcomes, and to develop interventions to improve antibiotic use when prescribed.
Keywords: adherence, antibiotics, general practice, determinants
IntroductionLower respiratory tract infections (LRTIs), characterized by acute cough, account
for approximately one-fifth of all consultations in primary care, and the majority of
patients who consult are prescribed antibiotics.1,2 However, adherence to antibiotics
in primary care is often poor.3,4 This wastes health care resources,5,6 could nega-
tively impact on clinical outcomes,7 and could result in infecting bacteria being
exposed to sub-optimal levels of treatment; creating an environment that promotes
antibiotic resistance.8
With concerns growing about the consequences of increasing levels of antimicrobial
resistance,9 interventions that effectively promote the appropriate use of antibiotics
are important. Although most antibiotic stewardship programs have focused on
reducing antibiotic use,10,11 less attention has been paid to ensuring that antibiotics are
appropriately used when prescribed. Interventions for improving adherence are likely
to be most effective if they are informed by an understanding of the determinants of
sub-optimal adherence. These determinants may operate on multiple levels to impact
correspondence: David gillespiecentre for Trials research, college of Biomedical & life sciences, cardiff University, heath Park, cardiff, cF14 4Ys, Wales, UKTel +44 2920 687610email [email protected]
Journal name: Patient Preference and AdherenceArticle Designation: Original ResearchYear: 2017Volume: 11Running head verso: Gillespie et alRunning head recto: Determinants of adherence to amoxicillin in patients with acute coughDOI: http://dx.doi.org/10.2147/PPA.S119256
P
atie
nt P
refe
renc
e an
d A
dher
ence
dow
nloa
ded
from
http
s://w
ww
.dov
epre
ss.c
om/ b
y 13
1.25
1.25
4.15
0 on
30-
Mar
-201
7F
or p
erso
nal u
se o
nly.
Powered by TCPDF (www.tcpdf.org)
1 / 1
Patient Preference and Adherence 2017:11submit your manuscript | www.dovepress.com
Dovepress
Dovepress
562
gillespie et al
on whether a patient adheres to a prescribed treatment, and
therefore large, detailed data sets are required to accurately
quantify these influences.
Adherence may be defined as “the process by which
patients take their medicine as prescribed”.12 Traditionally,
this has been represented quantitatively as a single variable
(eg, percentage of medicine taken as prescribed and a binary
taken as prescribed or not). However, recent work in this
field encourages the use of the distinct processes involved
in taking medicine, namely, initiation, implementation, and
discontinuation.13 Each individual process may have its own
determinants and influences on outcomes. Therefore, dif-
ferent interventions may be required to address each of the
adherence processes.
In this paper, we aim to investigate the determinants of
initiation, implementation, and discontinuation of amoxi-
cillin by adults consulting with an acute LRTI in European
primary care.
Materials and methodsstudies, patients, settings, and inclusion criteria for analysisData were used from three studies conducted as part of
the Genomics to combat Resistance against Antibiotics in
Community-acquired LRTI in Europe (GRACE) Network
of Excellence research program.14 All three studies recruited
adult patients aged $18 years consulting with an acute
LRTI/cough in primary care and are described in detail
elsewhere. In brief, Study 1 was a prospective cohort
study conducted in 13 European countries between 2006
and 2007;1 Study 2 was an observational study on the
etiology, diagnosis, and prognosis of LRTI conducted in
12 European countries between 2007 and 2010;15 and Study 3
was a placebo-controlled trial of amoxicillin nested within
Study 2.16 Following an initial consultation with a clinician,
participants in all three studies were given a diary that
recorded symptoms, medication use, and health care contacts.
Participants were asked to complete their diary for 28 days.
All three studies collected data using similar case report
forms (CRFs) and patient diaries. Study participants were
included in analysis if they were prescribed amoxicillin
for immediate use at their initial consultation (defined as
being prescribed amoxicillin and not advised to delay, as
recorded on the CRF) and it was possible to ascertain adher-
ence measures using self-reported diary data. The present
study focuses on the use of amoxicillin only, as this is the
recommended first-line antibiotic for LRTI in the European
Union.17 In Studies 1 and 2, participants who were prescribed
antibiotics other than amoxicillin were excluded. In Study 3
(the trial), amoxicillin was the only antibiotic prescribed.
Definition of adherence elementsinitiationParticipants were defined as having initiated their amoxicillin
if they indicated in their diary that they took amoxicillin at
least once during the 28 day follow-up period.
implementationIn participants who initiated their amoxicillin, implementa-
tion describes the extent to which the prescription was taken
as prescribed among those who initiated their amoxicillin.
For the purpose of this paper, it is defined as the proportion
of amoxicillin reportedly taken during the prescribed period.
For example, if a participant was prescribed amoxicillin for
5 days and only reported taking it for 4 days during the first
5 days of the follow-up period, their implementation score
would be 0.8 (ie, they initiated their amoxicillin course and
took 80% of it during the prescribing period).
DiscontinuationParticipants were defined as having discontinued their
amoxicillin prescription if they initiated their prescription and
subsequently reported a full week of not taking their medicine.
A gap of 1 week was deemed appropriate in distinguishing
between patients who stopped and restarted their medicine
and those who were prescribed a new course of amoxicillin.
The first day of that 1-week gap was defined as the day they
discontinued, and the time to discontinuation was calculated
as the difference in days between the day of discontinuation
and the day of initiation. For example, if a participant was
prescribed a 7-day course of amoxicillin, initiated their
amoxicillin on day 3, and days 10–17 were the first full week
where no amoxicillin was reportedly taken, they would be
defined as having discontinued on day 10, and their time from
initiation to discontinuation would be 7 days.
candidate determinantsDeterminants related to the patient, illness, prescription,
and health care setting were investigated. A full description
of the candidate determinants is given in the online supple-
mentary materials.
statistical analysisDescriptive statistics were reported as numbers and
percentages, means and standard deviations (SDs), or
medians and interquartile ranges (IQRs), as appropriate.
P
atie
nt P
refe
renc
e an
d A
dher
ence
dow
nloa
ded
from
http
s://w
ww
.dov
epre
ss.c
om/ b
y 13
1.25
1.25
4.15
0 on
30-
Mar
-201
7F
or p
erso
nal u
se o
nly.
Powered by TCPDF (www.tcpdf.org)
1 / 1
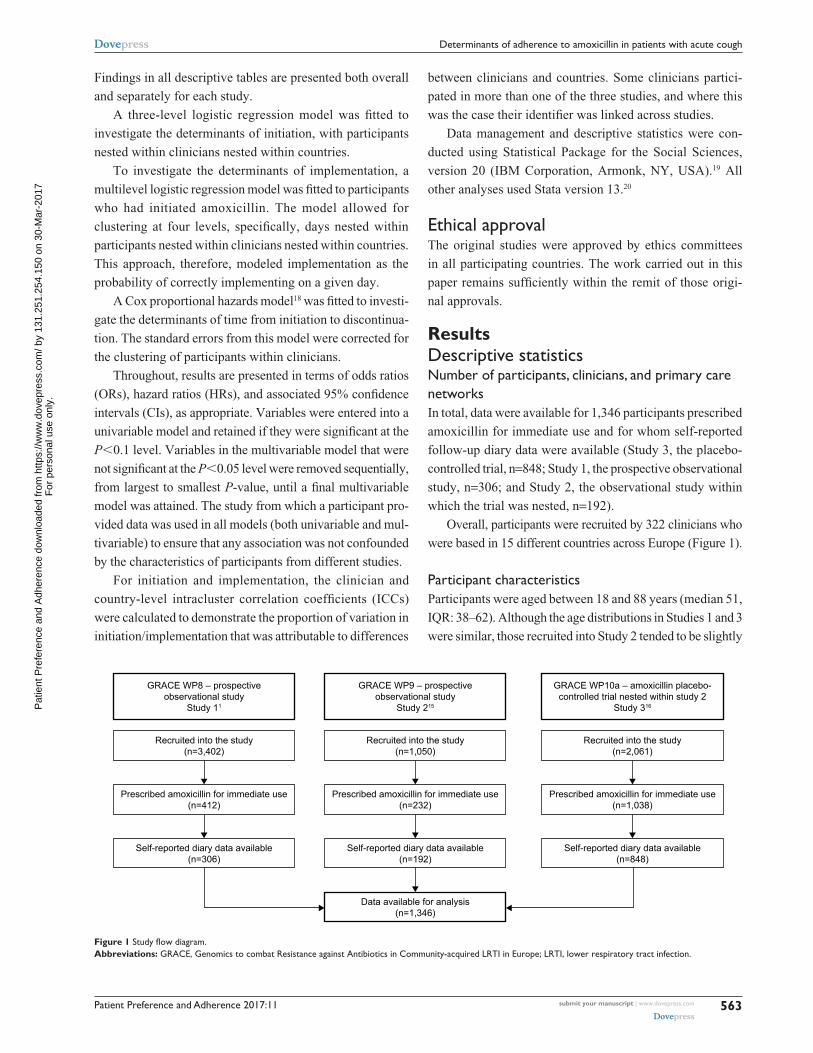
Patient Preference and Adherence 2017:11 submit your manuscript | www.dovepress.com
Dovepress
Dovepress
563
Determinants of adherence to amoxicillin in patients with acute cough
Findings in all descriptive tables are presented both overall
and separately for each study.
A three-level logistic regression model was fitted to
investigate the determinants of initiation, with participants
nested within clinicians nested within countries.
To investigate the determinants of implementation, a
multilevel logistic regression model was fitted to participants
who had initiated amoxicillin. The model allowed for
clustering at four levels, specifically, days nested within
participants nested within clinicians nested within countries.
This approach, therefore, modeled implementation as the
probability of correctly implementing on a given day.
A Cox proportional hazards model18 was fitted to investi-
gate the determinants of time from initiation to discontinua-
tion. The standard errors from this model were corrected for
the clustering of participants within clinicians.
Throughout, results are presented in terms of odds ratios
(ORs), hazard ratios (HRs), and associated 95% confidence
intervals (CIs), as appropriate. Variables were entered into a
univariable model and retained if they were significant at the
P,0.1 level. Variables in the multivariable model that were
not significant at the P,0.05 level were removed sequentially,
from largest to smallest P-value, until a final multivariable
model was attained. The study from which a participant pro-
vided data was used in all models (both univariable and mul-
tivariable) to ensure that any association was not confounded
by the characteristics of participants from different studies.
For initiation and implementation, the clinician and
country-level intracluster correlation coefficients (ICCs)
were calculated to demonstrate the proportion of variation in
initiation/implementation that was attributable to differences
between clinicians and countries. Some clinicians partici-
pated in more than one of the three studies, and where this
was the case their identifier was linked across studies.
Data management and descriptive statistics were con-
ducted using Statistical Package for the Social Sciences,
version 20 (IBM Corporation, Armonk, NY, USA).19 All
other analyses used Stata version 13.20
ethical approvalThe original studies were approved by ethics committees
in all participating countries. The work carried out in this
paper remains sufficiently within the remit of those origi-
nal approvals.
ResultsDescriptive statisticsnumber of participants, clinicians, and primary care networksIn total, data were available for 1,346 participants prescribed
amoxicillin for immediate use and for whom self-reported
follow-up diary data were available (Study 3, the placebo-
controlled trial, n=848; Study 1, the prospective observational
study, n=306; and Study 2, the observational study within
which the trial was nested, n=192).
Overall, participants were recruited by 322 clinicians who
were based in 15 different countries across Europe (Figure 1).
Participant characteristicsParticipants were aged between 18 and 88 years (median 51,
IQR: 38–62). Although the age distributions in Studies 1 and 3
were similar, those recruited into Study 2 tended to be slightly
Figure 1 Study flow diagram.Abbreviations: grAce, genomics to combat resistance against Antibiotics in community-acquired lrTi in europe; lrTi, lower respiratory tract infection.
P
atie
nt P
refe
renc
e an
d A
dher
ence
dow
nloa
ded
from
http
s://w
ww
.dov
epre
ss.c
om/ b
y 13
1.25
1.25
4.15
0 on
30-
Mar
-201
7F
or p
erso
nal u
se o
nly.
Powered by TCPDF (www.tcpdf.org)
1 / 1
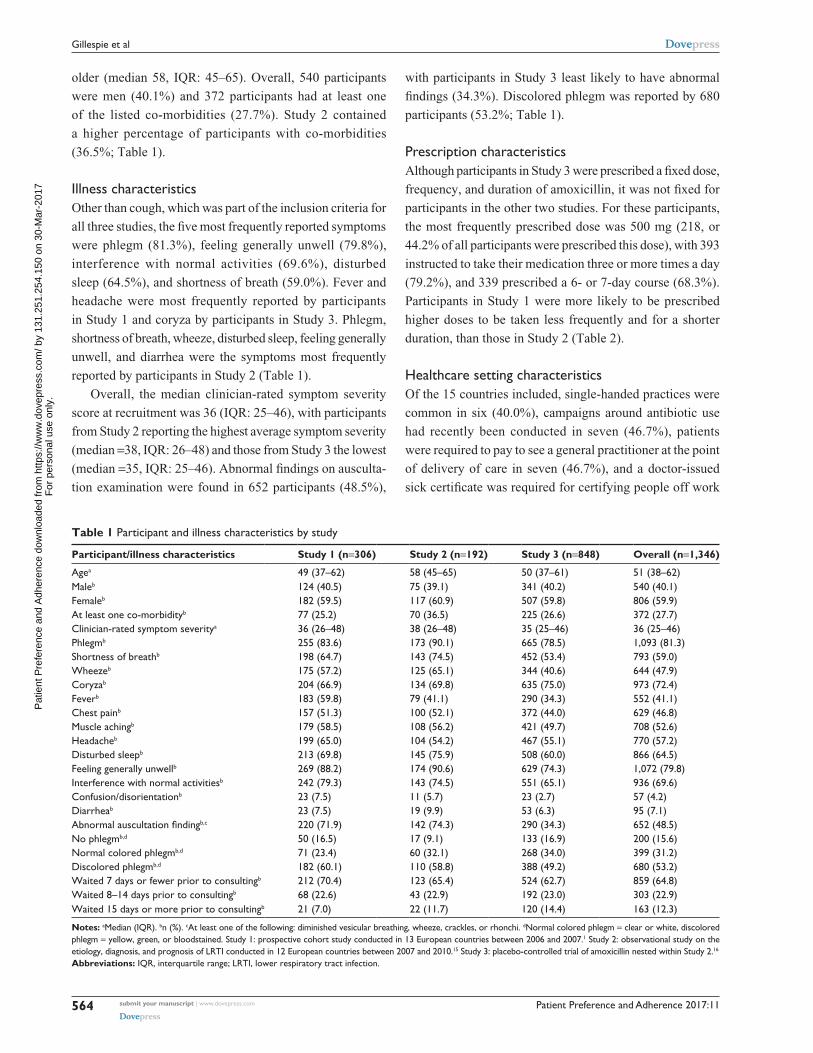
Patient Preference and Adherence 2017:11submit your manuscript | www.dovepress.com
Dovepress
Dovepress
564
gillespie et al
older (median 58, IQR: 45–65). Overall, 540 participants
were men (40.1%) and 372 participants had at least one
of the listed co-morbidities (27.7%). Study 2 contained
a higher percentage of participants with co-morbidities
(36.5%; Table 1).
illness characteristicsOther than cough, which was part of the inclusion criteria for
all three studies, the five most frequently reported symptoms
were phlegm (81.3%), feeling generally unwell (79.8%),
interference with normal activities (69.6%), disturbed
sleep (64.5%), and shortness of breath (59.0%). Fever and
headache were most frequently reported by participants
in Study 1 and coryza by participants in Study 3. Phlegm,
shortness of breath, wheeze, disturbed sleep, feeling generally
unwell, and diarrhea were the symptoms most frequently
reported by participants in Study 2 (Table 1).
Overall, the median clinician-rated symptom severity
score at recruitment was 36 (IQR: 25–46), with participants
from Study 2 reporting the highest average symptom severity
(median =38, IQR: 26–48) and those from Study 3 the lowest
(median =35, IQR: 25–46). Abnormal findings on ausculta-
tion examination were found in 652 participants (48.5%),
with participants in Study 3 least likely to have abnormal
findings (34.3%). Discolored phlegm was reported by 680
participants (53.2%; Table 1).
Prescription characteristicsAlthough participants in Study 3 were prescribed a fixed dose,
frequency, and duration of amoxicillin, it was not fixed for
participants in the other two studies. For these participants,
the most frequently prescribed dose was 500 mg (218, or
44.2% of all participants were prescribed this dose), with 393
instructed to take their medication three or more times a day
(79.2%), and 339 prescribed a 6- or 7-day course (68.3%).
Participants in Study 1 were more likely to be prescribed
higher doses to be taken less frequently and for a shorter
duration, than those in Study 2 (Table 2).
healthcare setting characteristicsOf the 15 countries included, single-handed practices were
common in six (40.0%), campaigns around antibiotic use
had recently been conducted in seven (46.7%), patients
were required to pay to see a general practitioner at the point
of delivery of care in seven (46.7%), and a doctor-issued
sick certificate was required for certifying people off work
Table 1 Participant and illness characteristics by study
Participant/illness characteristics Study 1 (n=306) Study 2 (n=192) Study 3 (n=848) Overall (n=1,346)
Agea 49 (37–62) 58 (45–65) 50 (37–61) 51 (38–62)Maleb 124 (40.5) 75 (39.1) 341 (40.2) 540 (40.1)Femaleb 182 (59.5) 117 (60.9) 507 (59.8) 806 (59.9)At least one co-morbidityb 77 (25.2) 70 (36.5) 225 (26.6) 372 (27.7)clinician-rated symptom severitya 36 (26–48) 38 (26–48) 35 (25–46) 36 (25–46)Phlegmb 255 (83.6) 173 (90.1) 665 (78.5) 1,093 (81.3)shortness of breathb 198 (64.7) 143 (74.5) 452 (53.4) 793 (59.0)Wheezeb 175 (57.2) 125 (65.1) 344 (40.6) 644 (47.9)coryzab 204 (66.9) 134 (69.8) 635 (75.0) 973 (72.4)Feverb 183 (59.8) 79 (41.1) 290 (34.3) 552 (41.1)chest painb 157 (51.3) 100 (52.1) 372 (44.0) 629 (46.8)Muscle achingb 179 (58.5) 108 (56.2) 421 (49.7) 708 (52.6)headacheb 199 (65.0) 104 (54.2) 467 (55.1) 770 (57.2)Disturbed sleepb 213 (69.8) 145 (75.9) 508 (60.0) 866 (64.5)Feeling generally unwellb 269 (88.2) 174 (90.6) 629 (74.3) 1,072 (79.8)interference with normal activitiesb 242 (79.3) 143 (74.5) 551 (65.1) 936 (69.6)confusion/disorientationb 23 (7.5) 11 (5.7) 23 (2.7) 57 (4.2)Diarrheab 23 (7.5) 19 (9.9) 53 (6.3) 95 (7.1)Abnormal auscultation findingb,c 220 (71.9) 142 (74.3) 290 (34.3) 652 (48.5)no phlegmb,d 50 (16.5) 17 (9.1) 133 (16.9) 200 (15.6)normal colored phlegmb,d 71 (23.4) 60 (32.1) 268 (34.0) 399 (31.2)Discolored phlegmb,d 182 (60.1) 110 (58.8) 388 (49.2) 680 (53.2)Waited 7 days or fewer prior to consultingb 212 (70.4) 123 (65.4) 524 (62.7) 859 (64.8)Waited 8–14 days prior to consultingb 68 (22.6) 43 (22.9) 192 (23.0) 303 (22.9)Waited 15 days or more prior to consultingb 21 (7.0) 22 (11.7) 120 (14.4) 163 (12.3)
Notes: aMedian (iQr). bn (%). cAt least one of the following: diminished vesicular breathing, wheeze, crackles, or rhonchi. dnormal colored phlegm = clear or white, discolored phlegm = yellow, green, or bloodstained. study 1: prospective cohort study conducted in 13 european countries between 2006 and 2007.1 study 2: observational study on the etiology, diagnosis, and prognosis of lrTi conducted in 12 european countries between 2007 and 2010.15 study 3: placebo-controlled trial of amoxicillin nested within study 2.16
Abbreviations: iQr, interquartile range; lrTi, lower respiratory tract infection.
P
atie
nt P
refe
renc
e an
d A
dher
ence
dow
nloa
ded
from
http
s://w
ww
.dov
epre
ss.c
om/ b
y 13
1.25
1.25
4.15
0 on
30-
Mar
-201
7F
or p
erso
nal u
se o
nly.
Powered by TCPDF (www.tcpdf.org)
1 / 1

Patient Preference and Adherence 2017:11 submit your manuscript | www.dovepress.com
Dovepress
Dovepress
565
Determinants of adherence to amoxicillin in patients with acute cough
for ,7 days in three (20.0%). Amoxicillin was the first-line
choice of antibiotic in the national guidelines of six of the
countries (40.0%), and antibiotic prescribing rates ranged
from 11.2 defined daily doses per 1,000 inhabitants/day
(the Netherlands) to 28.6 defined daily doses per 1,000 inhab-
itants/day (France), with six countries categorized as low
prescribers (the Netherlands, Sweden, Germany, Slovenia,
Norway, and Hungary), five as moderate (England, Wales,
Finland, Spain, and Poland), and four as high prescribers
(Slovakia, Belgium, Italy, and France) (Table 3).
AnalysisinitiationWhile overall, a high proportion of participants initiated their
amoxicillin (1,057 or 78.5% of participants), this was largely
driven by the almost-complete initiation of amoxicillin seen
in Study 3 (97.6%). Initiation in participants from Study 1
and Study 2 was considerably lower (51.0% and 38.0%,
respectively). When initiation occurred, it was mostly on
the day of prescription (91.5% of participants who initiated
did so on day 1).
Compared to those who had waited #7 days, partici-
pants who had waited $15 days prior to consulting had
higher odds of initiating their amoxicillin (OR =2.77, 95%
CI: 1.35–5.67). There was some evidence that the duration
of the prescription was also associated with amoxicillin
initiation. Participants who were prescribed amoxicillin
for $8 days had higher odds of initiating their amoxicillin
than those prescribed for #5 days, although this was not
statistically significant at the 5% level (OR =2.29, 95% CI:
0.97–5.42). Participants in countries where a sick certifi-
cate was required for taking ,7 days off work had higher
odds of initiating their amoxicillin (OR =2.15, 95% CI:
1.27–3.64) (Table 4).
The ICC from the final multivariable model indicated
that 17% of the total variation in initiation was attributable
to differences between clinicians. The country-level ICC
was negligible.
Table 3 health care setting characteristics
Country Widespread availability of single-handed practicesa
Recent public campaigns around antibiotic usea
Payment required to see general practitionera
Sick certification required for less than 7 days off worka
Amoxicillin first-line choice for a respiratory infection in primary carea
Antibiotic prescribing rateb
Belgium 27.1 (25.2–28.2)england 17.4 (16.5–18.7)Finland 18.1 (17.8–18.5)France 28.6 (28.1–29.6)germany 14.6 (14.5–14.9)hungary 15.6 (15.2–16.0)italy 28.1 (27.6–28.7)the netherlands 11.2 (11.1–11.4)norway 15.5 (15.2–15.8)Poland 21.9 (20.8–23.6)slovakia 23.9 (23.2–24.8)slovenia 14.9 (14.3–15.9)spain 19.9 (19.7–20.3)sweden 14.6 (14.1–15.5)Wales 17.4 (16.5–18.7)
Notes: aObtained from interview data as part of the grAce project.14 bObtained from the Antimicrobial consumption interactive database (ESAC-Net),30 and defined as the defined daily dose per 1,000 inhabitants per day. rate averaged across years 2007–2010 (min and max values in brackets). United Kingdom rates used for england and Wales.Abbreviations: grAce, genomics to combat resistance against Antibiotics in community-acquired lrTi in europe; lrTi, lower respiratory tract infection; max, maximum; min, minimum.
Table 2 Amoxicillin prescription characteristics by study
Prescription characteristic
Study 1 (n=306)
Study 2 (n=192)
Study 3 (n=848)
Overall (n=1,346)
Dose (mg),500 23 (12.3) 52 (17.0) 0 (0.0) 75 (5.6)500 99 (52.9) 119 (38.9) 0 (0.0) 218 (16.3)$500 to ,1,000 (not inclusive)
8 (4.3) 34 (11.1) 0 (0.0) 42 (3.1)
$1,000 57 (30.5) 101 (33.0) 848 (100.0) 1,006 (75.0)Frequency (times per day)Twice 13 (6.8) 90 (29.4) 0 (0.0) 103 (7.7)More than twice 177 (93.2) 216 (70.6) 848 (100.0) 1,241 (92.3)Duration (days)#5 14 (7.3) 59 (19.3) 0 (0.0) 73 (5.4)6 or 7 144 (75.4) 195 (63.9) 848 (100.0) 1,187 (88.3)$8 33 (17.3) 51 (16.7) 0 (0.0) 84 (6.2)
Notes: Data presented as n (%). study 1: prospective cohort study conducted in 13 european countries between 2006 and 2007.1 study 2: observational study on the etiology, diagnosis, and prognosis of lower respiratory tract infection conducted in 12 european countries between 2007 and 2010.15 study 3: placebo-controlled trial of amoxicillin nested within study 2.16
P
atie
nt P
refe
renc
e an
d A
dher
ence
dow
nloa
ded
from
http
s://w
ww
.dov
epre
ss.c
om/ b
y 13
1.25
1.25
4.15
0 on
30-
Mar
-201
7F
or p
erso
nal u
se o
nly.
Powered by TCPDF (www.tcpdf.org)
1 / 1
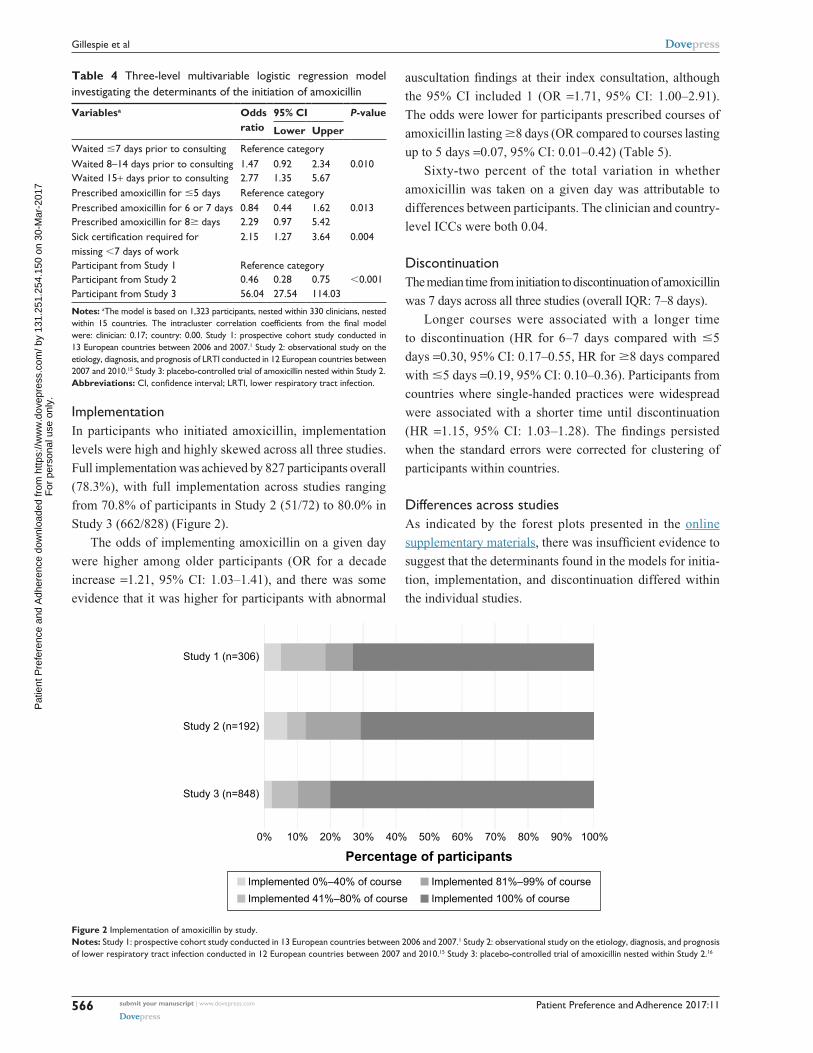
Patient Preference and Adherence 2017:11submit your manuscript | www.dovepress.com
Dovepress
Dovepress
566
gillespie et al
implementationIn participants who initiated amoxicillin, implementation
levels were high and highly skewed across all three studies.
Full implementation was achieved by 827 participants overall
(78.3%), with full implementation across studies ranging
from 70.8% of participants in Study 2 (51/72) to 80.0% in
Study 3 (662/828) (Figure 2).
The odds of implementing amoxicillin on a given day
were higher among older participants (OR for a decade
increase =1.21, 95% CI: 1.03–1.41), and there was some
evidence that it was higher for participants with abnormal
auscultation findings at their index consultation, although
the 95% CI included 1 (OR =1.71, 95% CI: 1.00–2.91).
The odds were lower for participants prescribed courses of
amoxicillin lasting $8 days (OR compared to courses lasting
up to 5 days =0.07, 95% CI: 0.01–0.42) (Table 5).
Sixty-two percent of the total variation in whether
amoxicillin was taken on a given day was attributable to
differences between participants. The clinician and country-
level ICCs were both 0.04.
DiscontinuationThe median time from initiation to discontinuation of amoxicillin
was 7 days across all three studies (overall IQR: 7–8 days).
Longer courses were associated with a longer time
to discontinuation (HR for 6–7 days compared with #5
days =0.30, 95% CI: 0.17–0.55, HR for $8 days compared
with #5 days =0.19, 95% CI: 0.10–0.36). Participants from
countries where single-handed practices were widespread
were associated with a shorter time until discontinuation
(HR =1.15, 95% CI: 1.03–1.28). The findings persisted
when the standard errors were corrected for clustering of
participants within countries.
Differences across studiesAs indicated by the forest plots presented in the online
supplementary materials, there was insufficient evidence to
suggest that the determinants found in the models for initia-
tion, implementation, and discontinuation differed within
the individual studies.
Table 4 Three-level multivariable logistic regression model investigating the determinants of the initiation of amoxicillin
Variablesa Odds ratio
95% CI P-value
Lower Upper
Waited #7 days prior to consulting reference categoryWaited 8–14 days prior to consulting 1.47 0.92 2.34 0.010Waited 15+ days prior to consulting 2.77 1.35 5.67Prescribed amoxicillin for #5 days reference categoryPrescribed amoxicillin for 6 or 7 days 0.84 0.44 1.62 0.013Prescribed amoxicillin for 8$ days 2.29 0.97 5.42Sick certification required for missing ,7 days of work
2.15 1.27 3.64 0.004
Participant from study 1 reference categoryParticipant from study 2 0.46 0.28 0.75 ,0.001Participant from study 3 56.04 27.54 114.03
Notes: aThe model is based on 1,323 participants, nested within 330 clinicians, nested within 15 countries. The intracluster correlation coefficients from the final model were: clinician: 0.17; country: 0.00. study 1: prospective cohort study conducted in 13 european countries between 2006 and 2007.1 study 2: observational study on the etiology, diagnosis, and prognosis of lrTi conducted in 12 european countries between 2007 and 2010.15 study 3: placebo-controlled trial of amoxicillin nested within study 2.Abbreviations: CI, confidence interval; LRTI, lower respiratory tract infection.
Figure 2 implementation of amoxicillin by study.Notes: study 1: prospective cohort study conducted in 13 european countries between 2006 and 2007.1 study 2: observational study on the etiology, diagnosis, and prognosis of lower respiratory tract infection conducted in 12 european countries between 2007 and 2010.15 study 3: placebo-controlled trial of amoxicillin nested within study 2.16
P
atie
nt P
refe
renc
e an
d A
dher
ence
dow
nloa
ded
from
http
s://w
ww
.dov
epre
ss.c
om/ b
y 13
1.25
1.25
4.15
0 on
30-
Mar
-201
7F
or p
erso
nal u
se o
nly.
Powered by TCPDF (www.tcpdf.org)
1 / 1
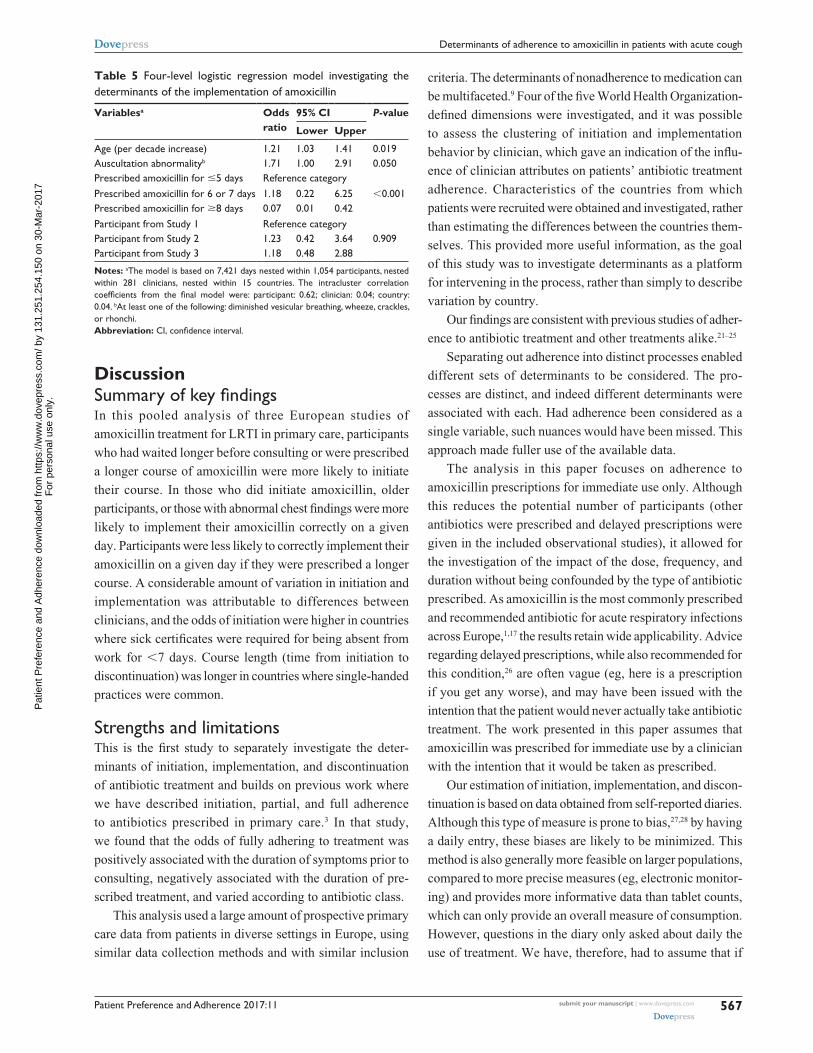
Patient Preference and Adherence 2017:11 submit your manuscript | www.dovepress.com
Dovepress
Dovepress
567
Determinants of adherence to amoxicillin in patients with acute cough
DiscussionSummary of key findingsIn this pooled analysis of three European studies of
amoxicillin treatment for LRTI in primary care, participants
who had waited longer before consulting or were prescribed
a longer course of amoxicillin were more likely to initiate
their course. In those who did initiate amoxicillin, older
participants, or those with abnormal chest findings were more
likely to implement their amoxicillin correctly on a given
day. Participants were less likely to correctly implement their
amoxicillin on a given day if they were prescribed a longer
course. A considerable amount of variation in initiation and
implementation was attributable to differences between
clinicians, and the odds of initiation were higher in countries
where sick certificates were required for being absent from
work for ,7 days. Course length (time from initiation to
discontinuation) was longer in countries where single-handed
practices were common.
strengths and limitationsThis is the first study to separately investigate the deter-
minants of initiation, implementation, and discontinuation
of antibiotic treatment and builds on previous work where
we have described initiation, partial, and full adherence
to antibiotics prescribed in primary care.3 In that study,
we found that the odds of fully adhering to treatment was
positively associated with the duration of symptoms prior to
consulting, negatively associated with the duration of pre-
scribed treatment, and varied according to antibiotic class.
This analysis used a large amount of prospective primary
care data from patients in diverse settings in Europe, using
similar data collection methods and with similar inclusion
criteria. The determinants of nonadherence to medication can
be multifaceted.9 Four of the five World Health Organization-
defined dimensions were investigated, and it was possible
to assess the clustering of initiation and implementation
behavior by clinician, which gave an indication of the influ-
ence of clinician attributes on patients’ antibiotic treatment
adherence. Characteristics of the countries from which
patients were recruited were obtained and investigated, rather
than estimating the differences between the countries them-
selves. This provided more useful information, as the goal
of this study was to investigate determinants as a platform
for intervening in the process, rather than simply to describe
variation by country.
Our findings are consistent with previous studies of adher-
ence to antibiotic treatment and other treatments alike.21–25
Separating out adherence into distinct processes enabled
different sets of determinants to be considered. The pro-
cesses are distinct, and indeed different determinants were
associated with each. Had adherence been considered as a
single variable, such nuances would have been missed. This
approach made fuller use of the available data.
The analysis in this paper focuses on adherence to
amoxicillin prescriptions for immediate use only. Although
this reduces the potential number of participants (other
antibiotics were prescribed and delayed prescriptions were
given in the included observational studies), it allowed for
the investigation of the impact of the dose, frequency, and
duration without being confounded by the type of antibiotic
prescribed. As amoxicillin is the most commonly prescribed
and recommended antibiotic for acute respiratory infections
across Europe,1,17 the results retain wide applicability. Advice
regarding delayed prescriptions, while also recommended for
this condition,26 are often vague (eg, here is a prescription
if you get any worse), and may have been issued with the
intention that the patient would never actually take antibiotic
treatment. The work presented in this paper assumes that
amoxicillin was prescribed for immediate use by a clinician
with the intention that it would be taken as prescribed.
Our estimation of initiation, implementation, and discon-
tinuation is based on data obtained from self-reported diaries.
Although this type of measure is prone to bias,27,28 by having
a daily entry, these biases are likely to be minimized. This
method is also generally more feasible on larger populations,
compared to more precise measures (eg, electronic monitor-
ing) and provides more informative data than tablet counts,
which can only provide an overall measure of consumption.
However, questions in the diary only asked about daily the
use of treatment. We have, therefore, had to assume that if
Table 5 Four-level logistic regression model investigating the determinants of the implementation of amoxicillin
Variablesa Odds ratio
95% CI P-value
Lower Upper
Age (per decade increase) 1.21 1.03 1.41 0.019Auscultation abnormalityb 1.71 1.00 2.91 0.050Prescribed amoxicillin for #5 days reference categoryPrescribed amoxicillin for 6 or 7 days 1.18 0.22 6.25 ,0.001Prescribed amoxicillin for $8 days 0.07 0.01 0.42Participant from study 1 reference categoryParticipant from study 2 1.23 0.42 3.64 0.909Participant from study 3 1.18 0.48 2.88
Notes: aThe model is based on 7,421 days nested within 1,054 participants, nested within 281 clinicians, nested within 15 countries. The intracluster correlation coefficients from the final model were: participant: 0.62; clinician: 0.04; country: 0.04. bAt least one of the following: diminished vesicular breathing, wheeze, crackles, or rhonchi.Abbreviation: CI, confidence interval.
P
atie
nt P
refe
renc
e an
d A
dher
ence
dow
nloa
ded
from
http
s://w
ww
.dov
epre
ss.c
om/ b
y 13
1.25
1.25
4.15
0 on
30-
Mar
-201
7F
or p
erso
nal u
se o
nly.
Powered by TCPDF (www.tcpdf.org)
1 / 1
Patient Preference and Adherence 2017:11submit your manuscript | www.dovepress.com
Dovepress
Dovepress
568
gillespie et al
a participant reported that they consumed amoxicillin on a
given day, they consumed the correct number of doses and
these doses were spread evenly throughout the day – an
assumption that could have been checked with a measure,
such as electronic monitoring.
To reduce any biases that may arise, from comparing
adherence to medication in observational studies and trials,
all analyses controlled for the study from which a patient
participated.
implicationsClinicians may be able to improve adherence to prescribed
antibiotics, especially in those most likely to benefit from
antibiotic treatment, by considering which patients are unlikely
to start or incorrectly implement their prescription.
There are no obvious, evidence-based, reasons for varia-
tion in adherence related to the determinants we identified.
There is a need to further understand the reasons for these
determinants and to develop interventions to improve
antibiotic use in this setting. However, the determinants that
were found associated with initiation and implementation
(particularly days with symptoms prior to consulting and
auscultation findings) may imply that an intervention that
addresses patients’ perceptions about their illness might
help improve adherence. Given the degree of clustering of
initiation and implementation at the level of the responsible
clinician, an intervention that was delivered by clinicians
would seem most likely to be effective.
Given the theorized association between sub-optimal
exposure to antibiotics and the development of antibiotic
resistance, time from initiation to discontinuation (regardless
of how correctly the medicine was implemented) does not
seem to be a priority target for intervention. Although it is an
element that has value in other areas (eg, medicines to be taken
long term and for which there may not be a defined end date),
its value for antibiotics for acute conditions is questionable.
Selection of resistance may already occur after the first
dose of an antibiotic, and therefore initiation of antibiotic
treatment may be the main driver of antibiotic resistance, not
necessarily implementation or discontinuation.29 Nonadher-
ence was driven by noninitiation. Different determinants were
found for each adherence element.
Future researchFuture work should focus on establishing whether there is
a causal relationship between noninitiation, poor imple-
mentation, and clinical outcomes (eg, patient recovery,
hospitalizations, re-consultations, and short- and long-term
carriage of antibiotic-resistant organisms). Should a link be
established, the findings reported in this paper could inform
the development of an intervention that improves initiation and
implementation, and in turn improves clinical outcomes for
patients with acute respiratory infections in primary care.
AcknowledgmentsThe authors wish to acknowledge Professor Herman
Goossens and Ms Jacqueline Nuttall for helping shape the
manuscript. In addition, we would like to acknowledge the
entire GRACE consortium for their tremendous efforts, both
directly and indirectly, in shaping the work presented in this
manuscript, including Tricia Worby, Alicia Borras, An De
Sutter, Anna Kowalczyk, Antoni Torres, Artur Mierzecki,
Bernadette Kovaks, Bo-Eric Malmvall, Carol Pascoe,
Christina Lannering, Christine Lammens, Curt Brugman,
Francesco Blasi, Frank Leus, Greet Ieven, Helena Hupkova,
Igor Svab, Iris Hering, Jackie Swain, Janko Kersnik, Jo Coast,
Jordi Almirall, Judit Holczerné, Karel Moons, Katherine
Loens, Kirsi Valve, Kristien Dirven, Kristin Alise Jakobsen,
Lidewij Broekhuizen, Maciek Godycki-Cwirko, Magdalena
Muras, Margareta Ieven, Marieke Lemiengre, Matteu Serra,
Mel Davies, Michael Moore, Niels Adriaenssens, Nuria
Sanchez Romano, Paolo Tarsia, Pascale Bruno, Patricia
Fernez, Peter Edwards, Peter Zuithoff, Pia Touboul, Pim
de Jong, Richard Smith, Robert Veen, Saskia van Vugt,
Sigvard Mölstad, Slawomir Chlabicz, Tom Schaberg, Zuzana
Bielicka, and Zseraldina Arvai.
FundingThe GRACE consortium’s research was funded by the
European Community’s Sixth Framework Programme (grant
agreement 518226). Work in the UK was also supported by
the National Institute for Health Research, in Barcelona by
2009 SGR 911 Ciber de Enfermedades Respiratorias (Ciberes
CB06/06/0028), and in Belgium by the Research Foundation –
Flanders (FWO; G.0274.08N). The work reported on in this
publication has been financially supported by Bond University
(Australia), Research Foundation – Flanders, University of
Antwerp, University of Ghent (Belgium), Chinese University
of Hong Kong (People’s Republic of China), University
of Copenhagen (Denmark), Research Council of Health,
Academy of Finland (Finland), College Azuréen des
Généralistes Enseignants, Comité Départemental d’Education
pour la Santé (France), Rostock University (Germany), the
Netherlands Organisation for Scientific Research, AMC
Amsterdam, Leiden UMC, UMC Utrecht (the Netherlands),
Research Council of Norway, University of Oslo, University
P
atie
nt P
refe
renc
e an
d A
dher
ence
dow
nloa
ded
from
http
s://w
ww
.dov
epre
ss.c
om/ b
y 13
1.25
1.25
4.15
0 on
30-
Mar
-201
7F
or p
erso
nal u
se o
nly.
Powered by TCPDF (www.tcpdf.org)
1 / 1
Patient Preference and Adherence
Publish your work in this journal
Submit your manuscript here: http://www.dovepress.com/patient-preference-and-adherence-journal
Patient Preference and Adherence is an international, peer-reviewed, open access journal that focuses on the growing importance of patient preference and adherence throughout the therapeutic continuum. Patient satisfaction, acceptability, quality of life, compliance, persistence and their role in developing new therapeutic modalities and compounds to optimize
clinical outcomes for existing disease states are major areas of interest for the journal. This journal has been accepted for indexing on PubMed Central. The manuscript management system is completely online and includes a very quick and fair peer-review system, which is all easy to use. Visit http://www.dovepress.com/testimonials.php to read real quotes from published authors.
Patient Preference and Adherence 2017:11 submit your manuscript | www.dovepress.com
Dovepress
Dovepress
Dovepress
569
Determinants of adherence to amoxicillin in patients with acute cough
of Tromso (Norway), Medical University of Bialystok,
Medical University of Lodz (Poland), National University
Research Council (Romania), Osnovno zdravstvo Gorenjske
(Slovenia), l’Institut d’Investigacions Biomèdiques August
Pi i Sunyer (Spain), Swedish Research Council, Karolinska
Institute (Sweden), Medical Research Council, Cardiff
University, University of Oxford, University of Southampton
(United Kingdom), Swiss National Science Foundation (Swit-
zerland) through the European Science Foundation (ESF),
in the framework of the Research Networking Programme
TRACE (http://archives.esf.org/trace).
DisclosureThe authors report no conflicts of interest in this work.
References 1. Butler CC, Hood K, Verheij T, et al. Variation in antibiotic prescribing
and its impact on recovery in patients with acute cough in primary care: prospective study in 13 countries. BMJ. 2009;338:b2242.
2. Currie CJ, Berni E, Jenkins-Jones S, et al. Antibiotic treatment failure in four common infections in UK primary care 1991–2012: longitudinal analysis. BMJ. 2014;349:g5493.
3. Francis NA, Gillespie D, Nuttall J, et al. Antibiotics for acute cough: an international observational study of patient adherence in primary care. Br J Gen Pract. 2012;62(599):e429–e437.
4. Kardas P, Devine S, Golembesky A, Roberts C. A systematic review and meta-analysis of misuse of antibiotic therapies in the community. Int J Antimicrob Agents. 2005;26(2):106–113.
5. Berg JS, Dischler J, Wagner DJ, Raia JJ, Palmer-Shevlin N. Medication compliance: a healthcare problem. Ann Pharmacother. 1993;27 (9 Suppl):S1–S24.
6. McDonnell PJ, Jacobs MR. Hospital admissions resulting from preventable adverse drug reactions. Ann Pharmacother. 2002;36(9): 1331–1336.
7. Sclar D, Tartaglione T, Fine M. Overview of issues related to medical compliance with implications for the outpatient management of infectious diseases. Infect Agents Dis. 1994;3(5):266–273.
8. Vrijens B, Urquhart J. Patient adherence to prescribed antimicrobial drug dosing regimens. J Antimicrob Chemother. 2005;55(5):616–627.
9. Sabaté E. Adherence to Long-Term Therapies: Evidence for Action: World Health Organization, 2003.
10. Butler CC, Simpson SA, Dunstan F, et al. Effectiveness of multifaceted educational programme to reduce antibiotic dispensing in primary care: practice based randomised controlled trial. BMJ. 2012;344:d8173.
11. Little P, Stuart B, Francis N, et al. Effects of internet-based training on antibiotic prescribing rates for acute respiratory-tract infections: a mul-tinational, cluster, randomised, factorial, controlled trial. Lancet. 2013; 382(9899):1175–1182.
12. Osterberg L, Blaschke T. Adherence to medication. N Engl J Med. 2005; 353(5):487–497.
13. Vrijens B, De Geest S, Hughes DA, et al. A new taxonomy for describ-ing and defining adherence to medications. Br J Clin Pharmacol. 2012; 73(5):691–705.
14. GRACE website. Secondary GRACE website. Available from: http://www.grace-lrti.org/portal/en-gb/. Accessed August 12, 2016.
15. van Vugt SF, Broekhuizen BD, Lammens C, et al. Use of serum C reac-tive protein and procalcitonin concentrations in addition to symptoms and signs to predict pneumonia in patients presenting to primary care with acute cough: diagnostic study. BMJ. 2013;346:f2450.
16. Little P, Stuart B, Moore M, et al. Amoxicillin for acute lower-respiratory-tract infection in primary care when pneumonia is not suspected: a 12-country, randomised, placebo-controlled trial. Lancet Infect Dis. 2013;13(2):123–129.
17. Wood J, Butler CC, Hood K, et al. Antibiotic prescribing for adults with acute cough/lower respiratory tract infection: congruence with guidelines. Eur Respir J. 2011;38(1):112–118.
18. Cox DR. Regression models and life-tables. J R Stat Soc Series B (Methodological). 1972;34(2):187–220.
19. IBM SPSS Statistics for Windows [program]. 20.0 version. Armonk, NY: IBM Corp, 2011.
20. Stata Statistical Software [program]. 13 version. College Station, TX: StataCorp LP, 2013.
21. Cockburn J, Gibberd RW, Reid AL, Sanson-Fisher RW. Determi-nants of non-compliance with short term antibiotic regimens. Br Med J (Clin Res Ed). 1987;295(6602):814–818.
22. DiMatteo MR, Haskard KB, Williams SL. Health beliefs, disease severity, and patient adherence: a meta-analysis. Med Care. 2007;45(6): 521–528.
23. Llor C, Sierra N, Hernandez S, et al. The higher the number of daily doses of antibiotic treatment in lower respiratory tract infection the worse the compliance. J Antimicrob Chemother. 2009;63(2):396–399.
24. Pechere JC, Hughes D, Kardas P, Cornaglia G. Non-compliance with antibiotic therapy for acute community infections: a global survey. Int J Antimicrob Agents. 2007;29(3):245–253.
25. Vermeire E, Hearnshaw H, Van Royen P, Denekens J. Patient adher-ence to treatment: three decades of research. A comprehensive review. J Clin Pharm Ther. 2001;26(5):331–342.
26. Francis NA, Gillespie D, Nuttall J, et al. Delayed antibiotic prescrib-ing and associated antibiotic consumption in adults with acute cough. Br J Gen Pract. 2012;62(602):e639–e646.
27. Aikens JE, Nease DE Jr, Nau DP, Klinkman MS, Schwenk TL. Adher-ence to maintenance-phase antidepressant medication as a function of patient beliefs about medication. Ann Fam Med. 2005;3(1):23–30.
28. Lu M, Safren SA, Skolnik PR, et al. Optimal recall period and response task for self-reported HIV medication adherence. AIDS Behav. 2008; 12(1):86–94.
29. Malhotra-Kumar S, Lammens C, Coenen S, Van Herck K, Goossens H. Effect of azithromycin and clarithromycin therapy on pharyngeal carriage of macrolide-resistant streptococci in healthy volunteers: a randomised, double-blind, placebo-controlled study. Lancet. 2007;369(9560): 482–490.
30. European Centre for Disease Prevention and Control. Antimicrobial con-sumption interactive database (ESAC-Net). Available from: http://ecdc.europa.eu/en/healthtopics/antimicrobial_resistance/esac-net-database/Pages/overview-country-consumption.aspx. Accessed September 2, 2016.
P
atie
nt P
refe
renc
e an
d A
dher
ence
dow
nloa
ded
from
http
s://w
ww
.dov
epre
ss.c
om/ b
y 13
1.25
1.25
4.15
0 on
30-
Mar
-201
7F
or p
erso
nal u
se o
nly.
Powered by TCPDF (www.tcpdf.org)
1 / 1

Supplementary materials
Description of candidate determinants
Patient‐related determinants included age, gender, and whether the participant had a co‐morbidity
(at least one of the following: Chronic Obstructive Pulmonary Disease (COPD), asthma, other lung
disease, heart failure, ischemic heart disease, other heart disease, or diabetes).
Illness‐related determinants included presenting symptoms (cough, phlegm, shortness of breath,
wheeze, coryza, fever, chest pain, muscle aching, headache, disturbed sleep, feeling generally unwell,
interference with normal activities, confusion/disorientation, and diarrhoea), clinician‐rated symptom
severity score (a summation of the severity of the 14 symptoms previously described scaled to range
from 0 to 100, where 100 represented the maximum severity on all 14 symptoms and 0 represented
no problems on any of the 14 symptoms), phlegm colour (categorised as no phlegm, normal coloured
phlegm (white or clear), and discoloured phlegm (yellow, green, or bloodstained)), whether an
abnormality was found when performing an auscultation examination (at least one of the following:
diminished vesicular breathing, wheeze, crackles, or rhonchi), and the number of days of symptoms
prior to consulting (categorised as seven days or less, eight to 14 days, or 15 days or more).
Prescription‐related determinants included the dose (categorised as less than 500mg, 500mg,
between 500 and 1000mg (not inclusive), and 1000mg or more), frequency (categorised as twice a
day or more than twice a day), and duration (categorised as five days or less, six to seven days, or eight
or more days) of the amoxicillin prescription. For the participants in study 3 (i.e. the placebo‐controlled
trial), this was fixed, as all participants were prescribed 1000mg of amoxicillin, three times a day for
seven days.
While there were no specific healthcare professional‐related determinants available consistently
across all three datasets, responsible clinician identifiers were available and could be used to
determine whether variation in adherence could be attributed to the influence of individual clinicians.
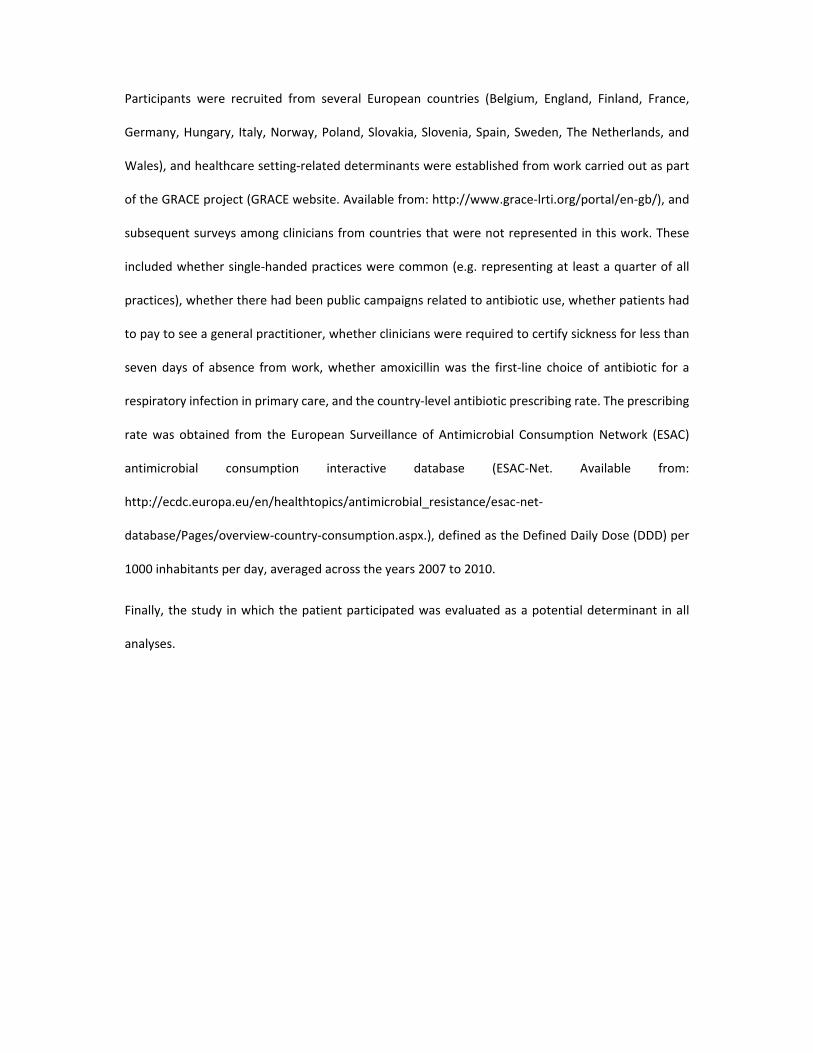
Participants were recruited from several European countries (Belgium, England, Finland, France,
Germany, Hungary, Italy, Norway, Poland, Slovakia, Slovenia, Spain, Sweden, The Netherlands, and
Wales), and healthcare setting‐related determinants were established from work carried out as part
of the GRACE project (GRACE website. Available from: http://www.grace‐lrti.org/portal/en‐gb/), and
subsequent surveys among clinicians from countries that were not represented in this work. These
included whether single‐handed practices were common (e.g. representing at least a quarter of all
practices), whether there had been public campaigns related to antibiotic use, whether patients had
to pay to see a general practitioner, whether clinicians were required to certify sickness for less than
seven days of absence from work, whether amoxicillin was the first‐line choice of antibiotic for a
respiratory infection in primary care, and the country‐level antibiotic prescribing rate. The prescribing
rate was obtained from the European Surveillance of Antimicrobial Consumption Network (ESAC)
antimicrobial consumption interactive database (ESAC‐Net. Available from:
http://ecdc.europa.eu/en/healthtopics/antimicrobial_resistance/esac‐net‐
database/Pages/overview‐country‐consumption.aspx.), defined as the Defined Daily Dose (DDD) per
1000 inhabitants per day, averaged across the years 2007 to 2010.
Finally, the study in which the patient participated was evaluated as a potential determinant in all
analyses.
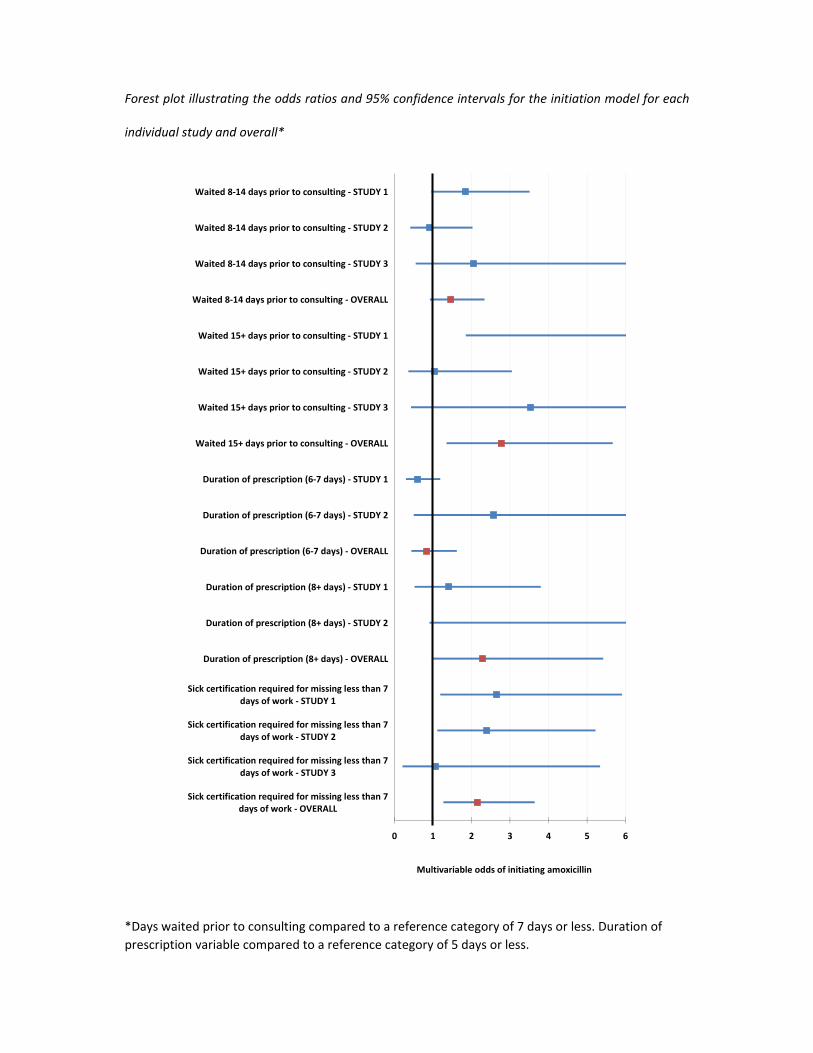
Forest plot illustrating the odds ratios and 95% confidence intervals for the initiation model for each
individual study and overall*
*Days waited prior to consulting compared to a reference category of 7 days or less. Duration of
prescription variable compared to a reference category of 5 days or less.
0 1 2 3 4 5 6
Sick certification required for missing less than 7days of work ‐ OVERALL
Sick certification required for missing less than 7days of work ‐ STUDY 3
Sick certification required for missing less than 7days of work ‐ STUDY 2
Sick certification required for missing less than 7days of work ‐ STUDY 1
Duration of prescription (8+ days) ‐ OVERALL
Duration of prescription (8+ days) ‐ STUDY 2
Duration of prescription (8+ days) ‐ STUDY 1
Duration of prescription (6‐7 days) ‐ OVERALL
Duration of prescription (6‐7 days) ‐ STUDY 2
Duration of prescription (6‐7 days) ‐ STUDY 1
Waited 15+ days prior to consulting ‐ OVERALL
Waited 15+ days prior to consulting ‐ STUDY 3
Waited 15+ days prior to consulting ‐ STUDY 2
Waited 15+ days prior to consulting ‐ STUDY 1
Waited 8‐14 days prior to consulting ‐ OVERALL
Waited 8‐14 days prior to consulting ‐ STUDY 3
Waited 8‐14 days prior to consulting ‐ STUDY 2
Waited 8‐14 days prior to consulting ‐ STUDY 1
Multivariable odds of initiating amoxicillin
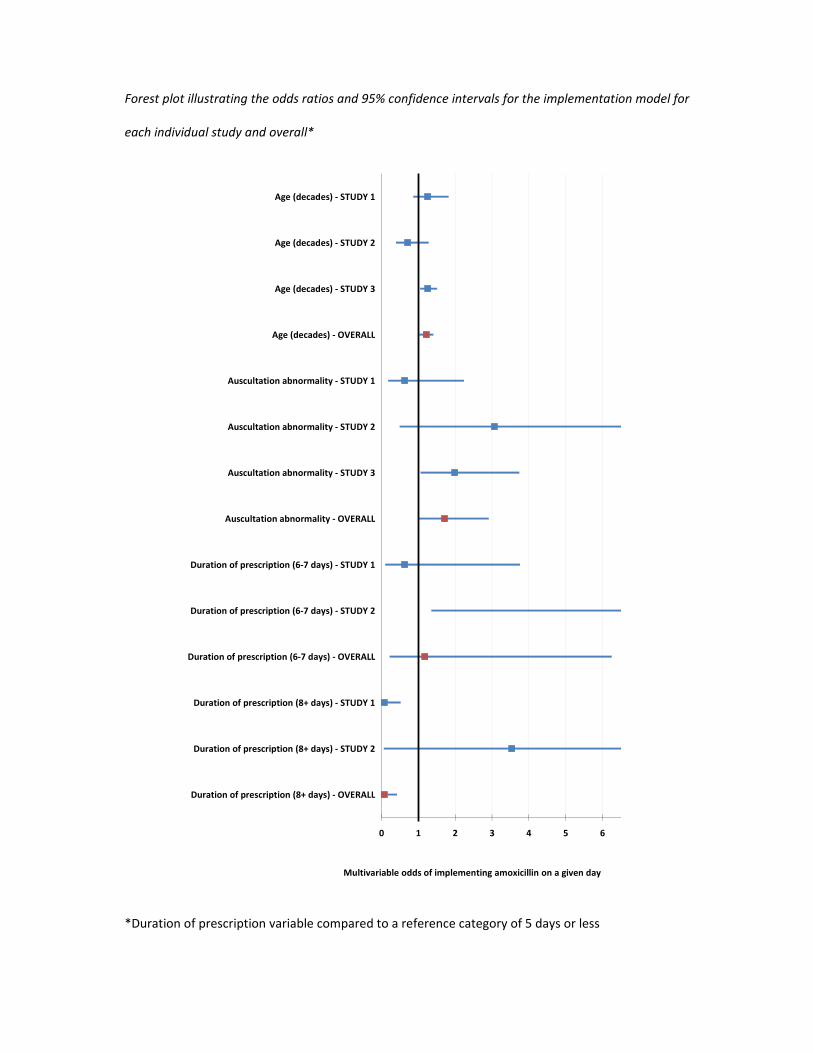
Forest plot illustrating the odds ratios and 95% confidence intervals for the implementation model for
each individual study and overall*
*Duration of prescription variable compared to a reference category of 5 days or less
0 1 2 3 4 5 6
Duration of prescription (8+ days) ‐ OVERALL
Duration of prescription (8+ days) ‐ STUDY 2
Duration of prescription (8+ days) ‐ STUDY 1
Duration of prescription (6‐7 days) ‐ OVERALL
Duration of prescription (6‐7 days) ‐ STUDY 2
Duration of prescription (6‐7 days) ‐ STUDY 1
Auscultation abnormality ‐ OVERALL
Auscultation abnormality ‐ STUDY 3
Auscultation abnormality ‐ STUDY 2
Auscultation abnormality ‐ STUDY 1
Age (decades) ‐ OVERALL
Age (decades) ‐ STUDY 3
Age (decades) ‐ STUDY 2
Age (decades) ‐ STUDY 1
Multivariable odds of implementing amoxicillin on a given day
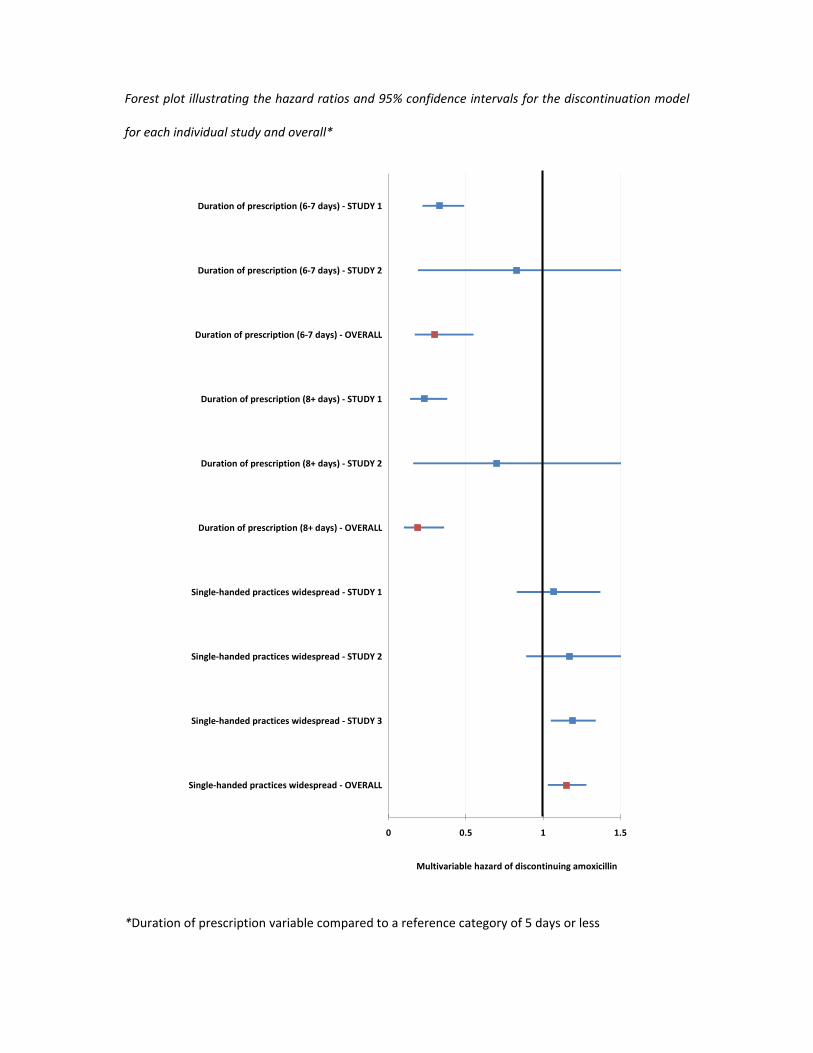
Forest plot illustrating the hazard ratios and 95% confidence intervals for the discontinuation model
for each individual study and overall*
*Duration of prescription variable compared to a reference category of 5 days or less
0 0.5 1 1.5
Single‐handed practices widespread ‐ OVERALL
Single‐handed practices widespread ‐ STUDY 3
Single‐handed practices widespread ‐ STUDY 2
Single‐handed practices widespread ‐ STUDY 1
Duration of prescription (8+ days) ‐ OVERALL
Duration of prescription (8+ days) ‐ STUDY 2
Duration of prescription (8+ days) ‐ STUDY 1
Duration of prescription (6‐7 days) ‐ OVERALL
Duration of prescription (6‐7 days) ‐ STUDY 2
Duration of prescription (6‐7 days) ‐ STUDY 1
Multivariable hazard of discontinuing amoxicillin
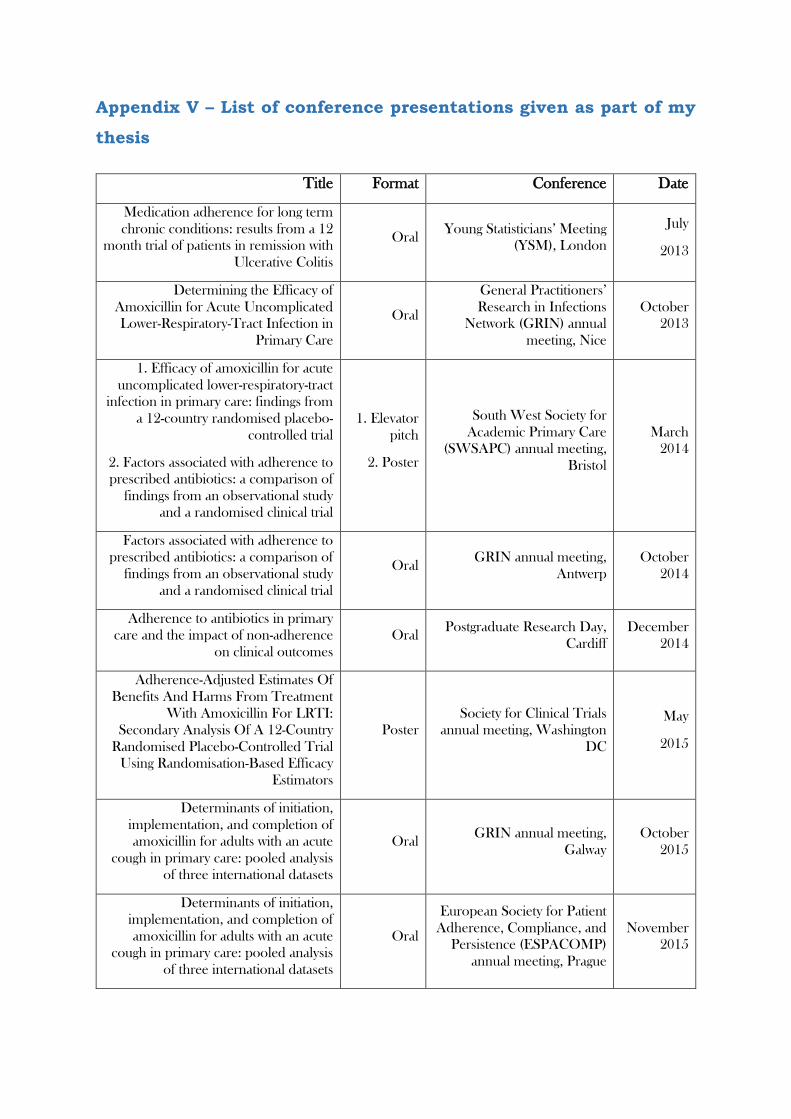
Appendix V – List of conference presentations given as part of my
thesis
Title Format Conference Date
Medication adherence for long term
chronic conditions: results from a 12
month trial of patients in remission with
Ulcerative Colitis
Oral Young Statisticians’ Meeting
(YSM), London
July
2013
Determining the Efficacy of
Amoxicillin for Acute Uncomplicated
Lower-Respiratory-Tract Infection in
Primary Care
Oral
General Practitioners’
Research in Infections
Network (GRIN) annual
meeting, Nice
October
2013
1. Efficacy of amoxicillin for acute
uncomplicated lower-respiratory-tract
infection in primary care: findings from
a 12-country randomised placebo-
controlled trial
2. Factors associated with adherence to
prescribed antibiotics: a comparison of
findings from an observational study
and a randomised clinical trial
1. Elevator
pitch
2. Poster
South West Society for
Academic Primary Care
(SWSAPC) annual meeting,
Bristol
March
2014
Factors associated with adherence to
prescribed antibiotics: a comparison of
findings from an observational study
and a randomised clinical trial
Oral GRIN annual meeting,
Antwerp
October
2014
Adherence to antibiotics in primary
care and the impact of non-adherence
on clinical outcomes
Oral Postgraduate Research Day,
Cardiff
December
2014
Adherence-Adjusted Estimates Of
Benefits And Harms From Treatment
With Amoxicillin For LRTI:
Secondary Analysis Of A 12-Country
Randomised Placebo-Controlled Trial
Using Randomisation-Based Efficacy
Estimators
Poster
Society for Clinical Trials
annual meeting, Washington
DC
May
2015
Determinants of initiation,
implementation, and completion of
amoxicillin for adults with an acute
cough in primary care: pooled analysis
of three international datasets
Oral GRIN annual meeting,
Galway
October
2015
Determinants of initiation,
implementation, and completion of
amoxicillin for adults with an acute
cough in primary care: pooled analysis
of three international datasets
Oral
European Society for Patient
Adherence, Compliance, and
Persistence (ESPACOMP)
annual meeting, Prague
November
2015

The use of randomisation-based
efficacy estimators in non-inferiority
trials
Poster
International Clinical Trials
Methodology Conference bi-
annual meeting, Glasgow
November
2015
Related Documents