Gayle Lee [email protected] Medicare Shared Savings Program: Accountable Care Organization March 9, 2016 Ivy Baer [email protected]

Medicare Shared Savings Program: Accountable … Lee [email protected] Medicare Shared Savings Program: Accountable Care Organization March 9, 2016 Ivy Baer [email protected] © 2015 AAMC.
Jun 30, 2018
Welcome message from author
This document is posted to help you gain knowledge. Please leave a comment to let me know what you think about it! Share it to your friends and learn new things together.
Transcript
Gayle [email protected]
Medicare Shared Savings
Program: Accountable Care
Organization
March 9, 2016Ivy Baer

© 2015 AAMC. May not be reproduced without permission.
Medicare Shared Savings Proposed Rule
Published in Federal Register, February 3, 2016
Comments Due March 28, 2016
Makes Changes to benchmarking rebasing methodology used in the MSSP program.
Modifies method for rebasing and updating ACO historical benchmarks to incorporate regional expenditures when an ACO renews participation agreement for second or subsequent agreement period
CMS seeks to reflect an ACO’s performance against providers in same market (instead of measuring based on its past performance)
© 2015 AAMC. May not be reproduced without permission.
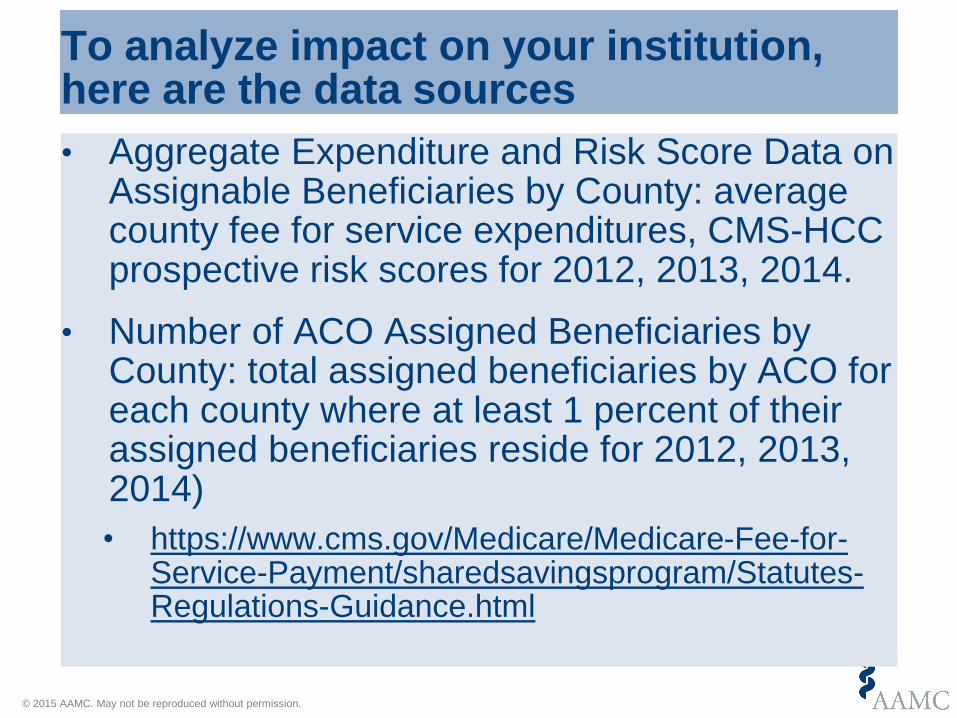
To analyze impact on your institution, here are the data sources
• Aggregate Expenditure and Risk Score Data on Assignable Beneficiaries by County: average county fee for service expenditures, CMS-HCC prospective risk scores for 2012, 2013, 2014.
• Number of ACO Assigned Beneficiaries by County: total assigned beneficiaries by ACO for each county where at least 1 percent of their assigned beneficiaries reside for 2012, 2013, 2014)
• https://www.cms.gov/Medicare/Medicare-Fee-for-Service-Payment/sharedsavingsprogram/Statutes-Regulations-Guidance.html

© 2015 AAMC. May not be reproduced without permission.
Medicare Shared Savings Approach
• ACOs are paid under fee for service
• To receive a shared savings payment must meet quality performance standards and generate shareable savings based on CMS payment methodology
• Savings: (1) actual assigned patient population expenditures are below the established benchmark and (2) the performance year expenditures meet or exceed the minimum savings rate (MSR)

© 2015 AAMC. May not be reproduced without permission.
MSSP ACO Tracks
Track I
Upside only: not accountable for
losses
May share in the savings under
Medicare; after first agreement ends, renew
under Track 2.
-The MSR varies based on the size of the ACO’s
population
.
Track 2
2-sided risk
ACOs: Share in the Savings and Losses. Can share a higher percentage of the
savings than track one.
MSR is 2% of the benchmark.
Track 3
More down-side risk
Beginning 1/1/16, may share 75% of any
shared savings earned in exchange for greater assumption of downside
risk
Prospective assignment of beneficiaries and a waiver of the Skilled
Nursing Facility (“SNF”) three-day qualifying
hospital stay rule
© 2015 AAMC. May not be reproduced without permission.
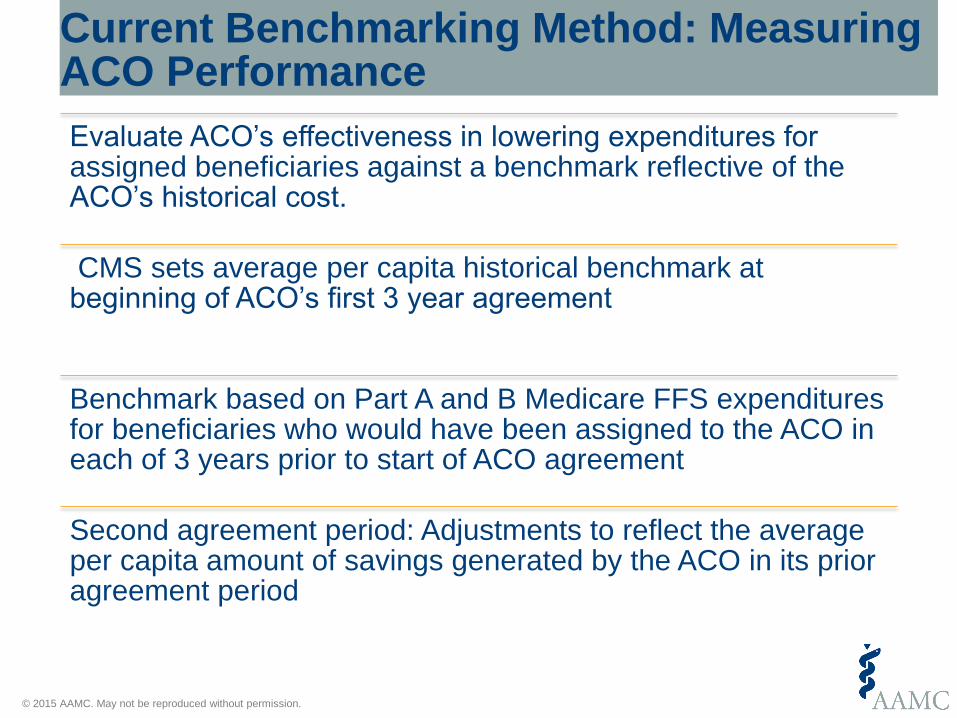
Current Benchmarking Method: Measuring ACO Performance
Evaluate ACO’s effectiveness in lowering expenditures for assigned beneficiaries against a benchmark reflective of the ACO’s historical cost.
CMS sets average per capita historical benchmark at beginning of ACO’s first 3 year agreement
Benchmark based on Part A and B Medicare FFS expenditures for beneficiaries who would have been assigned to the ACO in each of 3 years prior to start of ACO agreement
Second agreement period: Adjustments to reflect the average per capita amount of savings generated by the ACO in its prior agreement period
© 2015 AAMC. May not be reproduced without permission.
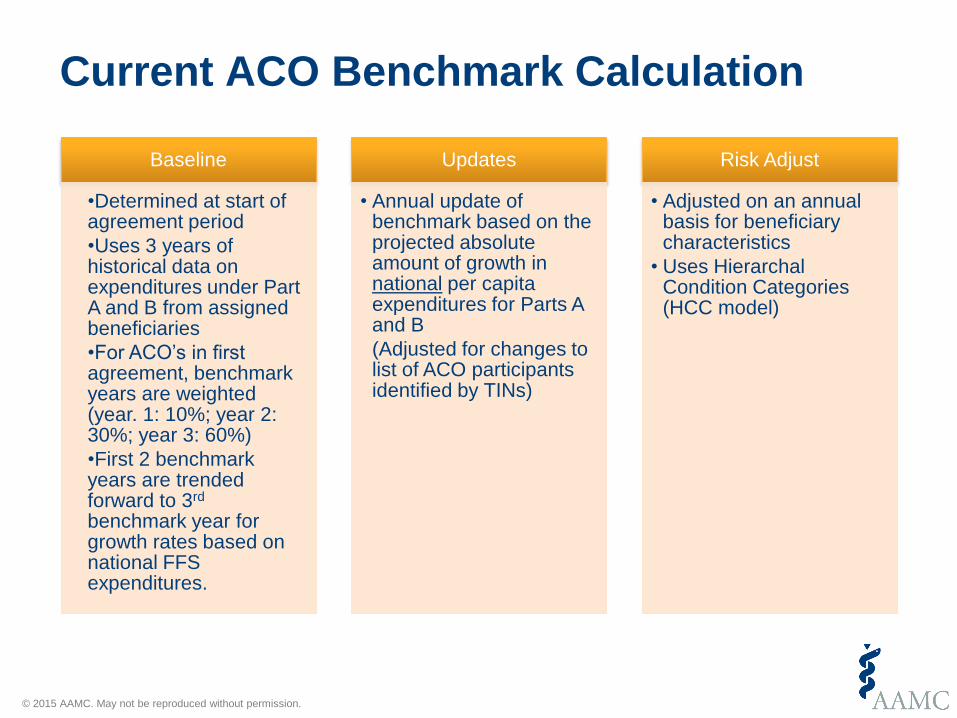
Current ACO Benchmark Calculation
Baseline
•Determined at start of agreement period
•Uses 3 years of historical data on expenditures under Part A and B from assigned beneficiaries
•For ACO’s in first agreement, benchmark years are weighted (year. 1: 10%; year 2: 30%; year 3: 60%)
•First 2 benchmark years are trended forward to 3rd
benchmark year for growth rates based on national FFS expenditures.
Updates
• Annual update of benchmark based on the projected absolute amount of growth in national per capita expenditures for Parts A and B
(Adjusted for changes to list of ACO participants identified by TINs)
Risk Adjust
• Adjusted on an annual basis for beneficiary characteristics
• Uses Hierarchal Condition Categories (HCC model)
© 2015 AAMC. May not be reproduced without permission.
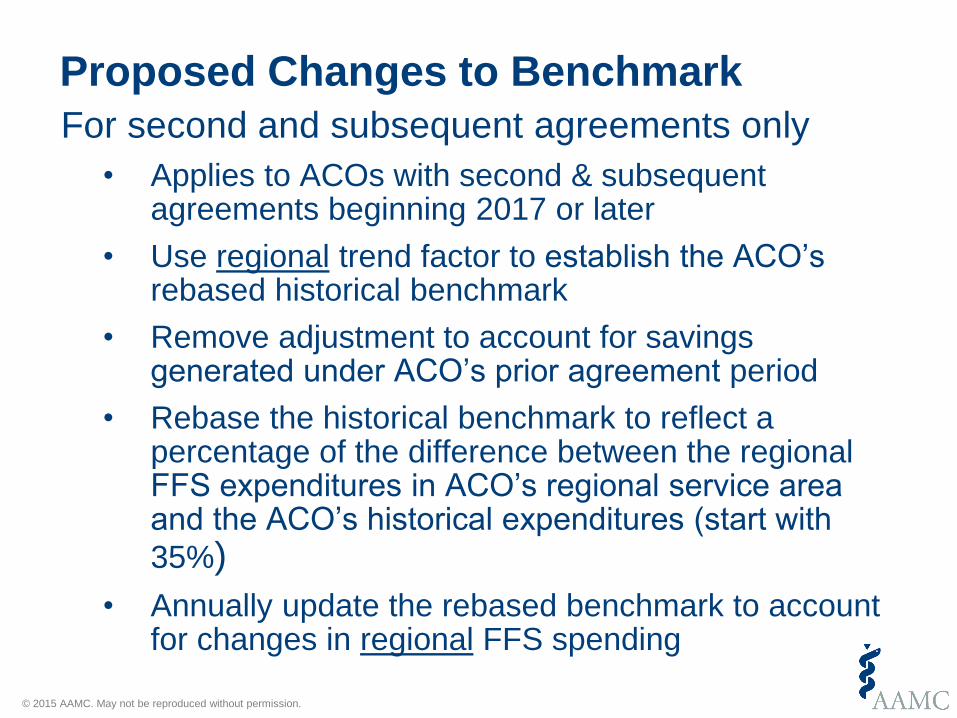
Proposed Changes to Benchmark
For second and subsequent agreements only
• Applies to ACOs with second & subsequent agreements beginning 2017 or later
• Use regional trend factor to establish the ACO’s rebased historical benchmark
• Remove adjustment to account for savings generated under ACO’s prior agreement period
• Rebase the historical benchmark to reflect a percentage of the difference between the regional FFS expenditures in ACO’s regional service area and the ACO’s historical expenditures (start with
35%)
• Annually update the rebased benchmark to account for changes in regional FFS spending
© 2015 AAMC. May not be reproduced without permission.
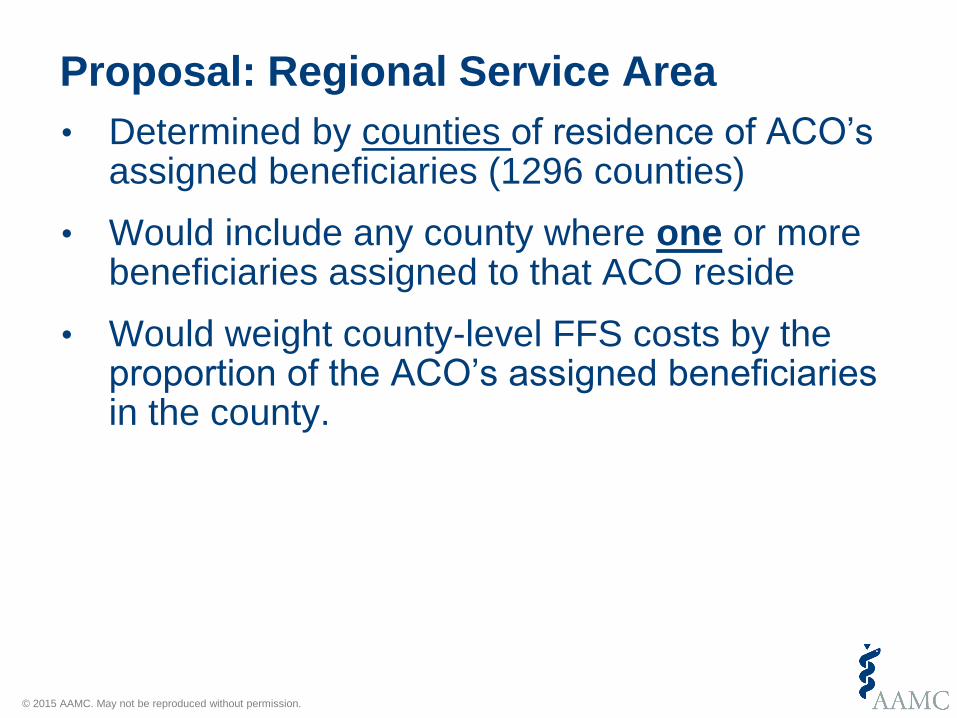
• Determined by counties of residence of ACO’s assigned beneficiaries (1296 counties)
• Would include any county where one or more beneficiaries assigned to that ACO reside
• Would weight county-level FFS costs by the proportion of the ACO’s assigned beneficiaries in the county.
Proposal: Regional Service Area
© 2015 AAMC. May not be reproduced without permission.
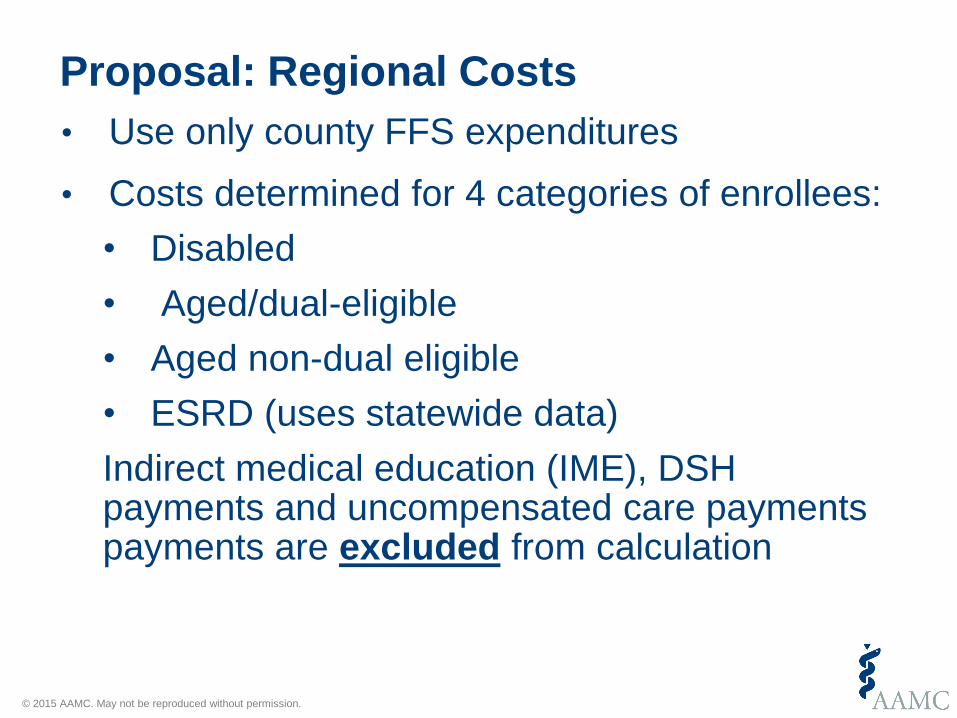
Proposal: Regional Costs
• Use only county FFS expenditures
• Costs determined for 4 categories of enrollees:
• Disabled
• Aged/dual-eligible
• Aged non-dual eligible
• ESRD (uses statewide data)
Indirect medical education (IME), DSH payments and uncompensated care payments payments are excluded from calculation

© 2015 AAMC. May not be reproduced without permission.
Beneficiary Population Used to Determine Regional Expenditures
• Use all “assignable beneficiaries,” including ACO- assigned beneficiaries in determining expenditures for the ACO’s regional service area
• “Assignable Beneficiaries”: received at least 1 primary care visit from any physician who is a Medicare enrolled primary care physician or a physician with primary specialty designation for purposes of ACO assignment in the ACO shared savings program during the 12-month assignment window.
© 2015 AAMC. May not be reproduced without permission.
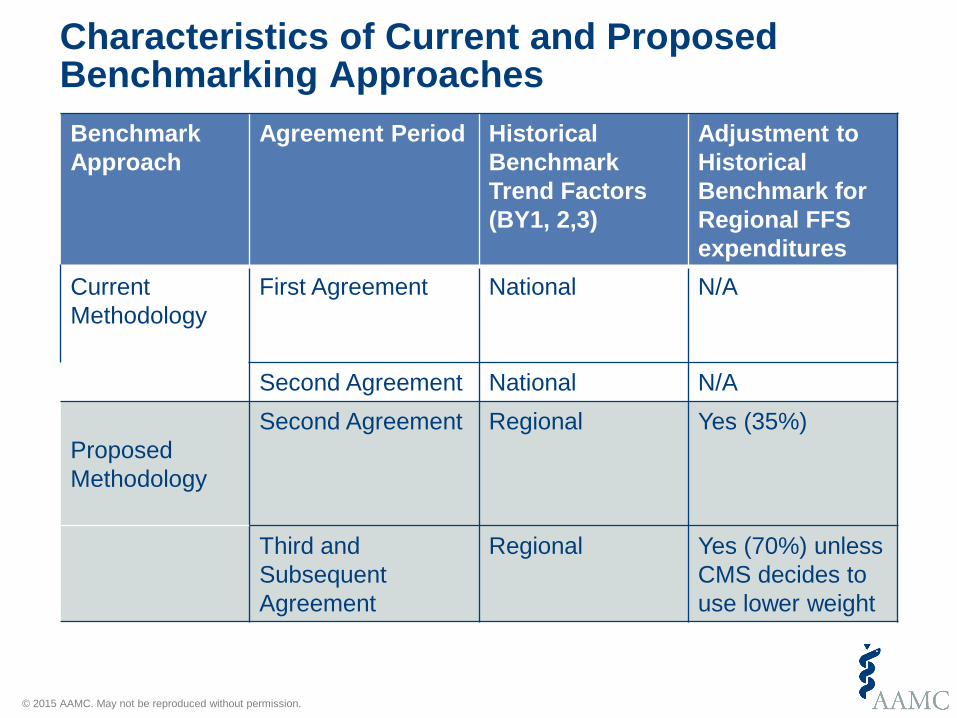
Characteristics of Current and Proposed Benchmarking Approaches
Benchmark
Approach
Agreement Period Historical
Benchmark
Trend Factors
(BY1, 2,3)
Adjustment to
Historical
Benchmark for
Regional FFS
expenditures
Current
Methodology
First Agreement National N/A
Second Agreement National N/A
Proposed
Methodology
Second Agreement Regional Yes (35%)
Third and
Subsequent
Agreement
Regional Yes (70%) unless
CMS decides to
use lower weight
© 2015 AAMC. May not be reproduced without permission.
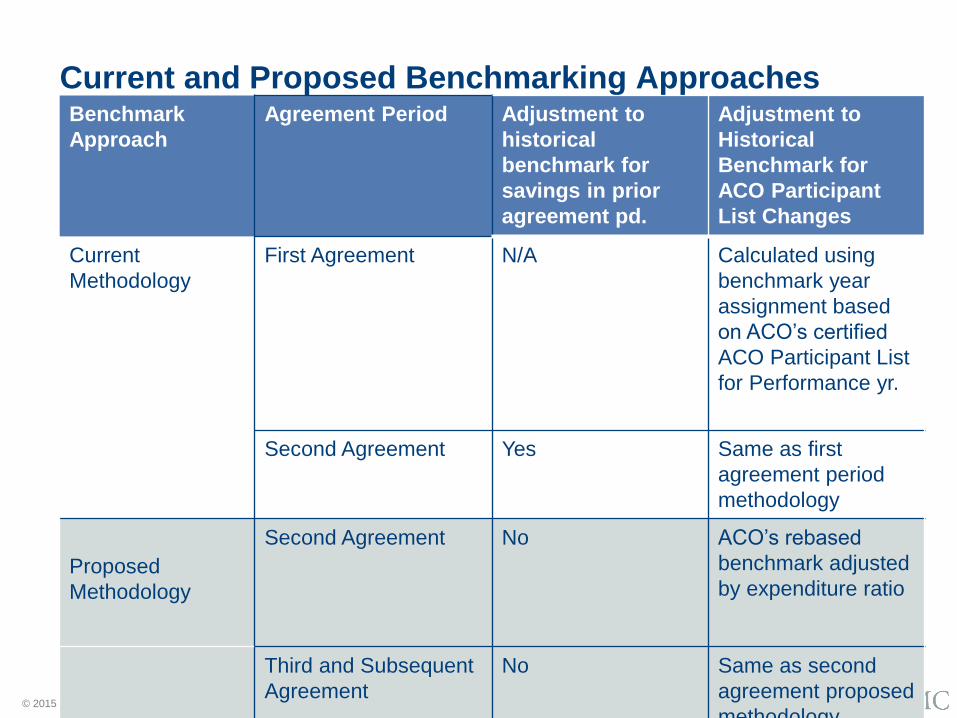
Current and Proposed Benchmarking ApproachesBenchmark
Approach
Agreement Period Adjustment to
historical
benchmark for
savings in prior
agreement pd.
Adjustment to
Historical
Benchmark for
ACO Participant
List Changes
Current
Methodology
First Agreement N/A Calculated using
benchmark year
assignment based
on ACO’s certified
ACO Participant List
for Performance yr.
Second Agreement Yes Same as first
agreement period
methodology
Proposed
Methodology
Second Agreement No ACO’s rebased
benchmark adjusted
by expenditure ratio
Third and Subsequent
Agreement
No Same as second
agreement proposed
methodology
© 2015 AAMC. May not be reproduced without permission.
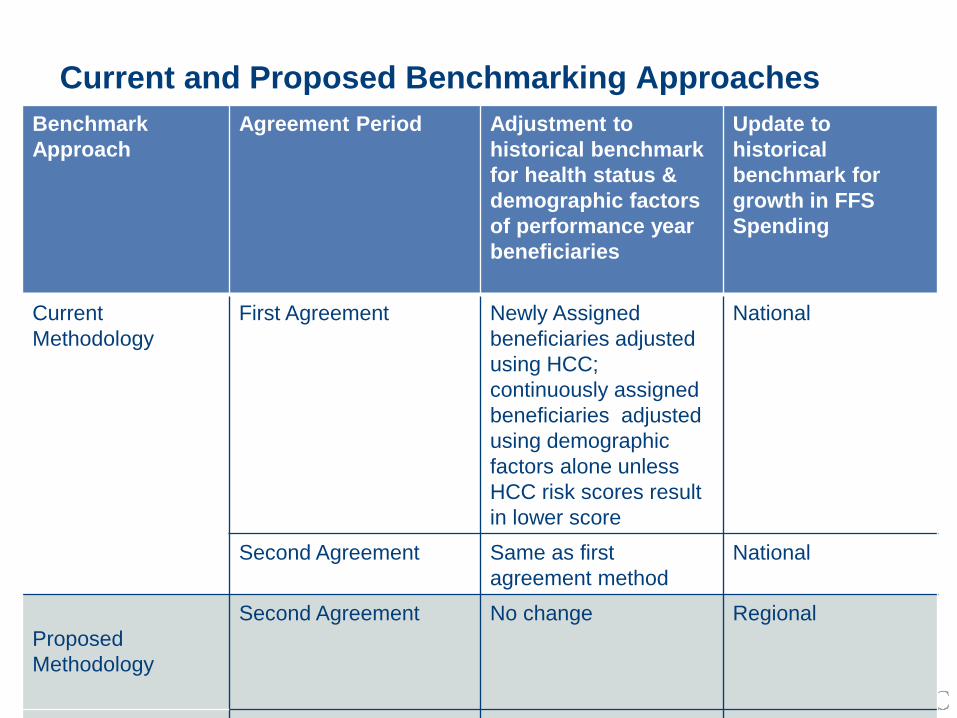
Current and Proposed Benchmarking Approaches
Benchmark
Approach
Agreement Period Adjustment to
historical benchmark
for health status &
demographic factors
of performance year
beneficiaries
Update to
historical
benchmark for
growth in FFS
Spending
Current
Methodology
First Agreement Newly Assigned
beneficiaries adjusted
using HCC;
continuously assigned
beneficiaries adjusted
using demographic
factors alone unless
HCC risk scores result
in lower score
National
Second Agreement Same as first
agreement method
National
Proposed
Methodology
Second Agreement No change Regional
Third and Subsequent No change Regional

© 2015 AAMC. May not be reproduced without permission.
Benchmark Calculation: Step 1
Use new participant TINs, equally weight 3 prior base years, trend baseline using average of risk adjusted FFS for ACO counties, Savings from
prior years are not added back
For each of 4 categories of beneficiaries: calculate average rebased historical benchmark
© 2015 AAMC. May not be reproduced without permission.
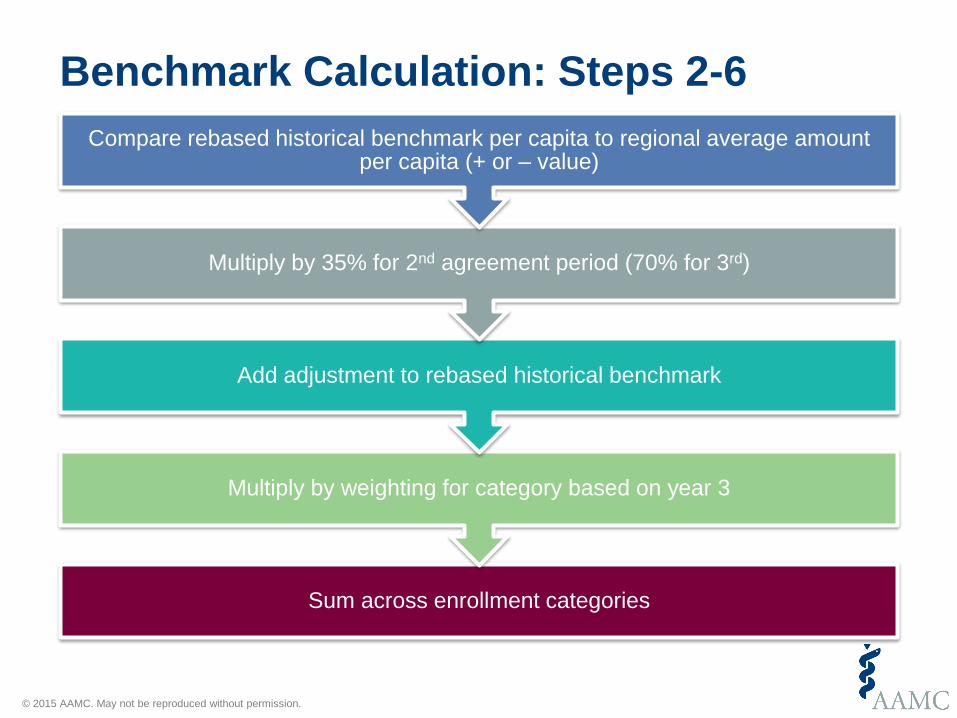
Benchmark Calculation: Steps 2-6
Sum across enrollment categories
Multiply by weighting for category based on year 3
Add adjustment to rebased historical benchmark
Multiply by 35% for 2nd agreement period (70% for 3rd)
Compare rebased historical benchmark per capita to regional average amount per capita (+ or – value)
© 2015 AAMC. May not be reproduced without permission.
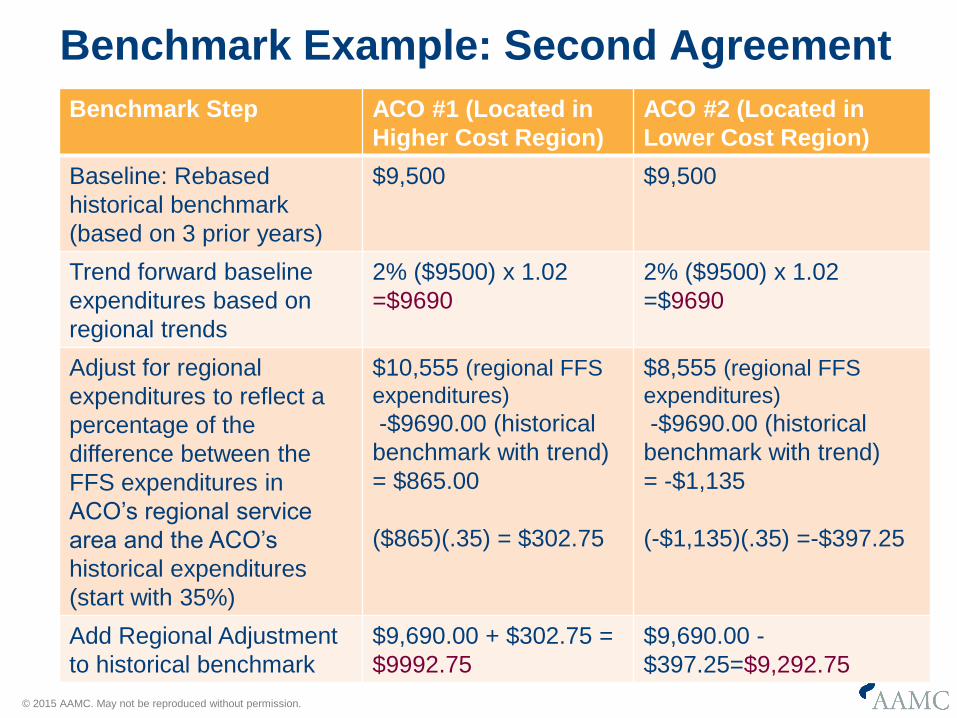
Benchmark Example: Second Agreement
Benchmark Step ACO #1 (Located in
Higher Cost Region)
ACO #2 (Located in
Lower Cost Region)
Baseline: Rebased
historical benchmark
(based on 3 prior years)
$9,500 $9,500
Trend forward baseline
expenditures based on
regional trends
2% ($9500) x 1.02
=$9690
2% ($9500) x 1.02
=$9690
Adjust for regional
expenditures to reflect a
percentage of the
difference between the
FFS expenditures in
ACO’s regional service
area and the ACO’s
historical expenditures
(start with 35%)
$10,555 (regional FFS
expenditures)
-$9690.00 (historical
benchmark with trend)
= $865.00
($865)(.35) = $302.75
$8,555 (regional FFS
expenditures)
-$9690.00 (historical
benchmark with trend)
= -$1,135
(-$1,135)(.35) =-$397.25
Add Regional Adjustment
to historical benchmark
$9,690.00 + $302.75 =
$9992.75
$9,690.00 -
$397.25=$9,292.75
© 2015 AAMC. May not be reproduced without permission.
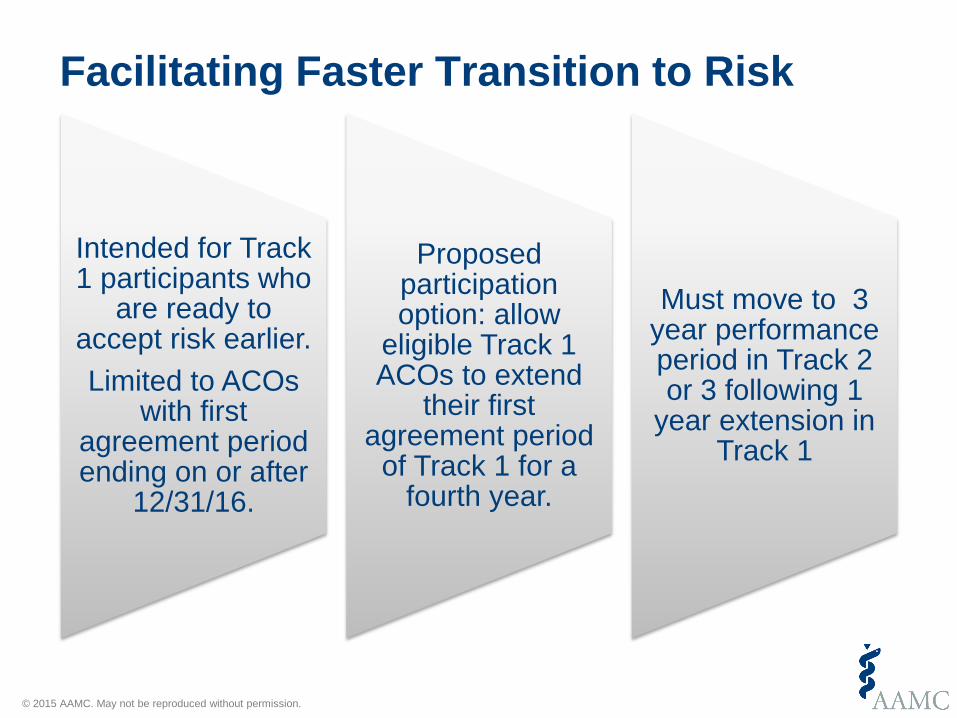
Facilitating Faster Transition to Risk
Intended for Track 1 participants who
are ready to accept risk earlier.
Limited to ACOs with first
agreement period ending on or after
12/31/16.
Proposed participation option: allow
eligible Track 1 ACOs to extend
their first agreement period
of Track 1 for a fourth year.
Must move to 3 year performance period in Track 2 or 3 following 1
year extension in Track 1
© 2015 AAMC. May not be reproduced without permission.
Proposal Reopening Determinations
• If error in calculation of Shared Savings or Losses, CMS may reopen earlier payment determination and revise.
• 4 year period to reopen after date of initial determination
• 3% threshold:
• A CMS technical error that affects total net sharings and losses for all ACOs in performance year of 3 percent or more would trigger reopening.
© 2015 AAMC. May not be reproduced without permission.
Questions:
How would the new benchmark (using regional FFS expenditures and trending) impact your ACO? Would it result in greater savings or losses?
How would including any county in your region with one ACO assigned beneficiary impact you?
Would you prefer your individual ACO assigned beneficiaries be excluded from the regional fee for service expenditure calculation?
How will you be impacted by the CMS proposal to remove the ACOs savings from the rebased benchmark?
© 2015 AAMC. May not be reproduced without permission.
Questions
Do you support a phased in transition to the regional benchmark of 35% in the second agreement and 70% in the third agreement?
If you are considering becoming a new ACO, would you prefer to have your benchmark based on the regional expenditures in your first agreement?
If you are an ACO that just renewed for January 1, 2016 would you like to have the option of transitioning to the regional benchmark method earlier (e.g. 2017)?
© 2015 AAMC. May not be reproduced without permission.
Questions
Would you consider remaining an extra fourth year in Track 1 and then transitioning to Track 2?
How would CMS proposal to reopen earlier payment determinations of shared savings impact you?

Related Documents


