Medicare Hospice Payment Reform: Hospice Study Technical Report HHSM-502005-00018I April 24, 2012 Prepared for: Centers for Medicare and Medicaid Services Center for Medicare Chronic Care Policy Group Anjana Patel, Project Officer Prepared by: Michael Plotzke Brant Morefield T.J. Christian Alyssa Pozniak Jeremy Luallen Michael Rezaee Elizabeth Axelrod Allison Muma Abt Associates Inc. 55 Wheeler St Cambridge, MA 02138 In Partnership with: Pedro Gozalo Joan Teno Brown University Center for Gerontology and Healthcare Research

Welcome message from author
This document is posted to help you gain knowledge. Please leave a comment to let me know what you think about it! Share it to your friends and learn new things together.
Transcript

Medicare Hospice
Payment Reform:
Hospice Study
Technical Report
HHSM-502005-00018I
April 24, 2012
Prepared for:
Centers for Medicare and
Medicaid Services
Center for Medicare
Chronic Care Policy Group
Anjana Patel, Project Officer
Prepared by:
Michael Plotzke
Brant Morefield
T.J. Christian
Alyssa Pozniak
Jeremy Luallen
Michael Rezaee
Elizabeth Axelrod
Allison Muma
Abt Associates Inc.
55 Wheeler St
Cambridge, MA 02138
In Partnership with:
Pedro Gozalo
Joan Teno
Brown University Center for
Gerontology and Healthcare
Research


Medicare Hospice Payment Reform: Hospice Study Technical Report HHSM-500-2005-00018I
Abt Associates Inc. Contents ▌pg. i
Table of Contents
1. Introduction .................................................................................................................................... 1
2. Construction of Data Files for the Analysis ................................................................................. 3 2.1 Specific Analytic Files Created ......................................................................................... 3
2.1.1 Hospice Claims File (Created from the Hospice SAF) ........................................ 3
2.1.2 Day Level Hospice Analytic File (Created from the Hospice SAF) ................... 4
2.2 Data Sources Used ............................................................................................................. 4
2.2.1 Hospice SAF ........................................................................................................ 5
2.2.2 Enrollment Database (EDB) ................................................................................ 5
2.2.3 Hospice Provider of Services (POS) File ............................................................ 6
2.2.4 Hospice Cost Reports .......................................................................................... 6
2.3 Construction of the Hospice Analytic Files ....................................................................... 6
2.3.1 Hospice Beneficiary Exclusions .......................................................................... 6
2.4 Analysis of Hospice Analytic Files ................................................................................... 7
2.4.1 Background Information Regarding Hospice Utilization by Medicare
Beneficiaries in 2011 ........................................................................................... 7
2.4.2 The Average Resource Curve for Routine Home Care Days in 2011 ................. 8
3. Geographic Variation in Hospice Utilization and Payment ..................................................... 11 3.1 Background and Methods ................................................................................................ 11
3.2 Results ............................................................................................................................. 11
4. Analysis of Trends in General Inpatient Care Utilization ....................................................... 15 4.1 Background ...................................................................................................................... 15
4.2 GIP Utilization ................................................................................................................. 15
4.2.1 Length of GIP stay ............................................................................................. 15
4.2.2 Site of Service of GIP Stay ................................................................................ 17
4.2.3 Transitions to and from a GIP Stay ................................................................... 17
4.2.4 Timing of a GIP Stay Within the Hospice Episode ........................................... 18
4.3 Provider Characteristics ................................................................................................... 18
4.3.1 Provider Age ...................................................................................................... 19
4.3.2 Provider Size ...................................................................................................... 19
4.3.3 Provider Region ................................................................................................. 20
4.4 Conclusion ....................................................................................................................... 20
5. Hospice Cost Reports—Benchmarks and Trends (2004–2011) ............................................... 23 5.1 Introduction ..................................................................................................................... 23 5.2 Inpatient Care .................................................................................................................. 24
5.3 Visiting Services (Labor)................................................................................................. 26
5.4 Other Hospice Services ................................................................................................... 28
6. Analysis of Face-to-Face Physician Visit Requirement ............................................................ 33 6.1 Methodology .................................................................................................................... 33
7. Trends in Live Discharge ............................................................................................................ 41

HHSM-500-2005-00018I Medicare Hospice Payment Reform: Hospice Study Technical Report
pg. ii ▌Contents Abt Associates Inc.
8. Part D Utilization While Enrolled in Hospice ........................................................................... 43 8.1 Background ..................................................................................................................... 43
8.2 Methods ........................................................................................................................... 44
8.3 Results ............................................................................................................................. 45
9. Reform Options ........................................................................................................................... 47 9.1 Simulation of a Hypothetical Tiered Model for the Hospice Benefit ............................. 47
9.1.1 Methodology for a Hypothetical Tiered Model ................................................ 47
9.1.2 Results ............................................................................................................... 48
9.1.3 Conclusion ........................................................................................................ 52
9.2 Rebasing the Routine Home Care Rate for Hospice ....................................................... 52
9.2.1 Introduction ....................................................................................................... 52
9.2.2 How the Routine Home Care Base Payment was Originally Set ...................... 52
9.2.3 A Potential Method for Rebasing the Clinical Service Component of the
Routine Home Care Rate .................................................................................. 54
9.2.4 Conclusion ........................................................................................................ 58
Appendix A: Descriptive Statistics on Hospice Utilization for 2011 ............................................. 59
Appendix B: Average Resource Use for Routine Home Care Days in 2011 ................................. 69
References ........................................................................................................................................... 71

Medicare Hospice Payment Reform: Hospice Study Technical Report HHSM-500-2005-00018I
Abt Associates Inc. 1. Introduction ▌pg. 1
1. Introduction
Section 3132(a) of The Patient Protection and Affordable Care Act of 2010 (ACA) requires the
Secretary of Health and Human Services (HHS) to revise Medicare’s payment system for hospice
care. This legislation comes as a response to (1) significant changes in hospice utilization since the
hospice benefit was established in 1983, and (2) recommendations by the Medicare Payment
Advisory Commission (MedPAC) and others, for updating the hospice payment system. These
updates, as required by the ACA include revising the Routine Home Care rate and the corresponding
methodology, as well as the rates for other hospice services as deemed appropriate by the Centers for
Medicare and Medicaid Services (CMS). Additionally, it allows for the Secretary to collect
―…additional data and information as the Secretary determines appropriate to revise payments for
hospice care.‖ These additional data collection efforts may include data on:
Hospice-related charges, payments, costs, number of days, and number of visits
attributable to each type of service;
Type of practitioner providing the hospice visit;
Length of visit and other information related to visit;
Number of hospice days attributable to Medicare beneficiaries enrolled under Part A;
and/or
Charitable contributions and other revenues for hospice providers.
From data such as these (which, as required by the legislation, the Secretary should begin collecting
no later than January 1, 2011), HHS is required to implement revisions to the hospice payment
methodology no earlier than October 1, 2013. The ACA mandates that the revisions to Medicare’s
hospice payment system ―…shall result in the same estimated amount of aggregate expenditures
under this title for hospice care furnished in the fiscal year in which such revisions in payment are
implemented as would have been made under this title for such care in such fiscal year if such
revisions had not been implemented.‖ That is, revisions need to be budget neutral for the first year.1
CMS contracted with Abt Associates Inc., teaming with Social and Scientific Systems, Inc. and the
Brown University Center for Gerontology and Healthcare Research, to conduct comprehensive data
analyses. This report will share some initial results of that data analysis, as described below.
Section 2 describes the construction of the analytic files used for this project.
Section 3 provides heat maps which highlight geographic variations in per-beneficiary
hospice utilization rate and payment amounts across markets.
Section 4 presents an analysis of General Inpatient Care (GIP) utilization among hospice
beneficiaries and the characteristics of hospice providers who provide GIP services
compared to those who do not provide any GIP services.
Section 5 presents the findings of an analysis of FY 2004–2011 Medicare hospice cost
reports which examined the sources of costs for hospice providers.
1 The law does not provide HHS with the authority to change the eligibility and coverage requirements under the hospice
benefit. We also note that the ACA makes additional changes to the hospice program that are unrelated to its payment
program (e.g., 3132(b), 3140, and 10326).

HHSM-500-2005-00018I Medicare Hospice Payment Reform: Hospice Study Technical Report
pg. 2 ▌1. Introduction Abt Associates Inc.
Section 6 presents an analysis of the impact of the ―face-to-face‖ encounter requirement
for recertification based on the number of benefit periods a Medicare beneficiary uses.
Section 7 examines trends in hospice live discharges during 2010.
Section 8 examines Part D billing of analgesic medications while a beneficiary is enrolled
in hospice.
Section 9 describes one potential payment reform option—a tiered model for Routine
Home Care—and describes potential impacts of implementing such an option.
Section 9 also describes one approach to rebasing the Routine Home Care base payment
rate.

Medicare Hospice Payment Reform: Hospice Study Technical Report HHSM-500-2005-00018I
Abt Associates Inc. 2. Construction of Data Files for the Analysis ▌pg. 3
2. Construction of Data Files for the Analysis
This section provides an overview of the data files used for the analyses presented in this report.
We constructed multiple data files to support our analyses. They included data on two mutually-
exclusive groups of individuals:
1. One set of files contains data on all Medicare beneficiaries who used at least 1 day of hospice
services (based on claims) between 2005 and 2011 (n = 5,974,234) [These are referred to as
the Hospice Beneficiary files].
2. Another set of files contains data on all Medicare beneficiaries who died in 2010 (n =
1,142,296) and 2011 (n = 1,118,612) and never utilized hospice (based on claims) while on
Medicare [These are referred to as the non-Hospice Decedents files].
The first set of files (on Hospice Beneficiaries) is comprised of two files: The Hospice Claims files
and the Hospice Day file. These files were used in the majority of analyses discussed in this report
including the examination of geographic variation in hospice utilization and payment (Section 3),
analysis of trends in GIP utilization (Section 4), analysis of the face-to-face visit requirement (Section
6), trends in live discharge (Section 7), trends in Part D utilization while enrolled in hospice, analyses
in the reform options section (Section 9), descriptive statistics on hospice utilization for 2011
(Appendix A), and average resource use for routine home care days in 2011 (Appendix B). The
second set of files was used to help us better understand key differences in utilization of healthcare
services between decedents using hospice and those not using hospice. These results are not included
in this report. We also created provider level files that include information on provider
characteristics (Provider of Services file) and the Medicare Hospice Cost Reports (Cost Reports file).
These files were used in a variety of analyses, including the analysis of benchmarks and trends in
hospice cost reports (Section 5).
2.1 Specific Analytic Files Created
For Hospice Beneficiaries, we created two types of files: The Hospice Claims File and the Hospice
Day File.
2.1.1 Hospice Claims File (Created from the Hospice SAF)
Social & Scientific Systems, Inc. (SSS) has created a hospice claim-level analytic file using
information from the Hospice Standard Analytic File (SAF). The unit of observation in this file is a
specific hospice claim for a particular beneficiary. This file contains claim-level information, that is,
variables that do not change over the course of the claim. Examples of these variables include:
Provider number
Diagnoses codes
Payment amount
Claim from and through dates
Dates identifying the start and end of a hospice benefit period.

HHSM-500-2005-00018I Medicare Hospice Payment Reform: Hospice Study Technical Report
pg. 4 ▌2. Construction of Data Files for the Analysis Abt Associates Inc.
2.1.2 Day Level Hospice Analytic File (Created from the Hospice SAF)
SSS also created a day-level hospice analytic file using information from the Hospice SAF. The unit
of observation in this file is an individual day of hospice services for a particular beneficiary at a
specific provider. The file is meant to describe the level of services (in terms of the number and
length of visits and minutes) on a particular day of hospice enrollment. Examples of these variables
include:
Number of visits by discipline
Number of minutes of care by discipline
Level of care for a particular day of hospice
Site of service for a particular day of hospice
Daily payment amounts
Abt Associates has added information from the Enrollment Database (EDB) to this file, such as
demographic data, and hospice enrollment period information for time periods prior to the earliest
SAF file we acquired.
2.2 Data Sources Used
To analyze trends in Medicare hospice utilization, we have acquired several administrative data files
from CMS in addition to the Hospice SAF. They are:
Hospice Provider of Services (POS) File
Medicare Enrollment Database (EDB)
Hospice Cost Reports
Inpatient SAF
Skilled Nursing Facility (SNF) SAF
Outpatient SAF
Home Health Agency SAF
Part B Claims (e.g. Carrier SAF)
Durable Medical Equipment (DME) SAF
Part D Drug Claims
Table 1 shows the years for which each type of data have been obtained and incorporated into an
analytic file:

Medicare Hospice Payment Reform: Hospice Study Technical Report HHSM-500-2005-00018I
Abt Associates Inc. 2. Construction of Data Files for the Analysis ▌pg. 5
Table 1: Years of Data Currently Acquired and Incorporated into an Analytic File
Dataset 2004 2005 2006 2007 2008 2009 2010 2011
Hospice (SAF)
Hospice POS
Enrollment Database
(EDB)
Hospice Cost Reports
Inpatient SAF
SNF SAF
Outpatient SAF
HHA SAF
Part B Claims
DME SAF
Part D Drug Claims
2.2.1 Hospice SAF
We use information from the Hospice SAF. SSS has used the Hospice SAF to create both the ―Day-
level‖ file and ―Claim-level‖ file described above. Both files currently include claims with ―Through
Dates‖ between January 2005 and December 2011. The 2011 Hospice SAF data represented the June
2012 final SAF. Table 2 provides details regarding the number of beneficiaries, providers, and
hospice days represented in each year of data.
Table 2: Number of Beneficiaries, Providers, and Days of Hospice as Found in the Hospice
SAF
Calendar year
Number of unique
beneficiary IDs
Number of unique
provider numbers
Number of hospice
days2
2005 870,424 2,878 57,023,165
2006 934,323 3,044 64,170,179
2007 996,641 3,248 70,136,822
2008 1,051,498 3,329 73,587,195
2009 1,090,840 3,385 77,014,398
2010 1,160,235 3,497 81,292,368
2011 1,220,682 3,585 85,049,995
2.2.2 Enrollment Database (EDB)
We use information from the Medicare Enrollment Database (EDB) for both the Hospice Day-Level
file and the Non-Hospice Decedent file.
These items include:
Birth and death date
Sex and race
Indicators for Part A, B, D, Medicaid, and Medicare Advantage Coverage
Indicator for hospice election period
2 This counts hospice days billed at any level of care. Days are considered CHC if the CHC rate was billed
on a particular day.

HHSM-500-2005-00018I Medicare Hospice Payment Reform: Hospice Study Technical Report
pg. 6 ▌2. Construction of Data Files for the Analysis Abt Associates Inc.
2.2.3 Hospice Provider of Services (POS) File
The provider of services (POS) files contain quarterly updates of information on the hospice itself.
Examples of variables found in this file include:
Location (city, state, county)
Age of provider
Provider number
Staffing information (as of most recent survey)3
Facility type (freestanding or facility-based)
Ownership type
We currently have the POS extracts that correspond to the following dates:
POS as of January 1, 2008
POS as of January 1, 2009
POS as of January 1, 2010
POS as of January 1, 2011
POS as of April 1, 2011
2.2.4 Hospice Cost Reports
We have collected hospice Medicare costs reports for fiscal years 2004–2011. We use this
information to study hospice costs by cost center. More information about how cost reports are
trimmed and how they are used for analysis can be found in Section 5 of this report.
2.3 Construction of the Hospice Analytic Files
This section provides some additional detail describing the data, data elements, and exclusions used
in the creation of the analytic file(s).
2.3.1 Hospice Beneficiary Exclusions
A number of beneficiaries were excluded from the Hospice SAF data due to missing or unusual data
that would make the creation of the ―day-level‖ file excessively complicated. These exclusions are
made by looking at all years of the Hospice SAF combined (e.g., 2005–2011) and dropping a small
number of beneficiaries (roughly 0.23% of the sample). Prior to the exclusions, there were 5,988,057
unique beneficiary IDs included in the file. Due to the exclusions listed below, 13,823 beneficiaries
were dropped, leaving 5,974,234 beneficiaries in the SSS analytic files.4 All claims for a beneficiary
were dropped if any of the following occurred5:
3 Note that hospice providers are not surveyed frequently. Examining the CMS Provider of Services file (as
of March 2011) shows that on average active providers have gone 4 years since their last survey. One
provider had not been surveyed in 26 years.
4 Due to the short length of time many individuals utilize hospice before they die, we did not cross-reference
beneficiary IDs. It is therefore possible that a single person may be represented in either the Hospice SAF
data or any other Medicare claims we use under multiple beneficiary IDs.
5 Note, some beneficiaries appear in multiple exclusions.

Medicare Hospice Payment Reform: Hospice Study Technical Report HHSM-500-2005-00018I
Abt Associates Inc. 2. Construction of Data Files for the Analysis ▌pg. 7
1. A claim for a beneficiary was missing the hospice start date [1,487 beneficiaries].
2. A line item for a beneficiary had revenue units equal to 0 and the revenue center was not
equal to ―0001‖ [924 beneficiaries].
3. A line item for a beneficiary had a missing revenue date and the revenue center was not equal
to ―0001‖ [6,021 beneficiaries].
4. A claim for a beneficiary had a benefit period start date that is later than the ―from‖ date of
the claim [2,287 beneficiaries].
5. Two claims (from the same provider) for a beneficiary covered overlapping time periods
[2,782 beneficiaries].
6. A beneficiary had service days without corresponding hospice period days [74 beneficiaries].
7. Two claims for a beneficiary were duplicates (same from- and through- dates, different
providers) [111 beneficiaries].
8. A claim for a beneficiary had inconsistent or out of order start dates (based on through date)
[375 beneficiaries].
2.4 Analysis of Hospice Analytic Files
We use the analytic files described above to examine several aspects of hospice utilization. Appendix
A in this report provides several basic descriptive statistics on hospice utilization from 2011.
Appendix B in this report provides average resource utilization for routine home care (RHC) days in
2011 based on when the day fell within a beneficiary’s lifetime length of stay in hospice. The other
sections of this report also use the analytic files to produce the results that are described.
2.4.1 Background Information Regarding Hospice Utilization by Medicare Beneficiaries in 2011
Table A.1 in Appendix A provides detailed information about hospice utilization based on episodes
that occurred in 2011. The results include information on 129,253,613 hospices days across
1,312,819 hospice episodes among 1,220,680 unique beneficiaries. Episodes were concentrated
amongst the older population of Medicare beneficiaries. Of the episodes examined, 47.3% were for
beneficiaries who were 85 years or older on the first day of the episode. We found that 31.0% of the
episodes were for beneficiaries who were between (and including) 75 years of age and 84 years of
age. Almost 60% of the hospice episodes were for female beneficiaries. Hospice is predominantly
(87.4% of episodes) used by beneficiaries identifying themselves as White, non-Hispanic. Hospice is
primarily being used for individuals without a primary diagnosis of cancer. Specifically, 71.3% of
the episodes had a non-cancer principal diagnosis listed on the first claim of the episode. We also
found that 12.0% of the episodes had ―adult failure to thrive‖ as the principal diagnosis on the first
claim of the episode. Typically (75.4% of episodes), only 1 diagnosis is listed on each of the claims
that corresponded to the episodes. 43.94% of the episodes occurred at for-profit providers based on
the provider identified during the first day of the episode. In addition, 41.43% of the episodes
occurred in the South census region.

HHSM-500-2005-00018I Medicare Hospice Payment Reform: Hospice Study Technical Report
pg. 8 ▌2. Construction of Data Files for the Analysis Abt Associates Inc.
There was some variation in the length of the episodes with 13.5% of the episodes examined (not
restricted to decedents) lasting between 1–3 days, 13.8% lasting between 4–7 days, and 6.4% lasting
between 8–10 days. We also found that 16.3% of episodes lasted 181 days or longer. Overall,
average length of stay for the episodes examined was 81 days (Figure A.1). There was some
variation in this number by site of service with average length of stay in the patient home being 81
days, average length of stay in the nursing home being 88 days, and average length of stay in an
assisted living facility being 121 days.
As shown in Figure A.2, based on the episodes examined, 83% died in hospice, 8% were alive in
hospice as of December 31, 2011. Four percent were discharged/revoked from hospice and alive after
discharge/revocation. Five percent were discharged/revoked from hospice and died after
discharge/revocation. These figures are mostly consistent across each site of service. However, the
assisted living site of service had a smaller percentage of episodes that died in hospice and a larger
percentage of episodes that were alive and in hospice as of December 31, 2012.
On average, episodes received 72.38 Part A visits (including Physician/NP visits recorded on the
hospice claim as well as discipline visits) as shown in Figure A.3. There was substantial variation
related to the site of service (which will also related to the length of stay mentioned above) with
average visits in the patient home being 56, average visits in the nursing home being 71, and average
visits in the assisted living facility being 93.
Although we do not report the following in Appendix A, we also examined all Medicare hospice
claims that occurred in 2011 and found:
Total Medicare payments on hospice claims equaled $13.8 billion.
There were 3,585 hospice providers that provided at least 1 day of hospice.
2.4.2 The Average Resource Curve for Routine Home Care Days in 2011
Appendix B provides detailed information about average resource utilization for RHC days in 2011.
An episode’s resource use is a description of the wage weighted minutes of care (as reported on the
claim) the hospice provides on a particular day of hospice. Resource use does not measure the actual
costs a hospice incurs on a daily basis, but is used as a proxy for the key labor costs that a hospice
incurs; non-labor costs are not reflected in this analysis. The purpose of this analysis is to describe
relative costs (e.g. such as the beginning and end of a hospice episode are more intensive than the
middle) as opposed to absolute costs. We use data from the Bureau of Labor Statistics to determine a
national hourly wage rate (which include the hourly wage plus an estimate of fringe benefit costs) for
the six disciplines of care whose minutes are reported on the claim. For 2011, the national hourly
wage rate that was used for the six disciplines of care was:
Skilled Nursing: $38.82
Physical Therapy: $54.30
Occupational Therapy: $54.06
Speech Language Pathology: $59.46
Medical Social Service: $36.19
Home Health Aide: $13.89

Medicare Hospice Payment Reform: Hospice Study Technical Report HHSM-500-2005-00018I
Abt Associates Inc. 2. Construction of Data Files for the Analysis ▌pg. 9
Those hourly wage rates are multiplied by the number of hours of service reported on the claim for a
particular day of hospice to compute the resource use that occurred on a particular day of hospice.6
Figure B.1 shows resource utilization is highest at the beginning of a beneficiary’s lifetime length of
stay and the end of the beneficiary’s lifetime length of stay. RHC falling on the first three days of a
beneficiary’s lifetime length of stay in hospice had average resource use of $82.30, $36.52, and
$22.70 respectively. Looking at the last 6 days before a beneficiary died, average resource use starts
out at $25.65 on the 6th day before death and ends up at $56.89 on the day of death. The other days
typically had average resource use ranging between $12 and $16. Average resource utilization
peaked every 7th day after the beneficiary’s first day in hospice.
6 As a data cleaning step, for a given day, minutes reported on the claim were censored at 1,440. That is, it
was imposed that no hospice provided more than 24 hours of care for one specific discipline on a given day
of hospice.


Medicare Hospice Payment Reform: Hospice Study Technical Report HHSM-500-2005-00018I
Abt Associates Inc. 3. Geographic Variation in Hospice Utilization and Payment ▌pg. 11
3. Geographic Variation in Hospice Utilization and Payment
3.1 Background and Methods
In this section of the report we present two ―heat maps‖ which highlight geographic variations in per-
beneficiary hospice utilization rates and payment amounts across markets that are defined using the
CBSA (or rural area) where hospice service occurred. Heat maps are charts in which values are
depicted by the shading intensity within a geographical boundary. They are useful to quickly compare
differences across areas and advantageous over tables by incorporating a spatial arrangement of the
data.
To construct these maps, we used the Hospice Day File to develop an analytic file comprised of all
hospice service days provided in calendar year 2011. We then assigned each hospice day to the
―market‖ in which the service took place. ―Markets‖ fell into two categories:
Urban Markets: Hospice services occurring in urban counties were assigned to the Core Based
Statistical Area (CBSA) of which the county belongs.
Rural Markets: Non-CBSA counties were grouped into state-wide rural markets. Hospice service
days not occurring within an urban county were assigned by state to these rural
markets.
In addition to the total number of hospice service days, our analytic file includes the total number of
beneficiaries receiving hospice services and the total payment amounts made for hospice services
provided.
3.2 Results
We identified 85.2 million days of hospice service provided to Medicare beneficiaries in 2011. There
were 69.4 million days (81%) provided in urban markets and 15.7 million days (18%) provided in
rural markets. We also identified 84,038 days (less than 1%) for which no service location was
provided which we subsequently omitted from our analyses.
We calculated that total hospice payments in 2011 were $13.8 billion. In urban markets total
payments were $11.6 billion (84% of total payments in 2011), and total payments in rural markets
were $2.2 billion (16% of total payments in 2011). Total payments for service days with an
unidentified location amounted to $5 million.
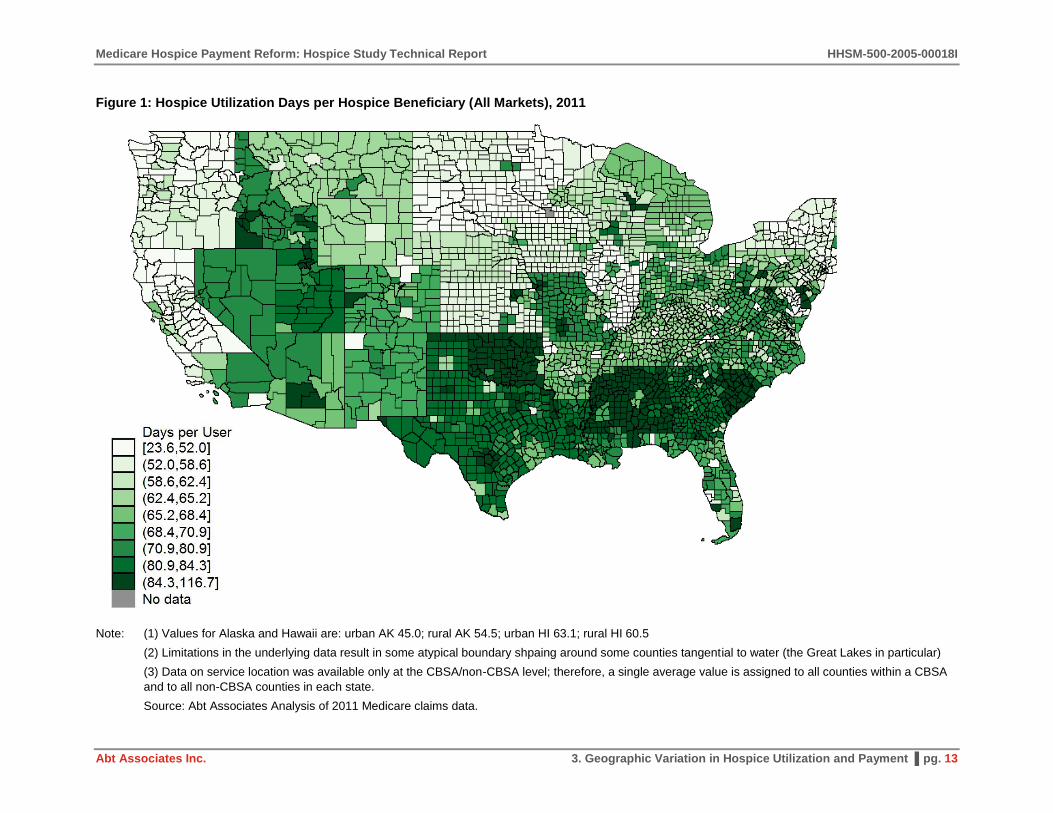
Figure 1 (at the end of this section) presents a map entitled ―Hospice Utilization Days per Hospice
Beneficiary (All Markets), 2011.‖ This heat map displays the average number of Medicare hospice
service days per user in 2011 for markets in the continental 48 states, constructed from the U.S.
Census Bureau’s county-level TIGER shapefile (Alaska and Hawaii are not displayed but we note
underneath the values for these states’ markets).7 Average days of hospice service per user were
calculated for each market by aggregating the total number of hospice service days provided in 2011
7 The boundaries of these shapefiles extend to the limit of U.S. territory. This feature results in some atypical
boundary shaping around some counties tangential to water (the Great Lakes in particular).

HHSM-500-2005-00018I Medicare Hospice Payment Reform: Hospice Study Technical Report
pg. 12 ▌3. Geographic Variation in Hospice Utilization and Payment Abt Associates Inc.
and dividing by the total number of beneficiaries receiving hospice service in that market in 2011.
These estimates were then applied to the county-level shapefile map. Due to the structure of the
underlying data, all counties within a CBSA, and all non-CBSA counties within a state, were assigned
the same estimate value.8
Among urban markets, the average service days per beneficiary ranged from 23.6 days per
beneficiary in Cheyenne, WY to 116.7 days per beneficiary in Morgantown, WV; followed in
decreasing order by Gadsden, AL (108.5 days); Johnstown, PA (104.9 days); and Florence, SC (103.5
days). Among rural markets, the average service days per beneficiary ranged from 42.1 days per
beneficiary in rural Connecticut to 99.4 days per beneficiary in rural Mississippi, followed in
decreasing order by rural Alabama (91.9 days), rural Delaware (87.2 days), and rural Oklahoma (87.0
days). The median among urban markets was 64.9 service days per beneficiary (Oxnard-Thousand
Oaks-Ventura, CA) and the median among rural markets was 65.4 service days per beneficiary (rural
Arkansas).
A second map, entitled ―Hospice Payments per Hospice Beneficiary (All Markets), 2011,‖ is
presented in Figure 2 (below). This heat map displays the average hospice payments (in $1,000s) per
Medicare hospice user in 2011 by hospice market again for the continental 48 states. Average hospice
payments per Medicare hospice user were calculated for each market by aggregating total hospice
payments for services provided in 2011 and dividing by the total number of beneficiaries receiving
hospice service in that market in 2011. These estimates were then applied to the county-level national
map in a similar manner to utilization days per beneficiary, above.
Among urban markets, the average payments per beneficiary in 2011 ranged from $3,618 per
beneficiary in Cheyenne, WY to $17,662 per beneficiary in Miami-Miami Beach-Kendall, FL;
followed in decreasing order by Ft. Lauderdale-Pompano Beach-Deerfield, FL ($16,917); Columbus,
GA-AL ($16,466); and Grand Junction, CO ($16,110). Among rural markets, the average payments
per beneficiary ranged from $6,101 per beneficiary in rural South Dakota to $14,521 per beneficiary
in rural Delaware, followed in decreasing order by rural Massachusetts ($14,175), rural Mississippi
($13,604), and rural South Carolina ($12,110). The median among urban markets was $10,246 per
beneficiary (Memphis TN-MS-AR) and the median among rural markets was $9,355 per beneficiary
(rural Ohio).
8 We are only able to identify the CBSA (or state) in which hospice service occurred; we cannot identify the
exact county of service. For this reason, all counties within an urban or rural market are grouped and the
same estimate value is applied to all counties in that grouping. There is presumably additional geographic
variation county-by-county within markets.
Medicare Hospice Payment Reform: Hospice Study Technical Report HHSM-500-2005-00018I
Abt Associates Inc. 3. Geographic Variation in Hospice Utilization and Payment ▌pg. 13
Figure 1: Hospice Utilization Days per Hospice Beneficiary (All Markets), 2011
Note: (1) Values for Alaska and Hawaii are: urban AK 45.0; rural AK 54.5; urban HI 63.1; rural HI 60.5
(2) Limitations in the underlying data result in some atypical boundary shpaing around some counties tangential to water (the Great Lakes in particular)
(3) Data on service location was available only at the CBSA/non-CBSA level; therefore, a single average value is assigned to all counties within a CBSA
and to all non-CBSA counties in each state.
Source: Abt Associates Analysis of 2011 Medicare claims data.

HHSM-500-2005-00018I Medicare Hospice Payment Reform: Hospice Study Technical Report
pg. 14 ▌3. Geographic Variation in Hospice Utilization and Payment Abt Associates Inc.
Figure 2: Hospice Payments per Hospice Beneficiary (All Markets), 2011
Note: (1) Values for Alaska and Hawaii (not displayed) are: urban AK 7.8; rural AK 9.3; urban HI 11.0; rural HI 9.9 (all in $1,000s)
(2) Limitations in the underlying data result in some atypical boundary shpaing around some counties tangential to water (the Great Lakes in particular)
(3) Data on service location was available only at the CBSA/non-CBSA level; therefore, a single average value is assigned to all counties within a CBSA
and to all non-CBSA counties in each state.
Source: Abt Associates Analysis of 2011 Medicare claims data.

Medicare Hospice Payment Reform: Hospice Study Technical Report HHSM-500-2005-00018I
Abt Associates Inc. 4. Analysis of Trends in General Inpatient Care Utilization ▌pg. 15
4. Analysis of Trends in General Inpatient Care Utilization
4.1 Background
General inpatient care (GIP) is one of the four levels of care under the hospice benefit. GIP is short-
term inpatient care provided in a hospice facility, a hospital, or a SNF for pain control or acute or
chronic symptom management which cannot be managed in other settings. Overall, it is used
relatively infrequently (as reported below, GIP accounts for just 1.5% of all hospice days in 2010–
2011). However, it is relatively expensive compared to the more commonly billed routine home care
(RHC): the FY 2012 payment rate for GIP was $671.84 per day compared to $151.03 for a day of
RHC.
To better understand the GIP level of care, we used Medicare hospice claims from 2010–2011 to
analyze GIP utilization among hospice beneficiaries and to compare the characteristics of hospice
providers who provide GIP services to those who do not provide any GIP services.
4.2 GIP Utilization
We found that approximately one-quarter of all hospice beneficiaries (N=500,579) had 553,397 GIP
stays comprised of 3,134,952 GIP days (Table 3); ―GIP stay‖ is defined as one or more consecutive
GIP days in hospice claims file.
Table 3: Summary of GIP Utilization
Total number
Beneficiaries with any GIP days in 2010–2011: 500,759
GIP stays (i.e., consecutive periods of GIP days) in 2010–2011: 553,397
GIP days in 2010–2011: 3,134,952
Source: All hospice claims 1/1/10–12/31/11. The last quarter of 2011 did not contain all final claims when this
analysis was completed.
Among beneficiaries who had a GIP stay, the average number of GIP stays per beneficiary was 1.1,
and the vast majority (92.5%) of beneficiaries had just 1 stay (Table 4). A small percentage (<1%)
had four or more GIP stays over the two year period.
Table 4: Frequency of GIP Stays (Among Beneficiaries Who Had at Least 1 GIP Stay in 2010–
2011)
Number of GIP stays Number of beneficiaries %
1 463,256 92.5%
2 28,927 5.8%
3 5,531 1.1%
4–44 3,045 0.6%
Total 500,759 100%
Source: All hospice claims 1/1/10–12/31/11. The last quarter of 2011 did not contain all final claims when this
analysis was completed.
4.2.1 Length of GIP stay
The total number of GIP stays among all beneficiaries who had at least 1 GIP stay is 553,397 (as
mentioned above, a GIP stay was defined as consecutive GIP days). The average duration of a GIP

HHSM-500-2005-00018I Medicare Hospice Payment Reform: Hospice Study Technical Report
pg. 16 ▌4. Analysis of Trends in General Inpatient Care Utilization Abt Associates Inc.
stay was 5.7 days per stay with a median of 4 days. Figure 3 provides additional detail on the length
of stay per GIP stay. Most GIP stays were just two days (mode). Over half (56%) of GIP stays were
1–4 days, and nearly all (98%) were 30 days or less.
Figure 3: Length of GIP Stays (in 2010–2011)
Source: All hospice claims 1/1/10–12/31/11. The last quarter of 2011 did not contain all final claims when this
analysis was completed.
The average length of a GIP stay varied by site of service (Figure 4). GIP stays provided at inpatient
hospices had a slightly longer average length of stay compared to all GIP stays (6.3 days vs. 5.7 days,
respectively). GIP stays provided at inpatient hospital sites had the shortest average LOS (4.7 days).
Figure 4: Average Length of GIP Stay (Days) Across Sites of Service (2010–2011)
Source: All hospice claims 1/1/10–12/31/11. The last quarter of 2011 did not contain all final claims when this
analysis was completed.

Medicare Hospice Payment Reform: Hospice Study Technical Report HHSM-500-2005-00018I
Abt Associates Inc. 4. Analysis of Trends in General Inpatient Care Utilization ▌pg. 17
4.2.2 Site of Service of GIP Stay
The corresponding total number of days associated with the 553,397 GIP stays in 2010–2011 is
3,134,952. Over 65% of all GIP days were provided in an inpatient hospice facility, and a quarter of
GIP days were provided in an inpatient hospital (Figure 5). Approximately 8% of GIP days were
provided in a skilled nursing facility (SNF).
Figure 5: Share of GIP Days by Site of Service (2010–2011)
Source: All hospice claims 1/1/10–12/31/11. The last quarter of 2011 did not contain all final claims when this
analysis was completed.
4.2.3 Transitions to and from a GIP Stay
We also examined transitions to and from a GIP stay. On the day immediately preceding the GIP stay,
nearly two-thirds (65%) of beneficiaries were not in hospice (that is, their first day in hospice was the
GIP stay), nearly a quarter (23%) were receiving hospice services at home, and the remaining 11%
were receiving hospice services not at home (first bar of Figure 6). Over two-thirds (68%) of
beneficiaries die during their GIP stay while 28% remained in hospice but received services in a non-
inpatient setting (13% +15%; second bar of Figure 6). Only 4% of beneficiaries were discharged alive
from hospice immediately following their GIP stay.
Figure 6: Site of Service Before and After GIP Stay (2010–2011)
Source: All hospice claims 1/1/10–12/31/11. The last quarter of 2011 did not contain all final claims when this
analysis was completed.

HHSM-500-2005-00018I Medicare Hospice Payment Reform: Hospice Study Technical Report
pg. 18 ▌4. Analysis of Trends in General Inpatient Care Utilization Abt Associates Inc.
4.2.4 Timing of a GIP Stay Within the Hospice Episode
Figure 7 shows when the GIP stay occurred relative to the beneficiaries’ entire hospice episode.
Nearly two thirds (64%) of GIP stays began within 3 days of the beginning of the beneficiary’s
hospice episode, while almost a quarter (23%) of GIP stays began over 30 days after the beneficiary
began hospice (first bar of Figure 7). Three-quarters of GIP stays ended within 3 days of the end of
the beneficiary’s hospice episode (second bar of Figure 7).
Figure 7: Timing of GIP Stay (2010–2011)
Source: All hospice claims 1/1/10–12/31/11. The last quarter of 2011 did not contain all final claims when this
analysis was completed.
4.3 Provider Characteristics
Among the 3,593 hospice providers who had at least one hospice claim in 2010–2011, 2,853 (79%)
provided at least one GIP day. For the 2,853 ―GIP providers,‖ the percentage of GIP days out of their
total number of hospice days (i.e., sum of all RHC days, continuous home care (CHC) days, inpatient
respite care (IRC) days, and GIP days) was 1.5% on average, with a median of 0.4% (Table 5). Over
99% of these GIP providers had 13% or fewer GIP days out of their total number of billed hospice
days, although there were a small number of providers who had over 20% of their hospice days as
GIP days (maximum=28.4%).
Table 5: Percent GIP Days Among GIP Providers (N=2,853)
Average
Percentile of GIP providers
Max 25th
50th
75th
90th
95th
99th
Percent GIP days
(GIP days/all hospice
days billed by the
provider)
1.5% 0.1% 0.4% 1.7% 4.6% 6.8% 12.9% 28.4%
Source: All hospice claims 1/1/10–12/31/11. The last quarter of 2011 did not contain all final claims when this
analysis was completed.
We also examined variation in provision of GIP by the following hospice provider characteristics:
age, size, and geographic location. Each is discussed below.

Medicare Hospice Payment Reform: Hospice Study Technical Report HHSM-500-2005-00018I
Abt Associates Inc. 4. Analysis of Trends in General Inpatient Care Utilization ▌pg. 19
4.3.1 Provider Age
The average age of providers is approximately 13 years (the age of providers was calculated as of
1/1/2011). As Figure 8 shows, a higher proportion of established hospice providers provide GIP
compared to newer hospice providers. For example, only 70% of hospice providers who had been in
operation for 0–5 years provided GIP whereas nearly all (97%) of hospice providers who had been in
operation for over 25 years provided GIP.
Figure 8: Percent of Hospice Providers Who Provided GIP, by Provider Age
Source: All hospice claims 1/1/10–12/31/11. The last quarter of 2011 did not contain all final claims when this
analysis was completed.
4.3.2 Provider Size
We grouped providers into three size categories using CMS’ definition9: Small=1–3,499 RHC days;
Medium=3,500–19,999 RHC days; and Large=20,000+ RHC days. We used RHC days reported in
the first three quarters of 2011 to accommodate incomplete claims, and the size thresholds were
adjusted accordingly (i.e., multiplied by 0.75). Like provider age, there was also variation in
provision of GIP by provider size (Figure 9). Only half of small providers provide GIP whereas
nearly all (96%) large providers provide GIP.
9 See page 28 of http://edocket.access.gpo.gov/2009/pdf/E9-18553.pdf

HHSM-500-2005-00018I Medicare Hospice Payment Reform: Hospice Study Technical Report
pg. 20 ▌4. Analysis of Trends in General Inpatient Care Utilization Abt Associates Inc.
Figure 9: Percent of Hospice Providers Who Provided GIP, by Provider Size
Source: All hospice claims 1/1/10–12/31/11. The last quarter of 2011 did not contain all final claims when this
analysis was completed.
4.3.3 Provider Region
Finally, we also found variation in the provision of GIP by hospice provider’s geographic location
(Figure 10). About 40% of providers are located in the South census region, a quarter of providers are
in the Midwest, nearly a fifth are in the West, and just over 10% are located in New England.
Although the South has the greatest number of hospice providers across the four regions (N=1,481), it
has the lowest percentage of providers who provide GIP (77%). Conversely, New England has the
smallest number of hospice providers across the four regions (N=445) and nearly all of them (91%)
provide GIP.
Figure 10: Percent of Hospice Providers Who Provided GIP, by Provider Region
Source: All hospice claims 1/1/10–12/31/11. The last quarter of 2011 did not contain all final claims when this
analysis was completed.
4.4 Conclusion
About a quarter of all hospice beneficiaries in 2010–2011 had at least one GIP stay; the vast majority
of these beneficiaries had just one GIP stay. Sixty-five percent of GIP days were provided in
inpatient hospices, a quarter were provided in inpatient hospitals, and 8% were provided in skilled

Medicare Hospice Payment Reform: Hospice Study Technical Report HHSM-500-2005-00018I
Abt Associates Inc. 4. Analysis of Trends in General Inpatient Care Utilization ▌pg. 21
nursing facilities. Across all sites of service, the average GIP stay was 5.7 days, but varied by site of
service (6.3 days in inpatient hospices; 4.7 days in inpatient hospitals; 5.3 days in skilled nursing
facilities). Over half of beneficiaries were not in hospice the day immediately before their GIP stay,
and relatively few (4%) were discharged alive from hospice immediately following their GIP stay.
Almost a quarter of GIP stays began over 30 days after the beneficiary began hospice, while three-
quarters of GIP stays ended within 3 days of the end of the beneficiary’s hospice episode.
Our analysis also revealed considerable variation in provider characteristics and provision of GIP.
Among the nearly 80% of hospice providers who provided at least one GIP day in 2010–2011, nearly
all of them had 13% or fewer GIP days out of their total number of billed hospice days (average=
1.5%). However, a small number of providers billed over 20% of their hospice days as GIP days. A
higher proportion of established hospice providers provide GIP compared to newer hospice providers,
and nearly all large providers provide GIP compared to only half of small providers. Finally, we also
found variation in the provision of GIP by hospice provider’s geographic location: 77% of providers
in the South provided GIP compared to 91% of providers in New England.


Medicare Hospice Payment Reform: Hospice Study Technical Report HHSM-500-2005-00018I
Abt Associates Inc. 5. Hospice Cost Reports—Benchmarks and Trends (2004–2011) ▌pg. 23
5. Hospice Cost Reports—Benchmarks and Trends (2004–2011)
5.1 Introduction
As part of Abt’s ongoing work for the Centers for Medicare and Medicaid Services, we have been
conducting analyses of Healthcare Cost Report Information System (HCRIS) data to inform specific
policy questions surrounding hospice payment reform. These analyses use FY 2004–2011 cost reports
from freestanding hospice providers to describe the sources of costs for hospice providers. In
particular, we use this information to determine: how much various cost centers contribute to total
costs for a ―typical‖ provider; how sources of costs vary across providers; and how the average total
costs per election period have changed over time.
The set of cost reports used for analyses was trimmed of cost reports that contain missing or unusual
data values that may cause measures of ―average‖ to be misleading. Specifically, the following
exclusion restrictions were applied to the 2004 to 2011 free-standing hospice provider cost reports.
The exclusions were made individually to each year of cost reports and were not applied sequentially.
Therefore, any exclusion based on the distribution of costs, payments, or margins is calculated on the
complete sample of providers.
1. Short or long cost report periods: Cost reports with period less than 10 months or greater than
14 months.
2. Missing or negative value costs or payments: Cost reports with missing information or
negative reported values for total costs or payments.
3. Top and bottom 1% of cost per day: providers in the highest and lowest percentile in costs per
days across all levels of care.
4. Top and bottom 5% of provider margins.
5. Aggregate of cost centers does not equal total costs as reported.
Using the trimmed sets of cost reports, cost centers are grouped into four broad categories: Inpatient
Care, Visiting Services, Other Hospice Services, and Non-reimbursable Services. All costs are taken
from Worksheet B of the freestanding hospice cost reports and include allocated costs from general
services (e.g. A&G costs).10
Information regarding the number of patients and hospice patient-days is
taken from worksheet S1 of the cost reports and includes patients from all payer sources. The patient
count describes a census count of the number of election periods and, thus, patients with two or more
election periods will be counted multiple times. The result of using such a census count is that figures
calculated as ―cost per patient‖ will more accurately provide a cost per election period and
underestimate the true cost per patient. Additionally, if a patient’s election period spans two cost
reporting periods, even if she only has one election period, she will be counted as a patient in both
cost reports. However, to be consistent with the cost report terminology the following refers to this
the patient count including duplicates as ―patients.‖
10 General service costs include costs for capital, plant operation and maintenance, staff transportation,
volunteer service coordination, and administrative and general costs.
HHSM-500-2005-00018I Medicare Hospice Payment Reform: Hospice Study Technical Report
pg. 24 ▌5. Hospice Cost Reports—Benchmarks and Trends (2004–2011) Abt Associates Inc.
Throughout the document means are calculated two ways: over all providers, and at the provider
level. If a mean is calculated over all providers (weighted), then it is defined using the totals across
providers in a given year. For instance, the mean cost per patient calculated over all providers is
defined as the sum of costs across all providers divided by the sum of patients across all providers.
When the mean is calculated in this manner, larger providers influence the mean to a greater degree
than smaller providers and may be more representative of the industry as a whole.
Alternatively, when the mean is calculated at the provider level, it is calculated for each provider;
then a mean of those provider means is calculated. When calculated in this manner, smaller providers
and larger providers have an equal weight in the calculation.
Below is a brief description of each broad cost category, as taken from the Provider Cost Reporting
Forms and Instructions (Form CMS-1984-99), and accompanying tables regarding the costs for each
year of cost reports. Again, the costs from each cost center include general service costs allocated to
the cost centers which receive the services on a statistical basis.
5.2 Inpatient Care
Inpatient care includes costs from general inpatient (GIP) care and inpatient respite care. Costs
represent direct costs of furnishing routine and ancillary services associated with general inpatient or
respite care—such as 24-hour nursing, meals, laundry, and housekeeping—and includes drug costs
incurred while the patient is in an inpatient unit. Direct patient care services, such as patient-specific
nursing or therapy, for patients receiving GIP or respite care are recorded in the visiting services cost
centers. If a provider does not maintain its own inpatient beds, but furnishes inpatient care through a
contractual arrangement with another facility, the contracted costs for routine and ancillary services
are included.
Table 6 shows information regarding the average inpatient costs per patient for hospice providers.
Section (a) of Table 6 shows the mean inpatient costs when averaged over all providers (i.e. all
provider inpatient costs/ all patients from all providers). Section (b) shows the mean, standard
deviation, and median costs per patient across providers attributed to the inpatient care cost centers
for freestanding providers. The mean of costs is significantly higher than the median indicating that
the data are skewed right. Given that these three measures of central tendency disagree, care should
be taken when describing the ―average‖ costs of inpatient care for hospice providers.
Section (c) of Table 6 shows that roughly one-third of providers report zero inpatient costs. As these
costs should include contractual costs for inpatient care, if a provider does not have inpatient beds,
zero costs on the cost report should reflect zeros rather than differences in accounting.
Section (d) of Table 6 shows the mean, standard deviation, and median for inpatient costs per patient
for providers who report that they had inpatient costs.

Medicare Hospice Payment Reform: Hospice Study Technical Report HHSM-500-2005-00018I
Abt Associates Inc. 5. Hospice Cost Reports—Benchmarks and Trends (2004–2011) ▌pg. 25
Table 6: Inpatient Care Costs per Patient by Year, Nominal Dollars
2004 2005 2006 2007 2008 2009 2010 2011
PANEL Aa
Number n = 1,046 n= 1,218 n = 1,490 n = 1,694 n = 1,834 n = 1,882 n = 1,928 n = 1,814
(a) Costs per patient averaged over all providers
Mean $1,046 $1,121 $1,170 $1,201 $1,187 $1,246 $1,254 $1,302
(b) Provider-level costs per patient
Mean $762 $808 $744 $761 $755 $772 $712 $828
Std dev (2,263) (2,593) (1,569) (1,756) (1,627) (1,594) (1,412) (2,991)
Median $203 $99 $92 $100 $107 $128 $122 $120
(c) Proportion of providers reporting inpatient costs = 0
0.27 0.36 0.36 0.36 0.33 0.33 0.34 0.33
PANEL Bb
Number n = 766 n= 776 n = 955 n = 1,084 n = 1,230 n = 1,259 n = 1,274 n = 1,220
(d) Provider-level costs per patient | costs > 0
Mean $1,040 $1,269 $1,161 $1,189 $1,125 $1,154 $1,078 $1,232
Std Dev (2,590) (3,158) (1,833) (2,077) (1,880) (1,832) (1,620) (3,579)
Median $396 $475 $476 $447 $402 $424 $404 $396
Data are from the Abt Trim sample of freestanding hospice cost reports. The total inpatient care service costs include inpatient general care and inpatient respite
care. Costs are in nominal dollars. Costs of direct patient care provided by hospice staff are not included. aPanel A shows descriptive information on the Abt Trim sample of freestanding hospice cost reports for each fiscal year.
bPanel B further restricts the sample to providers with non-zero inpatient costs.
.

HHSM-500-2005-00018I Medicare Hospice Payment Reform: Hospice Study Technical Report
pg. 26 ▌5. Hospice Cost Reports—Benchmarks and Trends (2004–2011) Abt Associates Inc.
Investigating the high count of $0 inpatient costs, there is an issue with providers reporting
conflicting information regarding inpatient stays for hospice patients. Specifically, significant
numbers of cost reports list a non-zero number of days but zero costs for inpatient care, i.e.,
conflicting information. A smaller proportion report non-zero costs and zero inpatient days. Table 7
below shows the cross tabulation of indicators for reports of non-zero inpatient costs and days,
conflicting information is highlighted in bold.
Table 7: Cross Tabulation of Indicators for Reports of Non-Zero Inpatient Costs and Days
Inpatient costs Inpatient days > 0 No inpatient days Row total
Inpatient costs > 0 63.49% 3.03% 66.52%
No inpatient costs 21.93% 11.55% 33.48%
Column total 85.42% 14.58%
In fiscal years 2004–2011, 11.55% of cost reports have both zero inpatient costs and zero inpatient
days reported, and 63.49% of cost reports denote positive amounts of both inpatient costs and days.
However, a significant proportion of providers report that they did not incur inpatient costs but
reported providing some inpatient days (21.93%); and a smaller proportion of cost reports denote
serving zero inpatient days but positive inpatient costs (3.03%).
5.3 Visiting Services (Labor)
This includes thirteen labor disciplines: physician services, nursing care, nursing care—CHC,
physical therapy, occupational therapy, speech/language pathology, medical social services, spiritual
counseling, dietary counseling, counseling-other, home health aide and homemaker, home health
aide/homemaker-CHC, and other.
Table 8 shows the mean weighted visiting service costs per patient calculated over all providers, as
well as the mean, standard deviation, and median of provider-level costs per patient in the visiting
services (labor) cost centers. The weighted mean is slightly higher than the mean costs averaged at the
provider level. This suggests that smaller hospice providers have slightly higher visiting service costs
per patient. For the provider-level averages, the mean is greater than the median; but, the difference is
not as dramatic as that seen for inpatient costs. This is partly because almost all providers report some
costs associated with visiting services. The mean value of nominal costs increases by a significant
amount for the 2006 and 2011 years. However, these changes are driven by high cost outliers—note
the large standard deviations associated with these means. Conversely, the median provider visiting
service cost per patient trends upward over time without significant year-to-year jumps in value.

Medicare Hospice Payment Reform: Hospice Study Technical Report HHSM-500-2005-00018I
Abt Associates Inc. 5. Hospice Cost Reports—Benchmarks and Trends (2004–2011) ▌pg. 27
Table 8: Visiting Services Costs per Patient by Year, Nominal Dollars
2004 2005 2006 2007 2008 2009 2010 2011
Number n = 1,046 n= 1,218 n = 1,490 n = 1,694 n = 1,834 n = 1,882 n = 1,928 n = 1,814
Costs averaged over all providers
Mean $5,303 $5,568 $6,295 $6,856 $6,816 $7,185 $7,078 $7,329
Costs averaged at provider level
Mean $6,028 $6,899 $8,718 $7,933 $8,034 $8,156 $8,060 $11,278
Std dev (2,577) (6,386) (60,438) (5,622) (4,150) (3,518) (3,708) (83,556)
Median $5,588 $6,205 $6,548 $7,184 $7,327 $7,577 $7,515 $7,815
Data are from the Abt Trim sample of freestanding hospice cost reports.

HHSM-500-2005-00018I Medicare Hospice Payment Reform: Hospice Study Technical Report
pg. 28 ▌5. Hospice Cost Reports—Benchmarks and Trends (2004–2011) Abt Associates Inc.
5.4 Other Hospice Services
Other Hospice Services include the following ten cost centers: drugs, biologicals, and infusion;
durable medical equipment/oxygen; patient transportation; imaging services; labs and diagnostics;
medical supplies; outpatient services (incl. E/R dept.); radiation therapy; chemotherapy; and ―other.‖
For the drugs, biological, and infusion cost center, we have also aggregated the sub-lines (i.e.
analgesics and sedatives/hypnotics) up to this center. Three costs centers—drugs, DME, and medical
supplies—account for the majority of the ―Other Hospice Service‖ costs. Only a few providers (fewer
than 5%) have more than half of other service costs come from cost centers other than these three;
and three-quarters of providers report that 90% or more of other service costs are attributed to these
three cost centers.
Table 9 shows the proportion of total costs attributed to the other service costs lines for each year of
cost reports. The means calculated over all facilities show the proportion of total costs over all
providers attributed to the other service cost centers (i.e. all provider ―other service‖ costs/ all
provider total costs). The bottom panel describes the proportion of total costs attributed to other
service lines when calculated at the provider level. There are not significant year-to-year changes in
these proportions. However, there is a downward trend in this proportion over time.
Examining the drivers of a downward trend in other hospice service costs, Table 10 shows mean,
standard deviation, and median costs of drugs, biologicals, and infusions per patient-day for hospice
providers. Additionally, Table 10 presents trimmed means of the costs per patient-day when the top
and bottom 1% and 5% of providers, in terms of cost per patient-day, are eliminated from the
calculation. The costs are in constant 2010 dollars, indexed using the producer price index for
prescription pharmaceuticals. The information in Table 10 suggests that drug costs for hospice
providers were trending downward significantly, in real dollars, from an average of $20 per patient
day to $11 per patient day over the 2004–2011 FYs. Conversely, in results not shown, the daily costs
of medical supplies remained flat, or slightly increased, over the same time periods.
Non-reimbursable services include bereavement counseling, volunteer program, and fundraising
costs. While there is a cost center line for ―other‖ non-reimbursable costs on the cost report, these
―other‖ costs are omitted from total costs and are not described below. Omitting ―other‖ non-
reimbursable costs is consistent with instructions for calculating the total costs and per diem costs on
Worksheet D of the cost report.
As with inpatient costs, measures of ―average‖ do not tend to agree; this is the result of a significant
proportion of facilities reporting zero costs in these cost centers. Up to 25% of cost reports include $0
in non-reimbursable costs with the proportion of providers reporting zero costs trending upward over
time. The report of $0 in non-reimbursable costs comes despite the requirement of providing
bereavement services.

Medicare Hospice Payment Reform: Hospice Study Technical Report HHSM-500-2005-00018I
Abt Associates Inc. 5. Hospice Cost Reports—Benchmarks and Trends (2004–2011) ▌pg. 29
Table 9: Proportion of Total Costs Attributed to ―Other Hospice Service Costs‖ Lines
2004 2005 2006 2007 2008 2009 2010 2011
Number n = 1,052 n= 1,222 n = 1,500 n = 1,698 n = 1,838 n = 1,887 n = 1,930 n = 1,818
Calculated over all providers
Mean 0.227 0.216 0.212 0.204 0.200 0.196 0.198 0.192
Costs averaged at provider level
Mean 0.243 0.231 0.228 0.215 0.210 0.206 0.211 0.207
Median 0.239 0.220 0.213 0.203 0.203 0.201 0.205 0.203
Data are from the Abt Trim sample of freestanding hospice cost reports.
Table 10: Costs per Patient-Day by Year, 2010 Dollars
2004 2005 2006 2007 2008 2009 2010 2011
Number n = 1,046 n= 1,218 n = 1,490 n = 1,694 n = 1,834 n = 1,882 n = 1,930 n = 1,818
Provider-level drug costs per patient-day
Mean $20 $18 $17 $15 $14 $13 $12 $11
Std dev (10) (11) (11) (9) (9) (9) (7) (6)
Median $20 $18 $16 $15 $14 $13 $12 $11
Trimmed means
1%-99% $21 $19 $17 $16 $15 $14 $13 $12
5%-95% $20 $18 $16 $15 $14 $13 $12 $11
Data are from the Abt Trim sample of freestanding hospice cost reports. The costs are averaged at the provider-level and adjusted to constant 2010 dollars using
the Producer Price Index for prescription pharmaceuticals.

HHSM-500-2005-00018I Medicare Hospice Payment Reform: Hospice Study Technical Report
pg. 30 ▌5. Hospice Cost Reports—Benchmarks and Trends (2004–2011) Abt Associates Inc.
Total Costs: Table 11 displays information regarding total costs. The top portions of Table 11 display
the weighted proportion of total costs attributed to each broad group of cost centers and the average
total costs per patient. The bottom portions of Table 11 display the provider-level mean proportion of
costs attributed to each broad cost center grouping and the median total cost per patient in each year.
The costs per patient statistics have been adjusted to constant 2010 dollars using the hospital market
basket update.
Using either the weighted or provider-level measures suggests that the visiting services cost centers
make up the largest and an increasing proportion of the total costs over time. Other hospice services
account for the second largest proportion of costs; however, this proportion is declining over time.
The measures of average cost per patient when measured in constant dollars have remained fairly flat
over time, trending upward until 2007 and downward after this time. Compared to 2004, the 2011
average costs per patient increased by roughly $200 to $300 dollars (2% to 3%). Note that the mean
costs per patient reflect costs associated with the mean length of episode, which is significantly longer
than the median length of episode.

Medicare Hospice Payment Reform: Hospice Study Technical Report HHSM-500-2005-00018I
Abt Associates Inc. 5. Hospice Cost Reports—Benchmarks and Trends (2004–2011) ▌pg. 31
Table 11: Proportion of Total Costs by Cost Center Grouping and Average Total Costs per Patient
Cost center group 2004 2005 2006 2007 2008 2009 2010 2011
Total costs by cost center group over all providers
Visiting services 61% 62% 63% 65% 65% 65% 66% 66%
Other services 23% 22% 21% 20% 20% 20% 20% 19%
Inpatient services 12% 13% 12% 11% 11% 11% 12% 12%
Non-reimbursable services 4% 4% 4% 4% 4% 4% 3% 3%
Total costs per patient over all
providers (2010 dollars) $10,509 $10,522 $11,053 $11,544 $11,259 $11,243 $10,775 $10,710
Total costs by cost center group at provider level
Visiting services 65% 67% 67% 69% 70% 70% 70% 71%
Other services 24% 23% 23% 22% 21% 21% 21% 21%
Inpatient services 7% 7% 7% 7% 6% 7% 6% 6%
Non-reimbursable services 4% 3% 3% 3% 3% 3% 2% 2%
Median of providers’ average costs
per patient (2010 dollars) $10,510 $11,084 $11,216 $11,560 $11,103 $11,209 $10,822 $10,819
*Costs per patient are in 2010 dollars, normalized using the hospital market basket update.


Medicare Hospice Payment Reform: Hospice Study Technical Report HHSM-500-2005-00018I
Abt Associates Inc. 6. Analysis of Face-to-Face Physician Visit Requirement ▌pg. 33
6. Analysis of Face-to-Face Physician Visit Requirement
The Affordable Care Act (ACA) requires that a hospice physician or nurse practitioner (NP) must
have a face-to-face encounter with every hospice patient to determine the continued eligibility of that
patient prior to the 180th day recertification (e.g., interpreted as the 3
rd benefit period recertification)
and prior to each subsequent recertification. This analysis provides an impact of the impact of the
face-to-face visit requirement for hospice on the probability of a beneficiary having a recertification
that is the second or later. One possible impact of this requirement is that beneficiaries who do not
have an expectation of death within six months would be discharged from hospice more frequently
than prior to the requirement’s existence.
The specific face-to-face requirement has several components, two of which are relevant
for the analysis included in the report.
A hospice physician or hospice NP must have a face-to-face encounter with hospice
patients prior to, but not more than 30 days prior to, the 3rd benefit period recertification,
and prior to, but not more than 30 days prior to, each recertification thereafter, to
determine continued eligibility for the hospice benefit.
A hospice physician or nurse practitioner who performs the encounter must attest in writing that he or
she had a face-to-face encounter with the patient, including the date of that visit. The attestation of the
nurse practitioner or non-certifying hospice physician shall state that the clinical findings of that visit
were provided to the certifying physician for use in determining continued eligibility for hospice care.
The face-to-face requirement was effective January 1, 2011. By April 1st, 2011 hospices were
required to have fully established internal processes to meet the face-to-face requirement and provide
appropriate documentation. Any third or later benefit period recertification on or after April 1, 2011
requires a face-to-face encounter.
6.1 Methodology
This analysis attempts to answer a very specific question that should provide information on the
impact of the face-to-face requirement by comparing the frequency of certain recertifications before
the requirement to the frequency after the requirement.
For beneficiaries whose first and second benefit periods are both 63 days or longer (a proxy for a
beneficiary not receiving hospice prior to the start of the data), is the frequency of a 3rd
benefit period
recertification or subsequent recertification greater for beneficiaries who began their first period
during October 2009–January 2010 (for recertifications before the requirement) compared to
beneficiaries who began their first period during October 2010–January 2011 (for recertifications
after the requirement)? We consider benefit periods 63 days or longer to be a 1st or 2
nd benefit period
or later, and thus a 90-day benefit period.
For the beneficiaries whose first benefit period began during October 2009–January 2010 (with 3rd
benefit period recertifications occurring before the face-to-face requirement), the analysis included
first benefit periods that started between October 4, 2009 and January 31, 2010. For those
beneficiaries, the analysis included subsequent benefit periods that had a start date through September
2010. Similarly, for the beneficiaries whose first benefit period began during October 2010–January
2011 (with 3rd
benefit period recertifications occurring after the requirement), the analysis included

HHSM-500-2005-00018I Medicare Hospice Payment Reform: Hospice Study Technical Report
pg. 34 ▌6. Analysis of Face-to-Face Physician Visit Requirement Abt Associates Inc.
first benefit periods that started between October 4, 2010 and January 31, 2011. Table 12 shows
information on when benefit periods begin if beneficiaries are continuously enrolled in hospice.
For the beneficiaries in this analysis, all subsequent benefit periods that had a start date through
September 2011 were included. The analysis included beneficiaries whose first two benefit periods
are 63 days or longer as this indicates that these benefit periods are a beneficiary’s first two 90-day
benefit periods. This is currently the only way to accurately identify the 2nd
recertification period
using our data, which begins with claims in 2010. That is, in our data, it is possible that the first
and/or second benefit period that is seen, in the sequence of benefit periods, are not 60-day benefit
periods. Conversely, one or both of those benefit periods may be a 90-day benefit period. To
determine whether these benefit periods are 60-day or 90-day benefit periods, we look to see if either
benefit period lasts 63 days or more. We consider benefit periods 63 days or longer to be a 1st or 2
nd
benefit period or later, and thus a 90-day benefit period.
The following bullets help explain why the time period mentioned was picked:
If a benefit period starts on October 4, April 1st (the day hospices were required to have
fully established internal processes to meet the face-to-face requirement and provide
appropriate documentation in 2011) occurs 180 days later.
180 days including and after January 31st is July 29
th. 60 days including after July 29
th is
September 26th.

Medicare Hospice Payment Reform: Hospice Study Technical Report HHSM-500-2005-00018I
Abt Associates Inc. 6. Analysis of Face-to-Face Physician Visit Requirement ▌pg. 35
Table 12: Select Time Periods and Start Dates of Benefit Periods for the Sample Examined
Start Date of
First Benefit Period Second Benefit Period Third Benefit Period Fourth Benefit Period Fifth Benefit Period
Beneficiaries
Not Impacted
by Face to
Face
October 4, 2009 January 2, 2010 April 2, 2010 June 1, 2010 July 31, 2010
November 1, 2009 January 30, 2010 April 30, 2010 June 29, 2010 August 28, 2010
December 1, 2009 March 1, 2010 May 30, 2010 July 29, 2010 September 27, 2010
January 1, 2010 April 1, 2010 June 30, 2010 August 29, 2010 October 28, 2010
January 31, 2010 May 1, 2010 July 30, 2010 September 28, 2010 November 27, 2010
Beneficiaries
Impacted by
Face to Face
October 4, 2010 January 2, 2011 April 2, 2011 June 1, 2011 July 31, 2011
November 1, 2010 January 30, 2011 April 30, 2011 June 29, 2011 August 28, 2011
December 1, 2010 March 1, 2011 May 30, 2011 July 29, 2011 September 27, 2011
January 1, 2011 April 1, 2011 June 30, 2011 August 29, 2011 October 28, 2011
January 31, 2011 May 1, 2011 July 30, 2011 September 28, 2011 November 27, 2011

HHSM-500-2005-00018I Medicare Hospice Payment Reform: Hospice Study Technical Report
pg. 36 ▌6. Analysis of Face-to-Face Physician Visit Requirement Abt Associates Inc.
The analysis examined a beneficiary’s benefit periods from their first benefit period to the time they
leave hospice. Table 13 shows the number of beneficiaries based on the number of consecutive
benefit periods they had. From Table 13, there are a similar (but slightly fewer) number of episodes
that started between October 2009 and January 2010 compared to October 2010 and January 2011.
However, the percentage of beneficiaries who did not make it past their second benefit period is
nearly identical between the two time periods. During the 4th period, slightly fewer beneficiaries (1.3
percentage point fewer) were recertified in the October 2010–January 2011 category compared to the
October 2009–January 2010 category. Note, the date of the third benefit period would fall on or after
April 1st.
Table 13: Number of Consecutive Benefit Periods for Beneficiaries Whose First Two Benefit
Periods Had at Least 63 Days
Benefit period
First benefit period had a start date between:
October 2009–January 2010
(before face-to-face)
October 2010–January 2011
(after face-to-face)
Beneficiaries
% of beneficiaries
who have left
hospice Beneficiaries
% of beneficiaries
who have left
hospice
1 39,783 — 40,608 —
2 39,783 — 40,608 —
3 30,046 24.5% 30,525 24.8%
4 22,129 44.4% 22,048 45.7%
5 8,735 78.0% 8,573 78.9%
Note: In the analytic file, there are 298,235 beneficiaries with a benefit period start date during October 2009–
January 2010 while there are 313,783 beneficiaries with a benefit period start date during October 2010–January
2011.
Table 14 provides information on the discharge status of a beneficiary at the end of a benefit period.
Again, this table shows beneficiaries whose first two periods had at least 63 days. Benefit period
refers to consecutive benefit period.
The discharge status at the end of the second period looks similar for the period after face-to-face
(October 2010–January 2011) compared to the period before face-to-face (October 2009–January
2010). The beneficiaries affected by face-to-face have a slightly higher percentage of benefit periods
ending in live discharge or ―still in hospice‖ but a slightly lower percentage of benefit periods ending
in death compared to the beneficiaries not affected by face-to-face. The discharge status in the 3rd
benefit period looks almost identical across the period affected by face-to-face versus the period not
affected.
In addition to examining the number of benefit periods for a hospice user, we also examined the
frequency of physician billing on the hospice claim before and after the face-to-face requirement.
Table 15 provides a day-by-day tabulation of how many physician services appear on a claim for a
particular day of hospice. Table 15 is further broken down into two parts to compare the beneficiaries
affected by face-to-face (2010–2011) to those beneficiaries who were not (2009–2010). While the
face-to-face encounter is not billable, hospice physicians may bill for direct patient care provided in
the course of such a visit; NPs may bill for such visits if they provide physician services and are the
designated attending physician. This table shows that physician services are rarely recorded on the
claim. Since the physician or NP would have a face-to-face encounter with the beneficiary at the

Medicare Hospice Payment Reform: Hospice Study Technical Report HHSM-500-2005-00018I
Abt Associates Inc. 6. Analysis of Face-to-Face Physician Visit Requirement ▌pg. 37
second and subsequent recertification period, it is possible that more physician services would be
recorded during that time period.
There are a few things to note from this table. First, for most of the different periods of days, slightly
fewer days in the face-to-face period have physician services recorded compared to the non-face-to-
face period. Second, it appears that for the days that would fall under the second or later
recertification (Days 161–215, 216-270, 271) fewer physician services are being recorded in the face-
to-face period compared to the earlier days (day 1–90 and 91–160).

HHSM-500-2005-00018I Medicare Hospice Payment Reform: Hospice Study Technical Report
pg. 38 ▌6. Analysis of Face-to-Face Physician Visit Requirement Abt Associates Inc.
Table 14: Discharge Status Upon End of Benefit Period for Beneficiaries Whose First Two Benefit Periods Had At Least 63 Days
Benefit
period Statistics
First claim has a start date between
October 2009 and January 2010
(before face-to-face)
First claim has a start date between
October 2010 and January 2011
(after face-to-face)
Died
Live
discharge
Still in
hospice
Unknown
discharge
code Died
Live
discharge
Still in
hospice
Unknown
discharge
code
1 N 0 9 39,774 0 0 10 40,597 1
Row % 0 0.02 99.98 0 0 0.02 99.97 0
2 N 5,415 4,112 30,200 56 5,057 4,536 30,957 58
Row % 13.61 10.34 75.91 0.14 12.45 11.17 76.23 0.14
3 N 4,652 3,063 22,287 44 4,781 3,067 22,610 67
Row % 15.48 10.19 74.18 0.15 15.66 10.05 74.07 0.22
4 N 3,129 2,179 16,784 37 3,021 1,891 17,098 38
Row % 14.14 9.85 75.85 0.17 13.7 8.58 77.55 0.17
5 N 1118 826 6,775 16 1067 678 6,809 19
Row % 12.8 9.46 77.56 0.18 12.45 7.91 79.42 0.22
Total N 14,324 10,209 115,934 153 13,967 10,196 118,250 183
Row % 10.19 7.26 82.44 0.11 9.79 7.15 82.93 0.13
Note: Changes in sample size from one benefit period to the next are due to censoring.

Medicare Hospice Payment Reform: Hospice Study Technical Report HHSM-500-2005-00018I
Abt Associates Inc. 6. Analysis of Face-to-Face Physician Visit Requirement ▌pg. 39
Table 15: Number of Services by Clinician Provider by Day
Day In hospice
Number of physician services
First claim has a start date between
October 2009 and January 2010
(before face-to-face)
First claim has a start date between
October 2010 and January 2011
(after face-to-face)
0 1 2 or more 0 1 2 or more
Day 1–90 223,077 1,616 93 358,109 2,630 113
99.24 0.72 0.04 99.24 0.73 0.03
Day 91–160 277,401 1,538 60 279,074 1,327 57
99.43 0.55 0.02 100 0.47 0.02
Day 161–215 176,678 1,265 59 179,774 1,222 36
99.26 0.71 0.03 99.31 0.68 0.02
Day 216–270 124,825 936 57 126,955 738 16
99.21 0.74 0.05 99.41 0.58 0.01
Day 271+ 64,669 595 34 66,532 363 12
99.04 0.91 0.05 99.44 0.54 0.02
Note: A beneficiary with multiple days in a category (e.g. Day 0–90) would appear multiple times on that row.


Medicare Hospice Payment Reform: Hospice Study Technical Report HHSM-500-2005-00018I
Abt Associates Inc. 7. Trends in Live Discharge ▌pg. 41
7. Trends in Live Discharge
A hospice patient may be discharged because of extended prognosis such that the patient is no longer
meeting hospice eligibility or the patient and/or family may choose to revoke the hospice benefit to
pursue curative treatment for their terminal illnesses or potentially seek care from another hospice
provider. By statute, hospices cannot enroll a patient who does not meet eligibility for hospice
services or discharge a patient so that patient can receive an expensive test or procedure that would be
paid for outside of the hospice benefit (Code of Federal Regulations, title 42, sec. 418.26). A potential
vulnerability of the hospice payment system though is that these behaviors may exist and therefore
result in inappropriate live discharge. Further, there could be a lack of understanding of what the
hospice benefit really entails and the beneficiary may decide they no longer want to be enrolled so
they can pursue curative treatment. Also, it is possible beneficiaries may revoke their benefit from a
particular hospice because they are receiving low quality care. MedPAC in 2011 noted that hospices
with high rate of live discharges were often those hospices that exceeded the hospice annual per
patient cap rate suggesting that these hospices may be inappropriately enrolling patients who are not
qualified for the Medicare Hospice Benefit (MedPAC, 2011).
Previous research suggests that the majority of live discharges (79%) are because the patient
condition has improved or stabilized with only 7% leaving hospice to pursue aggressive treatment and
12% was the patient or family decision to leave hospice care. Transfer between hospices was a rare
reason for hospice discharge (Kutner et al., 2004). The limited research is conflicting over whether
more cancer patients are live discharges compared to non-cancer patients (Bain et al., 2009; Albain et
al., 1991). As part of the analysis to examine potential vulnerabilities in the Medicare Hospice
Benefit, the rate of live discharges, its variation, and overall six outcomes post discharge was
examined among all Medicare Hospice Beneficiaries who were discharged in 2010.
In 2010, there were 956,497 discharges among 3,489 hospice providers whose provider number
linked to the provider of service file (MedPAC, 2011). Eighteen percent of theses discharges were
live discharges. Of those live discharges from hospice in 2010, 18.5% were admitted to an acute care
hospital within 2 days of that discharge and 16.1% were readmitted to hospice within 2 weeks. That
state variation of live discharges is shown in Figure 11.

HHSM-500-2005-00018I Medicare Hospice Payment Reform: Hospice Study Technical Report
pg. 42 ▌7. Trends in Live Discharge Abt Associates Inc.
Figure 11: Variation in the Rate of Live Discharges in 2010
Our analysis shows that among those 3,033 hospice programs with at least 30 discharges in 2010,
there was variation in the rate of live discharge with a median rate of 18.4% and an interquartile range
of 13.4% to 26.2%. Nearly one-fourth of these live discharges occurred within 19 days of hospice
admission. Overall, 49.2% of discharged hospice patients are dead within six months of the discharge.
The next step in this analysis is to better estimate how live discharges impact Medicare costs (Carlson
et al., 2010; Taylor et al., 2008). The observed variation suggest that the rate of live discharge
potentially could be an important vulnerability of Medicare hospice payment that should be
monitored during payment reform.

Medicare Hospice Payment Reform: Hospice Study Technical Report HHSM-500-2005-00018I
Abt Associates Inc. 8. Part D Utilization While Enrolled in Hospice ▌pg. 43
8. Part D Utilization While Enrolled in Hospice
8.1 Background
Medicare Part D is a Federal program, implemented in 2006, which subsidizes prescription drug costs
for Medicare beneficiaries. The program is relatively large: annual Part D expenditures were $56
billion in 2010 whereas hospice expenditures were $13 billion the same year. Individuals entitled to
Medicare Part A benefits are eligible for Part D coverage, therefore all (Part A) hospice beneficiaries
are also eligible to enroll in Part D.
Prior to the creation of Part D (and through the present), the hospice benefit provided medications.
All medications related to beneficiaries’ terminal illness and related conditions are fully covered by
the hospice benefit:
―…[D]rugs…used primarily for the relief of pain and symptom control related to the individual’s
terminal illness are covered [hospice services].‖ (42 CFR § 418.202f)
Moreover, the provision of such medications is a condition of participation for hospice providers:
―…[D]rugs and biologicals related to the palliation and management of the terminal illness and
related conditions, as identified in the hospice plan of care, must be provided by the hospice while
the patient is under hospice care.‖ (42 CFR § 418.106)
Providers are compensated for providing these medications through the per diem payments they
receive each day a beneficiary they are treating is enrolled in the benefit. That is, the per diem
payment amounts are set to incorporate the costs of these medications. If Part D were ever billed for a
hospice beneficiary’s covered medication, Medicare would effectively pay twice for the same drug:
once directly through Part D, and then a second time—implicitly—through the per diem payment the
provider received.
Concerned about the possibility of paying twice, CMS issued an advance notice call letter in 201111
to
educate plan sponsors on how to identify hospice enrollment. CMS informed sponsors (i) how to
identify hospice enrollment using transaction reply reports, (ii) that Part D should not be billed for
drugs related to hospice beneficiaries’ terminal illnesses or related conditions, and (iii) to enact
processes preventing such payments from occurring. CMS’s concerns were validated the following
year (2012) when the Office of Inspector General issued a report (A-06-10-00059; ―Medicare Could
Be Paying Twice for Prescription Drugs for Beneficiaries in Hospice‖) finding that in 2009, Medicare
Part D was billed $33.6 million for ―prescription analgesic, antinausea, laxative, and antianxiety
drugs, as well as prescription drugs used to treat COPD and ALS, that likely should have been
covered under the per diem payments made to hospice organizations.‖
In this section of the technical report, we expand upon the Office of Inspector General’s findings
using updated data. We focus on analgesic medications (one class of drugs included in the Office of
Inspector General’s report), medications for which the primary usage is to treat pain. Thus, these
11 See ―Preventing Part D Payment for Hospice Drugs‖ (p. 85), accessible via:
http://www.cms.gov/Medicare/Health-Plans/MedicareAdvtgSpecRateStats/downloads/Advance2012.pdf

HHSM-500-2005-00018I Medicare Hospice Payment Reform: Hospice Study Technical Report
pg. 44 ▌8. Part D Utilization While Enrolled in Hospice Abt Associates Inc.
drugs are likely examples of drugs falling under the scope of standard palliate care at the end-of-life
care. Thus, these drugs should probably be covered by hospice providers under the rule cited above.
Our results tabulate the total number of hospice beneficiaries receiving an analgesic prescription
through Medicare Part D in calendar year 2010. We estimate the total amount billed to Medicare for
these analgesics and the total amount paid for by hospice beneficiaries. We identify the generic drug
names which were most frequently billed to Part D, and which medications amounted to the greatest
total dollar value billed to Part D. Finally, we investigate geographical variation in billing patterns by
calculating the per-enrollment average analgesic billing amount for each state and territory.
8.2 Methods
We created an analytic file which identifies all analgesic prescriptions filled to hospice beneficiaries
in 2010 on days which the beneficiary was also enrolled in hospice. To build our file we combined
both our Hospice Day File and Medicare Part D claims to identify medications meeting the following
criteria:
1. The medication was an analgesic. This was accomplished using the 11-digit National Drug
Code provided on the Part D claim. Using external databases we established a list of drug
codes for which ―analgesic‖ was the therapeutic usage (primarily opiates and non-steroidal
anti-inflammatory drugs) and retained only those medications in our file.
2. The medication was filled for a hospice beneficiary. We verified this criterion by ensuring the
beneficiary identifier on the hospice day file matched the beneficiary identifier on the Part D
claims.
3. The hospice beneficiary was enrolled in Medicare Part D within thirty days prior to hospice
election. We believe that the most appropriate rate of Part D billing would limit the total base
of beneficiaries to only those enrolled in Medicare Part D. We identified Part D enrollment
(within thirty days of hospice election) using the corresponding Master Beneficiary Summary
File field which we joined to our day file.
4. The medication was filled on a day in which the hospice beneficiary was enrolled in hospice.
This was accomplished by matching drug fill dates listed on the Part D claims to the service
dates listed on the Hospice claim day file.
a. We are unable to determine when the prescription was written, when the beneficiary
received the medication from the dispensing pharmacy, or when the beneficiary began
taking the medication.
b. We were informed by the Research Data Assistance Center to interpret the ―drug fill
date‖ on the Part D claim as the ―date in which the pills went in the bottle.‖
c. We omitted medications filled on hospice admission days. We did this to reduce the
inclusion of analgesic prescriptions written before beneficiaries elected hospice. By
excluding all drugs filled on the first day of hospice we note that our estimates may be a
conservative lower bound on the true amount billed to Part D for hospice patients’
analgesics.

Medicare Hospice Payment Reform: Hospice Study Technical Report HHSM-500-2005-00018I
Abt Associates Inc. 8. Part D Utilization While Enrolled in Hospice ▌pg. 45
5. The medication was filled in 2010. This was accomplished by ensuring that the drug fill date
(and hospice service date) occurred during calendar year 2010.
8.3 Results
We identified 773,168 Medicare beneficiaries utilizing the hospice benefit at least one day in 2010
who were also enrolled in Part D within thirty days prior to hospice election. These beneficiaries
correspond to 832,028 admissions because some beneficiaries received the benefit over multiple
elections in 2010. Among these individuals, 112,555 beneficiaries (14.6% of all those enrolled in Part
D) received 334,387 analgesic prescriptions through Part D during their hospice enrollment. The total
gross value of these medications was $13,000,430. We calculate that over four-fifths of this amount
was paid by the Federal government: more than $6.6 million (51% of the total amount) was billed
directly to the Federal government and another $4.2 million (32%) was paid indirectly through the
low income subsidy reduction (this subsidy lowers qualifying beneficiaries’ coinsurance
responsibilities; the program is administered by the states using Federal funds). Medicare
beneficiaries paid $1.4 million (11%) through coinsurance and the remaining $0.8 million (6%) was
paid by a variety of sources including charities and auxiliary military benefits.
In Table 16 (―Hospice Patients’ Analgesics billed to Part D, 2010‖ below) we tabulate the total
number of prescriptions and aggregate dollar amounts billed to Part D for hospice beneficiaries’
analgesics in 2010 by generic medication for the most common generic medications we identified.
The accompanying figure (Figure 12 below, ―Distribution of Costs Billed to Part D by Drug, 2010‖)
illustrates the proportion of the total amount ($13 million) billed to Part D accounted for by each
generic analgesic drug. Table 16 indicates that the most common analgesic billed to Part D was
morphine. There were 54,850 morphine prescriptions billed to Part D for hospice beneficiaries in
2010, the greatest number among all analgesics. In terms of costs, Fentanyl accounts for the greatest
portion: 39%, or $5.0 million, of the total amount for analgesics billed to Part D for hospice
beneficiaries. In order of decreasing proportion of total costs, Fentanyl is followed by Oxycodone
(18%), Morphine (12%), Hydrocodone (9%), and Celecoxib (9%). These five generic prescriptions
together account for over 87% of the total dollar amount billed to Part D for hospice beneficiaries’
analgesics in 2010.

HHSM-500-2005-00018I Medicare Hospice Payment Reform: Hospice Study Technical Report
pg. 46 ▌8. Part D Utilization While Enrolled in Hospice Abt Associates Inc.
Table 16: Hospice Patients’ Analgesics Billed to Part D, 2010
Generic name # Drug fills Total costs
Fentanyl 48,420 $5,048,762
Oxycodone 35,971 $2,407,254
Morphine 54,850 $1,521,362
Hydrocodone 89,312 $1,206,089
Celecoxib 9,093 $1,192,967
Tramadol 34,942 $673,539
Propoxyphene 11,147 $462,499
Meloxicam 12,092 $133,774
Hydromorphone 3,835 $130,875
Oxymorphone 267 $120,190
Source: Abt Associates analysis of 2010 Medicare
Claims Data
Figure 12: Distribution of Costs Billed to Part D by Drug, 2010

Medicare Hospice Payment Reform: Hospice Study Technical Report HHSM-500-2005-00018I
Abt Associates Inc. 9. Reform Options ▌pg. 47
9. Reform Options
9.1 Simulation of a Hypothetical Tiered Model for the Hospice Benefit
This section of the report starts to build a framework for assessing the potential impacts of a tiered
model. The tiered model being simulated in this report primarily has characteristics of a U-Shaped
payment system—where days at the beginning or end of a hospice episode are paid at rates that are
relatively higher than those paid for days in the middle of the episode. The payment rates in this tiered
model also vary according to selected other characteristics of the episode (e.g. whether the episode is
an extremely short stay, and/or whether the episode includes visits at the end of life).
9.1.1 Methodology for a Hypothetical Tiered Model
The construction of the tiered model involves calculating average resource use for a variety of groups
of hospice days that correspond to characteristics of hospice use. An episode’s resource use is a
description of the wage weighted minutes of care (as reported on the claim) the hospice provides on a
particular day of hospice. Resource use does not measure the actual costs a hospice incurs on a daily
basis, but is just a proxy for the key labor costs that a hospice incurs; non-labor costs are not reflected
in this analysis. It is meant to describe relative costs (e.g. such as the beginning and end of a hospice
episode are more intensive than the middle) as opposed to absolute costs. We use data from the
Bureau of Labor Statistics to calculate a national hourly wage rate (including the hourly wage plus an
estimate of fringe benefit costs) for the six disciplines of care whose minutes are reported on the
claim. For 2011, the national hourly wage rates that were used for the six disciplines of care were:
Skilled Nursing: $38.82
Physical Therapy: $54.30
Occupational Therapy: $54.06
Speech Language Pathology: $59.46
Medical Social Service: $36.19
Home Health Aide: $13.89
Those hourly wage rates are multiplied by the number of hours of service reported on the claim for a
particular day of hospice to compute the resource use that occurred on that particular day of hospice
care.12
The tiered model discussed in this report is applicable only to Routine Home Care (RHC) days. The
general approach is to determine the average resource use for several different groups of hospice
episodes. As described below, these groups correspond to the characteristics such: where the hospice
day is in relation to the start and end of the episode, whether a beneficiary is an extremely short stay
hospice user, and whether the beneficiary received visits as recorded on the claim at the end of life.
The base payment rate for Routine Home Care (RHC) could then be multiplied by the ratio of the
average resource use for a particular group over the overall average resource use for all RHC days.
12 As a data cleaning step, for a given day, minutes reported on the claim were censored at 1,440. That is, it
was imposed that no hospice provided more than 24 hours of care of one specific discipline on a single day
of hospice care.

HHSM-500-2005-00018I Medicare Hospice Payment Reform: Hospice Study Technical Report
pg. 48 ▌9. Reform Options Abt Associates Inc.
The result would be the new base payment rate for RHC days that corresponded to one of the
categories. Several potential categories are described below.
Each grouping is applied to each day of hospice care. Groupings are applied in sequential order,
therefore a day may initially be assigned to ―Group 1,‖ but once the ―Group 7‖ logic is applied the
day could be assigned to ―Group 7.‖ Groups 1 to 4 are relevant to the initial high and then the low
(middle) part of the U-shaped curve. Groups 5 and 6 are relevant to the high end (near death) part of
the U-shaped curve. Group 7 days are used by beneficiaries with a short length of stay.
Group 1: RHC care that occurs between days 1 and day 5 of a beneficiary’s lifetime
length of stay.13
Group 2: RHC care that occurs between days 6 and day 10 of a beneficiary’s lifetime
length of stay.
Group 3: RHC care that occurs between days 11 and day 30 of a beneficiary’s lifetime
length of stay.
Group 4: RHC care that occurs on day 31 or later of a beneficiary’s lifetime length of
stay.
Group 5: RHC care that occurs during the last 7 days of a beneficiary’s lifetime length of
stay and the beneficiary is discharged dead. Beneficiary receives visiting service
(nursing, aide, MSS, therapy) during the last 2 days of life if the last two days of life are
RHC or the last two days of life are not RHC.
Group 6: RHC care that occurs during the last 7 days of a beneficiary’s lifetime length of
stay and the beneficiary is discharged dead. Beneficiary does not receive visiting service
(nursing, aide, MSS, therapy) during the last 2 days of life. Last two days of life are
RHC.
Group 7: RHC care when the beneficiary’s lifetime length of hospice is 5 days or less,
each day of hospice is RHC, and beneficiary is discharged deceased.
Note, groups were not picked to guide any conception about the appropriate length of stay in a
hospice. Instead, categories were defined to reflect differences in average resource use that appeared
meaningful. There is a little meaningful change in average daily resource following 30 days in
hospice (when the beneficiary is not in the last 7 days of life). However, this does not mean the
benefit is designed to only last 30 days.
9.1.2 Results
Table 17 shows summary statistics for the number of observations within each group and information
on the mean, 25th percentile, median, and 75
th percentile value of resource usage within each group.
The implied weight is calculated by taking the average resource use of each group and dividing it by
the total average resource use across all RHC days in the analysis.
13 For this particular example of a tiered payment system, the issue of live discharge is not considered. RHC
days are grouped based on the beneficiary’s lifetime length of stay. Future versions of this analysis will
address the issue of live discharge/revocation followed by a readmission into hospice.

Medicare Hospice Payment Reform: Hospice Study Technical Report HHSM-500-2005-00018I
Abt Associates Inc. 9. Reform Options ▌pg. 49
Table 17: Summary Statistics on Average Daily Resource Use by Payment Groups in the Tiered Model
Group
Days of
hospice
Unique
providers
Unique
beneficiaries
Resource use Implied
weight Mean p25 p50 p75
Group 1: RHC Days 1 – 5 2,800,144 3,570 613,274 $38.06 $0.00 $18.09 $58.23 2.30
Group 2: RHC days 6 – 10 2,493,004 3,562 532,779 $18.34 $0.00 $0.00 $29.11 1.11
Group 3: RHC days 11 – 30 7,767,918 3,565 501,445 $16.12 $0.00 $0.00 $24.31 0.97
Group 4: RHC Days 31+ 65,958,740 3,573 567,484 $14.27 $0.00 $0.00 $19.41 0.86
Group 5: RHC during last 7 days, skilled
visits during last 2 days 2,832,620 3,416 485,802 $40.35 $0.00 $25.04 $57.76 2.44
Group 6: RHC during last 7 days, no
skilled visits during last 2 days 476,809 3,012 74,144 $15.11 $0.00 $0.00 $19.41 0.91
Group 7: RHC when hospice LOS is 5
days or less, and discharged dead 510,787 3,334 142,703 $60.18 $0.00 $48.53 $87.35 3.64
Total 82,840,022 3,584 1,050,361 $16.55 $0.00 $0.00 $23.59 1.00
Source: 100% Sample of RHC Hospice Days from 2011

HHSM-500-2005-00018I Medicare Hospice Payment Reform: Hospice Study Technical Report
pg. 50 ▌9. Reform Options Abt Associates Inc.
The approach described above groups every RHC day into one of seven unique groups. As described
earlier, the implied weight calculated in the table could be used to set the payment rate for any RHC
day that was applicable to the group. The implied weight would be multiplied by the base payment
rate to determine the payment rate applicable to the group. For example, the base payment rates for
Fiscal Year (FY) 2012 are shown in Table 18.
Table 18: Base Payment Rates for FY 2012
Description Rate
Wage component
subject to index
Non-weighted
amount
Routine home care $151.03 $103.77 $47.26
Continuous home care
full rate = 24 hours of care
$36.73 = hourly rate
$881.46 $605.65 $275.81
Inpatient respite care $156.22 $84.56 $71.66
General inpatient care $671.84 $430.04 $241.80
A requirement of Section 3132(a) of the Affordable Care Act states that payment changes must be
made in a budget neutral manner in the first year. One method of determining budget neutrality is to
examine a set of hospice claims and determine what hospices were actually paid and then determine
what hospices would have been paid under an alternative system. The difference in payments between
the actual and hypothetical system is the payment amount that would need to be adjusted.
We apply a budget neutrality adjustment using hospice days that occurred in calendar year 2011.
Using our 100% sample of hospice days from that period, we divided the actual per-diem payments
by the hypothetical per-diem payments under the tiered model described above. That approach
produced a budget neutrality adjustment equal to 0.9969. The payment weights shown in Table Table
18 would be multiplied by that budget neutrality adjustment to achieve budget neutral weights.
Table 19 below shows estimated impacts from the tiered model described above. That is, after
determining the budget neutral weights, each hospice day from calendar year 2011 is grouped into
one of the aforementioned tiers. The base payment rate for RHC ($146.63 in FY 2011) is multiplied
by the budget neutral weights. A wage index adjustment is made and then additional payments on the
claim are added back into the hypothetical payment Medicare would have made for a particular day
of hospice. Each day of hospice then has two payment values. The actual payment provided for a
given day of hospice and the hypothetical payment that hospice would have received if the hospice
had provided that day under the tiered model. Table 19 groups hospice days into different categories
(e.g. provider location, ownership type, freestanding, etc.) and compares the actual payments to the
payments from the tiered model. This comparison assumes that hospices would not change their
behavior in providing hospice under the tiered model. Future work will need to examine the validity
of that assumption and where the assumption breaks down.
The first row of results (All Days/All Hospices) in Table 19 shows the impact of the budget neutrality
adjustment. Under both the actual and payments under the tiered model, hospices receive $13,782
million in payments. However, the remaining rows of the table show that budget neutrality applies
globally and not to individual hospices or even groups of hospices. Looking at hospices by Census
Division shows that hospices in the South Atlantic have lower payments under the tiered model
compared to the payments they actually received. The table also shows that freestanding hospices, for

Medicare Hospice Payment Reform: Hospice Study Technical Report HHSM-500-2005-00018I
Abt Associates Inc. 9. Reform Options ▌pg. 51
profit hospices, and larger hospices receive lower payments under the tiered model compared to the
payments they actually received.
Table 19: Impact of a Hypothetical Tiered Model on Payments for Different Hospice Subgroups
(Using RHC Days from 2011)
Description Hospice subgroup Providers
Total
RHC
days
(1,000s)
Benefici
aries
(1,000s)
Actual
payments
(millions)
Tiered
payments
(millions)
Tiered
as a %
of
actual
All days/all
hospices All Hospices 3,585 82,840 1,221 $13,782 $13,782 100%
Census
division
South Atlantic 509 18,767 267 $3,262 $3,197 98%
East North Central 475 12,544 201 $2,068 $2,092 101%
West South Central 676 10,961 141 $1,668 $1,630 98%
Pacific 374 9,220 149 $1,749 $1,808 103%
Middle Atlantic 290 8,186 138 $1,405 $1,427 102%
Mountain 352 6,845 91 $1,166 $1,144 98%
East South Central 286 5,849 79 $854 $846 99%
West North Central 378 5,628 89 $849 $873 103%
New England 163 3,146 55 $577 $593 103%
Unknown 82 1,692 15 $182 $172 95%
Facility type
Freestanding 2,490 66,726 929 $11,110 $10,990 99%
HHA 553 9,815 174 $1,627 $1,692 104%
Hospital 480 5,820 122 $975 $1,032 106%
Unknown 44 332 4 $47 $45 96%
SNF/NF 18 147 2 $23 $23 100%
Ownership
status
For profit 1,931 42,744 536 $6,880 $6,734 98%
Non-profit 1,125 31,693 563 $5,505 $5,628 102%
Government/other 485 8,071 136 $1,351 $1,376 102%
Unknown 44 332 4 $47 $45 96%
Hospice size
Large (20,000+ RHC days) 1,165 63,678 933 $10,856 $10,800 99%
Medium (3,500–19,999 RHC
days) 1,775 18,083 280 $2,761 $2,807 102%
Small (0–3,499 RHC days) 645 1,079 23 $165 $175 106%
Site of service
(Number of
Providers
describes the
number of
providers who
used the
corresponding
Q-Code at
least once)
Home 3,570 47,054 652 $7,239 $7,345 101%
Non-skilled nursing facility 2,375 16,882 213 $2,549 $2,500 98%
Assisted living 2,590 11,583 117 $1,842 $1,765 96%
SNF 2,318 6,065 104 $998 $997 100%
Not specified 457 516 7 $83 $82 98%
Hospice 403 400 14 $76 $84 111%
Inpatient 2,170 164 86 $275 $280 102%
Hospice inpatient 848 110 138 $694 $703 101%
LTC hospital 225 43 1 $8 $8 100%
Psychiatric 39 2 0 $0 $0 99%
Ownership
status
For profit 1,931 42,744 536 $6,880 $6,734 98%
Non-profit 1,125 31,693 563 $5,505 $5,628 102%
Government/other 485 8,071 136 $1,351 $1,376 102%
Unknown 44 332 4 $47 $45 96%
Note: The same beneficiaries can appear in multiple hospice subgroups when looking at the count of the number
of beneficiaries.

HHSM-500-2005-00018I Medicare Hospice Payment Reform: Hospice Study Technical Report
pg. 52 ▌9. Reform Options Abt Associates Inc.
9.1.3 Conclusion
The results of the simulations presented in this chapter are preliminary and we are continuing to
expand these analyses. We plan to conduct further analyses to better understand and model potential
behavioral responses to a tiered model to address vulnerabilities to the Medicare hospice benefit.
Furthermore, we are looking into possible expansions to the tiered model to include additional tiers.
The tiered model presented in this chapter does not make any adjustments for beneficiaries returning
to hospice after a live discharge.
9.2 Rebasing the Routine Home Care Rate for Hospice
9.2.1 Introduction
Rebasing the Medicare hospice payment rates could be one component to CMS hospice payment
reform efforts. The base payment rates were originally set in 1983 using information from a relatively
small set (n=26) of hospices that were participating in a CMS hospice demonstration. Since then,
CMS has updated payments rates to primarily account for inflation. This report explores how the
payment rate was originally set, some information on the potential misalignment between the current
payment rate and the cost of providing hospice, and the feasibility of rebasing the payment system
using the current available administrative data.
9.2.2 How the Routine Home Care Base Payment was Originally Set
It is CMS’ intent to ensure that reimbursement rates under the Hospice benefit align as closely as
possible with the average costs hospices incur when efficiently providing covered services to
beneficiaries. For the purposes of determining an appropriate reimbursement rate, CMS originally
established four levels of care: Routine Home Care, Continuous Home Care, Respite Care and
General Inpatient Care. In recent years, an annual payment rate update has been calculated for each of
these levels of care and providers are subsequently reimbursed according to the level of care provided
to hospice beneficiaries. This section of the document describes how the reimbursement rate for the
Routine Home Care level of care was originally calculated, beginning with the 1983 Notice of
Proposed Rule Making. Much of the material in this section comes directly from the referenced
documents.
Routine Home Care (RHC) is defined as a basic level of care under the Hospice benefit, where a
beneficiary receives hospice care but remains at home. With this level of care, hospice providers are
reimbursed by day regardless of the volume or intensity of services provided to a beneficiary on any
given day. At this level of care it is anticipated that there will be days when a beneficiary does not
require any services, as well as days when a beneficiary requires several visits by the hospice
provider.
Paying the average cost for every day of RHC permits hospices to provide needed care in the most
efficient and convenient method possible without the need to deal with the various coverage and
payment rules that would be required if a more detailed and service-oriented payment system were
implemented.

Medicare Hospice Payment Reform: Hospice Study Technical Report HHSM-500-2005-00018I
Abt Associates Inc. 9. Reform Options ▌pg. 53
RHC Payment Rate Determination—1983 Final Rule
The 1983 NPRM was revised and updated prior to public release in the Federal Register as a final
rule.14
In the final rule, average cost per visit estimates for nursing, home health, and social
service/therapy visits were recalculated based on the 1982 cost data from the Hospice demonstration
project. Average visits per day for each of these three service components were also recalculated to
reflect more recent data, but limited to include only utilization that occurred within the first 210 days
of a patients’ stay. Other changes that were made to the NPRM are as follows:
1. A cost component was added to represent the cost of respite care delivered in the home.
2. The hospice interdisciplinary team management cost was recalculated using the 1982 hospice
demonstration project data and was allocated over the average 70 day length of stay seen in
the data.
3. The proposed drug, supplies and equipment cost components were adjusted to reflect
inflation that occurred in 1982.
4. To account for inflation, a market basket index was implemented and developed from the
price of goods and services purchased by home health agencies.
5. A cost component was added to represent hospital outpatient costs for services such as
palliative radiation and chemotherapy. This component was determined by estimating the
average daily cost of these services based on a sample of Medicare patients who died from
cancer in 1980, but inflated for costs in 1984.
The 1983 proposed and final payment rates for RHC were determined from data obtained from the
Medicare hospice demonstration project. In calculating these rates, CMS relied on data for the
following cost components: kinds of services furnished by hospices, the cost of these services, how
often these services were rendered to beneficiaries, overhead costs (e.g. maintenance, depreciation,
general accounting, etc.) and other administrative costs (e.g. nursing or home health services). Table
20 displays the final components of the RHC base payment rate.
Table 20: RHC Rate Determination for the 1983 Final Rule
RHC components 1983 Final Rule cost per day
Nursing care $16.25
Home health $12.74
Social services/therapy $3.23
Home respite $1.46
Interdisciplinary group $2.78
Drugs $1.18
Supplies $4.49
Equipment $1.13
Outpatient hospital therapies $2.99
14 48 FR 56020; December 16, 1983

HHSM-500-2005-00018I Medicare Hospice Payment Reform: Hospice Study Technical Report
pg. 54 ▌9. Reform Options Abt Associates Inc.
9.2.3 A Potential Method for Rebasing the Clinical Service Component of the Routine Home Care Rate
This section describes one approach to rebasing the labor portion of the RHC rate for hospice. It uses
a methodology similar to the one used to create the current RHC base payment rate (as described in
the previous section of this report). However, due to key limitations in the data that is currently
available, a number of assumptions have to be made. We conclude that using the approach discussed
in this section would cause the base payment rate to fall by $16.09. That is, using the Abt Trim
sample of cost reports and weighting the sample by the number of RHC days, the RHC base payment
rate in FY 2011 would fall from $146.63 to $130.54.
Summary of Methodology for Revising the Clinical Service Component of the RHC Payment
Rate
When the hospice benefit was created, the RHC base rate was set using nine different components of
cost as described in Section 9.2.2 (Table 20) of this chapter. The sum of the cost of all the
components equals the base payment rate for RHC as stated in the final rule. During the 1980s, there
were periodic rate adjustments and then starting in the early 1990’s there were yearly market basket
updates to account for inflation and other adjustments to the RHC base rate. The updates were not
completely based on trends in inflation. This has caused some misalignment with the payment rate
and the actual cost of providing services. Updating the rate using the methodology proposed in this
section could better align costs with payments.
Figure 13 shows how the daily payment rates for RHC changed from 1983 to 2008. The rates are
indexed to the 1983 rate (index = 1.00). In addition to the rates, the changes in the PPS hospital
market basket, (forecasted and actual) are shown relative to their value in 1983 (index = 1.00).
Additionally, the index value for 2008 is listed next to each respective series. Through 2008, the
increase in the RHC rate was 18.7% higher than the forecasted market basket for hospitals and 63.1%
higher than the actual market basket for hospitals.

Medicare Hospice Payment Reform: Hospice Study Technical Report HHSM-500-2005-00018I
Abt Associates Inc. 9. Reform Options ▌pg. 55
Figure 13: Annual Trends in RHC Rates and Hospital Market Basket Updates (1983–2008)
Based on Figure 13, the current RHC rate is not aligned with changes to inflation that have occurred
since 1983. It is not clear if the increase in the RHC rate reflects real growth in the cost of providing
RHC in addition to the nominal growth that is reflected in the market basket.
The remainder of this report describes an approach to rebasing that attempts to improve the alignment
between the cost of providing RHC and the payment that CMS provides. The approach proposed
would rebase the three labor components (nursing, home health, social services/therapy) that
currently make up the RHC rate. These components comprise 69.7% of the original base payment
rate.15
The original RHC rate was set at $46.25. The FY 2011 rate for RHC was $146.63, meaning the
original rate increased by a factor of 3.17.16
This implies that each of the components of the original
rate would have also increased by a factor of 3.17. However, the mix of services and intensity may
15 At a later time, the components for the remaining 30.3% of the original base payment rate could be
adjusted using other data. Unfortunately, it is unlikely that cost reports and claims by themselves could
currently be used to rebase the non-labor components of the rate as they do not contain very detailed
information on the non-labor components.
16 3.17 = ($146.63/$46.25)

HHSM-500-2005-00018I Medicare Hospice Payment Reform: Hospice Study Technical Report
pg. 56 ▌9. Reform Options Abt Associates Inc.
have shifted over time so the implied increase of an individual component may not realistically
describe the actual increase.
One approach to rebase the RHC base payment rate would be to use more recent cost reports and
claims as follows. Each of the following steps would be taken for each hospice in the sample of
hospices used for rebasing.
1. Determine the costs (from the cost report) associated with each clinical service component
(e.g., nursing, home health aide and social service/therapy) and divide by the total number of
minutes of care provided by that discipline during the time period of the cost report.17
2. Divide the total number of RHC minutes for each clinical service component by the total
number of RHC days. Both pieces of information would be found on the claim and would
only correspond to hospice services that matched to the time period of the cost report.
3. Multiply the result in Step 1 by the result in Step 2. This produces the average cost of each
clinical service component (e.g., nursing, home health aide and social service/therapy) per
RHC day for a particular hospice.
4. Step 3 produces an average for each hospice. Those averages would then be averaged across
the results from all other hospices in order to determine an overall average cost per RHC day
for each clinical service component. That overall average cost could then be substituted for
the corresponding component that currently comprises the RHC base payment rate.
Detailed Methodology for Revising the Clinical Service Component of the RHC Payment Rate
This section reviews the methodology for revising the RHC payment rate in more detail. Limitations
for each step and potential solutions for addressing those limitations are also reviewed.
Rebasing would be based on a sample of freestanding and facility based hospices with a
fiscal year start date between October 1, 2010 and December 31st, 2011 and end date
during 2011. This sample of hospices includes 2,717 cost reports from 2,717 providers
which matched to claims.18
2,473 hospices contained usable information (costs and/or
minutes for skilled nursing or home health aides were not equal to 0). After applying the
Abt Trim, there were 2,140 hospices remaining.19
17 This approach computes the total of minutes (for Medicare only) and the total of costs (Medicare and non-
Medicare costs are combined on the cost report) looking across all levels of care. It does not focus solely on
RHC. However, it is important to note that on the cost report, costs are reported across all levels of care. On
the claims, minutes are reported for all levels of care EXCEPT GIP. This approach is conservative,
creating an overestimate of the actual average cost per minute of a discipline because it includes GIP costs
but no GIP minutes.
18 This sample was pulled from HCRIS data in January 2013.
19 The Abt Trim was applied to reduce the impact of outliers in the analysis. The Abt Trim makes the
following exclusions
1. Cost reports with period less than 10 months or greater than 14 months.
2. Cost reports with missing information or negative reported values for total costs or payments.
3. Providers in the highest and lowest percentile (1% and 99%) in costs per days across all levels of care.

Medicare Hospice Payment Reform: Hospice Study Technical Report HHSM-500-2005-00018I
Abt Associates Inc. 9. Reform Options ▌pg. 57
In 2011, according to claims data, there were 3,585 hospices that provided 82,905,754
RHC days. The sample of usable costs reports captures 2,473 hospices (69.0% of all
hospices) that provided 65,290,279 RHC days (78.8% of RHC Days) in 2011. The
sample of cost reports we use in rebasing (usable cost reports that are in the Abt Trim)
captures 2,140 hospices (59.7% of all hospices) that provided 60,603,864 RHC days
(73.1% of RHC days) in 2011. 20
Data on hospice days (from the claims) that fall on or between each cost report’s fiscal
year beginning and end date are merged with the cost report data. Hospice days that are
outside of the beginning and end date are not included in rebasing.
Total minutes of care by discipline (from the claims) are added together for each
hospice.21
The data is limited in that it does not provide information about the minutes of
care when the level of care is GIP. Therefore this approach is underestimating the total
minutes of care by discipline that a hospice provides. The cost reports include costs
accumulated from GIP, but the minutes (claims) data does not include information
associated with GIP.
For each hospice in the sample, a number of different variables are created in order to
carry out rebasing. The most pertinent variables are discussed below.
Cost of a discipline (e.g. nursing) per minute.22,23
4. Top and bottom 5% of provider margins.
5. Providers were excluded if the log payment to cost ratio was greater than the 90th
(or less than the 10th
)
percentile of this value across all providers plus (minus) 1.5 times the range between the 10th
and 90th
percentiles of this log ratio.
20 Of those 2,140 hospices: 1,623 (75.8%) are freestanding, 286 (13.4%) are home health agency based, 186
(8.7%) are hospital based, 2 (0.1%) are SNF based, and 43 (2.1%) are not classified. Information was
obtained from the Provider of Services file. In the full sample of hospices (n= 3,585): 2,350 (65.5%) are
freestanding, 563 (15.7%) are home health agency based, 490 (13.7%) are hospital based, 17 (0.5%) are
SNF based, and 165 (4.6%) are not classified.
21 Note, we censor observations that report having more than 1,440 minutes (24 hours) of a single discipline
on a single day of hospice. That is we impose that no observation can have more than 1,440 minutes of care
for a single discipline in a single day. Using claims for 2010 and 2011, there were 163,688,904 days of
hospice reported across all levels of care. 19,453 days (across all levels of care) had at least 1,440 minutes
of aide time reported. 1,341 days (across all levels of care) had at least 1,440 minutes of medical social
services reported. 163,046 days (across all levels of care) had at least 1,440 minutes of skilled nursing
service reported. 3 days (across all levels of care) had at least 1,440 minutes of occupational therapy
services reported. 6 days (across all levels of care) had at least 1,440 minutes of occupational therapy
services reported. 0 days (across all levels of care) had at least 1,440 minutes of speech therapy services
reported. Censoring observations causes the base payment rate to be approximately 10 cents higher than if
observations are not censored.
22 As noted earlier, the cost will includes costs from all LOCs but the minutes do not include information
from the GIP LOC. This will cause us to overestimate the cost per minute of each discipline.
23 Costs in the cost report are total costs, not Medicare costs. This will also cause us to overestimate the cost
per minute of each discipline. On average over 90% of all days referenced on the cost report are Medicare
days. Presumably, a similar proportion of costs would also be Medicare costs. In 2011, 95% of providers
reported at least three quarters of all their hospice days were for Medicare beneficiaries. Roughly 75% of

HHSM-500-2005-00018I Medicare Hospice Payment Reform: Hospice Study Technical Report
pg. 58 ▌9. Reform Options Abt Associates Inc.
The ratio of the number of RHC minutes per discipline over the number of RHC
days.
We multiply the cost per minute for each discipline by the RHC minutes for each
discipline per RHC day to compute the cost of a discipline per RHC day.
We then take a weighted average (using the number of RHC days a hospice provides as
the weight) of the cost per discipline per RHC day across all of the hospices in the sample
to compute a rebased cost per discipline per RHC day that could be substituted into the
RHC base rate.
Results from Rebasing the Clinical Service Component of the RHC Rate
We present results using a Day Weighted approach. The Day Weighted approach takes a weighted
average of the clinical service component costs across all hospices in the sample. The weight that is
used is the number of RHC days the hospice provided during the period of time their cost report
corresponds to. This way, larger hospices (who provide a larger portion of hospice services) are
having a greater weight on the average labor cost per RHC day. Table 21 compares the cost per day
of each component in the 1983 final rule versus the cost per day calculated from the approach
described in the previous sections of this report. Non-labor components (home respite,
interdisciplinary group, drugs, supplies, equipment, and outpatient hospital therapies) are costed by
the implied payment growth seen in the RHC base payment rate from the 1983 final rule to the FY
2011 rate. As described earlier, the overall rate grew by a factor of 3.17 during this time and this
growth rate was applied to the individual non-labor components.
Table 21: Comparison of Cost Components of the RHC Rate from 1983 vs. 2011
RHC components
1983 Final Rule
cost per day
FY 2011 Actual Implied
Payment Amounts
FY 2011 Day
weighted rate
Nursing care $16.25 $51.52 $56.54
Home health $12.74 $40.39 $19.24
Social services/therapy $3.23 $10.24 $10.29
Home respite $1.46 $4.63 $4.63
Interdisciplinary group $2.78 $8.81 $8.81
Drugs $1.18 $3.74 $3.74
Supplies $4.49 $14.23 $14.23
Equipment $1.13 $3.58 $3.58
Outpatient hospital therapies $2.99 $9.48 $9.48
RHC total $46.25 146.63 $130.54
9.2.4 Conclusion
The key results from the approach to rebasing the labor portion of the RHC rate are as follows:
The RHC base payment rate for 2011 was $146.63. The rebased RHC rate in 2011 would have
been $130.54 if the Abt Trim sample using the Day Weighted approach had been used.
providers reported at least 90% of all their hospice days were for Medicare beneficiaries. Excluding cost
reports with a high percentage of non-Medicare days (e.g. >= 20%) and also reducing the costs by a factor
equal to the ratio of Medicare days over total days could serve as one way to lower the aforementioned
overestimate.

Medicare Hospice Payment Reform: Hospice Study Technical Report HHSM-500-2005-00018I
Abt Associates Inc. Appendix A: Descriptive Statistics on Hospice Utilization for 2011 ▌pg. 59
Appendix A: Descriptive Statistics on Hospice Utilization for 2011
Data in the table below come from several Medicare data sources, including hospice claims, the
Medicare enrollment database, a provider-level data file, and the area resource file.
We constructed the dataset by identifying beneficiaries who received any hospice service in calendar
2011 and included all of their hospice episodes that occurred in calendar year 2011. A ―hospice
episode‖ was defined as contiguous days in the hospice program. Approximately 17% of the hospice
episodes began prior to 1/1/2011. For these episodes, we included all hospice days that were part of
the contiguous hospice stay (that is, days prior to 1/1/2011 that were part of the hospice episode). We
excluded any episodes that do not include at least one claim in 2011, unless otherwise noted. In all,
there were 129,253,613 hospice days across 1,312,819 hospice episodes among 1,220,680 unique
beneficiaries.
For the site of service stratification: (1) episode-level summary data was defined using all episodes
where at least one claim in the episode indicated the corresponding site of service; and (2)
beneficiary-level summary data was defined using all beneficiaries where at least one claim (across
all episodes) indicated the corresponding site of service. For variables that can vary within a hospice
episode (e.g., level of care, visits, and payment), only days that matched the specific site of service
are included in the tabulation.
For discharge status, the ―died in hospice‖ category includes beneficiaries who were enrolled in
hospice as of 12/31/2011 and died sometime in 2012 (this occurred 14%-16% across the four
columns). We note that some of these beneficiaries may have subsequently been discharged from
hospice in 2012 before dying. Additionally, ―Average number of days until death‖ excludes the small
number of beneficiaries whose reported date of death pre-dated their last hospice day.
The ―Visits per day per episode‖ results reflect the average visits per day within each episode,
averaged across all episodes. Similarly, the ―Spending per day per episode‖ results reflect the
average spending per day within each episode, averaged across all episodes.

HHSM-500-2005-00018I Medicare Hospice Payment Reform: Hospice Study Technical Report
pg. 60 ▌ Appendix A: Descriptive Statistics on Hospice Utilization for 2011 Abt Associates Inc.
Table A.1: Descriptive Statistics on Hospice Utilization for 2011
Data item All episodes Patient home Nursing home Assisted living
Beneficiary demographics
Age as of 1st day of episode
<65 5.50% 6.62% 3.89% 1.41%
65–<75 16.14% 19.57% 10.40% 5.62%
75–<85 31.02% 32.84% 28.41% 24.72%
85+ 47.34% 40.96% 57.30% 68.25%
Gender
Male 40.31% 43.85% 32.91% 30.02%
Female 59.69% 56.15% 67.09% 69.98%
Race/ethnicity
White, non-Hispanic 87.44% 85.86% 88.39% 94.85%
African-American, non-Hispanic 8.35% 9.15% 8.27% 2.32%
Hispanic 1.95% 2.33% 1.42% 1.55%
Other, non-Hispanic 2.26% 2.67% 1.91% 1.28%
Disease and comorbidities
Principal diagnosis on the first day of the episode
―Lung & other chest cavity cancer‖ 7.93% 10.70% 3.68% 2.60%
―Colorectal cancer‖ 2.67% 3.49% 1.54% 1.17%
―Alzheimer’s‖ 5.00% 4.12% 7.56% 8.82%
―Non-Alzheimer’s dementia‖ 11.30% 7.64% 19.01% 20.53%
―Cerebrovascular accident‖ 4.77% 3.16% 5.14% 3.04%
―Congestive heart failure‖ 7.53% 8.06% 6.96% 7.45%
―Other heart disease‖ 5.46% 5.88% 4.60% 5.76%
―Non-infectious respiratory disease‖ 6.74% 8.07% 5.44% 4.72%
―Failure to thrive—adult‖ 6.36% 5.30% 9.36% 10.05%
―Debility NOS‖ 11.99% 10.36% 16.28% 20.72%
―Parkinson & other degenerative‖ 2.20% 2.39% 2.59% 2.44%
―Pneumonias and other lung diseases‖ 2.34% 1.50% 1.20% 0.86%
―HIV/AIDS‖ 0.07% 0.08% 0.07% 0.03%
―Chronic liver disease‖ 1.17% 1.29% 0.78% 0.40%
―Chronic kidney disease‖ 2.37% 1.87% 2.19% 1.13%

Medicare Hospice Payment Reform: Hospice Study Technical Report HHSM-500-2005-00018I
Abt Associates Inc. Appendix A: Descriptive Statistics on Hospice Utilization for 2011 ▌pg. 61
Data item All episodes Patient home Nursing home Assisted living
Other 22.09% 26.08% 13.61% 10.29%
Principal diagnosis on the first day of the episode was cancer vs. non-cancer
Cancer 28.66% 37.47% 15.07% 11.51%
Non-cancer 71.34% 62.53% 84.93% 88.49%
Comorbidities per episode (highest number of comorbidities over the time period examined)
1 diagnosis 75.42% 73.11% 77.13% 77.67%
2 diagnoses 7.77% 8.27% 7.37% 7.68%
3 diagnoses 4.61% 5.05% 4.05% 4.27%
4+ diagnoses 12.20% 13.57% 11.45% 10.38%
Medicare/Medicaid Dual eligibility status
Dual eligible 7.28% 5.48% 16.00% 4.92%
Not dual-eligible 92.72% 94.52% 84.00% 95.08%
Medicare Advantage enrollment status
FFS enrollee (one month prior to election) 76.19% 73.65% 81.46% 74.52%
MA enrollee (one month prior to election) 23.81% 26.35% 18.54% 25.48%
Hospice provider characteristics as of 1st day of episode
Tax status
For-profit 43.94% 42.69% 52.66% 54.04%
Non-profit 46.17% 47.43% 37.02% 37.40%
Government 9.89% 9.88% 10.32% 8.56%
Ownership status
Freestanding 75.17% 73.01% 79.93% 81.09%
Hospital 10.17% 10.82% 7.76% 5.99%
SNF 0.18% 0.09% 0.45% 0.10%
HHA 14.48% 16.07% 11.87% 12.82%
Census regions
Northeast 15.61% 14.56% 18.06% 10.53%
Midwest 23.34% 19.50% 32.37% 20.44%
South 41.43% 43.75% 35.41% 36.04%
West 19.61% 22.19% 14.16% 32.98%
Census divisions
New England 4.51% 3.99% 6.24% 2.52%

HHSM-500-2005-00018I Medicare Hospice Payment Reform: Hospice Study Technical Report
pg. 62 ▌ Appendix A: Descriptive Statistics on Hospice Utilization for 2011 Abt Associates Inc.
Data item All episodes Patient home Nursing home Assisted living
Middle Atlantic 11.49% 11.20% 11.84% 8.47%
South Atlantic 22.37% 22.88% 15.71% 25.47%
East North Central 16.20% 13.66% 20.02% 15.61%
East South Central 6.73% 8.14% 5.22% 2.33%
West North Central 7.20% 5.95% 12.33% 4.90%
West South Central 11.84% 11.92% 14.48% 7.65%
Mountain 7.55% 7.75% 5.43% 14.61%
Pacific 12.11% 14.51% 8.74% 18.42%
Rural/urban status
Urban 87.51% 85.76% 87.24% 92.06%
Rural 12.49% 14.24% 12.76% 7.94%
Hospice level of care (LOC)
Received any care (not mutually exclusive)
Any RHC 86.45% 99.39% 92.81% 99.38%
Any CHC 6.18% 6.82% 5.14% 10.69%
Any GIP 22.27% 0.56% 6.88% 0.40%
Any IRC 3.40% 0.61% 6.52% 0.12%
LOC combinations (mutually exclusive)
RHC only 69.70% 92.14% 82.06% 88.85%
GIP only 12.63% 0.00% 3.26% 0.00%
RHC/CHC 4.82% 6.14% 4.53% 10.05%
RHC/GIP 7.83% 0.46% 3.10% 0.34%
Other 5.03% 1.26% 7.05% 0.75%
Hospice Benefit Periods & Days
Number of benefit periods per beneficiary (for all beneficiaries who had at a hospice episode in 2011)
1 benefit period 60.65% 55.54% 50.59% 37.70%
2 benefit periods 11.70% 13.99% 12.52% 14.29%
3 benefit periods 5.11% 5.86% 6.07% 7.36%
4+ benefit periods 22.53% 24.60% 30.81% 40.64%
Number of days per episode among decedents
Average number of TOTAL days per episode 81.24 81.47 88.46 120.8
Average number of RHC days per episode 79.18 81.05 87.34 119.97

Medicare Hospice Payment Reform: Hospice Study Technical Report HHSM-500-2005-00018I
Abt Associates Inc. Appendix A: Descriptive Statistics on Hospice Utilization for 2011 ▌pg. 63
Data item All episodes Patient home Nursing home Assisted living
Average number of CHC days per episode 0.34 0.37 0.26 0.8
Average number of GIP days per episode 1.51 0.02 0.46 0.02
Average number of IRC days per episode 0.21 0.03 0.4 0.01
Median number of TOTAL days per episode 20 27 20 48
Median number of RHC days per episode 18 26 19 48
Median number of CHC days per episode 0 0 0 0
Median number of GIP days per episode 0 0 0 0
Median number of IRC days per episode 0 0 0 0
Number of days per episode (categories), not restricted to decedents
1–3 days 13.52% 9.54% 12.92% 6.38%
4–7 days 13.78% 10.96% 14.63% 7.81%
8–10 days 6.4% 6.06% 6.49% 4.41%
11–14 days 5.88% 6.22% 5.52% 4.48%
15–30 days 13.1% 15.37% 12.48% 12.18%
31–60 days 11.87% 14.57% 10.97% 13.60%
61–90 days 7.61% 8.9% 7.25% 9.83%
91–180 days 11.58% 12.88% 11.70% 16.63%
181+ days 16.26% 15.5% 18.04% 24.69%
Hospice Discharge Status at beneficiary level
Died in hospice 82.8% 78.9% 79.5% 72.1%
Alive and in hospice as of 12/31/2011 7.6% 8.1% 9.0% 13.3%
Discharged from hospice—Alive after discharge 4.2% 5.2% 4.9% 6.6%
Discharged from hospice—Died after discharge 5.4% 7.9% 6.6% 8.0%
Average number of days until death 136 127 152 160
Hospice Visits
Visits per episode
Average number of PART A VISITS 72.38 55.79 70.51 92.52
Average number of PART A PHYSICIAN/NP VISITS 1.18 0.57 0.38 0.83
Average number of PART A PER DIEM VISITS 71.20 55.21 70.13 91.69
Average number of PART A PER DIEM SKILLED NURSING
VISITS
30.53 23.65 24.43 34.66

HHSM-500-2005-00018I Medicare Hospice Payment Reform: Hospice Study Technical Report
pg. 64 ▌ Appendix A: Descriptive Statistics on Hospice Utilization for 2011 Abt Associates Inc.
Data item All episodes Patient home Nursing home Assisted living
Average number of PART A PER DIEM HOME HEALTH AIDE
VISITS
34.84 26.31 39.4 49.19
Average number of PART A PER DIEM SOCIAL SERVICE
VISITS
5.73 5.15 6.25 7.75
Average number of PART A PER DIEM THERAPY VISITS
(physical, speech, occupational)
0.09 0.11 0.06 0.09
Median number of PART A VISITS 21 20 20 40
Median number of PART A PHYSICIAN/NP VISITS 0 0 0 0
Median number of PART A PER DIEM VISITS 20 20 20 40
Median number of PART A PER DIEM SKILLED NURSING
VISITS
11 11 9 18
Median number of PART A PER DIEM HOME HEALTH AIDE
VISITS
4 3 7 15
Median number of PART A PER DIEM SOCIAL SERVICE
VISITS
2 2 2 4
Median number of PART A PER DIEM THERAPY VISITS
(physical, speech, occupational)
0 0 0 0
Visits per day per episode
Average number of PART A VISITS 1.56 0.82 0.90 0.86
Average number of PART A PHYSICIAN/NP VISITS 0.06 0.01 0.01 0.01
Average number of PART A PER DIEM VISITS 1.5 0.81 0.89 0.85
Average number of PART A PER DIEM SKILLED NURSING
VISITS
0.89 0.47 0.45 0.44
Average number of PART A PER DIEM HOME HEALTH AIDE
VISITS
0.48 0.24 0.32 0.31
Average number of PART A PER DIEM SOCIAL SERVICE
VISITS
0.13 0.1 0.12 0.1
Average number of PART A PER DIEM THERAPY VISITS
(physical, speech, occupational)
0 0 0 0
Median number of PART A VISITS 0.76 0.67 0.75 0.71
Median number of PART A PHYSICIAN/NP VISITS 0 0 0 0
Median number of PART A PER DIEM VISITS 0.73 0.67 0.75 0.7

Medicare Hospice Payment Reform: Hospice Study Technical Report HHSM-500-2005-00018I
Abt Associates Inc. Appendix A: Descriptive Statistics on Hospice Utilization for 2011 ▌pg. 65
Data item All episodes Patient home Nursing home Assisted living
Median number of PART A PER DIEM SKILLED NURSING
VISITS
0.33 0.32 0.3 0.29
Median number of PART A PER DIEM HOME HEALTH AIDE
VISITS
0.25 0.19 0.28 0.28
Median number of PART A PER DIEM SOCIAL SERVICE
VISITS
0.07 0.06 0.07 0.06
Median number of PART A PER DIEM THERAPY VISITS
(physical, speech, occupational)
0 0 0 0

HHSM-500-2005-00018I Medicare Hospice Payment Reform: Hospice Study Technical Report
pg. 66 ▌ Appendix A: Descriptive Statistics on Hospice Utilization for 2011 Abt Associates Inc.
Figure A.1: Average Length of Hospice Stay: Overall and by Site of Service
Source: 2011 Medicare hospice claims.

Medicare Hospice Payment Reform: Hospice Study Technical Report HHSM-500-2005-00018I
Abt Associates Inc. Appendix A: Descriptive Statistics on Hospice Utilization for 2011 ▌pg. 67
Figure A.2: Discharge Status of Hospice Beneficiary: Overall and by Site of Service
Source: 2011 Medicare hospice claims.

HHSM-500-2005-00018I Medicare Hospice Payment Reform: Hospice Study Technical Report
pg. 68 ▌ Appendix A: Descriptive Statistics on Hospice Utilization for 2011 Abt Associates Inc.
Figure A.3: Average Number of Part A Visits During Hospice Stay: Overall and by Site
Source: 2011 Medicare hospice claims.

Medicare Hospice Payment Reform: Hospice Study Technical Report HHSM-500-2005-00018I
Abt Associates Inc. Appendix B: Average Resource Use for Routine Home Care Days in 2011 ▌pg. 69
Appendix B: Average Resource Use for Routine Home Care Days in 2011
Figure B.1: Average Resource Utilization for Routine Home Care Days in 2011 Based on when the Day Fell within a Beneficiary’s
Lifetime Length of Stay in Hospice
Note: ―Day‖ represents a specific day within a beneficiary’s lifetime length of stay in hospice. For example, when a beneficiary enrolls in hospice for the first time,
that would be considered Day 1. Each subsequent day in hospice would be counted as an additional day (Day 2, Day 3, and so on). Since Day represents where
a person is in their lifetime length of, if a beneficiary leaves the hospice benefit on his 90th
day and re-enrolls 2 weeks later, the first day of re-enrollment would
correspond to the 91st day. The figure is censored at 365 days so that any day that exceeded a beneficiary’s 365
th day in hospice was counted as occurring on the
365th
day. If a beneficiary’s lifetime length of hospice was 7 days or less, each of those days would only contribute to the information on the far right hand side of
the graph that represents the 6 days before death. Therefore, Day 1 represents individuals who had a length of stay of at least 8 days. Day 2 represents
individuals who had a length of stay of at least 9 days, and so on. If a beneficiary was still enrolled in hospice as of December 31, 2011, it was assumed that
beneficiary was not in their last 6 days before death and therefore all their days would be represented on the left part of the figure. Only resource use on Routine
Home Care days that occurred in 2011 are included in this figure. Data markers are only shown for days 1, 2, and 3 and each of the last 6 days before death. The
rest of the points in the figure do not have markers and are simply connected by a smoothed line.


Medicare Hospice Payment Reform: Hospice Study Technical Report HHSM-500-2005-00018I
Abt Associates Inc. References ▌pg. 71
References
Albain KS, Crowley JJ, LeBlanc M, Livingston RB. Survival determinants in extensive-stage non-
small-cell lung cancer: the Southwest Oncology Group experience. J Clin Oncol. 1991 Sep
1991;9(9):1618–1626.
Bain KT, Maxwell TL, Strassels SA, Whellan DJ. Hospice use among patients with heart failure. Am
Heart J. Jul 2009;158(1):118–125.
Carlson MD, Herrin J, Du Q, et al. Impact of hospice disenrollment on health care use and medicare
expenditures for patients with cancer. J Clin Oncol. Oct 1 2010;28(28):4371–4375.
Medicare Payment Advisory Commission. Report to Congress: Medicare Payment Policy March
2011. 2011; http://www.medpac.gov/chapters/mar11_ch11.pdf. Accessed March 25 2012.
Kutner JS, Meyer SA, Beaty BL, Kassner CT, Nowels DE, Beehler C. Outcomes and characteristics
of patients discharged alive from hospice. J Am Geriatr Soc. Aug 2004;52(8):1337–1342.
Taylor DH, Jr., Steinhauser K, Tulsky JA, Rattliff J, Van Houtven CH. Characterizing hospice
discharge patterns in a nationally representative sample of the elderly, 1993–2000. Am J Hosp Palliat
Care. Feb-Mar 2008;25(1):9–15.
U.S. National Archives and Records Administration. 2005. Code of Federal Regulations. Title 42.
Hospice Care.
Related Documents