MEDICARE ADVANTAGE PAYMENT METHODOLOGY AND AREA RATES for January – December 2017 June 2016

Welcome message from author
This document is posted to help you gain knowledge. Please leave a comment to let me know what you think about it! Share it to your friends and learn new things together.
Transcript
MEDICARE ADVANTAGEPAYMENT
METHODOLOGY AND AREA RATES
for
January – December 2017
June 2016
Table of Contents
Medicare Advantage: Overview for 2017......................................................................................2Medicare Advantage Payment Rates: Background.........................................................................6The CMS-HCC Risk-Adjustment Model........................................................................................9Clinical Features of the CMS-HCC Model...................................................................................11Medicare Advantage Payment Methodology................................................................................12Table 1: CMS-HCC Model Relative Factors for Community and Institutional Beneficiaries......14Table 2: Disease Hierarchies for the Revised CMS-HCC Model.................................................21Table 3: CMS-HCC Model Relative Factors for Aged and Disabled New Enrollees...................22Table 4: Medicare Advantage Monthly Capitation Rates for 2017 for All Plans Except PACE Plans...............................................................................................................................................24
2
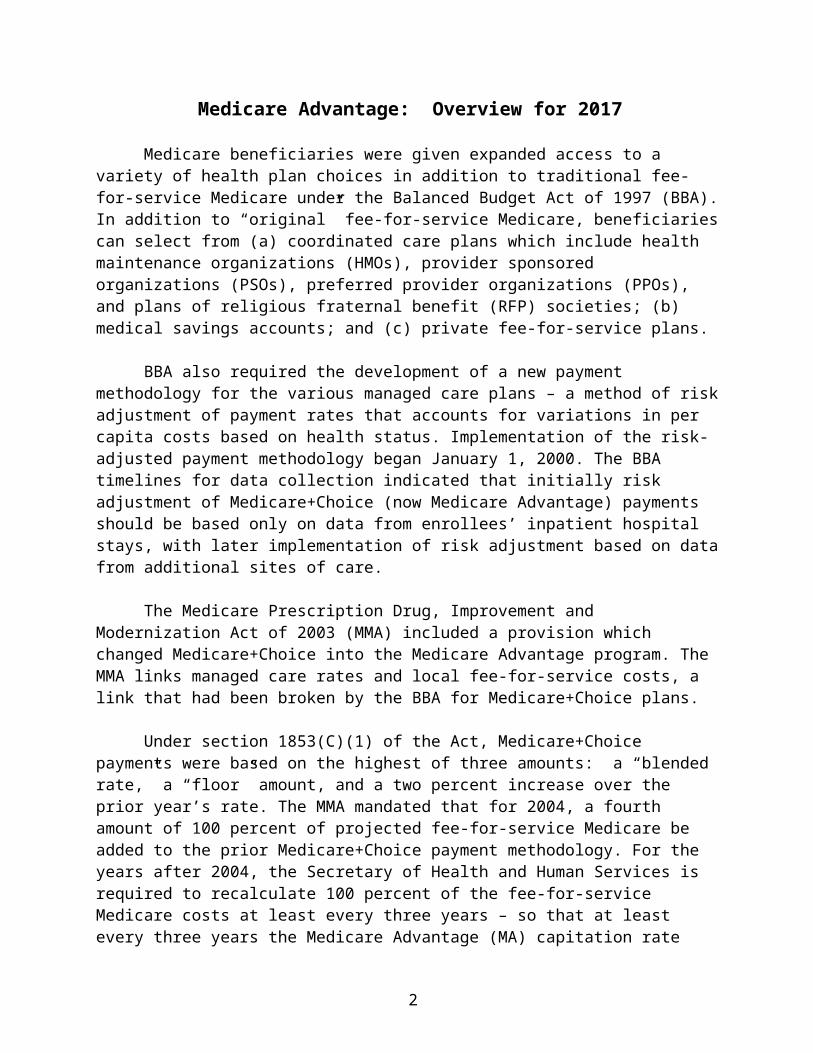
Medicare Advantage: Overview for 2017
Medicare beneficiaries were given expanded access to a variety of health plan choices in addition to traditional fee-for-service Medicare under the Balanced Budget Act of 1997 (BBA). In addition to “original” fee-for-service Medicare, beneficiaries can select from (a) coordinated care plans which include health maintenance organizations (HMOs), provider sponsored organizations (PSOs), preferred provider organizations (PPOs), and plans of religious fraternal benefit (RFP) societies; (b) medical savings accounts; and (c) private fee-for-service plans.
BBA also required the development of a new payment methodology for the various managed care plans – a method of risk adjustment of payment rates that accounts for variations in per capita costs based on health status. Implementation of the risk-adjusted payment methodology began January 1, 2000. The BBA timelines for data collection indicated that initially risk adjustment of Medicare+Choice (now Medicare Advantage) payments should be based only on data from enrollees’ inpatient hospital stays, with later implementation of risk adjustment based on data from additional sites of care.
The Medicare Prescription Drug, Improvement and Modernization Act of 2003 (MMA) included a provision which changed Medicare+Choice into the Medicare Advantage program. The MMA links managed care rates and local fee-for-service costs, a link that had been broken by the BBA for Medicare+Choice plans.
Under section 1853(C)(1) of the Act, Medicare+Choice payments were based on the highest of three amounts: a “blended rate,” a “floor” amount, and a two percent increase over the prior year’s rate. The MMA mandated that for 2004, a fourth amount of 100 percent of projected fee-for-service Medicare be added to the prior Medicare+Choice payment methodology. For the years after 2004, the Secretary of Health and Human Services is required to recalculate 100 percent of the fee-for-service Medicare costs at least every three years – so that at least every three years the Medicare Advantage (MA) capitation rate will be the higher of the fee-for-service rate and the minimum increase rate. In addition, for 2004 and subsequent years, the MMA modified the minimum increase to be the larger of:
1) 102 percent of the previous year’s rate, or
2) An increase by the Medicare growth percentage over the previous year’s rate.
Section 5301 of the Deficit Reduction Act of 2005 (DRA) created a single rate book for calculating MA payments and applicable adjustments. Beginning in 2007, the statute requires that the previous year’s benchmarks be updated annually using the national per capita MA growth percentage. The DRA eliminated the two percent minimum update for all but the end stage renal disease (ESRD) MA rates.
In 2007, CMS moved to 100 percent of the MA payment rate based on risk-adjustment models – marking the completion of a seven-year transition from the prior demographic-based payment system to the risk-adjustment payment system. Risk adjustment ensures that plans are paid higher amounts for sicker beneficiaries. Beginning in 2009, CMS uses more recent fee-for-
2
service diagnosis and claims data to update the relative risk factors in the CMS-HCC model, which is used to produce risk scores for all Medicare beneficiaries. The revised model incorporates updates to the community and institutional components, as well as a new enrollee segment. This model uses enrollees’ demographics and medical conditions collected into 70 hierarchical condition categories (HCCs) to predict their costliness.
Health plans that participate in the Medicare Advantage program receive monthly capitation payments for each Medicare enrollee. Each capitated payment is the product of two general parts:
A base rate which reflects the payment if a Medicare Advantage enrollee has the health status of the national average beneficiary, and
A risk score which indicates how costly the enrollee is expected to be relative to the national average beneficiary.
The purpose of the risk scores is to adjust Medicare Advantage payments so that they accurately reflect how much each Medicare Advantage enrollee would be expected to cost.
CMS has implemented a number of changes in the Medicare Advantage payment methodology beginning in CY2012 as a result of payment changes enacted in the Affordable Care Act, including the following:
a new blended benchmark as the county rate; the new methodology used to derive the new blended benchmark county rates; identify the qualifying bonus counties; how to determine transitional phase-in periods; and the applicability of the star system in the rebates.
For each county, CMS sets the Medicare Advantage benchmark. A Medicare Advantage plan’s payment from Medicare is based on how its bid compares with the local benchmark, which represents the maximum amount Medicare will pay to a plan in a given area on behalf of a Medicare Advantage enrollee. The plan’s bid reflects its costs to provide the Part A and Part B benefit package for a beneficiary of average health status and includes plan administrative cost and profit. The local Medicare Advantage benchmark represents a bidding target and is set using statutory formulas and adjusted for the plan’s quality ranking. If a plan’s bid is above the benchmark, then the plan receives a payment equal to the benchmark and the enrollees have to pay a premium, along with the Part B premium, that equals the difference between the bid and the benchmark. If a plan’s bid is at the benchmark, then the payment equals the benchmark. If a plan’s bid is below the benchmark, the plan receives a payment equal to its bid plus a rebate. The rebate is a fixed percentage – 50, 65, or 70 percent, depending on the plan’s quality ranking – of the difference between the plan’s bid and the benchmark. Once the rebate dollars are determined, the plan must return the rebate to its enrollees in the form of supplemental benefits or lower premiums.
3
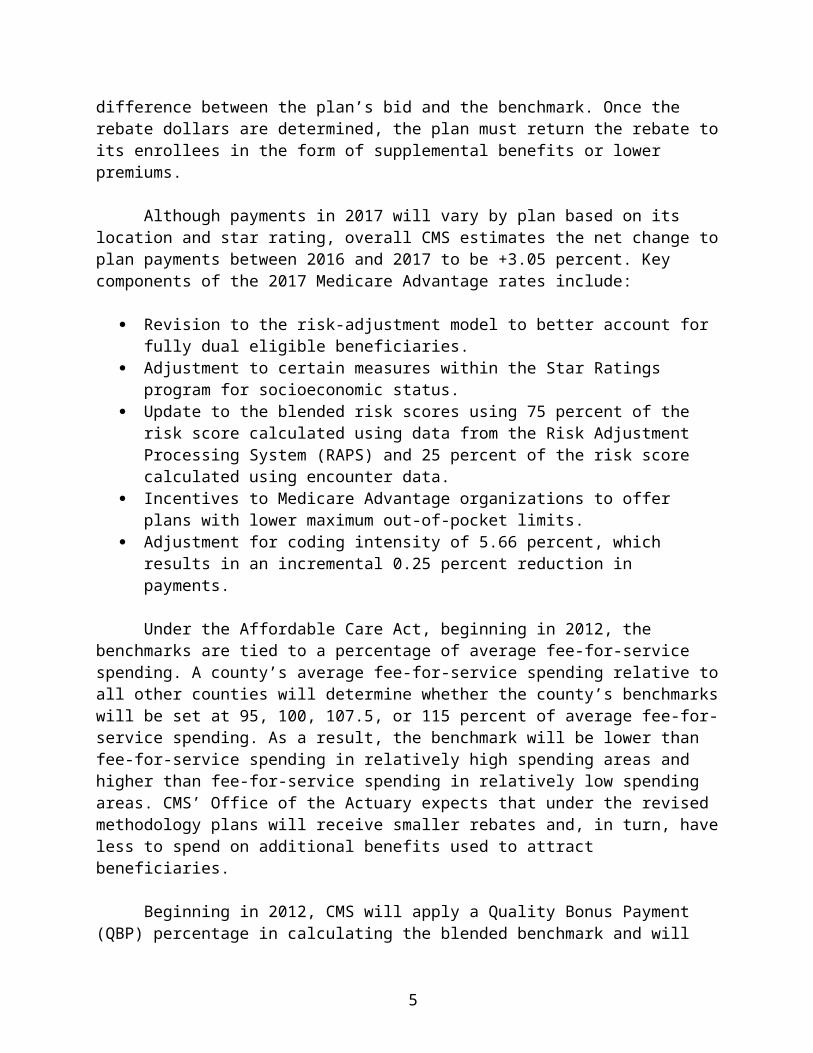
Although payments in 2017 will vary by plan based on its location and star rating, overall CMS estimates the net change to plan payments between 2016 and 2017 to be +3.05 percent. Key components of the 2017 Medicare Advantage rates include:
Revision to the risk-adjustment model to better account for fully dual eligible beneficiaries.
Adjustment to certain measures within the Star Ratings program for socioeconomic status. Update to the blended risk scores using 75 percent of the risk score calculated using data
from the Risk Adjustment Processing System (RAPS) and 25 percent of the risk score calculated using encounter data.
Incentives to Medicare Advantage organizations to offer plans with lower maximum out-of-pocket limits.
Adjustment for coding intensity of 5.66 percent, which results in an incremental 0.25 percent reduction in payments.
Under the Affordable Care Act, beginning in 2012, the benchmarks are tied to a percentage of average fee-for-service spending. A county’s average fee-for-service spending relative to all other counties will determine whether the county’s benchmarks will be set at 95, 100, 107.5, or 115 percent of average fee-for-service spending. As a result, the benchmark will be lower than fee-for-service spending in relatively high spending areas and higher than fee-for-service spending in relatively low spending areas. CMS’ Office of the Actuary expects that under the revised methodology plans will receive smaller rebates and, in turn, have less to spend on additional benefits used to attract beneficiaries.
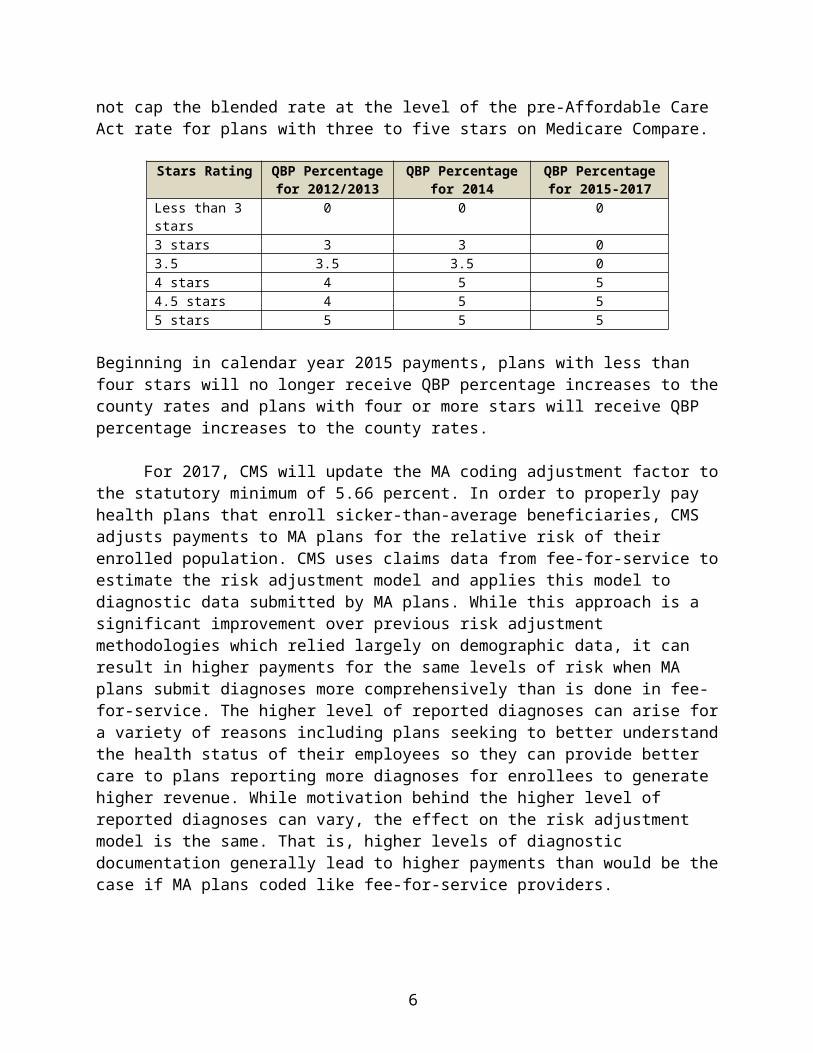
Beginning in 2012, CMS will apply a Quality Bonus Payment (QBP) percentage in calculating the blended benchmark and will not cap the blended rate at the level of the pre-Affordable Care Act rate for plans with three to five stars on Medicare Compare.
Stars Rating QBP Percentage for 2012/2013
QBP Percentage for 2014
QBP Percentage for 2015-2017
Less than 3 stars 0 0 03 stars 3 3 03.5 3.5 3.5 04 stars 4 5 54.5 stars 4 5 55 stars 5 5 5
Beginning in calendar year 2015 payments, plans with less than four stars will no longer receive QBP percentage increases to the county rates and plans with four or more stars will receive QBP percentage increases to the county rates.
For 2017, CMS will update the MA coding adjustment factor to the statutory minimum of 5.66 percent. In order to properly pay health plans that enroll sicker-than-average beneficiaries, CMS adjusts payments to MA plans for the relative risk of their enrolled population. CMS uses claims data from fee-for-service to estimate the risk adjustment model and applies this model to diagnostic data submitted by MA plans. While this approach is a significant improvement over previous risk adjustment methodologies which relied largely on demographic data, it can result in
4
higher payments for the same levels of risk when MA plans submit diagnoses more comprehensively than is done in fee-for-service. The higher level of reported diagnoses can arise for a variety of reasons including plans seeking to better understand the health status of their employees so they can provide better care to plans reporting more diagnoses for enrollees to generate higher revenue. While motivation behind the higher level of reported diagnoses can vary, the effect on the risk adjustment model is the same. That is, higher levels of diagnostic documentation generally lead to higher payments than would be the case if MA plans coded like fee-for-service providers.
As enrollment in MA grows, the imperative for CMS to adjust payments appropriately in response to greater coding intensity will grow. MA coding has the potential to threaten the solvency for the Hospital Insurance (HI) trust fund and lead to higher Part B premiums for all Medicare enrollees, not just MA enrollees. For example, a one percent increase in MA risk scores due to differential coding for 2017 would increase government payments to plans by about $2 billion. For this reason, CMS continues to monitor coding intensity closely and will utilize its authority to increase the coding intensity offset as appropriate.
5
Medicare Advantage Payment Rates: Background
Medicare managed healthcare options have been available to some Medicare beneficiaries since 1982 and Medicare has paid health plans a monthly per person county rate. The monthly per person, or “per capita,” county rates were determined under the Adjusted Average Per Capita Cost methodology (AAPCC).
AAPCCs are five-year moving averages of per beneficiary spending at the county level for fee-for-service Medicare. Because it was assumed that expenditures for enrollees in managed care would be lower due to care coordination efficiencies, the Medicare estimated fee-for-service costs were discounted by five percent. Separate AAPCCs were established for enrollees on the basis of age, sex, Medicaid eligibility, work status, and whether the individual was institutionalized. Medicare’s costs in paying claims for beneficiaries with end-stage renal disease (ESRD) were not considered in these county estimates. ESRD enrollees are handled on a statewide basis. The direct link between AAPCCs and payments created perceptions of geographic inequity as plans were more likely to serve counties with high AAPCCs and typically offered more comprehensive benefits than fee-for service Medicare or counties with lower rates.
BBA established a new payment methodology for HMOs and other plans under the Medicare+Choice program. This new methodology eliminated the direct link in the AAPCC method between managed care rates and local fee-for-service costs. Under the new methodology, the county rate was based on the greater of:
1) A blended local and national rate;
2) A minimum payment floor; or
3) A minimum two percent increase over the prior year’s rate, with the 1997 rate serving as the baseline.
MMA mandated that for 2004, a fourth amount of 100 percent of projected fee-for-service Medicare be added to the prior Medicare+Choice payment methodology. For the years after 2004, the Secretary of Health and Human Services is required to recalculate 100 percent of the fee-for-service Medicare costs at least every three years – so that at least every three years the MA capitation rate will be the higher of the fee-for-service rate and the minimum increase rate. In addition, for 2004 and subsequent years, MMA modified the minimum increase to be the larger of:
1) 102 percent of the previous year’s rate; or
2) An increase by the Medicare growth percentage over the previous year’s rate.
The county rates were used as the base rates for paying MA plans in 2004 and 2005. Beginning in 2006, however, the county rates were used to create benchmarks against which the plans will bid. Rates were set through competitive bid, rather than administered pricing. The benchmark for each plan was a weighted average of the county rates for the counties in the
6
plan’s service area. The weights were the projected enrollment from the counties in the plan’s service area. The bid included plan administrative cost and profit. CMS based the Medicare payment for a private plan on the relationship between the bid and its benchmark.
Plan payment rates are now determined by the plan bid – the dollar amount the plan estimates will cover the Part A and Part B benefit package for a beneficiary of average health status – and the payment area’s benchmark – the maximum amount of Medicare payment set by law for a Medicare Advantage plan to provide Part A and Part B benefits. Plans with higher quality ratings are rewarded with a higher benchmark. If a plan’s bid is above the benchmark, its Medicare Advantage payment rate is equal to the benchmarks, and enrollees have to pay a premium equal to the difference.
If a plan’s bid is below the benchmark, its payment rate is its bid plus a percentage of the difference between the plan’s bid and the benchmark. The beneficiary pays no premium to the plan for the Part A and Part B benefits, but continues to be responsible for payment of the Medicare Part B premium and may pay premiums to the plan for additional benefits. The payment amount above the bid is referred to as the rebate and must be used by the plan to provide additional benefits to the enrollees in the form of lower cost sharing, lower premiums, or supplemental benefits.
Medicare payments are also based on enrolled beneficiaries’ demographics and health risk characteristics. Section 1853(a)(3) of the Social Security Act required the Secretary to develop and implement a new risk-adjustment methodology to be used to adjust the countywide rates to reflect the expected relative health status of each enrollee. The purpose of risk adjustment is to use health status indicators to improve the accuracy of payments and establish incentives for plans to enroll and treat less healthy Medicare beneficiaries. The base payment for an enrollee is the base rate for the enrollee’s county of residence, multiplied by the enrollee’s risk measure.
CMS selected the Principal Inpatient Diagnostic Cost Group (PIP-DCG) model as the risk-adjustment method to be implemented in 2000. This model recognized diagnoses for which inpatient care is most frequently appropriate and which are predictive of higher future costs. Until October 2002, plans submitted to CMS encounter data on enrollees’ inpatient hospitalizations only, which CMS processed through the PIP-DCG model to calculate plan payments.
To assist managed care organizations, CMS provided for a gradual phase-in of the effects of risk adjustment, initially adjusting only a portion of the total payment based on the new PIP-DCG methodology, with the remainder still adjusted under the pre-BBA AAPCC method based only on demographic information. This element of the risk-adjustment methodology provided a safeguard against disruptive changes in payments to the plans. For 2000, the transition schedule called for basing 90 percent of the prospective monthly payment per enrollee on the demographic-only method and 10 percent on the PIP-DCG risk-adjustment method. The demographic-only portion of the payment was adjusted for age, gender, Medicaid eligibility, institutional status, and working-aged status. The risk-adjusted portion of the payment, under the
7
PIP-DCG model, was adjusted for age, gender, Medicaid eligibility, whether originally entitled to Medicare due to disability, and working-aged status, as well as health status.
The Balanced Budget Refinement Act of 1999 (BBRA) adopted CMS’ “phase-in” concept in statutory language, but altered CMS’ proposed timing by mandating that the 90/10 blend would continue through 2001. Most recently, the Benefits Improvement and Protection Act of 2000 (BIPA) again modified the phase-in schedule to further soften the financial impact of risk adjustment on Medicare managed care organizations. Under BIPA, the 90/10 blend continued through 2003. In 2004, the risk-adjusted portion of the payment increased to 30 percent, in 2005 to 50 percent, and to 75 percent in 2006. Beginning in 2007, the rates were fully risk adjusted.
Although the PIP-DCG model was an improvement over the previous demographic payment model based on the AAPCC, CMS recognized that its utility was limited by only using inpatient hospital data and providing additional payment for only a small number of high-cost, seriously ill beneficiaries. Subsequently, BIPA required the implementation of a model using not only diagnoses from inpatient hospital stays, but also from ambulatory settings beginning in 2004. To prepare for implementation in 2004 of a risk-adjustment model based on multiple sites of care, in 2001, CMS required plans to begin submitting data on enrollees’ hospital outpatient and physician office encounters. Although these encounters would have provided additional data for quality measures and re-estimation of payment weights for future risk-adjustment models, CMS was concerned about the associated administrative data burden. As a result, CMS selected a new risk-adjustment model beginning in 2004, which reduced the administrative burden on the managed care organizations significantly. Only a few data elements are required in addition to diagnoses.
8
The CMS-HCC Risk-Adjustment Model
The CMS-HCC model is a selected significant disease model because it incorporates a selected subset of ICD-9-CM diagnosis codes and places them into approximately 64 disease groups called Hierarchical Condition Categories (HCCs). Each disease group includes conditions that are related clinically and have similar cost implications.
The model is prospective in the sense that it uses diagnosis information from a base year to predict costs and adjust payments for the next year. Models of this type are largely driven by the costs associated with chronic diseases, and they capture the systematic risk (costs) associated with Medicare populations. In applying the CMS-HCC model to risk adjust payments for the MA program, the model is used to determine relative risk factors.
In order to use the model as an adjuster to a base rate, costs must be converted into relative cost factors – i.e., risk-adjustment factors. To create risk-adjustment factors, the dollar coefficients (i.e., the predicted expenditure estimates for the diagnostic and demographic characteristics in the model) are divided by the national average (mean) predicted expenditure for fee-for-service beneficiaries. The predicted national average was $5,129 for 2000, the calibration year of the model. These relative risk factors are used to adjust county ratebook amounts for the relative health status of the individual enrollee. The payment rate for an enrollee is the base rate for the enrollee’s county of residence, multiplied by the enrollee’s risk measure, expressed as the CMS-HCC weight.
The CMS-HCC model includes demographic variables for age and sex, Medicaid eligibility, and originally disabled status. A beneficiary having Medicaid status any one month in the data collection year triggers the Medicaid payment adjustment. There is also an adjustment for working-aged status.
The CMS-HCC model has a modification that distinguishes the community-dwelling Medicare population from the long-term institutionalized (defined as those in institutions more than 90 days) population. Institutional status is recognized in the payment year, rather than the prior year. Place of residence – community versus long-term institutionalized – has been found to be an appropriate predictor for high-cost enrollees.
Once identified as institutionalized, patients remain in this status until discharged home for more than 14 days. Note that the CMS-HCC model has been calibrated separately for the community-dwelling and long-term institutionalized populations, rather than using an add-on factor based on residence.
For the first time, for the 2010 plan year, CMS made a “coding pattern differences adjustment” to MA risk scores, reducing MA payments to account for differences in disease coding patterns between MA organization under Part C and original fee-for-service Medicare. CMS is required by law to adjust MA payments where it finds differences in coding patterns between MA plans and Part A and Part B providers. The MA coding pattern differences adjustment factor will adjust for the growth in MA risk scores that occurs above and beyond the average growth captured in the normalization factor. The adjustment was applied as a uniform
9
3.41 percentage reduction to all plans’ Part C risk scores in all years from 2010-2013. For 2014, the reduction was 4.91 percent and the reduction is set at 5.16 percent for 2015. For CY016, CMS finalized the proposed policy to make an adjustment reflective of the statutory minimum of 5.41 percent.
For CY2015, CMS used the 2013 CMS-HCC and 2014 CMS-HCC models, blending the resulting risk scores from each model at 67 percent and 33 percent, respectively. In the 2016 Rate Notice, CMS finalized the proposed policy to end the blend, and calculate risk scores entirely based on the 2014 CMS-HCC model. This revised model comprises both an update to the data years used to recalibrate the model, and a clinical update to the disease categories to reflect more recent clinical experience.
In 2017, CMS will implement an updated version of the CMS-HHC risk adjustment model. The updated model will be used in Part C payment for aged/disabled beneficiaries enrolled in MA plans. CMS believes that the revised CMS-HCC model will improve the predictive performance for aged and disabled full benefit dual, partial benefit dual, and non-dual beneficiaries in the community. The updated model results in more appropriate relative weights for the HCCs because the relative weights reflect the disease and expenditure patterns of each of the defined community segments. The revised segments are non-dual aged and non-dual disabled, full benefit dual aged and full benefit disabled, and partial benefit dual aged and partial benefit dual disabled beneficiaries.
10
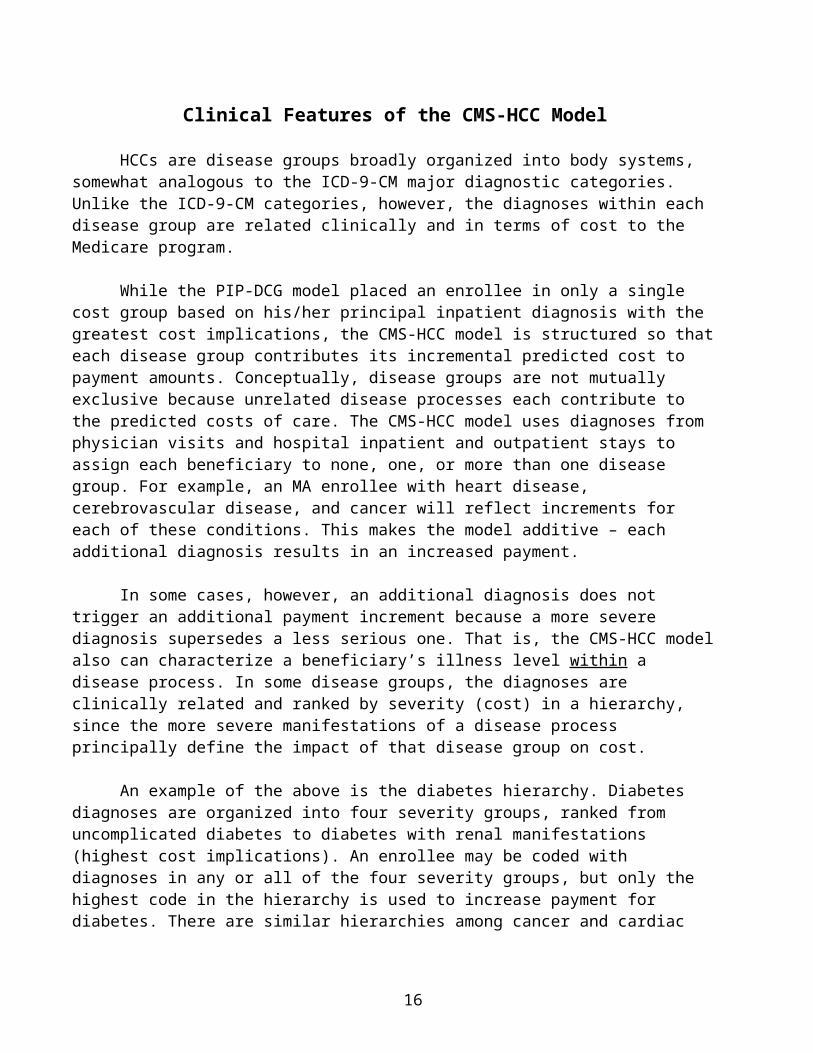
Clinical Features of the CMS-HCC Model
HCCs are disease groups broadly organized into body systems, somewhat analogous to the ICD-9-CM major diagnostic categories. Unlike the ICD-9-CM categories, however, the diagnoses within each disease group are related clinically and in terms of cost to the Medicare program.
While the PIP-DCG model placed an enrollee in only a single cost group based on his/her principal inpatient diagnosis with the greatest cost implications, the CMS-HCC model is structured so that each disease group contributes its incremental predicted cost to payment amounts. Conceptually, disease groups are not mutually exclusive because unrelated disease processes each contribute to the predicted costs of care. The CMS-HCC model uses diagnoses from physician visits and hospital inpatient and outpatient stays to assign each beneficiary to none, one, or more than one disease group. For example, an MA enrollee with heart disease, cerebrovascular disease, and cancer will reflect increments for each of these conditions. This makes the model additive – each additional diagnosis results in an increased payment.
In some cases, however, an additional diagnosis does not trigger an additional payment increment because a more severe diagnosis supersedes a less serious one. That is, the CMS-HCC model also can characterize a beneficiary’s illness level within a disease process. In some disease groups, the diagnoses are clinically related and ranked by severity (cost) in a hierarchy, since the more severe manifestations of a disease process principally define the impact of that disease group on cost.
An example of the above is the diabetes hierarchy. Diabetes diagnoses are organized into four severity groups, ranked from uncomplicated diabetes to diabetes with renal manifestations (highest cost implications). An enrollee may be coded with diagnoses in any or all of the four severity groups, but only the highest code in the hierarchy is used to increase payment for diabetes. There are similar hierarchies among cancer and cardiac diseases. In short, costs are additive across hierarchies and disease groups, but not within hierarchies.
As an example, if a beneficiary triggers Disease Groups 135 (Acute Renal Failure) and 136 (Chronic Kidney Disease (Stage 5)), then DG 136 will be dropped. In other words, payment will always be associated with the HCC in column 1, if a HCC in column 3 also occurs during the same collection period. Therefore, the organization’s payment will be based on HCC 135 rather than HCC 136.
11

Medicare Advantage Payment Methodology
X
Diagnoses SexAge
Payment to plan
CMS-HCC CMS-HCC
Patient characteristics:
Medicaid statusWorking aged statusDisable status
Rebate =0.5 to 0.7
(varies by plan start ratings) X
(case mix-adjusted benchmark-actual bid)
Adjustment (if any) to CMS payment for case mix factors
of individual enrollees to maintain fixed enrollee premium
+ +
+ +
Base rate
CMS-HCCweight
Enrollee basic premium
(Always zero)
Enrollee basic premium
(Equal to the difference between
the bid and the benchmark)
Base rate = standard bid
Base rate = benchmark
=
=
Benchmark(Dffers for regional PPO and local plans; includes any quality bonus)
Standard plan bid
Adjusted for case mix
Payment to plan
Plan bid below
benchmark
Plan bid below
benchmark
Compare standard bid and benchmark
Source: MedPAC Payment Basics, October 2013
12
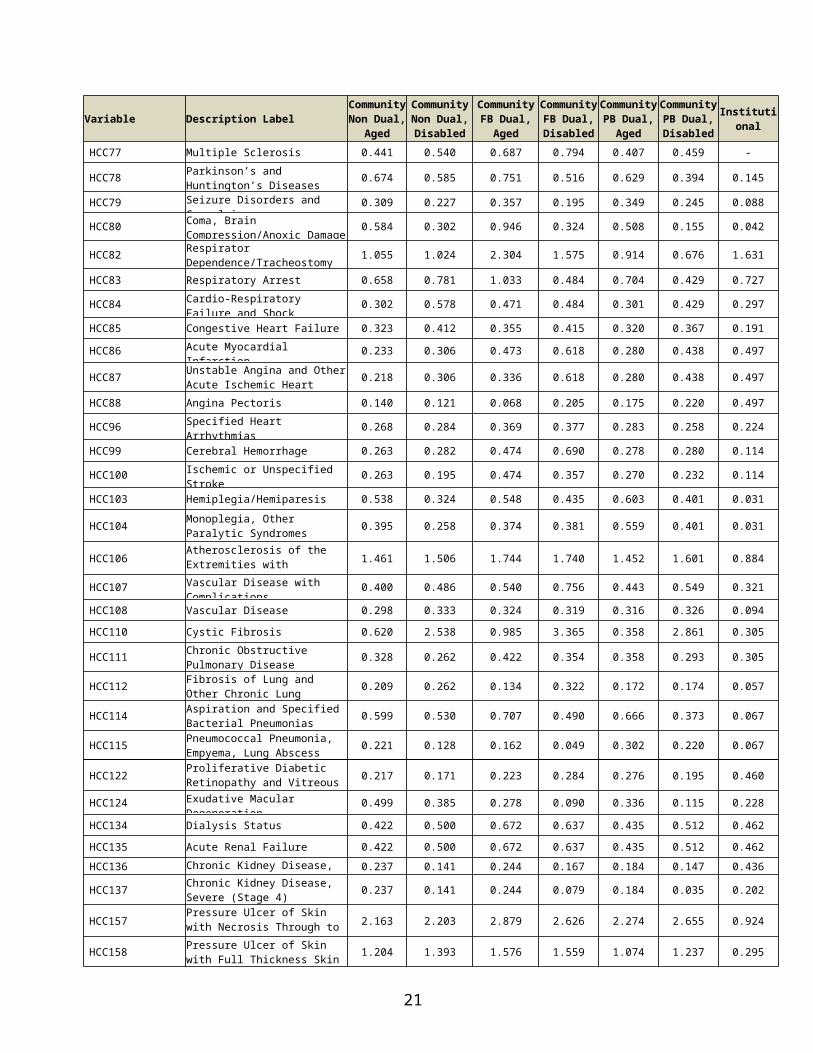
Table 1: CMS-HCC Model Relative Factors for Community and Institutional Beneficiaries
Variable Description LabelCommunityNon Dual,
Aged
Community Non Dual, Disabled
CommunityFB Dual,
Aged
CommunityFB Dual, Disabled
CommunityPB Dual,
Aged
CommunityPB Dual, Disabled
Institutional
Female
0-34 Years - 0.244 - 0.318 - 0.344 1.031
35-44 Years - 0.303 - 0.306 - 0.383 0.999
45-54 Years - 0.322 - 0.338 - 0.374 1.007
55-59 Years - 0.350 - 0.388 - 0.371 0.986
60-64 Years - 0.411 - 0.449 - 0.395 1.028
65-69 Years 0.312 - 0.425 - 0.341 - 1.200
70-74 Years 0.374 - 0.511 - 0.406 - 1.092
75-79 Years 0.448 - 0.611 - 0.484 - 0.995
80-84 Years 0.537 - 0.739 - 0.552 - 0.860
85-89 Years 0.664 - 0.917 - 0.678 - 0.749
90-94 Years 0.797 - 1.037 - 0.817 - 0.626
95 Years or Over 0.816 - 1.094 - 0.913 - 0.456
Male
0-34 Years - 0.155 - 0.225 - 0.330 1.049
35-44 Years - 0.190 - 0.204 - 0.267 1.074
45-54 Years - 0.221 - 0.281 - 0.300 1.008
55-59 Years - 0.271 - 0.372 - 0.307 1.055
60-64 Years - 0.303 - 0.486 - 0.343 1.039
65-69 Years 0.300 - 0.492 - 0.334 - 1.269
70-74 Years 0.379 - 0.582 - 0.409 - 1.323
75-79 Years 0.466 - 0.692 - 0.491 - 1.331
80-84 Years 0.561 - 0.816 - 0.546 - 1.189
85-89 Years 0.694 - 1.009 - 0.679 - 1.129
90-94 Years 0.857 - 1.186 - 0.822 - 0.964
95 Years or Over 0.976 - 1.268 - 1.038 - 0.781
Medicaid and Originally Disabled
Medicaid - - - - - - 0.062
Originally Disabled, Female 0.244 - 0.172 - 0.126 - -
Originally Disabled, Male 0.152 - 0.192 - 0.105 - -
Disease Coefficients Description Label
HCC1 HIV/AIDS 0.312 0.288 0.585 0.500 0.550 0.232 1.747
HCC2Septicemia, Sepsis, Systemic Inflammatory Response Syndrome/Shock
0.455 0.532 0.596 0.811 0.409 0.417 0.346
HCC6 Opportunistic Infections 0.435 0.704 0.548 0.919 0.482 0.765 0.580
13
Variable Description LabelCommunityNon Dual,
Aged
Community Non Dual, Disabled
CommunityFB Dual,
Aged
CommunityFB Dual, Disabled
CommunityPB Dual,
Aged
CommunityPB Dual, Disabled
Institutional
HCC8 Metastatic Cancer and Acute Leukemia 2.625 2.644 2.542 2.767 2.442 2.582 1.143
HCC9 Lung and Other Severe Cancers 0.970 0.927 0.973 1.025 0.955 0.879 0.727
HCC10 Lymphoma and Other Cancers 0.677 0.656 0.713 0.761 0.667 0.577 0.401
HCC11 Colorectal, Bladder, and Other Cancers 0.301 0.352 0.332 0.361 0.325 0.400 0.293
HCC12 Breast, Prostate, and Other Cancers and Tumors 0.146 0.202 0.159 0.190 0.152 0.182 0.199
HCC17 Diabetes with Acute Complications 0.318 0.371 0.346 0.431 0.354 0.423 0.441
HCC18 Diabetes with Chronic Complications 0.318 0.371 0.346 0.431 0.354 0.423 0.441
HCC19 Diabetes without Complication 0.104 0.128 0.097 0.160 0.098 0.136 0.160
HCC21 Protein-Calorie Malnutrition 0.545 0.753 0.752 0.845 0.562 0.709 0.260
HCC22 Morbid Obesity 0.273 0.227 0.410 0.373 0.244 0.242 0.511
HCC23 Other Significant Endocrine and Metabolic Disorders 0.228 0.444 0.228 0.353 0.193 0.351 0.337
HCC27 End-Stage Liver Disease 0.962 1.110 1.242 1.349 0.889 0.963 0.962
HCC28 Cirrhosis of Liver 0.390 0.394 0.342 0.491 0.460 0.324 0.390
HCC29 Chronic Hepatitis 0.165 0.267 0.038 0.400 0.263 0.324 0.390
HCC33 Intestinal Obstruction/Perforation 0.246 0.524 0.369 0.503 0.324 0.510 0.335
HCC34 Chronic Pancreatitis 0.276 0.678 0.333 0.875 0.412 0.849 0.241
HCC35 Inflammatory Bowel Disease 0.294 0.483 0.334 0.613 0.209 0.496 0.244
HCC39 Bone/Joint/Muscle Infections/Necrosis 0.425 0.474 0.552 0.713 0.418 0.491 0.345
HCC40Rheumatoid Arthritis and Inflammatory Connective Tissue Disease
0.423 0.377 0.370 0.345 0.390 0.290 0.329
HCC46 Severe Hematological Disorders 1.388 3.188 1.219 4.256 1.226 3.529 0.680
HCC47 Disorders of Immunity 0.625 0.848 0.529 0.589 0.449 0.690 0.529
HCC48 Coagulation Defects and Other Specified Hematological Disorders 0.221 0.339 0.268 0.378 0.225 0.382 0.151
HCC54 Drug/Alcohol Psychosis 0.383 0.569 0.706 0.919 0.388 0.613 0.102
HCC55 Drug/Alcohol Dependence 0.383 0.285 0.522 0.366 0.377 0.286 0.102
HCC57 Schizophrenia 0.608 0.395 0.612 0.432 0.547 0.366 0.271
HCC58 Major Depressive, Bipolar, and Paranoid Disorders 0.395 0.209 0.444 0.178 0.413 0.163 0.271
HCC70 Quadriplegia 1.314 1.053 1.098 1.056 1.274 1.328 0.497
HCC71 Paraplegia 1.007 0.704 0.920 1.019 0.958 0.908 0.467
HCC72 Spinal Cord Disorders/Injuries 0.528 0.456 0.552 0.407 0.556 0.384 0.229
HCC73 Amyotrophic Lateral Sclerosis and Other Motor Neuron Disease 0.970 1.082 1.230 1.219 0.570 0.814 0.224
HCC74 Cerebral Palsy 0.280 0.132 - - 0.158 0.052 -
HCC75
Myasthenia Gravis/Myoneural Disorders and Guillain-Barre Syndrome/Inflammatory and Toxic Neuropathy
0.457 0.528 0.436 0.465 0.364 0.331 0.369
HCC76 Muscular Dystrophy 0.505 0.457 0.553 0.512 0.429 0.168 0.104
HCC77 Multiple Sclerosis 0.441 0.540 0.687 0.794 0.407 0.459 -
14
Variable Description LabelCommunityNon Dual,
Aged
Community Non Dual, Disabled
CommunityFB Dual,
Aged
CommunityFB Dual, Disabled
CommunityPB Dual,
Aged
CommunityPB Dual, Disabled
Institutional
HCC78 Parkinson’s and Huntington’s Diseases 0.674 0.585 0.751 0.516 0.629 0.394 0.145
HCC79 Seizure Disorders and Convulsions 0.309 0.227 0.357 0.195 0.349 0.245 0.088
HCC80 Coma, Brain Compression/Anoxic Damage 0.584 0.302 0.946 0.324 0.508 0.155 0.042
HCC82 Respirator Dependence/Tracheostomy Status 1.055 1.024 2.304 1.575 0.914 0.676 1.631
HCC83 Respiratory Arrest 0.658 0.781 1.033 0.484 0.704 0.429 0.727
HCC84 Cardio-Respiratory Failure and Shock 0.302 0.578 0.471 0.484 0.301 0.429 0.297
HCC85 Congestive Heart Failure 0.323 0.412 0.355 0.415 0.320 0.367 0.191
HCC86 Acute Myocardial Infarction 0.233 0.306 0.473 0.618 0.280 0.438 0.497
HCC87 Unstable Angina and Other Acute Ischemic Heart Disease 0.218 0.306 0.336 0.618 0.280 0.438 0.497
HCC88 Angina Pectoris 0.140 0.121 0.068 0.205 0.175 0.220 0.497
HCC96 Specified Heart Arrhythmias 0.268 0.284 0.369 0.377 0.283 0.258 0.224
HCC99 Cerebral Hemorrhage 0.263 0.282 0.474 0.690 0.278 0.280 0.114
HCC100 Ischemic or Unspecified Stroke 0.263 0.195 0.474 0.357 0.270 0.232 0.114
HCC103 Hemiplegia/Hemiparesis 0.538 0.324 0.548 0.435 0.603 0.401 0.031
HCC104 Monoplegia, Other Paralytic Syndromes 0.395 0.258 0.374 0.381 0.559 0.401 0.031
HCC106 Atherosclerosis of the Extremities with Ulceration or Gangrene 1.461 1.506 1.744 1.740 1.452 1.601 0.884
HCC107 Vascular Disease with Complications 0.400 0.486 0.540 0.756 0.443 0.549 0.321
HCC108 Vascular Disease 0.298 0.333 0.324 0.319 0.316 0.326 0.094
HCC110 Cystic Fibrosis 0.620 2.538 0.985 3.365 0.358 2.861 0.305
HCC111 Chronic Obstructive Pulmonary Disease 0.328 0.262 0.422 0.354 0.358 0.293 0.305
HCC112 Fibrosis of Lung and Other Chronic Lung Disorders 0.209 0.262 0.134 0.322 0.172 0.174 0.057
HCC114 Aspiration and Specified Bacterial Pneumonias 0.599 0.530 0.707 0.490 0.666 0.373 0.067
HCC115 Pneumococcal Pneumonia, Empyema, Lung Abscess 0.221 0.128 0.162 0.049 0.302 0.220 0.067
HCC122 Proliferative Diabetic Retinopathy and Vitreous Hemorrhage 0.217 0.171 0.223 0.284 0.276 0.195 0.460
HCC124 Exudative Macular Degeneration 0.499 0.385 0.278 0.090 0.336 0.115 0.228
HCC134 Dialysis Status 0.422 0.500 0.672 0.637 0.435 0.512 0.462
HCC135 Acute Renal Failure 0.422 0.500 0.672 0.637 0.435 0.512 0.462
HCC136 Chronic Kidney Disease, Stage 5 0.237 0.141 0.244 0.167 0.184 0.147 0.436
HCC137 Chronic Kidney Disease, Severe (Stage 4) 0.237 0.141 0.244 0.079 0.184 0.035 0.202
HCC157 Pressure Ulcer of Skin with Necrosis Through to Muscle, Tendon, or Bone 2.163 2.203 2.879 2.626 2.274 2.655 0.924
HCC158 Pressure Ulcer of Skin with Full Thickness Skin Loss 1.204 1.393 1.576 1.559 1.074 1.237 0.295
15
Variable Description LabelCommunityNon Dual,
Aged
Community Non Dual, Disabled
CommunityFB Dual,
Aged
CommunityFB Dual, Disabled
CommunityPB Dual,
Aged
CommunityPB Dual, Disabled
Institutional
HCC161 Chronic Ulcer of Skin, Except Pressure 0.535 0.636 0.757 0.631 0.586 0.620 0.294
HCC162 Severe Skin Burn or Condition 0.321 0.348 0.003 0.537 0.525 0.119 0.076
HCC166 Severe Head Injury 0.584 0.302 0.946 0.324 1.065 0.155 0.042
HCC167 Major Head Injury 0.191 0.044 0.274 0.171 0.133 0.049 -
HCC169 Vertebral Fractures without Spinal Cord Injury 0.495 0.456 0.552 0.407 0.516 0.384 0.209
HCC170 Hip Fracture/Dislocation 0.418 0.513 0.520 0.668 0.383 0.484 -
HCC173 Traumatic Amputations and Complications 0.266 0.340 0.412 0.383 0.233 0.232 0.267
HCC176 Complications of Specified Implanted Device or Graft 0.597 0.871 0.721 1.156 0.584 0.876 0.502
HCC186 Major Organ Transplant or Replacement Status 1.000 0.618 0.816 1.075 0.795 0.655 0.962
HCC188 Artificial Openings for Feeding or Elimination 0.571 0.785 0.775 0.870 0.579 0.867 0.500
HCC189 Amputation Status, Lower Limb/Amputation Complications 0.588 0.455 0.787 1.065 0.737 0.696 0.407
Disease Interactions Description Label
HCC47 CANCER Immune Disorders* Cancer Group 0.893 0.675 0.815 0.652 0.776 0.808 -HCC85 DIABETES MELLIT
Congestive Heart Failure* Diabetes Group 0.154 0.096 0.205 0.160 0.178 0.139 0.154
HCC85 COPDCFCongestive Heart Failure* Chronic Obstructive Pulmonary Disease Group
0.190 0.174 0.240 0.217 0.186 0.181 0.164
HCC85 RENALCongestive Heart Failure* Renal Group 0.270 0.493 0.271 0.711 0.299 0.609 -
RESPDEPANDARRE COPDCF
Cardiorespiratory Failure Group* Chronic Obstructive Pulmonary Disease Group
0.336 0.256 0.564 0.524 0.460 0.449 0.423
HCC85 HCC96 Congestive Heart Failure* Specified Heart Arrhythmias 0.105 0.285 0.200 0.405 0.116 0.318 -
SUBSTANCE ABUSE PSYCHIATRIC
Substance Abuse Group* Psychiatric Group - 0.191 - 0.233 - 0.230 -
SEPSIS PRESSURE ULCER Sepsis* Pressure Ulcer - - - - - - 0.252
SEPSIS ARTIF OPENINGS
Sepsis* Artificial Openings for Feeding or Elimination - - - - - - 0.568
ART OPENINGS PRESSURE ULCER
Artificial Openings for Feeding or Elimination* Pressure Ulcer - - - - - - 0.331
COPDCF ASP SPEC BACT PNEUM
Chronic Obstructive Pulmonary Disease* Aspiration and Specified Bacterial Pneumonias - - - - - - 0.254
ASP SPEC BACT PNEUM PRES ULC
Aspiration and Specified Bacterial Pneumonias* Pressure Ulcer - - - - - - 0.366
SEPSIS ASP SPEC BACT PNEUM
Sepsis* Aspiration and Specified Bacterial Pneumonias - - - - - - 0.321
16
Variable Description LabelCommunityNon Dual,
Aged
Community Non Dual, Disabled
CommunityFB Dual,
Aged
CommunityFB Dual, Disabled
CommunityPB Dual,
Aged
CommunityPB Dual, Disabled
Institutional
SCHIZOPHRENIA COPDCF
Schizophrenia* Chronic Obstructive Pulmonary Disease - - - - - - 0.363
SCHIZOPHRENIA CHF
Schizophrenia* Congestive Heart Failure - - - - - - 0.173
SCHIZOPHRENIA SEIZURES
Schizophrenia* Seizure Disorders and Convulsions - - - - - - 0.483
Disabled/Disease Interactions
DISABLED HCC85 Disabled, Congestive Heart Failure - - - - - - 0.321
DISABLED PRESSURE ULCER Disabled, Pressure Ulcer - - - - - - 0.608
DISABLED HCC161 Disabled, Chronic Ulcer of the Skin, Except Pressure Ulcer - - - - - - 0.369
DISABLED HCC39 Disabled, Bone/Joint Muscle Infections/Necrosis - - - - - - 0.567
DISABLED HCC77 Disabled, Multiple Sclerosis - - - - - - 0.425DISABLED HCC6 Disabled, Opportunistic Infections - - - - - - 0.277
NOTES:The denominator is $9,185.29In the “disease interactions” and “disabled interactions,” the variables are defined as follows: Immune Disorders = HCC 47Cancer = HCCs 8-12Congestive Heart Failure = HCC 85 Diabetes = HCCs 17-19Chronic Obstructive Pulmonary Disease = HCCs 110-112 Renal = HCCs 134 – 137Cardiorespiratory Failure = HCCs 82-84 Specified Heart Arrhythmias = HCC 96 Substance Abuse = HCCs 54-55 Psychiatric = HCCs 57-58Sepsis = HCC 2Pressure Ulcer = HCCs 157-158Artificial Openings for Feeding or Elimination = HCC 188 Aspiration and Specified Bacterial Pneumonias = HCC 114 Schizophrenia = HCC 57Seizure Disorders and Convulsions = HCC 79 Chronic Ulcer of Skin, except Pressure = HCC 161 Bone/Joint/Muscle Infections/Necrosis = HCC 39 Multiple Sclerosis = HCC 77Opportunistic Infections = HCC 6SOURCE: RTI International analysis of 2013-2014 Medicare 100% data and RTI International analysis of 2013-2014 Medicare 100% institutional sample.
17
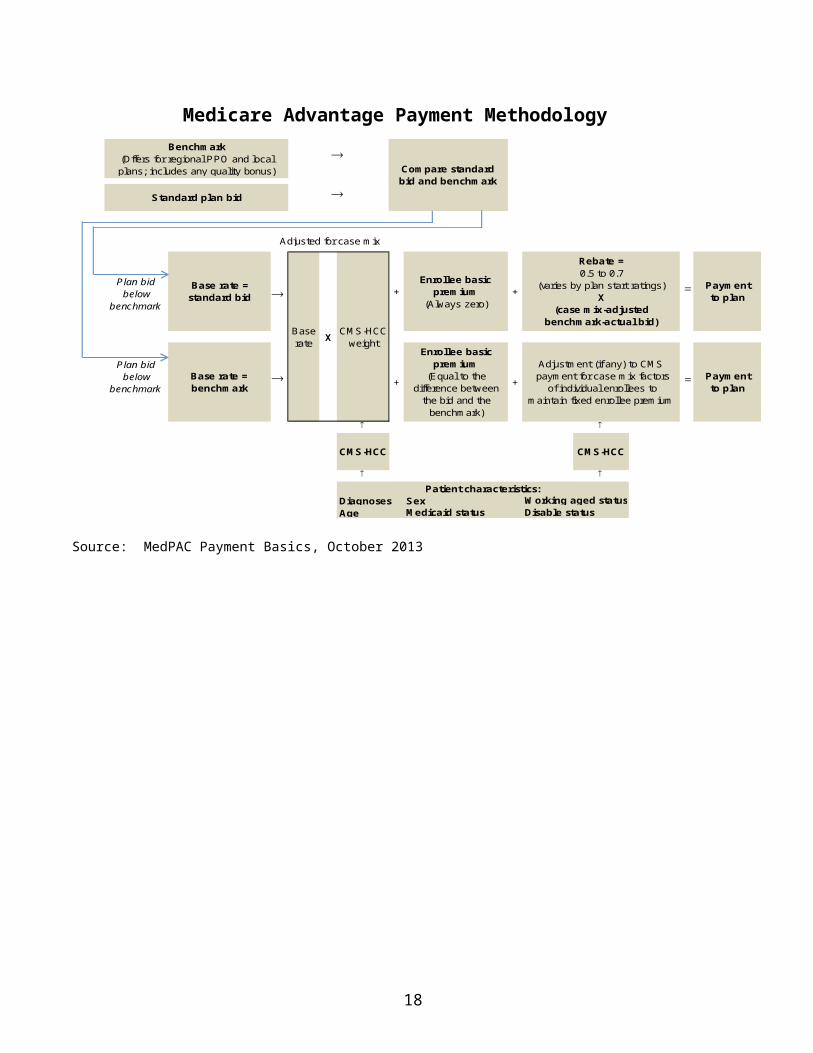
Table 2: Disease Hierarchies for the Revised CMS-HCC Model
Hierarchical Condition Category (HCC)
If the Disease Group is Listed in this column… …Then drop the Disease Group(s) listed in this column
Hierarchical Condition Category (HCC) LABEL8 Metastatic Cancer and Acute Leukemia 9,10,11,129 Lung and Other Severe Cancers 10,11,1210 Lymphoma and Other Cancers 11,1211 Colorectal, Bladder, and Other Cancers 1217 Diabetes with Acute Complications 18,1918 Diabetes with Chronic Complications 1927 End-Stage Liver Disease 28,29,8028 Cirrhosis of Liver 2946 Severe Hematological Disorders 4854 Drug/Alcohol Psychosis 5557 Schizophrenia 5870 Quadriplegia 71,72,103,104,16971 Paraplegia 72,104,16972 Spinal Cord Disorders/Injuries 16982 Respirator Dependence/Tracheostomy Status 83,8483 Respiratory Arrest 8486 Acute Myocardial Infarction 87,8887 Unstable Angina and Other Acute Ischemic Heart
Disease88
99 Cerebral Hemorrhage 100103 Hemiplegia/Hemiparesis 104106 Atherosclerosis of the Extremities with Ulceration or
Gangrene107,108,161,189
107 Vascular Disease with Complications 108110 Cystic Fibrosis 111,112111 Chronic Obstructive Pulmonary Disease 112114 Aspiration and Specified Bacterial Pneumonias 115134 Dialysis Status 135,136,137135 Acute Renal Failure 136,137136 Chronic Kidney Disease, Stage 5 137157 Pressure Ulcer of Skin with Necrosis Through to
Muscle, Tendon, or Bone158,161
158 Pressure Ulcer of Skin with Full Thickness Skin Loss 161166 Severe Head Injury 80,167
18
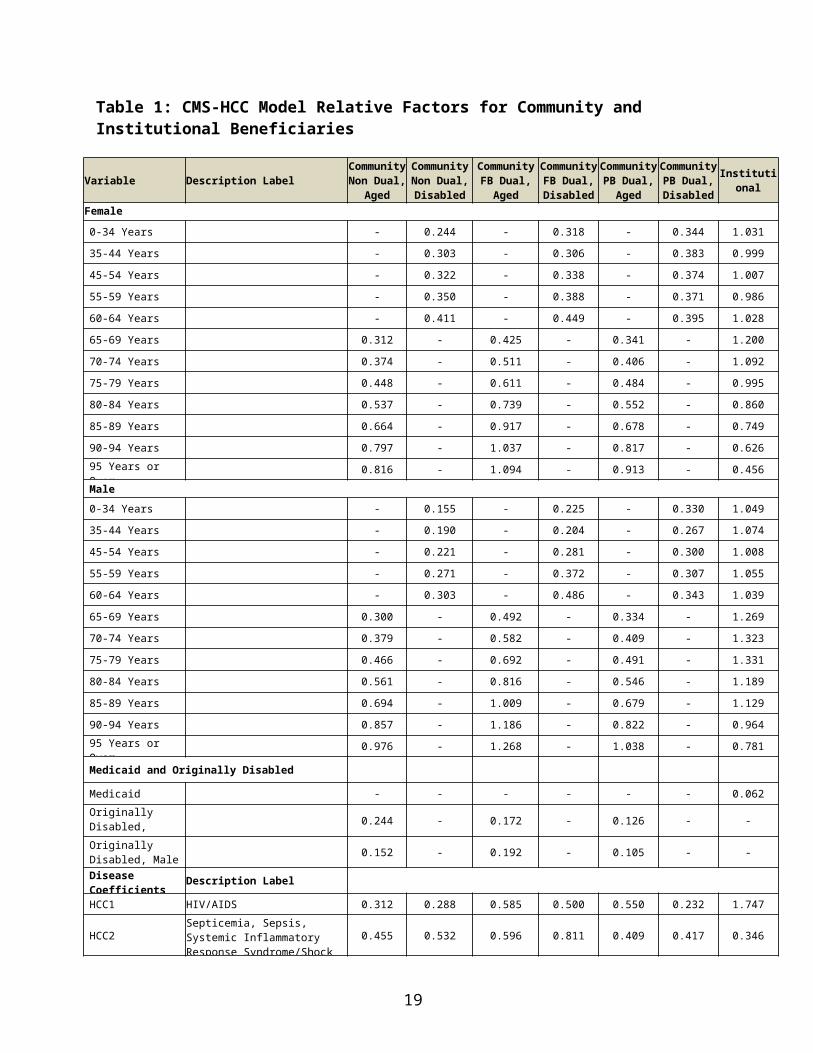
Table 3: CMS-HCC Model Relative Factors for Aged and Disabled New Enrollees
Non-Medicaid & Non-Originally
Disabled
Medicaid & Non-Originally
DisabledNon-Medicaid & Originally
Disabled
Medicaid & Originally Disabled
Female0-34 Years 0.664 0.985 - -35-44 Years 0.936 1.221 - -45-54 Years 1.035 1.337 - -55-59 Years 1.004 1.342 - -60-64 Years 1.122 1.438 - -65 Years 0.522 1.059 1.130 1.56666 Years 0.516 0.946 1.167 1.61967 Years 0.544 0.946 1.167 1.61968 Years 0.581 0.946 1.167 1.61969 Years 0.605 0.946 1.167 1.61970-74 Years 0.674 0.975 1.167 1.61975-79 Years 0.892 1.092 1.167 1.61980-84 Years 1.066 1.395 1.167 1.61985-89 Years 1.324 1.458 1.167 1.61990-94 Years 1.324 1.678 1.167 1.61995 Years or Over 1.324 1.678 1.167 1.619Male0-34 Years 0.456 0.766 - -35-44 Years 0.665 1.095 - -45-54 Years 0.834 1.357 - -55-59 Years 0.889 1.422 - -60-64 Years 0.923 1.582 - -65 Years 0.514 1.201 0.790 1.61366 Years 0.533 1.208 0.957 1.61367 Years 0.575 1.208 1.005 2.20268 Years 0.641 1.208 1.074 2.20269 Years 0.671 1.311 1.398 2.20270-74 Years 0.776 1.311 1.398 2.20275-79 Years 1.040 1.361 1.398 2.20280-84 Years 1.270 1.603 1.398 2.20285-89 Years 1.511 1.850 1.398 2.20290-94 Years 1.511 1.850 1.398 2.20295 Years or Over 1.511 1.850 1.398 2.202
NOTES:1. The denominator is $9,185.292. For payment purposes, a new enrollee is a beneficiary who did not have 12 months of Part B eligibility in
the data collection year. CMS-HCC new enrollee models are not based on diagnoses, but include factors for different age and gender combinations by Medicaid and the original reason for Medicare entitlement.
SOURCE: RTI International analysis of 2013-2014 100 Percent Medicare data.
19
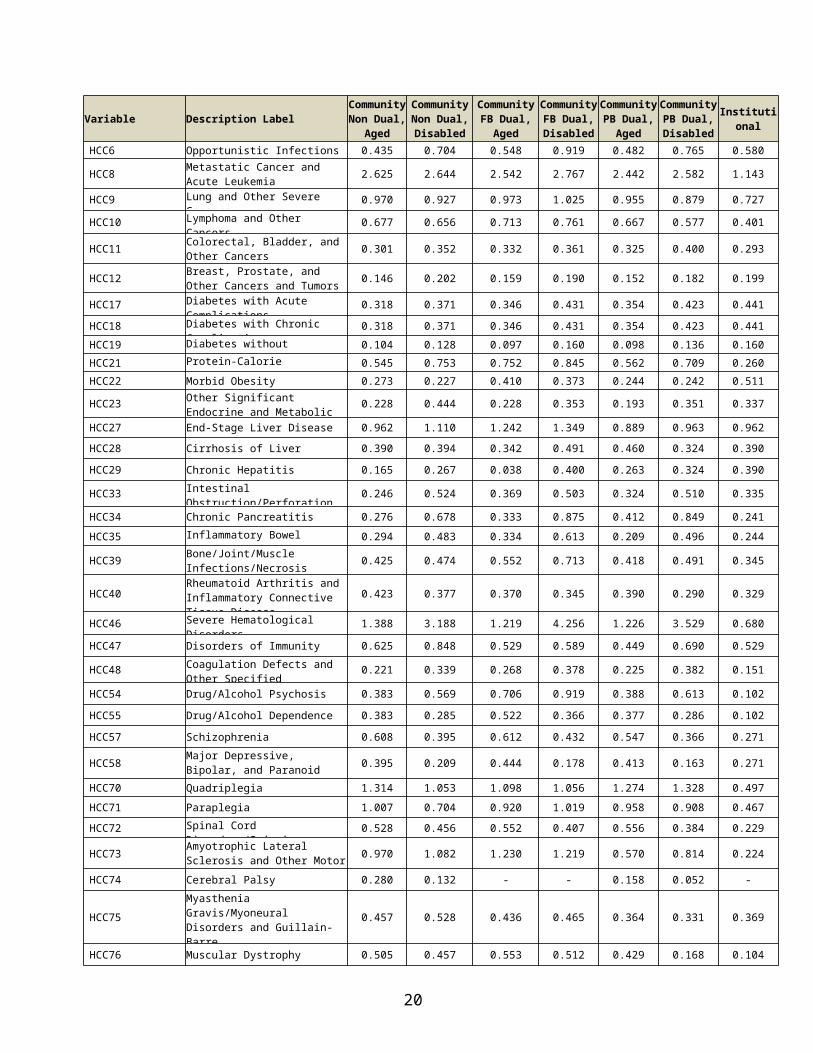
Table 4: Medicare Advantage Monthly Capitation Rates for 2017 for All Plans Except PACE Plans
Risk Parts A & BCounty Name 5%
Bonus Rate3%
Bonus Rate0%
Bonus RateESRD
Parts A & BALACHUA $820.13 $820.13 $820.13 $6,861.75BAKER $948.87 $934.64 $901.43 $6,861.75BAY $875.85 $862.71 $832.06 $6,861.75BRADFORD $858.25 $845.38 $815.34 $6,861.75BREVARD $869.03 $856.62 $827.65 $6,861.75BROWARD $922.60 $908.76 $876.47 $6,861.75CALHOUN $809.45 $809.45 $807.82 $6,861.75CHARLOTTE $879.13 $865.94 $835.17 $6,861.75CITRUS $814.25 $814.25 $808.79 $6,861.75CLAY $921.13 $907.31 $875.07 $6,861.75COLLIER $846.12 $833.43 $803.81 $6,861.75COLUMBIA $890.70 $890.70 $890.70 $6,861.75MIAMI-DADE $1,023.12 $1,007.77 $971.96 $6,861.75DESOTO $884.98 $871.71 $840.73 $6,861.75DIXIE $929.24 $915.30 $882.78 $6,861.75DUVAL $918.90 $905.12 $872.96 $6,861.75ESCAMBIA $852.75 $840.99 $813.55 $6,861.75FLAGLER $893.33 $877.14 $819.76 $6,861.75FRANKLIN $845.23 $833.15 $804.98 $6,861.75GADSDEN $892.08 $871.63 $821.62 $6,861.75GILCHRIST $866.30 $866.30 $865.86 $6,861.75GLADES $901.45 $887.93 $856.38 $6,861.75GULF $886.38 $878.29 $848.59 $6,861.75HAMILTON $833.03 $833.03 $833.03 $6,861.75HARDEE $880.21 $867.33 $837.27 $6,861.75HENDRY $868.12 $855.10 $824.71 $6,861.75HERNANDO $889.68 $876.66 $846.28 $6,861.75HIGHLANDS $868.66 $868.66 $862.94 $6,861.75HILLSBOROUGH $882.92 $869.68 $838.77 $6,861.75HOLMES $810.61 $810.61 $791.79 $6,861.75INDIAN RIVER $866.10 $853.43 $823.86 $6,861.75JACKSON $809.99 $809.99 $809.99 $6,861.75JEFFERSON $890.87 $890.87 $870.97 $6,861.75LAFAYETTE $864.22 $851.88 $823.07 $6,861.75LAKE $893.43 $886.93 $856.94 $6,861.75LEE $878.87 $865.69 $834.93 $6,861.75LEON $859.14 $837.20 $786.02 $6,861.75LEVY $860.95 $860.95 $860.95 $6,861.75LIBERTY $805.07 $805.07 $805.07 $6,861.75MADISON $806.01 $806.01 $806.01 $6,861.75MANATEE $859.81 $846.91 $816.82 $6,861.75MARION $860.50 $848.20 $819.52 $6,861.75MARTIN $884.90 $871.95 $841.74 $6,861.75MONROE $932.00 $918.02 $885.40 $6,861.75NASSAU $854.18 $841.37 $811.47 $6,861.75
20
Risk Parts A & BCounty Name 5%
Bonus Rate3%
Bonus Rate0%
Bonus RateESRD
Parts A & BOKALOOSA $833.75 $833.75 $810.21 $6,861.75OKEECHOBEE $975.26 $960.63 $926.50 $6,861.75ORANGE $867.53 $854.52 $824.15 $6,861.75OSCEOLA $866.45 $854.07 $825.19 $6,861.75PALM BEACH $926.81 $912.91 $880.47 $6,861.75PASCO $894.74 $894.07 $863.84 $6,861.75PINELLAS $886.22 $872.93 $841.91 $6,861.75POLK $882.26 $869.66 $840.25 $6,861.75PUTNAM $865.77 $865.77 $865.77 $6,861.75ST. JOHNS $890.94 $890.94 $861.19 $6,861.75ST. LUCIE $864.27 $851.31 $821.06 $6,861.75SANTA ROSA $844.73 $832.66 $804.50 $6,861.75SARASOTA $875.22 $862.71 $833.54 $6,861.75SEMINOLE $872.22 $859.14 $828.61 $6,861.75SUMTER $815.71 $803.47 $774.92 $6,861.75SUWANNEE $855.50 $855.50 $846.61 $6,861.75TAYLOR $875.82 $863.30 $834.11 $6,861.75UNION $951.78 $937.50 $904.19 $6,861.75VOLUSIA $891.60 $868.08 $813.21 $6,861.75WAKULLA $872.26 $849.25 $795.58 $6,861.75WALTON $851.50 $844.45 $815.89 $6,861.75WASHINGTON $842.90 $836.65 $808.36 $6,861.75
* Note:1. ESRD rates are for dialysis only and are shown after the deduction of user fee of $5.25. 2. All rates include MIPPA IME deduction.
21
Related Documents