1 Media Bias in Financial Newspapers: Evidence from Early Twentieth Century France Vincent Bignon & Antonio Miscio February 2009 Abstract The financial market was well developed in France in the years before World War I, and there were many newspapers that provided information to investors. Yet contemporaries faulted the financial press for inaccuracy and biases. This study implements a quantitative test to assess these accusations. The results show that, although firms’ media coverage was affected because firms paid to appear in newspapers, the performance of firms actually touted by the press was good, overall. Thus, the media bias is better explained by newspapers recommending investments according to their editorial policy and then inducing firms to pay for those recommendations. Keywords: Media coverage, newspapers, media bias, financial markets JEL Classifications: G11, G12, L15, O16, N13 Acknowledgments: We benefited from suggestions of the participants of the 1 st Euroclio conference in Paris (France), the 10 th ESNIE 2008 in Cargese (France), the 28 th APHES in Guimarães (Portugal), and of seminars at Rutgers University, Université Paris Ouest Nanterre (EconomiX), and Université d’Orléans (LEO). We also thank Olivier Accominotti, Sara Bertin, Norbert Gaillard, George Gallais-Hamonno, John Landon-Lane, John Nye, Yannick Perez, Camila VamMalle, Anne-Gael Vaubourg, and Eugen White for comments and insights. We are especially grateful to Régis Breton and Marc Flandreau for many discussions and comments. Vincent Bignon acknowledges support of the Mercatus Center at George Mason University while finishing the paper. This paper benefited from funding by the Agence Nationale de la Recherche, project # 05-JCJC-0225. The usual disclaimer applies. V. Bignon: Research fellow at EconomiX, Université Paris Ouest Nanterre La Défense, Bâtiment K, 200 avenue de la République, 92001 Nanterre cedex. Maître de Conférences at IUFM – Université Paris 12. E-mail: vbignon@u- paris10.fr . A. Miscio: LEO, Université d’Orléans. Faculté de Droit, d'Economie et Gestion, Rue de Blois, 45067 Orléans cedex 2. E-mail: [email protected]

Welcome message from author
This document is posted to help you gain knowledge. Please leave a comment to let me know what you think about it! Share it to your friends and learn new things together.
Transcript
1
Media Bias in Financial Newspapers: Evidence from Early Twentieth Century France
Vincent Bignon & Antonio Miscio
February 2009
Abstract The financial market was well developed in France in the years before World War I, and there were many
newspapers that provided information to investors. Yet contemporaries faulted the financial press for inaccuracy and
biases. This study implements a quantitative test to assess these accusations. The results show that, although firms’
media coverage was affected because firms paid to appear in newspapers, the performance of firms actually touted
by the press was good, overall. Thus, the media bias is better explained by newspapers recommending investments
according to their editorial policy and then inducing firms to pay for those recommendations.
Keywords: Media coverage, newspapers, media bias, financial markets
JEL Classifications: G11, G12, L15, O16, N13
Acknowledgments: We benefited from suggestions of the participants of the 1st Euroclio conference in Paris (France), the 10th ESNIE 2008 in Cargese (France), the 28th APHES in Guimarães (Portugal), and of seminars at Rutgers University, Université Paris Ouest Nanterre (EconomiX), and Université d’Orléans (LEO). We also thank Olivier Accominotti, Sara Bertin, Norbert Gaillard, George Gallais-Hamonno, John Landon-Lane, John Nye, Yannick Perez, Camila VamMalle, Anne-Gael Vaubourg, and Eugen White for comments and insights. We are especially grateful to Régis Breton and Marc Flandreau for many discussions and comments. Vincent Bignon acknowledges support of the Mercatus Center at George Mason University while finishing the paper. This paper benefited from funding by the Agence Nationale de la Recherche, project # 05-JCJC-0225. The usual disclaimer applies. V. Bignon: Research fellow at EconomiX, Université Paris Ouest Nanterre La Défense, Bâtiment K, 200 avenue de la République, 92001 Nanterre cedex. Maître de Conférences at IUFM – Université Paris 12. E-mail: [email protected]. A. Miscio: LEO, Université d’Orléans. Faculté de Droit, d'Economie et Gestion, Rue de Blois, 45067 Orléans cedex 2. E-mail: [email protected]
2
1. Introduction
Among the key elements of the development of financial markets are the quantity and quality of
information provided to investors on financial assets and on their issuers. The French financial
market experienced a remarkable development during the first wave of globalisation (Rajan and
Zingales 2003). Consequently, about two million investors held at least some of the several
thousands of stocks and bonds listed on the Paris stock exchange (Neymarck 1911). Although
newspapers were an active—indeed, unique—medium for spreading financial information with
“hundreds of living titles” (Albert 1972, p. 261), most contemporaries pointed to the low
informational content of financial newspapers (Lysis 1912; Kaufmann 1914). Those judgments
were based on qualitative evidence, whereas in this paper we construct a quantitative test to
assess the accuracy of the financial press.
Numerous contemporaries linked the poor content of financial newspapers with the
payments made by providers of the information. This is clearly a distinct and noticeable feature
of these particular newspapers. Contemporaries blamed this feature for creating a conflict of
interest and ultimately for biasing the information published. Calling such arrangements bribery
and decrying the venality of the French press, they further argued that “in our society, those who
have money have the newspapers and consequently, the public opinion” (Lysis 1912, p. 168).
Most historians (see e.g. Feis 1965; Albert 1972) subsequently went along with assuming that
these periodicals contained little valuable information. However, a closer look at this market
indicates that countervailing forces could have been at work. Albert (1972) wrote that “a reliable
financial press did nonetheless exist although their independence of thought could have been
questioned”. Martin (2006) discussed the so-called venality of the press and judged that the
phenomenon could have been overestimated by contemporaries whose negative assessments,
moreover, were accepted too uncritically by historians.

3
Although payments were part of a publication contract, the idea that newspapers slanted
information still needs to be proven. After all, a newspaper was also paid by its readers and thus
was unlikely to have acted against their interests. More precisely, from the literature on two-
sided markets we borrow the idea that an intermediary can set up a payment structure requiring
that both sides (information providers and readers) pay to cover the publication’s cost (Rochet
and Tirole 2004; Anderson and Gabszewicz 2006). Consequently, the mere existence of
payments to journals from information providers does not, in itself, prove information distortion.
Rather, the effect on editorial policy of such payments is an empirical question that needs
quantitative assessment. In this paper we use the information published during six months by a
sample of four newspapers concerning all firms listed on the stock market in order to test
whether those payments induced a (potential) coverage bias.1 This allows us to assess whether
published information was biased toward paying firms and to see if this could have devalued the
portfolios of the reader-investors. We show that payments did modify the distribution of
published information toward paying firms. However, this did not always make these investors
worse off.
In spite of the media’s widespread development since the 19th century and its importance
for financial development, few in the field of economic history have studied this issue. Some
look at the effect of the diffusion of price lists in newspapers before the Industrial Revolution
and argue that this facilitated arbitrage among places (Neal 1988; McCusker and Gravejstijn
1991; Flandreau et al. 2008). Gille (1959) provided a comprehensive history of this industry in
France during the Second Empire. Flandreau (2003) showed how information on sovereign debt
was produced and spread during the Belle Epoque. Hautcoeur (2006) provided insights on the
use of stock index in the French financial periodicals before 1914. Esteves (2007) proposed a
1 In the political context, D’Alessio and Allen (2000) defined three types of media bias: the gatekeeping bias, which is the preference for selecting stories from one (political) party or the other; the coverage bias, which considers the relative amounts of coverage each party receives; and the X bias, which focuses on the favorability of coverage.
4
detailed account of the diffusion of information on sovereign bonds through such bondholders’
periodicals as the Banker’s magazine. Our paper contributes to this literature by assessing the
accuracy of financial newspapers in early 20th-century France.
This paper is also related to the burgeoning literature that developed at the crossroads of
media economics and finance or political science. We borrow from the political science literature
a focus on measuring the bias. A few authors have recently attempted to measure the slanting of
news by media in the political area (Groseclose and Milyo 2005; Gentzkow and Shapiro 2006).
We differ from that work in focusing on financial newspapers. This allows us to provide a
measure of how investors might have been hurt by media bias. This paper is also linked to those
that measure the media’s relation with the financial markets. Some work in this vein shows that,
by diffusing information, the press helped to reduce economic inefficiencies such as private
benefits captured by a CEO (Dyck and Zingales 2004; Dyck et al. 2008). But most of these
papers concern measuring and explaining the media bias in reporting financial market
information. Huberman and Regev (2001) gave an example of the media’s effect on stock price
that stemmed solely from the reporting of soft information. Some other authors use the “event
study” approach to test for the impact of market newspapers’ stories on stock prices (Chan 2003;
Bhattacharya 2004). In the field of finance, the most similar approach is that of Reuter (2004)
and Reuter and Zitzewitz (2006), who studied the bias created by advertisements in the selection
of a newspaper’s coverage of products. In contrast, we study the coverage of listed firms and the
impact of a different payment scheme. Our paper is also linked to Gentzkow et al. (2004), who
studied the rise of independence in the political press during 19th-century America.
The rest of this paper is organized as follows. Section 2 explores the various scandals that
hurt the press. Section 3 presents our data and explains the test that is implemented in Section 4.
Section 5 presents the results, and Section 6 concludes.

5
2. Information slanting and hidden payments to newspapers
Much as many persons use today’s rating agencies, historians have used various financial
scandals to infer the efficiency of the media that disseminate information on financial assets. The
anecdotal evidence is said to demonstrate that payments made by information sources to
newspapers distorted the information published. In Section 2.1 we present these various affairs
and the claims historians infer from their study. It is often argued that studying the various
scandals is the best (if not the only) possible method for judging the accuracy of the press. In
Section 2.2 we propose an alternate proxy for the payments made to newspapers by firms and
explain its rationale.
2.1. Newspapers in turmoil: From the Panama scandal to the Rochette affair
During the two decades from the 1890s to World War I, a common opinion was spread through
journals, books, and parliamentary reports that the press was actually bribed by its information
sources and that this necessarily distorted the information published.
The opinion that the press was bribed to slant2 published information first appeared after
the Panama scandal burst on the scene in 1892. This scandal was openly discussed and resulted
in a report by a special commission of lawmakers as well as a court decision. It was then
revealed that politicians and journals had been paid to put a positive spin on Panama’s activities
and, notably, to foster the success of the company’s bond issues. The company had paid
newspapers and journalists for announcements, advertising, and favourable editorial coverage,
paying between 12 and 13 million francs to newspapers between 1880 and 1888 while it raised
about 1.5 billion from the public (Martin 2006, p. 23).3
2 Defined by Hayakawa (1940) as the process of deliberately selecting details that are favorable or unfavorable to the subject being described. 3 Although most newspapers received some payments, they might be relatively modest compared with the operating income or the amount of advertising revenue. Eveno (2003, p. 67) computed that Le Figaro (its manager and journalists) received 500,450 francs from the Panama company during the period (amounting to 55,600 francs per annum) while its annual operating income fluctuated between 1.88 and 2.58 million.

6
The scandal led to charges of corruption leveled at both the press and the political
system. It caused Anatole Leroy-Beaulieu—then a professor at Sciences Po—to question the
very organization of the democratic system, blaming “extravagant governments, drudge
lawmakers and a venal press”. The press was especially attacked because the scandal revealed
that it worked at odds with the romantic vision of the journalist who uses his pen as “a sword
pure of any shed blood” and so is “the modern knight, the righter of wrongs” (Leroy-Beaulieu
1896, p. 733).4
As a result, perception of the newspapers’ accuracy changed among the general public
and the elite. Discussions revolved around the role played by money in slanting the published
information. The Revue Bleue, an influential periodical among the elite, opened its columns in
1897 to debate on the “responsibilities of the contemporaneous press”. Henry Beranger, the
discussion’s initiator, argued that “cash, when it reigns, is never a principle of superiority and
quite always a principle of corruption” and that “our legislator planned the independence of the
press towards judges or the police, but they did not foresee the slavery of the press towards
business men and the plutocracy”. Yet not all contemporaries shared this view. Georges
Clémenceau—a lawmaker and journalist at L’aurore—argued that the newspapers’ readership
must be blamed for failing to identify the truth; the novelist Emile Zola and the socialist
lawmaker Jean Jaurès pointed that one should be confident in the outcome of a free competition
that sorts out good journals from bad.
March 1908 saw another financial affair that linked politics, the financial market, and the
media. This was the Rochette affair,5 which also ended up in a commission of the National
Assembly and a court judgment. Rochette was a financier who owned two banks, about a dozen
other companies (notably mines), and three financial newspapers. When he tried to take over Le
petit journal—a newspaper owned and managed by Senator Charles Prevet—the Paris’ préfet 4 He had earlier written that, “among all the vileness of the Panama scandal, the role played by the press was the most shameful” (Leroy-Beaulieu 1894, p. 733). 5 The most reliable source of information on the Rochette affair is the parliamentary report (Folleville 1911).

7
Lépine (the highest representative of the French government in Paris) searched for investors to
lodge a complaint against Rochette, who was accused of releasing flawed and possibly altered
information on his companies. According to the 1910 judgement, he attempted to influence
investors through his own newspapers 6 and by contracting with other newspapers to publicize
his companies. Rochette was convicted and sentenced to three years in jail. This financial
turmoil revivified the public debate on the mutual influence of newspapers and financiers.
In this context of periodic scandals, contemporaries such as Lysis blamed the “quite
universal corruption of our [French] press, paid, sold, indentured by the financial powers” (1912,
p. 168).7 Paul Leroy Beaulieu, editor of l’Economiste Français, argued that when “articles and
advertising are mixed up, it is clear that the press is losing its authority. It should no longer be
regarded as a collection of information and people must distrust it” (Cassagnac 1893, pp. 4–5).
Kaufmann, a German economist who published a detailed analysis of French banks, agreed and
asserted that the financial press “does not have a value as an source of information; It is, as
perfectly put by Lysis—and besides few exceptions that are becoming rarer—an advertisement
press rather than an opinion press” (1914, p. 210; emphasis in original).
Building on those judgements, French historians—with the notable exception of Marc
Martin—blamed this venality for weakening the press’s credibility among the public. As Albert
(1972, pp. 266–267) asserted, “financial advertising contributed to a significant extent to give to
the French people a distorted view of the facts”; he added: “It exerted a real censorship on the
economic information which resulted, in the short run, in a discredit of the business world to
French eyes and in the long run, to divert their attention from economic issues.” Jeanneney
(1981) observed that opinions published in newspapers “were not for sure independent of secret
subsidies” (p. 210) and noted that financial advertising “takes the shape of misleading editorial
analysis” (p. 211).
6 Finance Pratique, Bulletin Hebdomadaire du Banco Franco Espagnol and Moniteur de la Banque et de la Bourse. 7 See also Esteves (2007, pp. 5–6) for an account of Lysis’s grievances.
8
Although such financial affairs clearly hurt the welfare of investors, relying on them to
assess the quality of financial newspapers is misleading because investors are typically not
sufficiently informed on enough firms to judge fairly. Therefore, in order to evaluate the quality
of the French financial press, we must construct a quantitative test capable of measuring the
effect of payments made to newspapers on their editorial policy. Toward this end, we must
isolate a variable that can be used to find traces of those payments, which we describe in more
detail next.
2.2. Direct payments to newspapers
During the Panama scandal, a fear of their newspapers’ lost credibility led some editors to
reconsider current advertising arrangements. Paul de Cassagnac, a lawmaker of the Bonapartist
party and editor of L’Autorité, argued in 1893 that receiving funds from companies is not, per se,
an indication of corruption as long as the editorial content and the advertising section appear as
two different and clearly separate sections of the newspaper. This view of payments to
newspapers became dominant later in the century, but this particular solution was not
implemented before 1914 (Delporte 1999). Until then, firms continued to pay for editorial
articles, not for advertising as that term is normally understood.
Payments were made to newspapers because the payer expected, in exchange, some
coverage or some spinning of the news. Although it has proved impossible to re-enact each
payment made by firms to newspapers, there are many indications of the payment pattern. In his
handbook intended for small investors, Neymarck (1911, pp. 63–64) indicated that, when a stock
is introduced on the market, “the promotion in the newspapers using advertisement and articles”
was common and that, in this, France was just following the widespread practice in America and
England. He further added that it would have been a “mistake to believe that those expenses
could have been avoided” (p. 66). Oscar Marinitsch, who worked in the financial advertising
sector and wrote a book in 1892 to inform on stock exchange practices, pointed out that “the

9
good—as well as the bad—deals cannot succeed without the help of the press” and that
consequently the information providers “contracted with the journalists or editor of the financial
press or of the newspapers’ financial section” (Marinitsch 1892, p. 292).
Payments were not made directly from firms to newspapers; rather, they were
intermediated by the investment banks (Lajeune vilar 1895). The correspondence of Raffalovich
(1931)—a distinguished economist but also a secret advisor of the Russian Finance minister, and
thus the dispatcher of Russian Tsarist funds to French newspapers—acknowledged that he
received the indication summing up all payments made to newspapers through the Banque de
Paris et des Pays Bas.8 One of the advantages of this delegation was that pooling the payments
of various firms gave banks more bargaining power against newspapers and so allowed banks to
become a greater threat to them (Raffalovich 1931, p. 207).9 Another reason for delegation could
have been that banks knew more than firms did about the workings of the media industry. Since
banks also provided firms with other services such as financial advertisements and legal
representation (and since this fact was publicly known), “direct payments made by firms to
newspapers are suitably proxied by these firms’ relationships with their investment banks.
3. Methodology and samples on newspapers and securities
Although payments could have distorted the information available to investors and hence their
allocation of funds to financial assets (Merton 1987), we show in Section 3.1 that such payments
do not in themselves prove information distortion. In order to assess newspapers’ quality, in
Section 3.2 we propose a quantitative test of the (potential) induced distortions.
3.1. Theoretical background
8 Raffalovich (1931, pp. 74, 176, 205, 208). 9 Newspapers regularly asked for an increase in advertising from the Russian Empire. A letter of 20 October 1908 stated: ‘A contract between the representative of the Finances ministry and the various newspapers will have the drawback of overexciting the envies because they will have for the first time to negotiate directly with a government official of Russia instead of a bank employee.’ (Raffalovich 1931, p. 207).

10
A financial newspaper is a firm that selects a set of information and reveals it to its readers. Most
of the discussion implied by this definition revolves around the elements that determine the
news’ selection and especially on whether it is made with the precision and neutrality of normal
news reports. Potential biases arise because newspapers are intervening in a two-sided market.
On one side they form relationships with the information providers (the supply side of news) and
with the advertising market; on the other side they interact with readers by selling issues (the
demand side). Financial newspapers can thus be viewed as “matchmakers”: some firms are
highlighted (to the potential advantage of reader-investors) by their selection to the sample of
firms covered in each issue.
As noticed by Rochet and Tirole (2004), most markets are two-sided. But on most of
those markets the payment structure (who pays what on which side of the market) is neutral. If
there is some externality between the two sides, then a Coasian bargaining can implement the
first-best allocation because it allows agents to be compensated ex post for losses induced by the
externality (Coase 1960). The main point of this literature is to focus on markets where one side
imposes on the other an externality for which Coasian bargaining cannot compensate. Clearly,
the selection of information published by newspapers exerted an externality on their readers.
Moreover, because information is a public good, it is difficult to find a mechanism making
readers pay entirely for this externality.
An important consequence of the theory of two-sided markets in this context is that the
payment structure is no longer neutral: it becomes an instrument for inducing both sides of the
market to participate. Numerous papers have shown that the price charged to one side of the
market can be used to subsidize the other side. With the financial newspapers, this implies that
charging information providers to publish information was neither corrupt nor venal but, rather,
simply an indirect subsidy paid by information providers to readers. This need not create an

11
economic inefficiency, since those payments may have been a precondition of the newspaper’s
existence.
However, efficiency would suffer if newspapers switched their news coverage to poorly
performing firms, since this could lead investors to make poor choices in their portfolio
allocation. Yet a newspaper’s objectives can be influenced both by its readers’ preferences and
by its relations with information providers or advertisers. Therefore, it is natural to test for bias
resulting from supply-side payments by assessing whether a newspaper is hewing to the best
interests of its readers or of its advertisers.
From the reader’s point of view, a financial newspaper is a collection of pieces of
information on financial assets and on events that could affect their prices. We can expect
rational readers to buy one issue of a given newspaper if the value of the information content—
its accuracy and relevance to the financial market—is greater than the cost of buying it. The
newspaper then has an incentive to build a reputation for accuracy (Coase 1974) whose effect is
to “selectively reduce [an] agent’s cost of collecting information and evaluating information”
(Dyck & Zingales 2002). Gentzkow and Shapiro (2006) provided an additional result by
showing that, when media compete on the basis of reputation, slanting is reduced if consumers
can easily learn the “true” information.
Of course, newspapers wish to maintain their relations with sources of primary material.
The firms themselves are the principal information providers through disclosure of their
accounting figures, sales records, and/or business perspectives (e.g., information on new
contracts). Although a reader benefits from learning all types of news, firms typically have a
vested interest in disclosing only information whose expected impact is to increase the stock
price (else disclosure could damage the firm’s value). Hence the firm has an incentive to use
newspapers to signal positive information to investors, and it is more than willing to pay for that.
Even when a firm has no interest in disclosing some information, it may be that someone inside

12
the firm (or a third party, such as a competitor) does. In this way, a newspaper can use its
relationships with all information providers to raise its revenue by demanding payments. Such
advertising does help to reduce a newspaper’s price and hence to increase the readership, but it
could create two biases. First, it could alter the distribution of published information toward
paying firms. Second, it could bias this distribution toward positive news.
In sum, each of the relationships managed by newspapers (readers and advertisers or
information sources) can decrease the value—for rational consumers—of the published
information. When investors have preferences regarding some subset of firms, a media outlet
may well bias disclosed information toward that subset in order to increase readership. When a
newspaper’s informational content is strongly linked to advertisers, the likely effect is to bias the
distribution of news toward advertising firms (as compared to the case of no advertising).
Finally, when information is not freely available, the relationship between newspaper editors and
information providers will bias published information toward those sources that have an interest
in widening their audience.
3.2. Testing for the accuracy of firms’ media coverage
We’ve shown that two tests must be conducted in order to measure the potential biases. First, we
test for the “positive news” bias that sources induce by computing the ratio of negative to total
information published in each newspaper. Second, we assess the accuracy of the press by
proposing and testing determinants of the media coverage of firms listed on the stock market. It
is worth noting that our test of coverage bias also yields results on the slanting of information by
newspapers when providers must pay to have information published, because the payment often
entails not only coverage but also some spinning of the news.
The regressions take into account that a newspaper could have targeted one of several
different readerships. It might target liquidity traders—that is, those who must be able to sell
their financial assets when needed. In that case, a newspaper would tend to cover firms with high
13
liquidity on the market and those with asset prices of (relatively) low volatility. Another potential
target was the rentiers (i.e., long-term investors with a “buy and hold” strategy). In all cases
we’ll assume that the quantity of positive information on firms published by one newspaper
defines a portfolio of assets. A newspaper that wanted to maximize the value of information for
these investors should choose a portfolio according to the mean-variance theory. Readers of the
rentier type seek information on low-risk firms generating relatively low yields (e.g., large firms
with a high market capitalization) or on firms with high yields but at high risk. The need to
attract a targeted readership means that the regression results on financial variables will define
the profile of each newspaper.
We will also allow firms’ coverage to reflect the newspaper tendency to write about
enterprises with a wide audience (Nguyen-Dang 2006). This will bias the selection of news
toward big firms or some sectors. We also check for any relation between a firms’ country of
registration and its press exposure. This effect will be negative if investors were reluctant to hold
stocks issued by foreign firms (e.g., because it was costly to enforce property rights in another
judicial system). Finally, another newspaper motive could have been to provide coverage of
firms operating abroad, given that such information would be more difficult and expensive (than
with a domestic firm) for an individual investor to gather directly.
The regression also takes into account the possible bias induced by advertising.10 Two
channels could have influenced the media. First, as documented in Reuter (2004) and Reuter and
Zitzewitz (2006), one can expect a positive correlation between firms’ coverage and the volume
of their advertising. Moreover, since newspapers also received payments – mediated by
investment banks – from firms for the publication in the editorial part, we include a variable to
proxy for those payments (see Section 2.2). 10 This bias was documented by Reuter (2004) and Reuter and Zitzewitz (2006). Reuter (2004) found only limited evidence for a positive correlation between product reviews and advertising. Reuter and Zitzewitz (2006) showed that major personal finance magazine are ‘more likely to recommend funds from families that have advertised within their pages in the past’, but they document no such relationship for newspapers (e.g., the New York Times or the Washington Post) covering more general subjects for a wider audience.

14
The test of coverage bias is implemented using the number of times a firm received
coverage in a given newspaper as the left-hand-side variable (Exposure). On the right-hand side
we have a set (SP) of financial variables that reflect the firm’s stock market performance, a set
(FC) of variables that describe the firm’s characteristics, a measure (Ads) of each firm’s
advertising volume in the newspaper, and a proxy (Banks) for direct payments made to
newspaper. This yields the following model:
Exposure = constant + a(SP) + b(FC) + c(Ads) + e(Banks) + ui
We are interested in knowing how the set of financial variables interacts with the Ads and
DP variables. The null assumption is as follows. When its readers are rational investors (i.e. they
want to learn about events that can affect their financial assets), we expect a newspaper’s editor
to select the most accurate available information in order to maximize readership (and build
reputation). Thus we expect to find that financial variables are significant and that payments
variables (both Ads and Banks) are insignificant. However, the desired reputation effect could be
negated by payments that might boost the exposure of the paying firms. In this case, financial
variables may well appear to be insignificant while those on payments do not, indicating that
payments were the main driver of the newspapers’ editorial policy.
A third possibility is that both types of variables (payments and financial) are significant.
In that case, it would be hard to distinguish the effect on investors’ welfare of payments made by
firms from the effect of financial performance. We tackle this issue by computing various
measures—of the quality of a newspaper’s editorial content under various counterfactual
scenarios—that use the regression results to remove the potential effect of our payment variables
on media coverage. The measures used to assess the quality of the newspapers’
recommendations are the mean of the return (i.e., the mean of the stock’s dividend/price ratio)
and the variance of the return, both computed for each newspaper based on the sample of firms
that it covered. These measures will allow us to assess whether or not a given investor was worse
15
off (in terms of return) when those payment variables that could affect media coverage of a firm
are included in the computation.
4. Database and sample of newspapers
To test the accuracy of newspaper’s coverage, we used a sample of four newspapers; see Section
4.1. The most reputable were chosen, since it’s likely that rational readers will also have chosen
them to get information on traded securities. In order to account for the selection (or not) of
firms by newspaper, the characteristics of the entire population of firms listed on the stock
market were also gathered. This information is described in Section 4.2.
4.1. The sample of newspapers
The number of financial periodicals at the beginning of the 20th century was gauged by Albert
(1972) to be in the hundreds. However, among the 186 periodicals active in 1891, Marinitsch
(1892, p. 292) pointed that 25 were unofficial mouthpieces of credit banks, another 25 were
managed by journalists of various renown, and the rest were owned by financial intermediaries.
In selecting the sample of newspapers to be analyzed, we restricted our choice to weekly
journals with a wide coverage of financial markets. We selected two of the most reputable
periodicals, L’Economiste Européen (hereafter EURO) and the Rentier (RENT, published every
ten days). These newspapers had a good reputation, were managed by independent journalists
who were also economists,11 and resembled modern financial periodicals in presenting detailed
macroeconomic information, news on firm activities, some accounting figures, and a full list of
security quotations. Moreover, these two were among the few that did not offer any
(supplementary) financial services, as the subtitle to Le Rentier indicated from 27 July 1906
11 Edmond Théry and Alfred Neymarck, respectively.
16
onward.12 To test for a potential effect of ownership on the editorial policy we added two other
newspapers, the Journal des Intérêts Financiers (INTFIN) and La Semaine Financière (SEM).
The former was owned and managed by a bank (the Crédit Mobilier Français); the latter,
although it appeared to be independent and was managed by journalist Charles Bourdon, offered
its readers financial brokerage services and was probably linked to the Banque des Français.13
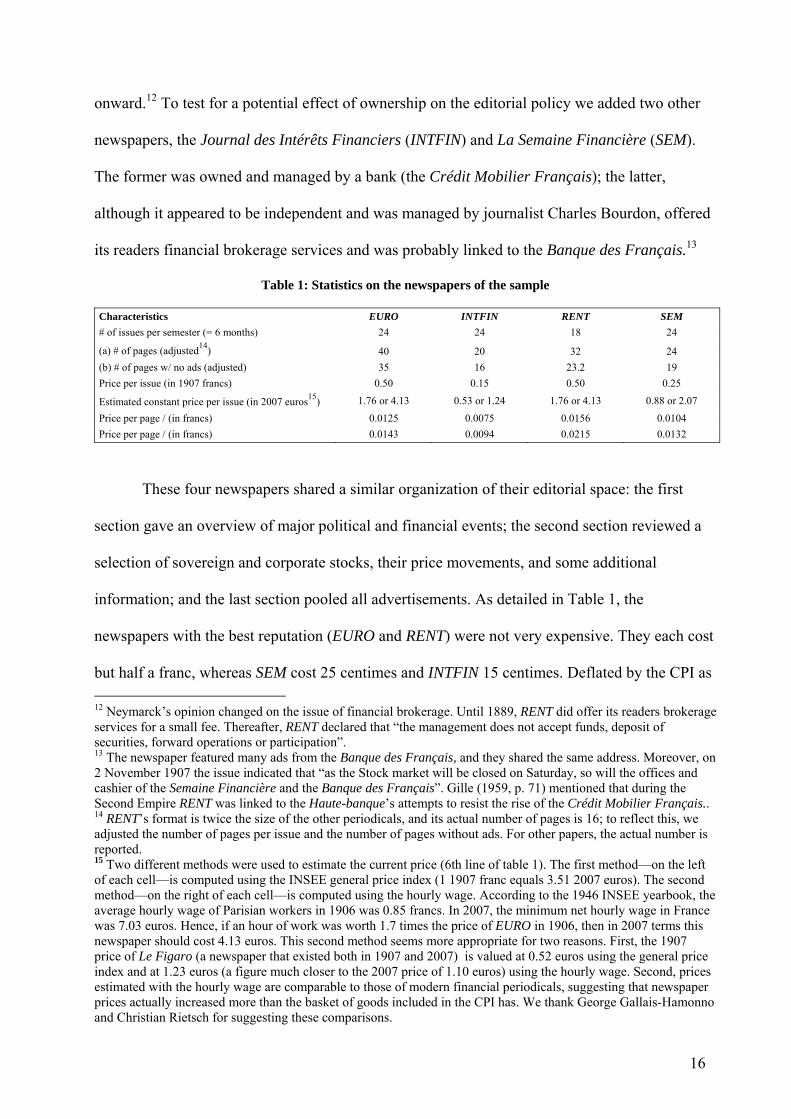
Table 1: Statistics on the newspapers of the sample
Characteristics EURO INTFIN RENT SEM # of issues per semester (= 6 months) 24 24 18 24
(a) # of pages (adjusted14) 40 20 32 24 (b) # of pages w/ no ads (adjusted) 35 16 23.2 19 Price per issue (in 1907 francs) 0.50 0.15 0.50 0.25
Estimated constant price per issue (in 2007 euros15) 1.76 or 4.13 0.53 or 1.24 1.76 or 4.13 0.88 or 2.07
Price per page / (in francs) 0.0125 0.0075 0.0156 0.0104 Price per page / (in francs) 0.0143 0.0094 0.0215 0.0132
These four newspapers shared a similar organization of their editorial space: the first
section gave an overview of major political and financial events; the second section reviewed a
selection of sovereign and corporate stocks, their price movements, and some additional
information; and the last section pooled all advertisements. As detailed in Table 1, the
newspapers with the best reputation (EURO and RENT) were not very expensive. They each cost
but half a franc, whereas SEM cost 25 centimes and INTFIN 15 centimes. Deflated by the CPI as 12 Neymarck’s opinion changed on the issue of financial brokerage. Until 1889, RENT did offer its readers brokerage services for a small fee. Thereafter, RENT declared that “the management does not accept funds, deposit of securities, forward operations or participation”. 13 The newspaper featured many ads from the Banque des Français, and they shared the same address. Moreover, on 2 November 1907 the issue indicated that “as the Stock market will be closed on Saturday, so will the offices and cashier of the Semaine Financière and the Banque des Français”. Gille (1959, p. 71) mentioned that during the Second Empire RENT was linked to the Haute-banque’s attempts to resist the rise of the Crédit Mobilier Français.. 14 RENT’s format is twice the size of the other periodicals, and its actual number of pages is 16; to reflect this, we adjusted the number of pages per issue and the number of pages without ads. For other papers, the actual number is reported. 15 Two different methods were used to estimate the current price (6th line of table 1). The first method—on the left of each cell—is computed using the INSEE general price index (1 1907 franc equals 3.51 2007 euros). The second method—on the right of each cell—is computed using the hourly wage. According to the 1946 INSEE yearbook, the average hourly wage of Parisian workers in 1906 was 0.85 francs. In 2007, the minimum net hourly wage in France was 7.03 euros. Hence, if an hour of work was worth 1.7 times the price of EURO in 1906, then in 2007 terms this newspaper should cost 4.13 euros. This second method seems more appropriate for two reasons. First, the 1907 price of Le Figaro (a newspaper that existed both in 1907 and 2007) is valued at 0.52 euros using the general price index and at 1.23 euros (a figure much closer to the 2007 price of 1.10 euros) using the hourly wage. Second, prices estimated with the hourly wage are comparable to those of modern financial periodicals, suggesting that newspaper prices actually increased more than the basket of goods included in the CPI has. We thank George Gallais-Hamonno and Christian Rietsch for suggesting these comparisons.
17
computed by the French statistical office (INSEE), the 2007 value of these prices ranges between
0.88 and 1.76 euros per issue. Computing the actual cost using hourly wages gives higher but
comparable figures (between 1.24 and 4.13 euros). The cost per page of editorial content was
also cheap, though it varied substantially and ranged from less than 1 centime for INTFIN to 2.15
centimes for RENT.
To assess media exposure, we counted how many times each publicly traded company
received exposure in each of the four newspapers. These pieces of information were collected for
the period from 1 July to 31 December 1907. To minimize possible effects stemming from a bear
or a bull market, we chose a period that was characterized by a fairly stable stock price index;
see Figure 1.
Figure 1: Evolution of the Paris Bourse stock index (1905–1910)
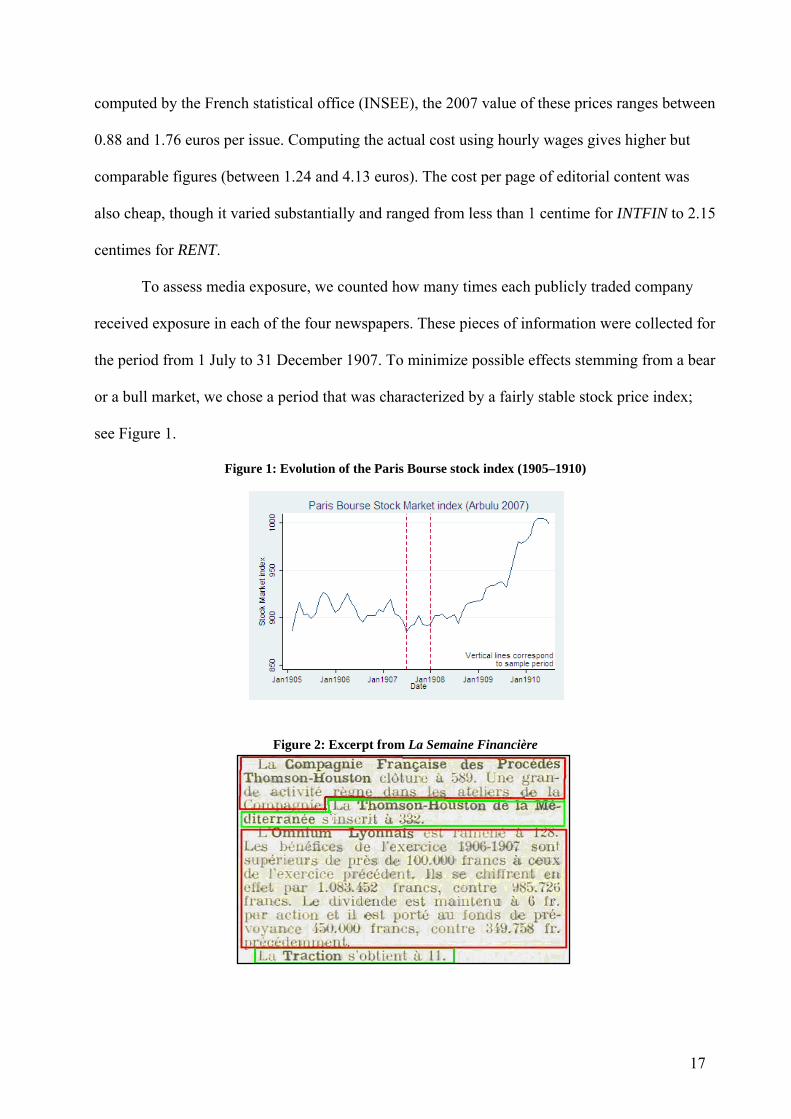
Figure 2: Excerpt from La Semaine Financière
18
The information published was coded as follows. We considered as significant any piece
of information richer than the stock price. Each newspaper published a list of prices in a separate
section, and each piece of information that mentioned only the stock price of the company was
coded as 0; richer pieces of information were coded as 1. Figure 2 is an excerpt from the 16
November 1907 edition of SEM that illustrates our coding methodology. For Thomson-Houston
de la Méditerranée and Traction, the newspaper gives only the stock price (outlined in red in the
figure) and so a value of 0 was assigned. Readers obtained more valuable information (outlined
in green) for the other two companies mentioned in Figure 2, such as “the factories of the
Compagnie Française des Procédés Thomson Houston experienced a significant business
activity” and that Omnium Lyonnais made higher profits in 1906–1907 than before. Hence these
two observations were each coded as 1 in the database. We performed this exercise for all the
information published on firms in the four newspapers.
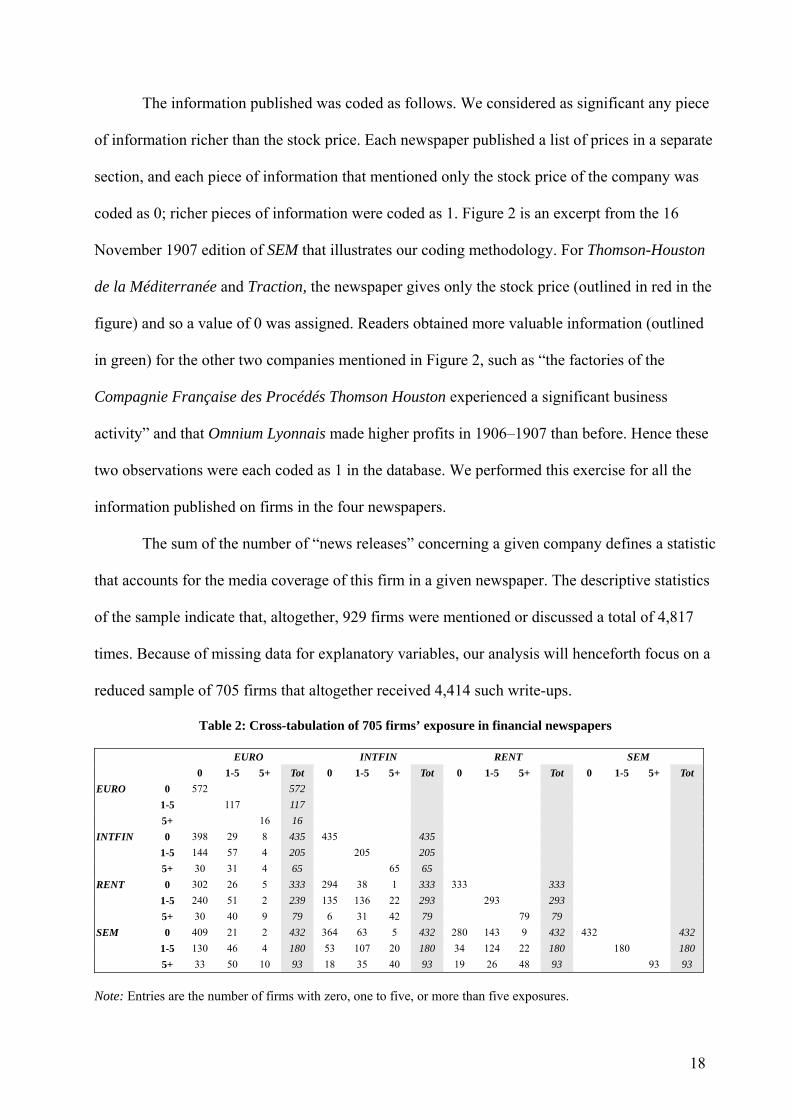
The sum of the number of “news releases” concerning a given company defines a statistic
that accounts for the media coverage of this firm in a given newspaper. The descriptive statistics
of the sample indicate that, altogether, 929 firms were mentioned or discussed a total of 4,817
times. Because of missing data for explanatory variables, our analysis will henceforth focus on a
reduced sample of 705 firms that altogether received 4,414 such write-ups.
Table 2: Cross-tabulation of 705 firms’ exposure in financial newspapers
EURO INTFIN RENT SEM 0 1-5 5+ Tot 0 1-5 5+ Tot 0 1-5 5+ Tot 0 1-5 5+ Tot
EURO 0 572 572 1-5 117 117 5+ 16 16
INTFIN 0 398 29 8 435 435 435 1-5 144 57 4 205 205 205 5+ 30 31 4 65 65 65
RENT 0 302 26 5 333 294 38 1 333 333 333 1-5 240 51 2 239 135 136 22 293 293 293 5+ 30 40 9 79 6 31 42 79 79 79
SEM 0 409 21 2 432 364 63 5 432 280 143 9 432 432 432 1-5 130 46 4 180 53 107 20 180 34 124 22 180 180 180 5+ 33 50 10 93 18 35 40 93 19 26 48 93 93 93
Note: Entries are the number of firms with zero, one to five, or more than five exposures.
19
Newspapers differed in the number of companies for which information was published.
Out of 705 firms, RENT provided exposure to only 372 of them; the figures for EURO, SEM, and
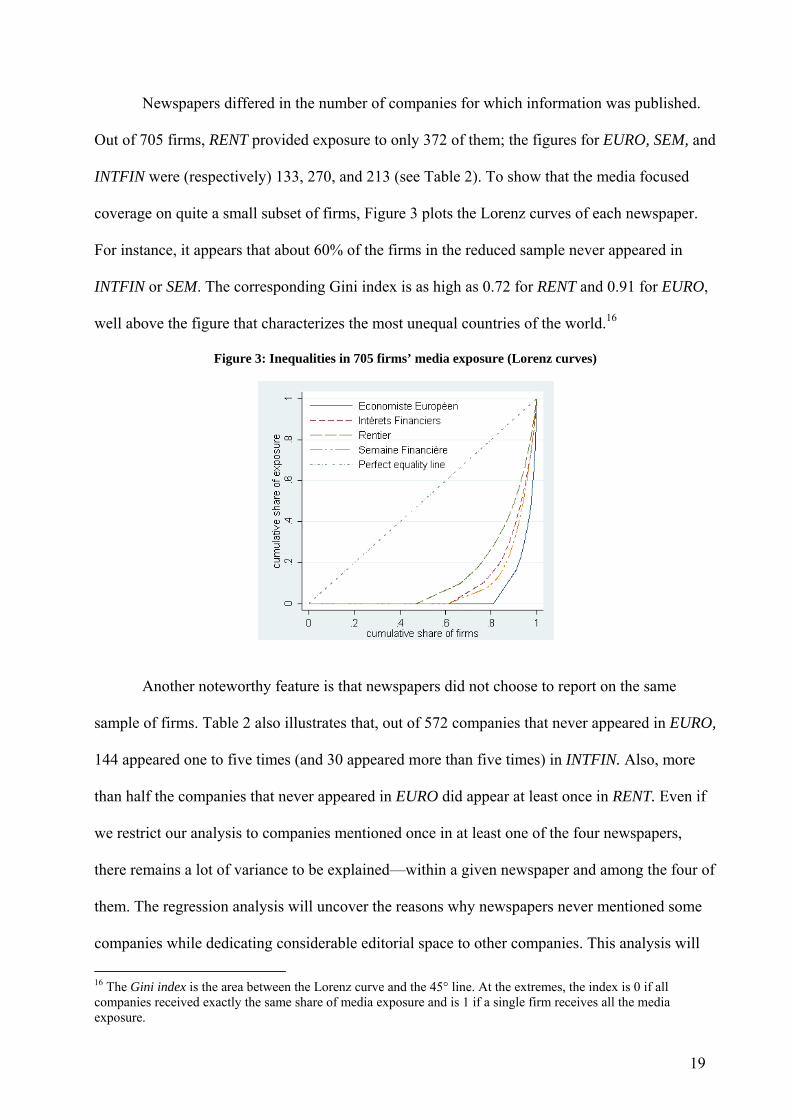
INTFIN were (respectively) 133, 270, and 213 (see Table 2). To show that the media focused
coverage on quite a small subset of firms, Figure 3 plots the Lorenz curves of each newspaper.
For instance, it appears that about 60% of the firms in the reduced sample never appeared in
INTFIN or SEM. The corresponding Gini index is as high as 0.72 for RENT and 0.91 for EURO,
well above the figure that characterizes the most unequal countries of the world.16
Figure 3: Inequalities in 705 firms’ media exposure (Lorenz curves)
Another noteworthy feature is that newspapers did not choose to report on the same
sample of firms. Table 2 also illustrates that, out of 572 companies that never appeared in EURO,
144 appeared one to five times (and 30 appeared more than five times) in INTFIN. Also, more
than half the companies that never appeared in EURO did appear at least once in RENT. Even if
we restrict our analysis to companies mentioned once in at least one of the four newspapers,
there remains a lot of variance to be explained—within a given newspaper and among the four of
them. The regression analysis will uncover the reasons why newspapers never mentioned some
companies while dedicating considerable editorial space to other companies. This analysis will
16 The Gini index is the area between the Lorenz curve and the 45° line. At the extremes, the index is 0 if all companies received exactly the same share of media exposure and is 1 if a single firm receives all the media exposure.
20
enable us to assess each journal’s editorial policy, that is, the choices made when selecting the
subsample of firms to feature.
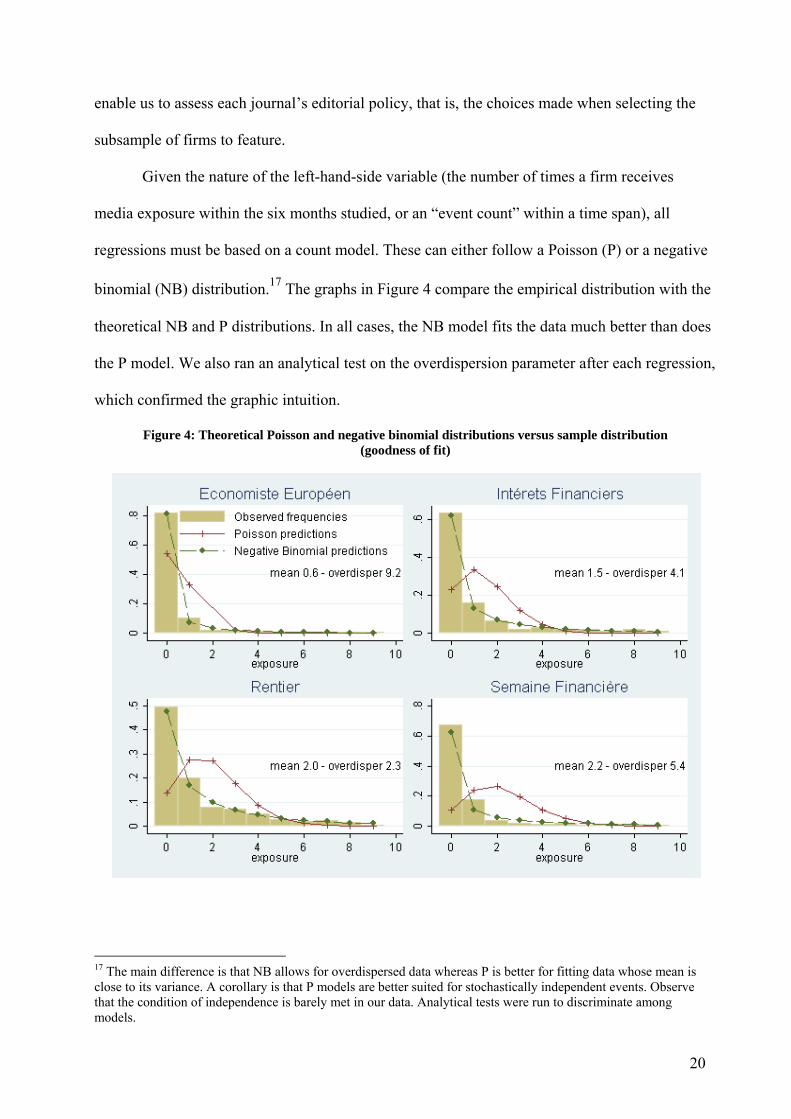
Given the nature of the left-hand-side variable (the number of times a firm receives
media exposure within the six months studied, or an “event count” within a time span), all
regressions must be based on a count model. These can either follow a Poisson (P) or a negative
binomial (NB) distribution.17 The graphs in Figure 4 compare the empirical distribution with the
theoretical NB and P distributions. In all cases, the NB model fits the data much better than does
the P model. We also ran an analytical test on the overdispersion parameter after each regression,
which confirmed the graphic intuition.
Figure 4: Theoretical Poisson and negative binomial distributions versus sample distribution (goodness of fit)
17 The main difference is that NB allows for overdispersed data whereas P is better for fitting data whose mean is close to its variance. A corollary is that P models are better suited for stochastically independent events. Observe that the condition of independence is barely met in our data. Analytical tests were run to discriminate among models.
21
4.2. Database
The list of covariates is organized into three groups. The first includes all variables summing up
the financial performance, and the second adds controls for characteristics of the firm. Finally,
the third group concerns payments made by firms to newspapers. In this section we describe how
these variables were constructed.
Financial performance variables
Financial data came from the 1907–1909 Stock Exchange yearbooks and from daily or monthly
stock price bulletins. Data were collected on 929 firms with equity traded in Paris, either at the
official stock exchange or in the Coulisse (over-the-counter) during July 1907. Because of
missing data on dividends, the sample was reduced to the 705 companies for which capitalization
and 1907 dividends are known.
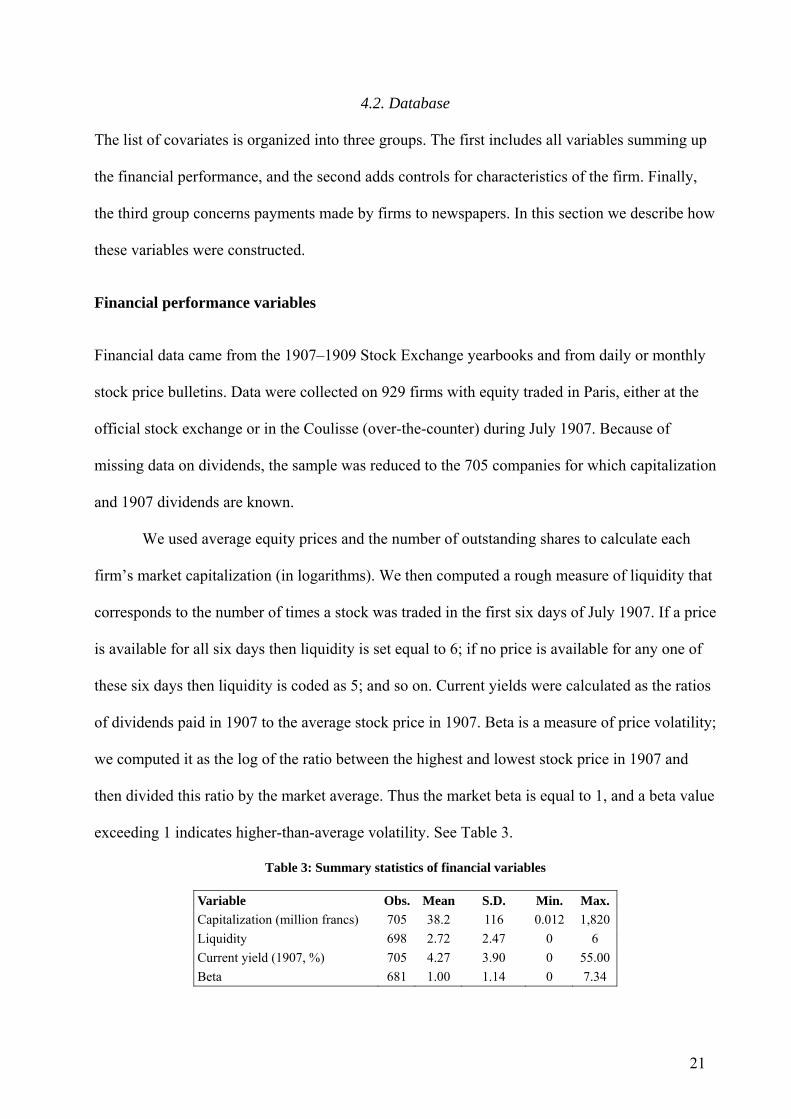
We used average equity prices and the number of outstanding shares to calculate each
firm’s market capitalization (in logarithms). We then computed a rough measure of liquidity that
corresponds to the number of times a stock was traded in the first six days of July 1907. If a price
is available for all six days then liquidity is set equal to 6; if no price is available for any one of
these six days then liquidity is coded as 5; and so on. Current yields were calculated as the ratios
of dividends paid in 1907 to the average stock price in 1907. Beta is a measure of price volatility;
we computed it as the log of the ratio between the highest and lowest stock price in 1907 and
then divided this ratio by the market average. Thus the market beta is equal to 1, and a beta value
exceeding 1 indicates higher-than-average volatility. See Table 3.
Table 3: Summary statistics of financial variables
Variable Obs. Mean S.D. Min. Max. Capitalization (million francs) 705 38.2 116 0.012 1,820 Liquidity 698 2.72 2.47 0 6 Current yield (1907, %) 705 4.27 3.90 0 55.00 Beta 681 1.00 1.14 0 7.34
22
Firm characteristics
Sectors and markets. Companies were classified as belonging to one of the following seven
industries: banks and insurance; railways; utilities; mining (other than coal); coal; “new
economy” (i.e. chemical industry, electricity and carmakers); or metal work (typically steel). All
companies that could not be placed within these sectors were aggregated into a category entitled
“other”;18 this includes firms such as printers, hotels and other tourism companies, and the food
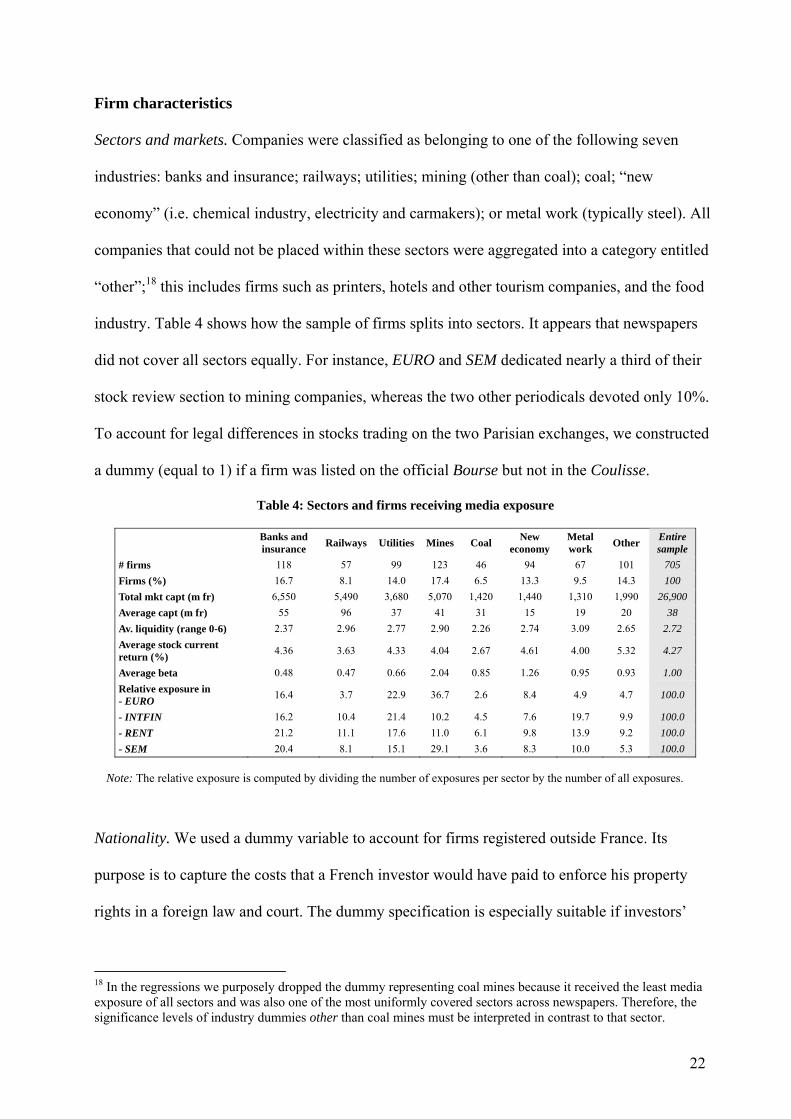
industry. Table 4 shows how the sample of firms splits into sectors. It appears that newspapers
did not cover all sectors equally. For instance, EURO and SEM dedicated nearly a third of their
stock review section to mining companies, whereas the two other periodicals devoted only 10%.
To account for legal differences in stocks trading on the two Parisian exchanges, we constructed
a dummy (equal to 1) if a firm was listed on the official Bourse but not in the Coulisse.
Table 4: Sectors and firms receiving media exposure
Banks and insurance Railways Utilities Mines Coal New
economy Metal work Other Entire
sample # firms 118 57 99 123 46 94 67 101 705 Firms (%) 16.7 8.1 14.0 17.4 6.5 13.3 9.5 14.3 100 Total mkt capt (m fr) 6,550 5,490 3,680 5,070 1,420 1,440 1,310 1,990 26,900 Average capt (m fr) 55 96 37 41 31 15 19 20 38 Av. liquidity (range 0-6) 2.37 2.96 2.77 2.90 2.26 2.74 3.09 2.65 2.72 Average stock current return (%) 4.36 3.63 4.33 4.04 2.67 4.61 4.00 5.32 4.27
Average beta 0.48 0.47 0.66 2.04 0.85 1.26 0.95 0.93 1.00 Relative exposure in - EURO 16.4 3.7 22.9 36.7 2.6 8.4 4.9 4.7 100.0
- INTFIN 16.2 10.4 21.4 10.2 4.5 7.6 19.7 9.9 100.0 - RENT 21.2 11.1 17.6 11.0 6.1 9.8 13.9 9.2 100.0 - SEM 20.4 8.1 15.1 29.1 3.6 8.3 10.0 5.3 100.0
Note: The relative exposure is computed by dividing the number of exposures per sector by the number of all exposures.
Nationality. We used a dummy variable to account for firms registered outside France. Its
purpose is to capture the costs that a French investor would have paid to enforce his property
rights in a foreign law and court. The dummy specification is especially suitable if investors’
18 In the regressions we purposely dropped the dummy representing coal mines because it received the least media exposure of all sectors and was also one of the most uniformly covered sectors across newspapers. Therefore, the significance levels of industry dummies other than coal mines must be interpreted in contrast to that sector.

23
costs were mainly fixed cost. Finally, the dummy “colony” captures the effect of a firm operating
in a French colony (52 firms).
Distance. In order to account for differences in coverage explained by mere geography, we
computed a measure of distance that relies on the country in which the firms operated its (main)
business. The measure captures the difficulty that investors might encounter in gathering
information about firms. This is especially important because many companies (87 in our
sample) operated outside the country in which they were registered (mostly France, the United
Kingdom, and Belgium). To account for the familiarity that investors might have felt toward
some country, distance is (inversely) weighted by the country share in the total capitalization of
the listed companies.19
Payments to newspapers
Advertisements. Firms could pay for two types of ads. The advertisement section included
commercial announcements of new products or services such as railway fares, insurance
companies’ policies, the opening of a new branch by a given bank, and so forth. Issuers of
publicly traded securities also used such advertising as a medium to inform the wider public on
financial news, such as the introduction of a new security on the market or shareholders’
meeting, and also to announce the serial numbers of bonds drawn at the lottery for
reimbursement. We have counted the number of advertisements of both types paid by each
company. The regressions used two specifications for this variable, either the actual number of
ads or a dummy (equal to 1) if the company advertised in the newspaper. As shown in Table 5,
firms that advertised have, on average, a significantly higher capitalization and lower stock
19 The intuition behind this measure is that as the number of stocks from a particular country grows, so should the flow of information from that country to Paris, making it seem to be less distant. Thus, high availability of information is assumed to reduce the country’s perceived distance in investors’ minds (and vice versa). The significance and sign of the variable in the regressions are not affected by this weighting.
24
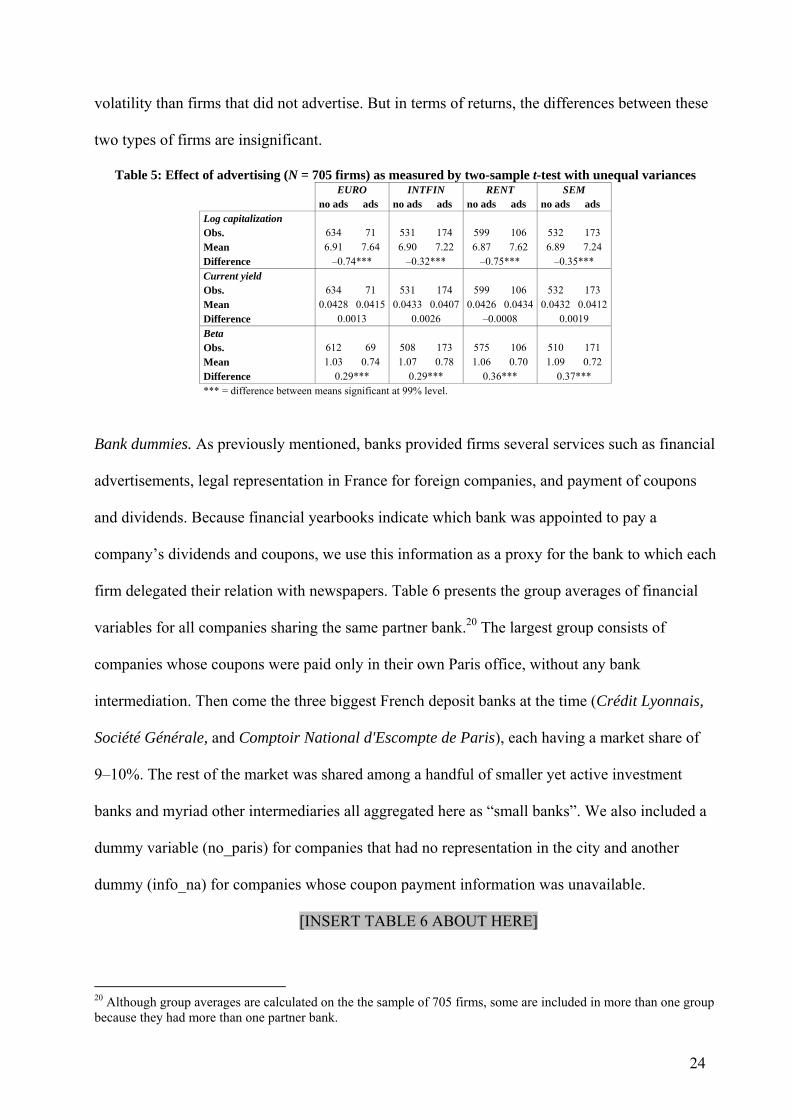
volatility than firms that did not advertise. But in terms of returns, the differences between these
two types of firms are insignificant.
Table 5: Effect of advertising (N = 705 firms) as measured by two-sample t-test with unequal variances EURO INTFIN RENT SEM no ads ads no ads ads no ads ads no ads ads
Log capitalization Obs. 634 71 531 174 599 106 532 173 Mean 6.91 7.64 6.90 7.22 6.87 7.62 6.89 7.24 Difference –0.74*** –0.32*** –0.75*** –0.35*** Current yield Obs. 634 71 531 174 599 106 532 173 Mean 0.0428 0.0415 0.0433 0.0407 0.0426 0.0434 0.0432 0.0412 Difference 0.0013 0.0026 –0.0008 0.0019 Beta Obs. 612 69 508 173 575 106 510 171 Mean 1.03 0.74 1.07 0.78 1.06 0.70 1.09 0.72 Difference 0.29*** 0.29*** 0.36*** 0.37*** *** = difference between means significant at 99% level.
Bank dummies. As previously mentioned, banks provided firms several services such as financial
advertisements, legal representation in France for foreign companies, and payment of coupons
and dividends. Because financial yearbooks indicate which bank was appointed to pay a
company’s dividends and coupons, we use this information as a proxy for the bank to which each
firm delegated their relation with newspapers. Table 6 presents the group averages of financial
variables for all companies sharing the same partner bank.20 The largest group consists of
companies whose coupons were paid only in their own Paris office, without any bank
intermediation. Then come the three biggest French deposit banks at the time (Crédit Lyonnais,
Société Générale, and Comptoir National d'Escompte de Paris), each having a market share of
9–10%. The rest of the market was shared among a handful of smaller yet active investment
banks and myriad other intermediaries all aggregated here as “small banks”. We also included a
dummy variable (no_paris) for companies that had no representation in the city and another
dummy (info_na) for companies whose coupon payment information was unavailable.
[INSERT TABLE 6 ABOUT HERE]
20 Although group averages are calculated on the the sample of 705 firms, some are included in more than one group because they had more than one partner bank.

25
4. Results
Our aim is to discover whether media exposure is a function either of a firm’s financial
performance or of payments that it made to newspapers. This test is implemented by matching
the sample of firms cited in the media and the characteristics of the population of listed firms.
We first review results concerning the impact of financial variables on editorial policy, and then
we quantify the bias created by payments.
4.1. Various targeted readerships
The first result is that editors did not choose the content of their periodicals at random, since they
were valuable to readers as guidelines for investments only if they highlighted some firms and
profiled their position in the market. Consequently, most financial variables are significant in the
regression. Tables 7–10 give the regression outputs for each newspaper. They show that a firm’s
market capitalization and stock liquidity is always positively correlated with its media exposure.
The measure of stock price variance is never significant, which could indicate that most
newspapers did not target liquidity traders but rather investors with a buy-and-hold strategy (i.e.,
rentiers).
[INSERT TABLE 7 ABOUT HERE]
[INSERT TABLE 8 ABOUT HERE]
[INSERT TABLE 9 ABOUT HERE]
[INSERT TABLE 10 ABOUT HERE]
The significance of those financial variables changes across newspapers, which can be
interpreted as indicating that different groups of readers (e.g., risk-averse versus risk-neutral
investors) were being targeted. For example, EURO tends to prefer firms not listed on the official
stock exchanges; the other three periodicals did not exhibit such a preference. Columns 1d and
1e of Tables 7–10 show the results of including the bank dummy in the regression. The sign of

26
current return in these columns confirms that newspapers were indeed trying to differentiate their
products by highlighting different subsets of companies. Whereas EURO promoted firms with
relatively high current returns, both INTFIN and RENT reported on those with lower returns.
Two reasons can explain this. First, firms with a lower yield also feature a lower default risk (not
measured in this regression); second, a lower return implies a higher price/dividend ratio. Thus
INTFIN and RENT may have been focusing on “blue chip” firms (i.e., those with a high growth
potential).
Another dimension on which newspapers competed was the sectors that were covered. As
we saw in Table 4, they did not cover all sectors equally. Because industries had different
characteristics, regressions help to test for newspapers specialization in a multivariate setting.
For instance, even though banks and insurance companies together represented 16–21% of all
write-ups (ranging from the most-exposed to the third most-exposed of our eight industry
categories), they had the second-highest average capitalization and one of the lowest beta values.
Hence, once all variables are factored into the analysis, banks turn out to be not significantly
different from coal mines—the least-exposed industry. Utilities were overrepresented in all four
newspapers, while RENT and INTFIN also favored the metal industry. Finally, RENT tended to
cover mining firms significantly less than the other industries. It seems fair to conclude that the
varying exposure across journals (and within a given journal) reflected firms’ characteristics and
the newspapers’ choices of which industries to cover most extensively.
Being registered in a foreign country had a negative impact on media exposure. We
interpret this lower coverage as the logical counterpart of investors’ lesser willingness to hold
foreign stocks owing to higher enforcement costs;21 ceteris paribus, a French contract would
have been easier to enforce and thus more attractive. This does not mean that French investors or
21 Although we displayed the specification with the dummy, we also tried to model this in terms of distance between Paris and the foreign country. That variable was not significant in half the regressions, whereas the dummy was always significant (and negative). This could reflect that the costs of enforcing contracts abroad were of a “fixed” nature and thus not proportional to distance.

27
financial newspapers neglected stocks of firms operating abroad. In fact, a substantial share of
savings was invested in foreign assets, so investors needed information that would help them
monitor such investments. Consequently, more information was needed on more-distant firms in
order to compensate for the increased difficulty of monitoring them directly. With the exception
of INTFIN, the periodicals in our sample accommodated investors by granting relatively more
coverage to firms whose activities were farther away from France.
The evidence suggests that media outlets were of actual value to investors, enabling
readers to make more informed investment choices. Moreover, editors evidently used various
criteria when choosing companies, thereby competing on various dimensions to attract readers.
Our next step is to assess the size of the resulting biases.
4.2. Testing for biases originating in advertisements and direct payments
A newspaper’s coverage could have been distorted either by the volume of advertising or by
direct payments. The variable Bank is taken as the proxy for payments of the editorial content by
firms. We shall discuss the effect of sequentially including these variables in the regressions,
provide a measure of the biases’ importance, and give some insights on the positive bias.
A first test of the positive information bias can be given, in a rough fashion, by
computing the proportion of negative published information. We adopted a rather restrictive
definition of negative news; thus, such events as a small decrease in sales or a decision not to pay
dividends despite positive earnings were not classified as negative.22 With this criterion, only
5.1% of the write-ups in EURO, 4.9% in INTFIN, 8.2% in RENT, and 3.5% in SEM were
negative. Given these low figures, it seems that newspapers were somewhat reluctant to publish
negative information. However, when we ran all regressions with a new dependent variable—the
proportion of positive published information —the results were strikingly similar to those
22 Classifications based on quality judgments are less objective than those based on quantities. This fact is what ultimately led us to focus our analysis on the quantity of information (i.e., the amount of media exposure).

28
reported in Tables 7–10. This suggests that the firms about which negative news was published
were otherwise not much different from the others.
To check whether companies featured in the advertising section also had their exposure
boosted in the editorial section, we added in the regressions two alternative measures of
advertising; see columns 1b and 1c of Tables 7–10. The significance of the financial variables is
not disrupted by our introducing this variable, and the coefficients remain fairly stable. It does
appear that advertising expenses increased a company’s exposure in the editorial section,
although the effect is more ambiguous in EURO.
However, the advertising variable is ineffective in capturing the effect of direct payments
on a newspaper’s editorial policy. In Section 2 we showed that the relationship a firm had with a
bank is a reasonable proxy for such payments, and Table 6 reported on whether the choice of a
partner bank had any impact on firms’ media exposure. Columns 1d and 1e in Tables 7–10 (one
for each periodical) give the results for the bank dummies. It shows that companies that paid
newspapers directly had significantly less exposure in RENT and that companies paying via non-
Parisian banks received less exposure in EURO. Together, the latter variables (advertising and
payments to newspapers) give us some idea of the relative advantage of having a bank as
intermediary—especially if the bank is not too small and has at least an office in Paris.
Out of 26 bank dummies, only a few for each journal turn out to be significant. As
expected, a firm linked to the Crédit Mobilier Français would benefit from a boost of exposure
in the journal (INTFIN) owned by the same bank. But even the most reputable journals seemed
to have been linked to one or more banks: EURO is positively associated with the CIC, the
GMFC, and Rochette’s group; RENT is positively associated with the BPPB, the CIC, and the
CM and is negatively associated with the CMAS and the BJ (see table footnotes for
abbreviations). In a separate set of regressions (see Table 11), we test whether there was an

29
interaction effect between the bank dummies and the firms’ capitalization and current yield.23
The results show that, in some cases, introducing the interaction term eliminates the bank
effect’s significance. A significant positive (resp. negative) coefficient on the interaction term
suggests that banks choose to boost (resp. hinder) the exposure of companies that yielded a
higher return among its portfolio elements.
[INSERT TABLE 11 ABOUT HERE]
The significance of some of the bank dummy variables indicates that editorial content
was biased toward some firms. Two methods can be used to judge the size of the impact of these
biases on investors: (i) computing the marginal effect of the coefficient of the bank dummies;
and (ii) constructing counterfactual scenarios.
First, Table 12 shows the marginal effect of the bank dummy variables and allows us to
compare them with the effect of financial variables on predicted media exposure. The predicted
change in the number of write-ups in EURO for the average firm would increase by 0.0079 if the
number of ads were to increase by half a standard deviation (i.e., 1.39 ads), holding all the other
variables at their mean. The number of write-ups would actually increase by 0.2284 if a company
increased its number of ads from zero to forty (the maximum). In gauging whether this is a small
effect, we should compare it to the marginal effect of the other variables in the same regression.
Hence we could argue that the number of ads a firm bought in EURO had a negligible effect on
the firm’s exposure in that paper. Similarly, if the average firm increased the number of its ads in
INTFIN by half a standard deviation (or 0.98 ads) then its exposure in the editorial sections
would increase by 0.0934, a marginal effect that is 12 times greater than in the other newspaper.
We could give further examples. The influence of banks is easier to assess. For instance, firms
23 The interaction terms Bank × log_capitalization were almost never significantly different from zero, so in the table we show only the set of regressions with the interaction terms Bank × current_yield. The bank dummies used to construct interaction variables are those whose coefficients were significantly different from 0 in both the 1d and 1e regressions of the respective newspaper (see Tables 7–10).

30
linked with Rochette or GMFC experienced a substantial increase in exposure in both EURO and
SEM.
[INSERT TABLE 12 ABOUT HERE]
Second, we look at the overall editorial policy and compare it to counterfactual scenarios
in which firms purchase no advertising and/or are not linked to any particular bank.24 We assess
alternative asset allocations by assuming that investors followed newspapers’ content as a
guideline when selecting their portfolios. For each newspaper we constructed five different
portfolios in which the weight given to each firm is proportional to:
1. its actual number of write-ups (portfolio E for EURO, I for INTFIN, R for RENT, S for
SEM);
2. its positive write-ups (portfolios E+, I+, R+, S+);
3. counterfactual predicted write-ups assuming that firms purchased no newspaper
advertising (E+1, I+1, R+1, S+1);
4. counterfactual predicted write-ups assuming that firms had no link with any bank that
was significant in regression 1e of the respective journal (E+2, I+2, R+2, S+2);
5. counterfactual predicted write-ups assuming that firms purchased no advertising and had
no links with the banks mentioned in portfolio 4 (E+3, I+3, R+3, S+3).
Figure 5 plots the different combinations of stock price variance and current yield (that
proxy for risk and return) of these portfolios. For obvious reasons we will consider the portfolios
described at 2 (above) as the baseline for constructing counterfactual scenarios. The first
observation is that these portfolios (i.e., E+, I+, R+, S+) behaved consistently with the theory,
according to which risk and return move in the same direction. For example, as would be
expected from its title, RENT privileged those stocks with both a lower return and a lower risk, a
24 Counterfactual scenarios correspond to the predicted number of write-ups a firm would receive in a given journal if it had a different profile. To derive these scenarios, we multiplied the estimated coefficients from regressions 1e of Tables 7–10 by a modified data set in which the appropriate variables were changed (e.g. changing the Ads dummy from 1 to 0 when we wanted to simulate that firms did not advertise in that newspaper).
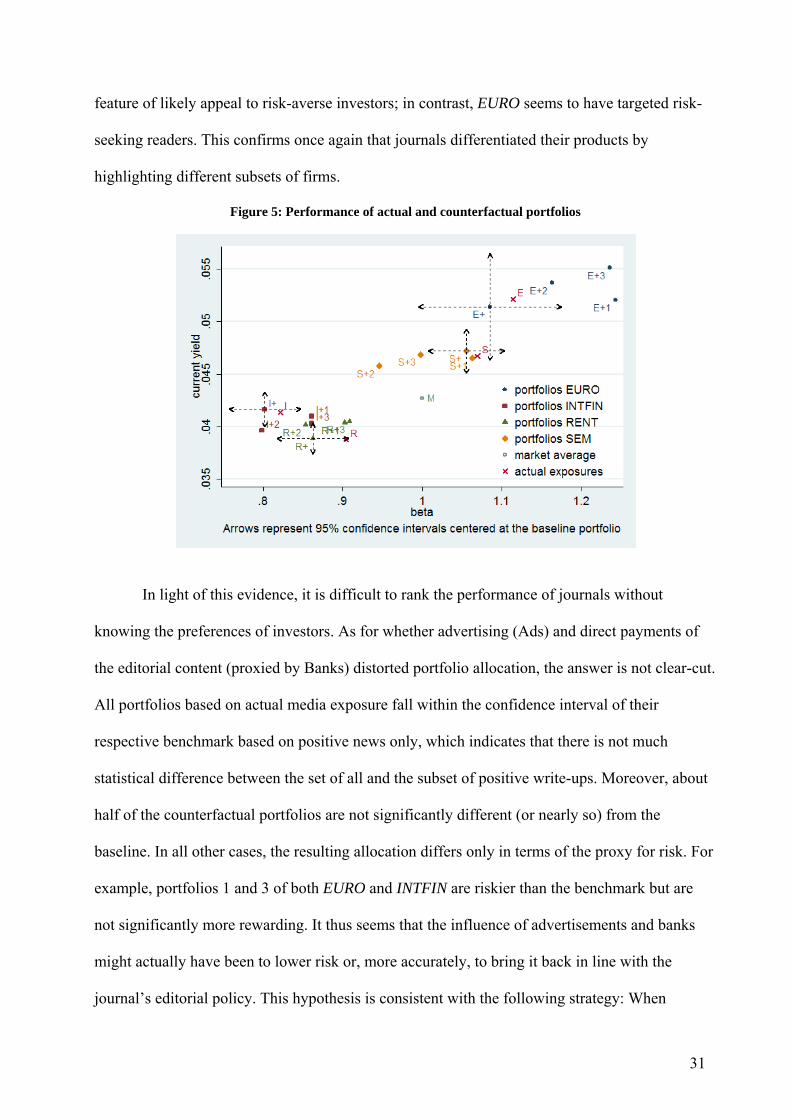
31
feature of likely appeal to risk-averse investors; in contrast, EURO seems to have targeted risk-
seeking readers. This confirms once again that journals differentiated their products by
highlighting different subsets of firms.
Figure 5: Performance of actual and counterfactual portfolios
In light of this evidence, it is difficult to rank the performance of journals without
knowing the preferences of investors. As for whether advertising (Ads) and direct payments of
the editorial content (proxied by Banks) distorted portfolio allocation, the answer is not clear-cut.
All portfolios based on actual media exposure fall within the confidence interval of their
respective benchmark based on positive news only, which indicates that there is not much
statistical difference between the set of all and the subset of positive write-ups. Moreover, about
half of the counterfactual portfolios are not significantly different (or nearly so) from the
baseline. In all other cases, the resulting allocation differs only in terms of the proxy for risk. For
example, portfolios 1 and 3 of both EURO and INTFIN are riskier than the benchmark but are
not significantly more rewarding. It thus seems that the influence of advertisements and banks
might actually have been to lower risk or, more accurately, to bring it back in line with the
journal’s editorial policy. This hypothesis is consistent with the following strategy: When
32
newspapers care about their reputation and their readership but at the same time need to increase
their revenue from information sources, they could accept payment only from companies like
those that they wanted to highlight. This explains why some banks appear in the regressions with
a negative sign. Rather than evidence of not extorting money from those banks, this suggests that
newspapers simply didn’t consider a company that was not in line with their editorial policy.
5. Conclusion
This paper provides quantitative evidence of how four of the main financial newspapers in early
20th-century France selected what information to publish on listed firms. We show that firms’
media exposure is positively correlated with the financial variables of the firm and that
newspapers differentiate their readerships along the various financial variables. Newspapers
were thus selecting firms according to their editorial policy. We also find that the ownership of a
newspaper by a bank does make a difference: it leads to media overexposure of firms in its
portfolio (in terms of what their financial performance would merit). We test whether payments
made by banks affected media exposure and find significant correlations for some banks in each
newspaper. To assess the importance of these biases, counterfactual scenarios were constructed
to simulate whether biases could have resulted in a distortion in the allocation of funds. Our
results show that the observed allocation was not inferior to the counterfactual one. Indeed, for
two of the four newspapers, the biases increased both the return and the risk of the resulting
portfolio. We interpret these results as demonstrating that the development of financial markets
was indeed accompanied by a financial press that performed reasonably well. This conclusion
stands in sharp contrast to most of the literature concerning these phenomena.

33
References
Albert P. (1972). Histoire générale de la presse française, tome 3, Paris: PUF
Anderson S. P. and Gabszewicz J. J. (2006). The Media and Advertising: A Tale of Two-Sided
Markets. Handbook on the Economics of Art and Culture 1, 567-614
Arbulu P. (2007). Le marché parisien des actions au 19ème siècle Le marché financier français au
XIXe siècle 2, G. Gallais Hamonno ed., Publications de la Sorbonne, 365-458
Bhattacharya, U., N. Galpin, R. Ray, and Yu X. (2004). The Role of the Media in the Internet
IPO Bubble. Working paper Indiana University
Bencivengo Y., 2004, Les réseaux d'influence de la banque Rothschild, manuscript.
Béranger H. (1897). Les responsabilités de la presse contemporaine La revue bleue 8, 706-10.
Cassagnac (de) P.. (1893). La publicité dans les journaux. Paris: Imprimerie de Paul Dupont
Chan, W.S. (2003). Stock Price Reaction to News and No-News: Drift and Reversal After
Headlines Journal of Financial Economics, 70, 2, 223-260.
Chancelier I., 2001, Messieurs Mirabaud et Cie : D'Aigues Vives à Paris, via Genève et Milan,
Editions Familiales, 290 pages.
Coase, R. (1960). The Problem of Social Cost. Journal of Law and Economics 3, 1–44
Coase R. (1974). The Market for Goods and the Market for Ideas, American Economic Review
64, 384-91.
D'Alessio D. and Allen M. (2000). Media bias in presidential elections: a meta-analysis. Journal
of Communication 50, 133-156
Delporte, C. (1999). Les journalistes en France 1880-1950. Paris: Le Seuil.
Dupont H., 1890, Les Mines d’Or de l’Afrique du Sud. Paris: Librairie Lemaire et Dupont.
Dyck, A. and Zingales L. (2002). The Corporate Governance Role of the Media The Right to
Tell: The Role of Mass Media in Development. Washington: The World Bank
Dyck, A. and L. Zingales. (2004). Private Benefit of Control: An International Comparison
Journal of Finance 59, 533-596
Dyck, A., N. Volchkova and Zingales L. (2008). Corporate Governance Role of the Media:
Evidence from Russia Journal of Finance (forthcoming)
Esteves, R. (2007). Quis Custodiet Quem? Sovereign Debt and Bondholders’ Protection Before
1914. Working paper Oxford University
Eveno, P. (2003). L’argent de la presse française. Paris: Editions du CHTS
Feis, H. (1930, 1965). Europe, the world’s banker, 1870-1914, New York: Norton Library

34
Flandreau, M. (2003). Caveat Emptor: Copying with Sovereign Risk Under the International
Gold Standard International Financial History in the Twentieth Century, System and Anarchy,
Flandreau M., Holtfrerich C.-L. and James H. eds, Cambridge University Press.
Flandreau, M., C. Galimard, C. Jobst and Noguès-Marco P. (2008). Monetary Geography Before
the Industrial Revolution Cambridge Journal of Regions, Economy and Society forthcoming.
Folleville (de), D. (1911). Rapport de la commission chargée de procéder à une enquête sur les
circonstances qui ont préparé, précédé, accompagné ou suivi l'arrestation du financier
Rochette, Paris: Imprimerie de la chambre des députés
Gentzkow, M., Glaeser, E. and Goldin, C. (2004). The Rise of the Fourth Estate: How
Newspapers Became Informative and why it mattered. NBER 10791.
Gentzkow, M. and Shapiro, J. (2006). Media Bias and Reputation. Journal of Political Economy
114, 280-316
Gille, B. (1959). Etat de la presse économique et financière en France. Histoire des entreprises 4,
58-76.
Groseclose, T. J. and Milyo J. (2005). A Measure of Media Bias Quarterly Journal of Economics
120, 1191–237
Hautcoeur, P.C. (2006). Why and how to measure stock market fluctuations? Working paper
Hayakawa, S. I. (1940), Language in thought and action. San Diego: Harcourt Brace Jovanovich
Houston D., 1897, Copper Manual: Copper Mines and Copper Statistics, New York: J.W. Pratt
Huberman, G. and Regev, T. (2001). Contagious Speculation and a Cure for Cancer: A Non-
event that Made Stock Prices Soar. Journal of Finance 56, 387-396
Jeanneney, J.-N. (1984). La vénalité du journalisme financier pendant l’entre deux guerre.
L’argent caché. Paris: Points Seuil.
Kaufmann, E. (1914). La banque en France. Paris: Giard & Briére
Lajeune-Vilar, A. (1895). Les coulisses de la presse. Paris: A. Charles
Leroy-Beaulieu, A. (1896). L’internationale de l’or et la bancocratie. Revue des deux mondes
135, 42-68
Long, J. (1972). Russian Manipulation of the French Press. Slavic Review 31, 343-54
Lysis (Letailleur E.). (1912). Contre l'oligarchie financière, 11th ed., Paris: Albin Michel
Marinitsch, O. (1892). La Bourse théorique et pratique. Paris: Ollendorf
Martin, M. (2006). Retour sur « l’abominable vénalité de la presse française. Le Temps des
Médias 1, 22-33.
Merton, R. C. (1987). A Simple Model of Capital market Equilibrium with Incomplete
Information. Journal of Finance 42, 483-510.

35
Neal, L. (1988). The Rise of a Financial Press: London and Amsterdam, 1681-1810. Business
History 30, 163-78.
Neymark, A. (1911). Finances contemporaines. Paris: Félix Alcan
Nguyen-Dang, B. (2006). Is More News Good News? Media Coverage of CEOs, Firm Value,
and Rent Extraction. Manuscript.
Palmer, R. (1992). Des petits journaux aux grandes agences. Paris: Aubier Montaigne
Raffalovich, A. (1931). L’abominable vénalité de la presse. Paris: Librairie du travail
Rajan R. and Zingales L. (2003). The Great Reversals: The Politics of Financial Development in
the 20th Century. Journal of Financial Economics 69, 5-50
Reuter J. (2004). Does Advertising Bias Product Review? Testing for Biased Wine Ratings.
manuscript
Reuter J. and Zitzewitz E. (2006). Do ads influence editors? Advertising and Bias in the
Financial Media. Quarterly Journal of Economics 121, 197–227
Rochet, J.-C. and Tirole J. (2004). Two-sided markets: an overview. Manuscript.
Stephens H., 1907, The Copper Handbook, Houghton (Michigan): Horace J. Stevens.
36
Appendix: Sources
For the firms with stock listed on the official market, the Annuaire des valeurs admises à
la cote officielle was used; information on firms traded in the Coulisse was gathered in the
Annuaire Desfossés. Liquidity was computed using daily prices printed in the Tableau des titres
cotés à la bourse de Paris et des cous moyens (edited by Direction Générale de l'Enregistrement,
des Domaines et du Timbre) and in the Cote du Marché des Banquiers (edited by Syndicat des
Banquiers en valeurs au comptant près la bourse de Paris).25
The distance was computed only when the firm operated abroad. We record the distance
between Paris and the foreign country’s capital city. When the country was not available in the
various yearbooks, we relied on various investors’ handbooks such as Raffalovich’s ‘Le marché
financier’ (various years), the ‘Copper Manual’ of D. Houston (1897) and the ‘Copper
Handbook’ of H. Stephens (1907), or ‘Les mines d’or de l’Afrique du Sud’ (1890) by H. Dupont.
The dummy “bank” was coded using the Annuaire Desfossés. We departed from this
source only if we know that a bank had a major stake in a company, as was sometimes the case
for mines (we then use secondary sources). We have also aggregated banks when they appeared
to be a branch of another bank. This happened three times. First, we pooled Crédit Foncier de
France and Crédit Foncier et Agricole d'Algérie because (a) nearly half of the value of CFAA
assets in 1907 were actually financed by a loan from CFF; (b) they shared some board members;
and (c) despite its name, CFAA’s operations extended well beyond Algeria and were often
unrelated to agricultural or real estate matters (it seems rather to have been acting as the
investment bank of the CFF). Second, we also merged into one group all companies directly or
indirectly run by the financier Rochette (Crédit Minier et Industiel and Banque Franco-
Espagnole). Third, we pooled all the companies whose coupons were being paid at the Paris
office of General Mining and Finance Corporation. Finally, the stakes of Rothschild and
Mirabaud in various companies were adjusted using Bencivengo (2004) and Chancelier (2001).
25 We thank Angelo Riva for allowing us to access these documents at Euronext, Paris.
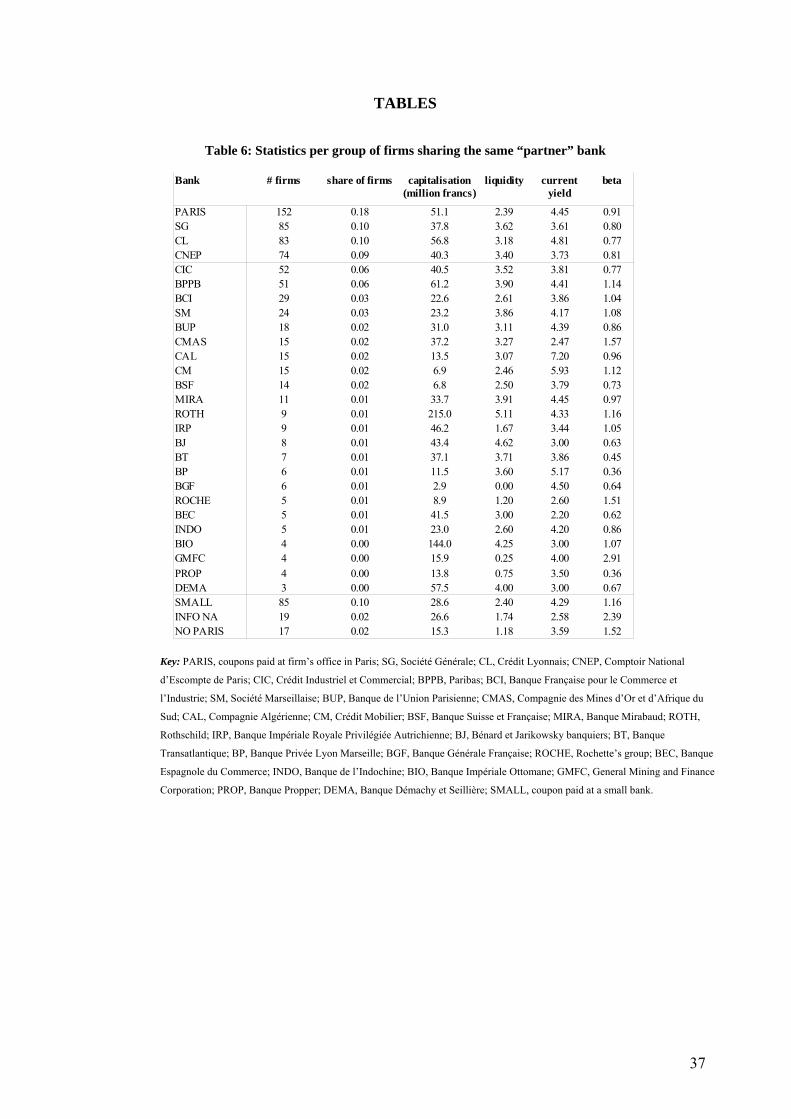
37
TABLES
Table 6: Statistics per group of firms sharing the same “partner” bank
Key: PARIS, coupons paid at firm’s office in Paris; SG, Société Générale; CL, Crédit Lyonnais; CNEP, Comptoir National
d’Escompte de Paris; CIC, Crédit Industriel et Commercial; BPPB, Paribas; BCI, Banque Française pour le Commerce et
l’Industrie; SM, Société Marseillaise; BUP, Banque de l’Union Parisienne; CMAS, Compagnie des Mines d’Or et d’Afrique du
Sud; CAL, Compagnie Algérienne; CM, Crédit Mobilier; BSF, Banque Suisse et Française; MIRA, Banque Mirabaud; ROTH,
Rothschild; IRP, Banque Impériale Royale Privilégiée Autrichienne; BJ, Bénard et Jarikowsky banquiers; BT, Banque
Transatlantique; BP, Banque Privée Lyon Marseille; BGF, Banque Générale Française; ROCHE, Rochette’s group; BEC, Banque
Espagnole du Commerce; INDO, Banque de l’Indochine; BIO, Banque Impériale Ottomane; GMFC, General Mining and Finance
Corporation; PROP, Banque Propper; DEMA, Banque Démachy et Seillière; SMALL, coupon paid at a small bank.
Bank # firms share of firms liquidity beta
PARIS 152 0.18 51.1 2.39 4.45 0.91SG 85 0.10 37.8 3.62 3.61 0.80CL 83 0.10 56.8 3.18 4.81 0.77CNEP 74 0.09 40.3 3.40 3.73 0.81CIC 52 0.06 40.5 3.52 3.81 0.77BPPB 51 0.06 61.2 3.90 4.41 1.14BCI 29 0.03 22.6 2.61 3.86 1.04SM 24 0.03 23.2 3.86 4.17 1.08BUP 18 0.02 31.0 3.11 4.39 0.86CMAS 15 0.02 37.2 3.27 2.47 1.57CAL 15 0.02 13.5 3.07 7.20 0.96CM 15 0.02 6.9 2.46 5.93 1.12BSF 14 0.02 6.8 2.50 3.79 0.73MIRA 11 0.01 33.7 3.91 4.45 0.97ROTH 9 0.01 215.0 5.11 4.33 1.16IRP 9 0.01 46.2 1.67 3.44 1.05BJ 8 0.01 43.4 4.62 3.00 0.63BT 7 0.01 37.1 3.71 3.86 0.45BP 6 0.01 11.5 3.60 5.17 0.36BGF 6 0.01 2.9 0.00 4.50 0.64ROCHE 5 0.01 8.9 1.20 2.60 1.51BEC 5 0.01 41.5 3.00 2.20 0.62INDO 5 0.01 23.0 2.60 4.20 0.86BIO 4 0.00 144.0 4.25 3.00 1.07GMFC 4 0.00 15.9 0.25 4.00 2.91PROP 4 0.00 13.8 0.75 3.50 0.36DEMA 3 0.00 57.5 4.00 3.00 0.67SMALL 85 0.10 28.6 2.40 4.29 1.16INFO NA 19 0.02 26.6 1.74 2.58 2.39NO PARIS 17 0.02 15.3 1.18 3.59 1.52
capitalisation (million francs)
current yield
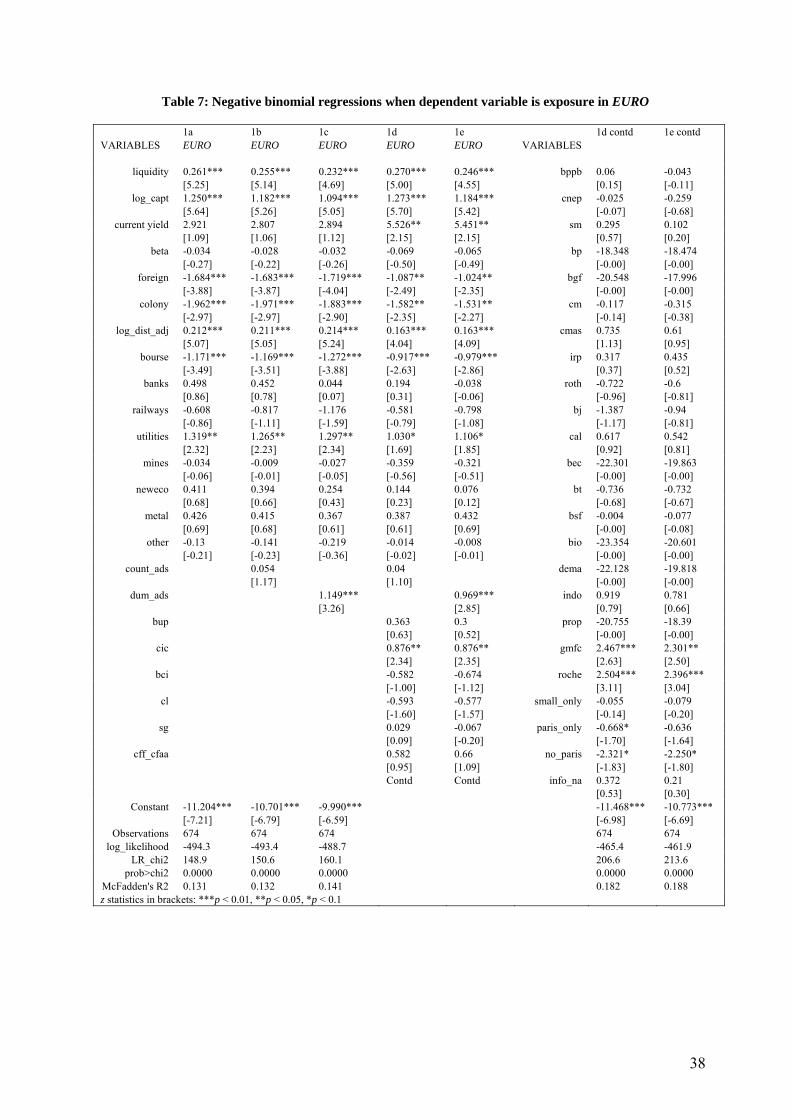
38
Table 7: Negative binomial regressions when dependent variable is exposure in EURO
1a 1b 1c 1d 1e 1d contd 1e contd VARIABLES EURO EURO EURO EURO EURO VARIABLES
liquidity 0.261*** 0.255*** 0.232*** 0.270*** 0.246*** bppb 0.06 -0.043
[5.25] [5.14] [4.69] [5.00] [4.55] [0.15] [-0.11] log_capt 1.250*** 1.182*** 1.094*** 1.273*** 1.184*** cnep -0.025 -0.259
[5.64] [5.26] [5.05] [5.70] [5.42] [-0.07] [-0.68] current yield 2.921 2.807 2.894 5.526** 5.451** sm 0.295 0.102
[1.09] [1.06] [1.12] [2.15] [2.15] [0.57] [0.20] beta -0.034 -0.028 -0.032 -0.069 -0.065 bp -18.348 -18.474
[-0.27] [-0.22] [-0.26] [-0.50] [-0.49] [-0.00] [-0.00] foreign -1.684*** -1.683*** -1.719*** -1.087** -1.024** bgf -20.548 -17.996
[-3.88] [-3.87] [-4.04] [-2.49] [-2.35] [-0.00] [-0.00] colony -1.962*** -1.971*** -1.883*** -1.582** -1.531** cm -0.117 -0.315
[-2.97] [-2.97] [-2.90] [-2.35] [-2.27] [-0.14] [-0.38] log_dist_adj 0.212*** 0.211*** 0.214*** 0.163*** 0.163*** cmas 0.735 0.61
[5.07] [5.05] [5.24] [4.04] [4.09] [1.13] [0.95] bourse -1.171*** -1.169*** -1.272*** -0.917*** -0.979*** irp 0.317 0.435
[-3.49] [-3.51] [-3.88] [-2.63] [-2.86] [0.37] [0.52] banks 0.498 0.452 0.044 0.194 -0.038 roth -0.722 -0.6
[0.86] [0.78] [0.07] [0.31] [-0.06] [-0.96] [-0.81] railways -0.608 -0.817 -1.176 -0.581 -0.798 bj -1.387 -0.94
[-0.86] [-1.11] [-1.59] [-0.79] [-1.08] [-1.17] [-0.81] utilities 1.319** 1.265** 1.297** 1.030* 1.106* cal 0.617 0.542
[2.32] [2.23] [2.34] [1.69] [1.85] [0.92] [0.81] mines -0.034 -0.009 -0.027 -0.359 -0.321 bec -22.301 -19.863
[-0.06] [-0.01] [-0.05] [-0.56] [-0.51] [-0.00] [-0.00] neweco 0.411 0.394 0.254 0.144 0.076 bt -0.736 -0.732
[0.68] [0.66] [0.43] [0.23] [0.12] [-0.68] [-0.67] metal 0.426 0.415 0.367 0.387 0.432 bsf -0.004 -0.077
[0.69] [0.68] [0.61] [0.61] [0.69] [-0.00] [-0.08] other -0.13 -0.141 -0.219 -0.014 -0.008 bio -23.354 -20.601
[-0.21] [-0.23] [-0.36] [-0.02] [-0.01] [-0.00] [-0.00] count_ads 0.054 0.04 dema -22.128 -19.818
[1.17] [1.10] [-0.00] [-0.00] dum_ads 1.149*** 0.969*** indo 0.919 0.781
[3.26] [2.85] [0.79] [0.66] bup 0.363 0.3 prop -20.755 -18.39
[0.63] [0.52] [-0.00] [-0.00] cic 0.876** 0.876** gmfc 2.467*** 2.301**
[2.34] [2.35] [2.63] [2.50] bci -0.582 -0.674 roche 2.504*** 2.396***
[-1.00] [-1.12] [3.11] [3.04] cl -0.593 -0.577 small_only -0.055 -0.079
[-1.60] [-1.57] [-0.14] [-0.20] sg 0.029 -0.067 paris_only -0.668* -0.636
[0.09] [-0.20] [-1.70] [-1.64] cff_cfaa 0.582 0.66 no_paris -2.321* -2.250*
[0.95] [1.09] [-1.83] [-1.80] Contd Contd info_na 0.372 0.21 [0.53] [0.30]
Constant -11.204*** -10.701*** -9.990*** -11.468*** -10.773*** [-7.21] [-6.79] [-6.59] [-6.98] [-6.69]
Observations 674 674 674 674 674 log_likelihood -494.3 -493.4 -488.7 -465.4 -461.9
LR_chi2 148.9 150.6 160.1 206.6 213.6 prob>chi2 0.0000 0.0000 0.0000 0.0000 0.0000
McFadden's R2 0.131 0.132 0.141 0.182 0.188 z statistics in brackets: ***p < 0.01, **p < 0.05, *p < 0.1
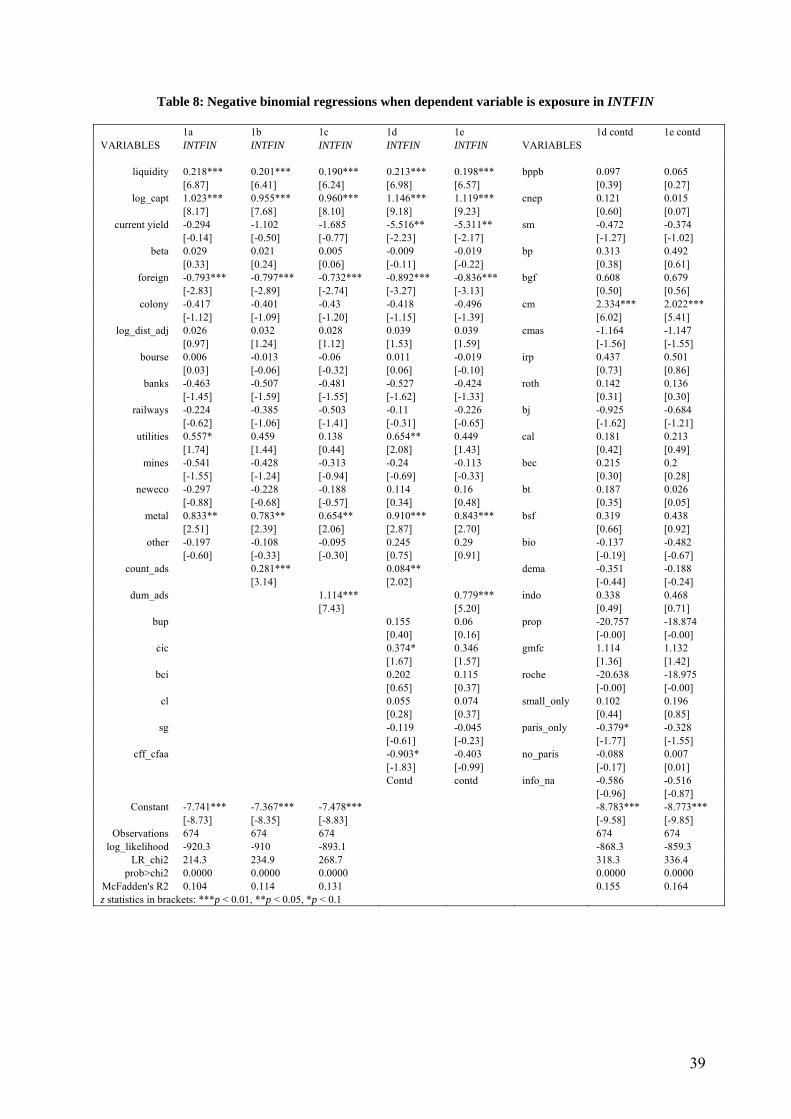
39
Table 8: Negative binomial regressions when dependent variable is exposure in INTFIN
1a 1b 1c 1d 1e 1d contd 1e contd VARIABLES INTFIN INTFIN INTFIN INTFIN INTFIN VARIABLES
liquidity 0.218*** 0.201*** 0.190*** 0.213*** 0.198*** bppb 0.097 0.065
[6.87] [6.41] [6.24] [6.98] [6.57] [0.39] [0.27] log_capt 1.023*** 0.955*** 0.960*** 1.146*** 1.119*** cnep 0.121 0.015
[8.17] [7.68] [8.10] [9.18] [9.23] [0.60] [0.07] current yield -0.294 -1.102 -1.685 -5.516** -5.311** sm -0.472 -0.374
[-0.14] [-0.50] [-0.77] [-2.23] [-2.17] [-1.27] [-1.02] beta 0.029 0.021 0.005 -0.009 -0.019 bp 0.313 0.492
[0.33] [0.24] [0.06] [-0.11] [-0.22] [0.38] [0.61] foreign -0.793*** -0.797*** -0.732*** -0.892*** -0.836*** bgf 0.608 0.679
[-2.83] [-2.89] [-2.74] [-3.27] [-3.13] [0.50] [0.56] colony -0.417 -0.401 -0.43 -0.418 -0.496 cm 2.334*** 2.022***
[-1.12] [-1.09] [-1.20] [-1.15] [-1.39] [6.02] [5.41] log_dist_adj 0.026 0.032 0.028 0.039 0.039 cmas -1.164 -1.147
[0.97] [1.24] [1.12] [1.53] [1.59] [-1.56] [-1.55] bourse 0.006 -0.013 -0.06 0.011 -0.019 irp 0.437 0.501
[0.03] [-0.06] [-0.32] [0.06] [-0.10] [0.73] [0.86] banks -0.463 -0.507 -0.481 -0.527 -0.424 roth 0.142 0.136
[-1.45] [-1.59] [-1.55] [-1.62] [-1.33] [0.31] [0.30] railways -0.224 -0.385 -0.503 -0.11 -0.226 bj -0.925 -0.684
[-0.62] [-1.06] [-1.41] [-0.31] [-0.65] [-1.62] [-1.21] utilities 0.557* 0.459 0.138 0.654** 0.449 cal 0.181 0.213
[1.74] [1.44] [0.44] [2.08] [1.43] [0.42] [0.49] mines -0.541 -0.428 -0.313 -0.24 -0.113 bec 0.215 0.2
[-1.55] [-1.24] [-0.94] [-0.69] [-0.33] [0.30] [0.28] neweco -0.297 -0.228 -0.188 0.114 0.16 bt 0.187 0.026
[-0.88] [-0.68] [-0.57] [0.34] [0.48] [0.35] [0.05] metal 0.833** 0.783** 0.654** 0.910*** 0.843*** bsf 0.319 0.438
[2.51] [2.39] [2.06] [2.87] [2.70] [0.66] [0.92] other -0.197 -0.108 -0.095 0.245 0.29 bio -0.137 -0.482
[-0.60] [-0.33] [-0.30] [0.75] [0.91] [-0.19] [-0.67] count_ads 0.281*** 0.084** dema -0.351 -0.188
[3.14] [2.02] [-0.44] [-0.24] dum_ads 1.114*** 0.779*** indo 0.338 0.468
[7.43] [5.20] [0.49] [0.71] bup 0.155 0.06 prop -20.757 -18.874
[0.40] [0.16] [-0.00] [-0.00] cic 0.374* 0.346 gmfc 1.114 1.132
[1.67] [1.57] [1.36] [1.42] bci 0.202 0.115 roche -20.638 -18.975
[0.65] [0.37] [-0.00] [-0.00] cl 0.055 0.074 small_only 0.102 0.196
[0.28] [0.37] [0.44] [0.85] sg -0.119 -0.045 paris_only -0.379* -0.328
[-0.61] [-0.23] [-1.77] [-1.55] cff_cfaa -0.903* -0.403 no_paris -0.088 0.007
[-1.83] [-0.99] [-0.17] [0.01] Contd contd info_na -0.586 -0.516 [-0.96] [-0.87]
Constant -7.741*** -7.367*** -7.478*** -8.783*** -8.773*** [-8.73] [-8.35] [-8.83] [-9.58] [-9.85]
Observations 674 674 674 674 674 log_likelihood -920.3 -910 -893.1 -868.3 -859.3
LR_chi2 214.3 234.9 268.7 318.3 336.4 prob>chi2 0.0000 0.0000 0.0000 0.0000 0.0000
McFadden's R2 0.104 0.114 0.131 0.155 0.164 z statistics in brackets: ***p < 0.01, **p < 0.05, *p < 0.1
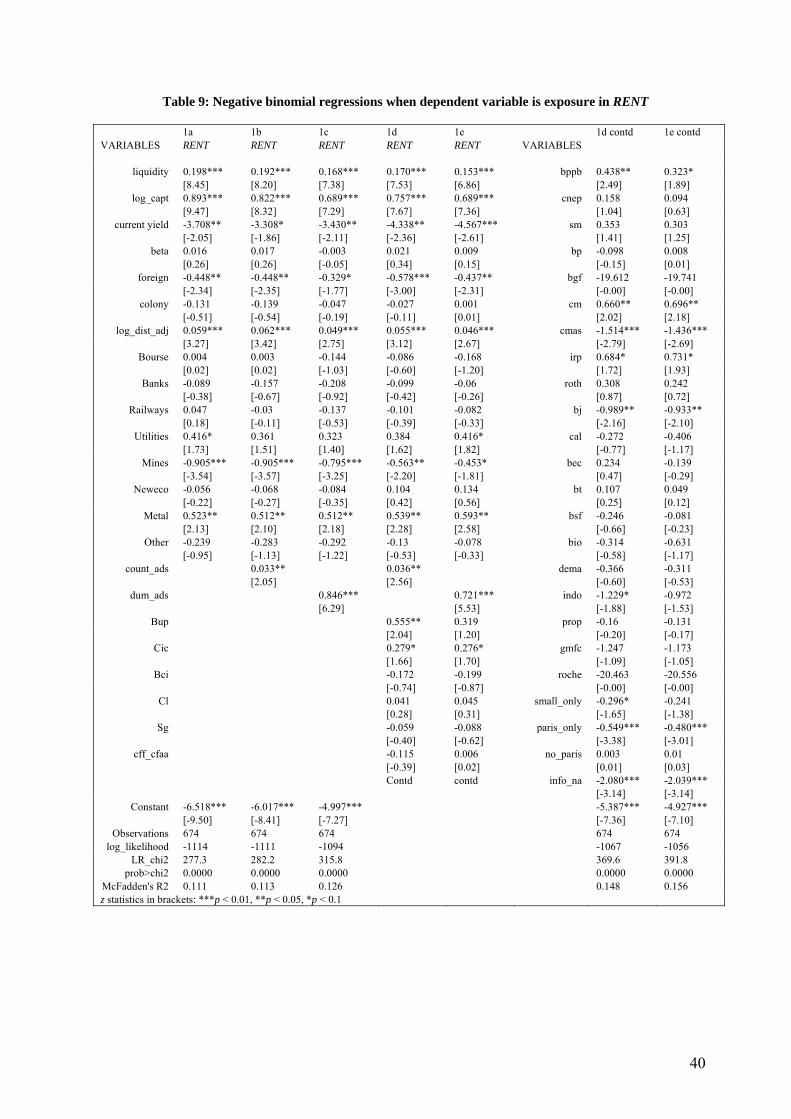
40
Table 9: Negative binomial regressions when dependent variable is exposure in RENT
1a 1b 1c 1d 1e 1d contd 1e contd VARIABLES RENT RENT RENT RENT RENT VARIABLES
liquidity 0.198*** 0.192*** 0.168*** 0.170*** 0.153*** bppb 0.438** 0.323*
[8.45] [8.20] [7.38] [7.53] [6.86] [2.49] [1.89] log_capt 0.893*** 0.822*** 0.689*** 0.757*** 0.689*** cnep 0.158 0.094
[9.47] [8.32] [7.29] [7.67] [7.36] [1.04] [0.63] current yield -3.708** -3.308* -3.430** -4.338** -4.567*** sm 0.353 0.303
[-2.05] [-1.86] [-2.11] [-2.36] [-2.61] [1.41] [1.25] beta 0.016 0.017 -0.003 0.021 0.009 bp -0.098 0.008
[0.26] [0.26] [-0.05] [0.34] [0.15] [-0.15] [0.01] foreign -0.448** -0.448** -0.329* -0.578*** -0.437** bgf -19.612 -19.741
[-2.34] [-2.35] [-1.77] [-3.00] [-2.31] [-0.00] [-0.00] colony -0.131 -0.139 -0.047 -0.027 0.001 cm 0.660** 0.696**
[-0.51] [-0.54] [-0.19] [-0.11] [0.01] [2.02] [2.18] log_dist_adj 0.059*** 0.062*** 0.049*** 0.055*** 0.046*** cmas -1.514*** -1.436***
[3.27] [3.42] [2.75] [3.12] [2.67] [-2.79] [-2.69] Bourse 0.004 0.003 -0.144 -0.086 -0.168 irp 0.684* 0.731*
[0.02] [0.02] [-1.03] [-0.60] [-1.20] [1.72] [1.93] Banks -0.089 -0.157 -0.208 -0.099 -0.06 roth 0.308 0.242
[-0.38] [-0.67] [-0.92] [-0.42] [-0.26] [0.87] [0.72] Railways 0.047 -0.03 -0.137 -0.101 -0.082 bj -0.989** -0.933**
[0.18] [-0.11] [-0.53] [-0.39] [-0.33] [-2.16] [-2.10] Utilities 0.416* 0.361 0.323 0.384 0.416* cal -0.272 -0.406
[1.73] [1.51] [1.40] [1.62] [1.82] [-0.77] [-1.17] Mines -0.905*** -0.905*** -0.795*** -0.563** -0.453* bec 0.234 -0.139
[-3.54] [-3.57] [-3.25] [-2.20] [-1.81] [0.47] [-0.29] Neweco -0.056 -0.068 -0.084 0.104 0.134 bt 0.107 0.049
[-0.22] [-0.27] [-0.35] [0.42] [0.56] [0.25] [0.12] Metal 0.523** 0.512** 0.512** 0.539** 0.593** bsf -0.246 -0.081
[2.13] [2.10] [2.18] [2.28] [2.58] [-0.66] [-0.23] Other -0.239 -0.283 -0.292 -0.13 -0.078 bio -0.314 -0.631
[-0.95] [-1.13] [-1.22] [-0.53] [-0.33] [-0.58] [-1.17] count_ads 0.033** 0.036** dema -0.366 -0.311
[2.05] [2.56] [-0.60] [-0.53] dum_ads 0.846*** 0.721*** indo -1.229* -0.972
[6.29] [5.53] [-1.88] [-1.53] Bup 0.555** 0.319 prop -0.16 -0.131
[2.04] [1.20] [-0.20] [-0.17] Cic 0.279* 0.276* gmfc -1.247 -1.173
[1.66] [1.70] [-1.09] [-1.05] Bci -0.172 -0.199 roche -20.463 -20.556
[-0.74] [-0.87] [-0.00] [-0.00] Cl 0.041 0.045 small_only -0.296* -0.241
[0.28] [0.31] [-1.65] [-1.38] Sg -0.059 -0.088 paris_only -0.549*** -0.480***
[-0.40] [-0.62] [-3.38] [-3.01] cff_cfaa -0.115 0.006 no_paris 0.003 0.01
[-0.39] [0.02] [0.01] [0.03] Contd contd info_na -2.080*** -2.039*** [-3.14] [-3.14]
Constant -6.518*** -6.017*** -4.997*** -5.387*** -4.927*** [-9.50] [-8.41] [-7.27] [-7.36] [-7.10]
Observations 674 674 674 674 674 log_likelihood -1114 -1111 -1094 -1067 -1056
LR_chi2 277.3 282.2 315.8 369.6 391.8 prob>chi2 0.0000 0.0000 0.0000 0.0000 0.0000
McFadden's R2 0.111 0.113 0.126 0.148 0.156 z statistics in brackets: ***p < 0.01, **p < 0.05, *p < 0.1
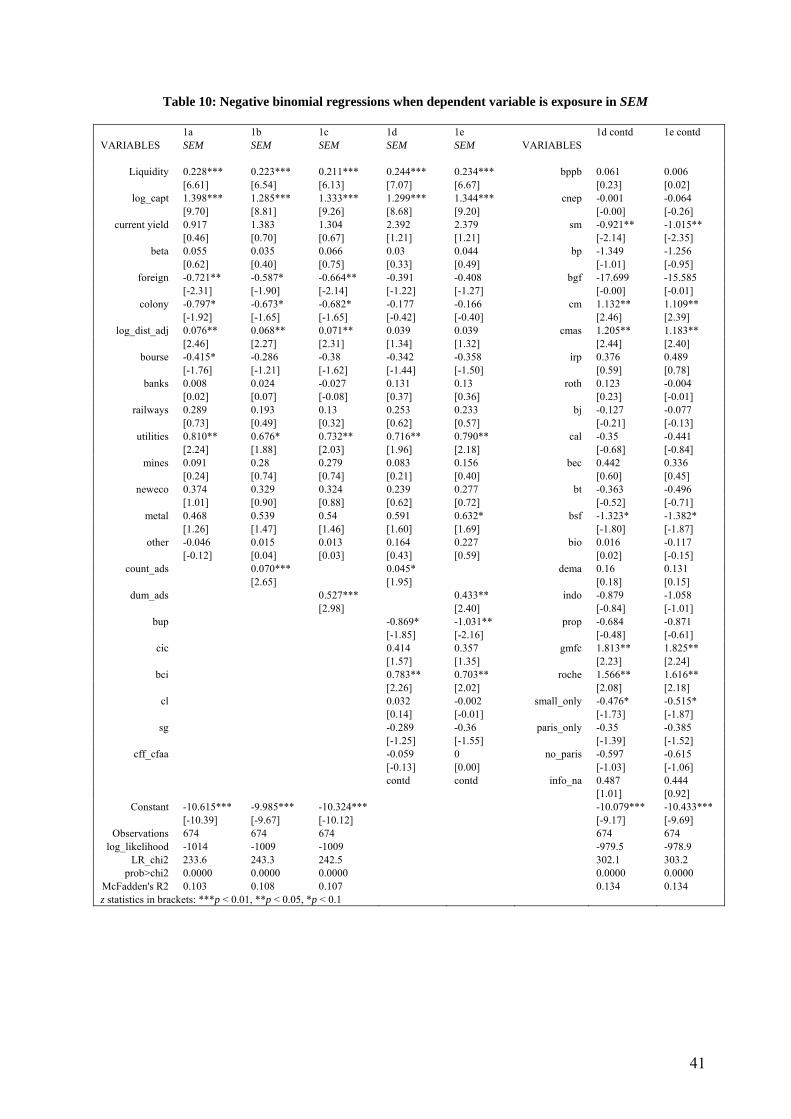
41
Table 10: Negative binomial regressions when dependent variable is exposure in SEM
1a 1b 1c 1d 1e 1d contd 1e contd VARIABLES SEM SEM SEM SEM SEM VARIABLES
Liquidity 0.228*** 0.223*** 0.211*** 0.244*** 0.234*** bppb 0.061 0.006
[6.61] [6.54] [6.13] [7.07] [6.67] [0.23] [0.02] log_capt 1.398*** 1.285*** 1.333*** 1.299*** 1.344*** cnep -0.001 -0.064
[9.70] [8.81] [9.26] [8.68] [9.20] [-0.00] [-0.26] current yield 0.917 1.383 1.304 2.392 2.379 sm -0.921** -1.015**
[0.46] [0.70] [0.67] [1.21] [1.21] [-2.14] [-2.35] beta 0.055 0.035 0.066 0.03 0.044 bp -1.349 -1.256
[0.62] [0.40] [0.75] [0.33] [0.49] [-1.01] [-0.95] foreign -0.721** -0.587* -0.664** -0.391 -0.408 bgf -17.699 -15.585
[-2.31] [-1.90] [-2.14] [-1.22] [-1.27] [-0.00] [-0.01] colony -0.797* -0.673* -0.682* -0.177 -0.166 cm 1.132** 1.109**
[-1.92] [-1.65] [-1.65] [-0.42] [-0.40] [2.46] [2.39] log_dist_adj 0.076** 0.068** 0.071** 0.039 0.039 cmas 1.205** 1.183**
[2.46] [2.27] [2.31] [1.34] [1.32] [2.44] [2.40] bourse -0.415* -0.286 -0.38 -0.342 -0.358 irp 0.376 0.489
[-1.76] [-1.21] [-1.62] [-1.44] [-1.50] [0.59] [0.78] banks 0.008 0.024 -0.027 0.131 0.13 roth 0.123 -0.004
[0.02] [0.07] [-0.08] [0.37] [0.36] [0.23] [-0.01] railways 0.289 0.193 0.13 0.253 0.233 bj -0.127 -0.077
[0.73] [0.49] [0.32] [0.62] [0.57] [-0.21] [-0.13] utilities 0.810** 0.676* 0.732** 0.716** 0.790** cal -0.35 -0.441
[2.24] [1.88] [2.03] [1.96] [2.18] [-0.68] [-0.84] mines 0.091 0.28 0.279 0.083 0.156 bec 0.442 0.336
[0.24] [0.74] [0.74] [0.21] [0.40] [0.60] [0.45] neweco 0.374 0.329 0.324 0.239 0.277 bt -0.363 -0.496
[1.01] [0.90] [0.88] [0.62] [0.72] [-0.52] [-0.71] metal 0.468 0.539 0.54 0.591 0.632* bsf -1.323* -1.382*
[1.26] [1.47] [1.46] [1.60] [1.69] [-1.80] [-1.87] other -0.046 0.015 0.013 0.164 0.227 bio 0.016 -0.117
[-0.12] [0.04] [0.03] [0.43] [0.59] [0.02] [-0.15] count_ads 0.070*** 0.045* dema 0.16 0.131
[2.65] [1.95] [0.18] [0.15] dum_ads 0.527*** 0.433** indo -0.879 -1.058
[2.98] [2.40] [-0.84] [-1.01] bup -0.869* -1.031** prop -0.684 -0.871
[-1.85] [-2.16] [-0.48] [-0.61] cic 0.414 0.357 gmfc 1.813** 1.825**
[1.57] [1.35] [2.23] [2.24] bci 0.783** 0.703** roche 1.566** 1.616**
[2.26] [2.02] [2.08] [2.18] cl 0.032 -0.002 small_only -0.476* -0.515*
[0.14] [-0.01] [-1.73] [-1.87] sg -0.289 -0.36 paris_only -0.35 -0.385
[-1.25] [-1.55] [-1.39] [-1.52] cff_cfaa -0.059 0 no_paris -0.597 -0.615
[-0.13] [0.00] [-1.03] [-1.06] contd contd info_na 0.487 0.444 [1.01] [0.92]
Constant -10.615*** -9.985*** -10.324*** -10.079*** -10.433*** [-10.39] [-9.67] [-10.12] [-9.17] [-9.69]
Observations 674 674 674 674 674 log_likelihood -1014 -1009 -1009 -979.5 -978.9
LR_chi2 233.6 243.3 242.5 302.1 303.2 prob>chi2 0.0000 0.0000 0.0000 0.0000 0.0000
McFadden's R2 0.103 0.108 0.107 0.134 0.134 z statistics in brackets: ***p < 0.01, **p < 0.05, *p < 0.1
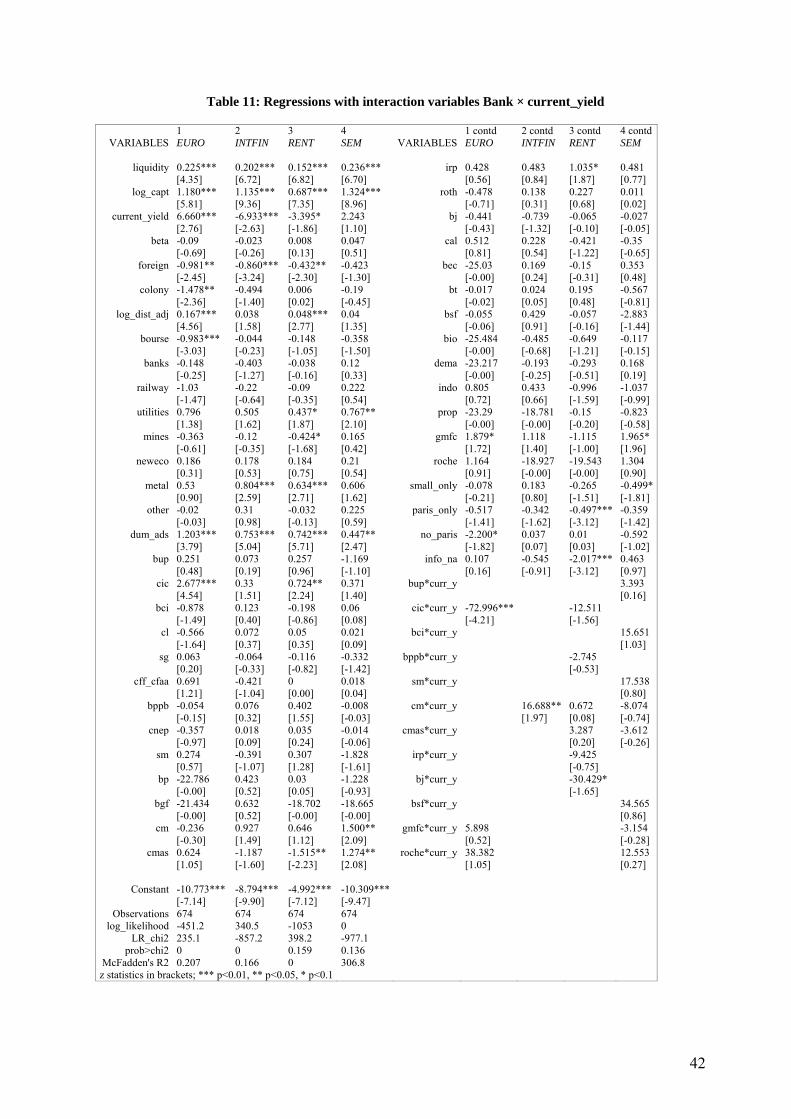
42
Table 11: Regressions with interaction variables Bank × current_yield
1 2 3 4 1 contd 2 contd 3 contd 4 contd VARIABLES EURO INTFIN RENT SEM VARIABLES EURO INTFIN RENT SEM
liquidity 0.225*** 0.202*** 0.152*** 0.236*** irp 0.428 0.483 1.035* 0.481
[4.35] [6.72] [6.82] [6.70] [0.56] [0.84] [1.87] [0.77] log_capt 1.180*** 1.135*** 0.687*** 1.324*** roth -0.478 0.138 0.227 0.011
[5.81] [9.36] [7.35] [8.96] [-0.71] [0.31] [0.68] [0.02] current_yield 6.660*** -6.933*** -3.395* 2.243 bj -0.441 -0.739 -0.065 -0.027
[2.76] [-2.63] [-1.86] [1.10] [-0.43] [-1.32] [-0.10] [-0.05] beta -0.09 -0.023 0.008 0.047 cal 0.512 0.228 -0.421 -0.35
[-0.69] [-0.26] [0.13] [0.51] [0.81] [0.54] [-1.22] [-0.65] foreign -0.981** -0.860*** -0.432** -0.423 bec -25.03 0.169 -0.15 0.353
[-2.45] [-3.24] [-2.30] [-1.30] [-0.00] [0.24] [-0.31] [0.48] colony -1.478** -0.494 0.006 -0.19 bt -0.017 0.024 0.195 -0.567
[-2.36] [-1.40] [0.02] [-0.45] [-0.02] [0.05] [0.48] [-0.81] log_dist_adj 0.167*** 0.038 0.048*** 0.04 bsf -0.055 0.429 -0.057 -2.883
[4.56] [1.58] [2.77] [1.35] [-0.06] [0.91] [-0.16] [-1.44] bourse -0.983*** -0.044 -0.148 -0.358 bio -25.484 -0.485 -0.649 -0.117
[-3.03] [-0.23] [-1.05] [-1.50] [-0.00] [-0.68] [-1.21] [-0.15] banks -0.148 -0.403 -0.038 0.12 dema -23.217 -0.193 -0.293 0.168
[-0.25] [-1.27] [-0.16] [0.33] [-0.00] [-0.25] [-0.51] [0.19] railway -1.03 -0.22 -0.09 0.222 indo 0.805 0.433 -0.996 -1.037
[-1.47] [-0.64] [-0.35] [0.54] [0.72] [0.66] [-1.59] [-0.99] utilities 0.796 0.505 0.437* 0.767** prop -23.29 -18.781 -0.15 -0.823
[1.38] [1.62] [1.87] [2.10] [-0.00] [-0.00] [-0.20] [-0.58] mines -0.363 -0.12 -0.424* 0.165 gmfc 1.879* 1.118 -1.115 1.965*
[-0.61] [-0.35] [-1.68] [0.42] [1.72] [1.40] [-1.00] [1.96] neweco 0.186 0.178 0.184 0.21 roche 1.164 -18.927 -19.543 1.304
[0.31] [0.53] [0.75] [0.54] [0.91] [-0.00] [-0.00] [0.90] metal 0.53 0.804*** 0.634*** 0.606 small_only -0.078 0.183 -0.265 -0.499*
[0.90] [2.59] [2.71] [1.62] [-0.21] [0.80] [-1.51] [-1.81] other -0.02 0.31 -0.032 0.225 paris_only -0.517 -0.342 -0.497*** -0.359
[-0.03] [0.98] [-0.13] [0.59] [-1.41] [-1.62] [-3.12] [-1.42] dum_ads 1.203*** 0.753*** 0.742*** 0.447** no_paris -2.200* 0.037 0.01 -0.592
[3.79] [5.04] [5.71] [2.47] [-1.82] [0.07] [0.03] [-1.02] bup 0.251 0.073 0.257 -1.169 info_na 0.107 -0.545 -2.017*** 0.463
[0.48] [0.19] [0.96] [-1.10] [0.16] [-0.91] [-3.12] [0.97] cic 2.677*** 0.33 0.724** 0.371 bup*curr_y 3.393
[4.54] [1.51] [2.24] [1.40] [0.16] bci -0.878 0.123 -0.198 0.06 cic*curr_y -72.996*** -12.511
[-1.49] [0.40] [-0.86] [0.08] [-4.21] [-1.56] cl -0.566 0.072 0.05 0.021 bci*curr_y 15.651
[-1.64] [0.37] [0.35] [0.09] [1.03] sg 0.063 -0.064 -0.116 -0.332 bppb*curr_y -2.745
[0.20] [-0.33] [-0.82] [-1.42] [-0.53] cff_cfaa 0.691 -0.421 0 0.018 sm*curr_y 17.538
[1.21] [-1.04] [0.00] [0.04] [0.80] bppb -0.054 0.076 0.402 -0.008 cm*curr_y 16.688** 0.672 -8.074
[-0.15] [0.32] [1.55] [-0.03] [1.97] [0.08] [-0.74] cnep -0.357 0.018 0.035 -0.014 cmas*curr_y 3.287 -3.612
[-0.97] [0.09] [0.24] [-0.06] [0.20] [-0.26] sm 0.274 -0.391 0.307 -1.828 irp*curr_y -9.425
[0.57] [-1.07] [1.28] [-1.61] [-0.75] bp -22.786 0.423 0.03 -1.228 bj*curr_y -30.429*
[-0.00] [0.52] [0.05] [-0.93] [-1.65] bgf -21.434 0.632 -18.702 -18.665 bsf*curr_y 34.565
[-0.00] [0.52] [-0.00] [-0.00] [0.86] cm -0.236 0.927 0.646 1.500** gmfc*curr_y 5.898 -3.154
[-0.30] [1.49] [1.12] [2.09] [0.52] [-0.28] cmas 0.624 -1.187 -1.515** 1.274** roche*curr_y 38.382 12.553
[1.05] [-1.60] [-2.23] [2.08] [1.05] [0.27]
Constant -10.773*** -8.794*** -4.992*** -10.309*** [-7.14] [-9.90] [-7.12] [-9.47]
Observations 674 674 674 674 log_likelihood -451.2 340.5 -1053 0
LR_chi2 235.1 -857.2 398.2 -977.1 prob>chi2 0 0 0.159 0.136
McFadden's R2 0.207 0.166 0 306.8 z statistics in brackets; *** p<0.01, ** p<0.05, * p<0.1
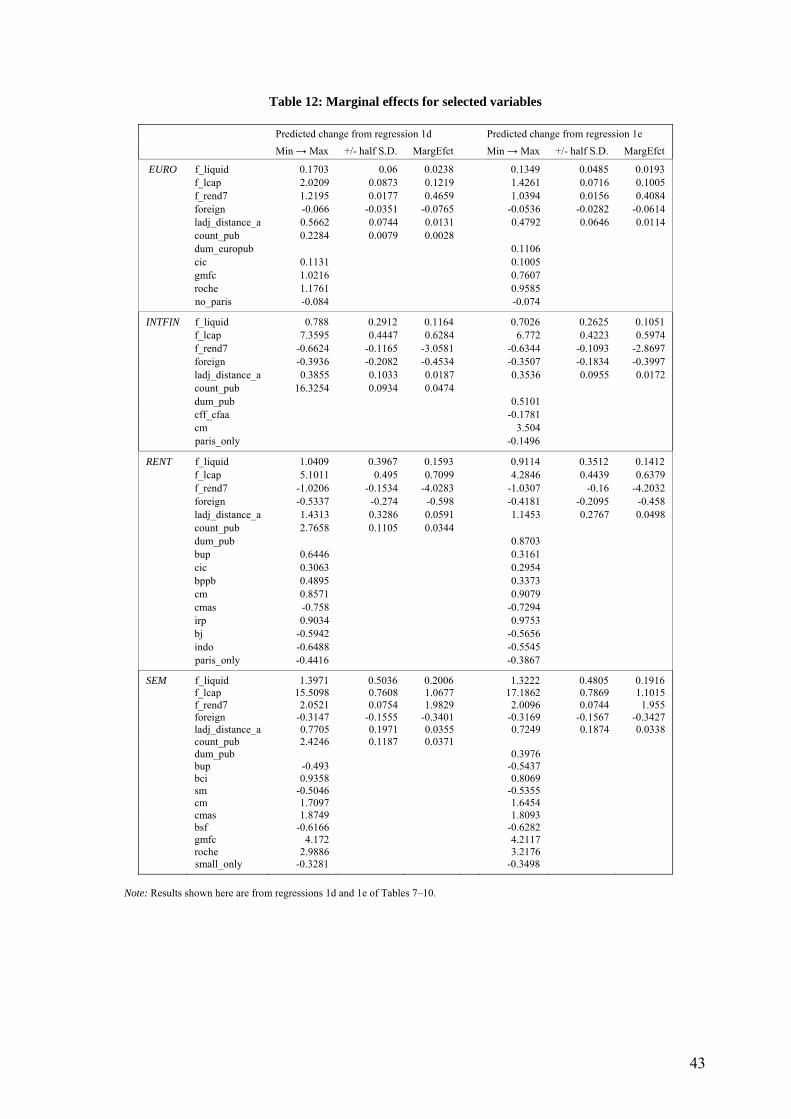
43
Table 12: Marginal effects for selected variables
Predicted change from regression 1d Predicted change from regression 1e Min → Max +/- half S.D. MargEfct Min → Max +/- half S.D. MargEfct
EURO f_liquid 0.1703 0.06 0.0238 0.1349 0.0485 0.0193 f_lcap 2.0209 0.0873 0.1219 1.4261 0.0716 0.1005 f_rend7 1.2195 0.0177 0.4659 1.0394 0.0156 0.4084 foreign -0.066 -0.0351 -0.0765 -0.0536 -0.0282 -0.0614 ladj_distance_a 0.5662 0.0744 0.0131 0.4792 0.0646 0.0114 count_pub 0.2284 0.0079 0.0028 dum_europub 0.1106 cic 0.1131 0.1005 gmfc 1.0216 0.7607 roche 1.1761 0.9585 no_paris -0.084 -0.074
INTFIN f_liquid 0.788 0.2912 0.1164 0.7026 0.2625 0.1051 f_lcap 7.3595 0.4447 0.6284 6.772 0.4223 0.5974 f_rend7 -0.6624 -0.1165 -3.0581 -0.6344 -0.1093 -2.8697 foreign -0.3936 -0.2082 -0.4534 -0.3507 -0.1834 -0.3997 ladj_distance_a 0.3855 0.1033 0.0187 0.3536 0.0955 0.0172 count_pub 16.3254 0.0934 0.0474 dum_pub 0.5101 cff_cfaa -0.1781 cm 3.504 paris_only -0.1496
RENT f_liquid 1.0409 0.3967 0.1593 0.9114 0.3512 0.1412 f_lcap 5.1011 0.495 0.7099 4.2846 0.4439 0.6379 f_rend7 -1.0206 -0.1534 -4.0283 -1.0307 -0.16 -4.2032 foreign -0.5337 -0.274 -0.598 -0.4181 -0.2095 -0.458 ladj_distance_a 1.4313 0.3286 0.0591 1.1453 0.2767 0.0498 count_pub 2.7658 0.1105 0.0344 dum_pub 0.8703 bup 0.6446 0.3161 cic 0.3063 0.2954 bppb 0.4895 0.3373 cm 0.8571 0.9079 cmas -0.758 -0.7294 irp 0.9034 0.9753 bj -0.5942 -0.5656 indo -0.6488 -0.5545 paris_only -0.4416 -0.3867
SEM f_liquid 1.3971 0.5036 0.2006 1.3222 0.4805 0.1916 f_lcap 15.5098 0.7608 1.0677 17.1862 0.7869 1.1015 f_rend7 2.0521 0.0754 1.9829 2.0096 0.0744 1.955 foreign -0.3147 -0.1555 -0.3401 -0.3169 -0.1567 -0.3427 ladj_distance_a 0.7705 0.1971 0.0355 0.7249 0.1874 0.0338 count_pub 2.4246 0.1187 0.0371 dum_pub 0.3976 bup -0.493 -0.5437 bci 0.9358 0.8069 sm -0.5046 -0.5355 cm 1.7097 1.6454 cmas 1.8749 1.8093 bsf -0.6166 -0.6282 gmfc 4.172 4.2117 roche 2.9886 3.2176 small_only -0.3281 -0.3498
Note: Results shown here are from regressions 1d and 1e of Tables 7–10.
Related Documents