Division of Pharmaneutical Technology Faculty of Pharmacy University of Helsinki MECHANISTIC STUDIES OF DRUG DISSOLUTION TESTING Implications of solid phase properties and in vivo prognostic media by Paula Lehto Academic Dissertation To be presented, with the permission of the Faculty of Pharmacy of the University of Helsinki, for public criticism in auditorium XII at Helsinki University main building (Unioninkatu 34), on February 5th, at 12 noon 2010. brought to you by CORE View metadata, citation and similar papers at core.ac.uk provided by Helsingin yliopiston digitaalinen arkisto

Welcome message from author
This document is posted to help you gain knowledge. Please leave a comment to let me know what you think about it! Share it to your friends and learn new things together.
Transcript

1 INTRODUCTION
I
Division of Pharmaneutical Technology Faculty of PharmacyUniversity of Helsinki
Mechanistic studies
of drug dissolution testing
Implications of solid phase properties
and in vivo prognostic media
by
Paula Lehto
Academic DissertationTo be presented, with the permission of the Faculty of Pharmacy of the
University of Helsinki, for public criticism in auditorium XII at Helsinki University main building (Unioninkatu 34), on February 5th, at 12 noon 2010.
brought to you by COREView metadata, citation and similar papers at core.ac.uk
provided by Helsingin yliopiston digitaalinen arkisto

II
Supervisors: Docent Leena Peltonen Division of Pharmaceutical Technology University of Helsinki Helsinki, Finland
Professor Veli Pekka Tanninen Pharmaceutical Product Development Orion Pharma R&D Espoo, Finland
Professor Jouni Hirvonen Division of Pharmaceutical Technology University of Helsinki Helsinki, Finland
Reviewers Docent Jarno Salonen Laboratory of Industrial Physics University of Turku Turku, Finland
Professor Thomas Rades School of Pharmacy University of Otago Dunedin, New Zealand
Opponent: Professor Jarkko Ketolainen Department of Pharmaceutics University of Kuopio Kuopio, Finland
© Paula Lehto
ISBN 978-952-10-5318-4 (paperback)ISBN 978-952-10-6093-9 (pdf)ISSN 1795-7079
Helsinki University Printing House
Helsinki, Finland, 2010

1 INTRODUCTION
I
acknowledgements
This thesis was carried out at the Division of Pharmaceutical Technology, Faculty of Pharmacy, University of Helsinki. During this study I worked at Orion Pharma and the experiments of the thesis were part of the In-vitro-in vivo technology project. I wish to thank all the people involved in this work.
My deepest gratitude goes to my supervisors, Docent Leena Peltonen, Profes-sor Veli Pekka Tanninen and Professor Jouni Hirvonen. Docent Leena Peltonen has guided me towards being an independent and critical scientist. Her long patience and any-time availability has made my work a lot of easier. I am very grateful to Professor Veli Pekka Tanninen for his endless inspiration and support and positive attitude towards my studies. During the grazy moments of this study Prof. Tanninen has help me to put things into right perspective. Professor Jouni Hirvonen is gratefully acknowledged for sharing of his expertise and en-couraging me to go further with the studies.
The reviewers of this thesis, Docent Jarno Salonen and Professor Thomas Rades, are warmly thanked for extremely flexible and quick review process and their constructive comments on the manuscript.
A load of thanks to my co-authors, Mikko Tenho, Jaakko Aaltonen, Pentti Niemelä, Hanna Kortejärvi, Anni Liimatainen and Krista Ojala for their scientific contribution, inspiring discussions and assistance with the experiments. Profes-sor Jukka Rantanen is gratefully acknowledged for unselfish sharing of his ex-pertise in the field of solid state of pharmaceuticals. I owe my special thanks to Anja Koski for fruitful discussions concerning dissolution testing and her friend-ship throughout this work.
I thank Orion Pharma, and especially Jarmo Lintulaakso, Tuula Romppanen and Tuula Hokkanen for providing me the opportunity to carry out the Ph.D. studys at Orion Pharma. Tero Närvänen is warmly thanked for his friendly sup-port and interest towards my studies. My special thanks to all who worked in Orion’s laboratory of physics during 2006-2008.
I owe my deepest gratitude to my parents, Lena and Markku, and my sister’s family (Katri, Tuomo, Julia, Elise and Sofia), for always being there for me. I warmly thank my mother-in-law, Milja, for being such a good listener and sup-port. All my friends are thanked for understanding that I did not have much free time during these years of the Ph.D. study.
Finally, I thank my most lowed ones, Ilkka, Aino and Vijami, for everything. With you I am whole. With you my dream have came true.
Helsinki, February 2009
Paula Lehto (née Heinänen)

II

1 INTRODUCTION
III
abstract
Drug absorption after oral administration requires that the drug first dissolves into gastro-intestinal tract liquids. In vivo dissolution of a drug is affected by physiological and drug-related physicochemical factors. In the case of poorly water-soluble drugs, in vitro dissolution testing at various stages of drug devel-opment is especially important, since the absorption is predominantly limited by the dissolution rate. Varying dissolution rates, possible for different physical structures of the same chemical entity (known as polymorphs), for example, can lead to varying degrees of bioavailability and, potentially, result in therapeutic failure. Traditionally, pharmaceutical dissolution testing has relied on determi-nation of the dissolved drug concentration from liquid phase. This has led to poor understanding (and possible underestimation) of the connection between the change in solid phase and dissolution behaviour. Thus, new powerful ap-proaches are needed. To correlate in vitro dissolution results of drug products with in vivo behaviour often requires the use of dissolution methods reflecting conditions in the gastro-intestinal tract. For such purpose, various physiologi-cally based dissolution media have been proposed.
In this thesis, solid phase analysis was combined with dissolution determina-tions to provide in depth understanding of the effects of solid state properties on the intrinsic dissolution rate of active pharmaceutical ingredients (API). A new approach to dissolution testing, which involved simultaneous in situ solid phase analyses of the dissolving sample and measurement of dissolved concen-trations in the dissolution medium, were utilized to explain the implications of solvent-mediated solid phase conversions on dissolution processes. Simplified dissolution media were developed and studied for the prediction of in vivo be-haviour of Biopharmaceutics Classification System (BCS) class II drugs.
Quantitative solid phase analysis using Raman spectroscopy was successfully performed in situ during the intrinsic dissolution testing of APIs. Direct solid phase analysis in tandem with measurement of dissolved concentrations enabled molecular level insight into changes in dissolution rate due to hydrate forma-tion. Against expectations, preferred orientation of drug crystals during sample preparation was shown to have only minor effects on dissolution results dur-ing intrinsic dissolution. Importance of dissolution medium on solvent-mediated conversion kinetics was revealed as bile salts were shown to be able to interact with the dissolving solid by hydrogen bonding mechanisms. To predict in vivo behaviour of BCS class II drugs, simple and cost-effective conventional surfactant media were shown to be potential substitutes for more complex, physiologically based Fasted State Simulated Intestinal Fluid (FaSSIF).
This thesis provides directly applicable new tools for the dissolution experi-ments in pharmaceutical drug development. In-depth information of solid state properties on dissolution rate assists in drug candidate selection as well as in explaining and controlling the behaviour of APIs in the final drug products.
IV
The use of simplified, in vivo prognostic dissolution media has potential of sav-ing development time and costs for formulation development and regulatory purposes.

1 INTRODUCTION
V
Contents
acknowledgements . . . . . . . . . . . . . . . . . . . . . . . . . . . . . . . . . . . . . . . . . . . . . . . . . I
abstract. . . . . . . . . . . . . . . . . . . . . . . . . . . . . . . . . . . . . . . . . . . . . . . . . . . . . . . . . . . . . III
abbreviations . . . . . . . . . . . . . . . . . . . . . . . . . . . . . . . . . . . . . . . . . . . . . . . . . . . . . . . VII
list of original publications . . . . . . . . . . . . . . . . . . . . . . . . . . . . . . . . . . . . . . . . . . IX
1 introduction . . . . . . . . . . . . . . . . . . . . . . . . . . . . . . . . . . . . . . . . . . . . . . . . . . . . . . . 1
2 theory and literature review . . . . . . . . . . . . . . . . . . . . . . . . . . . . . . . . . . . . . . 3
2.1 Concept of dissolution . . . . . . . . . . . . . . . . . . . . . . . . . . . . . . . . . . . . . . . . 3
2.2 Dissolution of solid substances . . . . . . . . . . . . . . . . . . . . . . . . . . . . . . . . 42.2.1 Classification of solid substances . . . . . . . . . . . . . . . . . . . . . . . . . 4
2.2.2 Stability relationships between solid phases – meaning for solubility and dissolution . . . . . . . . . . . . . . . . . . . . . . . . . . . . . . 5
2.2.3 Phase transformations & dissolution. . . . . . . . . . . . . . . . . . . . . . 7
Crystallization (supersaturation, nucleation and crystal . . growth) . . . . . . . . . . . . . . . . . . . . . . . . . . . . . . . . . . . . . . . . . . . . . . 7
Crystal morphology . . . . . . . . . . . . . . . . . . . . . . . . . . . . . . . . . . . 8
Effect of additives. . . . . . . . . . . . . . . . . . . . . . . . . . . . . . . . . . . . . 8
Transformation during dissolution; stages and controlling processes . . . . . . . . . . . . . . . . . . . . . . . . . . . . . . . . . . 9
2.2.4 Dissolution testing of solid forms. . . . . . . . . . . . . . . . . . . . . . . . . 9
Preferred orientation. . . . . . . . . . . . . . . . . . . . . . . . . . . . . . . . . . 10
Crystal imperfections/crystallinity. . . . . . . . . . . . . . . . . . . . . . . 11
2.3 Dissolution as a prognostic in vivo tool . . . . . . . . . . . . . . . . . . . . . . . . 112.3.1 Limiting factors in oral absorption . . . . . . . . . . . . . . . . . . . . . . . 11
2.3.2 Biopharmaceutics classification system. . . . . . . . . . . . . . . . . . . . 12
Applications of BCS in pharmaceutical industry . . . . . . . . . . 12
2.3.3 Gastrointestinal conditions for solubility and dissolution . . . 13
2.3.4 Biorelevant in vitro dissolution media . . . . . . . . . . . . . . . . . . . . 14
3 aims of the study . . . . . . . . . . . . . . . . . . . . . . . . . . . . . . . . . . . . . . . . . . . . . . . . . 17
4 experimental . . . . . . . . . . . . . . . . . . . . . . . . . . . . . . . . . . . . . . . . . . . . . . . . . . . . . . 19
4.1 Materials . . . . . . . . . . . . . . . . . . . . . . . . . . . . . . . . . . . . . . . . . . . . . . . . . . . . . 19Preparation of the studied solids . . . . . . . . . . . . . . . . . . . . . . . 19
Preparation of the dissolution media . . . . . . . . . . . . . . . . . . . 20

VI
4.2 Methods . . . . . . . . . . . . . . . . . . . . . . . . . . . . . . . . . . . . . . . . . . . . . . . . . . . . . 204.2.1 Dissolution methods . . . . . . . . . . . . . . . . . . . . . . . . . . . . . . . . . . . . 20
4.2.2 Evaluation of the dissolution media . . . . . . . . . . . . . . . . . . . . . . 21
4.2.3 Solid phase characterization . . . . . . . . . . . . . . . . . . . . . . . . . . . . 21
4.3 Molecular modelling . . . . . . . . . . . . . . . . . . . . . . . . . . . . . . . . . . . . . . . . . 22
4.4 Data processing . . . . . . . . . . . . . . . . . . . . . . . . . . . . . . . . . . . . . . . . . . . . . . 22
4.5 Simulation of plasma profiles . . . . . . . . . . . . . . . . . . . . . . . . . . . . . . . . . 23
5 results and discussion . . . . . . . . . . . . . . . . . . . . . . . . . . . . . . . . . . . . . . . . . . . . 25
5.1 Intrinsic dissolution . . . . . . . . . . . . . . . . . . . . . . . . . . . . . . . . . . . . . . . . . . . 25
5.2 Preferred orientation of crystals . . . . . . . . . . . . . . . . . . . . . . . . . . . . . . 25
5.3 In situ solid phase analysis during intrinsic dissolution testing. . 275.3.1 Solid phase analysis using Raman spectroscopy . . . . . . . . . . . . 27
5.3.2 Connection between the solid phase composition and dissolution rate . . . . . . . . . . . . . . . . . . . . . . . . . . . . . . . . . . . . . . . 28
5.3.3 Effect of hydrodynamics . . . . . . . . . . . . . . . . . . . . . . . . . . . . . . . . . 30
5.3.4 Effect of additives . . . . . . . . . . . . . . . . . . . . . . . . . . . . . . . . . . . . . . 31
5.3.5 Uncertainties related to in situ Raman measurements . . . . . 32
5.4 In vitro media for simulating dissolution in vivo . . . . . . . . . . . . . . . 335.4.1 Evaluation of in vivo prognostic dissolution media . . . . . . . 33
5.4.2 Prediction of absorption . . . . . . . . . . . . . . . . . . . . . . . . . . . . . . . . 33
6 conclusions . . . . . . . . . . . . . . . . . . . . . . . . . . . . . . . . . . . . . . . . . . . . . . . . . . . . . . . 37
7 references . . . . . . . . . . . . . . . . . . . . . . . . . . . . . . . . . . . . . . . . . . . . . . . . . . . . . . . . 39

1 INTRODUCTION
VII
abbreviations
API active pharmaceutical ingredientBA bioavailabilityBCS Biopharmaceutics Classification SystemCAT Compartmental Absorption and Transit modelCBZ carbamazepineCCD-Raman charge-coupled device Raman spectroscopyCFC channel flow cellCMC critical micelle concentrationDE dissolution efficiencyDLS dynamic light scatteringEMEA the European Agency for the Evaluation of Medicinal ProductsFaSSIF Fasted State Simulated Intestinal FluidFeSSIF Fed State Simulated Intestinal FluidFDA Food and Drug AdministrationGI gastro-intestinalHIF human intestinal fluidICH International Conference on HarmonisationIDR intrinsic dissolution rateIVIVC in vitro- in vivo correlationNF nitrofurantoinRD rotating discSEM scanning electron microscopySGF Simulated Gastric FluidSIF Simulated Intestinal FluidSLS sodium lauryl sulphateSNV standard normal variateSTC sodium taurocholateTB tolbutamideTP teophyllineUSP United States PharmacopoeiaXRPD X-ray powder diffraction

VIII

1 INTRODUCTION
IX
list of original publications
This thesis is based on the following publications, which are referred to in the text by their respective Roman numerals (I–V).
I Tenho M, Heinänen P, Tanninen VP, Lehto VP. Does preferred orientation of crystallites in tablets affect the intrinsic dissolution? Journal of Pharmaceutical and Biomedical Analysis 43 (2007) 1315-1323.
II Aaltonen J, Heinänen P, Peltonen L, Kortejärvi H, Tanninen VP, Christiansen L, Hirvonen J, Yliruusi J, Rantanen J. In situ measurement of solvent-mediated phase transformations during dissolution testing. Journal of Pharmaceutical Sciences 95 (2006) 2730-2737.
III Lehto P, Aaltonen J, Niemelä P, Rantanen J, Hirvonen J, Tanninen VP, Peltonen L. Simultaneous measurement of liquid-phase and solid-phase transformation kinetics in rotating disc and channel flow cell dissolution devices. International Journal of Pharmaceutics 363 (2008) 66-72.
IV Lehto P, Aaltonen J, Tenho M, Rantanen J, Hirvonen J, Tanninen VP, Peltonen L. Solvent-mediated solid phase transformations of carbamazepine: Effects of Simulated Intestinal Fluid and Fasted State Simulated Intestinal Fluid. Journal of Pharmaceutical Sciences, 98 (2009) 985-996.
V Lehto P, Kortejärvi H, Hirvonen J, Tanninen VP, Peltonen L. Conventional surfactant media as surrogates for FaSSIF in predicting in vivo dissolution of BCS class II drugs. European Journal of Pharmaceutics and Biopharmaceutics, submitted.
Reprinted with permission from the Elsevier Ltd. (I, III, V) and John Wiley & Sons, Inc. (II, IV).

X
1 INTRODUCTION
1
1 introduction
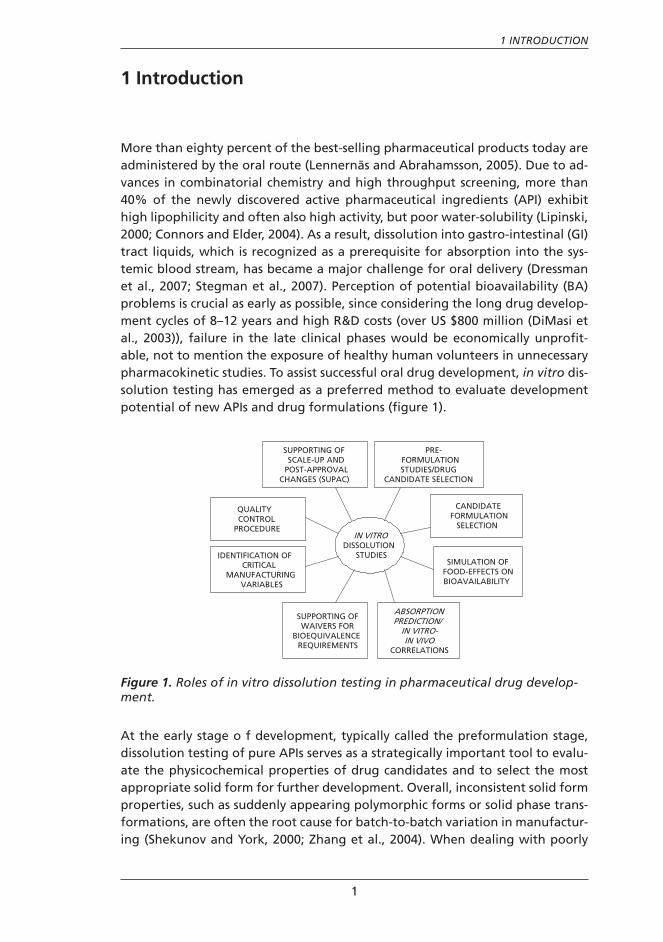
More than eighty percent of the best-selling pharmaceutical products today are administered by the oral route (Lennernäs and Abrahamsson, 2005). Due to ad-vances in combinatorial chemistry and high throughput screening, more than 40% of the newly discovered active pharmaceutical ingredients (API) exhibit high lipophilicity and often also high activity, but poor water-solubility (Lipinski, 2000; Connors and Elder, 2004). As a result, dissolution into gastro-intestinal (GI) tract liquids, which is recognized as a prerequisite for absorption into the sys-temic blood stream, has became a major challenge for oral delivery (Dressman et al., 2007; Stegman et al., 2007). Perception of potential bioavailability (BA) problems is crucial as early as possible, since considering the long drug develop-ment cycles of 8–12 years and high R&D costs (over US $800 million (DiMasi et al., 2003)), failure in the late clinical phases would be economically unprofit-able, not to mention the exposure of healthy human volunteers in unnecessary pharmacokinetic studies. To assist successful oral drug development, in vitro dis-solution testing has emerged as a preferred method to evaluate development potential of new APIs and drug formulations (figure 1).
Figure 1. Roles of in vitro dissolution testing in pharmaceutical drug develop-ment.
At the early stage o f development, typically called the preformulation stage, dissolution testing of pure APIs serves as a strategically important tool to evalu-ate the physicochemical properties of drug candidates and to select the most appropriate solid form for further development. Overall, inconsistent solid form properties, such as suddenly appearing polymorphic forms or solid phase trans-formations, are often the root cause for batch-to-batch variation in manufactur-ing (Shekunov and York, 2000; Zhang et al., 2004). When dealing with poorly
IN VITRODISSOLUTION
STUDIES
QUALITYCONTROL
PROCEDURE
PRE-FORMULATIONSTUDIES/DRUG
CANDIDATE SELECTION
CANDIDATEFORMULATION
SELECTION
SIMULATION OFFOOD-EFFECTS ON BIOAVAILABILITY
ABSORPTION PREDICTION/
IN VITRO-IN VIVO
CORRELATIONS
SUPPORTING OFWAIVERS FOR
BIOEQUIVALENCEREQUIREMENTS
IDENTIFICATION OF CRITICAL
MANUFACTURINGVARIABLES
SUPPORTING OF SCALE-UP AND
POST-APPROVALCHANGES (SUPAC)

2
soluble drugs, even slight changes in dissolution behaviour may lead to inad-equate bioavailability and delay new drug approvals as well as cause product recalls from the market (Meyer et al., 1992; Vippagunta et al., 2001). In addition, observations of potential solubility/dissolution-limited absorption phenomena can strongly facilitate and direct formulation strategies at this stage of develop-ment.
At later stages of development, dissolution tests are performed with drug products to compare prototype formulations, to indicate stability and the suc-cess of the manufacturing process, and to assure safe release of the products to the market. With the introduction of regulatory guidelines concerning Biophar-maceutics Classification System (BCS) (FDA, 2000) and establishment of in vitro-in vivo correlation (IVIVC) (FDA, 1997b; EMEA, 2000), the focus of dissolution testing has rapidly moved from a traditional ‘single point’ quality control test to a critical indicator of medicaments performance in vivo. Especially in the cases of dissolution-controlled absorption (BCS class II drugs), it is of major importance to search for an IVIVC. Validated ‘point-to-point’ IVIVC models enable not only the prediction of absorption profiles, but also the utilization of dissolution tests as surrogate measures for bioequivalence (BE) (called biowaivers).
Prediction of in vivo behaviour often requires the use of in vitro dissolution methods reflecting the in vivo GI conditions. Several physiologically based disso-lution media, like Fasted State Simulated Intestinal Fluid (FaSSIF) and Fed State Simulated Intestinal Fluid (FeSSIF) (Galia et al., 1998; Jantratid, 2008), have been proposed for this purpose, but their prediction accuracy is still insufficient in many cases. One of the main reasons is the complexity of the physiology of the GI tract (e.g. hydrodynamics) and the digestion process, which are not yet completely understood. In addition, the pharmaceutical industry has been re-luctant to make use of the more complex and expensive dissolution media. The lack of innovativeness in employing the available dissolution testing methods is mainly due to the conservative regulatory environment (FDA, 1997a). Although the advised compendial dissolution methods are well-suited for the traditional quality control purposes, they may not be able to answer other challenging de-mands faced during drug product development. For example, by relying solely on the detection of drug concentrations in the liquid state, problematic dissolu-tion behaviour of APIs undergoing solvent-mediated phase conversion during the dissolution cannot be completely addressed. Hopefully, the new regulatory ‘Quality by Design (QbD)’ directives (FDA, 2004a; FDA, 2004b; ICH Q8, 2005a; ICH Q9, 2005b), which encourage pharmaceutical development for in-depth under-standing of ‘causes and consequences’, will lead to even more innovative and science-based approaches in order to ensure the dissolution consistency of the oral dosage forms in human body.
In this thesis, mechanistic in-depth approaches are used to study the early phase dissolution testings of pure APIs and drug formulations. Novel methods comprising simultaneous liquid and solid phase detection during the dissolution testing are demonstrated. In addition, an industrial perspective is provided in the application of in vivo prognostic dissolution media.

2 THEORY AND LITERATURE REVIEW
3
2 theory and literature review
2.1 concept of dissolution
Dissolution is defined as a dynamic process by which a material is transferred from solid state to solvent phase per unit time. Figure 2 is a schematic represen-tation of the dissolution process. At the first stage (a and b) a solute molecule is removed from its solid phase and a cavity for the molecule is created in the solvent. In the second stage (c) molecules of the solute are inserted into solvents cavities and the solute and solvent molecules bind to each other (Brittain and Grant, 1999). For the process to proceed spontaneously, the forces of attraction between the solute and solvent must overcome the attractive forces holding together the solid and the liquid solvent (Byrn et al., 1999). The term solubility is used for a specific thermodynamic parameter, which in specified conditions (temperature, pressure, solvent, pH) is constant. The term dissolution is applied for a kinetic parameter, which presents the amount of drug that transfers from solid state to solvent phase per unit time.
3
SoluteSolute
SolventSolent
S Solute
Solvent
SSolute-solventinteractions
S
(a) (b) (c)
Figure 2. Steps of dissolution process. Modified from Abraham et al., 2002.
Drug absorption after oral administration requires that the drug dissolves into the gastro-intestinal fluids. The theoretical expression most often used to de-scribe the dissolution rate is the Noyes-Whitney equation (Noyes and Whitney, 1897), which was published over one hundred years ago, but is still valid:
( )ts CChAD
dtdm −⋅⋅= )(
(1)
where D is the diffusion coefficient of the drug substance in a stagnant layer of dissolution medium around each drug particle with thickness h, A is the drug particle surface area, Cs is the saturation solubility and Ct is the drug concentra-tion in the bulk solution. The most important physicochemical and physiological parameters affecting drug dissolution in the GI tract are summarized in table 1.

4
In addition, formulation dependent parameters also influence the dissolution of drug products (Dressman et al., 1998; Dressman and Krämer, 2005). Continu-ous removal of a drug from the intestine due to the absorption through the intestinal wall usually assures in vivo that the concentration in the bulk solution is negligible compared to saturation solubility (Ungell and Abrahamsson, 2000). To achieve physiologically representative dissolution results, this state – denoted as ‘sink condition’ – is widely recommended for all in vitro dissolution testing (USP XXXI, 2008; FDA, 1997a).
Table 1. Factors affecting drug dissolution in the gastro-intestinal tract. Modified from Dressman et al., 1998.
factor (noyes-Whitney equation)
Physicochemical Parameter Physiological Parameter
Surface area of drug (A) Particle size, wettability Surfactants in gastric and intes-tinal liquids
Diffusivity of drug (D) Molecular size Viscosity of luminal contents, micelle size of amphiphiles
Boundary layer thickness (h) Motility patterns and flow rate
Solubility (Cs) Hydrophilicity/hydrophobic-ity, pKa, melting point, crystal structure, solubilization, com-plexation
pH, buffer capacity, bile, food components
Amount of drug already dis-solved (Ct)
Permeability across gut wall
Volume of solvent available (Ct) Secretions, co-administered fluids
2.2 dissolution of solid substances
The main area for dissolution rate studies during the early phases of drug devel-opment is the evaluation of different solid forms of a drug (e.g. salts, solvates/hydrates, polymorphs, amorphous forms) or the effects of particle size. This sec-tion focuses on the solid phase and on the importance of solid-state properties on the dissolution rate of APIs.
2.2.1 Classification of solid substancesDrug molecules in a crystal are held together by weak forces such as hydrogen bonds, forces of attraction between polarisable units or by van der Waals forces (Brittain and Byrn, 1999; Grant, 1999). In the crystalline state the atoms, ions, or molecules are arranged in a periodic, three-dimensional (3D) pattern to form unit cells, which, when repeated in regular array, constitute crystal lattices. Poly-morphs are solid crystalline phases of a compound, resulting from at least two

2 THEORY AND LITERATURE REVIEW
5
different molecular arrangements of the compound in the solid-state (Grant, 1999; Bernstein, 2002). When solvent molecules are a part of the crystal lattice, the solid is called solvate, and if the incorporated solvent is water, the term hydrate is used (Morris, 1999). Amorphous forms are non-crystalline materials which lack a definite long-range order (Hancock and Zografi, 1997). The change in crystal structure often, but not always, translates to a change in the external shape (morphology), termed crystal habit.
Differences in packing properties as well as in lattice energies and entropies (see next chapter) between the solid forms give rise to differences in physico-chemical properties (thermodynamic, spectroscopic, kinetic, surface and me-chanical) that may significantly affect the performance of an API (Haleblian and McCrone, 1969; Grant, 1999). These properties are of great importance for the pharmaceutical industry, since the differences in, for example, flowability or tabletting properties may induce difficulties in manufacturing processes. On the other hand, the physical and sometimes also chemical stability may depend on the solid form (Byrn et al., 2001). A major concern, however, is that varying dissolution rates possible for different structures of the same drug entity can, in turn, lead to varying degrees of bioavailability and result in a therapeutic failure (Haleblian and McCrone, 1969; Brittain and Grant, 1999; Vippagunta et al., 2001). Classical API examples are carbamazepine (Meyer et al., 1992) and ritonavir (Chemburkar et al., 2000). Therefore, regulatory guidelines require the pharmaceutical industry to characterize the physicochemical properties of APIs and to evaluate their impact on dissolution behaviour (Byrn et al., 1995; ICH, 1999; Huang and Tong, 2004; FDA, 2007).
2.2.2 Stability relationships between solid phases – meaning for solubility and dissolution
Thermodynamically, only one solid form is stable at constant temperature and pressure. All the other forms tend to transform to the stable solid form. The Gibbs free energy of a polymorph is defined as:
TSHG −= (2)
where H is the enthalpy, T is the absolute temperature and S is the entropy. The stable solid form has the lowest Gibbs free energy. Two polymorphs are classified as enantiotropes if a reversible transition occurs at definite transition temperature (Tt), below the melting point of either polymorphic form (figure 3a). Each enantiotrope has its own range of stability and at transition tempera-ture the Gibbs free energies of the two phases are equal, meaning that the two phases are in equilibrium. Examples of enantiotropic APIs are carbamazepine, metochlopramide and tolbutamide (Giron, 1995; Burger and Ramberger, 1979; Yu, 1995). In a monotropic system only one polymorph is stable at all temper-atures (i.e. has the lowest Gibbs free energy) (figure 3b). Monotropic system has been reported for e.g. chloramphenicol palmitate (Giron, 1995). Solids that are thermodynamically unstable, but may exert kinetically stable behaviour for

6
some time at given conditions, are said to be metastable. Amorphous form of solid (i.e. form that possess no long-range order) is the most energetic form, which, above its glass transition temperature (Tg) tends to crystallize to a crystal-line form.
Figure 3. Energy diagram for (a) enantiotropic and (b) monotropic systems. Modified from Burger and Ramberger, 1979.
Different lattice free energies also give rise to differences in solubilities be-tween the solid forms (Brittain and Grant, 1999). The solid having higher lattice free energy (i.e. the less stable form) dissolves faster, because the release of a higher amount of stored lattice free energy will increase the solubility and, hence, the driving force for dissolution. Hydrates are very common among the pharmaceutical APIs - about one-third are capable of hydrate formation (Griesser, 2006). The hydrates are usually more stable and less soluble than their anhydrous counterparts at temperatures regularly used in solubility and dissolu-tion testing (25–37°C) (Shefter and Higuchi, 1963; Yalkowsky, 1981). The stabil-ity of hydrate crystal structures is related to hydrogen bonding ability of water molecules, which contributes to stabilizing the crystal lattices (Gillon et al., 2003; Morris, 1999). The solubility diagram for a hydrate-anhydrate system can be ex-pressed by using a van’t Hoff Plot (figure 4) (Shefter and Higuchi, 1963; Byrn et al., 1995). The general rule that lower dissolution and absorption rates are obtained with hydrate forms has been found to hold true for e.g. theophyl-line (de Smidt et al., 1986; Zhu et al., 1996), ampicillin (Zhu and Grant, 1996) and glutethimide (Khankari and Grant, 1995), but opposite observations also exist, for example in the case of erythromycin (Allen, 1978). Amorphous forms of pharmaceuticals have been found to be much more soluble than their crystal-line counterparts (Hancock and Parks, 2000). The determination of meaningfull experimental solubilities for amorphous materials has been found, however, difficult because of the tendency to rapidly revert to the crystalline state upon exposure to small quantities of solvent.
Temperature
Ene
rgy,G
Tt Tm,A Tm,B
Form B
Form A
TemperatureE
nerg
y, G
TtTm,A Tm,B
Form B
Form A

2 THEORY AND LITERATURE REVIEW
7
2.2.3 Phase transformations & dissolution
Pharmaceutical development of metast-able forms with higher thermodynamic activity is sometimes desired because the enhanced biopharmaceutical properties they possess as a result of higher solubili-ties and faster dissolution rates. In other cases, metastable forms are unaccept-able because of transformation to ther-modynamically more stable forms during processing (e.g. wet granulation, drying or milling) (Shekunov and York, 2000; Wik-ström et al., 2005; Jørgensen et al., 2004;
Airaksinen et al., 2005, Aaltonen et al., 2007), storage (Byrn et al., 1995; Byrn, 2001), or, perhaps most importantly, during dissolution in the aqueous environ-ment of the GI tract (Kahela et al., 1983; Meyer et al., 1992). The most serious consequence of these transformations is that the bioavailability and therapeutic efficacy may be endangered, since the crystallization of a stable form will inter-fere with the dissolution kinetics and deplete the drug concentration available for absorption. Experimental interpretation of in vitro dissolution or solubility of drugs capable of hydrate formation is quite a challenging task, and a strong need exists for new applications (Shefter and Higuchi, 1963; de Smidt et al., 1986; Zhu et al., 1996; Rodriquez-Hornedo and Murphy, 1999; Tian et al., 2007). Although solid-solid transformations are also possible for the pharmaceutical APIs, this sec-tion focuses on describing transformations mediated by the solvent.
Crystallization (supersaturation, nucleation and crystal growth)Transformation to a new solid phase is a kinetic crystallization process which can be described by two steps, nucleation and crystal growth (Myerson, 1999). Su-persaturation, i.e. the state where the concentration of solute exceeds the equi-librium concentration, sets up the thermodynamic potential for nucleation and crystal growth. Numerous methods exist to create supersaturation: evaporation of solvent, dissolution of metastable solid phases, or methods that regulate the solute solubility, including change in temperature, pH, solvent composition, and enzyme activation.
Crystal nucleation occurs when dissolved molecules aggregate in a supersatu-rated solution into organized clusters. Nucleation can be divided into two cat-egories: (1) homogenous nucleation, which occurs only in bulk solutions having large volumes, and (2) heterogeneous nucleation, which occurs at interfaces or surfaces (Mullin, 2001). Nucleation rate can be controlled by viscosity, tempera-ture, degree of supersaturation, solubility and solid-liquid interfacial tension (Mullin, 1993; Myerson, 1993). For example, increasing solubility increases the rate of nucleation (at constant supersaturation) by increasing the probability of intermolecular collisions.
1/temperature (K)
ln s
olub
ility Anhydrate
Hydrate
Tt
Figure 4. Solubility diagram for anhydrate-hydrate system. Modified from Shefter and Higuchi, 1963.

8
Growth of crystals consists of several stages (Rodriquez-Hornedo and Mur-phy, 1999): (1) transport of molecules from the bulk solution to a site at the crystal surface (i.e. impingement site), (2) absorption of the growth unit onto the impingement site, (3) diffusion from impingement site to a growth site, and (4) incorporation into crystal lattice. Crystal growth can be either: (1) vol-ume-diffusion controlled, if diffusion of the solute from the bulk solution to the crystal surface is the rate-limiting step, or (2) surface integration controlled, if incorporation into a crystal lattice is the slowest process (Nyvlt et al., 1985; My-erson, 1993). Crystal growth can be affected by supersaturation, temperature, additives or solvent(s). For a diffusion controlled process, the hydrodynamic con-ditions, such as flow rate or stirring rate, may have a remarkable effect.
Crystal morphologyThe morphology of a crystal (i.e. crystal habit) is determined by the relative growth rates of individual crystal faces; the ones that have the most influence are the slow growing faces. A classification of crystal morphologies is given in the United States Pharmacopoeia (USP) (USP XXXI, 2008). Morphology changes are due to different crystal faces that grow at different rates depending on the internal factors such as crystal defects, or external ones such as temperature, sol-vent conditions or presence of additives (Garti and Zour, 1997). Crystals having elongated, acicular or plate-like habits may produce difficulties in their phar-maceutical behaviour in, for example, flowability, compressibility, wettability or dissolution (Shekunov and York, 2000; Davey et al., 2002; Garnier, 2002).
Effect of additivesAdditives, such as surfactants regularly used for solubilising poorly water-solu-ble drugs, are known to affect the crystallization. Surfactants can solubilize hy-drophobic drugs through micellar solubilization (Mukerjee and Cardinal, 1976; Luner et al., 1994; Yalkowsky, 1999; Alvarez-Nunez and Yalkowsky, 2000, Li and Zhao, 2003; Chen et al., 2003), which usually results in higher solubilities and dis-solution rates. Depending on the solubilization capacity, surfactants have shown to induce more rapid achievement of the supersaturated state and, thereby, faster onset of nucleation (Luhtala, 1992; Rodriquez-Hornedo and Murphy, 2004). The surfactant micelles may also either promote the crystallization of a stable solid form by acting as templates for nucleation and growth (Weissbuch et al., 1991; Canselier, 1993), or retard the crystallization when increase in solu-bility is compensated by intermolecular interactions between the surfactant and crystallizing solute (Garti et al., 1982; Furedi-Millhofer et al., 2002). If surfactants adsorb or interact with specific crystal faces during growth, crystal morphology may be changed (Hendriksen et al., 1998; Sinclair, 2000; Rodriquez-Hornedo and Murphy, 2004). A schematic representation of the change in crystal morphology due to inhibition of growth of a specific crystal face is presented in figure 5.

2 THEORY AND LITERATURE REVIEW
9
Transformation during dissolution; stages and controlling processes
Solvent-mediated transformations occurring during the dissolution of a metastable solid can be described by three stages (Cardew and Davey,
1985): (1) First stage is a pre-trans-formation stage during which the metastable solid dissolves until the
solubility limit of the stable form has been exceeded (i.e. the supersaturated state is created); (2) During the transformation stage nucleation and growth occur and supersaturation with respect to the stable solid form is maintained by dissolution of both the forms; (3) After the transformation is over (steady-state stage), the crystals of the stable form dissolve at a constant rate. The driving force for the solvent-mediated transformation is the solubility difference be-tween the metastable and stable phases.
A model has been developed and used to explain the solvent-mediated trans-formation kinetics (Cardew and Davey, 1985;Davey et al., 2002). For a dissolu-tion controlled process, rate constant kdissolution<<kgrowth, and the dissolution of the metastable phase is slower than the nucleation and growth of the stable phase, resulting in an initial decline in the supersaturation as crystallization of the stable phase rapidly depletes the concentration in solution (figure 6). When kdissolution>>kgrowth, the process is growth controlled and the supersaturation re-mains close to the initial supersaturation as the metastable form dissolves.
2.2.4 Dissolution testing of solid forms
The effect of solid form properties on dissolution rate is usually tested with pure APIs by studying the surface spe-cific dissolution, termed intrinsic disso-lution, of a material (Nicklasson, 1992; Gibson, 2000). The basis of the intrinsic dissolution method is that the surface area of the compact is kept constant during the testing (USP XXXI, 2008). The advantage of the method is that particle size effects can be excluded, which may hide the actual solid form effects on the dissolution rate. The dissolution rate is expressed as the
amount of drug dissolved per unit surface area per time (e.g. mg/(min cm2). The rotating disc method is the most popular technique for testing the intrinsic dissolution rate and the use in preformulation phase dissolution studies is well documented (Levich, 1962; Grijseels et al., 1981; Nicklasson et al., 1981; Grijseels
Additive interactionwith face a
growth b>>growth a
face b
Figure 5. Morphology change due to additive interaction with crystal face a. Higher growth rate of face b results in an elongated habit.
Time
Rel
ativ
e su
pers
atur
atio
n kdissolution>>kgrowth
kdissolution<<kgrowth
Figure 6. Supersaturation dependence on the dissolution of a metastable and growth of stable crystal form during solvent-mediated transformation. Modified from Davey et al.,1986.

10
et al., 1983; Nicklasson and Magnusson, 1985; Nicklasson et al., 1988; Nicklasson, 1992 USP XXXI, 2008). The dissolution rate in a centrically mounted rotating disc can be expressed according to Levich’s equation (1962):
2/126/13/261.0/ ω⋅⋅⋅⋅⋅= − rCvDdtdm s , (2)
where D is the diffusion coefficient, v is the kinetic viscosity of the solvent, Cs is the aqueous solubility, r is the radius of disc and ω is the angular velocity. Ac-cording to this equation, constant laminar flow hydrodynamics can be assured if a linear relationship with zero intercept is obtained between the dm/dt and ω . Although the determination of intrinsic dissolution from the compressed
discs is well standardized (USP XXXI, 2008), it still encompasses many uncertain-ties that may affect interpretation of the results. For example, with solids that undergo solvent-mediated transformation during dissolution testing, it may be unachievable to detect which of the solid phases is determining the dissolu-tion rate by measuring only the dissolved concentrations in the liquid state. The subchapters below also address a few uncertainties related to sample prepara-tion.
Preferred orientationCrystal growth and habit were addressed earlier in this literature review. Pre-ferred orientation, also called texture, usually results when powders with highly asymmetric crystal habits (e.g. plate-like or needle-like habits) tend to adopt a preferred alignment in a sample or, more usually, due to the different treat-ments, such as compression (figure 7), formation (drawing, stretching or rolling), or annealing (Kocks et al., 2000). In a highly texturized sample, only certain crys-tal faces are represented on the tablet surface. Since dissolution can be roughly considered as the inverse process of the crystal growth (e.g. slower growing face = slower dissolution rate), the surface specific dissolution rate from tablets con-sisting of randomly distributed isotropic crystals can be assumed to differ from that of texturized tablets (Watanabe et al., 1982; Danesh et al., 2001; Prasad et al., 2002).
Figure 7. Compacts with randomly distributed (left) and preferentially oriented crystals (right).

2 THEORY AND LITERATURE REVIEW
11
crystal imperfections/crystallinityPrior to the intrinsic dissolution measurements, APIs are compressed into com-pacts. Depending on the mechanical stress applied, molecular disordering from a large number of crystal imperfections, such as vacancies (point defects), dis-locations (line defects) or grain boundaries (surface defects), can be induced to reduced crystallinity (amorphization) (Grant and York, 1986; Fabbiani and Pulman, 2006). The dissolution phenomenon exhibits the same symmetry as the crystal structure itself and, thereby, depends on the type of forces that exist between the atoms and molecules in the crystal lattice. Crystal lattice imperfec-tions increase the dissolution rate by assisting the weakening of forces holding the crystals together (Burt and Mitchell, 1981). Large disordered areas on the surface of the compacts may act as high energy spots, where wettability and dissolution is enhanced.
2.3 dissolution as a prognostic in vivo tool
One of the most important purposes of the in vitro dissolution testing is to pre-dict in vivo performance of formulated drug products. This section focuses on absorption limitations, GI conditions for dissolution and in vivo prognostics of in vitro dissolution media.
2.3.1 Limiting factors in oral absorptionBioavailability (BA) is defined as the rate and extent to which the active sub-stance is absorbed from a drug product and becomes available at the site of ac-tion (FDA, 2000). Processes that may influence the BA are highlighted in figure 8.
Figure 8. Processes influencing the bioavailability (BA) of therapeutic APIs.
According to the following equation, the oral bioavailability can be simpli-fied to be determined by three major components:
GutLumen
Gut WallPortal Vein
Liver SystemicCirculation
Transit
Solid dosage form
DisintegrationDissolution
Drug in solution
Degradation
Complexation
Precipitation
Metabolism (EG) Metabolism,
biliaryexcretion (EH)
Fa BA

12
)1()1( HGa EEFBA −⋅−⋅= , (3)
where Fa is the fraction of the dose that is absorbed across the apical cell membrane of the enterocyte and EG and EH are the fractions that are extracted over the gut and the liver, respectively (FDA, 2000). The Fa may be limited by several different sources of reactions in the GI lumen and at the apical side of the enterocyte membrane: (1) the drug is not released from the formulation over an appropriate time frame, (2) the drug is decomposed in the GI tract or a nonabsorbable complex is formed, (3) the drug does not permeate efficiently enough across the gut wall or it is transported back to GI lumen by efflux trans-porters, or (4) the drug is metabolised presystemically, for example in the gut wall (Macheras et al., 1995).
2.3.2 Biopharmaceutics classification systemThe Biopharmaceutics Classification System (BCS), proposed by Amidon et al. in 1995, is a simplified model which classifies APIs into four basic groups according to their solubility and permeability (figure 9). Equilibrium solubility is consid-ered high if the highest dose of the drug can be dissolved in 250 ml of buffer solution over entire physiological pH range (pH 1-7.5 (FDA, 2000) or pH 1-6.8 (EMEA, 2002). A drug is assigned as highly permeable if the fraction absorbed after oral administration is >90% (FDA, 2000). Since processes in body liquids are usually kinetic in nature (not equilibrium), also a requirement for rapid dissolu-tion has been established (>85% of the dose should be dissolved in 30 minutes). These classification criteria have been criticized as being overly conservative and relaxed criteria for solubility (soluble in 500 ml) (Polli et al., 2004), permeability (fraction absorbed >85%) (Yu et al., 2002) and dissolution (>85% dissolved in 60 min) (Polli et al., 2004) have been proposed.
Figure 9. Biopharmaceutics Classification System.
applications of Bcs in pharmaceutical industry(1) The main aim of the BCS is to provide a regulatory tool for replacing bioavail-ability/ bioequivalence (BA/BE) studies by prognostic in vitro dissolution tests, e.g. in the case of approving generic drug products or with Scale-Up and Post Approval Changes (SUPACs) (FDA, 2000; EMEA, 2002). The BCS allows a biow-
Class IVPoor solubility
Poor permeability
Class IIPoor solubility
Good permeability
Class IGood solubility
Good permeability
Class IIIGood solubility
Poor permeability
Class IVPoor solubility
Poor permeability
Class IIPoor solubility
Good permeability
Class IGood solubility
Good permeability
Class IIIGood solubility
Poor permeability
Solubility
Permeability

2 THEORY AND LITERATURE REVIEW
13
aiver for class I drugs (high solubility, high permeability, rapid dissolution) with good stability in the GI tract and a wide therapeutic window (Amidon et al., 1995; Lennernäs and Abrahamsson, 2005). In the future, also BCS class III APIs should be considered as biowaiver candidates (Blume and Schug, 1999; Polli, 2004; Kortejärvi et al., 2007).
(2) BCS can also be used as a simple tool in early drug development to deter-mine the rate-limiting step in oral absorption process and, thereby, to assist in selecting new drug candidates and further guiding the formulation decisions (Abrahamsson and Lennernäs, 2004; Lennernäs and Abrahamsson, 2005; Len-nernäs et al., 2007). Increased risk for successful drug product development can be considered with BCS class II and IV APIs, which are usually quite lipophilic and, thus, sparingly water soluble. For BCS class II drugs, oral absorption is pre-dominantly limited by their (a) inability for the whole dose to be dissolved in the gastrointestinal (GI) aqueous contents or (b) their too slow dissolution rate to occur in the proper time frame (Dressman et al., 1998). Mediated by dissolu-tion, the BA of class II drugs is influenced by physicochemical, physiological and formulation parameters, and can often be increased by different formulation methods (e.g. nanoparticles, microemulsions, semisolids), solid phase treatment approaches (e.g. micro/nanonization, amorphization, solvate/hydrate forma-tion) or by co-digested fatty meal (Gibson et al., 2000; Lennernäs and Abraham-sson, 2005; Porter et al., 2007; Stegman et al., 2007).
(3) One use of BCS is evaluation whether in vitro–in vivo (IVIVC) correla-tion would be achievable. A point-to point relationship, i.e. level A IVIVC (FDA, 1997b) can usually be found between the in vivo and in vitro dissolution, if the dissolution is the determining step for absorption, as in the case of class II drugs or controlled release formulations.
(4) For immediate release dosage forms, the BCS provides a good starting point for dissolution method development. For class II (and sometimes class IV) drugs, use of biologically relevant dissolution media may assist in achieving IVIVC, or at least an in vitro–in vivo association (Dressman and Reppas, 2000; Nicolaides et al., 2001). For BCS I and III drugs, IVIVC is usually not achievable because permeability or gastric emptying is the rate limiting step for absorption. In those cases, a simple quality control method using plain buffer solutions is suitable throughout the lifecycle (Klein et al., 2005).
2.3.3 Gastrointestinal conditions for solubility and dissolutionThe in vivo solubility and dissolution rate are affected by GI conditions such as pH, GI fluid composition and hydrodynamics (Lennernäs et al., 2007). The GI tract consists of three major anatomical regions, the stomach, the small intestine and the colon, which all have their unique features for dissolution and absorption.
Gastric fluids are acidic in fasted state (median pH 1.7), but are buffered to higher pH values at fed state (median pH 5.0) (Dressman et al., 1990; Dressman et al., 1998; Efentakis and Dressman, 1998). In the small intestine, the pH varies from pH 6.0 to 6.5 at fasted state and from pH 5.0 to 5.5 at fed state (Kalantzi et al., 2006). The pH is especially important for the solubility and dissolution of

14
proteolytic drugs with pKa values within the physiological pH range. Some for-mulation excipients may also show pH dependent behaviour.
Dosage form transit time is influenced by intestinal motility and fluid flow. In the fasted state, motility is controlled by migrating myoelectric complex (MMC), which cycles over 90–120 min pushing any residual contents from the stomach to the upper intestine (Kellow et al., 1986). In the presence of food, irregular contractions mix the intestinal contents, but the activities in the stomach are de-layed. This may appear as delayed absorption of weak acids and enteric coated formulations, since the absorption from stomach is generally minimal and oc-curs mainly across the large surface of intestine (Davis et al., 1986; Gruber et al., 1987).
The maintenance of sink conditions for dissolution in vivo is dependent on the available fluid volume. Fluid volumes are controlled by oral intake of liquid or food, secretions and permeability across the GI wall. The fluid volumes in fasted GI tract vary from 20-50 ml in stomach to 120-350 ml in the intestine (Dil-lard et al., 1965; Dressman et al., 1998).
Considering poorly water-soluble, lipophilic drugs, the major dissolution en-hancing factors in the GI tract are wetting and solubilization by physiological amphiphiles. The main endogenous micelle forming surfactants in the GI fluids are bile salts. In the small intestine, the bile salts may incorporate phospholipids and lipid digestion products (e.g. free fatty acids, monoglycerides, cholesterol) into their micellar structure and form various colloidal phases (e.g. mixed mi-celles, vesicular structures, and emulsion droplets) that are capable of efficient solubilization of molecules (Carey and Small, 1972; Gardiner and Small, 1976; Mithani et al., 1996; Charman et al., 1997; Porter and Charman, 2001; Wiedman et al., 2002; Kossena et al, 2003).
2.3.4 Biorelevant in vitro dissolution mediaThe prediction of in vivo dissolution strongly depends on how well the in vitro dissolution test represents the conditions in the GI tract. The consistence of hu-man intestinal fluids (HIF) has been investigated in fasted and fed states (table 2). Although the HIF is the most representative medium for in vivo situation, its use is limited by difficulties in collecting the aspirates, in generating reproduc-ible results and by high costs (Dressman, 2007). The use of canine intestinal fluid (CIF) as an alternative to HIF is limited by higher bile salt levels compared to HIF (Kostewicz et al., 2002; Kalantzi, 2006a). Tubes and various imaging techniques, to directly monitor drug dissolution in vivo, have been used to increase under-standing and to develop better predictive models (Bonlokke et al., 2001; Persson et al., 2005; Persson et al., 2006; Kalantzi et al., 2006b).
Biorelevant media simulating the gastric and intestinal fluids (IF) have suc-cessfully been utilized to better reflect the wetting and solubilization power of the in vivo GI fluids (Naylor et al., 1993; Naylor et al., 1995; Galia et al., 1998; Nicolaides et al., 1999; Pedersen et al., 2000a; Vertzoni et al., 2004; Vertzoni et al., 2007), and in some cases IVIVC has been established (Nicolaides et al., 1999; Dressman and Reppas, 2000; Nicolaides et al., 2001; Sunesen et al., 2005b; Wei

2 THEORY AND LITERATURE REVIEW
15
and Löbenberg, 2006). The first compositions of the most widely used IFs, FaSSIF (Fasted State Simulated Intestinal Fluid) and FeSSIF (Fed State Simulated Intesti-nal Fluid), were designed 10 years ago on the basis of bile salt and phospholipids concentrations and the pH in human GI tract, and buffer capacities measured in a fistulated dog model (Galia et al., 1998; Dressman et al., 1998). In vitro dis-solution rates in these media may not, however, always correlate with aspirated fluids (Pedersen et al., 2000b; Kostewicz et al., 2002). Lately, the composition of FaSSIF and FeSSIF has been redefined to better correspond to the fasted and fed conditions in the proximal gut (Jantratid et al., 2008) (table 3). For exam-ple, monoglycerides and fatty acids, important digestion lipids that affect the solubilization and dissolution in the fed state, are now included in the FeSSIF. Complexicity and high costs of these physiologically based media, however, limit their wider use for industrial drug development purposes and development of simpler media for in vivo prediction is strongly warranted.
Table 2. Characteristics of human intestinal fluid, HIF.
HIF Fasted Fed
Bile salts (mM)
(mean ± SD)2.0 ± 1.9a (n=9) Jejunum
2.9 ± 2.9b (n=37) Jejunum
5.3 ± 4.7c (n=16) Jejunum
5.9 ± 1.8d (n= 7) Duodenum
14.7 ± 8.9c (n=16) Jejunum
16.2 ± 1.5e (n=13) Jejunum
10.1 ± 4.2d (n=7) Duodenum
Phospholipids (mM)
(mean ± SD)
0.2 ± 0.07f Jejunum 3.0 ± 0.3 f (n=3) Jejunum
4.31 g (pooled, n=12) Duodenum
6.3 ± 1.0d (n=7) Duodenum
Monoglycerides (mM) 5.4 ± 4.5d, 3.9 ± 1.7e
Free fatty acids (mM) 23.5h 28.3 ± 4.1 h
Cholesterol (mM) 1.5 ± 0.12 h
pH 6.63 ± 0.23i 5.1-5.4 j
a Pedersen et al., 2000b, bLindahl et al., 1997, cTangerman et al., 1986, dArmand et al., 1996, eRauterau et al., 1981, fPersson et al., 2005, gKalantzi et al., 2006a, hMansbach et al., 1975, iKostewicz et al., 2002, j
Dressman et al., 1990.
Table 3. Compositions of FaSSIF and FeSSIF according to Jantratid et al., 2008.
fassif fessif
Bile salt (sodium taurocholate) (mM)
Phospholipid (lecithin) (mM)
Maleic acid (mM)
Sodium hydroxide (mM)
Sodium chloride (mM)
Glyceryl monooleate (mM)
Sodium oleate (mM)
pH
Osmolality (mOsm kg-1)
Buffer capacity (mmol l-1 ΔpH-1)
3
0.2
19.12
34.8
68.62
6.5
180 ± 10
10
10
2
55.02
81.65
125.5
5
0.8
5.8
390 ± 10
25

16

3 AIMS OF THE STUDY
17
3 aims of the study
The topic of this thesis was to combine solid phase analyses with dissolution determinations and, thereby, to provide in-depth understanding of the effects of solid state properties on the intrinsic dissolution rate of APIs. In addition, an objective was to find a simplified dissolution media in order to predict and com-pare the in vivo behaviour of BCS class II drugs. The specific aims of the thesis were the following:
• To study the effects of preferred orientation of crystals on IDR and, in this context, to clarify the extent of influence that sample preparation exerts on intrinsic dissolution studies (I)
• To explain the changes in intrinsic dissolution rate due to solvent-mediated phase transformations by simultaneously measuring the drug concentrations in the dissolution media and quantifying solid phase compositions of the dis-solving solids in situ with Raman spectroscopy (II, III, IV)
• To investigate the effects of hydrodynamics on the solvent-mediated trans-formation kinetics by comparing two intrinsic dissolution testing devices with different liquid flow characteristics (III)
• To gain molecular level insight into the influence of biorelevant dissolution medium, FaSSIF, on the solvent-mediated transformation behaviour (II, IV)
• To evaluate dissolution media with synthetic surfactants for their ability to enhance drug dissolution similarly to FaSSIF, and to predict drug absorption in vivo (V)

18

4 EXPERIMENTAL
19
4 Experimental
4.1 Materials
Used materials and references to corresponding publications are summarized in table 4.
Table 4. Materials used in this thesis work.
Material Publication source
Acetylsalicylic acid (ASA) I Shandong Xinhua, ChinaTolbutamide (TB) I Dipharma Francis, FranceCarbamazepine (CBZ) I, IV Fabrika Italiana Sintetici, ItalyEntacapone I Orion Corporation, Fermion, FinlandTheophylline (TP) II, III BASF, Ludwigshafen, GermanyNitrofurantoin (NF) II Sigma-Aldrich, Seelze, GermanySpironolactone V Pharmacia Ltd., United KingdomDanazol V Yangzhou Pharmaceutical co., Ltd., China
N74 (phase I substance) V Orion Corporation, Orion Pharma, Finland
Spiridon® tablets V Yangzhou Pharmaceutical co., Ltd., China
Danol® capsules V Sanofi-Synthelabo, United Kingdom
N74 capsules V Orion Corporation, Orion Pharma, Finland
Ethanol (96% v/v) I, II, III, IV Primalco, Rajamäki, FinlandSodium taurocholate (extracted from ox)
IV, V Sigma-Aldrich Chemie GmbH, Germany
Egg phosphatidylcholine (lecithin)
IV, V Lipoid E PCS, n.l.t. 96% pure, Lipoid GmbH, Germany
Sodium lauryl sulphate (96% pure)
V Fluka, Bucfs, Switzerland
Tween 80 (per sinteci) V Merck-Schicherdt, GermanySodium dihydrogen phosphate, sodium chloride, sodium hydroxide, phosphoric acid, hydrochloric acid (analytical grades)
I,V Merck KGaA, Germany
Phosphate buffers pH 5.5 (USP), 6.5 (USP), 6.8 (Ph.Eur.)
I, V FF Chemicals, Finland
Simulated Gastric and Intestinal Fluids (USP grade, without enzymes)
III, IV Oy Reagena Ltd., Finland
Preparation of the studied solidsTP monohydrate (II, III), NF monohydrate (II) and CBZ dihydrate (IV) were crys-tallized from aqueous solutions. Anhydrous forms used in the studies were ob-tained by dehydration of their respective monohydrate forms at 100°C under

20
reduced pressure (72 mbar, for 24 hours). For texture measurements, the tex-turizing batches were obtained by one of the following means: sieving (ASA), recrystallizing from ethanol: drug solution by drowning out with water (TB), by dissolving drug powder into etanol and drying at 80°C, or as received (entaca-pone). Batches with less-texturizing behaviour were produced by grinding the texturizing batch with mortar and pestle.
Preparation of the dissolution mediaFasted State Simulated Intestinal Fluid (FaSSIF) containing biological amphiphiles, sodium taurocholate and lecithin, was prepared according to Galia et al. (1998) (IV, V). The synthetic surfactant solutions studied in publication V were prepared by adding various concentrations (w/v %) of either SLS or Tween 80 into sodium based phosphate buffer solution pH 6.8 (Ph. Eur.). Phosphate buffer solutions pH 5.5 (USP) (I), pH 6.5 (USP) (I) and pH 6.8 (Ph. Eur.) (V), Simulated Gastric Fluid (SGF) pH 1.2 (III) and Simulated Intestinal Fluid (SIF) (IV) were used as received.
4.2 Methods
Experimental methods and equipment used in this thesis and references to the corresponding publications are summarized in table 5.
4.2.1 Dissolution methodsDissolution rates of pure APIs in publications I–IV were studied using intrinsic dissolution methods. Two devices were used (III, figure 1): standardized rotat-ing disc (RD) (USP) (I, III) and channel flow cell (CFC) apparatus introduced for pharmaceutical purposes more recently (Peltonen et al., 2003) (II, III, IV). In both methods only one face of the powder compact is in contact with the dissolution medium. XRPD was used to confirm that no phase changes or reduced degrees of crystallinity were induced during the preparation of compacts. To assure sink conditions and the best possible discrimination power of the dissolution meth-ods, composition of dissolution media, pH (range 1.2-6.8) and rotation (rpm)/flow (range 9.0-20.0 ml/min) rate were chosen in each case based on the pKa and solubility properties of the studied drug.
Dissolution studies of the drug formulations in FaSSIF and conventional sur-factant media were performed with a flow through dissolution method de-scribed in USP (V). Flow rate of 8 ml/min was used since velocities (2 cm/min us-ing Ø 22.6 mm cells) close to those reported to exist in GI tract (1.5 cm/min) were achieved (Sunesen et al., 2005b). Dissolution equipment was used as an open loop to assure the maintenance of sink conditions with the tested poorly soluble drugs. Collected fractions were filtered (0.45 μm) and in some cases centrifuged (2500 rpm for 5 min) prior to analysis.
Quantification of the dissolved amounts were performed either with UV-Vis-spectrophotometer (I-IV) or by reverse-phase HPLC (Agilent 1100) with UV de-tector (V).

4 EXPERIMENTAL
21
Table 5. Methods and techniques used in this work.
Method/equipment Publication equipment
X-ray powder diffractometry (XRPD)
I–IV Bruker AXS, Bruker, Germany/
Philips X’Pert Pro II, PANalytical, The Netherlands/
Philips X’Pert Pro MPD, PANalytical, The Nether-lands
Raman spectroscopy II, III, IV Spectrometer: Control Development Inc., USA (IN), probe: InPhotonics, USA (MA), laser: Star-bright 785 S, Torsana Laser Technologies, Den-mark/
VTT Optical Instrument Centre, Finland
Scanning electron microscopy (SEM)
I–IV Scanning microscope JSM-840A, Jeol, Japan with ADDA and Image AnalySIS software, Olympus Soft Imaging Solutions GmbH, Germany
Intrinsic dissolution measure-ments
I–IV Rotating disc, USP/
Channel flow cell (Peltonen et al., 2003)
Surface tension measurements V Delta-8 automatic multichannel micro tensiom-eter with 8 parallel balances, Kibron Inc., Finland
Hydrodynamic particle size measurements/Dynamic light scattering
V Zetasizer Nano ZS, Malvern Instruments Ltd., United Kingdom
Solubility measurements V Modified shake-flask method
Flow through dissolution meas-urements
V Dissolution tester with a piston pump CY7-50, Sotax, Switzerland
4.2.2 Evaluation of the dissolution mediaSurface tensions of the dissolution media were measured with 96-well plates using the Du Noüy maximum pull force method. Critical micelle concentrations (CMC) were derived from the surface tension measurements. The hydrodynamic size (d(H)) of the micelles in each media was evaluated by dynamic light scat-tering (DLS) measurements at detection angle of 173° and wavelength of 633 nm. The translational diffusion coefficients (D) were converted to hydrodynamic sizes of the particles using Stokes-Einstein relation (V, equation 1). The micelle sizes were presented as intensity distributions.
4.2.3 Solid phase characterization Solid forms were verified after crystallization, grinding, compression and dissolu-tion testing using X-ray powder diffraction equipped with theta-theta goniom-eter (I-IV). The measurements were performed in symmetrical reflection mode using Göbel mirror bent multiplayer optics. Degree of crystallinity was checked after compression by Full Width at Half Maximum (FWHM) comparisons. The texture, in publication I, was characterized with three different methods: (1) pole figure analysis (with Schultz reflection geometry), (2) crystal structure cal-culations and (3) peak intensity comparison. For the last two methods, the or-

22
dinary laboratory diffractometer with Bragg-Brentano geometry was used, but for the pole figure measurements the diffractometer was equipped with special (ATC-3) goniometer.
Solid state compositions during intrinsic dissolution testing were monitored in situ with CCD-Raman spectrometers equipped with fibre optic probes. With the CFC dissolution device, a Raman spectrometer (resolution 5 cm-1) equipped with diode laser having operational wavelength of 785 nm and spot size of 200 μm was used (II, III, IV). With the RD dissolution equipment, the spectrometer operated at a higher wavelength (830 nm) and collected information from a larger area (spot size 600 μm) (III). The Raman spectral intensities were normal-ized by standard normal variate (SNV) transformation (Barnes et al., 1989). For the purposes of this study, quantification using a univariate method was suf-ficient: A ratio of test peak and reference peak areas was calculated and the results were correlated with hydrate contents (w/w%) in the samples. The main differences in measuring the configurations were that, in RD, the signal was measured through the dissolution medium, the glass wall of the vessel and the water bath, whereas in CFC, the measurement was conducted through a quartz sight window modified for the Raman probe and through a much thinner layer of dissolution medium (III, figure 1)
Scanning electron microscopy (SEM) was utilized for crystal morphology (habit) examination prior to the texture measurements (I) and during the sol-vent-mediated phase conversions (off-line) (II-IV). The excess dissolution media was immediately removed from the compact surfaces and samples were sput-tered with a layer of cold under vacuum prior to the measurements.
4.3 Molecular modelling
Hydrogen bonding capability between the API and amphiphile molecules was inspected by docking simulations (IV). Calculations of minimum energy struc-tures (MMFF94x force field) of isolated molecules were performed within MOE modelling environment (Chemical Computing Group Inc., Montreal, Canada, 2007).
4.4 data processing
Kinetics of the solvent-mediated phase conversions were evaluated by fittings using Weibull distribution combined with Nonlinear Mixed Effects Model ap-proach (NONMEM) (Davidian and Giltinan, 1995) (III, equation 1, and IV). Rate of conversion functions were derived from the fitted Weibull models, and the de-scriptive solid transformation parameters were solved from the resulting func-tions according to equations 2–4 presented in publication III.
Intrinsic dissolution concentration data were analysed by moving the fit of a simple linear regression (III, IV). The series of regression coefficients were con-

4 EXPERIMENTAL
23
sidered estimates of the rate of dissolution. Flow-through dissolution profiles were evaluated using analysis of variance to compare the dissolution efficiencies (DE%) (Khan and Rhodes, 1975). Fractional dissolution rates (Lánský and Weiss, 2003) for the first order kinetic model were calculated from the flow through dissolution data and the obtained rate constants were used as input parameters for plasma profile simulations (V, equations 2-4). All model fittings were per-formed with SAS software (version 9.1.3, SAS Institute Inc., USA).
4.5 simulation of plasma profiles
The in vivo predictability of the different ‘biorelevant’ dissolution media were tested by comparing the observed and simulated plasma profiles (V). The ob-served plasma profiles were obtained from in vivo studies with fasted beagle dogs. Simulation of plasma profiles was performed using a compartmental absorption and transit model (CAT) (Yu et al., 1996) (software Stella 8.1, isee systems, Lebanon, NH, USA) (figure 10). This model combined the following: 1) the basic pharmacokinetic parameters (bioavailability (BA), distribution rate constants (K12, K21), elimination rate constant (Kel), absorption rate constant (Ka)
and volume of distribution (Vss)) calculated from the in vivo data obtained af-ter administration by intravenous injection, oral solution and oral capsule; 2) the physiological parameters of canine GI tract (gastric emptying and intestinal transit rates and liquid volumes in the stomach and intestine) obtained from the literature; and 3) the dissolution rate constants (input parameters) derived from the in vitro flow through dissolution data. The observed versus simulated plasma profiles were compared by means of AUC and Cmax values (with predic-tion errors (PE%)).
Figure 10. The structure of the CAT simulation model illustrating the rate constants for gastric emptying (Kge) (for capsule and solution), dissolution (Kd), intestinal transit (Kt), absorption (Ka), distribution (K12, K21) and elimination (Kel) (modified from publication V).
Solid
Solid
Solution
Solution
Stomach: 1st
compartment
Intestine: 2nd -8th
compartmentCentral
compartment
Peripheralcompartment
Kd
Kge(capsule) Kge(liquid)
Kt Kt
Ka
K12K21
Kel
SolidColon: 9th
compartmentSolution
Structure of CAT-model

24

5 RESULTS AND DISCUSSION
25
5 results and discussion
5.1 intrinsic dissolution
The intrinsic dissolution method is based on the idea that the surface area of the dissolving sample is kept constant during testing (Levich, 1962; USP XXXI, 2008). Although considered as quite a simple method, serious sources of errors exist that may affect the concentration gradient at the solid-liquid interface and lead to errors in the evaluation of the dissolution rate. Potential factors that may affect the interpretation of the intrinsic dissolution (figure 11) were studied in publications I–IV and are discussed in the next chapters.
Figure 11. Factors that may affect the intrinsic dissolution rate of drugs.
5.2 Preferred orientation of crystals
As highlighted in the theoretical part, the preferred orientation of drug crystals with highly asymmetric habits (e.g. plate-like or needle-like) can be induced, for example, when preparing powder compacts for the intrinsic dissolution studies. In publication I, the surface specific dissolution rates were studied from less-texturized and texturized acetylsalicylic acid (ASA), tolbutamide (TB), car-bamazepine (CBZ) and entacapone compacts. The degree of texture in the sam-ples was characterized with three different X-ray-based methods: (1) pole figure analysis, (2) crystal structure calculations, and (3) peak intensity comparison.
The trends in results from the different texture characterization methods used were shown to correspond well with each other (I, table 2). This observation confirmed the fact that no special X-ray goniometers are needed, since a very good indication of the texture can be obtained with normal Bragg-Brentano X-ray diffraction equipment. All the studied plate- or needle-like APIs, except CBZ, were found to texturize strongly during compression. Also, the ground powder samples were texturized, but the degree of preferred orientation was
Sample preparation
-crystallinity-preferred orientation-solid form changes
Hydrodynamics-flow/mixing
Dissolution medium-solvent-mediated
solid phase conversion-interactions between
additives and API
Intrinsicdissolution
Surface area-crystal growth

26
significantly lower. This was due to the decreasing particle size, which allowed more random orientation of particles in the compacts. The intrinsic dissolution rate of the samples compacted from ground powder was in all cases slightly higher than the dissolution rate of their more texturized counterparts. However, the only statistically significant difference in the intrinsic dissolution rates was shown in case of tolbutamide samples (figure 12).
Figure 12. The preferred orientation illustrated as pole figure profiles measured from the crystal plane (200) (sharp downward trend in profile corresponds to a high degree of texture in the sample) (left) and the intrinsic dissolution rates of the tolbutamide samples (right). Modified from publication I.
It is generally expected that the direction in which the crystals grow most intensively is also the direction in which the dissolution is the highest. Although this theory has been proved with single crystals (Watanabe et al., 1982; Danesh et al., 2001; Prasad et al., 2002), it was not supported with the compacted ma-terials. The most important source responsible for the ‘hidden’ effect of texture on dissolution was considered to be the grinding process. Grinding might both increase (more crystal strains) and decrease (less effective surface area) the dis-solution rate (Burt and Mitchell, 1980). Therefore, Tenho et al. (2007) conducted another study, in which all the samples had intact particle surfaces after crystal-lization. The findings were similar to this study, but the difference between the intrinsic dissolution rates of texturized and less-texturized samples was shown to be clearly higher. It should, however, be noted that those dissolution studies were performed with the channel flow cell device, which has different hydro-dynamic characters than the rotating disc apparatus used in the present study. To summarize, the preferred orientation of crystals during compact preparation can be considered as a possible source of error when performing intrinsic dis-solution experiments.
Preferred orientation Intrinsic dissolution

5 RESULTS AND DISCUSSION
27
5.3 In situ solid phase analysis during intrinsic dissolution testing
The intrinsic dissolution rate of drugs is usually directly proportional to ther-modynamic solubility (Nicklasson et al., 1981; Gu et al., 1987), but deviations from this general rule exist (Allen et al., 1978; Kahela et al., 1983; Laihanen et al., 1996). As shown in figure 11, there are several factors that may affect the intrinsic dissolution rate of APIs. In the search for cause, the traditional measure-ment of drug concentrations in the liquid phase can only show that there is a change between samples, but not what and/or why it has changed. Therefore, simultaneous measurements of the solid phase composition and the dissolved concentrations (figure 13) were applied in publications II, III and IV. These stud-ies, where Raman spectroscopy was used in situ to explain the problematic disso-lution behaviour of drugs that underwent solvent-mediated conversion during the tests, are discussed in this section.
Figure 13. Simultaneous measurement of the solid and liquid phases during intrinsic dissolu-tion testing.
5.3.1 Solid phase analysis using Raman spectroscopyRaman spectroscopes were interfaced with the channel flow cell (CFC) (II, III, IV) and rotating disc (RD) (II) devices to detect the hydrate formation during the dis-solution of theophylline (TP) (II, III), nitrofurantoin (NF) (II) and carbamazepine (CBZ) (IV) anhydrate forms (III, Fig.1). In each case, Raman was able to distinguish between the anhydrate and hydrate forms of the studied drugs. The in situ evaluation of the solid phase conversion was shown, however, to be much more challenging in the case of RD. Figure 14 shows the changes at the wavenumbers where clear spectral differences existed during the dissolution experiments. In the case of CFC, TP anhydrate (A) had distinct peaks at 1671 and 1714 cm-1 and TP monohydrate (M) had a characteristic peak at 1694 cm-1. In the RD, the phase change was quantified in the range of 1150–1200 cm-1 due to decreased signal-to-noise ratio at the high wavenumber end of the spectra. The intensity of the Raman signal was considered to be decreased as a result of light interactions while passing through the layers of water and glass between the sample and the probe. The channel flow cell equipment was modified with a quartz sight window for the Raman probe, which helped to obtain better quality spectra throughout the spectral range.
Solid
Liquid
Solid phasecomposition
Liquid phaseconcentration
+Combinedinformation

28
When dealing with spectroscopic data, a decision between univariate and multivariate quantification techniques has to be made. Multivariate methods are advised only in cases of very noisy and cross-correlated data. Since our data had, in each case, distinct anhydrate and hydrate peaks with sufficiently high signal-to-noise ratios, simple rationing of the test and reference peak intensities (II) or peak areas (III, IV) was utilized. Despite the interfering sources observed in RD, Raman spectroscopy was has been shown to be a powerful tool to detect the solid phase changes during dissolution in aqueous surroundings. Since Ra-man spectroscopy mainly detects symmetric vibrations of nonpolar and aromatic groups in the drug molecules, water has a weak Raman scatter signature. With regards to this, it is superior compared to other spectroscopic techniques, such as Near Infrared (NIR) spectroscopy, for which the spectra is dominated by vibra-tions associated with O-H bonds and is thereby influenced by the presence of water molecules. In the field of pharmaceutical applications, this unique char-acter of Raman spectroscopy has previously been utilized to detect solid state changes during e.g. wet-granulation (Jørgensen et al., 2002; Airaksinen et al., 2003; Wikström et al., 2005) and aqueous crystallization (Agarwal and Berglund, 2003; Ono et al., 2004; Caillet et al., 2006).
Figure 14. Characteristic peaks used in the quantification of TP (A) to TP (M) phase conversion during dissolution tests in RD (left) and CFC (right). Modified from publication III.
5.3.2 Connection between the solid phase composition and dissolution rate
Complex dissolution behaviour of drugs that are capable of hydrate formation has been an unsolved area in the pharmaceutical field. Previous studies have combined off-line solid phase analytics with in vitro dissolution, which, how-ever, are incapable of accurately quantifying the conversion kinetics (Kahela et al., 1983; Kaneniwa et al., 1987; Kobayashi et al., 2000; Tian et al., 2007). In this thesis, the in situ measured Raman data helped to explain the changes in dis-solution rates of TP (II, III), NF (II) and CBZ (IV) anhydrate forms. Results discussed here were all measured in simple aqueous media using the channel flow cell dissolution device.
0
10
20
30
1050 1100 1150 1200 1250
0
0.5
1
1.5
2
x 104
Raman shift (1/cm)Time (min)
Inte
nsity TP (M)
TP (A)
aRD
1550 1600 1650 1700 1750 1800 0
5
10
-1
0
1
2
3
4
Time (min)
Raman shift (1/cm)
Inte
nsity
bTP(M)
TP(A) TP(A)
CFC

5 RESULTS AND DISCUSSION
29
A nonlinear mixed effects model approach was utilized to distinguish the three stages of solvent-mediated conversion from the solid phase data (Cardew and Davey, 1985). Figure 15 demonstrates the effects of the increasing hydrate ratio on the intrinsic dissolution rate of the initially anhydrous TP (A) compacts (with the pre-transformation, transformation and steady state stages) (III). At the pre-transformation stage, the dissolution rate of TP (A) compact was higher than the dissolution rate of TP monohydrate (M). The dissolution rate of initially anhydrous compact was decreased as the amount of monohydrate form was increased. During the transformation, dissolution of both the forms and crystal-lization of the monohydrate occurred. Once the conversion was complete, the dissolution rate of the initially anhydrous surface became constant (linearized phase). At the steady state stage, TP (A) was no longer present and, therefore, only TP (M) dissolved. Transformation was seen in SEM figures as rapid needle-like growth of monohydrate crystals on the surfaces of the compacts (II, figure 3 and III, figure 6). This clear increase in the effective surface area was seen in the dissolution results; despite the fact that the Raman results indicated ~100% con-version, the dissolution rate of the initially anhydrous compact was still slightly higher than the dissolution rate of the TP (M) compacts.
Unlike with TP, the correlation between the solid phase transformation and changes in intrinsic dissolution rates were not evident with NF. Although the dissolution rate was changed several times during the test, there was no distinct decrease in the dissolution rate during the transformation stage (II, figure 5). Variation of the dissolution rate was likely caused by several overlapping fac-tors, e.g. the changing anhydrate/monohydrate ratio and the decreasing rate of hydrate formation.
Figure 15. Connection between hydrate formation (primary y-axis) and intrinsic dissolution rate (secondary y-axis) of TP anhydrate (left). More detailed description of dissolution behaviour during conversion is shown on the right. Modified from publication III.
Time (min)
0 5 10 15 20 25
Am
ount
of T
P m
onoh
ydra
te (%
)
0
20
40
60
80
100
0
2
4
6
8
Raman; predicted TP (M)Raman; measured TP (M) (n=4)UV; TP (A)UV; TP (M)
Steady state stageTransformation stage
Pre-transformationstage
Dis
solv
ed T
P (m
g cm
-2)
Theophylline
Dis
solv
ed T
P A
(mg
cm-2
)
0
2
4
6
8
Time (min)
0 5 10 15 20 25 30
Dis
solu
tion
rate
(mg
(cm
2m
in)-1
)
0,0
0,1
0,2
0,3
0,4
0,5
Prestage
Transfromationstage
Steady state stage
Start of linearized phase (13 min)
Dissolution of TP(A)

30
The poor water solubility and low dissolution rate of CBZ resulted in 20-fold and 200-fold slower rates of hydrate formation compared to NF and TP, respec-tively (IV). Like with TP, Raman data explained the dissolution behaviour of the CBZ forms extremely well. However, whereas the surfaces of TP and NF compacts were transformed completely to monohydrate form, Raman results indicated a 25% unconverted CBZ anhydrate (form III) portion at the steady state stage of conversion (IV, figure 5). Moreover, during the first few hours, the dissolu-tion rate of dihydrate compact in simple buffer media (SIF) was almost equal to the dissolution rate of the initially anhydrous compact (IV, Fig. 3). SEM figures showed several layers of needle-like growth on the surface of the compacts (IV, figure 4). This extensive crystal growth may have impeded the SIF contact with the solid CBZ form III, resulted in a decreased dissolution rate and, correspond-ingly, retarded the growth of further needles. These hypotheses agree well with other recent studies (Rodriquez-Hornedo and Murphy, 2004; Tian et al., 2006; Tian et al., 2007). Furthermore, the needle-like crystal growth also changed the effective surface area throughout the tests, and this may partly explain the dis-solution behaviour observed with CBZ and NF.
5.3.3 Effect of hydrodynamicsIn publication III, the effect of hydrodynamics on the solvent-mediated trans-formation kinetics of TP was tested with RD and CFC devices. Raman spectro-scopic measurement showed distinctly different timescales in transformation behaviour between the two devices. Modelling of the kinetics confirmed the fact that the transformation in the CFC clearly followed the first order kinetics, but the transformation kinetics in the RD was S-shaped. Figure 16 shows the conversion-rate profiles derived from these models. The extremely rapid onset of transformation in the CFC was connected to a three-fold higher intrinsic dis-solution rate during the pre-transformation stage. Thus, the higher dissolution rate promoted the attainment of supersaturation prior to the nucleation and growth. The dissolution dependence on the angular velocity showed, accord-ing to Levich’s theory (Levich, 1962), that the transport process in the RD could be accelerated by increasing the agitation speed. SEM figures confirmed the dependence of crystal growth rate on the dissolution device used (III, figure 6). This dependence on the hydrodynamic conditions show that the diffusion of the solute from the bulk solution to the crystal surface was the rate-limiting step, not the incorporation into a crystal lattice.
The hydrodynamics of a system is known to largely affect the diffusion con-trolled processes (Nyvlt et al., 1985; Myerson, 1993). Observed differences in transformation kinetics were, hence, related to dissimilar hydrodynamics and dif-fusion characteristics in the two set-ups, which were shown to control both the dissolution and crystallization processes. Direct comparison of the hydrodynam-ics provided by these two devices (e.g. by using dimensionless Reynolds numbers) was complicated by the diverse nature of the liquid flow characteristics. The RD provides radial and tangential motions of the liquid flow and a boundary diffu-sion layer is formed at the centre area (Grijseels et al., 1982), whereas the lami-

5 RESULTS AND DISCUSSION
31
nar liquid convection in the CFC device directed parallel to the solid surface prevents the formation of a uniform diffusion layer at the solid-liquid inter-face (Compton et al., 1993). Based on this study, no recommendations were given of whether an RD or CFC device is preferred for the intrinsic dissolution evaluation of metastable drugs, How-ever, it is obvious that the selection of the dissolution equipment and flow/agitation rate remarkably affects the transformation (in case of diffusion-controlled crystal growth), and the dissolution results gained.
5.3.4 Effect of additivesSurfactants are frequently used in the dissolution testing of poorly soluble drugs (USP XXXI, 2008). Surfactants can either promote or inhibit the crystal growth processes depending on their solubilizing capacity and interaction potential (Luhtala, 1992; Bujan et al., 2001; Rodriquez-Hornedo and Murphy, 2004). In IV, the effect of physiological surfactants, sodium taurocholate (STC) and lecithin, was evaluated on solvent-mediated transformation behaviour of CBZ.
Dissolution of CBZ form III was clearly promoted by increased wetting and solubilization by the STC-lecithin micellar aggregates (IV, table 1). Raman spec-troscopic analysis of the solid phase data showed, however, that the maximum rate of transformation was almost equal in the presence and absence of STC and lecithin. The results from both Raman and off-line XRPD measurements indicated approximately one-half CBZ form III unconverted portion after 19 hours of dissolution (steady state stage). The X-ray peak intensity comparison also revealed a significant preferred orientation effect (figure 17); based on the solved crystal structure of CBZ dihydrate, the most texturized plane in SIF (a medium without surfactants) was plane (020) (corresponding to peak at 12.3° (2θ)). In FaSSIF, however, the plane (-111) was the most preferred one (corre-sponding to the peak at 19.5° (2θ)). This clear indication of different CBZ dihy-drate crystal habits among the two media was confirmed by SEM-micrographs, which showed needle-like crystal habits in SIF, but in FaSSIF principally plate-like shaped clusters were found (figure 17). These results are in line with other re-cent studies (Rodriquez-Hornedo and Murphy, 2004; Sinclair, 2000) and indicate the fact that intermolecular interactions (e.g. hydrogen bonds, electrostatic at-tractions) between the surfactant additives (e.g. STC) and the preferred crystal plane (-111) were formed. This hypothesis was further tested by docking simula-tions. A great number of low energy conformations were observed that enabled the generation of CBZ-STC structures via several hydrogen bonds (distance 2Å). Strong H-bonding may have 1) impeded the medium contact with the CBZ and slowed down the dissolution, 2) changed the growing habit, and 3) limited the
Time (min)
0 5 10 15 20 25
Rat
e of
con
vers
ion
(%/m
in)
0
10
20
30
40
CFCRD
2%/min
Tsteady state Tsteady stateTinduction
Tsl
Tsl
Max.rate
Max.rate Conversion-rate profiles
Figure 16. Anhydrate to monohydrate conversion-rate profiles of theophylline in rotating disc (RD) and channel flow cell (CFC) devices. Modified from publication III.

32
conversion rate to a constant level. Depending on the type of surfactant used in the dissolution medium and the drug substance studied, surfactant micelles may also promote the crystallization of the stable solid form by acting as templates for nucleation and growth (Weissbuch et al., 1991; Canselier, 1993). Therefore, in order to be able to relate the in vitro dissolution results of metastable solids to their in vivo behaviour, it is essential that the studies are initiated in a physi-ologically relevant medium.
figure 17. X-ray diffractograms of CBZ compacts before and after dissolution tests (peaks indicating preferred orientation are circled) (left) and SEM figures taken during CBZ dissolu-tion in SIF (needle-like habit) (a-c) and FaSSIF (plate-like habit) (d-f) (right). Modified from publication IV.
5.3.5 Uncertainties related to in situ Raman measurements There are few challenges related to the measuring configuration of Raman (when used in situ during intrinsic dissolution testing), which need to be re-solved in future to achieve even more accurate quantitative results. The acces-sible depth of Raman measurement varies from a few hundred micrometers (semitransparent materials like tissue) to one millimetre (pharmaceutical tab-lets) (Matousek, 2007). This implies that, in our studies, Raman was not able to measure only the outermost layers where dissolution, nucleation and growth oc-curred. This may partly explain the detected unconverted portions of CBZ form III in IV. The depth of Raman measurement has not, however, been a greatly discussed issue, and more detailed investigations should be performed in the fu-ture. Surface-sensitive methods could help to avoid this problem. Another chal-lenging issue is related to the fact that the focus of the Raman measurement was influenced to some extent by thick dihydrate crystal growth on the surfaces of the compacts. Moreover, future studies should also concentrate on increasing the effective sample volume, for example by using optics that can be focused to a much larger area. Raman microscopy could, on the other hand, help to visual-ize the situation in situ, whether or not the spot is focused on the site where the growth is occurring.
Position [°2Theta]5 10 15 20 25 30
Counts
05000
10000
05000
10000
0
5000
10000
05000
10000
d) CBZ Form III after dissolution in FaSSIF
c) CBZ Form III after dissolution in SIF
b) dry CBZ Dihydrate
a) dry CBZ Form III
** *
* * *
*
*
100 µm
100 µm
a) t = 0 h
d) t = 0 h
b) t = 4 h c) t = 14 h
f) t = 6 he) t = 2 h

5 RESULTS AND DISCUSSION
33
5.4 In vitro media for simulating dissolution in vivo
5.4.1 Evaluation of in vivo prognostic dissolution mediaBiorelevant media simulating the fasted and fed states in the small intestine have lately been developed to increase the in vivo predictability of in vitro dis-solution tests (Galia et al., 1998; Sunesen et al., 2005b; Wei and Löbenberg, 2006; Lue et al., 2008; Jantratid et al., 2008). Most well-known of these media are perhaps FaSSIF and FeSSIF, which contain biologically relevant amounts of physi-ological amphiphiles, bile salts and lecithin. The cost and complexity of these me-dia, however, limit their extensive use for industrial applications. In V, dissolution enhancement of three BCS class II drug formulations (Danol®, Spiridon® and N74 capsule (compound under phase I development)), was compared between FaSSIF and various concentrations of conventional surfactants (SLS and Tween 80).
The studied dissolution media were shown to deviate quite largely in their physicochemical properties. Surface tensions, indicating the wetting ability of the drug surfaces, ranged between ~34-46 mN/m, surface tension of SLS being the closest to that prevailing in human intestinal fluids (~34 mN/m (Pedersen et al., 2000)). The micelle size of sodium taurocholate (STC)-lecithin mixed micelles was 5-fold and 18-fold larger than the micelle size obtained for Tween 80 and SLS, respectively. The diffusivity of micelles, which affects the overall dissolu-tion rate, decreased in the order SLS > Tween >> STC-lecithin. For danazol, a 0.07% Tween 80 gave equal dissolution efficiency (DE%) with FaSSIF, whereas for less hydrophobic N74, 0.07% Tween 80 and 0.1% SLS were the closest, but still over-estimated the DE% in FaSSIF. The least hydrophobic drug, spironolac-tone, showed almost no affinity to the surfactant micelles, and, thus, no dissolu-tion enhancement in any of the studied media. The level of dissolution enhance-ment was clearly related to the magnitude of solubilization by the surfactant micelles, driven by the hydrophobicity of the drug (V, figure 2a-c and table 1). This agrees well with previous studies which have shown correlation between the increasing octanol-water partition coefficient (logP) and the increasing af-finity to bile salt micelles (Mithani et al., 1996; Wiedman et al., 2002). Moreo-ver, the results indicated differences in the payload of drug molecules between the SLS, Tween 80 and STC-lecithin micelles (Crison et al., 1996). The fact that very different combinations of properties between the media were shown to produce similar dissolution enhancement levels in FaSSIF and drug-specific con-centrations of SLS or Tween 80 underlines the importance of the evaluation of surfactant-facilitated dissolution as a whole. Although it is obvious due to the specificity of the drug-surfactant interactions that the in vivo prognostic amounts of synthetic surfactants have to be adjusted drug-specifically, this study shows the great potential of substituting FaSSIF with simple and cost-effective conventional surfactant media.
5.4.2 Prediction of absorption The field of computer simulations with physiologically based pharmacokinetic absorption models has been covered in several articles (Plusquellac et al., 1999;

34
Norris et al., 2000; Yokoe et al., 2003). The compartmental absorption and transit model (CAT) predicts the Fa of drugs on the basis of GI tract physiology, in vitro dissolution data and physicochemical drug-related parameters (e.g. solubility, permeability) (Yu et al., 1996). In the CAT model, absorption and transit proc-esses are described with nine compartments (stomach, colon and small intestine as seven compartments) (Yu and Amidon 1999). In V, an advanced CAT model (Agoram et al., 2001), in which basic pharmacokinetic parameters describing drug distribution and elimination were integrated into the model, was used to predict plasma concentration-time profile of N74 (chapter 4.5, figure 10). Pharmacokinetics of N74 was studied with dogs and thus, also the physiological part of the model was adapted to correspond to canine GI tract conditions. The dissolution rate constants calculated from the in vitro dissolution data described in chapter 5.4.1 were used as input parameters in the simulations.
The simulations indicated that 0.1% SLS was the best predictor to the in vivo pharmacokinetic parameters, Cmax and AUC (figure 18, V table 5). The fact that FaSSIF, which is designed on the basis of human GI fluids, gave lower Cmax and AUC than observed in vivo could be related to the physiological differences be-tween the human and canine GI tract. For example, dogs reportedly have higher small intestinal bile salt levels, which, due to the increased solubilization capac-ity, may lead to higher amounts absorbed (Carlsson et al., 2002). Based on these results, it is obvious that the typical amounts of conventional surfactants in dis-solution testing monographs (from 0.5% up to 2.0% (w/v) (USP XXXI, 2008)) grossly overestimate the solubility from the in vivo point of view.
Figure 18. Observed versus simulated plasma profiles of N74. Modified from publication V.
Overall,pharmacokinetic simulations always include some uncertainties. In this study, the slight inaccuracy in prediction of Tmax was probably related to
Time (h)
0 2 4 6 8 10
Con
cent
ratio
n of
N74
(ng/
ml)
0
20
40
60
80
100
120
Buffer (Kd 0.39)FaSSIF (Kd 0.85)0.1% SLS (Kd 1.13)0.2% SLS (Kd 1.50)0.07% Tween (Kd 0.60)Simulated in vivo (Kd 0.96)Observed in vivo
CAT-simulations of N74

5 RESULTS AND DISCUSSION
35
the high variation between dogs, which complicated the definition of repre-sentative pharmacokinetic parameters (absorption, distribution, elimination) for the simulation model. Also the use of non-sink (> 30% of saturation solubil-ity) in vitro dissolution data may have added some uncertainty to the simulation model. However, these simulations, which consider the input phase as a result of processes taking place in various compartments, can generally be considered to give a much more precise estimation of the input profile than the traditional convolution approach (Yu and Amidon, 1998). Due to increasing interest in ex-ploitation of canine data for construction of simulation models, future efforts should be directed towards transforming the nine-compartment CAT-model to better correspond to the GI physiology in dogs.

36

6 CONCLUSIONS
37
6 conclusions
The main conclusions of this thesis are:
1. Quantitative solid phase analysis can be performed during intrinsic dissolution testing of APIs using Raman spectroscopy in situ. Simultaneous analysis of liquid and solid phases enables science-based explanation(s) for changes in the dissolution rate, e.g. due to hydrate formation. This information will serve the pharmaceutical industry in drug candidate selection as well as in explaining and controlling the behaviour of APIs in the final drug products.
2. Careful selection of the dissolution equipment and flow/agitation rate is crucial for intrinsic dissolution testing of APIs, as hydrodynamics was shown to remarkably affect the solvent-mediated transformations, and, thereby, the dissolution results gained.
3. The preferred orientation of drug crystals, which may occur during the preparation of powder compacts for intrinsic dissolution studies, has only a minor effect on the interpretation of dissolved concentrations.
4. Physiological amphiphiles, as bile salts in a biorelevant dissolution medium, FaSSIF, may interact with dissolving APIs via hydrogen bonding and change the solvent-mediated crystallization behaviour. Therefore, in order to be able to relate the in vitro dissolution results of metastable solids to their in vivo behaviour, it is essential that the studies are initiated in a physiologically relevant medium.
5. To predict in vivo behaviour of BCS class II drugs, simple and cost-effective conventional surfactant media were shown to be potential substitutes for the more complex, physiologically based FaSSIF. The use of biorelevant amounts of conventional surfactants in dissolution media will not only be economic during the various steps of drug development, but could also place the quality control dissolution tests into a more meaningful context.

38

7 REFERENCES
39
7 references
Aaltonen, J., Kogermann, K., Strachan, C.J., Rantanen, J. 2007. In-line monitoring of solid-state
transitions during fluidisation, Chemical Engineering Science, 62, 408–415.
Abraham, M.H., Ibrahim, A., Zissimos, A.M., Zhao, Y.H., Comer, J., Reynolds, D.P. 2002. Applica-
tion of hydrogen bonding calculations in property based drug design. Drug Discovery
Today. 7: 1056-1063.
Abrahamsson, B., and Lennernäs, H., 2004. Application of the biopharmaceutic classification
system now and in future in Drug Availability. Estimation of solubility, permeability,
absorption and bioavailability, van Waterbeemb, H., Lennernäs, H., and Artursson, P.,
Editors. Wiley-VCH verlag GmbH&Co.KGaA; Weinheim, Germany.
Agarwal, P. and Berglund, K.A. 2003. In situ monitoring of calcium carbonate polymorphs
during batch crystallization in the presence of polymeric additives using Raman spec-
troscopy. Cryst. Growth Des. 3, 941–946.
Agoram, B., Woltosz, W.S., Bolger, M.B. 2001. Predicting the impact of physiological and bio-
chemical processes on oral bioavailability, Advanced Drug Delivery Reviews, 50, 41–76.
Airaksinen, S., Luukkonen P., Jørgensen, A., Karjalainen, M., Rantanen, J., Yliruusi, J. 2003. Ef-
fect of excipients of hydrate formation in wet masses containing theophylline. Journal
of Pharmaceutical Sciences, 92, 516–528.
Airaksinen, S., Karjalainen, M., Kivikero, N., Westermarck, S., Shevchenko, A., Rantanen, J.,
Yliruusi, J. 2005. Excipient selection can significantly affect solid-state phase transforma-
tion in formulation during wet granulation, AAPS PharmSciTech, 6, 311–322.
Allen, P.V., Rahn, P.D., Sarapu, A.C., Vanderwielen, A.J. 1978. Physical characterization of
erythromycin: anhydrate, monohydrate, and dehydrate crystalline solids. Journal of
Pharmaceutical Sciences, 67, 1087.
Alvarez-Núñez, F.A. and Yalkowsky, S.H. 2002. Relationship between polysorbate 80 solubiliza-
tion descriptors and octanol-water partition coefficients of drugs. International Journal
of Pharmaceutics, 10, 217-222.
Amidon, G.L., Lennernäs, H., Shah, V.P., Crison, J.R., 1995. A theoretical basis for a biopharma-
ceutic drug classification: the correlation of in vitro drug product dissolution and in vivo
bioavailability. Pharmaceutical Research, 3, 413–419.
Armand, M., Borel, P., Pasquier, B., Dubois, M., Senft, M., Andre, M., Peyrot, J., Salducci, J.,
Lairon, D. 1996. Physicochemical characteristics of emulsions during fat digestion in hu-
man stomach and duodenum. American Journal of Physiology, 271, 172-183.
Barnes, R.J., Dhanoa, M.S., Lister, S.J., 1989. Standard Normal Variate Transformation and de-
trending of near-infrared diffuse reflectance spectra. Applied Spectroscopy, 43, 772–777.
Bernstein, J., Introduction and historical background, in Polymorphism in Molecular Crystals.
2002, Clarendon Press: Oxford. p. 1–28.
Blume, H.H., Schug, B.S. 1999. The biopharmaceutics classification system (BCS): Class III drugs
– better candidates for BA/BE waiver? European Journal of Pharmaceutical Sciences, 9,
117–121.
Bonlokke, L., Hovgaard, L., Kristensen, H.G., Knutson, L., Lennernäs, H., 2001. Direct estima-
tion of in vivo dissolution of spironolactone in two particle size ranges using the single

40
pass perfusion technique (Loc-I-Gut) in humans. European Journal of Pharmaceutical
Sciences, 12, 239–250.
Brittain, H.G. and Grant J.W., Effects of polymorphism and solid-state salvation on solubil-
ity and dissolution rate in Polymorphism in Pharmaceutical Solids, H.G. Brittain, Edi-
tor.1999, Marcel Dekker, Inc.: New York. p. 278–330.
Brittain, H.G. and Byrn, S.R., Structural aspects of polymorphism in Polymorphism in Pharma-
ceutical Solids, H.G. Brittain, Editor.1999, Marcel Dekker, Inc.: New York. p. 278–330.
Bujan, M., Sikiric, M., Filipovic-Vincekovic, N., Vdovic, N., Garti, N., Füredi-Milhofer, H. 2001. Ef-
fect of anionic surfactants on crystal growth of calcium hydrogen phosphate dehydrate.
Langmuir, 17, 6461–6470.
Burger, A. and Ramberger, R. 1979. On the polymorphism of pharmaceuticals and other mo-
lecular crystals I. Theory and thermodynamic rules. Microchimica Acta, II, 259–271.
Burt, H.M., and Mitchell, A.G., 1981. Crystal defects and dissolution. International Journal of
Pharmaceutics, 9, 137–152.
Byrn, S.R., Pfeiffer, R.R., Ganey, M., Hoiberg, C., Poochikian, G. 1995. Pharmaceutical solids: a
strategic approach to regulatory considerations. Pharmaceutical Research, 12, 945–954.
Byrn, S.R., Pfeiffer, R.R., and Stowell, J.G., Hydrates and Solvates, in Solid-State Chemistry of
Drugs. 1999, SSCI Inc.: West Lafayette. p. 143–231.
Byrn, S.R., Xu, W., and Newman, A.W. 2001. Chemical reactivity in solid-state pharmaceuticals:
formulation implications. Advanced Drug Delivery Reviews, 48, 115–136.
Caillet A., Puel, F., Fevotte G. 2006. In-line monitoring of partial and overall solid concentra-
tion during solvent-mediated phase transition using Raman spectroscopy. International
Journal of Pharmaceutics, 307, 201–208.
Canselier, J.P. 1993. The effects of surfactants on crystallization phenomena, Journal of Disper-
sion Science and Technology, 14, 625-644.
Cardew, P.T., and Davey, R.J. 1985. The kinetics of solvent-mediated phase transformations.
Proceedings of the Royal Society of London. Series A, Mathematical and Physical Sci-
ences, 398, 415-428.
Carey, M.C., and Small, D.M. 1972. Micelle formation by bile salts. Physical-chemical and ther-
modynamic considerations. Archives of Internal Medicines, 130, 506–527.
Carlsson, A.S., Kostewicz, E.S., Hanisch, G., Krumkuhler, K., Nilsson, R.G., Loefgren, L., Ab-
rahamsson, B. 2002. Is the dog a suitable model for bioavailability studies of poorly
soluble drugs? AAPS Annual Meeting and Exposition. Toronto, Canada.
Charman, W.N., Porter, C.J.H., Mithani, S., Dressman, J.B., 1997. Physico-chemical and physi-
ological mechanisms for the effects of food on drug absorption: The role of lipids and
pH, Journal of Pharmaceutical Sciences, 86, 269–282.
Chemburkar, S.R., Bauer, J., Deming, K., Spiwek H., Patel, K., Morris, J., Henry, R., Spanton,
S., Dziki, W., Porter, W., Quick, J., Bauer, P., Donabauer, J., Narayanan, B.A., Soldani,
M., Riley, D., McFarland K., 2000. Dealing with the impact of ritonavir polymorphs on
the late stages of bulk drug process development, Journal of Organic Process Research
Development, 4, 413–417.
Chen, L.R., Wesley, J.A., Shobna, B., Bienvenido, R., Korey, B., Suresh, R.B. 2003. Dissolution
behaviour of a poorly water soluble aompound in the presence of Tween. Pharmaceuti-
cal Research, 20, 292-301.

7 REFERENCES
41
Compton, R.C., Harding, M.S., Pluck, M.R. 1993. Mechanism of solid/liquid interfacial reactions.
Journal of Physical Chemistry, 97, 10416-10420.
Connors, R.D. and Elder, E.J. 2004. Solubilization Solutions in Drug Delivery Technology maga-
zine, 4 (8).
Crison, J.R., Shah, V.P., Skelly, J.P:, Amidon, G.L. 1996. Drug diffusion into micellar solutions:
development of a connective diffusion model and comparison to the film equilibrium
model with application to surfactant-facilitated dissolution of carbamazepine. Journal
of Pharmaceutical Sciences, 85, 1005-1011.
Cullity, B.D., 1978, Elements of X-ray Diffraction, (Addison-Wesley, Reading).
Danesh A., Connell S.D., Davies M.C., Roberts C.J., Trendler S.J.B., Williams P.M., Wilkins M.J.
2001. An in situ dissolution study of aspirin crystal planes (100) and (001) by atomic force
microscopy. Pharmaceutical Research, 18, 299–303.
Davey, R.J., Cardew, P.T., McEvan, D., Sadler, D.E. 1986. Rate controlling processes in solvent-
mediated phase transformations. Journal of Crystal Growth, 79, 648-653.
Davey, R.J., Bladgen, N., Righini, S., Alison, H., Ferrari, E.S. 2002. Nucleation control in solution
mediated polymorphic phase transformations: The case of 2, 6-dihydroxybenzoic acid,
Journal of Physical Chemistry B, 106, 1954–1959.
Davidian, M. and Giltinan, D.M. 1995. Nonlinear Models for Repeated Measurement Data.
New York: Chapman & Hall.
Davis, S.S., Hardy, J.G., Fara, J.W., 1986. Transit of pharmaceutical dosage forms through the
small intestine, Gut, 27, 886–892.
Dillard, R.L., Eastman, H., Fodtran, J.S. 1965. Volume-flow relationship during the transport of
fluid through the human small intestine. Gastroenterology, 49, 58–66.
DiMasi, J.A., Hansen, R.W., Grabowski, H.G. 2003. The price of innovation: new estimates of
drug development costs. Journal of Health Economics, 22, 151–185.
De Smidt, J.H., Fokkens, J.G., Grijseels, H., Crommelin D.J.A. 1986. Dissolution of theophylline
monohydrate and anhydrous theophylline in buffer solutions. Journal of Pharmaceuti-
cal Sciences, 75, 497.
Dressman, J.B., Berardi, R.R., Dermentzoglou, L.C., Russel, T.L., Schmaltz, S.P., Barnet, J.L., Jär-
venpää, K., 1990. Upper gastrointestinal pH in young men and women, Pharmaceutical
Research, 7, 756–761.
Dressman, J.B., Amidon G.L., Reppas C., Shah V.P. 1998. Dissolution testing as a prognostic tool
for oral drug absorption: Immediate release dosage forms. Pharmaceutical Research.
15:11–22.
Dressman, J.B., and Reppas, C., 2000. In vitro–in vivo correlations for lipophilic, poorly water-
soluble drugs. European Journal of Pharmaceutical Sciences, 11, 73–80.
Dressman J.B. and Krämer J. Pharmaceutical Dissolution Testing. 2005, Taylor and Francis
group, LLC.: Boca Raton.
Dressman , J.B., Vertzoni, M., Goumas, K., Reppas, C., 2007. Estimating drug solubility in the
gastrointestinal tract. Advanced Drug Delivery Reviews, 59, 591–602.
Efentakis, M., and Dressman, J.B., 1998. Gastric juice as dissolution medium: Surface tension
and pH, European Journal of Drug Metabolism and Pharmacokinetics, 23, 97–102.
The European Agency for the Evaluation of Medicinal Products EMEA, 2000. Note for Guid-
ance on quality of modified-release products: A: Oral dosage forms, B: Transdermal
dosage forms section I Quality. Committee for Proprietary Medicinal Products (CPMP).

42
The European Agency for the Evaluation of Medicinal Products EMEA, 2002. Note for guidance
on the investigation of bioavailability and bioequivalence. Committee for Proprietary
Medicinal Products (CPMP).
Fabbiani, F.P.A., and Pulman, C.R., 2006. High-pressure studies of pharmaceutical compounds
and energetic materials. Chemical Society Reviews, 35, 932–942.
Food and Drug Administration FDA, 1997a. Guidance for Industry; Dissolution Testing of Im-
mediate Release Solid Oral Dosage Forms, Center for Drug Evaluation and Research
(CDER), Rockville.
Food and Drug Administration FDA, 1997b. Extended release oral dosage forms: development,
evaluation and application of in vitro/in vivo correlations, Center for Drug Evaluation
and Research (CDER), Rockville.
Food and Drug Administration FDA, 2000. Guidance for Industry; Waiver of in vivo bioavail-
ability and bioequivalence studies for immediate-release solid oral dosage forms based
on a Biopharmaceutics Classification System, Center for Drug Evaluation and Research,
(CDER), Rockville.
Food and Drug Administration FDA, 2004a. Guidance for Industry: Pharmaceutical CGMPs for
the 21st Century – A Risk-Based Approach, Center for Drug Evaluation and Research
(CDER), Rockville.
Food and Drug Administration FDA, 2004b. Guidance for Industry: PAT – A Framework for In-
novative Pharmaceutical Development, Manufacturing, and Quality Assurance, Center
for Drug Evaluation and Research (CDER), Rockville.
Food and Drug Administration FDA, 2007. Guidance for Industry; ANDAs: Pharmaceutical Solid
Polymorphism, Center for Drug Evaluation and Research (CDER), Rockville.
Furedi-Milhofer, H., Sikiric, M., Tunik, L., Filipovic-Vincekovic, N., Garti, N. 2002. Interactions
of organic additives with ionic crystal hydrates: the importance of the hydrated layer.
International Journal of Modern Physics B, 16, 359-366.
Galia, E., Nicolaides, E., Hörter, D., Löbenberg, R., Reppas, C., Dressman, J.B., 1998. Evaluation
of various dissolution media for predicting in vivo performance of class I and class II
drugs. Pharmaceutical Research, 15, 698–705.
Gardiner, B.N., and Small, D.M., 1976. Simultaneous measurement of pancreatic and biliary
response to CCK and secretin. Gastroenterology, 70, 403–407.
Garnier, S., Petit, S., Coquerel, G. 2002. Influence of supersaturation and structurally related
additives on the crystal growth of alpha-lactose monohydrate, Journal of Crystal
Growth, 234, 201–219.
Garti, N., Wellner, E., Sarig, S. 1982. Effect of surfactants on crystal-structure modification of
stearic-acid, Journal of Crystal Growth, 57, 577–584.
Garti, N. and Zour, H. 1997. The effect of surfactants on the crystallization and polymorphic
transformation of glutamic acid, Journal of Crystal Growth, 172, 486–498.
Gibson, M., Steele, G., Ungell, A.-L., Abrahamsson, B. in Pharmaceutical Preformulation and
Formulation, M. Gison, Editor. 2000, CRC press LLC: Boca Raton, Florida.
Gillon, A.L., Feeder, N., Davey, R.J., Storey, R. 2003. Hydration in molecular crystals – a Cam-
bridge Structural Database Analysis. Crystal Growth and Design, 3, 663-573.
Giron, D. 1995. Thermal analysis and calorimetric methods in the characterization of poly-
morphs and solvates. Thermochimica Acta, 248, 1–59.

7 REFERENCES
43
Grant, D.J.W., and York, P., 1986. Entropy of processing: a new quantity for comparing the
solid state disorder of pharmaceutical materials. International Journal of Pharmaceu-
tics, 30, 161–180.
Grant, D.J.W. Theory and origin of polymorphism in Polymorphism in Pharmaceutical Solids,
H.G.Brittain, Editor.1999, Marcel Dekker, Inc.: New York. p. 278–330.
Gray, V.A., and Dressman, J.B., 1996. Change of pH requirements for simulated intestinal fluids
TS, Pharmacopoeial Forum, 22, 1943–1945.
Griesser, U.J., The importance of solvates in Polymorphism in the Pharmaceutical Industry, R.
Hilfiker, Editor. 2006, Wiley-VCH Verlag GmbH.: Weinheim. p. 211–234.
Grijseels, H., Crommelin, D.J.A., de Blaey, C.J., 1981. Hydrodynamic approach to dissolution
rate. Pharmaceutical Weekbladet, 3, 1005–1020.
Grijseels, H., van Bloois, L., Crommelin, D.J.A., de Blaey, C.J., 1983. Dissolution at porous inter-
faces II. A study of pore effects through rotating disc experiments.
Gruber, P., Rubinstein, A., Li, V.H., Bass, P., Robinson, J.R., 1987. Gastric emptying of nondigest-
ible solids in the fasted dog, Journal of Pharmaceutical Sciences, 76, 117–122.
Gu, L., Huynh, O., Becker, A., Peters, S., Nguyen, H., Chu, N. 1987. Preformulation selection of
a proper salt for a weak acid-base (RS-82856) – a new positive inotropic agent. Drug
Development and Industrial Pharmacy, 13, 437–448.
Haleblian, J. and McCrone, W. 1969. Pharmaceutical applications of polymorphism. Journal of
Pharmaceutical Sciences, 58, 911–929.
Hancock, B.C. and Zografi, G. 1997. Characteristics and significance of the amorphous state in
pharmaceutical systems. Journal of Pharmaceutical Sciences, 86, 1–12.
Hancock, B.C. and Parks, M. 2000. What is the true solubility advantage for amorphous phar-
maceuticals?, Pharmaceutical Research, 17, 397-404.
Hendriksen, B.A., Grant, D.J.W, Meenan, P., Green, D.A. 1998. Crystallization of paracetamol
(acetaminophen) in the presence of structurally related substances, Journal of Crystal
Growth, 183, 629-640.
Huang, L.-F., Tong, W.-Q. 2004. Impact of solids state properties on developability assessment
of drug candidates. Advanced Drug Delivery Reviews, 56, 321–334.
International Conference of Harmonisation ICH, Q6A, 1999. Test Procedures and Acceptance
Criteria for New Drug Substances and New Drug Products: Chemical Substances.
International Conference of Harmonisation ICH, Q8, 2005a. Pharmaceutical Development.
International Conference of Harmonisation ICH, Q9, 2005b. Quality Risk Management.
Jantratid, E., Janssen, N., Chokshi, H., Tang, K., Dressman, J.B., 2008. Designing biorelevant
dissolution tests for lipid formulations: case example- lipid suspension of RZ-50.
Jørgensen, A.C., Rantanen, J., Karjalainen, M., Khriachtchev, L., Räsänen, E., Yliruusi, J. 2002.
Hydrate formation during wet granulation studied by spectroscopic methods and mul-
tivariate analysis. Pharmaceutical Research, 19, 1285–1291.
Jørgensen, A.C., Airaksinen, S., Karjalainen, M., Luukkonen, P., Rantanen, J., Yliruusi, 2004.
Role of excipients in hydrate formation kinetics of theophylline in wet masses studied
by near-infrared spectroscopy, European Journal of Pharmaceutical Sciences, 23, 99–104.
Kahela, P., Aaltonen, R., Lewing, E., Anttila, M., Kristoffersson, E. 1983. Pharmacokinetics and
dissolution of two crystalline forms of carbamazepine, International Journal of Pharma-
ceutics, 14, 103–112.

44
Kalantzi, L., Persson, E., Polentarutti, B., Abrahamsson, B., Goumas, K., Dressman, J.B., Reppas,
C., 2006a. Canine intestinal contents vs. simulated media for the assessment of solubility
of two weak bases in the human small intestinal contents. Pharmaceutical Research, 23,
1373–1381.
Kalantzi, L., Goumas, K., Kalioras, V., Abrahamsson, B., Dressman, J., Reppas, C., 2006b. Char-
acterization of the human upper gastrointestinal contents under conditions simulating
bioavailability/bioequivalence studies. Pharmaceutical Research, 23, 165–176.
Kaneniwa, N., Ichikawa, J.I., Yamaguchi, T., Hayashi, K., Watari, N., Sumi, M. 1987. Dissolution
behaviour of carbamazepine polymorphs. Yakugaku Zasshi (J Pharm Soc Japan), 107,
808–813.
Kellow, J.E., Borody, T.J., Philips, S.F., Tucker, R.L., Haddad, A.C.1986. Human interdigestive
motility: variations in patterns from esophagus to colon Gastroenterology, 91, 386–395.
Khan, C.S., Rhodes, C.T. 1975. The concept of dissolution efficiency. Journal of Pharmacy and
Pharmacology, 27, 48–49.
Khankari, R.K. and Grant, D.J.W. 1995. Theophylline monohydrate. Thermochimica Acta, 248,
61.
Klein, S., Wunderlich, M., Dressman, J.B., Stippler, E., Development of dissolution tests on the
basis of gastrointestinal physiology in Pharmaceutical Dissolution Testing, J.B. Dress-
man and J. Krämer, Editors. 2005, Taylor and Francis Group, LLC: Boca Raton, Florida.
p. 193–227.
Kobayashi, Y., Shusei, I., Shigeru, I., Yamamoto, K. 2000. Physicochemical properties and
bioavailability of carbamazepine polymorphs and dihydrate. International Journal of
Pharmaceutics, 193, 137–146.
Kocks, U.F., Tomé, C.N., Wenk, H.-R. 2000. Texture and anisotropy. Cambridge University Press.
Kortejärvi, H., Urtti, A., Yliperttula, M. 2007. Pharmacokinetic simulation of biowaiver crite-
ria: The effects of gastric emptying, dissolution, absorption and elimination rates, 30,
155–166.
Kossena, G.A., Boyd, B.J., Porter, C.J., Charman, W.N., 2003. Separation and characterization
of the colloidal phases produced on digestion of common formulation lipids and assess-
ment of their impact on the apparent solubility of selected poorly water-soluble drugs,
Journal of Pharmaceutical Sciences, 92, 634–548.
Kostewicz, E.S., Carlsson, A.S., Hanisch, G., Krumkühler, K., Nilsson, R.G., Löfgren, L., Abra-
hamsson, B., 2002. Comparison of dog and human intestinal fluids and its impact on
solubility estimations. European Journal of Pharmaceutical Sciences, 17, ????
Laihanen, N., Muttonen, E., Laaksonen, M. 1996. Solubility and intrinsic dissolution rate of
alprazolam crystal modifications. Pharmaceutical Development and Technology, 1,
373–380.
Lennernäs, H., and Abrahamsson, P., 2005. The use of biopharmaceutic classification of drugs
in drug discovery and development: current status and future extensions. Journal of
Pharmacy and Pharmacology, 57, 273–285.
Lennernäs, H., Abrahamsson, B., Persson, E.M., Knutson, L., 2007. Oral drug absorption and the
Biopharmaceutics Classification System, Journal of Drug Delivery Science and Technol-
ogy, 17, 237–244.
Levich, V.G., 1962. Physicochemical hydrodynamics. Prentice Hall NJ. p. 1–184.

7 REFERENCES
45
Li, P. and Zhao, L. 2003. Solubilization of flurbiprofen in pH-surfactant solutions. Journal of
Pharmaceutical Sciences, 92, 951-956.
Lindahl, A., Ungell, A.L., Knutson, L., Lennernäs, H., 1997. Characterization of fluids from
the stomach and proximal jejunum in men and women. Pharmaceutical Research, 14,
497–502.
Lipinsky, C.A., 2000. Drug-like properties and the causes of poor solubility and poor perme-
ability. Journal of Pharmacological and Toxicological Methods, 44, 235–249.
Lue B.-M., Nielsen, F.S., Magnussen, T., Schou, H.M., Kristensen, K., Jacobsen, L.O., Müllertz, A.
2008. Using biorelevant dissolution to obtain IVIVC of solid dosage forms containing a
poorly soluble model compound, European Jouranl of Pharmaceutics and Biopharma-
ceutics, 69, 648-657.
Luhtala, S. 1992. Effect of sodium lauryl sulphate and polysorbate 80 on crystal growth of
carbamazepine, Acta Pharmaceutica Nordica, 4, 85–90.
Macheras, P., Reppas, C., Dressman, J.B., Biopharmaceutics of Orally Administered Dosage
Forms in Series in Pharmaceutical Technology, 1995. Ellis Horwood Ltd.; Chichester, UK.
Mansbach, M.C., Cohen, R.S., Leff, P.B., 1975. Isolation and properties of the mixed lipid
micelles present in intestinal content during fat digestion in man. Journal of Clinical
Investigation, 56, 781–791.
Matousek, P. 2007. Deep non-invasive Raman spectroscopy of living tissue and powders.
Chemical Society Reviews, 36, 1292–1304.
Meyer, M.C., Straughn, A.B., Jarvi, E.J., Wood, G.C., Pelsor, F.R., Shah, V.P. 1992. The bioineq-
uivalence of carbamazepine tablets with a history of clinical failures, Pharmaceutical
Research, 9, 1612–1616.
Mithani, S.D., Bakatselou, C.N., TenHoor, C.N., Dressman, J.B., 1996. Prediction of increase in
solubility of drugs as a function of bile salt concentration. Pharmaceutical Research, 13,
163–167.
Morris, K.R. Structural aspects of hydrates and solvates in Polymorphism in Pharmaceutical
Solids, H.G.Brittain, Editor.1999, Marcel Dekker, Inc.: New York. p. 278–330.
Mukerjee, P. and Cardinal, J.R. 1976. Solubilization as a method for studying self-association
– solubility of naphthalene in bile-salt sodium cholate and complex pattern of its ag-
gregation. Journal of Pharmaceutical Sciences, 65, 882-886.
Mullin, J.W. Crystallization, 1993, Butterworth-Heinemann; Boston.
Mullin, J.W. Industrial techniques and equipment in crystallization, 2001, Butterworth-Heine-
mann; Oxford.
Myerson, A.S. Handbook of Industrial Pharmacy, 1993, Butterworth-Heinemann, Boston.
Myerson , A.S. Crystallization Basics in Molecular Modeling Applications in Crystallization, A.S.
Myerson, Editor. 1999, Cambridge University Press; New York. p. 55–105.
Naylor, L.J., Bakatselou, V., Dressman, J.B., 1993. Comparison of the mechanism of dissolution
of hydrocortisone in simple and mixed micelle systems. Pharmaceutical Research, 10,
865–870.
Naylor, L.J., Bakatselou, V., Rodriquez-Hornedo, N., Weiner, N.D., Dressman, J.B., 1995. Dissolu-
tion of steroids in bile salt solutions is modified by the presence of lecithin. Journal of
Pharmaceutics and Biopharmaceutics, 41, 346–353.
Nicklasson, M., Brodin, A., Nyqvist, H. 1981. Studies on the relationship between solubility and
intrinsic rate of dissolution as a function of pH. Acta Pharmaceutica Suec., 18, 119–128.

46
Nicklasson, M., Brodin, A., Stenlander C., 1982. The dependence of intrinsic rates of dissolution
on hydrodynamic conditions using a thermodynamic approach. Acta Pharmaceutica
Suec., 19, 24–36.
Nicklasson, M., and Magnusson, A.-B., 1985. Program for evaluating drug dissolution kinetics
in preformulation. Pharmaceutical Research, 6, 262–266.
Nicklasson, M., Fyhr P., Magnusson A.-B., Gunnvald K. 1988. A preformulation study on the in
vitro dissolution characteristics of the organophosphorous poisoning antidote HI-6. Int.
J. Pharm. 46, 247–254.
Nicklasson, M., In vitro characterization of dissolution rate in Industrial Aspects of Pharmaceu-
tics, E. Sandell, Editor. 1992, Swedish Pharmaceutical Press; Uppsala. p. 64–78.
Nicolaides, E., Galia, E., Efthymiopoulos, C., Dressman, J.B., Reppas, C., 1999. Forecasting the
in vivo performance of four low solubility drugs from their in vitro dissolution data.
Pharmaceutical Research, 16, 1876–1882.
Nicolaides, E., Symillides, M., Dressman, J.B., Reppas, C., 2001. Biorelevant dissolution testing
to predict the plasma profile of lipophilic drugs after oral administration. Pharmaceuti-
cal Research, 18, 380–388.
Norris, D.A., Leesman, G.D., Sinko, P.J., Grass, G.M. 2000. Development of predictive pharma-
cokinetic simulation models for drug discovery, Journal of Controlled Release, 65, 55–62.
Noyes, A.A. and Whitney, W.R. 1897. The rate of solution of solid substances in their own
solutions Journal of American Chemical Society, 19, 930-934.
Nyvlt, J., Sohnel, O., Matuchova, M., Broul, M. The kinetics of industrial crystallization, 1985,
Elsevier; Amsterdam.
Ono et al., 2004. Quantitative measurement of polymorphic transformation of L-glutamic acid
using in-situ Raman spectroscopy. Crystal Growth and Design, 4, 465–469.,
Pedersen, B.L., Müllertz, A., Bronsted, H., Kristensen, H.G., 2000a. A comparison of the solubil-
ity of danazol in human and simulated gastrointestinal fluids. Pharmaceutical Research,
17, 891–894.
Pedersen, B.L., Brøndsted, H., Lennernäs, H., Christensen, F.N., Müllertz, A., Kristensen, H.G.,
2000b. Dissolution of hydrocortisone in human and simulated intestinal fluids. Pharma-
ceutical Research, 17, 183–189.
Peltonen, L., Liljeroth, P., Heikkilä, T., Kontturi, K., Hirvonen, J. 2003. Dissolution testing of
acetylsalicylic acid by a channel flow method – correlation to USP basket and intrinsic
dissolution methods. Europena Journal of Pharmaceutical Sciences, 19, 395-401.
Persson, E.M., Gustafsson, A.S., Carlsson, A.S., Nilsson, R.G., Knutson, L., Forsell, P., Hanisch, G.,
Lennernäs, H., Abrahamsson, B., 2005. The effects of food on the dissolution of poorly
soluble drugs in human and in model intestinal fluids, Pharmaceutical Research, 22,
2141–2151.
Persson, E.M., Nilsson, R.G., Hansson, G.I., Lofgren, L.J., Liback, F., Knutson, L., Forsell, P.,
Hanisch, G., Lennernäs, H., 2006. A clinical single-pass perfusion investigation of the
dynamic in vivo secretory response to a dietary meal in human proximal small intestine.
Pharmaceutical Research, 23, 742–751.
Plusquellac, Y., Efthymiopoulos, C., Duthil, P., Houin, G. 1999. A pharmacokinetic model for
multiple sites discontinuous gastrointestinal absorption, Medicinal Engineering and
Physics, 21, 525–532.

7 REFERENCES
47
Polli, J.E., Yu, L.X., Amidon, L.A., Borchardt, R.T., Burnside, B.A., Burton, P.S., Chen, M.-L., Con-
ner, D.P., Faustino, P.J., Hawi, A.A., Hussain, A.S., Joshi, H.N., Kwei, G., Lee, V.H.L., Lesko,
L.J., Lipper, R.A., Loper, A.E., Nerurkar, S.G., Polli, J.W., Sanvordeker, D.R., Taneja, R.,
Uppoor, R.S., Vattikonda, C.S., Wilding, I., Zhang, G., 2004. Summary workshop report:
Biopharmaceutics classification system – implementation challenges and extension op-
portunities. Journal of Pharmaceutical Sciences, 93, 1375–1381.
Porter, C.J.H., and Charman, W.N., 2001. In vitro assessment of oral lipid based formulations.
Advanced Drug Delivery Reviews, 50, 127–147.
Porter, C.J.H., Trevaskis, N.L., Charman, W.N. 2007. Lipids and lipid-based formulations: opti-
mizing the oral delivery of lipophilic drugs, Nature Reviews, 6, 231–248.
Prasad K.V.R., Ristic R.I., Sheen D.B. and Sherwood J.N. 2002. Dissolution kinetics of paraceta-
mol single crystals. International Journal of Pharmaceutics, 238, 29–41.
Rauterau, M., Bisalli, A., Rambaud, J.C., 1981. Bile salts and lipids in aqueous intraluminal
phase during the digestion of a standard meal in normal man. Gastroentérologie cli-
nique et biologique, 5, 417–425.
Rodriquez-Hornedo, N. and Murphy, D., 1999. Significance of controlling crystallization
mechanisms and kinetics in pharmaceutical systems, Journal of Pharmaceutical Sciences,
88, 651–660.
Rodriquez-Hornedo, N. and Murphy, D. 2004. Surfactants-facilitated crystallization of dihy-
drate carbamazepine during dissolution of anhydrous polymorph, Journal of Pharma-
ceutical Sciences, 93, 449–460.
Shefter, E. and Higuchi, T. 1963. Dissolution behaviour of crystalline solvated and nonsolvated
forms of some pharmaceuticals, Journal of Pharmaceutical Sciences, 52, 781–791.
Shekunov, B.Y., York, P., 2000. Crystallization processes in pharmaceutical technology and drug
delivery design, Journal of Crystal Growth, 211, 122–136.
Sinclair, B. 2000. Interpreting changes in nucleation and crystal morphology of carbamazepine
dihydrate by probing the intermolecular interactions between additives and crystal
surfaces (Dissertation). Ann Arbor, MI: The University of Michigan.
Schiller, C., Frönlich, C.P., Giesmann, T., Siegmund, Y., Mönnikes, H., Hosten, N., Weitschies,
W., 2005. Intestinal fluid volumes and transit of dosage forms as assessed by magnetic
resonance imaging, Alimentary Pharmacology and Therapeutics, 22, 971–979.
Sunesen, V.H., Pedersen, B.L:, Kristensen, H.G., Müllertz, A., 2005b. In vivo in vitro correlations
for a poorly soluble drug, danazol, using the flow through dissolution method with bi-
orelevant dissolution media. European Journal of Pharmaceutical Sciences, 24, 305-313.
Stegman, S., Leveiller, F., Franchi, D., de Jong, H., Linden, H., 2007. When poor solubility be-
comes an issue: From early stage to proof of concept. European Journal of Pharmaceuti-
cal Sciences, 31, 249–261.
Tangerman, A., va Schaik, A., van der Hock, E.W., 1986. Analysis of conjugated and unconju-
gated bile acids in serum and jejunal fluid of normal subjects. Clinica Chimica Acta, 159,
405–411.
Tenho, M., Aaltonen, J., Heinänen, P., Peltonen, L., Lehto, V.-P. 2007. Effect of texture on the
intrinsic dissolution behaviour of acetylsalicylic acid and tolbutamide compacts. Journal
of Applied Crystallography, 40, 857-864.

48
Tian, F., Zeitler, J.A., Strachan, C.J., Saville, D.J., Gordon, K.C., Rades, T. 2006. Characterizing the
conversion kinetics of carbamazepine polymorphs to the dihydrate in aqueous suspen-
sion using Raman spectroscopy, Journal of Pharmaceutical and Biomedical Analysis, 13,
271–280.
Tian, F., Sandler, N., Aaltonen, J., Lang, C., Saville, D.J., Cordon, K.C., Strachan, C.J., Rantanen,
J., Rades, T. 2007. Influence of polymorphic form, morphology and excipient interactions
on the dissolution of carbamazepine compacts, Journal of Pharmaceutical Sciences, 96,
584–594.
Ungell, A.-L., Abrahamsson B. Biopharmaceutical support in candidate drug selection in Phar-
maceutical Preformulation and Formulation, M. Gibson, Editor. 2000, CRC Press LLC.:
Boca Raton. p. 97–153.
USP XXXI, 2008. Intrinsic Dissolution. The United States Pharmacopeial Convention, Rockville.
Watanabe A., Yamaoka Y. and Takada K. 1982. Crystal habits and dissolution behaviours of
aspirin, Chemical and Pharmaceutical Bulletin, 30, 2958–2963.
Wei, H., and Löbenberg, R., 2006. Biorelevant dissolution media as a predictive tool for glybu-
ride a class II drug. European Journal of Pharmaceutical Sciences, 29, 45–52.
Weissbuch, I., Addadi, L., Leiserowitz, L. 1991. Molecular recognition at crystal interfaces. Sci-
ence, 253, 637-645.
Vertzoni, M., Fotaki, N., Kostewicz, E., Stippler, E., Leuner, C., Nicolaides, E., Dressman, J, Rep-
pas, C., 2004. Dissolution media simulating the intralumenal composition of the small
intestine: physiological issues and practical aspects. Journal of Pharmacy and Pharma-
cology, 56, 453–462.
Vertzoni, M., Pastelli, E., Psachoulias, D., Kalantzi, L., Reppas, C., 2007. Estimation of intragas-
tric solubility of drugs: In what medium? Pharmaceutical Research, 24, 909–917.
Wiedman, T.S., Liang, W., Kamel, L., 2002. Solubilization of drugs by physiological mixtures of
bile salts. Pharmaceutical Research, 19, 1203–1208.
Wikström, H., Marsac, P.J. and Taylor, L.S., 2005. In-line monitoring of hydrate formation dur-
ing wet granulation using Raman spectroscopy, Journal of pharmaceutical sciences, 94,
209–219.
Vippagunta, S.R., Brittain, H.G. and Grant, D.J. 2001. Crystalline solids. Advanced Drug Delivery
Reviews, 48, 3–26.
Yalkowsky, S.H., Techniques of Solubilization of Drugs, 1981, Marcel Dekker.: New York.
Yalkowsky, S.H., Solubility and solubilization in aqueous media, 1999, Oxford University Press;
New York, p 262–266.
Yokoe, J., Iwasaki, N., Haruta, S., Kadano, K., Ogawara, K., Higaki, K., Kimura, T. 2003. Analysis
and prediction of absorption behaviour of colon-targeted prodrug in rats by GI-transit-
absorption model, Journal of Controlled Release, 86, 305–313.
Yu, L. 1995. Inferring thermodynamic stability relationship of polymorphs from melting data.
Journal of Pharmaceutical Sciences, 84, 966–974.
Yu L.X., Crison J.R., Amidon G.L. 1996. Compartmental transit and dispersion model analysis
of small intestinal transit flow in humans. International Journal of Pharmaceutics, 140,
111–118.
Yu, L.X., Amidon, G.L. 1999. A compartmental absorption and transit model for estimating oral
drug absorption, International Journal of Pharmaceutics, 186, 119–125.

7 REFERENCES
49
Yu, L.X., Amidon, G.L., Polli, J.E., Zhao, H., Mehta, M.U., Conner, D.P., Shah, V.P., Lesko, L.J.,
Chen, M.L., Lee, V.H.L., Hussain, A.,S., 2002. Biopharmaceutics Classification System: the
scientific basis for biowaiver extensions, Pharmaceutical Research, 19, 921–925.
Zhang, G.G., Law, D., Schmitt, E.A., Qiu, Y. 2004. Phase transformation considerations during
the process development and manufacture of solid oral dosage forms, Advanced Drug
Delivery Reviews, 23, 371–390.
Zhu, H., Yuen, C., Grant, D.J.W. 1996. Influence of water activity in organic solvent plus water
mixtures on the nature of the crystallizing phase. 1. Theophylline, International Journal
of Pharmaceutical Sciences, 135, 151–160.

Related Documents