Mechanistic Mathematical Model for In Vivo Aroma Release during Eating of Semiliquid Foods Ioan Cristian Trelea, Samuel Atlan, Isabelle De ´le ´ ris, Anne Saint-Eve, Miche ` le Marin and Isabelle Souchon UMR782 Ge ´ nie et Microbiologie des Proce ´ de ´ s Alimentaires, AgroParisTech, INRA, BP 01, 1 av. Lucien Bre ´ tigne ` res, 78850 Thiverval-Grignon, France Correspondence to be sent to: Ioan Cristian Trelea, UMR782 Ge ´ nie et Microbiologie des Proce ´ de ´s Alimentaires, AgroParisTech, INRA, 1 av. Lucien Bre ´ tigne ` res, 78850 Thiverval-Grignon, France. e-mail: [email protected] Abstract The paper describes a mechanistic mathematical model for aroma release in the oropharynx to the nasal cavity during food consumption. The model is based on the physiology of the swallowing process and is validated with atmospheric pressure chem- ical ionization coupled with mass spectrometry measurements of aroma concentration in the nasal cavity of subjects eating flavored yogurt. The study is conducted on 3 aroma compounds representative for strawberry flavor (ethyl acetate, ethyl buta- noate, and ethyl hexanoate) and 3 panelists. The model provides reasonably accurate time predictions of the relative aroma concentration in the nasal cavity and is able to simulate successive swallowing events as well as imperfect velopharyngeal closure. The most influent parameters are found to be the amount of the residual product in the pharynx and its contact area with the air flux, the volume of the nasal cavity, the equilibrium air/product partition coefficient of the volatile compound, the breath airflow rate, as well as the mass transfer coefficient of the aroma compound in the product, and the amount of product in the mouth. This work constitutes a first step toward computer-aided product formulation by allowing calculation of retronasal aroma in- tensity as a function of transfer and volatility properties of aroma compounds in food matrices and anatomophysiological char- acteristics of consumers. Key words: APCI-MS, dynamic model, flavor release, mass transfer, swallowing physiology, yogurt Introduction During eating, aroma compounds initially present in the food matrix have to reach the olfactory epithelium by the retronasal pathway in order to be perceived by the consumer. The relationship between this release and the perception is quite complex and not well understood so far due, for exam- ple, to perceptual interactions and possibly to other poorly known mechanisms. It is therefore of a great interest to have a quantitative description of in vivo aroma release because 1) it is a key step in understanding the role of the product (com- position and structure) and of the consumer (physiological parameters and individual experience) in the perceived flavor (Cook et al. 2005; Bult et al. 2007), 2) it is essential in under- standing the role of the oral mechanisms and processes in the flavor release (Buettner et al. 2001), and 3) it could help to design food products taking physiological characteristics of individuals (young or elderly, healthy subjects, or with some clinical pathologies as dysphasia) into account. In this con- text, mechanistic models, describing the mass transfer of vol- atiles from food product to the air of the oral and nasal cavities, can constitute useful tool to predict aroma release and thus to identify the most important physicochemical, an- atomical, and physiological parameters responsible for this release. The development and the validation of such models require a better knowledge of both in vivo aroma concentrations and involved physiological mechanisms. The experimental deter- mination of the aroma compound concentrations in the na- sal cavity is now possible due to sufficiently sensitive and fast in vivo volatile measurement techniques such as atmospheric pressure chemical ionization (APCI-MS) or proton transfer reaction (PTR-MS) coupled with mass spectrometry. In the recent years, in vivo studies of volatile release using APCI- MS (e.g., Hodgson et al. 2004; Van Loon et al. 2005; Bayarri et al. 2006; King et al. 2006; Saint-Eve, Martin, et al. 2006) or PTR-MS (Hansson et al. 2003; Aprea et al. 2006; Boland et al. 2006) became more and more abundant. But the data Chem. Senses doi:10.1093/chemse/bjm077 ª The Author 2007. Published by Oxford University Press. All rights reserved. For permissions, please e-mail: [email protected] Chemical Senses Advance Access published November 28, 2007 by guest on February 6, 2015 http://chemse.oxfordjournals.org/ Downloaded from

Welcome message from author
This document is posted to help you gain knowledge. Please leave a comment to let me know what you think about it! Share it to your friends and learn new things together.
Transcript
Mechanistic Mathematical Model for In Vivo Aroma Release during Eatingof Semiliquid Foods
Ioan Cristian Trelea, Samuel Atlan, Isabelle Deleris, Anne Saint-Eve, Michele Marin andIsabelle Souchon
UMR782 Genie et Microbiologie des Procedes Alimentaires, AgroParisTech, INRA, BP 01, 1 av.Lucien Bretigneres, 78850 Thiverval-Grignon, France
Correspondence to be sent to: Ioan Cristian Trelea, UMR782 Genie et Microbiologie des Procedes Alimentaires, AgroParisTech,INRA, 1 av. Lucien Bretigneres, 78850 Thiverval-Grignon, France. e-mail: [email protected]
Abstract
The paper describes a mechanistic mathematical model for aroma release in the oropharynx to the nasal cavity during foodconsumption. The model is based on the physiology of the swallowing process and is validated with atmospheric pressure chem-ical ionization coupled with mass spectrometry measurements of aroma concentration in the nasal cavity of subjects eatingflavored yogurt. The study is conducted on 3 aroma compounds representative for strawberry flavor (ethyl acetate, ethyl buta-noate, and ethyl hexanoate) and 3 panelists. The model provides reasonably accurate time predictions of the relative aromaconcentration in the nasal cavity and is able to simulate successive swallowing events as well as imperfect velopharyngeal closure.The most influent parameters are found to be the amount of the residual product in the pharynx and its contact area with the airflux, the volume of the nasal cavity, the equilibrium air/product partition coefficient of the volatile compound, the breath airflowrate, as well as the mass transfer coefficient of the aroma compound in the product, and the amount of product in the mouth.This work constitutes a first step toward computer-aided product formulation by allowing calculation of retronasal aroma in-tensity as a function of transfer and volatility properties of aroma compounds in food matrices and anatomophysiological char-acteristics of consumers.
Key words: APCI-MS, dynamic model, flavor release, mass transfer, swallowing physiology, yogurt
Introduction
During eating, aroma compounds initially present in the
food matrix have to reach the olfactory epithelium by theretronasal pathway in order to be perceived by the consumer.
The relationship between this release and the perception is
quite complex and not well understood so far due, for exam-
ple, to perceptual interactions and possibly to other poorly
known mechanisms. It is therefore of a great interest to have
a quantitative description of in vivo aroma release because 1)
it is a key step in understanding the role of the product (com-
position and structure) and of the consumer (physiologicalparameters and individual experience) in the perceived flavor
(Cook et al. 2005; Bult et al. 2007), 2) it is essential in under-
standing the role of the oral mechanisms and processes in the
flavor release (Buettner et al. 2001), and 3) it could help to
design food products taking physiological characteristics of
individuals (young or elderly, healthy subjects, or with some
clinical pathologies as dysphasia) into account. In this con-
text, mechanistic models, describing the mass transfer of vol-
atiles from food product to the air of the oral and nasal
cavities, can constitute useful tool to predict aroma releaseand thus to identify the most important physicochemical, an-
atomical, and physiological parameters responsible for this
release.
The development and the validation of suchmodels require
a better knowledge of both in vivo aroma concentrations and
involved physiological mechanisms. The experimental deter-
mination of the aroma compound concentrations in the na-
sal cavity is now possible due to sufficiently sensitive and fastin vivo volatile measurement techniques such as atmospheric
pressure chemical ionization (APCI-MS) or proton transfer
reaction (PTR-MS) coupled with mass spectrometry. In the
recent years, in vivo studies of volatile release using APCI-
MS (e.g., Hodgson et al. 2004; Van Loon et al. 2005; Bayarri
et al. 2006; King et al. 2006; Saint-Eve,Martin, et al. 2006) or
PTR-MS (Hansson et al. 2003; Aprea et al. 2006; Boland
et al. 2006) became more and more abundant. But the data
Chem. Senses doi:10.1093/chemse/bjm077
ª The Author 2007. Published by Oxford University Press. All rights reserved.For permissions, please e-mail: [email protected]
Chemical Senses Advance Access published November 28, 2007 by guest on February 6, 2015
http://chemse.oxfordjournals.org/
Dow
nloaded from
processing is often limited to computation of maximum in-
tensities, slopes, areas, durations, and relative comparisons
between these descriptors and if possible with sensory prop-
erties. The complexity of the olfactory system geometry
(Damm et al. 2002) could explain the difficulty to establisha direct correlation between the volatile amount present in
the nasal cavity and the one locally available for sensory
receptors. Beyond quantification, the determination of the
volatile release dynamic can constitute an important and use-
ful step to better understand the dynamic of perception.
Detailed physiological studies of the deglutition process
were performed by videofluoroscopy and real-time magnetic
resonance imaging, giving a description of the key oral andpharyngeal stages of the swallowing act (Buettner et al.
2001). Some in vivo deglutition studies synchronously re-
corded a large number of physiological parameters: respira-
tion by spirometry, mastication by electromyography,
deglutition by electroglottography, and aroma compound
release by APCI-MS (e.g., Hodgson et al. 2003). Such syn-
chronous studies are particularly valuable because they
allow the integrationof the various signals in anoverallmech-anistic picture. For instance, lots of authors agreed to estab-
lish a direct link between volatile apparition in the nasal
cavity and swallowing events (Buettner et al. 2002; Hodgson
et al. 2003), but, because of the interindividual variability
and the complexity of the consumption and perception pro-
cesses, few studies developed an integrated modeling
approach taking into account the whole physiological, phys-
icochemical, and kinetic phenomena.The development of a dynamic release model consists in the
calculation of the amounts of aroma compounds transferred
from the food matrix to the nasal cavity in the course of the
eating process. Pioneering work in flavor-release modeling
during food consumption is due to Harrison et al. (Harrison
1998; Harrison et al. 1998). A theoretical description of aroma
release was proposed on the basis of mass transfer theory,
but these models did not include experimental validationand made strong simplifying assumptions, like constant
breath airflow, which are relatively far from reality. Based
on these first in vivo modeling attempts, improvements of
flavor-release models have been proposed by integrating a
more realistic description of physiological mechanisms: 1)
mastication for semisolid products as sweet gel (Wright
and Hills 2003; Wright, Sprunt, et al. 2003) and 2) flow in
the throat for liquids (Wright, Hills, et al. 2003). The flavorpersistence was quite well represented by this last model, but
the signal intensity in the first breath was not in agreement
with in vivo experiments. Based on the empirical approach
suggested by Linforth and Taylor (2000), Linforth et al.
(2002) have used a quantitative structure property relation-
ships method to represent flavor release from solutions after
the first 2 swallowing events. In the case of a semisolid prod-
uct (gelled emulsion particles), Lian et al. (2004) have mod-eled flavor release and underlined the important role of the
product structure on the main mechanisms explaining the re-
lease. Their mathematical model was focused more on the
product than on the physiological conditions during eating
process. Normand et al. (2004) developed a volatile release
model from liquid products based on a simplified but real-
istic description of the human swallowing and breathing pro-cess. Distinct mechanisms were assumed for the first breath
after the deglutition event and the subsequent ones. Short-
time persistence (less than 1 min) of the aroma release
was considered to be mainly due to saliva coating, whereas
longer time persistence to volatile adsorption in the mucosa.
All these studies constituted a real progress in analyzing
aroma release, but they illustrated the need for a better in-
tegration of the complexity of the involved phenomena todescribe more realistically aroma release.
The present work focuses on modeling in vivo aroma re-
lease from semisolid (gelled) food matrices. The model is
based on anatomic and physiologic reality of the swallowing
process and describes volatile release without distinction be-
tween the first and the subsequent breaths. Validation is per-
formed by comparing simulations with in vivo APCI-MS
volatile measurements. This model intends to be a step to-ward quantitative mechanistic description of the retronasal
olfactory stimulus generation. Possible applications include
computer-aided product formulation, considering the retro-
nasal aroma intensity as a function of aroma compound
properties in food matrices and anatomophysiological char-
acteristics of the consumers.
Materials and methods
Measurement of volatiles concentration in the nasal cavity
The concentration of the volatile compounds in the nasal
cavity of the panelists was measured by APCI-MS using
anEsquire-LiquidChromatographmassspectrometer (Bruker
Daltonique, Wissenbourg, France) as previously described
(Saint-Eve,Martin, et al. 2006).Airwas sampled from the sub-ject’s nose at a flow rate of 35 ml/min through a deactivated
fused silica tubing (Supelco, Saint Quentin Fallavier, France).
A glass Y junction was set up between the entry of the APCI-
MScapillary and the subject’s nose.The protonatedmolecular
ion of each target molecule was detected at its corresponding
m/z value, indicated in Table 1. In addition to the 3 esters
considered in this study, the acetone signal (m/z = 59) was
also recorded, as a marker of subject’s breath. Acetone isnaturally produced by human liver and is present in the air
expired from the lungs (Wilson 1986) at a concentration that
was assumed constant for the duration of the experiments
(less than 2 min). In order to attenuate the measurement
noise, the APCI-MS signals stored at a rate of 10 samples
per second were filtered by a symmetric moving average
filter with a ±1-s time window and 1 filtered value per
second was retained. The stability of the APCI-MS signalwas checked with a reference gas (headspace of a solution
of heptan-2-one at 15 parts per million) before and after the
2 I.C. Trelea et al.
by guest on February 6, 2015http://chem
se.oxfordjournals.org/D
ownloaded from
release experiments. Relative aroma compound concentra-
tions were determined as ratios of APCI peak heights at
the corresponding m/z values.
Preparation of the flavored products
Two flavored stirred yogurts were used in this study. Their
preparation and properties were previously described in de-
tail (Saint-Eve, Levy, et al. 2006). They had the same dry
matter (22.5%), fat (4%), and total protein (5.4%) contents,
but different protein fractions: yoghurt enriched with sodiumcaseinate (CAS) (complex viscosity at 0.1 Pa: 159 Pa�s),whereas yoghurt enriched with milk powder (MPO) (complex
viscosity at 0.1 Pa: 109 Pa�s). Yogurts were flavored to 1 mg/g
with a strawberry flavor containing 17 aroma compounds
mixed with propylene glycol (Saint-Eve, Levy, et al. 2006).
The compounds considered in this study were ethyl acetate,
ethyl butanoate, and ethyl hexanoate, whose initial concen-
trations in the yogurt (COP0) are given in Table 1.
Yogurt consumption protocol
The yogurt consumption protocol was organized as de-
scribed by Saint-Eve, Martin, et al. (2006). During a session,
each of the 3 panelists considered in this study ate 5 cm3 ofyogurt at 10 �C. They had to keep the yogurt in the mouth for
12 s and to swallow. Then, they had to continue eating nor-
mally. The nose-space APCI-MS signal was recorded for at
least 1 min after having introduced the yogurt in the mouth.
The swallowing events during this time were recorded. Each
experiment was repeated 4 times.
Estimation of the instantaneous breath flow rate
The breath flow rate of the panelists during the consumption
of flavored products was estimated from the acetone signal
measured in the nasal cavity and recorded synchronouslywith the concentration of the target aroma compounds. Dur-
ing inspiration, the acetone concentration in the nasal cavity
decreases due to dilution by ambient air, whereas during ex-
piration, it increases due to the contribution of the air com-
ing from the lungs. The instantaneous breath flow rate was
thus estimated as being proportional to the (minus) deriva-
tive of the acetone concentration signal. The proportionality
factor, necessary for scaling the flow rate in physical units,was obtained from spirometric data recorded for each pan-
elist during 1 min before each experiment (spirometer
PulmoSystem 2, Datalink, MSR, Paris, France).
Mathematical model
Principle of the developed model
Before presenting the equations describing flavor transfer oc-
curring in the yogurt-eating process, the principle and the
main steps of the developed model are described first. The
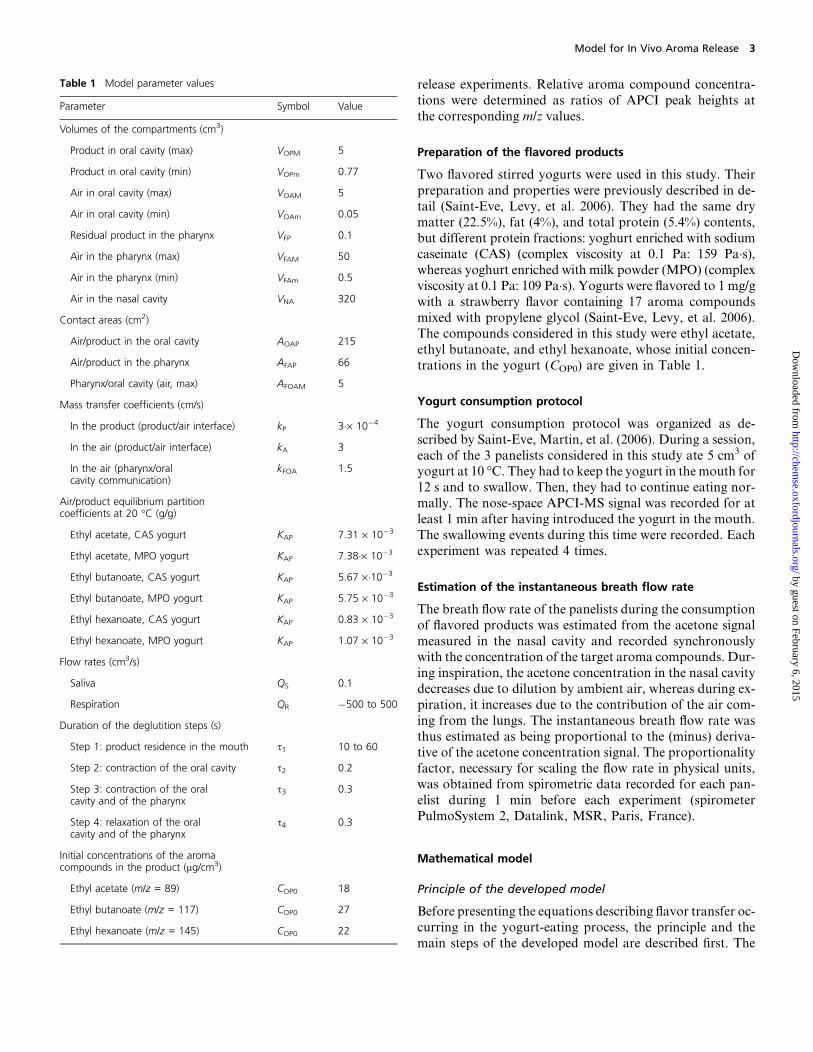
Table 1 Model parameter values
Parameter Symbol Value
Volumes of the compartments (cm3)
Product in oral cavity (max) VOPM 5
Product in oral cavity (min) VOPm 0.77
Air in oral cavity (max) VOAM 5
Air in oral cavity (min) VOAm 0.05
Residual product in the pharynx VFP 0.1
Air in the pharynx (max) VFAM 50
Air in the pharynx (min) VFAm 0.5
Air in the nasal cavity VNA 320
Contact areas (cm2)
Air/product in the oral cavity AOAP 215
Air/product in the pharynx AFAP 66
Pharynx/oral cavity (air, max) AFOAM 5
Mass transfer coefficients (cm/s)
In the product (product/air interface) kP 3�· 10�4
In the air (product/air interface) kA 3
In the air (pharynx/oralcavity communication)
kFOA 1.5
Air/product equilibrium partitioncoefficients at 20 �C (g/g)
Ethyl acetate, CAS yogurt KAP 7.31 · 10�3
Ethyl acetate, MPO yogurt KAP 7.38�· 10�3
Ethyl butanoate, CAS yogurt KAP 5.67 ·�10�3
Ethyl butanoate, MPO yogurt KAP 5.75 · 10�3
Ethyl hexanoate, CAS yogurt KAP 0.83 · 10�3
Ethyl hexanoate, MPO yogurt KAP 1.07 · 10�3
Flow rates (cm3/s)
Saliva QS 0.1
Respiration QR �500 to 500
Duration of the deglutition steps (s)
Step 1: product residence in the mouth s1 10 to 60
Step 2: contraction of the oral cavity s2 0.2
Step 3: contraction of the oralcavity and of the pharynx
s3 0.3
Step 4: relaxation of the oralcavity and of the pharynx
s4 0.3
Initial concentrations of the aromacompounds in the product (lg/cm3)
Ethyl acetate (m/z = 89) COP0 18
Ethyl butanoate (m/z = 117) COP0 27
Ethyl hexanoate (m/z = 145) COP0 22
Model for In Vivo Aroma Release 3
by guest on February 6, 2015http://chem
se.oxfordjournals.org/D
ownloaded from
purpose of this section is to give an outline of the modeling
approach without going into any mathematical detail. The
starting point for developing themechanistic model is a phys-
iological representation of the deglutition process. Volatile
release is quantitatively described using tools from chemicalengineering. The various parts of the upper respiratory tract
are viewed as interconnected reactors, containing an air
phase and possibly a flavored product phase. The deglutition
process is decomposed into 4 main steps. Detailed mass bal-
ances are written for each step in each compartment. Mass
balances include volatile release at air–product interface and,
when appropriate, bulk flows for product and air.
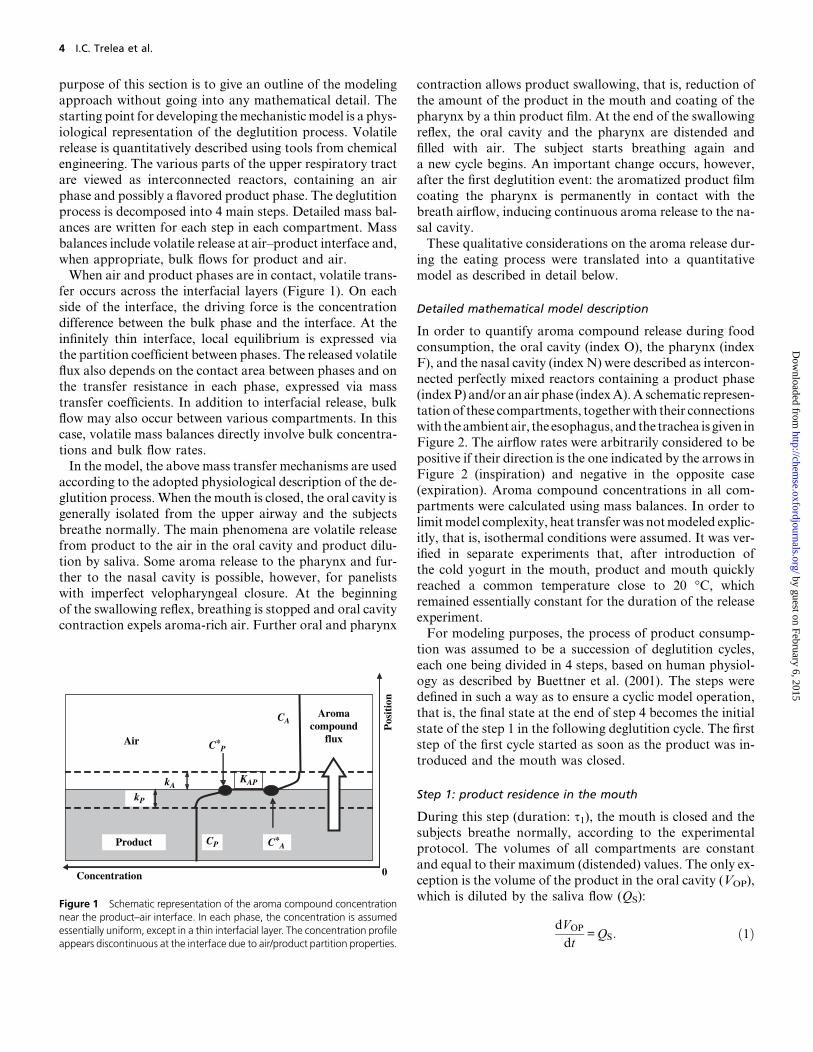
When air and product phases are in contact, volatile trans-fer occurs across the interfacial layers (Figure 1). On each
side of the interface, the driving force is the concentration
difference between the bulk phase and the interface. At the
infinitely thin interface, local equilibrium is expressed via
the partition coefficient between phases. The released volatile
flux also depends on the contact area between phases and on
the transfer resistance in each phase, expressed via mass
transfer coefficients. In addition to interfacial release, bulkflow may also occur between various compartments. In this
case, volatile mass balances directly involve bulk concentra-
tions and bulk flow rates.
In the model, the above mass transfer mechanisms are used
according to the adopted physiological description of the de-
glutition process.When the mouth is closed, the oral cavity is
generally isolated from the upper airway and the subjects
breathe normally. The main phenomena are volatile releasefrom product to the air in the oral cavity and product dilu-
tion by saliva. Some aroma release to the pharynx and fur-
ther to the nasal cavity is possible, however, for panelists
with imperfect velopharyngeal closure. At the beginning
of the swallowing reflex, breathing is stopped and oral cavity
contraction expels aroma-rich air. Further oral and pharynx
contraction allows product swallowing, that is, reduction of
the amount of the product in the mouth and coating of the
pharynx by a thin product film. At the end of the swallowing
reflex, the oral cavity and the pharynx are distended and
filled with air. The subject starts breathing again anda new cycle begins. An important change occurs, however,
after the first deglutition event: the aromatized product film
coating the pharynx is permanently in contact with the
breath airflow, inducing continuous aroma release to the na-
sal cavity.
These qualitative considerations on the aroma release dur-
ing the eating process were translated into a quantitative
model as described in detail below.
Detailed mathematical model description
In order to quantify aroma compound release during food
consumption, the oral cavity (index O), the pharynx (index
F), and the nasal cavity (index N) were described as intercon-
nected perfectly mixed reactors containing a product phase
(indexP) and/or an air phase (indexA).A schematic represen-
tationof these compartments, togetherwith their connectionswith theambient air, the esophagus, and the trachea is given in
Figure 2. The airflow rates were arbitrarily considered to be
positive if their direction is the one indicated by the arrows in
Figure 2 (inspiration) and negative in the opposite case
(expiration). Aroma compound concentrations in all com-
partments were calculated using mass balances. In order to
limitmodel complexity, heat transferwas notmodeled explic-
itly, that is, isothermal conditions were assumed. It was ver-ified in separate experiments that, after introduction of
the cold yogurt in the mouth, product and mouth quickly
reached a common temperature close to 20 �C, which
remained essentially constant for the duration of the release
experiment.
For modeling purposes, the process of product consump-
tion was assumed to be a succession of deglutition cycles,
each one being divided in 4 steps, based on human physiol-ogy as described by Buettner et al. (2001). The steps were
defined in such a way as to ensure a cyclic model operation,
that is, the final state at the end of step 4 becomes the initial
state of the step 1 in the following deglutition cycle. The first
step of the first cycle started as soon as the product was in-
troduced and the mouth was closed.
Step 1: product residence in the mouth
During this step (duration: s1), the mouth is closed and the
subjects breathe normally, according to the experimentalprotocol. The volumes of all compartments are constant
and equal to their maximum (distended) values. The only ex-
ception is the volume of the product in the oral cavity (VOP),
which is diluted by the saliva flow (QS):
dVOP
dt=QS: ð1Þ
Concentration 0
CPProduct
Air
Pos
itio
n
C*A
C*P
CA
kA
kP
KAP
Aromacompound
flux
Figure 1 Schematic representation of the aroma compound concentrationnear the product–air interface. In each phase, the concentration is assumedessentially uniform, except in a thin interfacial layer. The concentration profileappears discontinuous at the interface due to air/product partition properties.
4 I.C. Trelea et al.
by guest on February 6, 2015http://chem
se.oxfordjournals.org/D
ownloaded from
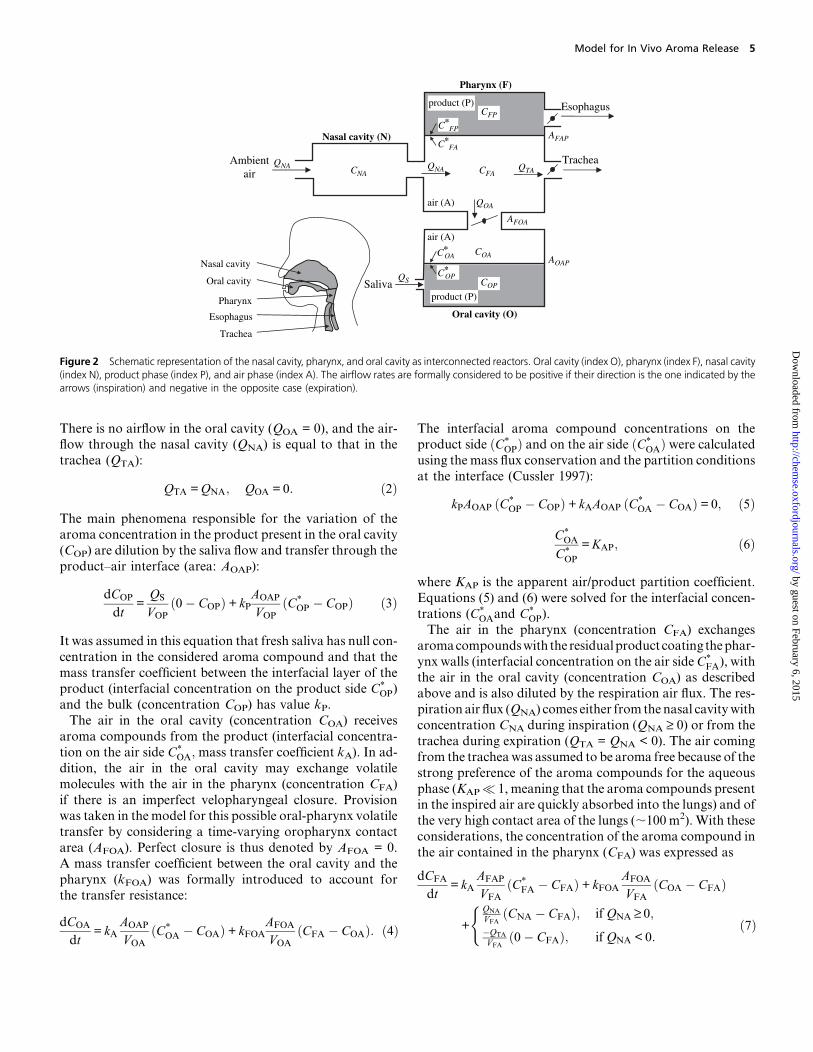
There is no airflow in the oral cavity (QOA = 0), and the air-flow through the nasal cavity (QNA) is equal to that in the
trachea (QTA):
QTA =QNA; QOA = 0: ð2Þ
The main phenomena responsible for the variation of thearoma concentration in the product present in the oral cavity
(COP) are dilution by the saliva flow and transfer through the
product–air interface (area: AOAP):
dCOP
dt=
QS
VOPð0� COPÞ+kP
AOAP
VOPðC*
OP � COPÞ ð3Þ
It was assumed in this equation that fresh saliva has null con-
centration in the considered aroma compound and that the
mass transfer coefficient between the interfacial layer of theproduct (interfacial concentration on the product side C*
OP)
and the bulk (concentration COP) has value kP.
The air in the oral cavity (concentration COA) receives
aroma compounds from the product (interfacial concentra-
tion on the air side C*OA; mass transfer coefficient kA). In ad-
dition, the air in the oral cavity may exchange volatile
molecules with the air in the pharynx (concentration CFA)
if there is an imperfect velopharyngeal closure. Provisionwas taken in the model for this possible oral-pharynx volatile
transfer by considering a time-varying oropharynx contact
area (AFOA). Perfect closure is thus denoted by AFOA = 0.
A mass transfer coefficient between the oral cavity and the
pharynx (kFOA) was formally introduced to account for
the transfer resistance:
dCOA
dt= kA
AOAP
VOAðC*
OA � COAÞ+kFOAAFOA
VOAðCFA � COAÞ: ð4Þ
The interfacial aroma compound concentrations on theproduct side ðC*
OPÞ and on the air side ðC*OAÞ were calculated
using the mass flux conservation and the partition conditions
at the interface (Cussler 1997):
kPAOAP ðC*OP � COPÞ+kAAOAP ðC*
OA � COAÞ= 0; ð5Þ
C*OA
C*OP
=KAP; ð6Þ
where KAP is the apparent air/product partition coefficient.
Equations (5) and (6) were solved for the interfacial concen-
trations (C*OAand C*
OP).
The air in the pharynx (concentration CFA) exchanges
aromacompoundswith the residualproduct coating thephar-
ynx walls (interfacial concentration on the air side C*FA), with
the air in the oral cavity (concentration COA) as described
above and is also diluted by the respiration air flux. The res-
piration air flux (QNA) comes either from the nasal cavitywith
concentration CNA during inspiration (QNA ‡ 0) or from the
trachea during expiration (QTA = QNA < 0). The air coming
from the tracheawas assumed to be aroma free because of the
strong preference of the aroma compounds for the aqueous
phase (KAP� 1, meaning that the aroma compounds presentin the inspired air are quickly absorbed into the lungs) and of
the very high contact area of the lungs (;100 m2). With these
considerations, the concentration of the aroma compound in
the air contained in the pharynx (CFA) was expressed as
dCFA
dt= kA
AFAP
VFAðC*
FA � CFAÞ+ kFOAAFOA
VFAðCOA � CFAÞ
+
QNA
VFAðCNA � CFAÞ; if QNA ‡ 0;
�QTA
VFAð0� CFAÞ; if QNA < 0:
ð7Þ(
Nasal cavity (N)
air (A)
CNAQNA QNA
Pharynx (F)
Oral cavity (O)
product (P)
air (A)
product (P)
QOA
CFA
COA
COP
CFP
Ambientair
Esophagus
TracheaQTA
QS
C*OA
C*OP
C*FP
C*FA
AOAP
AFOA
AFAP
Nasal cavity
Oral cavity
Pharynx
Trachea
Saliva
Esophagus
Figure 2 Schematic representation of the nasal cavity, pharynx, and oral cavity as interconnected reactors. Oral cavity (index O), pharynx (index F), nasal cavity(index N), product phase (index P), and air phase (index A). The airflow rates are formally considered to be positive if their direction is the one indicated by thearrows (inspiration) and negative in the opposite case (expiration).
Model for In Vivo Aroma Release 5
by guest on February 6, 2015http://chem
se.oxfordjournals.org/D
ownloaded from
The residual product in the pharynx (concentration CFP)
exchanges aroma compounds with the adjacent air (interfa-cial concentration on the product side C*
FP):
dCFP
dt= kP
AFAP
VFPðC*
FP � CFPÞ: ð8Þ
Before the first swallowing event, there is no product presentin the pharynx, but the pharynx walls are coated with saliva
(initially aroma free). During this time, CFP represents the
concentration in the saliva film, allowing equations (7)
and (8) to be written in the same way as for subsequent swal-
lowing cycles.
The interfacial aroma compound concentrations on the
product ðC*FPÞ and on the air side in the pharynx ðC*
FAÞ werecalculated similarly to the oral cavity, that is, using equations(5) and (6) with index F (pharynx) replacing the index O (oral
cavity).
Finally, the concentration of the aroma compound in the
nasal cavity (CNA) results frommixingwith thebreathairflux.
The ambient air coming during inspiration (QNA ‡ 0) is as-
sumed aroma free, whereas during the expiration (QNA < 0)
air with concentration (CFA) comes from the pharynx:
dCNA
dt=
QNA
VNAð0� CNAÞ; if QNA ‡ 0;
�QNA
VNAðCFA � CNAÞ; if QNA < 0:
(ð9Þ
Step 2: contraction of the oral cavity (air expulsion)
This step (duration: s2) corresponds to the beginning of the
swallowing reflex. The volume of the air in the oral cavity
(VOA) is reduced from its initial maximum value (VOAM) to
some small residual amount (VOAm), resulting in expulsion
ofaroma-richair tothepharynxandfurthertothenasalcavity:
dVOA
dt=VOAm � VOAM
s2< 0: ð10Þ
Communication with the trachea is closed. The air flux to the
trachea (QTA) is zero, and the air flux from the oral cavity to
the pharynx (QOA) and further to the nasal cavity (QNA) is
due to the volume reduction:
QTA = 0; QOA =QNA =dVOA
dt< 0: ð11Þ
The volume of the product in the oral cavity (VOP) is still
given by equation (1). For the product in the oral cavity (con-centration COP), the mass transfer phenomena are identical
to step 1 and are given by equation (3). The expression of the
aroma concentration in the air of the oral cavity (COA) is sim-
ilar to equation (4) except that the term corresponding to
transfer with the pharynx is missing due to the presence
of the bulk airflow:
dCOA
dt= kA
AOAP
VOAðC*
OA � COAÞ: ð12Þ
The evolution of the air concentration in the pharynx (CFA)
is given by equation (13), which is similar to equation (7) ex-cept that the dilution by the breath air is missing, and the
transfer term with the oral cavity is replaced by dilution
due to expulsed air:
dCFA
dt= kA
AFAP
VFAðC*
FA � CFAÞ+�QOA
VFAðCOA � CFAÞ ð13Þ
The aroma concentration in the residual product in the phar-
ynx (CFP) is still given by equation (8). The concentration in
thenasal cavity (CNA) results frommixing theair coming from
the pharynx. It is given by equation (9) taking into account
that the air flux is always negative (QNA< 0) in step 2 (eq. 11).
Step 3: contraction of the oral cavity and of the pharynx
(product swallowing)
During this step (duration: s3), the pharynx is contracted,
expulsing the air to the nasal cavity. The volume of theair in the pharynx (VFA) is reduced from its initial maximum
value (VFAM) to some small residual amount (VFAm):
dVFA
dt=VFAm � VFAM
s3< 0: ð14Þ
The oral cavity contracts further, pushing the bolus to the
esophagus via the pharynx. The volume of the product in
the oral cavity (VOP) is reduced from its value reached at
the end of step 2 (VOP2) to a small residual value (VOPm):
dVOP
dt=VOPm � VOP2
s3< 0: ð15Þ
The other volumes remain constant during this step. The air
flows to the trachea (QTA) and to the oral cavity (QOA) are
zero, whereas the air flow from the pharynx to the nasal cav-
ity (QNA) is due to the volume reduction:
QTA = 0; QOA = 0; QNA =dVFA
dt< 0: ð16Þ
In addition to the airflows, a product flow (QOP) appears in
step 3, due to the contraction of the oral cavity. This product
flow also includes the saliva flow, which is assumed to be con-
stant in time:
QOP =dVOP
dt� QS < 0: ð17Þ
The concentrations of the considered aroma compound in
the product contained in the oral cavity (COP) and in the
air of the oral cavity (COA) are given by equations (3) and
(12), respectively. The concentration in the air contained
in the pharynx (CFA) is given by equation (18), which is sim-
ilar to equation (13) except that the dilution term is missing:
dCFA
dt= kA
AFAP
VFA
ðC*FA � CFAÞ: ð18Þ
Concerning the product in the pharynx (concentration CFP),
an additionalmixing term appears in this step compared with
6 I.C. Trelea et al.
by guest on February 6, 2015http://chem
se.oxfordjournals.org/D
ownloaded from
equation (8) due to the product flow from the oral cavity
through the pharynx to the esophagus:
dCFP
dt= kP
AFAP
VFPðC*
FP � CFPÞ+�QOP
VFPðCOP � CFPÞ: ð19Þ
The concentration in the nasal cavity (CNA) is given by equa-
tion (9) taking into account that the airflow is always nega-
tive (QNA < 0) in step 3 (eq. 16).
Step 4: relaxation of the oral cavity and of the pharynx
(air influx)
Step 4 of the product consumption cycle (duration: s4) cor-responds to the relaxation of the oral cavity and the pharynx.
The trachea is still closed in this step. The air compartments
are filled with air coming from the nasal cavity. The volume
of the air in the oral cavity (VOA) increases from its minimal
(VOAm) to its maximal values (VOAM):
dVOA
dt=VOAM � VOAm
s4> 0: ð20Þ
The expression for the air volume in the pharynx (VFA) is
similar, replacing index O with index F in equation (20).
The air inflow in the oral cavity (QOA) is due to the oral vol-
ume increase. The airflow from the nasal cavity (QNA) addi-
tionally includes pharynx volume increase (Figure 2):
QOA =dVOA
dt> 0; QNA =QOA +
dVFA
dt> 0: ð21Þ
The volume of the product in the oral cavity (VOP) is given by
equation (1), and the other volumes are constant.
After the end of step 4, calculations continue cyclically with
step 1. The model state at the end of step 4 (volumes andaroma compound concentrations in the various compart-
ments) becomes the initial state for the new cycle.
Model simulation and parameters
The starting time for the model simulation (t = 0) is the mo-
ment when the panelist introduces the product in the oral
cavity and closes the mouth. At the initial time, all time-vary-
ing volumes (product in the oral cavity and air in the oral
cavity and in the pharynx) have their maximum values(eq. 22). The concentration of the aroma compound in the
product (COP) is equal to the amount introduced during
the product preparation, whereas all other compartments
shown in Figure 2 are aroma free (eq. 23):
VOPð0Þ=VOPM; VOAð0Þ=VOAM; VFAð0Þ=VFAM; ð22Þ
COPð0Þ=COP0; COAð0Þ= 0; CFAð0Þ= 0;
CFPð0Þ= 0; CNAð0Þ= 0: ð23Þ
In each of the 4 steps of the deglutition process mentioned
above, model simulation requires the simultaneous solution
of 12 coupled equations: 8 ordinary differential equations
(3 for the time-varying volumes, 5 for the bulk aroma com-
pound concentrations) and 4 algebraic equations for the
interfacial concentrations. These equations were solved nu-
merically using the Matlab 7 simulation software (The Math-Works, Natick, MA).
The parameter values required for model simulation are
listed in Table 1. These parameters are related either 1) to
the product (e.g., initial aroma compound concentrations,
air/product equilibrium partition coefficients), 2) to the con-
sumer anatomy and physiology (such as the volumes of the
compartments, saliva and airflow rates, durations of the var-
ious steps of the deglutition process), or 3) to the interactionof both (e.g., residual amounts of the product, mass transfer
coefficients, and product–air contact areas are expected to
depend both on product rheology and on the mouth and
pharynx configuration and movement). The values for these
parameters were selected as explained below.
The initial concentrations of the aroma compounds in the
product were given by the product flavoring protocol, as de-
scribed in the experimental section. The air/product partitioncoefficientsKAPweremeasuredspecifically for eacharomacom-
pound/product couple by the nonlinear phase ratio variation
technique (Ettre et al. 1993; Atlan et al. 2006). The volume of
the product introduced in the oral cavity VOPM was fixed by
theexperimentalprotocolto5cm3(volumecontainedinaspoon)
and corresponded to a realistic amount, even if one can notice
a wide range of values used in swallowing studies (Shaw et al.
2004; Linforth et al. 2005; Stephen et al. 2005; Seta et al. 2006).Concerning the physiological parameters, the total free
volume of the oral cavity was estimated at about 10 cm3
by spit-out experiments with water, in accordance with liter-
ature data (Lauder andMuhl 1991; Kahrilas et al. 1993). The
maximum air volume VOAM was taken as the difference with
the product volume. The residual (minimum) air volume in
the oral cavity VOAm was arbitrarily set to 1/100 of this
value. The pharynx geometry (maximum volume, surfacearea, and contact area with the mouth) was estimated using
an anatomic atlas (Netter 2004), and literature data obtained
by biplane videofluoroscopy (Kahrilas et al. 1993). The vol-
ume of the nasal cavityVNAwas set to a typical value accord-
ing to Damm et al. (2002), even if very high interindividual
variations were observed. Hodgson et al. (2003) also speci-
fied that volume of the retronasal pathway involved in aroma
release could be different depending on the process (swal-lowing ormastication). The saliva flow rateQS wasmeasured
at rest for the considered panelists and fixed to an average
value. The duration of the first step (s1) of the product con-sumption cycle was determined in each case by recording the
swallowing events. The durations of the other deglutition
steps (s2, s3, and s4 for steps 2, 3, and 4, respectively) were
estimated by considering the description of the physiology of
swallowing (Buettner et al. 2001) and the total duration ofa swallowing act (Hiss et al. 2001) and were in agreement
with the data of Dodds (1989) and Kahrilas et al. (1993).
Model for In Vivo Aroma Release 7
by guest on February 6, 2015http://chem
se.oxfordjournals.org/D
ownloaded from
As regards parameters dependent on both the product and
the eating process, the surface area of the mouth AOAP, and
the residual product volume in the mouth after deglutition
VOPm were measured by Collins andDawes (1987). Bogaardt
et al. (2007) estimated the residual volume of product in thepharynx (VFP) to about 2% of the initial volume introduced
in mouth (which would give 0.1 cm3 here) and highlighted
that it was weakly dependent on product viscosity. We ini-
tially estimated this parameter (VFP) at 0.3 cm3 by assuming
a similar amount per unit area as in the mouth (Collins and
Dawes 1987). It was then reduced to 0.1 cm3 to account for
the observed aroma persistence signal. This seems reasonable
taking into account the lack of ‘‘dead’’ volumes in the phar-ynx as compared with the ones in mouth (between teeth,
under the tongue, etc.). The interfacial mass transfer coeffi-
cients in the product (kP) and in the air (kA and kFOA) are
known to have relatively similar values for various molecules
and were set to usual values according to Marin et al. (1999)
and Cussler (1997).
It should be noted, however, that most of these parameters
are subject to strong interindividual variations and are inmany cases only crude estimations. The effects of these
parameters onmodel predictions were examined as described
in the Results in order to determine those on which addi-
tional experimental efforts should be concentrated.
Results
Typical results
With the considered experimental setup, the only model pre-
diction that could be validated against measured data was
the relative concentration of the target aroma compounds
in the nose space of the subjects. This concentration was con-
sidered because of its relevance to aroma perception. A typ-
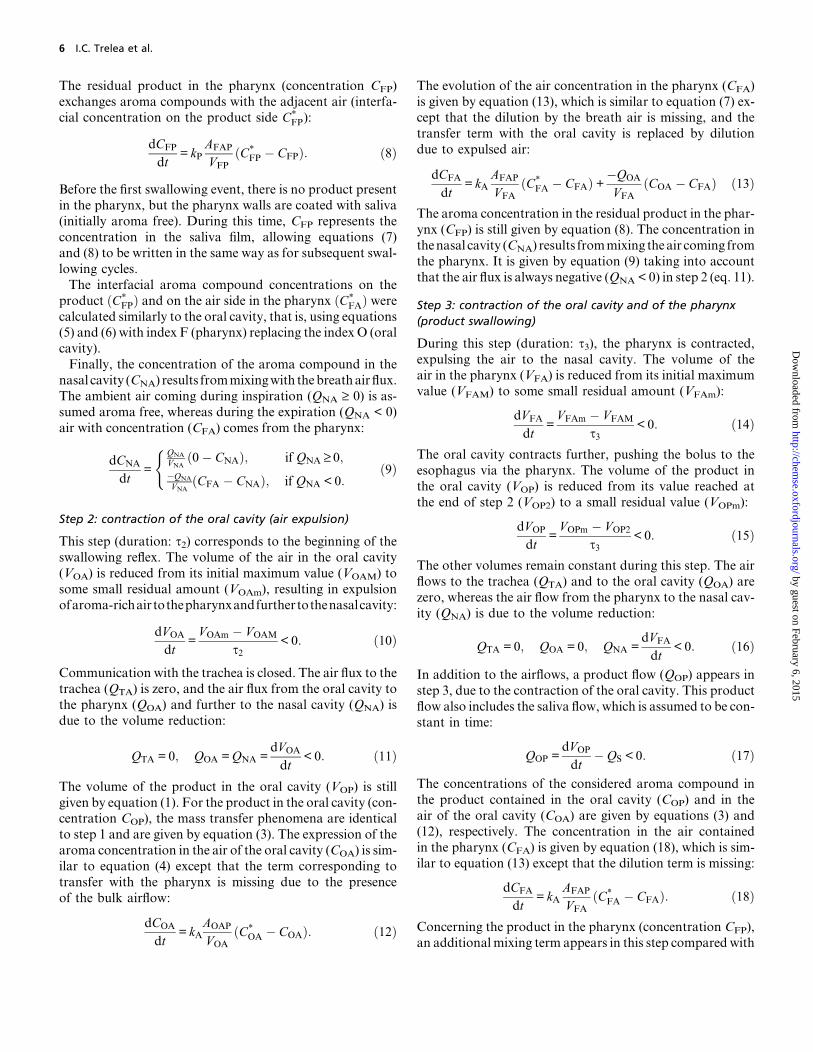
ical result of a model simulation is shown in Figure 3.Agreement with the measured nose-space concentration is
reasonably good, taking into account the simplifying mod-
eling assumptions versus the complexity of the oropharynx
anatomy and of the swallowing physiology. It is worth no-
ticing that similar adequacy between experimental release ki-
netics in the nasal cavity and model simulations was
observed for all panelists, aroma compounds, and products
studied. It appears in Figure 3 that aroma compound con-centration in the nasal cavity of the subject is very low before
the first deglutition event (step 1 of the model), denoting al-
most perfect closure of the velopharynx while the product is
kept in the mouth (for this particular experiment). A sharp
increase of this concentration occurs immediately after the
first swallow: both the expulsion of an aroma-rich air from
the oral cavity (step 2) and the quick increase of the volatile
concentration in the pharynx due to the product flow towardthe esophagus (step 3) can explain this release peak. The
aroma concentration in the nasal cavity gradually decreases
until the next deglutition event: the small residual amount of
the product present in the pharynx continues to release
aroma compound but this concentration is continuously di-
luted by the airflow (Normand et al. 2004). Subsequent swal-
lows increase aroma concentration in the nasal cavity but to
a much lesser extent than the first swallow because of the re-
sidual product dilution by the saliva in the oral cavity.
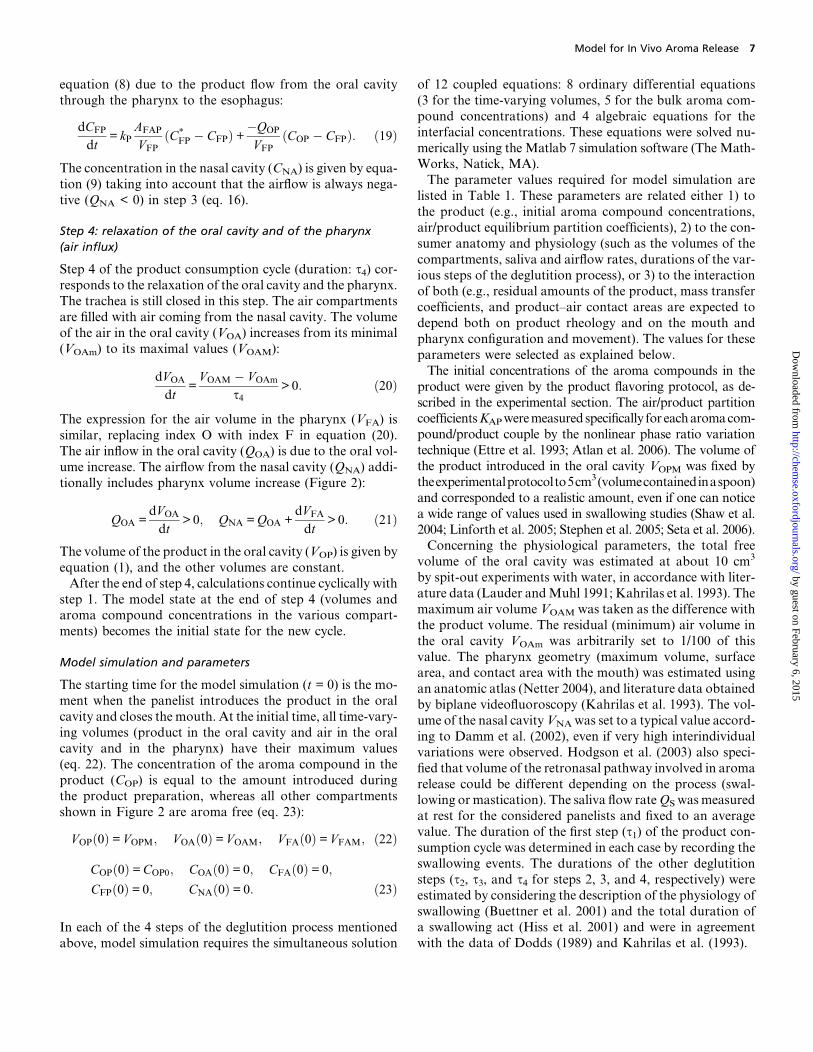
To illustrate the way the model integrates the considered
physiological and mass transfer mechanisms, representationof additional calculated variables is given in Figure 4. The
product volume in the oral cavity (VOP) (Figure 4A) gradu-
ally increases between swallows due to permanent saliva flow
and decreases abruptly to a small residual value at each swal-
lowing time. The saliva flow also induces the dilution of the
aroma compound in the product: its concentration (COP)
decreases slowly when the amount of the product is high
and faster after each swallow, when the total amount ofthe product becomes smaller (Figure 4C). The air volume
in the oral cavity VOA is essentially constant, except during
the contraction of the oral cavity in the swallowing reflex
(Figure 4B). The air volume in the pharynx has similar var-
iations (data not shown). The volatile concentration in the
air contained in the oral cavity (COA) increases between swal-
lows due to mass transfer from the product to the gaseous
phase and decreases quickly immediately after the swallowsbecause of the fresh air intake during the relaxation of the
oral cavity (Figure 4D). The aroma compound concentra-
tion in the product present in the pharynx (CFP) is null before
the first swallowing event. The flow of aroma-rich product
from the mouth at each swallow induces a sharp increase
in this concentration (Figure 4E). Between swallows, this
concentration decreases gradually, the volatile compound
being transferred from the product toward the air and sweptout by the breath airflow. As expected, the aroma compound
concentration in the product present in the pharynx after
0 10 20 30 40 50 60 70 80-1000
-500
0
500
1000
Bre
ath
flow
rat
e (
cm3 /
s)
0
20
40
60
80
100
120
time (s)
Rel
ativ
e na
sal c
once
ntra
tion
( )
Figure 3 Example of model validation in a typical situation. Release of ethylacetate in the nasal cavity of panelist A during the consumption of CAS yo-gurt. Measured (�) and simulated (— bold) relative aroma compound concen-tration in the nasal cavity, breath flow rate (— thin), and deglutition events (j).
8 I.C. Trelea et al.
by guest on February 6, 2015http://chem
se.oxfordjournals.org/D
ownloaded from

each swallowing event is equal to the concentration in the
product leaving the oral cavity. The volatile concentration
profile in the air contained in the pharynx (CFA) (Figure 4F)is roughly similar to the one in the nasal cavity (Figure 3).
However, concentration variations in the pharynx are faster
because of a highest dilution effect by the breath airflow, the
volume of the pharynx being smaller than that of the nasal
cavity.
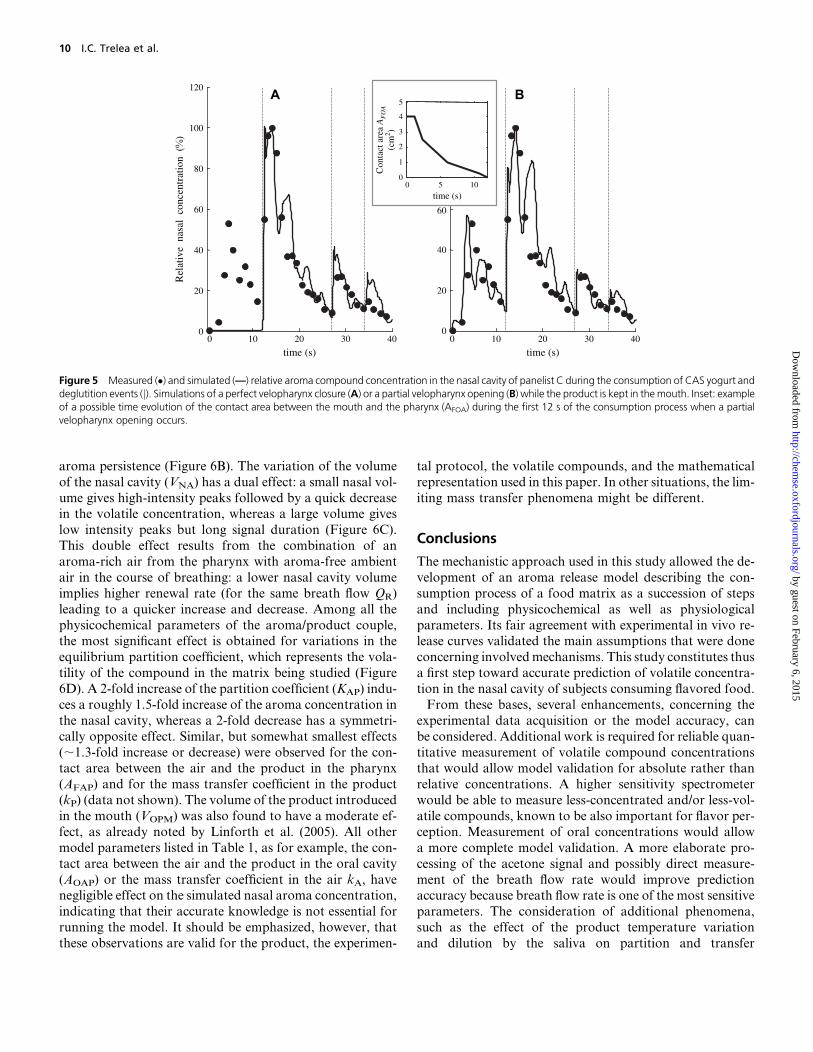
Imperfect closure of the velopharynx
Velopharynx closure while keeping the product in the mouth
can be more or less tight, depending on experiments, on indi-
viduals, and on product texture (Buettner et al. 2002). Imper-
fect closure can result in an additional aroma release from
the oral cavity. This phenomenon is mostly visible before
the first swallowing event, as illustrated in Figure 5 for pan-elist C. As the airflow between the oral cavity and the phar-
ynx (QOA) is assumed to be null during the first step,
imperfect closure is represented in the model by a nonzero
contact area between the oral cavity and the pharynx. Its
evolution with time during the first 12 s of the eating process
was represented in the inset in the Figure 5. This contact area
can actually account for the observed aroma release to the
nasal cavity before the first deglutition (additional releasepeaks before 12 s in Figure 5B). Yet, comparison of Figures
5A,B reveals that this partial velopharynx opening has rel-
atively little effect on the subsequent release.
Parameter effect on model predictions
The presented mechanistic model contains a large number of
parameters, some of which being poorly known, difficult to
measure experimentally, and/or subject to significant inter-
individual variability. The importance of these parameters
for the prediction of the aroma concentration in the nasal
cavity was assessed. The goal was to determine those on
which future experimental effort should be concentrated
in order to improve prediction accuracy and those for whichorder of magnitude estimations would be sufficient. Each
model parameter listed in Table 1 was varied (2-fold decrease
or increase). To avoid the masking effect of the relative con-
centration representation adopted so far, the normalization
coefficient used to convert absolute concentrations in the na-
sal cavity to relative ones was always kept constant when
varying any given parameter. As expected, the initial concen-
tration of the aroma compound in the product has a propor-tional effect on the aroma concentration in the nasal cavity
and is not discussed further. Only the most influent model
parameters on the nasal aroma concentration are illustrated
in Figure 6 and described next.
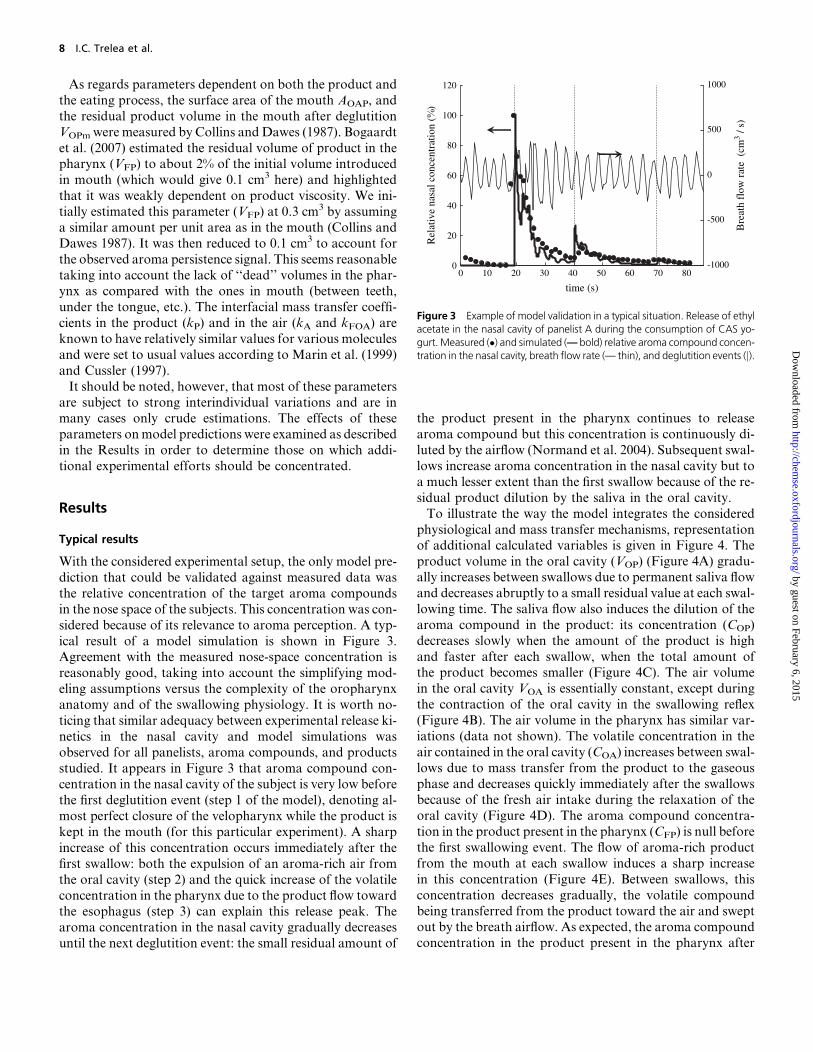
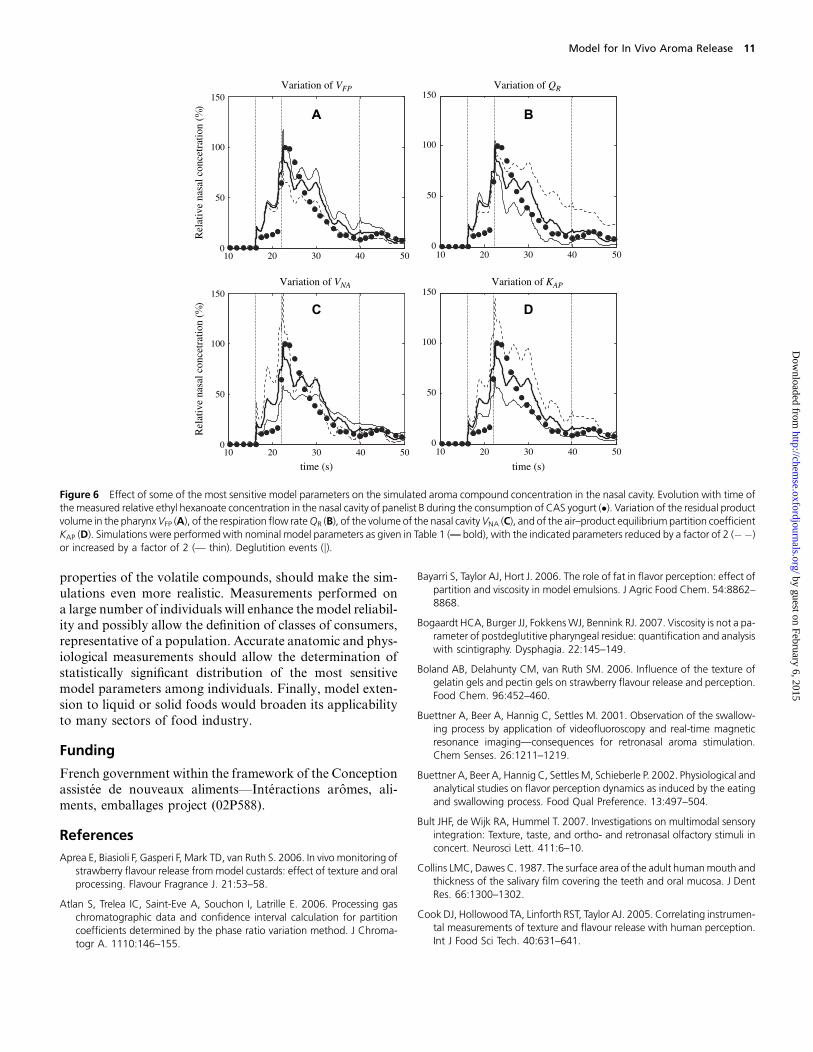
The reduction of the residual product volume in the phar-
ynx (VFP) accelerates the volatile compound depletion by the
breath flow rate (QR), whereas its increase induces a longer
persistence effect (Figure 6A). Variation of the breath flowrate (QR) has an even strongest but opposite effect, as could
be expected: the lowest the breath flow rate, the highest the
0 50 1000
5
10Product vol. in oral cav.VOP
A
cm3
0 50 1000
5
10Air vol. in oral cav.VOA
B
cm3
0 50 1000
20
40
µg /
cm3
Product conc. in oral cav.COP
C
0 50 1000
0.1
0.2Air conc. in oral cav.COA
D
0 50 1000
10
20
time (s)
Product conc. in pharynx CFP
E
µg /
cm3
0 50 1000
0.01
0.02
time (s)
Air conc. in pharynx CFA
F
µg /
cm3
µg /
cm3
Figure 4 Example of calculated evolutions of volumes and aroma compound concentrations in different compartments. Data for ethyl acetate, yogurt CAS,and panelist A. Simulated values (—) and deglutition events (j). Product (A) and air (B) volumes in the oral cavity, product (C), and air (D) concentrations of thevolatile compound in the oral cavity, product (E), and air (F) concentrations of the volatile compound in the pharynx.
Model for In Vivo Aroma Release 9
by guest on February 6, 2015http://chem
se.oxfordjournals.org/D
ownloaded from
aroma persistence (Figure 6B). The variation of the volume
of the nasal cavity (VNA) has a dual effect: a small nasal vol-
ume gives high-intensity peaks followed by a quick decreasein the volatile concentration, whereas a large volume gives
low intensity peaks but long signal duration (Figure 6C).
This double effect results from the combination of an
aroma-rich air from the pharynx with aroma-free ambient
air in the course of breathing: a lower nasal cavity volume
implies higher renewal rate (for the same breath flow QR)
leading to a quicker increase and decrease. Among all the
physicochemical parameters of the aroma/product couple,the most significant effect is obtained for variations in the
equilibrium partition coefficient, which represents the vola-
tility of the compound in the matrix being studied (Figure
6D). A 2-fold increase of the partition coefficient (KAP) indu-
ces a roughly 1.5-fold increase of the aroma concentration in
the nasal cavity, whereas a 2-fold decrease has a symmetri-
cally opposite effect. Similar, but somewhat smallest effects
(;1.3-fold increase or decrease) were observed for the con-tact area between the air and the product in the pharynx
(AFAP) and for the mass transfer coefficient in the product
(kP) (data not shown). The volume of the product introduced
in the mouth (VOPM) was also found to have a moderate ef-
fect, as already noted by Linforth et al. (2005). All other
model parameters listed in Table 1, as for example, the con-
tact area between the air and the product in the oral cavity
(AOAP) or the mass transfer coefficient in the air kA, havenegligible effect on the simulated nasal aroma concentration,
indicating that their accurate knowledge is not essential for
running the model. It should be emphasized, however, that
these observations are valid for the product, the experimen-
tal protocol, the volatile compounds, and the mathematical
representation used in this paper. In other situations, the lim-
iting mass transfer phenomena might be different.
Conclusions
The mechanistic approach used in this study allowed the de-
velopment of an aroma release model describing the con-
sumption process of a food matrix as a succession of steps
and including physicochemical as well as physiological
parameters. Its fair agreement with experimental in vivo re-lease curves validated the main assumptions that were done
concerning involvedmechanisms. This study constitutes thus
a first step toward accurate prediction of volatile concentra-
tion in the nasal cavity of subjects consuming flavored food.
From these bases, several enhancements, concerning the
experimental data acquisition or the model accuracy, can
be considered. Additional work is required for reliable quan-
titative measurement of volatile compound concentrationsthat would allow model validation for absolute rather than
relative concentrations. A higher sensitivity spectrometer
would be able to measure less-concentrated and/or less-vol-
atile compounds, known to be also important for flavor per-
ception. Measurement of oral concentrations would allow
a more complete model validation. A more elaborate pro-
cessing of the acetone signal and possibly direct measure-
ment of the breath flow rate would improve predictionaccuracy because breath flow rate is one of the most sensitive
parameters. The consideration of additional phenomena,
such as the effect of the product temperature variation
and dilution by the saliva on partition and transfer
0 10 20 30 400
20
40
60
80
100
120
time (s) time (s)
Rel
ativ
e n
asal
con
cent
ratio
n (
)
0 10 20 30 400
20
40
60
80
100
120A B
0 5 100
1
2
3
4
5
Con
tact
are
a A
FO
A(c
m2 )
time (s)
Figure 5 Measured (�) and simulated (—) relative aroma compound concentration in the nasal cavity of panelist C during the consumption of CAS yogurt anddeglutition events (j). Simulations of a perfect velopharynx closure (A) or a partial velopharynx opening (B) while the product is kept in themouth. Inset: exampleof a possible time evolution of the contact area between the mouth and the pharynx (AFOA) during the first 12 s of the consumption process when a partialvelopharynx opening occurs.
10 I.C. Trelea et al.
by guest on February 6, 2015http://chem
se.oxfordjournals.org/D
ownloaded from
properties of the volatile compounds, should make the sim-
ulations even more realistic. Measurements performed on
a large number of individuals will enhance the model reliabil-ity and possibly allow the definition of classes of consumers,
representative of a population. Accurate anatomic and phys-
iological measurements should allow the determination of
statistically significant distribution of the most sensitive
model parameters among individuals. Finally, model exten-
sion to liquid or solid foods would broaden its applicability
to many sectors of food industry.
Funding
French government within the framework of the Conceptionassistee de nouveaux aliments—Interactions aromes, ali-
ments, emballages project (02P588).
References
Aprea E, Biasioli F, Gasperi F, Mark TD, van Ruth S. 2006. In vivo monitoring ofstrawberry flavour release from model custards: effect of texture and oralprocessing. Flavour Fragrance J. 21:53–58.
Atlan S, Trelea IC, Saint-Eve A, Souchon I, Latrille E. 2006. Processing gaschromatographic data and confidence interval calculation for partitioncoefficients determined by the phase ratio variation method. J Chroma-togr A. 1110:146–155.
Bayarri S, Taylor AJ, Hort J. 2006. The role of fat in flavor perception: effect ofpartition and viscosity in model emulsions. J Agric Food Chem. 54:8862–8868.
Bogaardt HCA, Burger JJ, FokkensWJ, Bennink RJ. 2007. Viscosity is not a pa-rameter of postdeglutitive pharyngeal residue: quantification and analysiswith scintigraphy. Dysphagia. 22:145–149.
Boland AB, Delahunty CM, van Ruth SM. 2006. Influence of the texture ofgelatin gels and pectin gels on strawberry flavour release and perception.Food Chem. 96:452–460.
Buettner A, Beer A, Hannig C, Settles M. 2001. Observation of the swallow-ing process by application of videofluoroscopy and real-time magneticresonance imaging—consequences for retronasal aroma stimulation.Chem Senses. 26:1211–1219.
Buettner A, Beer A, Hannig C, SettlesM, Schieberle P. 2002. Physiological andanalytical studies on flavor perception dynamics as induced by the eatingand swallowing process. Food Qual Preference. 13:497–504.
Bult JHF, de Wijk RA, Hummel T. 2007. Investigations on multimodal sensoryintegration: Texture, taste, and ortho- and retronasal olfactory stimuli inconcert. Neurosci Lett. 411:6–10.
Collins LMC, Dawes C. 1987. The surface area of the adult humanmouth andthickness of the salivary film covering the teeth and oral mucosa. J DentRes. 66:1300–1302.
Cook DJ, Hollowood TA, Linforth RST, Taylor AJ. 2005. Correlating instrumen-tal measurements of texture and flavour release with human perception.Int J Food Sci Tech. 40:631–641.
10 20 30 40 500
50
100
150
Rel
ativ
e na
sal c
once
trat
ion
( )
Variation of VFP
A
10 20 30 40 500
50
100
150Variation of QR
B
10 20 30 40 500
50
100
150Variation of KAP
time (s)
D
Rel
ativ
e na
sal c
once
trat
ion
( )
10 20 30 40 500
50
100
150Variation of VNA
C
time (s)
Figure 6 Effect of some of the most sensitive model parameters on the simulated aroma compound concentration in the nasal cavity. Evolution with time ofthe measured relative ethyl hexanoate concentration in the nasal cavity of panelist B during the consumption of CAS yogurt (�). Variation of the residual productvolume in the pharynxVFP (A), of the respiration flow rateQR (B), of the volume of the nasal cavityVNA (C), and of the air–product equilibrium partition coefficientKAP (D). Simulations were performed with nominal model parameters as given in Table 1 (— bold), with the indicated parameters reduced by a factor of 2 (��)or increased by a factor of 2 (— thin). Deglutition events (j).
Model for In Vivo Aroma Release 11
by guest on February 6, 2015http://chem
se.oxfordjournals.org/D
ownloaded from
Cussler EL. 1997 Diffusion: mass transfer in fluid systems. Cambridge:Cambridge University Press.
Damm M, Vent J, Schmidt M, Theissen P, Eckel HE, Lotsch J, Hummel T.2002. Intranasal volume and olfactory function. Chem Senses. 27:831–839.
Dodds WJ. 1989. The physiology of swallowing. Dysphagia. 3:171–178.
Ettre LS, Welter C, Kolb B. 1993. Determination of gas-liquid partition coef-ficients by automatic equilibrium headspace gas chromatography utilisingthe phase ratio variation method. Chromatographia. 35:73–84.
Hansson A, Giannouli P, vanRuth S. 2003. The Influence of gel strength onaroma release from pectin gels in a model mouth and in vivo, monitoredwith proton-transfer-reaction mass spectrometry. J Agric Food Chem.51:4732–4740.
Harrison M. 1998. Effects of breathing and saliva flow on flavor release fromliquid foods. J Agric Food Chem. 46:2727–2735.
Harrison M, Campbell S, Hills BP. 1998. Computer simulation of flavorrelease from solid foods in the mouth. J Agric Food Chem. 46:2736–2743.
Hiss SG, Treole K, Stuart A. 2001. Effects of age, gender, bolus volume, andtrial on swallowing apnea duration and swallow/respiratory phase rela-tionships of normal adults. Dysphagia. 16:128–135.
Hodgson M, Linforth RST, Taylor AJ. 2003. Simultaneous real-time measure-ments of mastication, swallowing, nasal airflow and aroma release.J Agric Food Chem. 51:5052–5057.
Hodgson M, Parker A, Linforth RST, Taylor AJ. 2004. In vivo studies on thelong-term persistence of volatiles in the breath. Flavour FragranceJ. 19:470–475.
Kahrilas PJ, Lin SZ, Logemann JA, Ergun GA, Facchini F. 1993. Deglutitivetongue action—volume accommodation and bolus propulsion. Gastroen-terology. 104:152–162.
King BM, Arents P, Bouter N, Duineveld CAA, Meyners M, Schroff SI, SoekhaiST. 2006. Sweetener/sweetness-induced changes in flavor perception andflavor release of fruity and green character in beverages. J Agric FoodChem. 54:2671–2677.
Lauder R, Muhl ZF. 1991. Estimation of tongue volume from magnetic res-onance imaging. Angle Orthod. 61:175–184.
Lian G, Malone ME, Homan JE, Norton IT. 2004. A mathematical model ofvolatile release in mouth from the dispersion of gelled emulsion particles.J Control Release. 98:139–155.
Linforth R, Taylor AJ. 2000. Persistence of volatile compounds in the breathafter their consumption in aqueous solutions. J Agric Food Chem.48:5419–5423.
Linforth RST, Blissett A, Taylor AJ. 2005. Differences in the effect of bolusweight on flavor release into the breath between low-fat and high-fatproducts. J Agric Food Chem. 53:7217–7221.
Linforth RST, Martin F, Carey M, Davidson J, Taylor AJ. 2002. Retronasal trans-port of aroma compounds. J Agric Food Chem. 50:1111–1117.
Marin M, Baek I, Taylor AJ. 1999. Volatile release from aqueous solutions un-der dynamic headspace dilution conditions. J Agric Food Chem. 47:4750–4755.
Netter F. 2004. Atlas d’anatomie humaine. Paris (France): Masson.
Normand V, Avison S, Parker A. 2004. Modelling of the kinetics of flavourrelease during drinking. Chem Senses. 29:235–245.
Saint-Eve A, Levy C, Martin N, Souchon I. 2006. Influence of proteins on theperception of flavored stirred yogurts. J Dairy Sci. 89:922–933.
Saint-Eve A, Martin N, Guillemin H, Semon E, Guichard E, Souchon I. 2006.Flavored yogurt complex viscosity influences real-time aroma release inthe mouth and sensory properties. J Agric Food Chem. 54:7794–7803.
Seta H, Hashimoto K, Inada H, Sugimoto A, Abo M. 2006. Laterality ofswallowing in healthy subjects by AP projection using videofluoroscopy.Dysphagia. 21:191–197.
Shaw DW, Williams RBH, Cook IJ, Wallace KL, Weltman MD, Collins PJ,McKay E, Smart R, Simula ME. 2004. Oropharyngeal scintigraphy: a reli-able technique for the quantitative evaluation of oral-pharyngeal swal-lowing. Dysphagia. 19:36–42.
Stephen JR, Taves DH, Smith RC, Martin RE. 2005. Bolus location at theinitiation of the pharyngeal stage of swallowing in healthy older adults.Dysphagia. 20:266–272.
Van Loon WAM, Linssen JPH, Boelrijk AEM, Burgering MJM, Voragen AGJ.2005. Real-time, flavor release from French fries using atmospheric pres-sure chemical ionization-mass spectrometry. J Agric Food Chem. 53:6438–6442.
Wilson HK. 1986. Breath analysis. Physiological basis and sampling techni-ques. Scan J Work Environ Health. 13:174–192.
Wright KM, Hills BP. 2003. Modelling flavour release from a chewed bolus inthe mouth: Part II. The release kinetics. Int J Food Sci Tech. 38:361–368.
Wright KM, Hills BP, Hollowood TA, Linforth RST, Taylor AJ. 2003. Persistenceeffects in flavour release from liquids in the mouth. Int J Food Sci Tech.38:343–350.
Wright KM, Sprunt J, Smith AC, Hills BP. 2003. Modelling flavour release froma chewed bolus in the mouth: Part I. Mastication. Int J Food Sci Tech.38:351–360.
Accepted October 18, 2007
12 I.C. Trelea et al.
by guest on February 6, 2015http://chem
se.oxfordjournals.org/D
ownloaded from
Related Documents