Mechanistic Biomarkers in Acute Liver Injury By © 2017 James L. Weemhoff D.V.M., Kansas State University, 2007 B.S., University of New Hampshire, 1999 Submitted to the graduate degree program in Pharmacology, Toxicology, and Therapeutics and the Graduate Faculty of the University of Kansas in partial fulfillment of the requirements for the degree of Doctor of Philosophy. Committee Chair: Hartmut Jaeschke, PhD Udayan Apte, PhD Wen-Xing Ding, PhD Michele Pritchard, PhD John Wood, PhD Date Defended: 27 October 2017

Welcome message from author
This document is posted to help you gain knowledge. Please leave a comment to let me know what you think about it! Share it to your friends and learn new things together.
Transcript

Mechanistic Biomarkers in Acute Liver Injury By
© 2017
James L. Weemhoff
D.V.M., Kansas State University, 2007
B.S., University of New Hampshire, 1999
Submitted to the graduate degree program in Pharmacology, Toxicology, and Therapeutics and
the Graduate Faculty of the University of Kansas in partial fulfillment of the requirements for the
degree of Doctor of Philosophy.
Committee Chair: Hartmut Jaeschke, PhD
Udayan Apte, PhD
Wen-Xing Ding, PhD
Michele Pritchard, PhD
John Wood, PhD
Date Defended: 27 October 2017

ii
The dissertation committee for James L. Weemhoff, DVM certifies that
this is the approved version of the following dissertation:
Mechanistic Biomarkers in Acute Liver Injury
Committee Chair: Hartmut Jaeschke, PhD
Date Approved: 27 October 2017

iii
ABSTRACT:
Acute liver failure continues to be a major medical problem. There are many underlying causes of
acute liver failure, but drug induced liver injury is the most common. However, ischemic injury
secondary to either liver transplantation or hypoxic hepatitis are also commonly encountered
clinically. While the pathogenesis of some etiologies of liver failure are well known due to
appropriate animal and cell culture models (i.e. acetaminophen toxicity), that of ischemic injury is
not as well documented. A major reason for this is the lack of appropriate animal models available
to recapitulate these conditions in humans. Furthermore, obtaining multiple liver biopsies to study
these conditions at the cellular level is generally not possible owing, in part, to the invasive nature
of obtaining the sample, but also to the fact that liver biopsies are contraindicated in acute liver
injury patients. Thus, alternative methods which can help diagnose and study liver injury are being
explored and refined. Among these methods are the use of circulating biomarkers, which are
currently being extensively explored in the field of hepatology. Because biologic specimens in
which these biomarkers are being measured can be easily obtained and are non-invasive, they offer
a promising means by which to study liver injury, particularly for prolonged periods of time.
Indeed, a series of blood collections can provide vital information into various injury-specific
aspects of liver pathophysiology including mode of cell death, mitochondrial involvement, degree
of liver injury, and presence or absence of a sterile inflammatory component to the injurious
process.
Here, we use a well-established set of circulating plasma biomarkers to study the pathophysiology
of both warm and cold ischemia to better characterize the cellular events which take place during
these conditions. Data obtained demonstrates that during both warm and cold ischemia, the
majority of injury occurs early in the reperfusion period and that necrosis, rather than apoptosis

iv
predominates. Furthermore, we identified the mitochondria as critical mediators of liver injury
following ischemia. However, we were unable to find evidence of an inflammatory component of
ischemic injury. Furthermore, we conclude that due to advances in surgical technique and organ
preservation strategies, future efforts to study injury secondary to liver transplantation should focus
on the biliary system and the formation of biliary strictures rather than ischemic injury.
HepaRG cells are a human hepatoma cell line which is commonly used in the laboratory. Unlike
other liver cell lines, HepaRG cells have a full complement of drug metabolizing enzymes, making
them ideal for the study of drug induced liver injury. However, growth, maintenance, and
differentiation of conventional HepaRG cells is a timely process. Recently, this lengthy process
has been dramatically shortened with the advent of pre-differentiated cryopreserved HepaRG cells.
Due to the frequency of acetaminophen toxicity, combined with the fact that liver injury is the
most common cause of drug failure and market withdrawal, we set out to compare these two
preparations of HepaRG cells. Using acetaminophen as a test substrate, we found both preparations
of HepaRG to be similar in all aspects of acetaminophen metabolism. This finding will help
advance the study of acetaminophen, as well as help identify idiosyncratic adverse drug reactions
earlier in the drug development process.

v
WITH GRATITUDE AND APPRECIATION…
To my beloved wife, and best friend, Kara…
Though at times it seemed as if this day would never come, you have been my most steadfast supporter
since the beginning - from the early hours of that fateful morning in the ER working on ‘Skid Roadie’ until
now, you’ve never given up on me. Given my ‘love’ of cats, I find it hilarious that it was a cat which brought
us together! Since that point, you have challenged me to be a better person, husband, and father. While at
times I’ve fallen short of my goals in those areas, you’ve always understood and supported me with patience
and grace and I couldn’t have done this without you.
To my beautiful children, Sloane, Quinn, and Landon…
I am blessed to have such amazing kids. Your smiling faces and giant hugs softened my hardened heart.
Your sense of curiosity and wonder never cease to amaze me and I hope you continue to find joy in the
small things in life. I look forward to watching you grow up to become the amazing women and man I know
you will be.
To my parents, Deborah Mincu and James Weemhoff, and my step-parents, Anthony Mincu and Terry
Weemhoff…
While my journey to arrive at this point has been anything but a direct flight, you have been there at every
layover to provide moral support and to encourage me to never give up. Your influence in my life goes well
beyond this and I am, and always will be, forever grateful to have such amazing and supporting parents.
You have taught me to be ‘gently tenacious’ in pursuit of my goals and I wouldn’t have made it this far
without your support. I look forward to sharing the challenges and joys of the next chapter of my life with
you. While my next layover doesn’t seem to involve astronaut candidate school, I’m not going to give up
on that dream either!

vi
To Drs. Hartmut Jaeschke and Mary Lynn Bajt-Jaeschke…
It is sometimes said, “it’s better to be lucky than good”, and I was extremely lucky to find a place in your
laboratory. I will be forever grateful for the opportunity to transfer to KUMC and work under your guidance
and mentorship. You taught me an immeasurable amount about science, the scientific process, and how to
succeed as a scientist. Your influence goes well beyond teaching in the laboratory and I am deeply
appreciative of all you have both done for me. As a new student, you welcomed me into the lab as if I had
been there for years and treated me and my family as an extension of your own. From scientific and hilarious
not-so-scientific discussions in the office, to Pictionary at Christmas parties it has been a pleasure and honor
working with you and I will forever be in your debt for the chances you have given me. As I move forward,
I will do so knowing that you have set the foundation for success and I hope to demonstrate that I was
worthy of the leaps of faith you took on my behalf.
To my committee members, Drs. Apte, Ding, Pritchard, Wood, and Kumer…
I am lucky to have such a well-rounded group of scientists to keep me pointed in the right direction when I
got off track. You have been invaluable in offering insight into all aspects of my project. I’ve enjoyed our
formal committee meetings and impromptu hallway discussions. I am more deeply appreciative of your
support than you’ll ever know.
To Dr. Steven Weinman, Brian Bridges, the Liver Center and the OR and TICU staff…
Thank you for your endless hours of assistance in patient recruitment and sample procurement. A special
thank you to Brian Bridges for his assistance in data mining and compiling patient reports. From initial
concept to sample procurements, your efforts were instrumental in making the transplant project a reality.

vii
To my fellow lab mates, past and present…
Drs. Dave Williams, Mitch McGill, Benjamin Woolbright, Yuchao Xie, and Kuo Du, as well as Luqi Duan,
Jephte Akakpo, and Margitta Lebofsky. It has been an honor to work with you all. I couldn’t have asked
for a better group of students to work with. Through your hard work and dedication, you have set the bar
by which to compare myself – and what a bar it is! Despite your success and hectic schedules, you’ve
always found time to answer my questions, even the last-minute questions before my presentations (Mitch)!
I will always remember the many thought provoking (and very often laughter-filled) conversations we had
together in the lab. Although many of you have gone on to start your careers, I wish the rest of you the best
in your studies and future endeavors.
To (the soon-to-be) Dr. McGreal…
Your friendship has meant so much over the past five years. Equally valuable was your unselfish willingness
to allow me to borrow your tools and rely on your help to fix stuff around my house! Our nearly daily trips
to QT, and discussions and commiserations about life’s trials and tribulations have been both hilarious and
therapeutic. Thanks for always making me laugh and helping to keep things light-hearted.
To my fellow students…
It has been a pleasure getting to know you all on a more personal level throughout these past 5 years and to
experience this academic journey together. I will always have fond memories of our student outings and I
wish you all the best in all your endeavors. I look forward to seeing you in the future at conferences and
hearing about your many successes!
To Cody, Elizabeth, and the entire Departmental staff…
Thank you so very much for your hard work in keeping things organized to ensure that I enrolled when I
needed to enroll, and that I had committee meetings when I needed them. If not for your organizational

viii
skills, I’d likely still be planning my first committee meeting! Thank you also for organizing departmental
social events which helped bring everyone together and convey a sense of family within the department.
To all my professors (past and present)…
From my undergraduate studies through veterinary school and through KUMC, I am fortunate to have had
such dedicated professors who have challenged me at each step of the way, and encouraged independent
thought and exploration. A special thanks to Dr. Joseph Moore for his guidance and mentorship in pursuit
of my veterinary degree, and to Dr. Paul Tsang whose willingness to join his laboratory was instrumental
in sparking my interest in research.
To Mrs. Edith Tatulis, my 8th grade science teacher…
It’s been a long time since I’ve sat in your classroom, and nearly just as long since you were my mentor for
the UNH Math and Marine Science Program. I have never forgotten or stopped appreciating your
willingness to be my mentor for that program. You piqued my initial interest in science and if it weren’t for
you, who knows where I’d be now.
To Dr. Larry L., Dr. George H., and Brian G….
I am so lucky to have crossed paths with you all. You have given me hope when all hope seemed lost. You
have worked selflessly and endlessly with me to help me become a better person and to do the next right
thing. I look forward to continuing to ‘trudge the path of happy destiny’ with you all.

ix
DEDICATED TO….
…my parents,
Deborah Mincu and James H. Weemhoff
…my step parents,
Anthony Mincu and Terry Weemhoff
…my grandparents,
The late Mildred and Lawrence Weemhoff
The late Bernadette Loveland
Collette Mincu
…my wife,
Kara Forsee
…my children,
Sloane, Quinn, and Landon
…my brothers
Jeremy and Joshua
…and all those who have helped along the way!

x
‘Twenty years from now you will be more disappointed by the things that you didn’t do than by
the ones you did do. So throw off the bowlines. Sail away from the safe harbor. Catch the trade
winds in your sails. Explore. Dream. Discover.’
Samuel Langhorne Clemens (Mark Twain)
‘I don’t need to fight to prove I’m right; I don’t need to be forgiven’
Pete Townshend and Roger Daltry, The Who (Baba O’Riley)

xi
TABLE OF CONTENTS
TITLE PAGE ................................................................................................................................... i
ACCEPTANCE PAGE ................................................................................................................... ii
ABSTRACT ................................................................................................................................... iii
WITH GRATITUDE AND APPRECIATION ............................................................................... v
DEDICATED TO .......................................................................................................................... ix
TABLE OF CONTENTS ............................................................................................................... xi
1. INTRODUCTION ................................................................................................................... 1
1.1 ACUTE LIVER INJURY ............................................................................................................. 2
1.2 ISCHEMIA-REPERFUSION INJURY ...................................................................................... 16
1.2.1 INTRODUCTION .............................................................................................................. 16
1.2.2 INFLAMMATION DURING ISCHEMIA-REPERFUSION INJURY ............................. 17
1.2.3 ISCHEMIC INJURY FOLLOWING LIVER TRANSPLANTATION .............................. 18
1.2.4 LIVER INJURY FOLLOWING HYPOXIC HEPATITIS ................................................. 20
1.3 DRUG-INDUCED LIVER INJURY .......................................................................................... 22
2. PLASMA BIOMARKERS OF ISCHEMIA-REPERFUSION INJURY IN HUMAN LIVER
TRANSPLANTATION ................................................................................................................ 26
2.1 INTRODUCTION ............................................................................................................................ 27
2.2 PATIENTS AND METHODS .......................................................................................................... 29
2.3 RESULTS ......................................................................................................................................... 32
2.4 DISCUSSION ................................................................................................................................... 40
3. PLASMA BIOMARKERS TO STUDY MECHANISMS OF LIVER INJURY IN PATIENTS
WITH HYPOXIC HEPATITIS .................................................................................................... 44
3.1 INTRODUCTION ............................................................................................................................ 45
3.2 PATIENTS, MATERIALS AND METHODS ................................................................................. 47
3.3 RESULTS ......................................................................................................................................... 50
4. COMPARISON OF FRESHLY DIFFERENTIATED AND CRYOPRESERVED PRE-
DIFFERENTIATED HEPARG CELLS FOR STUDIES OF ACETAMINOPHEN TOXICITY 71
4.1 INTRODUCTION ............................................................................................................................ 72
4.2 MATERIALS AND METHODS ...................................................................................................... 74
4.3 RESULTS ......................................................................................................................................... 77
4.4 DISCUSSION ................................................................................................................................... 87

xii
5. DISCUSSION AND FUTURE DIRECTIONS ........................................................................ 90
5.1 SUMMARY ...................................................................................................................................... 91
5.2 NOVELTY OF THE USE OF BIOMARKERS TO STUDY ISCHEMIC LIVER INJURY........... 91
5.3 APOPTOSIS VS. NECROSIS IN ISCHEMIC LIVER INJURY ..................................................... 92
5.4 MITOCHONDRIAL INVOLVEMENT IN ISCHEMIC LIVER INJURY ...................................... 94
5.5 INFLAMMATION FOLLOWING ISCHEMIC LIVER INJURY IN HUMANS ........................... 95
5.6 COMPLICATIONS FOLLOWING ORTHOTOPIC LIVER TRANSPLANTATION ................... 98
5.7 UNDIFFERENTIATED VS. PRE-DIFFERENTIATED CRYOPRESERVED HEPARG CELLS
.............................................................................................................................................................. 100
5.8 CONCLUDING REMARKS .......................................................................................................... 103
REFERENCES ........................................................................................................................... 105

1
1. INTRODUCTION

2
1.1 ACUTE LIVER INJURY
1.1.1 Introduction
Acute liver injury (ALI) and acute liver failure (ALF) are clinical syndromes marked by severe
hepatic injury in the absence of pre-existing liver disease. Acute liver injury can develop over a
period of 6 months but often progresses much more rapidly (Lee, 2012). The difference between
ALI and ALF is that with acute liver injury, liver function is maintained while in acute liver failure,
it is not. Consequently, clinical measurements of liver function can easily be used to differentiate
between acute liver injury and acute liver failure. In ALF patients, there is often coagulopathy,
icterus, and altered mentation as a result of compromised liver function (Thawley, 2017; Trotter,
2009). The most common cause of acute liver failure in the United States is acetaminophen
toxicity. Other common causes include ischemic injury secondary to liver transplantation and
hypoxic hepatitis. Regardless of the cause, if left untreated, ALF can be fatal.
1.1.2 Clinical Symptoms of ALF
The liver is the largest organ in the body and serves multiple functions including bile synthesis,
host defense, protein synthesis, biotransformation/detoxification, and metabolic homeostasis.
Therefore, patients with advanced liver failure are at risk for complications resulting from the
inability of the liver to function, most notably coagulopathies and hepatic encephalopathy.
Coagulopathies secondary to liver injury result from disturbances in the synthesis of pro-coagulant
proteins, particularly Factors V and VII (Munoz et al., 2009; Northup and Caldwell, 2013).
Because of the short half-lives of these pro-coagulants, an increase in pro-thrombin test time is
often one of the first clinical signs of acute liver failure (Munoz et al., 2009). Hepatic
encephalopathy results from the injured liver’s inability to convert ammonia into urea (Kodali and

3
McGuire, 2015). Under normal circumstances, gut-derived ammonia is taken up by hepatocytes
and converted to urea. A small amount is also converted to glutamine by the enzyme glutamine
synthetase (Aldridge et al., 2015). During acute liver failure, the ability of the liver to detoxify
ammonia is compromised. As a consequence, ammonia levels raise within the serum and are able
to cross the blood-brain barrier (Kodali and McGuire, 2015). Once in the brain, ammonia is
converted to glutamine by astrocytes, which causes an osmotic pull of fluid from blood vessels
into the extracellular space (Butterworth, 2015; Kodali and McGuire, 2015; Scott et al., 2013). At
lower concentrations, ammonia also has direct effects on both inhibitory and excitatory neurons
leading to altered patient mentation (Butterworth, 2015). Higher levels of ammonia can lead to
cerebral edema, increased intracranial pressure, brain swelling, coma, and death.
There are many biochemical assays commonly used to assess liver injury and function. The most
common markers of injury include alanine and aspartate aminotransferase (ALT and AST,
respectively), cytosolic enzymes which are released upon hepatocyte death. The most common
marker of liver function is bilirubin levels. It is important to remember that markers of liver injury
may remain normal despite significantly decreased function. Conversely, liver function may
remain normal in the face of severe hepatic injury, provided that the number of healthy hepatocytes
are sufficient to carry out normal function. Thus, evaluation of liver injury and function should not
rely on a single marker. Furthermore, these enzymes often provide little information as to the
mechanisms which are occurring at the cellular level. When this information is lacking,
development of additional therapeutics for liver disease cannot be identified. As such, scientists
within the hepatology field have begun to focus their efforts on identification of other markers of
cellular injury and death which may provide additional information regarding mode and
mechanisms of cell death during acute liver injury and failure.

4
1.1.3 Biomarkers in Hepatology
1.1.3.1 Introduction to biomarkers
Some of the first biomarkers of liver injury were the aminotransferases – ALT and AST in 1955
(Karmen et al., 1955). Gamma-glutamyl transferase (GGT) was discovered and adopted into
clinical practice in 1961 (Szczeklik et al., 1961) but since then, very few advances have been made
in the identification of additional biomarkers of liver injury. However, in the previous decade,
much research has been conducted to identify additional biomarkers of organ pathology. Broad
categories of this biomarker research include mechanistic biomarkers, biomarkers of injury,
biomarkers of inflammation, biomarkers of regeneration, and extracellular RNA based biomarkers
specific to the organ in question (McGill, 2016). Drug induced liver injury, viral hepatitis,
hepatocellular carcinoma, and hepatic steatosis appear to be among the most commonly studied
conditions in the hepatology field, but applications in other fields such as transplantation, hypoxic
hepatitis, and biliary diseases have been studied as well. Regardless, it is hypothesized that soon,
the use of these biomarkers in the clinic will become as normal as the use of ALT, either in
conjunction with, or instead of, currently used markers of injury (McGill, 2016). Regardless, there
has been a tremendous amount of useful information gained from this research, particularly
regarding their usefulness in the diagnosis, treatment, management, and prognosis of various
causes of ALF, regardless of the etiology.
The most commonly used method of assessing liver injury in the clinic is ALT levels. However,
ALT is not specific to the liver as it is also found in other tissues such as skeletal muscle and
kidney. Thus, even a moderate increase in ALT may not indicate an injurious process specific to
the liver. Furthermore, measurement of ALT provides little information as to the cellular
mechanism of cell death. This is important because in addition to treatment of the underlying

5
cause, an important approach to treating ALF patients would be to prevent continued hepatocyte
injury and death. Thus, if hepatocytes are dying via necrosis, necrostatins may be used to minimize
cell death. Similarly, if apoptosis predominates, caspase inhibitors could be used as the optimal
treatment modality.
Recent advances in the field of hepatology have identified a reliable set of circulating biomarkers
which can be used to help establish both mode and mechanism of cell death following hepatic
injury. In general, biomarkers can be classified as those of exposure, effect, or susceptibility. For
the purpose of this dissertation, the research described subsequently focuses on biomarkers of
effect – either the effect of a condition (ischemia-reperfusion injury) or the effect of a toxin
(acetaminophen). These biomarkers, discussed in detail below, represent a promising and
convenient method of assessing liver injury in humans following a variety of insults to the liver
when invasive methods (ie: biopsy) are either unavailable or contraindicated. The greatest benefit
to the use of these biomarkers is that they exist in the general circulation, and thus can be evaluated
in peripheral blood.
The bulk of this dissertation will focus on the use of the following mechanistic biomarkers to aid
in the description of the cellular events leading up to liver injury following ischemia-reperfusion
injury secondary to orthotopic liver transplantation (OLT) and hypoxic hepatitis (HH).
1.1.3.2 Biomarkers of Liver Injury
ALT is responsible for the transfer of an amino group from alanine to α-ketoglutarate to form
pyruvate and glutamate and is found in the cytosol of hepatocytes. Alanine aminotransferase
(ALT) and aspartate aminotransferase (AST) are cytosolic enzymes which catalyze the transfer of
alanine, or aspartate, to α-ketoglutarate to form pyruvate and glutamate or oxaloacetate and

6
glutamate, respectively. Though they exist in multiple tissues such as the muscle, kidney, brain,
and red blood cells, their highest concentration is in the liver (Steven Stockham and Michael Scott,
2002). Upon cell death, these cytosolic enzymes are released into the sinusoids and can easily be
measured in the blood. In fact, ALT is considered the gold standard for the measurement of liver
injury clinically (Steven Stockham and Michael Scott, 2002). Despite the sensitivity for liver
injury, ALT and AST have limited specificity for diagnosis of liver injury, particularly at low
levels. In contrast, microRNA-122 (miRNA-122) is liver specific. MicroRNAs are small non-
coding RNAs thought to be formed by the cell as a means to regulate protein expression at a post-
transcriptional level. Importantly, it has been shown that miRNA-122 is a more sensitive marker
for liver injury than ALT, becoming elevated earlier and to a greater degree than ALT (Wang et
al., 2009a). A faster identification of injury following transplantation would allow for a more rapid
response and treatment. MicroRNAs will be discussed in more detail below.
1.1.3.3 Biomarkers of cell death modality
There are many forms of cell death, but the most common are apoptosis and necrosis. Recently,
research has been conducted into the use of circulating biomarkers to differentiate between these
two forms with the need for invasive biopsy procedures. Cytokeratin-18 is one such biomarker.
Cytokeratin-18 is a type 1 intermediate filament protein which is ubiquitous in the cytoplasm of
cells (Omary et al., 2009). Following membrane rupture from oncotic necrosis, cytokeratin-18 is
released in its full-length form (FK18). During apoptosis, however, activated effector caspases
cause cleavage of cytokeratin-18 at aspartic acid #397 (Asp397) along the protein, cleaving it into
to smaller caspase-cleaved fragment (ccK18) and creating a neo-epitope (Leers et al., 1999; Linder
et al., 2010; Omary et al., 2009). Commercially available kits containing antibodies to full-length

7
and caspase-cleaved cytokeratin-18 (ccK18) allowing for the easy quantification of FK18 and
ccK18. In this way, by comparing the ratio of FK18 to ccK18 it is possible to determine which
mode of cell death is predominating at any given point in time. In fact, after subjecting mice to 45
minutes of ischemia followed by various periods of reperfusion, up to 24hr, we found a time
dependent increase in full length cytokeratin-18 which closely correlated with degree of liver
necrosis, as determined histologically, suggesting the primary mode of cell death after IRI is
necrosis (Yang et al., 2014). A study evaluating cytokeratin-18 in humans undergoing liver
transplantation shows that there is an increase in FK18 following transplantation, suggesting that
necrosis predominates following OLT (Ulukaya et al., 2010). However, this study compares the
differences in living donors versus cadaveric donors, the livers of which undergo different
procurement procedures, as well as surgical procedures which can affect liver viability following
transplantation (Jassem et al., 2003; Oliveros et al., 2005). In addition, no measurement of ccK18
is shown here, which is crucial since we have also shown a slight increase in ccK18 at 3 hours
post-reperfusion, when no relevant amount of apoptosis is present. This is because the
corresponding increase in FK18 is >150-fold greater (Yang et al., 2014). Thus, it is the ratio of
FK18 to ccK18 that is necessary to make conclusions about mode of cell death.
In addition to helping differentiate between apoptosis and necrosis, cytokeratin-18 has a number
of other practical diagnostic and prognostic applications for a variety of liver disorders. For
malignancies, much use of cytokeratins comes from immunohistochemical staining, which
necessitates biopsy. Therefore, an in-depth discussion of cytokeratins for this purpose would be
beyond the scope of this dissertation. Nevertheless, malformations in keratin organization have
been shown to predispose individuals to certain conditions such as copper storage disease and non-
alcoholic steatohepatitis (Ku et al., 2007; Strnad et al., 2012; Zatloukal et al., 2007). The thought

8
is that these malformed keratin structures contribute to hepatocyte ballooning in these conditions
(Guy et al., 2012; Lackner, 2011). Furthermore, overexpression of cytokeratin variants have been
useful in differentiating between various tumor types. For instance, HCC can be differentiated
from cholangiocarcinoma by the overexpression of K19 relative to K18 because hepatocytes only
contain cytokeratin-8 and -18 whereas cholangiocytes contain K8, 18, and 19 (Moll et al., 2008;
Omary et al., 2009).
More relevant to the field of circulating biomarkers is that elevated levels of caspase-cleaved
cytokeratin is present in patients suffering from NASH and can help not only differentiate NASH
from simple steatosis, but may also be correlative with the degree of severity (Alkhouri et al.,
2011; Molnar et al., 2011; Musso et al., 2011; Wieckowska et al., 2006). This is also true for
chronic HBV and fibrotic injury associated with HCV (Bantel et al., 2004; Papatheodoridis et al.,
2008). In fact, circulating cytokeratins are the only non-invasive marker currently being used for
the diagnosis of NASH. A recent study demonstrated that cytokeratin-18 fragments were able to
predict the presence of NASH in patients with a sensitivity of 0.78, specificity of 0.87, and area
under ROC of 0.82 (Musso et al., 2011). Similarly, in cases of acute liver failure, an increase in
caspase-cleaved cytokeratin-18 was also associated with favorable prognosis and elevated full
length cytokeratin-18 indicated more significant liver injury and a poor outcome (Bechmann et al.,
2010; Volkmann et al., 2008). However, there is conflicting data suggesting that outcome is more
dependent on etiology than on M65 levels; in one study of APAP toxicity, evaluation of keratin
fragmentation did not appear to offer additional benefit in predicting outcome relative to the
currently used ALF criteria (Craig et al., 2011). On the other hand, in a study of patients who
presented to the ER for APAP overdose, elevated full length cytokeratin-18 levels were shown to
be highly predictive of which patients would go on to develop liver injury (Antoine et al., 2013).

9
While these numbers may not be ideal, they are much better than the use of ALT levels at the time
of presentation for the prediction of development of liver injury. Finally, keratin-18 may be able
to predict which patients will respond to anti-HCV therapy (Volkmann et al., 2008). Further
research into cytokeratins will provide more information into their use as both predictive as well
as prognostic biomarkers and will make them a more valuable clinical resource, particular in
conjunction with other markers of injury.
HMGB-1 is a nuclear protein which sits in the minor groove of DNA and acts as a transcription
factor for a variety of proteins. HMGB-1 exists in two forms, a hypo-acetylated (HMGB-1) form
and a hyper-acetylated form (acHMGB-1) (Antoine et al., 2009; van Golen et al., 2012). In its
hyper-acetylated form, acHMGB-1 is actively secreted by macrophages and represents a pro-
inflammatory biomarker (Antoine et al., 2009; Bonaldi et al., 2003). However, during necrosis,
hypoacetylated HMGB-1 is passively released into sinusoids and acts on macrophages through
toll-like receptors to produce cytokines (Tsung et al., 2005; Yang et al., 2010). Studies conducted
by our laboratory, and others, have shown that increased levels of total HMGB-1 correlate with
degree of necrosis, particularly during earlier time points (Tsung et al., 2005; Yang et al., 2014).
Oxidation status of non-acetylated HMGB1 can also differentiate between necrosis and apoptosis
and whether or not an immune response may be generated. Isoforms of HMGB1 which contain
reduced residues are generally associated with necrosis and facilitate chemotaxis and cytokine release
from innate immune cells. The opposite is true of isoforms of HMGB1 which contain fully oxidized
residues and are associated with apoptosis and the lack of an innate immune response (Tang et al.,
2010, 2012) Thus, much like cleaved and full-length cytokeratin, the ratio of oxidized to reduced
isoforms of HGMB1 can be used to differentiate between necrosis and apoptosis. Furthermore,
correlations between HMGB1 and outcome have been identified following acetaminophen toxicity in

10
humans (Antoine et al., 2013). Finally, caspase activity and cleaved caspase protein (particularly
caspase-3) can be used as markers of apoptotic cell death, but more research needs to be conducted
before their application in the clinical setting can be assessed (McGill et al., 2012; Woolbright et al.,
2015)
1.1.3.4 Biomarkers of Mitochondrial Injury
The premise with all mechanistic biomarkers of cellular injury and death is that they are only
released into circulation as a result of cellular injury. For instance, mitochondrial DNA (mtDNA)
exists within the mitochondrial matrix and injury to the mitochondria would lead to release of
mtDNA into the cellular matrix. However, this alone would not be expected to cause an increase
in circulating mtDNA, provided, of course, that the injury to the mitochondria was not sufficient
to cause cellular death.
Drug hepatotoxicity often involves mitochondrial damage and dysfunction (Pessayre et al., 2012).
Indeed, during APAP toxicity, which is the major cause of DILI, mitochondrial injury is a critical
feature of liver injury (Jaeschke et al., 2012a). As a result, several biomarkers of mitochondrial
injury have been identified.
Glutamate dehydrogenase (GDH) is an enzyme situated within the mitochondrial matrix. Using
NAD+ as a cofactor, GDH catalyzes the conversion of glutamate to oxoglutamate – forming
ammonia and NADH. Critically, mitochondrial injury must occur for GDH to exist in measurable
amounts in the plasma. This is exemplified by studies comparing hepatotoxic drugs which have
different mechanisms of action. For instance, both acetaminophen and furosemide cause
hepatocyte injury but only APAP toxicity leads to mitochondrial injury. In studies comparing
APAP to furosemide, measurements of GDH following acetaminophen toxicity are elevated while

11
those following furosemide toxicity are not (McGill et al., 2012). This is because if mitochondrial
rupture does not precede necrosis, in-tact mitochondria can be removed from plasma prior to the
measurement of GDH. Previous studies from our lab have shown definitively that mitochondria
play a critical role in hepatocyte necrosis following acetaminophen toxicity (McGill et al., 2012)
and data using rodent models of ischemia suggests this may be true in humans following OLT
(Yang et al., 2014).
In conjunction with GDH, measurement of mitochondrial DNA within the plasma can be used to
identify mitochondrial injury. During the measurement of mtDNA, total DNA is isolated from the
plasma, then subjected to PCR, using primers for genes encoded specifically by mitochondrial
specific DNA, such as NADH dehydrogenase or Cytochrome C oxidase subunit 3. In studies
detailed in this dissertation as well as those of acetaminophen metabolism, mtDNA is not only
elevated in patients with liver injury relative to those without liver injury, but preliminary data
from our lab suggests that elevations in GDH and mtDNA may even slightly precede elevations in
ALT, underscoring the critical role of mitochondrial injury in cell death under these conditions.
Although mores studies are needed to confirm this, it would seem to indicate that therapies targeted
towards the prevention of mitochondrial injury would have a tremendous impact on the
progression of liver injury in these conditions.
In addition to these matrix macromolecules, Bajt and co-workers have shown that damage to the
mitochondria also results in release of apoptosis inducing factor (AIF) and endonuclease G (Bajt
et al., 2006). Endonuclease G then translocates to the nucleus where it begins cleaving nuclear
DNA into fragments, ultimately leading to necrosis (Bajt et al., 2006, 2008, 2011). Therefore,
measurements of nuclear DNA fragmentation following OLT in humans may be indicative of

12
mitochondrial involvement. Indeed, in rodent models of IRI, there is an increase in both
biomarkers, suggesting a role of mitochondrial involvement (Yang et al., 2014).
1.1.3.5 Nucleic Acid Biomarkers
Regardless of whether cell death mode is necrosis or apoptosis, the final step in the death process
involves DNA fragmentation. Therefore, it is not surprising that identification of methods to
measure DNA fragmentation have been explored as a biomarker of cell death. The biggest
drawback to the use of older tests such as gel electrophoresis and the TUNEL assay is that they
require invasive means for acquisition. Nevertheless, when liver tissue can be obtained, these tests
can provide valuable information regarding both the degree and mode of cell death. This is because
the extent of DNA fragmentation correlates with the degree of cellular injury, and the pattern of
fragmentation varies due to differences in the cellular pathways for apoptosis and necrosis. During
apoptotic cell death, activated effector caspases (ie: caspase-3) cleave the inhibitor of caspase
activated DNAse (iCAD) protein, allowing CAD to cleave DNA. Once activated, CAD cleaves
DNA at regular intervals of about 180-200 bp, or multiples thereof. In contrast, during necrosis,
DNA fragmentation is random, leading to DNA fragments of random size. The resulting
electrophoresis pattern following apoptosis would therefore show up as a ‘ladder’ of bands as a
result of numerous fragments of similar size but would appear as a ‘smear’ with no distinct
identifiable band following necrosis. While gel electrophoresis can provide valuable information
into the mode of cell death, it provides little information into the extent of injury. The opposite is
true for the TUNEL assay, which based on the degree of staining can show extent of injury relative
to another test compound, or contro group (Duan et al., 2016). Although this assay is not specific
for apoptotic cell death, the pattern of staining can still provide information as to whether apoptosis

13
or necrosis predominates. This is because during apoptosis, TUNEL staining will appear as
punctate areas in shrunken cells which have been pulled away from neighboring cells. In contrast,
during necrosis, the TUNEL staining often encompasses large areas of tissue as a result of
membrane rupture and spillage of DNA fragments into the surrounding area (Yang et al., 2014).
Recently, methods have been developed which allow for the measurement of nuclear DNA
fragmentation in plasma following liver injury. This assay is commercially available and utilizes
the principle of the ELISA assay and uses a primary capture antibody against histones. Following
incubation with secondary antibody, a colorimetric reaction occurs and the intensity of this color
change can be compared between different injury groups as well as healthy volunteers. Nuclear
DNA fragmentation has been assessed in a variety of liver conditions such as acetaminophen
toxicity, liver transplantation, and hypoxic hepatitis (Bajt et al., 2006; McGill et al., 2012;
Weemhoff et al., 2017). While this can provide information into the extent of injury, it does not
provide any information into the mode of cell death. In fact, one of the biggest drawbacks to this
assay is that if the DNA fragment is long enough, it may actually fold back onto one or more
additional primary antibodies, thus over estimating the amount of injury.
One of the most rapidly growing topics in the field of biomarker research is micro-RNAs, or
miRNA. Micro-RNAs are short, non-coding RNA sequences which regulate gene expression of
numerous proteins by inhibiting translation of mRNA (Bala et al., 2009; Cortez and Calin, 2009).
Since they were first identified in 1993, much research has been conducted on the role of miRNAs
in pathways such as cell death, differentiation, proliferation, and the pathogenesis of infectious
and neoplastic diseases (Bala et al., 2009; Lee et al., 1993; Voinnet, 2005; Zamore and Haley,
2005). Micro-RNAs are being used to not only assess extent of cell death, but also to help

14
differentiate between underlying etiology. In fact, the vast majority of biomarker research has been
conducted in this particular field and the future of the use miRNA as a clinical tool is promising.
The use of miRNA, particularly miRNA-122, in the field of hepatology is of benefit because this
miRNA-122 is specific to the liver. Thus, unlike other markers of liver injury such as ALT,
elevated miRNA can only be attributed to liver injury. The correlation between liver injury and
increases of miRNA have been shown in numerous studies (Ward et al., 2014; Weemhoff et al.,
2017). In fact, miRNA-122 levels may be a more sensitive marker of liver injury than ALT as
numerous studies have shown it to become elevated prior to ALT (Dear et al., 2014; Wang et al.,
2009b; Ward et al., 2014).
While the studies detailed in this dissertation have focused only on miRNA-122, many other
microRNAs have been studied and described in the context of liver injury. Other miRNAs such as
miR-192 and miR-125b, are elevated in plasma or serum after acetaminophen toxicity in humans
and in mice (Krauskopf et al., 2015; McGill and Jaeschke, 2015; Ward et al., 2014; Yang et al.,
2015). Furthermore, some studies of the liver specific miRNA-122 have not only been shown to
be predictive of the development of liver injury in early-presenting acetaminophen overdose
patients, but is also associated with a poor outcome (Antoine et al., 2012, 2013).
The use of miRNAs as biomarkers is multifaceted and goes well beyond the measurement of cell
death and prediction of injury and outcome following acetaminophen toxicity. Indeed, circulating
miRNA profiles could be beneficial in differentiating the underlying cause of injury. In a 2014
study, expression profiles of various liver specific miRNAs were used to help differentiate between
APAP toxicity and hypoxic hepatitis (Ward et al., 2014). Additionally, specific changes in miRNA
expression profiles have been associated with specific liver diseases such as non-alcoholic fatty
liver disease, alcoholic liver disease, primary biliary cirrhosis, and hepatocellular carcinoma

15
(Dolganiuc et al., 2009; Jin et al., 2009; Ladeiro et al., 2008; Li et al., 2009; Murakami et al., 2006;
Padgett et al., 2009). Using the knowledge gained from miRNA profiles in these types of diseases,
research has been carried out to explore the possibility of miRNA as a therapeutic mechanism to
counteract aberrant expression of miRNA during disease processes. In one example therapeutic
silencing of miRNA-122 lead to a significant decrease in HCV levels in chimpanzees (Lanford et
al., 2010). In another study, HCC progression was reversed following miRNA-26a administration
(Kota et al., 2009). Finally, overexpression of miRNA-150 and 194 leads to decreased stellate cell
activation, potentially playing a critical role in the therapy of liver fibrosis (Antoine et al., 2015).
1.1.3.6 Other Biomarkers
In the rapidly growing field of biomarker research, new markers of injury are constantly being
identified and investigated. In some cases, markers of other organ systems have been investigated
for their use as markers of liver injury. For instance, kidney injury molecule-1 can be a sensitive
predictor of outcome following APAP overdose (Antoine et al., 2015). The relationship between
KIM-1 and liver injury is of particular importance for determining the urgency of liver
transplantation in these cases.
In addition to plasma biomarkers of liver injury, several studies have identified a number of
changes in urine composition as a method to assess liver injury (Amacher, 2002). For instance,
urinary biomarker profiles following exposure to several hepatotoxicants were used to differentiate
between administered toxins (Beckwith-Hall et al., 1998).

16
1.2 ISCHEMIA-REPERFUSION INJURY
1.2.1 INTRODUCTION
Ischemia-Reperfusion Injury (IRI) is the process by which reintroduction of oxygen to a previously
ischemic organ leads to exacerbation of injury to that organ. IRI has been described for decades
and observed in a number of organs, including the heart (Hausenloy and Yellon, 2013), liver
(Jaeschke, 1991; Marubayashi et al., 1986), and kidneys (Chatauret et al., 2011). Clinically, IRI
can occur during veno-occlusive disease, severe hypotension, or hemorrhagic shock (Eltzschig and
Eckle, 2011). It can also be introduced iatrogenically during the Pringle Maneuver, when blood
supply to an organ is intentionally occluded to prevent blood loss during prolonged surgical
procedures. In the context of the liver, this can occur during lobectomy, mass removal, or
transplantation.
After decades of research in rodent models of IRI, much has been learned about the mechanisms
of injury following an ischemic insult to the liver (Jaeschke, 2003). Despite these advances, little
is known about the mechanisms of reperfusion injury in humans. Even in rodent models there is
considerable debate about the mechanisms of injury, though recent studies by our laboratory have
conclusively demonstrated that necrotic rather than apoptotic cell death predominates (Gujral et
al., 2001; Yang et al., 2014). Determination of the type of cell death is important for the design of
therapeutic agents intended to minimize injury following ischemia.
One difficulty in characterizing the mechanisms of ischemic injury in humans, particularly over
longer periods of time, is that multiple biopsies in human patients during liver injury is not
possible. Thus, histologic evaluation to determine mode of cell death and neutrophil infiltration
cannot be used. Therefore, we sought to use the specific circulating biomarkers discussed above
to characterize mode of cell death, the role of mitochondria in cell death, and the role of

17
inflammation leading up to, and following, cell death following ischemia-reperfusion injury.
Importantly, these same biomarkers provide useful insight into prognosis of patients suffering from
other clinical conditions such as acetaminophen toxicity and cholestasis.
1.2.2 INFLAMMATION DURING ISCHEMIA-REPERFUSION INJURY
In rodent IRI, Kupffer cells and neutrophils play a significant role in the initiation and propagation
of injury, respectively (Jaeschke and Farhood, 1991a; Jaeschke et al., 1992, 1993). Through the
activation of Kupffer cells and the subsequent release of cytokines, neutrophils are recruited to the
area and mediate the later phase of injury. Studies have demonstrated that antibody-mediated
depletion of neutrophils affords substantial protection following IRI in rodents (Jaeschke et al.,
1990). In addition to pro-inflammatory, anti-inflammatory, and regenerative mediators are also
released (Lentsch, 2012). Thus, the balance between injury and repair is dependent on the balance
of these cytokines. Indeed, increased pro-inflammatory and decreased anti-inflammatory
chemokines are associated with increased injury and risk of graft rejection (Camargo et al., 1997;
Friedman et al., 2012; Tomiyama et al., 2008; Zhai et al., 2008).
As mentioned previously, HMGB-1 can be a marker of necrosis, but can also serve as a marker of
inflammation. A study evaluating the presence of HMGB-1 following OLT found a measurable
amount of HMGB-1 in the early stages of reperfusion but not in the later stages, suggesting
necrosis occurs during the early phase of injury (Ilmakunnas et al., 2008), which is in agreement
with our rodent studies (Yang et al., 2014). This study concludes there is no correlation between
HMGB-1 and inflammation, as measured by TNF-α and IL-6 (Ilmakunnas et al., 2008). However,
these conclusions were based on total HMGB-1, which is released passively during necrosis, rather
than hyper-acetylated HMGB-1, which is released actively and serves to initiate an immune

18
response. Studies from our laboratory demonstrate an increase in HMGB-1 corresponding to
necrosis at the earlier time points, and an increase in acHMGB-1 corresponding to inflammation
at later time points, underscoring the importance of measuring both forms of HMGB1 (Yang et
al., 2014).
In previous studies using the rodent model of IRI, an increase in neutrophil priming and activation
(CD11b expression) was observed. This correlated with degree of injury at later time points
following ischemia (Jaeschke et al., 1992, 1993) and confirmed the importance of neutrophils in
the late stage of injury. Neutrophils are also capable of phagocytosis which can both help stop the
inflammatory process by removing inflammatory debris, and it can also prepare the tissue for
regeneration. In fact, neutrophil infiltration is crucial for regeneration following acetaminophen
overdose (Williams et al., 2014). A study examining the role of neutrophils in human OLT injury
concluded that despite early (5 minutes post-reperfusion) activation of neutrophils, there was no
effect on graft function, suggesting neutrophil activation does not exacerbate tissue injury
(Ilmakunnas et al., 2009). However, this study failed to examine neutrophil involvement at later
time points (>6h) which has been shown in the rodent model to be the time at which neutrophils
have extravasated and begin to propagate injury in the mouse model (Jaeschke and Smith, 1997;
Jaeschke et al., 1990).
1.2.3 ISCHEMIC INJURY FOLLOWING LIVER TRANSPLANTATION
1.2.3.1 Introduction
Liver transplantation remains the only therapeutic option for end-stage liver disease of any
etiology. Although liver transplantation has become a routine therapy, there are significant post-
operative risks associated with the procedure, such as reperfusion injury and the formation of

19
biliary strictures, which can affect graft survival, morbidity and mortality, and long-term outcome.
Furthermore, methods to predict which patient will develop these complications are lacking.
During donor liver procurement and transplantation, the organ experiences no-flow ischemia upon
procurement, and is stored in a preservative such as University of Wisconsin (UW) solution until
a recipient is identified (El-Wahsh, 2007). Thus, there is a varying degree of time during which
the donor liver experiences no-flow ischemia. Unfortunately, this period of ischemia can
predispose parenchymal and non-parenchymal cells to injury (reperfusion injury) upon warm
reperfusion, leading to increased risk of graft injury and primary graft failure. Research has shown
that longer ischemic times lead to greater injury to the liver and an increased risk of complications,
such as primary graft failure (Marsman et al., 1996; Perez-Daga et al., 2006; van der Vliet and
Warlé, 2013). Additionally, certain donor liver factors, such as increased levels of steatosis,
predispose the allograft to increased injury and failure. As a result, these marginal quality livers
are not frequently used in transplantation, limiting the number of organs available for the life-
saving procedure. Indeed, according to the Organ Procurement and Transplantation Network
(OPTN), there are currently over 14,000 individuals on a waiting list to receive a transplant despite
the fact that more than 26,000 transplants have been performed thus far in 2017. Moreover,
approximately 4,100 people have died while waiting for a transplant. In light of these statistics, it
is crucial to determine the mechanisms leading to reperfusion injury and biliary stricture following
human liver transplantation.
1.2.3.2 Cell death following LT
One of the most basic questions is whether cells die by necrosis or apoptosis following liver
transplantation. These two modes of cell death differ both in intracellular events as well as

20
histological characteristics. Apoptosis involves activation of caspases and ultimately activation of
caspase-activated DNAse, which leads to fragmentation of nuclear DNA. Histologically, apoptosis
is characterized by cellular shrinking, formation of apoptotic bodies, nuclear condensation, and an
intact cell membrane (Jaeschke and Lemasters, 2003). In contrast, necrosis can be recognized by
cell swelling, karyorrhexis and karyolysis, and loss of membrane integrity (Jaeschke and
Lemasters, 2003). Many studies arguing for a relevant impact of apoptosis in IRI rely on terminal
deoxynucleotidyl transferase dUTP nick end labeling (TUNEL) staining (Kim et al., 2013; Rao et
al., 2013). However, because both forms of cell death involve fragmentation of nuclear DNA,
TUNEL staining alone cannot be used to differentiate the two. Interestingly, the pattern of TUNEL
staining can give insight into which mode of cell death predominates. We have shown that in cells
undergoing apoptosis, TUNEL-positive cells appear as punctate stains within the microscopic
field. However, due to nuclear and cellular lysis that occurs during necrosis, DNA fragments
diffuse into surrounding areas leading to large, irregularly shaped stained areas.(Jaeschke et al.,
2011; Yang et al., 2014). Since each mode of cell death is carried out by two distinct processes,
determination of the predominant form of cell death following OLT in humans is necessary to
identify appropriate therapeutic targets. Furthermore, not much is currently known regarding
downstream cellular events which lead to hepatocyte injury and death.
1.2.4 LIVER INJURY FOLLOWING HYPOXIC HEPATITIS
1.2.4.1 Introduction
Hypoxic hepatitis (HH), also called ischemic hepatitis, or ‘shock’ liver, is a clinical condition
precipitated by prolonged periods of oxygen deprivation to the liver and can have several
underlying causes. It is characterized by a sudden and rapid increase in ALT (~20X normal) in the

21
absence of any other causes of liver injury, such as viral hepatitis, alcoholic hepatitis, or drug-
induced liver injury. Its prevalence in critically ill patients can reach upwards of 10%. Despite its
prevalence, little is known about the mechanisms of injury.
1.2.4.2 Clinical Hypoxic Hepatitis
Typically, the inciting cause for HH involves an episode of cardiogenic, circulatory, or respiratory
failure leading to decreased oxygen delivery to the liver (Henrion et al., 2003). Hypoxic hepatitis
represents a serious source of morbidity and mortality, with a prevalence of approximately 10% in
intensive care patients (Fuhrmann et al., 2010). Treatment of hypoxic hepatitis involves treatment
of the underlying cause, but mortality can still be as high as 50% (Fuhrmann et al., 2010; Hawker,
1991; Horvatits et al., 2013).
In the laboratory, hypoxic hepatitis has been studied in a variety of ways including the hemorrhagic
shock model. This model involves hemorrhage of the animal to a hypotensive state, thereby
decreasing oxygen delivery to the liver. In another model, the cardiogenic shock model, a balloon
catheter is placed in the coronary artery and inflated, leading to cardiogenic shock. A major
downside to the use of animal models for the study of hypoxic hepatitis is that they are not often
reproducible. In the most commonly used model, hemorrhagic shock, ALT values don’t always
reach the level expected during hypoxic hepatitis and even under similar conditions, the degree of
injury is often vastly different between experiments. Furthermore, the number of underlying
conditions that can precipitate hypoxic hepatitis in humans, such as respiratory failure/shock,
aortic dissection, and obstructive sleep apnea (Alcorn and Miyai, 1992; French et al., 1984;
Henrion et al., 1997, 1999; Leslie et al., 1989; Mathurin et al., 1995; Trilok et al., 2012). far
outnumber the types of animal models developed for the study of the condition. Thus, subtle

22
differences in the pathophysiology may be missed by relying on animal models which do not
recapitulate the condition in humans. Furthermore, most laboratory studies of hypoxic hepatitis
are limited to a specific time point, rather than a complete clinical course. Thus, an alternative
approach is necessary.
One possible method to study HH clinically is through the use of the same biomarkers of liver
injury and death described above. Once a diagnosis of hypoxic hepatitis is made, these biomarkers
can be measured for an extended time course. Furthermore, they could easily be catalogued and
classified according to underlying etiology so that patterns in injury can be identified, regardless
of the underlying cause.
1.3 DRUG-INDUCED LIVER INJURY
1.3.1 Introduction
Drug induced liver injury is the most common cause of acute liver failure in the US (Chen et al.,
2015; Reuben et al., 2010). Drug induced liver injury can be classified as intrinsic or idiosyncratic;
the basis for the classification being whether or not the mechanism of injury is intrinsic to the drug
or not. For the drugs that fall under the ‘intrinsic’ category, either the drug itself or a metabolite,
has a known deleterious effect on the liver. Thus, injury secondary to the use of these drugs, is
both predictable and dose-dependent (Fisher et al., 2015). However, the vast majority of drugs
responsible for DILI fall within the umbrella of idiosyncratic. Idiosyncratic drug induced liver
injury remains a problem due to the fact that the basis for the injury in susceptible individuals
remains unknown. There is not likely a single cause for the development of injury in these patients,
but rather a combination of chemical, genetic, and immunologic factors for the individual which

23
leads to the reaction (Chen et al., 2015; Tailor et al., 2015). Thus, injury with these drugs is both
unpredictable and non-dose dependent (Fisher et al., 2015).
Most drugs with a predictable adverse reaction on the liver are screened out before, or during,
clinical trials (Jaeschke, 2015). An exception to this rule is acetaminophen. While acetaminophen
is safe at therapeutic levels, it actually represents the most common cause of acute liver failure in
the United States (Chen et al., 2015; Fisher et al., 2015; Jaeschke, 2015; Reuben et al., 2010). This
is due in no small part to its availability as an over-the-counter medication, as well as its presence
in many prescription opioid formulations such as Vicodin® and Percocet® (Bunchorntavakul and
Reddy, 2013; Herndon and Dankenbring, 2014; Yoon et al., 2016). Many patients on medication
to manage long-term pain take a combination of these opioid formulations as well as
acetaminophen, thereby unwittingly overdosing on the drug. Intentional overdose with
acetaminophen also accounts for a significant number of acetaminophen toxicities.
1.3.2 DILI Secondary to Acetaminophen
Acetaminophen is a commonly used analgesic and antipyretic (Bunchorntavakul and Reddy, 2013;
Yoon et al., 2016). It is well tolerated at therapeutic doses (<4g/day) but leads to toxicity at higher
doses. APAP is metabolized through a combination of Phase I and Phase II detoxifying enzymes.
In the case of acetaminophen, Phase II metabolism occurs first with the majority of the parent
compound being conjugated to glucuronide or sulfate, and being excreted as inactive conjugates
(Larson, 2007). Even at therapeutic doses, a small amount of the parent compound is metabolized
by cytochrome P-450 enzymes 2E1, 1A2, and 3A4 (Lee et al., 1996; Snawder et al., 1994;
Thummel et al., 1993). into the toxic and electrophilic intermediate N-acetyl-p-benzoquinone
imine, or NAPQI (Dahlin et al., 1984). NAPQI is subsequently detoxified by the tripeptide

24
glutathione (Larson, 2007). At higher doses of acetaminophen, the conjugation systems become
overwhelmed and a much higher percent of the initial dose is shunted through the P-450 system,
leading to increased NAPQI formation (Du et al., 2013). Although glutathione exists in very high
concentrations within the cytoplasm, increased NAPQI formation rapidly depletes glutathione
stores (Lee et al., 1996; Mitchell et al., 1973; Xie et al., 2015a). As an electrophile, NAPQI can
covalently bind to proteins free-floating within the cytoplasm, or proteins contained on organelle
membranes forming protein adducts. It has been extensively shown that mitochondrial proteins are
affected by NAPQI (Cohen et al., 1997; McGill et al., 2012; Qiu et al., 1998; Tirmenstein and
Nelson, 1989; Xie et al., 2015b). This leads to mitochondrial oxidative stress and JNK activation
(Du et al., 2015; Gunawan et al., 2006; Henderson et al., 2007; Meyers et al., 1988; Saito et al.,
2010; Xie et al., 2014a). Activated JNK (pJNK) then translocates into the mitochondria and
amplifies the oxidative stress (Hanawa et al., 2008; Saito et al., 2010). Eventually, the
mitochondrial membrane permeability transition (MPT) occurs leading to matrix swelling and
lysis of the outer mitochondrial membrane (Hanawa et al., 2008; Jaeschke et al., 2012a; Kon et al.,
2004; Saito et al., 2010). Mitochondrial lysis leads to the release of apoptosis-inducing factor (AIF)
and endonuclease G (EndoG) from the intermembrane space (Bajt et al., 2004, 2006; Cover et al.,
2005). These two endonucleases then translocate to the nucleus leading to fragmentation of nuclear
DNA and, ultimately, hepatocyte cell death by oncotic necrosis (Bajt et al., 2011; McGill et al.,
2012).
1.3.3 Importance of hepatocyte models
While the mechanisms of liver injury following acetaminophen toxicity are well described in mice
and man, knowledge into the mechanisms leading to liver injury following idiosyncratic drug

25
induced liver injury is lacking. Furthermore, hepatotoxicity is the most common cause of drug
failure during development or clinical trials. Thus, to prevent a significant expenditure of financial
and other resources, drug development companies must be able to determine early on in the
development process which drugs will cause hepatotoxicity, and which drugs will not. Therefore,
convenient, reliable, and inexpensive models, such as cell culture models, must be developed to
accurately identify hepatotoxic drugs before the clinical phase.
One of the more commonly used hepatocyte cell line is the HepG2 cell line. Since the discovery
of this cell line in 1979 (Aden et al., 1979), it has been used extensively in research, including drug
metabolism studies. One major drawback, however, is that the HepG2 cell line, while beneficial
for many aspects of liver study, do not possess a full complement of the drug metabolizing
enzymes, cytochrome-P450s (Wilkening et al., 2003), limiting their usefulness for these studies.
Another human hepatoma cell line, HepaRG, was identified and shown to express a level of
cytochrome P450s more consistent with primary human hepatocytes (Aninat et al., 2006; Gripon
et al., 2002), making them a superior choice for studies of drug metabolism, relative to HepG2.
While primary human hepatocytes remain the gold standard for hepatocyte cell culture studies,
they are only sporadically available, require specialized isolation techniques and do not tolerate
the freeze/thaw cycle well (Rijntjes et al., 1986). Thus, HepaRG cells provide an attractive
alternative to primary cells. Even still, lengthy growth and differentiation process limits their
usefulness for quick studies. To overcome this, a pre-differentiated cryo-preserved HepaRG cell
line was developed, dramatically decreasing the growth period, and increasing their usefulness.
The final chapter of this dissertation will be dedicated to the exploration of the use of the pre-
differentiated HepaRG cell line for the studies of drug metabolism, specifically for studies of
acetaminophen toxicity.

26
2. PLASMA BIOMARKERS OF ISCHEMIA-REPERFUSION
INJURY IN HUMAN LIVER TRANSPLANTATION

27
2.1 INTRODUCTION:
Liver transplantation (LT) remains the only therapeutic option for patients with end-stage liver
disease (ESLD). During LT, the donor liver undergoes a period of ischemia during harvest and
cold storage up until the time of reperfusion in the recipient. This ischemic period consists of both
warm and cold ischemia. Paradoxically, the return of blood flow to the ischemic organ predisposes
it to injury.
Ischemia-reperfusion injury (IRI) has been described in multiple organs. In the mouse liver, the
reperfusion period itself is relatively well tolerated as demonstrated by low levels of ALT for
several hours following reperfusion (Yang et al., 2014). However, this low level of injury
ultimately initiates an inflammatory cascade through the release of cellular debris, activation of
Kupffer cells, and finally, the recruitment of neutrophils, which are responsible for necrotic cell
death (Ellett et al., 2009; Jaeschke and Farhood, 1991b). In human patients undergoing liver
transplantation, relatively little is known about IRI. This is due, in part, to the fact that invasive
biopsies at extended time-points following transplantation are not possible in these patients.
Therefore, a non-invasive method for describing IRI in human transplant patients is required.
Recently, circulating biomarkers have been used to describe molecular mechanisms and events
following several types of liver injury, such as cholestasis and drug induced liver injury (DILI)
(Antoine et al., 2012; McGill and Jaeschke, 2014; Woolbright et al., 2013). These biomarkers
accurately describe both mode and mechanisms of cell death during these conditions, and also
show promise in predicting outcome (McGill et al., 2012). Previous results from our laboratory
has demonstrated that these same biomarkers can be used to accurately describe the events
occurring following IRI in rodents (Yang et al., 2014). Because these biomarkers are non-invasive,

28
and can be easily measured in plasma, they represent an ideal technique to describe the events
contributing to liver injury following LT in humans.
While other groups have also used this approach, their studies have been limited to earlier
reperfusion times (Ilmakunnas et al., 2008, 2009; Pesonen et al., 2000; Ulukaya et al., 2010),
following transplantation. However, in the rodent model of IRI, a model often used to recapitulate
human transplantation, peak neutrophil infiltration and extravasation doesn’t occur until 6 hours
post reperfusion, and peak injury doesn’t occur until 24 hours post reperfusion. Therefore, a more
comprehensive time course is necessary to fully understand the events which occur following LT
in humans. In addition, there are currently no studies which evaluate multiple biomarkers for a
prolonged time course. Thus, an accurate clinical picture of the cellular events that occur several
days following transplantation is lacking. Therefore, we sought to obtain a comprehensive
characterization of the cellular events which occur following liver transplantation by evaluating
biomarkers known to accurately describe extent of injury (ALT, miRNA-122), mode of cell death
(cytokeratin-18), and mitochondrial involvement (GDH, mtDNA), in patients undergoing liver
transplantation before, during, and up to 72 hours following the procedure. Furthermore, we
evaluated the role of neutrophils in the post-reperfusion injury process by evaluating CD11b
expression, ROS production, and phagocytic capability, all parameters of neutrophil activation.
We found that in contrast to the mouse model of IRI, most of the injury occurs within several hours
of reperfusion. Importantly, we found no evidence for the involvement of neutrophils in this
process, but rather a trend toward the decrease of neutrophil involvement. Thus, we conclude that
the mouse model of IRI is not a good surrogate for the study of liver transplantation.

29
2.2 PATIENTS AND METHODS:
Study Design: All consenting patients undergoing liver transplantation for any reason at the
University of Kansas Hospital were included in this study. Blood from patients enrolled in this
study was collected at the following times: Pre-OLT (6hrs before procedure), anhepatic period,
0.25, 0.5, 1, 6, 12, 24, 48, and 72 hours post-reperfusion. At each time point, blood was collected
in a red top tube (no additives) for serum, and a green top tube (heparin) or pink top tube (EDTA)
for plasma. Upon collection, blood was stored at 4oC until procurement by study personnel, at
which point blood tubes were centrifuged and plasma/serum was aliquoted and stored at -80oC
until use. All procedures conducted in this study were done with approval by, and in accordance
with, the Institutional Review Board at the University of Kansas.
Biochemistry: ALT was measured using a commercially available kit (Pointe Scientific, Roche,
IL) according to the manufacturer’s instructions. GDH was measured using the modified method
of Passonneau and Lowry as previously described (McGill et al., 2012).
Mitochondrial DNA: DNA from serum was isolated using the QiaAMP Mini Blood Kit (Qiagen,
USA) according to the manufacturer’s instructions. Isolated DNA was then subjected to qPCR
using primers for the mitochondrial-DNA specific gene cytochrome C oxidase subunit III (CytC;
Fwd-ATGACCCACCAATCACATGC, Rev-ATCACATGGCTAGGCCGGAG). Quantification
of mtDNA was compared to a standard curve consisting of known amounts of DNA isolated from
primary human hepatocytes as previously described (Xie et al., 2014a).

30
Nuclear DNA fragments: Nuclear DNA fragments were measured using a commercially available
cell death detection kit (Roche, Indianapolis, IN) according to the manufacturer’s instructions.
This ELISA kit uses a primary anti-histone antibody and a secondary anti-DNA antibody. Upon
addition of substrate, the absorbance at 405nm over 1 hour was measured and compared to control
(pre-OLT sample for each patient).
miRNA-122: qPCR was used to measure miRNA levels as described previously (Starkey Lewis et
al., 2011).
HMGB1 and cytokeratin: Total HMGB1 and cytokeratin-18 (cleaved and full-length) were
measured by LC-MS/MS as described previously (Antoine et al., 2009).
Neutrophil assays: All neutrophil assays were performed within 6 hours of the blood draw. Neutrophil
activation was measured using flow cytometry to identify neutrophils expressing the CD11b surface
marker. Whole blood was incubated on ice with saturating concentrations of PE-labeled anti-CD11b
antibody. Red blood cells were subsequently lysed and neutrophils expressing CD11b were identified via
flow cytometry. The oxidative burst assay was used to measure production of ROS from activated
neutrophils. Briefly, whole blood was incubated with PBS, PMA, or E. coli at 37oC for 10 min. DHR-123
was then added, followed by a second ten minute incubation period. The samples were washed, red cells
lysed, centrifuged, and the pellet reconstituted. In the presence of ROS, DHR-123 is converted to its
fluorescent metabolite rhodamine-123. Flow cytometry was then used to quantitate production of ROS as
a function of increased fluorescence. The neutrophil phagocytosis assay was used to assess neutrophil

31
function. Whole blood was incubated with FITC-labelled E-coli for 15 minutes. Flow cytometry was used
to identify neutrophils that have phagocytosed FITC-labelled E. coli.

32
2.3 RESULTS:
Patient Data. Consenting patients undergoing transplant for any etiology of ESLD were included
in this study. The age of patients in this study ranged from 19 to 69 (mean = 57) and consisted of
47 males and 25 females. The most common diagnosis was viral hepatitis (HCV) with or without
the presence of other confounding factors. Patient data is summarized in Table 2.3.1. Data from
one consenting patient was excluded due to immediate post-operative complications (thrombosis).
Every attempt was made to collect each time point for every patient but some time points were
missed in order to maintain standard of care. The most commonly missed time point was +72
hours.
Time course of injury following LT. We first set out to describe the time course of injury following
OLT in humans. In contrast to the rodent model of IRI, in which ALT remains low during the early
time point and peaks at later time points, we found a sharp rise in ALT at 1hr (44649 U/L)
followed by a gradual decline over the next 72 hours (Figure 2.3.1A). Previous studies have
demonstrated that miRNA-122 is a more sensitive indicator of liver injury than ALT (Laterza et
al., 2009), so we measured this biomarker to confirm this pattern of injury. Again, we found, a
similar pattern: a sharp rise to maximum injury (11.71.7 U/L) at 1 hour followed by a gradual but
steady decline over the next 72 hours (Figure 2.3.1B). The similarity between ALT and miRNA-
122 is best observed when compared directly (Figure 2.3.1C).
Mitochondrial injury during OLT. Previous studies have implicated mitochondrial injury as an
initiator of cell death following periods of ischemia (Lemasters et al., 1997; Theruvath et al., 2008).
To test the possibility that injury following OLT is a result of mitochondrial injury, we measured

33
Table 2.3.1 Patient Data
Table 2.3.1. Patient Data. Representative data for patients undergoing orthotopic liver transplantation
including diagnosis as well as cold and warm ischemic times

34
Reperfusion Duration (hr)
0 12 24 36 48 60 72
miR
NA
-1
22
(L
et-
7d
No
rm
alize
d)
0
2
4
6
8
10
12
14
16
AL
T (
U/L
)
0
100
200
300
400
500
600miRNA-122
ALT
A
C
Reperfusion Duration (hr)
0 12 24 36 48 60 72
miR
NA
-12
2 (
Le
t-7
d N
orm
alize
d)
0
2
4
6
8
10
12
14
16
Reperfusion Duration (hr)
0 12 24 36 48 60 72
AL
T (
U/L
)
0
100
200
300
400
500
600
B
Figure 2.3.1. Time course of reperfusion injury following transplantation. Plasma levels of (A) ALT
and (B) miRNA-122 from ≤6hrs before to 72 hours after liver transplantation. (C) ALT and miRNA-122
for these same time points on the same graph to show correlation of miRNA-122 and ALT. Data from
each time point is represented as average ± SEM for 43-74 patients (ALT) or 18-25 patients (miRNA-
122). Horizontal dashed bar represents average of healthy volunteers.

35
the matrix macromolecules glutamate dehydrogenase and mitochondrial DNA. Upon
mitochondrial injury and cell death, these macromolecules would be released into the sinusoids
and systemic circulation. Interestingly, we found that peak mtDNA for CytC reached 7.51.3
ng/ml and occurred 1 hour following reperfusion (Figure 2.3.2A). In contrast, peak levels of GDH
(15327 U/L) didn’t occur until 24 hours post-reperfusion (Figures 2.3.2B&C).
Nuclear DNA fragmentation. In addition to GDH and mtDNA, mitochondrial injury leads to the
release of endonuclease G, causing nuclear fragmentation and cell death (McGill et al., 2012). To
explore the relationship between mitochondrial injury and nuclear DNA fragmentation following
transplantation, we measured the amount of DNA fragments in plasma from these patients. As
with ALT, miRNA-122, and mtDNA, we found a sharp increase in DNA fragmentation at 1 hour
post-reperfusion (~700 fold increase vs. control) which gradually reached baseline over the next 3
days (Figure 2.3.2D). Taken together, these data indicate that the majority of injury following OLT
is due to ischemia, rather than reperfusion injury.
Necrosis, not apoptosis, is the predominant mode of cell death. Despite substantial evidence to the
contrary, many studies still point to apoptosis as the primary mode of cell death following ischemic
injury. To differentiate between these two forms of cell death in the current study, we used levels
of cytokeratin-18, an intermediate filament protein. During apoptosis, CK-18 is cleaved by
caspases into its shorter form, ccK-18. However, during necrosis, the full-length form (FK-18) is
passively released. We found a dramatic increase in both the caspase-cleaved and full-length forms
of cytokeratin (2950580 vs 29,3004200 U/L, respectively) 1 hour following reperfusion
(Figures 2.3.3A&B). While the increase in ccK-18 was unexpected, when compared to the FK-18

36
A
D
B
C
Reperfusion Duration (hr)
0 12 24 36 48 60 72
mtD
NA
(n
g/m
l)
0
2
4
6
8
10
GD
H (
U/L
)
0
50
100
150
200CytC
ND1
Reperfusion Duration (hr)
0 12 24 36 48 60 72
CytC
mtD
NA
(n
g/m
l)
0
2
4
6
8
10
Reperfusion Duration (hr)
0 12 24 36 48 60 72
GD
H (
U/L
)
0
50
100
150
200
Reperfusion Duration (hr)
0 12 24 36 48 60 72
Nu
cle
ar
DN
A F
rag
me
nts
(% I
ncre
ase
Ove
r C
on
tro
l (P
re-O
LT
))
0
200
400
600
800
Figure 2.3.2. Mitochondrial biomarkers following transplantation. Plasma levels of (A)
Cytochrome C oxidase subunit III mtDNA and (B) GDH from ≤6hrs before to 72 hours after liver
transplantation. (C) mtDNA and GDH for these same time points on the same graph demonstrates lack
of correlation between mtDNA and GDH. (D) Nuclear DNA fragments from ≤6hrs before to 72 hours
after liver transplantation. Data from each time point is represented as average ± SEM for 44-59 (CytC)
or 43-74 patients (GHD). Horizontal dashed line represents average of healthy volunteers.

37
B
Reperfusion Duration (hr)
0 12 24 36 48 60 72
FK
-18
(U
/L)
0
10000
20000
30000
40000
A
Reperfusion Duration (hr)
0 12 24 36 48 60 72
ccK
-18
(U
/L)
0
1000
2000
3000
4000
D
Reperfusion Duration (hr)
0 12 24 36 48 60 72
To
tal H
MG
B1
(n
g/m
l)
0
2
4
6
8
10
12
14
16
18
Reperfusion Duration (hr)
Pre Anh 1 6 12 24 48 72
Cyto
ke
ratin
(U
/L)
0
10000
20000
30000
40000FK-18
ccK-18
C
*
*
*
*
*
Figure 2.3.3. Necrosis predominates following reperfusion. Plasma levels of (A) caspase cleaved (ccK-
18) and (B) full length (FK-19) cytokeratin-18 from ≤6 hours before to 72 hours after liver transplantation.
(C) Comparison of ccK-18 and FK-19 showing significant elevation of FK-18 over ccK-18 at each post-
reperfusion time point except 72hr. ‘Pre’ and ‘Anh’ represent the pre-OLT and anhepatic blood draws,
respectively. (D) Plasma levels of nuclear DNA fragments for the same time points. Data from each time
point is represented as average ± SEM for 18-25 patients. Horizontal dashed line represents average of
healthy volunteers. * = p<0.05
.

38
at each time point, the contribution of ccK-18 to overall cell death is only approximately 10%.
(Figure 2.3.3C). Furthermore, the nuclear protein HMGB1 also peaks at this time point (15.72.4
ng/ml). Since HMGB1 is passively released during necrosis, this increase gives further evidence
to the necrosis at this time point (Figure 2.3.3D). Taken together, this data indicates that necrosis,
rather than apoptosis predominates during all time points.
No evidence for neutrophil involvement in OLT injury. In the rodent model of IRI, liver injury is
largely dependent on Kupffer cell activation and neutrophil recruitment/activation (Ellett et al.,
2009; Jaeschke and Farhood, 1991b; Nace et al., 2013). Therefore, we set out to determine the
extent to which neutrophils are involved in injury following LT in humans. To do this, we
measured neutrophil activation as determined by CD11b expression, (Figure 2.3.4A), ROS
production (Figure 2.3.4B), and phagocytic capability (Figure 2.3.4C). In contrast to markers of
injury and cell death, which peaked early and gradually subsided, we found no significant change
over the 72 hours in these parameters following LT. In fact, all markers of neutrophil activity were
observed to be elevated initially, and then trend downward during this period. When compared to
ALT activity, there was no significant change in neutrophil activity at the same time as peak ALT
concentration suggesting liver injury is not a result of neutrophil activation (Figure 2.3.4D). Taken
together, these data suggest no relevant role for neutrophils in the injury process following OLT,
particularly in the later time points.

39
Reperfusion Duration (hr)
0 12 24 36 48 60 72 84
Ph
ag
ocy
tosi
s (M
FI)
0
10000
20000
30000
40000
50000
60000
B
Reperfusion Duration (hr)
0 12 24 36 48 60 72
CD
11
b E
xpre
ssio
n (
MF
I)
0
2000
4000
6000
8000
A
Reperfusion Duration (hr)
0 12 24 36 48 60 72
CD
11
b E
xpre
ssio
n (
MF
I)
0
2000
4000
6000
8000
AL
T (
U/L
)
0
200
400
600
800
1000
1200
1400CD11b
ALT
E
C
PE-A
Count
Control OLT
D
FITC-A
Count
Control OLT
Figure 2.3.4. Assessment of CD11b expression and phagocytosis following transplantation.
Measurement of (A) CD11b expression and (B) phagocytic activity in neutrophils following OLT in human
patients at various time points before and after reperfusion. Representative histogram showing shifts in (C)
CD11b expression or (D) phagocytosis at 6 hours post-reperfusion relative to healthy volunteers. (E)
Comparison of neutrophil activation (as measured by CD11b expression) and ALT, demonstrating that
peak ALT injury occurs in the absence of increased neutrophil activity. Data from each time point is
represented as average ± SEM for 6-7 patients (CD11b and phagocytosis) or 43-74 patients (ALT).
Horizontal dashed bar represents average of healthy volunteers.
.

40
2.4 DISCUSSION:
In the present study, we set out to examine the cellular events leading to reperfusion injury in
humans following OLT. To do this, we used several circulating plasma biomarkers which are
predictive of mode and mechanism of cell death in other disease models, as well as the mouse
model of IRI (Antoine et al., 2012; McGill and Jaeschke, 2014; Woolbright et al., 2013; Yang et
al., 2014). Because the role of neutrophils following OLT in humans is currently unknown, we
also measured markers of neutrophil activation including CD11b expression, phagocytic
capability, and ROS production.
Based on the results of this study, it appears that there is very little reperfusion injury in the average
transplant patient; most of the observed increase in ALT is likely a result of the ischemic period.
Previous studies have demonstrated that during ischemia, the lack of oxygen delivery causes the
hepatocyte to switch from aerobic metabolism to anaerobic metabolism leading to an increase in
lactic acid concentrations, a rapid decrease in ATP levels, decreased intracellular pH, and an
inability of the cell to maintain homeostasis (Barbiro et al., 1998; Lemasters et al., 1987). As a
result of these changes, a small percentage of cells die during ischemia. However, the majority of
cell death is caused during the reperfusion period during which osmotic forces drive extracellular
fluid into the cell in an attempt to normalize the metabolic perturbations which occurred as a result
of ischemia. This results in cellular swelling and oncotic necrosis.
In our study, nearly all of the markers of injury peak very shortly after reperfusion, which is in
direct contrast to the rodent model of IRI in which injury peaks 12-24 hours post-ischemia. This
rapid peak likely represents a ‘wash-out’ period where reperfusion of the previously ischemic liver
causes release of these markers from necrotic cells. However, the use of preservative solutions and
cold storage minimize the degree of damage (Vine et al., 1989), thus, the overall degree of injury

41
is quite low relative to models of warm ischemia, such as the rodent IRI model, and hypoxic
hepatitis (Weemhoff et al., 2017). This also explains the lack of a robust immune response in that
neutrophils are recruited to eliminate cellular debris from necrotic cells and in the process, release
ROS, such as hypochlorous acid (Hasegawa et al., 2005), which accidentally kill injured
hepatocytes which may have otherwise recovered from the initial hypoxic insult. In the warm
ischemia mouse model, there is extensive injury and thus a robust immune response. Furthermore,
it could be assumed that the number of unhealthy, but not dead, hepatocytes are greater in models
of warm ischemia than in patients following OLT as a result of the use of preservative solutions
which reduce the ionic changes described above, decreased operative time, and decreased storage
time.
Previous studies have suggested that the mitochondria play a key role in ischemic injury through
opening of the MPTP (Kim et al., 2003; Lemasters et al., 1997; Theruvath et al., 2008). Our data
supports this hypothesis in that there is an elevation of mitochondrial specific macromolecules
DNA and GDH, which would only be expected to be present in serum if mitochondrial rupture has
occurred. Interestingly, whereas mtDNA shows a rapid increase and decline, GDH actually shows
a rapid, yet sustained increase (Figures 2.3.2A & 2.3.2B). However, since there is no significant
difference between 6 and 24 hours, and a downward trend is noted after 6 hours, this discrepancy
could be attributed to different half-lives of the macromolecules in plasma.
In contrast to the rodent model of IRI, in which significant injury occurs approximately 6 hours
after reperfusion and is correlated with neutrophil infiltration (Jaeschke et al., 1990), human
patients undergoing OLT experience peak injury much earlier (approximately 1 hour post-
reperfusion) and does not correlated with an increase in neutrophil activity (Figures 2.3.1A and
2.3.4E). In fact, in these patients, markers of neutrophil activity actually tend to decrease following

42
reperfusion. This unexpected finding underscores the difference between the two models of IRI.
In the rodent model, maximum damage is created by occlusion of the portal triad supplying the
left lateral and medium lobe, and the liver undergoes warm ischemia, while during transplantation,
every effort is made to minimize tissue injury though the use of preservatives such as University
of Wisconsin solution, minimizing operative time, and optimizing donor liver for the recipient.
Importantly, livers stored in UW solution prior to transplant are stored at sub-normothermic
temperatures, which slows basal metabolic rate and delays the depletion of ATP (Jain et al., 2008;
Reckendorfer et al., 1992). Thus, the two major inciting causes of reperfusion injury in the mouse
model are ameliorated in human patients. Therefore, very little injury occurs, which would not be
expected to generate a robust inflammatory response.
In addition to storage and operative protocols which minimize damage, other factors may play a
role in the pattern of neutrophil activation observed in the current study. During experimental
induction of IRI in the mouse model, the livers of the ischemic mice are healthy but then greatly
injured, leading to neutrophil infiltration and exacerbation of injury (Jaeschke et al., 1990). On the
other hand, human patients preparing to receive a liver transplant already have injured livers, which
might explain why pre-operative neutrophil activity is already high (Figure 2.3.4A). Following
transplantation, the diseased liver is replaced with a healthier liver, causing neutrophil activity to
actually decrease over the first few days. In addition, many of these patients are on
immunosuppressive medications which may contribute to the tapering of neutrophil activation
observed following reperfusion.
A final point of interest in this study is the observation that necrosis, not apoptosis predominates
during all time points following reperfusion in OLT. While many studies point to apoptosis as the
primary mode of cell death following ischemia, many of these studies rely solely on TUNEL

43
staining, which is not specific for apoptotic cell death. Histopathology can be used to differentiate
between the two forms, but this is not practical for human patients following OLT. Thus, the
cytokeratin-18 assay can be used. During apoptosis, caspases cleave cytokeratin-18 into a
fragmented form, but during necrosis, cytokeratin-18 is passively released in its full-length form.
Thus, the degree of elevation of each form can indicate which mode of cell death is predominating.
In the current study, it is clear that necrosis, not apoptosis, is the mode of injury following
reperfusion. This is in direct contrast with previous studies showing protection against injury when
an experimental caspase inhibitor is added to the preservation solution (Baskin-Bey et al., 2007).
However, protection is only afforded if added to the preservative solution, and at a concentration
high enough to affect other proteases which may be active during necrosis (Schotte et al., 1999).
Thus, therapeutic efforts aimed at minimizing injury should be directed towards minimizing
necrosis, rather than apoptosis.
In the current study, we have characterized the mechanisms and mode of cell death following liver
transplantation in humans. Despite minimal injury, there is still evidence for mitochondrial
involvement in cellular injury which is in agreement with other studies. Furthermore, we have
shown that necrosis, rather than apoptosis predominates following OLT. Overall, the current study
underscores the importance of choosing an animal model which accurately reflects the clinical
experience.

44
3. PLASMA BIOMARKERS TO STUDY MECHANISMS OF LIVER
INJURY IN PATIENTS WITH HYPOXIC HEPATITIS

45
3.1 INTRODUCTION
Hypoxic hepatitis (HH) is a condition resulting from prolonged periods of hypoxia to the liver.
Hypoxic hepatitis is recognized clinically by a hypoxic insult accompanied by sharp increases in
plasma transaminase activity to >20 times normal, and lack of other confounding etiologies of
liver disease, such as viral or drug-induced hepatitis (Henrion et al., 2003; Horvatits et al., 2013).
Typically, the inciting cause for HH involves an episode of cardiogenic, circulatory, or respiratory
failure leading to decreased oxygen delivery to the liver (Henrion et al., 2003). Hypoxic hepatitis
represents a serious source of morbidity and mortality, with a prevalence of approximately 10% in
intensive care patients (Fuhrmann et al., 2010). HH resolves with treatment of underlying causes,
but mortality can reache 50-60% within one month (Fuhrmann et al., 2010; Hawker, 1991;
Horvatits et al., 2013).
Despite the prevalence and mortality of HH, very few studies have examined the cellular
mechanisms underlying liver injury, in part due to the lack of an animal model. The most relevant
model employed experimentally is the hemorrhagic shock/resuscitation model in which rodents
are hemorrhaged to a hypotensive state (low flow ischemia) for a period of time, followed by a
resuscitation period, after which cellular mechanisms of liver injury can be assessed. A major
problem with this model is that liver injury does not always approach the degree of injury seen
during clinical cases of HH, during which ALT levels easily exceed 20 times normal (Jaeschke
and Farhood, 2002; Wetzel et al., 2014; Zuckerbraun et al., 2005), indicating that the model does
not completely recapitulate what is occurring in a clinical setting. Additionally, HH can be
precipitated by a number of causes other than hemorrhagic shock (Henrion et al., 2003).
Furthermore, most of these studies are limited in that they evaluate a time point shortly after

46
(<6hrs) resuscitation, rather than a prolonged time course. Therefore, a different approach to study
the mechanisms of injury during HH is needed.
One such approach is the use of mechanistic biomarkers of liver injury, such as mitochondrial
DNA, microRNA-122 (miRNA-122), total and acetylated HMGB-1 (acHMGB1), and the ratio of
caspase-cleaved to full-length cytokeratin-18. Our laboratory and others have previously used this
approach to characterize both modes of cell death (apoptosis vs. necrosis) and cellular mechanisms
of liver injury in ischemia/reperfusion injury in mice, as well as acetaminophen toxicity and
cholestasis in both mice and humans (Antoine et al., 2012; McGill et al., 2012; Starkey Lewis et
al., 2011; Woolbright et al., 2015; Yang et al., 2014). In addition, a previous study has
demonstrated that miRNA-122 may be a more sensitive marker of liver injury during HH in a
porcine model of cardiogenic shock (Andersson et al., 2012). However, to date, no studies have
employed the use of these biomarkers to characterize the mechanisms of liver injury following HH
in humans. Therefore, the aim of the current study was to assess the mechanisms of liver injury
following HH using circulating plasma biomarkers in order to better understand cellular
mechanisms leading to injury in these patients.

47
3.2 PATIENTS, MATERIALS AND METHODS
Patient Characteristics and Study Design: Subjects with HH were selected from 266 patients who
presented to Banner-University Medical Center Phoenix with initially suspected acetaminophen
(APAP) toxicity. However, only those patients with peak plasma ALT > 1,000 IU/L whose hepatic
necrosis was not caused by APAP (as determined by plasma APAP and APAP-protein adduct
levels), medical history demonstrating a definitive history or strong likelihood of
hypotension/shock, and who were subsequently diagnosed with HH were selected (total of 14
patients). A total of 15 age- and gender-matched subjects with APAP toxicity were selected among
inpatients at the University of Kansas Medical Center or Banner-University Medical Center
Phoenix as comparison. Patients with comorbidities contributing to liver injury (such as alcoholism
or viral hepatitis) were excluded. Blood was obtained upon admission after informed consent, and
then approximately every 24 hours. Because duration of hospitalization differed for each patient,
for the purposes of this study, the day of peak injury (as assessed by clinically measured ALT
levels) was considered ‘day 0’. Following blood collection, blood tubes were centrifuged, plasma
collected, frozen, and sent to the University of Kansas Medical Center or the University of
Liverpool for analysis. All biochemical parameters reported are averages of maximum values, not
necessarily values at the time of peak ALT. All patient samples were procured with approval by,
and in accordance with the Institutional Review Board at both the University of Kansas and Banner
Health Center.
Animals. C57Bl/6J mice were purchased from Jackson Laboratories (Bar Harbor, Maine) and
treated with 700 mg/kg galactosamine/100 µg/kg Salmonella enteritidis endotoxin (Gal/ET). After
6 h, blood was obtained for measurement of plasma caspase-3 activities as described (McGill et

48
al., 2012). All experimental protocols were approved by the Institutional Animal Care and Use
Committee of the University of Kansas Medical Center.
Biochemistry. ALT values reported for all subjects from Banner-University Medical Center
Phoenix were from the hospital laboratory. ALT values for APAP patients from University of
Kansas were measured in our laboratory using a commercially available kit (Pointe Scientific;
Canton, MI). GDH activity was measured in our laboratory as previously described (McGill et al.,
2012).
Mitochondrial DNA. Mitochondrial DNA was measured as previously described (McGill et al.,
2012). Briefly, total DNA was isolated from plasma using the QIAamp DNA Blood Mini Kit
(QIAGEN) and subjected to RT-qPCR using primers for human mtDNA specific NADH
dehydrogenase (ND1: Fwd: ATACCCATGGCCAACCTCCT Rev:
GGGCCTTTGCGTAGTTGTAT). Absolute quantification was achieved with use of a standard
curve using known amounts of DNA from mitochondrial pellets obtained from primary human
hepatocytes, isolated and processed as described previously (Xie et al., 2014a).
Nuclear DNA Fragments. Nuclear DNA fragments from HH subjects and healthy volunteers were
measured using the cell death detection ELISA kit (Roche, Indianapolis, IN) according to the
manufacturer’s instructions (McGill et al., 2012). Change in absorbance over time at 405 nm was
measured and values are reported as percent of control (healthy volunteers).

49
HMGB1 and cytokeratin-18. HMGB1 (total and acetylated) and cytokeratin-18 (cleaved and full-
length) were measured by LC-MS/MS as previously described (Antoine et al., 2012, 2013).
miRNA-122. miRNA levels were measured by qPCR as previously described (Antoine et al., 2013;
Starkey Lewis et al., 2011) and normalized to let-7d, is stably expressed in patients with acute liver
injury and healthy volunteers (Antoine et al., 2013; Qi et al., 2012).
Caspase Activity. Caspase activity was measured using a fluorometric assay as described (Jaeschke
et al., 1998). Briefly, plasma was added to caspase substrate (DEVD; 50µM final concentration)
with or without inhibitor (Z-VAD-fmk; 10µM final concentration). Fluorescence was measured
(excitation 480nm and emission 560nm) over one hour. Caspase activity was measured by
subtracting activity with inhibitor from activity without inhibitor.
Cytokine Measurements. Plasma cytokines were measured by a multi-plex ELISA (Millipore,
Billerica, MA) according to the manufacturer’s instructions. Quality controls were run in duplicate
with the samples and found to be within the normal range.
APAP-CYS Adduct Measurements. Plasma levels of APAP-CYS were measured using HPLC-
ECD as previously described (James et al., 2009; Xie et al., 2015a). Time points as close as
possible to Day 0 (peak ALT) for both APAP and HH patients were used in this analysis.
Statistics. All data are expressed as average ± SEM. Statistics was performed using 1-way ANOVA
with appropriate ad hoc test, or t-test where appropriate.
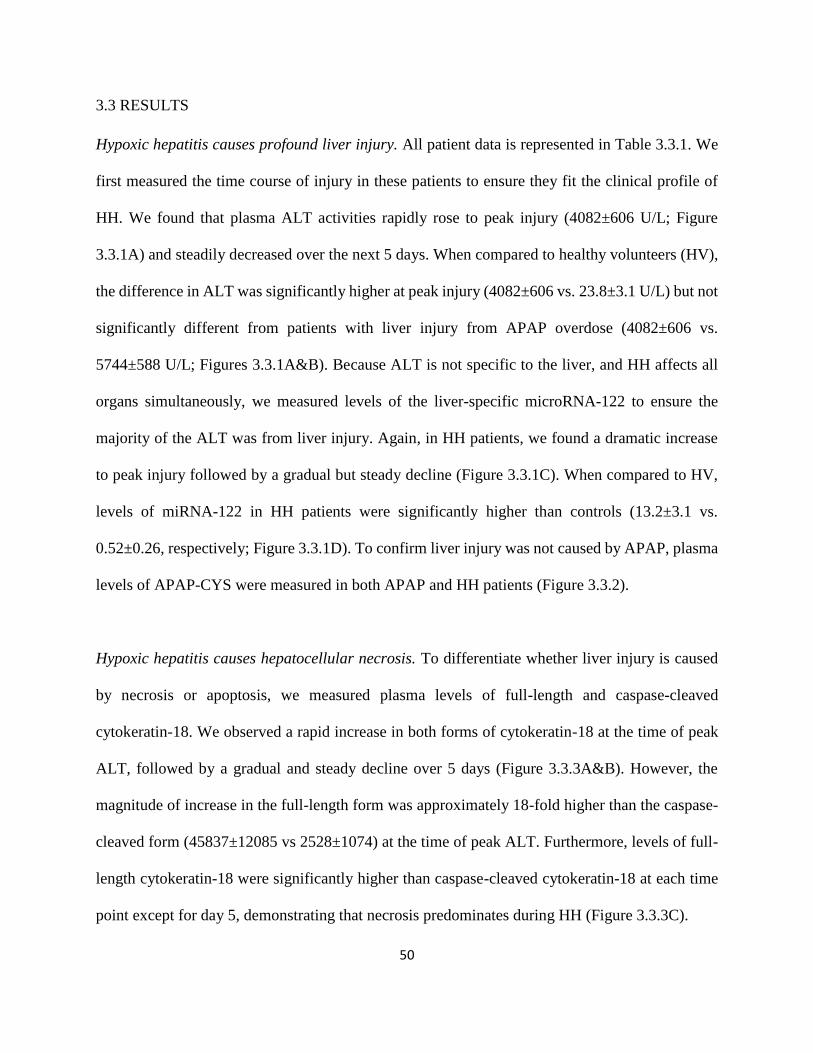
50
3.3 RESULTS
Hypoxic hepatitis causes profound liver injury. All patient data is represented in Table 3.3.1. We
first measured the time course of injury in these patients to ensure they fit the clinical profile of
HH. We found that plasma ALT activities rapidly rose to peak injury (4082±606 U/L; Figure
3.3.1A) and steadily decreased over the next 5 days. When compared to healthy volunteers (HV),
the difference in ALT was significantly higher at peak injury (4082±606 vs. 23.8±3.1 U/L) but not
significantly different from patients with liver injury from APAP overdose (4082±606 vs.
5744±588 U/L; Figures 3.3.1A&B). Because ALT is not specific to the liver, and HH affects all
organs simultaneously, we measured levels of the liver-specific microRNA-122 to ensure the
majority of the ALT was from liver injury. Again, in HH patients, we found a dramatic increase
to peak injury followed by a gradual but steady decline (Figure 3.3.1C). When compared to HV,
levels of miRNA-122 in HH patients were significantly higher than controls (13.2±3.1 vs.
0.52±0.26, respectively; Figure 3.3.1D). To confirm liver injury was not caused by APAP, plasma
levels of APAP-CYS were measured in both APAP and HH patients (Figure 3.3.2).
Hypoxic hepatitis causes hepatocellular necrosis. To differentiate whether liver injury is caused
by necrosis or apoptosis, we measured plasma levels of full-length and caspase-cleaved
cytokeratin-18. We observed a rapid increase in both forms of cytokeratin-18 at the time of peak
ALT, followed by a gradual and steady decline over 5 days (Figure 3.3.3A&B). However, the
magnitude of increase in the full-length form was approximately 18-fold higher than the caspase-
cleaved form (45837±12085 vs 2528±1074) at the time of peak ALT. Furthermore, levels of full-
length cytokeratin-18 were significantly higher than caspase-cleaved cytokeratin-18 at each time
point except for day 5, demonstrating that necrosis predominates during HH (Figure 3.3.3C).

51
Table 3.3.1 Patient Data
Table 3.3.1. Patient characteristics. Clinical parameters and other characteristics of patients diagnosed with HH
and acetaminophen toxicity. Peak values for AST, ALT, creatinine and bilirubin are reported as average ± SEM of
peak value, not necessarily at the time of peak ALT. NR = Not Reported. * = p<0.05.
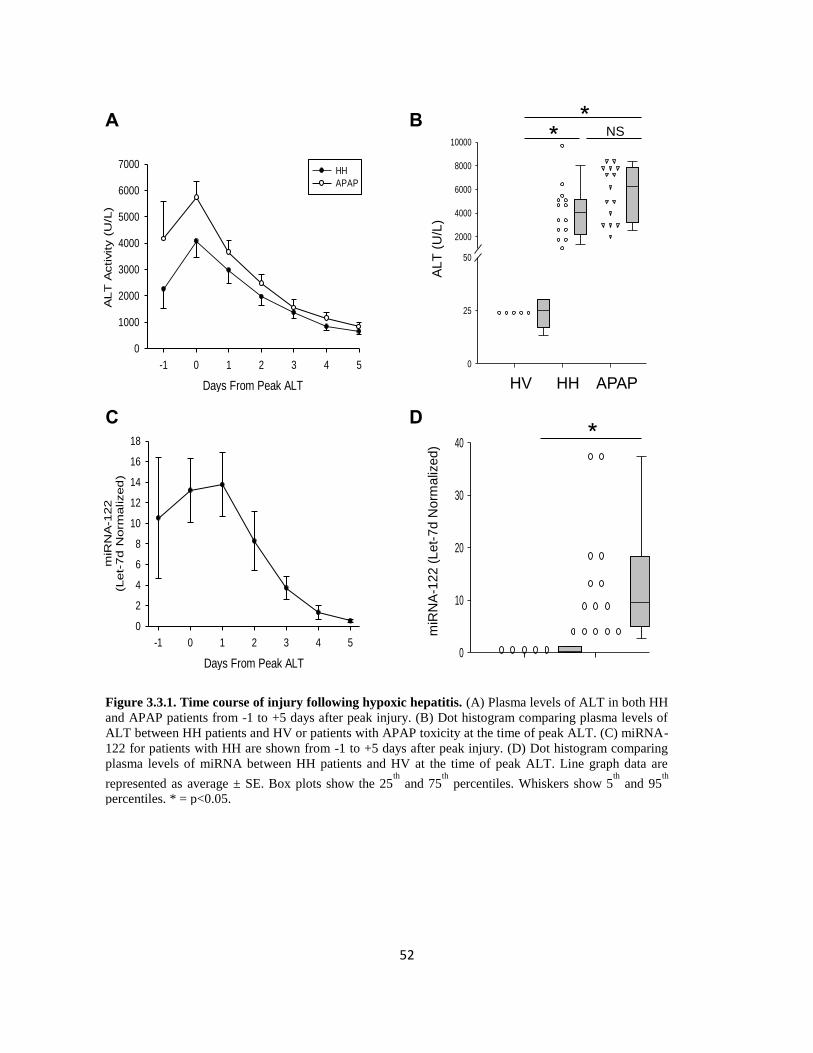
52
Days From Peak ALT
-1 0 1 2 3 4 5
ALT
Activity (
U/L
)
0
1000
2000
3000
4000
5000
6000
7000HH
APAP
A
Days From Peak ALT
-1 0 1 2 3 4 5
miR
NA
-122
(Let-
7d
Norm
alized
)
0
2
4
6
8
10
12
14
16
18
C
0
25
50
2000
4000
6000
8000
10000
B
ALT
(U
/L)
HV HH APAP
* NS *
D
0
10
20
30
40m
iRN
A-1
22 (
Let-
7d N
orm
aliz
ed)
*
Figure 3.3.1. Time course of injury following hypoxic hepatitis. (A) Plasma levels of ALT in both HH
and APAP patients from -1 to +5 days after peak injury. (B) Dot histogram comparing plasma levels of
ALT between HH patients and HV or patients with APAP toxicity at the time of peak ALT. (C) miRNA-
122 for patients with HH are shown from -1 to +5 days after peak injury. (D) Dot histogram comparing
plasma levels of miRNA between HH patients and HV at the time of peak ALT. Line graph data are
represented as average ± SE. Box plots show the 25th
and 75th
percentiles. Whiskers show 5th
and 95th
percentiles. * = p<0.05.

53
HH APAP
Pla
sm
a A
PA
P-C
YS
(uM
)
0
1
2
3
4 *
Figure 3.3.2 Plasma APAP-CYS adducts. Comparison of
plasma APAP-CYS protein adducts in HH or APAP overdose
patients at the time of peak injury. Data are expressed as average
± SE. * = p<0.05

54
Days From Peak ALT
-1 0 1 2 3 4 5
Fu
ll L
en
gth
K18 (
U/L
)
0
10000
20000
30000
40000
50000
60000
A
Days From Peak ALT
Gal/En -1 0 1 2 3
Casp
ase A
ctivity
(RF
U/h
r/u
l p
lasm
a)
0
20
40
60
80
100
D
Days From Peak ALT
-1 0 1 2 3 4 5
Cyto
kera
tin
18 (
U/L
)
0
10000
20000
30000
40000
50000
60000M65
M30
*
* *
*
*
*
C
B
Days From Peak ALT
-1 0 1 2 3 4 5
Casp
ase C
leaved
K18 (
U/L
)
0
1000
2000
3000
4000
Figure 3.3.3. Necrosis predominates during hypoxic hepatitis. Plasma levels of (A) full-length
cytokeratin-18 and (B) caspase-cleaved cytokeratin-18 from -1 to +5 days after peak injury. (C) Total
cytokeratin-18 levels during the same time course demonstrating the relative contributions of each form
of cytokeratin. (D) Caspase activity in plasma at various time points following peak injury. As positive
control for apoptosis, plasma samples were obtained from mice treated with galactosamine/endotoxin for
6 h. Data are represented as average ± SE. * = p<0.05.

55
However, because there was an increase in caspase cleaved cytokeratin-18, we measured caspase
activity in the plasma but found no measureable caspase activity in these samples (Figure 3.3.3D).
Plasma from galactosamine//endotoxin (Gal/ET)-treated animals served as controls for
parenchymal cell apoptosis (Jaeschke et al., 1998). The readily detectable caspase-3 activity in
these animals suggested that if significant caspase-dependent apoptotic cell death occurs, plasma
caspase-3 activity can be measured.
Mitochondrial injury occurs in HH. Numerous in vitro studies suggest mitochondria are targets of
ischemia-reperfusion injury (Lemasters et al., 1997). To test this hypothesis in these patients, we
measured levels of the mitochondria-specific biomarkers GDH and mitochondrial DNA (mtDNA).
Because these macromolecules are located within the mitochondrial matrix, only mitochondrial
damage would be expected to lead to their release in plasma (McGill et al., 2012). Accordingly,
we found an increase in GDH which closely mimicked the increase in ALT – that is, a rapid
increase at the time of peak ALT (1381±229) followed by a gradual but steady decline (Figures
3.3.4A, 3.3.5, 3.3.6, & 3.3.7). Similarly, plasma levels of mtDNA as measured by RT-PCR of the
cytochrome c oxidase (CytC) gene showed a similar downward trend following peak injury (Figure
2.3.4C). Interestingly, neither levels of GDH nor CytC mtDNA in plasma of HH patients were
elevated compared to APAP overdose patients (Figures 3.3.4B & D).
Nuclear DNA fragmentation in HH. Because mitochondrial injury during necrosis releases
endonucleases leading to nuclear DNA fragmentation and cell death (Bajt et al., 2006), we
measured plasma levels of nuclear DNA fragments. Our results show an increasing concentration
of nuclear DNA fragments in the plasma of HH patients which peaks at day zero

56
Days From Peak ALT
-1 0 1 2 3 4 5
CytC
mtD
NA
(ng/m
l)
0
5
10
15
20
25
30HHAPAP
Days From Peak ALT
-1 0 1 2 3 4 5
GD
H A
ctivity (
U/L
)
0
500
1000
1500
2000
2500
3000HH
APAP
0
10
20
30
40
50
0
1000
2000
3000
A
D C
B
GD
H (
U/L
)
HV HH APAP
* NS *
* C
ytC
mtD
NA (
ng/m
l)
HV HH APAP
NS *
Figure 3.3.4. Mitochondrial injury occurs in hypoxic hepatitis. Plasma levels of (A) GDH and (C)
cytochrome c oxidase (CytC) mtDNA for patients with HH or APAP overdose shown from -1 to +5 days
after peak injury. Data are presented as average ± SE. Dot histograms comparing plasma levels of (B) GDH
and (D) CytC mtDNA between HH patients and HV or patients with APAP toxicity at the time of peak
ALT. Box plots show the 25th
and 75th
percentiles. Whiskers show 5th
and 95th
percentiles. * = p<0.05.

57
Days From Peak ALT
-1 0 1 2 3 4 5
En
zym
e A
ctivi
ty (
U/L
)
0
1000
2000
3000
4000
5000
ALT
GDH
Figure 3.3.5 Time course of hepatocellular and mitochondrial
injury. Comparison of plasma levels of ALT (hepatocellular
injury) and GDH (mitochondrial injury) in hypoxic hepatitis
patients from one day before to 5 days after peak ALT. Data are
expressed as average ± SE.
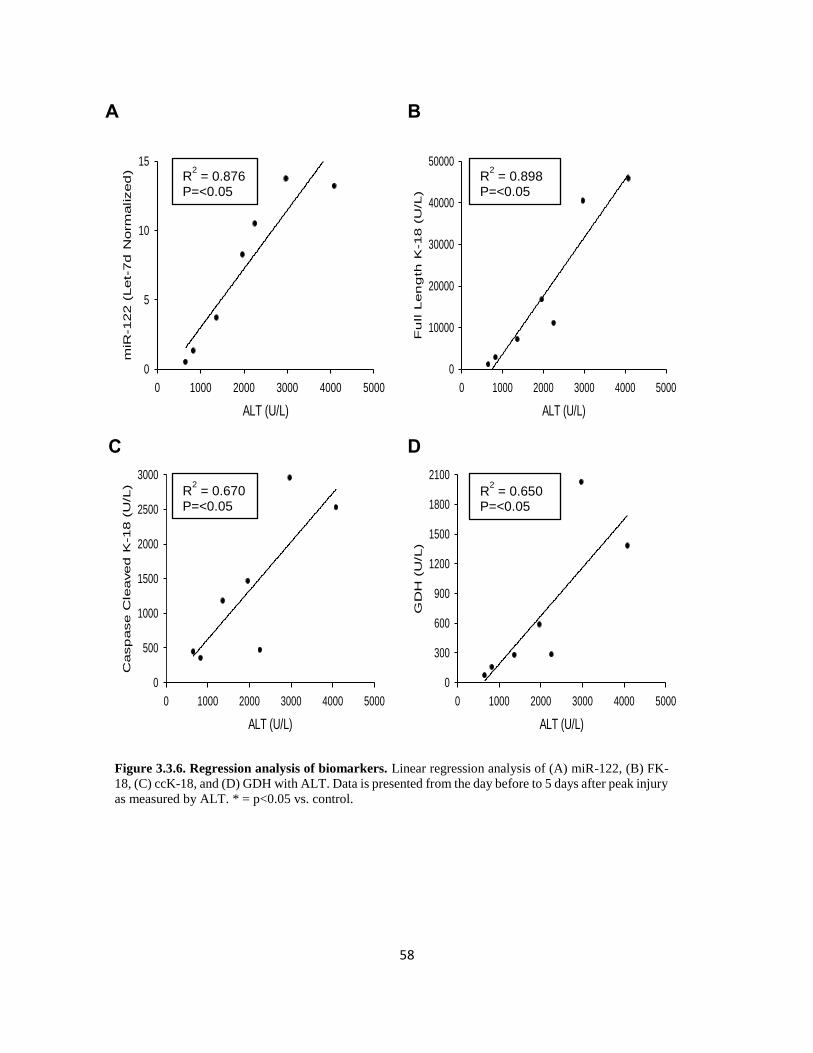
58
ALT (U/L)
0 1000 2000 3000 4000 5000
GD
H (
U/L
)
0
300
600
900
1200
1500
1800
2100
R2 = 0.650
P=<0.05
C
ALT (U/L)
0 1000 2000 3000 4000 5000
Casp
ase C
leaved
K-18 (
U/L
)
0
500
1000
1500
2000
2500
3000
R2 = 0.670
P=<0.05
A
ALT (U/L)
0 1000 2000 3000 4000 5000
miR
-122 (
Let-
7d
Norm
alized
)
0
5
10
15R
2 = 0.876
P=<0.05
B
ALT (U/L)
0 1000 2000 3000 4000 5000
Fu
ll L
en
gth
K-18 (
U/L
)
0
10000
20000
30000
40000
50000R
2 = 0.898
P=<0.05
Figure 3.3.6. Regression analysis of biomarkers. Linear regression analysis of (A) miR-122, (B) FK-
18, (C) ccK-18, and (D) GDH with ALT. Data is presented from the day before to 5 days after peak injury
as measured by ALT. * = p<0.05 vs. control.
D

59
Figure 3.3.7. Regression analysis of biomarkers. Linear regression analysis of (A) CytC, (B) Nuclear
DNA Fragments, (C) Total HMGB1, and (D) Acetylated HMGB1 with ALT. Data is presented from the
day before to 5 days after peak injury as measured by ALT. * = p<0.05 vs. control.
ALT (U/L)
0 1000 2000 3000 4000 5000
Acety
late
d H
MG
B1 (
ng
/ml)
0
1
2
3
ALT (U/L)
0 1000 2000 3000 4000 5000
Tota
l H
MG
B1 (
ng
/ml)
0
10
20
30
40
ALT (U/L)
0 1000 2000 3000 4000 5000Nu
cle
ar D
NA
Frag
men
ts (
% o
f C
on
trol)
0
500
1000
1500
ALT (U/L)
0 1000 2000 3000 4000 5000
CytC
mtD
NA
(n
g/m
l)
0
2
4
6
8
R2 = 0.768
P= <0.05
R2 = 0.765
P= <0.05
R2 = 0.160
P= >0.05
R2 = 0.842
P= <0.05
A B
C D
60
(1444±182%; Figure 3.3.8A). As with GDH, this time course of injury closely mimics that of
ALT. We then compared the levels of nuclear DNA fragments to those observed in APAP patients.
As with GDH and mtDNA, there was no significant difference between HH and APAP patients
(1444±182 vs. 2531±552%, respectively; Figures 3.3.8A & B).
The inflammatory response does not exacerbate HH in later stages. HMGB1 is a nuclear protein
that sits in the minor grove of DNA and modulates transcription of numerous genes. HMGB1 can
be either passively released during necrosis or actively secreted in its acetylated form by
inflammatory cells. Therefore, the two forms of HMGB1 can provide information on the mode of
cell death as well as possible inflammatory cell activation during injury. To confirm necrosis as
the mode of cell death, we measured total levels of HMGB1 and found a similar pattern of change
over the course of injury as all other parameters measured thus far (Figure 3.3.8C). These data are
consistent with our cytokeratin-18 measurements and provide further evidence for necrosis as the
primary mode of cell death. To assess whether or not there is an immune component, we also
measured levels of acetylated HMGB1 and found a reverse pattern – an increase in acHMGB1 at
the later time points. When comparing acHMGB1 to total HMGB1, there is a time-dependent
increase in the percent of acHMGB1 from less than 5% at the peak of injury to 20-30% during the
recovery phase (Figure 3.3.8D). Several studies point to elevated levels of pro-inflammatory
cytokines such as IL-6 and IL-10 during the early phase of HH (Bajt et al., 2006; Wetzel et al.,
2014; Zuckerbraun et al., 2005). To determine whether the elevated acHMGB1 ratio we observed
was an indication of a robust inflammatory response during the later stages of HH, we measured
multiple cytokines. For most cytokines and chemokines, the highest levels were observed at the
early injury with a downward trend at the later stages (Figures 3.3.9A – D).
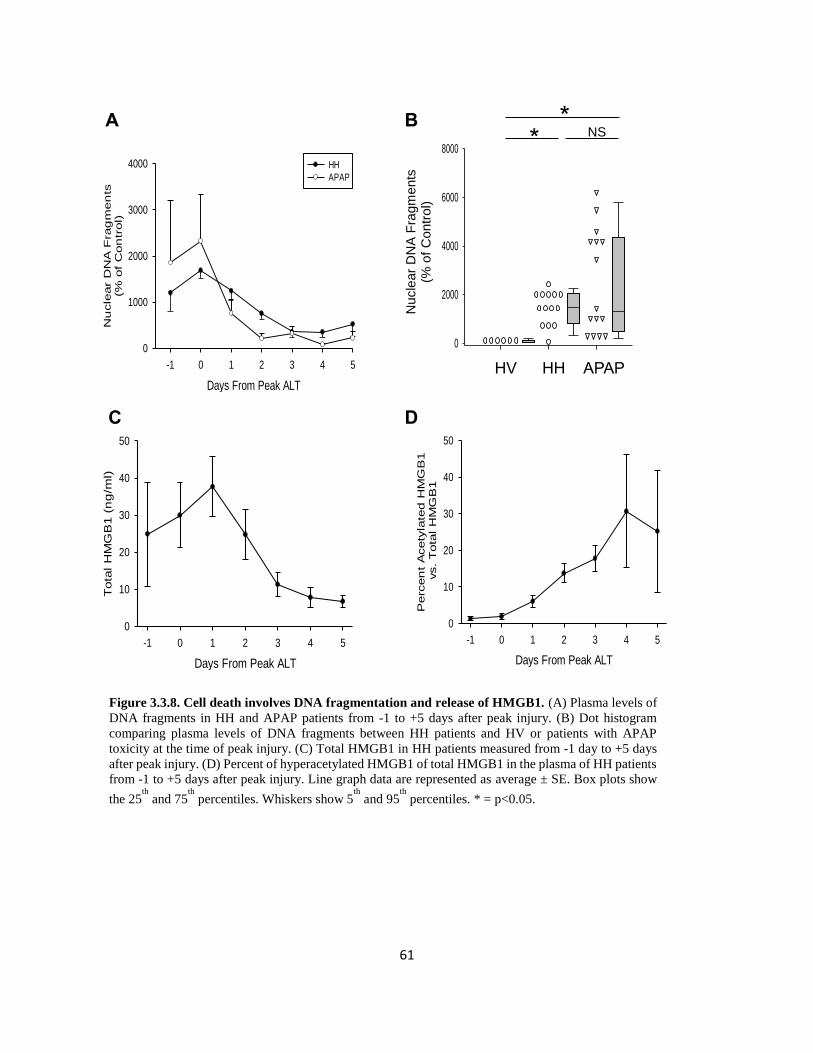
61
Days From Peak ALT
-1 0 1 2 3 4 5
Nu
cle
ar
DN
A F
rag
men
ts(%
of
Con
trol)
0
1000
2000
3000
4000 HH
APAP
A
0
2000
4000
6000
8000
B
*
HV HH APAP
*
Nucle
ar
DN
A F
ragm
ents
(% o
f C
ontr
ol)
NS
Days From Peak ALT
-1 0 1 2 3 4 5
Tota
l H
MG
B1 (
ng
/ml)
0
10
20
30
40
50
C
Days From Peak ALT
-1 0 1 2 3 4 5
Perc
en
t A
cety
late
d H
MG
B1
vs.
Tota
l H
MG
B1
0
10
20
30
40
50
D
Figure 3.3.8. Cell death involves DNA fragmentation and release of HMGB1. (A) Plasma levels of
DNA fragments in HH and APAP patients from -1 to +5 days after peak injury. (B) Dot histogram
comparing plasma levels of DNA fragments between HH patients and HV or patients with APAP
toxicity at the time of peak injury. (C) Total HMGB1 in HH patients measured from -1 day to +5 days
after peak injury. (D) Percent of hyperacetylated HMGB1 of total HMGB1 in the plasma of HH patients
from -1 to +5 days after peak injury. Line graph data are represented as average ± SE. Box plots show
the 25th
and 75th
percentiles. Whiskers show 5th
and 95th
percentiles. * = p<0.05.

62
Days From Peak ALT
TNF-a MCP-1 0 1 2 3
Cyto
kin
e C
on
cen
tration
(p
g/m
l)
0
25
50
1000
2000
3000
4000
5000
TNF-a Control
MCP-1 Control
HH TNF-a
HH MCP-1
Days From Peak ALT
IL-1b IL-1Ra 0 1 2 3
Cyto
kin
e C
on
cen
tration
(p
g/m
l)
0
10
20
30
40
200
400
600 IL-1b Control
IL-1Ra Control
HH IL-1b
HH IL-1Ra
Days From Peak ALT
IL-4 IL-6 0 1 2 3
Cyto
kin
e C
on
cen
tration
(p
g/m
l)
0
50
100
150
200IL-4 Control
IL-6 Control
HH IL-4
HH IL6
A B
C D
Days From Peak ALT
IL-8 IL-10 0 1 2 3C
yto
kin
e C
on
cen
tration
(p
g/m
l)
0
200
400
600IL-8 Control
IL-10 Control
HH IL-8
HH IL-10
*
Figure 3.3.9 Plasma levels of inflammatory mediators during hypoxic hepatitis. Plasma levels of
(A) IL-4 and IL-6, (B) IL-8 and IL-10, (C) IL-1β and IL-1Ra, and (D) TNF-α and MCP-1 in hypoxic
hepatitis patients from day 0 (peak of ALT) to 3 days after peak of injury (line graphs) are compared
to control levels of the same cytokines (healthy volunteers, single plots). Data represent average ± SE
(n = 5-11 patients per time point). * = p<0.05 vs. control.
63
In order to highlight the strong correlation between each of these plasma parameters with ALT,
the time course of ALT vs miR-122, full-length cytokeratin-18, caspase-cleaved cytokeratin-18,
mtDNA, nuclear DNA fragments, and total HMGB1 is shown in the Figure 3.3.10 and 3.3.11. All
parameters show a similar time-dependent increase and subsequent decrease in plasma as ALT
(Figure 3.3.10 & 3.3.11). This is further supported by linear regression analysis, which
demonstrated a significant correlation of each parameter with ALT on each day (Figures 3.3.6 &
3.3.7). The only exception is plasma levels of acetylated HMGB1, an indicator of inflammatory
cell activation, which shows neither a temporary correlation (Figure 3.3.11) nor a significance with
linear regression (Figures 3.3.7).

64
Days From Peak ALT
-1 0 1 2 3 4 5
ALT
(U
/L)
0
1000
2000
3000
4000
5000
Casp
ase C
leaved
K18 (
U/L
)
0
500
1000
1500
2000
2500
3000
3500ALT
cc-K18
C
Days From Peak ALT
-1 0 1 2 3 4 5
ALT
(U
/L)
0
1000
2000
3000
4000
5000
GD
H (
U/L
)0
500
1000
1500
2000
2500ALT
GDH
D
Days From Peak ALT
-1 0 1 2 3 4 5
ALT
(U
/L)
0
1000
2000
3000
4000
5000
miR
NA
-122 (
Let-
7d
Norm
alized
)
0
5
10
15
20ALT
miRNA-122
A
Days From Peak ALT
-1 0 1 2 3 4 5
ALT
(U
/L)
0
1000
2000
3000
4000
5000
Fu
ll L
en
gth
K18 (
U/L
)
0
10000
20000
30000
40000
50000ALT
FL-K18
B
Figure 3.3.10 Relationship between ALT and plasma biomarkers. Side by side comparison
demonstrating relationship between ALT and (A) miR-122, (B) FL-K18, (C) cc-K18, and (D) GDH
Data is presented as the average value from the day before, to 5 days after, peak injury as measured by
ALT. Error bars have been omitted for clarity.
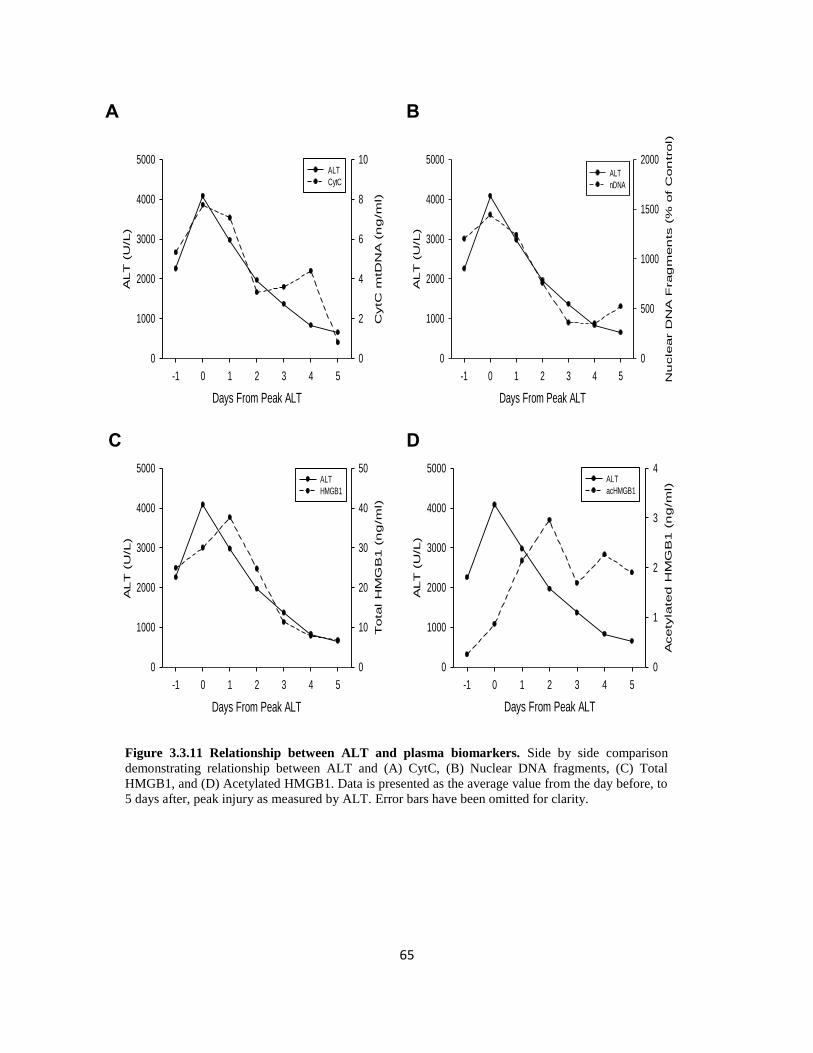
65
Days From Peak ALT
-1 0 1 2 3 4 5
ALT
(U
/L)
0
1000
2000
3000
4000
5000
Tota
l H
MG
B1 (
ng
/ml)
0
10
20
30
40
50ALT
HMGB1
C
Days From Peak ALT
-1 0 1 2 3 4 5
ALT
(U
/L)
0
1000
2000
3000
4000
5000
Acety
late
d H
MG
B1 (
ng
/ml)
0
1
2
3
4ALT
acHMGB1
D
Days From Peak ALT
-1 0 1 2 3 4 5
ALT
(U
/L)
0
1000
2000
3000
4000
5000
CytC
mtD
NA
(n
g/m
l)
0
2
4
6
8
10ALT
CytC
A
Days From Peak ALT
-1 0 1 2 3 4 5
ALT
(U
/L)
0
1000
2000
3000
4000
5000
Nu
cle
ar D
NA
Frag
men
ts (
% o
f C
on
trol)
0
500
1000
1500
2000ALT
nDNA
B
Figure 3.3.11 Relationship between ALT and plasma biomarkers. Side by side comparison
demonstrating relationship between ALT and (A) CytC, (B) Nuclear DNA fragments, (C) Total
HMGB1, and (D) Acetylated HMGB1. Data is presented as the average value from the day before, to
5 days after, peak injury as measured by ALT. Error bars have been omitted for clarity.

66
3.4 DISCUSSION
In the present study, we set out to investigate the mechanisms of injury during HH in patients. To
accomplish this, we investigated a series of circulating plasma biomarkers which characterize
mode and mechanisms of cell death in experimental models and other human liver diseases
(Antoine et al., 2012; McGill et al., 2012; Starkey Lewis et al., 2011; Woolbright et al., 2015;
Yang et al., 2014). Because APAP hepatotoxicity is well-characterized in both animal models and
humans (Jaeschke, 2015), we compared the findings in patients with HH to those in patients with
APAP toxicity.
Liver injury during HH. We found liver injury in our patients fits the clinical profile of HH, mostly
characterized by a sharp rise in ALT greater than 20 times normal. Although not liver specific,
ALT is clinically used for assessment of liver injury. Multiple studies show that miRNA-122 is a
more sensitive and specific indicator of ongoing liver injury, rising earlier and to a much greater
degree than ALT (Roderburg et al., 2015; Starkey Lewis et al., 2011; Wang et al., 2009b). Because
we detected a dramatic increase of the liver-specific miRNA-122 in HH patients similar to that
previously observed in APAP hepatotoxicity, we conclude that the majority of ALT release in
these patients was derived from hepatocytes – an important distinction in the setting of HH, since
hypoxia is not limited to the liver. Our results are consistent with previously reported values of
miRNA-122 in a porcine model of cardiogenic shock (Andersson et al., 2012). Interestingly, our
cohort of HH patients had low plasma levels of adducts (Figure 3.3.2), however such low levels
of adducts are well under the level which would be expected if APAP caused a significant amount
of liver injury (James et al., 2009). More likely, these individuals consumed a therapeutic dose of

67
APAP and adducts were passively released as a result of the hypoxic event leading to HH (McGill
et al., 2013).
Mode of cell death during HH. To differentiate whether or not hepatocellular injury was occurring
as a result of apoptosis or necrosis, we measured plasma levels of cytokeratin-18, an intermediate
filament protein which composes part of the cytoskeleton. During apoptosis, active caspases cleave
cytokeratin creating a neo-epitope which can be recognized by the M30 antibody. In contrast,
during necrosis, caspases are not active and mainly full-length cytokeratin-18 is released. Thus,
the ratio of cleaved/full-length cytokeratin-18 can be used to determine whether cells undergo
apoptosis or necrosis. Given that at any time during the observation period >95% of the detectable
cytokeratin-18 levels in blood of these patients was the full-length form, our data strongly suggest
that necrosis was the dominant form of liver cell death during HH. Even still, we saw significant
elevations in the caspase-cleaved form of cytokeratin-18 at various time points. However, no
detectable caspase activity could be found in plasma of HH patients despite the fact that plasma
caspase-3 activities are readily measurable in experimental models of apoptosis (McGill et al.,
2012). In light of elevated levels of caspase-cleaved cytokeratin-18, however, these results should
be interpreted with caution, since little is known about the stability or half-life of active caspases
in plasma. It is possible that caspases are rapidly degraded or eliminated from plasma before blood
samples are obtained. Therefore, caspase-3 activities, especially at later time points during the
recovery phase could be lower than in the liver. Regardless, when compared quantitatively with
the full-length form of cytokeratin-18 (Figure 3.3.3C), it becomes clear that the vast majority of
injury is caused by necrosis, and that apoptosis, as indicated by cleaved cytokeratin-18, contributes
relatively little to liver injury in this setting.

68
Mitochondrial damage as a hallmark of cell death in HH. In other causes of liver injury, such as
APAP toxicity, in which necrosis is the predominant form of cell death, mitochondria play a major
role in the pathophysiology of injury (Jaeschke et al., 2012a). In the experimental model and in
APAP overdose patients, mitochondrial rupture leads to release of matrix macromolecules which
can be measured in plasma (McGill et al., 2012). Furthermore, endonuclease-G released from
damaged mitochondria translocates to the nucleus where it causes DNA fragmentation and cell
death (Bajt et al., 2006; Jaeschke et al., 2012a). Our results show that the increase in mitochondrial
injury as measured by GDH and mitochondrial DNA mirror the pattern of injury as measured by
ALT. Similarly, levels of nuclear DNA fragments follow this trend. These results provide strong
evidence for mitochondrial damage as a key event in the mechanism of liver cell death in HH
patients. Interestingly, our in vivo results in humans correlate with many experimental studies
which demonstrate a critical role of mitochondria in reperfusion injury (Lemasters et al., 1997;
Powell et al., 2014; Vairetti et al., 2006). It has been shown that during hypoxia, intracellular pH
decreases which actually exerts a protective effect against hypoxic injury (Qian et al., 1997).
However, upon re-oxygenation, intracellular pH returns to normal, precipitating formation of the
MPTP and mitochondrial rupture (Qian et al., 1997; Schwartz et al., 2013). Mechanisms behind
pH-induced mitochondrial injury are thought to involve mitochondrial calcium uptake (Schwartz
et al., 2013). Collectively, a clinical picture begins to emerge: during a period of hypoxia, ATP
levels fall leading to a decreased ability to sequester calcium within mitochondria (Gasbarrini et
al., 1992; Lemasters et al., 1987). Return of oxygen allows for oxidative phosphorylation and
elevated cytosolic calcium levels, leading to mitochondrial calcium sequestration. This incites
formation of the MPTP, which triggers matrix swelling, rupture and necrotic cell death. Based on

69
our previous data, it is possible that endonuclease-G released from ruptured mitochondrial
produces DNA fragmentation, but further studies are needed for verification.
Role of inflammation in HH. Interestingly, we found an increase in acetylated HMGB1
(acHMGB1) protein in plasma of HH patients at later time points. Since macrophages actively
secrete acHMGB1 upon activation (Bonaldi et al., 2003), our data suggest activation of
inflammatory cells during the recovery phase. These findings are consistent with activation of
macrophages and other phagocytes for removal of cell debris and regeneration of the damaged
tissue. However, the majority of cytokines were slightly elevated earlier. Since the gastrointestinal
tract is very susceptible to microcirculatory changes during ischemic injury (Ceppa et al., 2003),
it is possible that intestinal injury allows for bacterial translocation and macrophage activation
before liver injury occurs. Thus, the initial inflammatory response is on the decline at the point
when these blood samples were drawn and the increased acHMGB1 levels, reflecting a sterile
inflammatory response, could be the result of macrophage activation in an attempt to clear debris
rather than exacerbate injury (Jaeschke et al., 2012b). This has also been shown in APAP overdose
patients, where neutrophil and monocyte activation and hepatic infiltration are crucial for liver
repair and regeneration (Antoniades et al., 2012; Williams et al., 2014). This seems very likely
given that injury is decreased at later time points despite an apparent activation of inflammatory
cells. This is in stark contrast to models where inflammation is involved in propagation of injury,
such as no-flow ischemia, in which sterile inflammation leads to exacerbation of injury well past
the point of reperfusion (Jaeschke, 2003).

70
Overall, our data demonstrated that HH, similar to APAP hepatotoxicity, is characterized by
extensive mitochondrial damage and necrotic cell death. Although these mechanistic biomarkers
gave novel insight into the mechanism of these disease states in humans, there was no relevant
difference between the parameters in APAP and HH that would allow a more accurate diagnosis.
However, our previous studies looking at the miRNA profile between these patient groups
indicated that similar miRNAs with different levels and unique miRNAs can be detected in plasma
of these patients suggesting that the miRNA profile may be used to differentiate between APAP
hepatotoxicity and HH (Ward et al., 2014). Thus, plasma biomarkers are useful in both better
understanding the mechanisms of the disease in humans and can be used to aid in the differential
diagnosis.

71
4. COMPARISON OF FRESHLY DIFFERENTIATED AND
CRYOPRESERVED PRE-DIFFERENTIATED HEPARG CELLS
FOR STUDIES OF ACETAMINOPHEN TOXICITY

72
4.1 INTRODUCTION
Drug safety, specifically hepatotoxicity, is a common cause for drug failure during clinical trials
(Arrowsmith and Miller, 2013). The development of a reliable and convenient in vitro model to
assess drug toxicity would help identify hepatotoxic compounds earlier during the drug discovery
process, saving time and minimizing animal experiments. Currently, primary human hepatocytes
(PHH) remain the gold standard for in vitro studies of hepatotoxicity; however, they are not widely
available and are known to lose cytochrome-P450 activity following cryopreservation, limiting
their usefulness in drug metabolism studies (Hengstler et al., 2000). A suitable alternative is the
human cell line HepaRG (Guillouzo et al., 2007; Hewitt et al., 2007). These cells are favorable for
drug toxicity studies because they contain a full complement of drug metabolizing enzymes,
including cytochromes P450 (Aninat et al., 2006; Hart et al., 2010). Although HepaRG cells can
withstand the cryopreservation process, the subsequent growth and differentiation period is
lengthy and inconvenient for high throughput studies. Recently, pre-differentiated cryopreserved
HepaRG (cHepaRG) cells have been developed, but no studies have directly compared these two
preparations in a controlled drug toxicity study.
Acetaminophen (APAP) overdose continues to be a major problem in the United States and
accounts for the majority of acute liver failure cases on a yearly basis (Lee, 2013). At therapeutic
doses, the bulk of APAP is glucuronidated or sulfated and excreted in the urine as inactive
conjugates (Larson, 2007). However, a small percent of the dose is metabolically activated by
P450-mediated conversion to the electrophile NAPQI by cytochrome-P450 mediated metabolism
(Dahlin et al., 1984). This metabolic activation is driven predominantly by CYP2E1 (Lee et al.,
1996), although CYP3A4 (Thummel et al., 1993) and CYP1A2 (Snawder et al., 1994) have also
been shown to contribute to NAPQI formation. Despite the formation of the highly reactive

73
compound NAPQI, APAP is safe at therapeutic doses because the metabolite is detoxified by the
tripeptide glutathione (GSH), which exists at high concentrations within the hepatocyte cytoplasm
(Larson, 2007). However, in cases of APAP overdose, sulfation is overwhelmed and a much higher
percent of the dose is shunted through the P450 system, leading to depletion of GSH (Mitchell et
al., 1973; Xie et al., 2015a) and increased levels of NAPQI (Lee et al., 1996). NAPQI covalently
bind to proteins, particularly mitochondrial proteins (Cohen et al., 1997; McGill et al., 2012; Qiu
et al., 1998; Tirmenstein and Nelson, 1989), leading to mitochondrial stress, membrane
depolarization, and release of endonucleases which translocate to the nucleus leading to cell death
(Jaeschke et al., 2003; McGill et al., 2012). Thus, APAP hepatotoxicity is dependent upon 3 major
processes: metabolic activation, glutathione depletion, and mitochondrial injury, ultimately
culminating in oncotic necrosis. Inhibition of any one or more of these processes prevents the liver
injury.
The acetaminophen model of hepatotoxicity is well characterized, relatively simple, and as
previously stated, requires multiple intracellular events to occur before toxicity is observed.
Therefore, APAP provides an ideal model for identifying any potential differences between freshly
differentiated HepaRG cells and cHepaRG cells.

74
4.2 MATERIALS AND METHODS
Cell culture. All HepaRG cells were obtained from Biopredic International (Rennes, FR). All cells
were stored in LN2 until use. HepaRG cells were grown and differentiated as previously described
(McGill et al., 2011). cHepaRG cells were seeded according to the manufacturer’s instructions and
were acclimated for 1 week prior to initiation of experiments. Frozen PHH were obtained from
Biopredic International (Rennes, FR), CellzDirect (now Life Technologies) and ZenBio (Research
Triangle Park, NC). The frozen PHH were thawed and prepared according to the manufacturer’s
instructions. Before seeding, frozen PHH were centrifuged with 90% Percoll to purify live cells.
Fresh PHH were acquired through the University of Kansas Liver Center from consenting donor
patients presenting to the University of Kansas Hospital. All samples were obtained with approval
from the Institutional Review Board. Once approved, liver tissue was processed as described in
detail (Xie et al., 2014b). All cell lines were maintained at 37oC and 5% CO2 before and during
experiments.
Acetaminophen treatment. At the time of treatment, growth medium was removed and cells were
washed once with 1x PBS and treated with the indicated concentrations of APAP dissolved in
DMSO-free William’s E medium or with Williams’ E medium alone. The cells were harvested at
the indicated time points.
Biochemistry. After acetaminophen treatment, 1 ml cell medium was collected for measurement
of enzyme (LDH or ALT) release. Cells were then washed once with PBS, scraped in cell lysis
buffer, and frozen at -80oC until use. Once thawed, cells were sonicated and LDH concentration
in both medium and cell lysate was measured as previously described (McGill et al., 2011). ALT

75
levels were similarly measured using a commercially available kit according to the manufacturer’s
instructions (Pointe Scientific, Canton, MI).
APAP-protein Adducts. Following acetaminophen treatment, cells were washed once with PBS,
scraped in 10 mM sodium-acetate buffer (pH 6.5), and frozen at -80oC until use. APAP-protein
binding was measured using high-pressure liquid chromatography with electrochemical detection
(HPLC-ECD) as previously described (McGill et al., 2013). The results were normalized to total
protein concentration in cell lysates as determined by the BCA assay.
GSH Depletion. GSH was measured as previously described (Jaeschke and Mitchell, 1990).
Results were normalized to total protein concentration of cell lysate as determined by the BCA
assay.
JC-1 Assay. Mitochondrial membrane permeability was measured with the use of a commercially
available JC-1 Mitochondrial Membrane Permeability Kit (Cell Technology, Fremont, CA) as
described (Bajt et al., 2004).
DNA isolation and qPCR. Cells subjected to P450 mRNA analysis were scraped and stored in Tri®
Reagent (Sigma Chemical, St. Louis, MO) at -80oC until use. After thawing, mRNA was isolated
using a standard protocol and converted to cDNA. cDNA was subject to qPCR reaction using the
following primers: CYP2E1 (fwd: TTGAAGCCTCTCGTTGACCC, rev:
CGTGGTGGGATACAGCCAA), CYP3A4 (fwd: CTTCATCCAATGGACTGCATAAAT, rev:
TCCCAAGTATAACACTCTACACAGACAA), and 1A2 (fwd:

76
TGGAGACCTTCCGACACTCCT, rev: CGTTGTGTCCCTTGTTGTGC) and normalized to β-
actin (fwd: CATGTACGTTGCTATCCAGGC rev: CTCCTTAATGTCACGCACGAT).
Statistics. All data are expressed as average ± SEM. Statistical significance was assessed using
Student’s t-test or one-way analysis of variance (ANOVA) with Tukey’s post-hoc test where
appropriate. All graphs were made using SigmaPlot® software (vers. 12.5). p < 0.05 was
considered significant.

77
4.3 RESULTS
We first compared cell death in four different cell preparations: fresh PHH, frozen PHH, HepaRG
cells, and cHepaRG cells. ALT release was measured in PHH cultures, while LDH was chosen for
HepaRG cultures due to lower expression of ALT in this cell line. Following 24 hour treatment
with 20 mM APAP, cell death was observed in fresh PHH, HepaRG, and cHepaRG cells (enzyme
release: 64±6%, 23±2% and 50±10%, respectively) (Figures 4.3.1A, C, D). Notably, viability in
cryopreserved PHH cultures was poor as indicated by excessive cell death in control samples
(36±10%), which actually decreased after 24 hrs of APAP treatment (27±5%) (Figures 4.3.1B and
4.3.2). Importantly, cell death between cHepaRG and fresh PHH was similar (64±6% vs. 50±10%).
These data suggest that frozen PHH cultures are generally a poor model for drug toxicity studies,
while fresh PHH, HepaRG and cHepaRG cells are useful.
Because no direct comparison of HepaRG and cHepaRG cells has been performed, we wanted to
determine whether or not these cells respond similarly to APAP. We began by measuring full time
courses of enzyme release after APAP treatment. We found that APAP caused a time dependent
increase in cell death in both HepaRG and cHepaRG cells, however, injury occurred faster, and
was more severe, in cHepaRG cells compared to HepaRG cells (16hr vs. 24hr and 50±10% vs.
23±2%, respectively) (Figures 4.3.3A, B). We then performed dose-response studies in both cell
types. Interestingly, in HepaRG cells, there was a significant increase in cell death at 10 mM APAP
but no additional cell death was observed with 20mM APAP (Figure 4.3.3C), despite a clear dose-
response in cHepaRG cells (Figure 4.3.3D). In addition, the degree of injury in cHepaRG cells at
10mM was similar to that in HepaRG cells (28±15% vs. 32±4%). These results are similar to those
observed in Figure 4.3.1C (28±1% vs. 23±2%), but differ from what we have previously reported
(McGill et al., 2011)

78
Time (hr)
0 24
LD
H R
ele
ase
(%
)
0
20
40
60
80
D
*
cHepaRG
Time (hr)
0 24
LD
H R
ele
ase
(%
)
0
20
40
60
80
*
C HepaRG
Time (hr)
0 24
AL
T R
ele
ase
(%
)
0
20
40
60
80 *
A Fresh PHH
Time (hr)
0 24
AL
T R
ele
ase
(%
)
0
20
40
60
80
B Frozen PHH
Figure 4.3.1. Comparison of cell death between primary human hepatocytes and HepaRG cells.
Release of ALT or LDH was measured in (A) fresh and (B) frozen primary human hepatocytes (PHH) as
well as in (C) freshly differentiated (HepaRG) or (D) pre-differentiated cryopreserved (cHepaRG)
HepaRG cells following treatment with vehicle or 20mM acetaminophen. Data are expressed as average
± SE for 3 independent experiments. * = p<0.05 vs. control.

79
Figure 4.3.2. Microscopic comparison of primary human hepatocytes and HepaRG cells. Phase
contrast images (400X) of (A) fresh primary human hepatocytes; (B) cryopreserved primary human
hepatocytes; and (C) Undifferentiated cryopreserved HepaRG cells 24 hours after seeding.
Fresh PHH A
HepaRG C
cPHH B

80
Concentration (mM)
0 10 20
LD
H R
ele
ase
(%
)
0
10
20
30
40
50
60
70
D cHepaRG
Concentration (mM)
0 10 20
LD
H R
ele
ase
(%
)
0
10
20
30
40
50
60
70
* *
C HepaRG
Time (hr)
0 5 10 15 20 25 30
LD
H R
ele
ase
(%
)
0
10
20
30
40
50
60
*
A HepaRG
Time (hr)
0 5 10 15 20 25 30L
DH
Re
lea
se
(%
)
0
10
20
30
40
50
60
*
*
B cHepaRG
Figure 4.3.3. Comparison of time-course and dose-response of cell death between HepaRG and
cHepaRG cells. Release of LDH was measured in (A) freshly differentiated (HepaRG) or (B) pre-
differentiated cryopreserved (cHepaRG) HepaRG cells following treatment with vehicle or 20mM
acetaminophen. Dose response curves following 24hr treatment with vehicle or various concentrations of
acetaminophen in (C) freshly differentiated (HepaRG) or (D) pre-differentiated cryopreserved (cHepaRG)
HepaRG cells. Data are expressed as average ± SE for 3 independent experiments. * = p<0.05 vs. control.

81
Metabolic activation of APAP leads to NAPQI formation which is detoxified by GSH, leading to
decreased GSH levels. Therefore, depletion of GSH can be used as a measurement of metabolism
of APAP into its toxic metabolite. To compare the ability of HepaRG and cHepaRG to form this
reactive intermediate, we treated cells with 20 mM APAP for multiple time points up to 24 hours
and measured GSH. Although HepaRG cells were observed to have higher basal levels of GSH
(98±11 vs. 62±5 nmol/mg protein), we found a similar pattern of GSH depletion with an initial
rapid decrease between 0 and 3 hr which then plateaued (Figures 4.3.4A, B). The dose-response
of GSH depletion was also similar, resulting in approximately 34% and 37% depletion of GSH in
HepaRG and cHepaRG, respectively, after 10 mM APAP, and 68% and 70% depletion of GSH in
HepaRG and cHepaRG, respectively, following 20mM APAP (Figures 4.3.4C, D).
If NAPQI is not detoxified by GSH, it can covalently bind to sulfhydryl groups on cysteine
residues to form APAP-protein adducts. To further test formation of NAPQI in the cells, we
measured the levels of protein-derived APAP-cys and found that although maximum adduct
formation was higher in cHepaRG cells compared to HepaRG cells (0.44±0.05 vs. 0.28±0.04
nmol/mg protein, respectively) (Figures 4.3.5A, B), the time course was similar between the two
preparations. Both HepaRG and cHepaRG cells demonstrated a sharp rise in adduct formation
between 0 and 6 hrs post-APAP treatment, followed by a gradual decline to 24 hrs.
We also compared the levels of P450 mRNA between HepaRG and cHepaRG for those P450s
known to play a role in APAP metabolism. Interestingly, we observed a trend toward higher
CYP2E1 and CYP3A4 mRNA levels in cHepaRG cells which may explain the higher APAP-
protein adduct concentrations in these cells. We also found a slight decrease in CYP1A2 mRNA
levels relative to HepaRG cells. However, these differences were not found to be statistically

82
Time (hr)
0 5 10 15 20 25 30
GS
H (
nm
ol/m
g p
rote
in)
0
20
40
60
80
100
120
*
A HepaRG
Concentration (mM)
0 10 20
GS
H (
nm
ol/m
g p
rote
in)
0
20
40
60
80
100
120
140
*
D cHepaRG
Concentration (mM)
0 10 20
GS
H (
nm
ol/m
g p
rote
in)
0
20
40
60
80
100
120
140
*
*
C HepaRG
Time (hr)
0 5 10 15 20 25 30G
SH
(n
mo
l/m
g p
rote
in)
0
20
40
60
80
100
120
* *
*
B cHepaRG
Figure 4.3.4. GSH Depletion is similar between ‘Regular’ and cryopreserved HepaRG cells. Time
course of GSH depletion following acetaminophen treatment (20mM) in (A) freshly differentiated
(HepaRG) and (B) pre-differentiated cryopreserved (cHepaRG) HepaRG cells. Dose-response of GSH
depletion following acetaminophen treatment in (C) freshly differentiated (HepaRG) and (D) pre-
differentiated cryopreserved (cHepaRG) HepaRG cells at 24 h. Data are expressed as average ± SE for 3
independent experiments. * = p<0.05 vs. control.

83
Time (hr)
0 5 10 15 20 25 30
Adducts
(nm
ol/m
g p
rote
in)
0.0
0.1
0.2
0.3
0.4
0.5
0.6
*
cHepaRG B
Time (hr)
0 5 10 15 20 25 30
Adducts
(nm
ol/m
g p
rote
in)
0.0
0.1
0.2
0.3
0.4
0.5
0.6
*
HepaRG A
Figure 4.3.5. Time course of APAP-protein adducts in HepaRG cells. Acetaminophen-cysteine
protein adducts were measured in (A) freshly differentiated (HepaRG) and (B) pre-differentiated
cryopreserved (cHepaRG) HepaRG cells following treatment with 20mM acetaminophen for various
times. Data are expressed as mean±SE for 3 independent experiments. * = p<0.05 vs. control.

84
significant (Table 4.3.1). Taken together, our results suggest similar phase I drug metabolism
capabilities in HepaRG and cHepaRG cells.
Mitochondrial damage and membrane permeability plays a key role in APAP toxicity. With this
in mind, we set out to determine the extent to which mitochondrial membrane permeability plays
a role in the cell death measured in Figure 4.3.1. We performed the JC1 assay to assess
mitochondrial membrane potential after APAP treatment in both HepaRG and cHepaRG cells.
Again, we found that the two cell preparations showed a similar response to APAP treatment. After
3 hrs, mitochondrial membrane potential decreased 32±1% in HepaRG cells compared to 32±5%
in cHepaRG cells (Figures 4.3.6A, B). Furthermore, mitochondrial membrane potential remained
low relative to control in both HepaRG and cHepaRG cells over 24 hrs. These data suggest that
downstream events occurring during APAP toxicity are similar between the two cell preparations.
Taken together, these data indicate similar mechanisms of toxicity between HepaRG and cHepaRG
cells.

85
Table 4.3.1 CYP Activity Level
Table 4.3.1. Comparison of mRNA levels of major cytochrome P450 enzymes involved in APAP
metabolism between cryopreserved predifferentiated HepaRG cells and undifferentiated
crypreserved HepaRG cells.

86
Time (hr)
0 5 10 15 20 25 30
Fo
ld I
ncre
ase
vs.
Co
ntr
ol
0.0
0.2
0.4
0.6
0.8
1.0
1.2
1.4
* *
* *
A HepaRG
Time (hr)
0 5 10 15 20 25 30
Fo
ld I
ncre
ase
vs.
Co
ntr
ol
0.0
0.2
0.4
0.6
0.8
1.0
1.2
1.4
*
B cHepaRG
Figure 4.3.6. Time course of mitochondrial permeability in HepaRG cells. Red/green ratio from JC-
1 assay (normalized to control) in (A) freshly differentiated (HepaRG) and (B) pre-differentiated
cryopreserved (cHepaRG) HepaRG cells following treatment with 20mM acetaminophen. Each time
point represents average data from at least three groups. * = p<0.05 vs. control.

87
4.4 DISCUSSION
In the present study, HepaRG and cHepaRG cells were compared for their ability to metabolize
APAP and develop subsequent toxicity. To this end, we focused on several aspects of APAP
metabolism and toxicity: GSH depletion, adduct formation, and mitochondrial membrane
permeability, all events shown to be critical for APAP toxicity (Jaeschke et al., 2012a; McGill et
al., 2011). We found that although there were quantitative differences between the two cell
preparations, the overall pattern of injury in cHepaRG cells were similar to HepaRG in all
measured parameters.
Due to inter-species differences, primary human hepatocytes are the gold standard for in vitro drug
toxicity studies. However, limited availability of these cells hinder their usefulness for most labs.
The development of a long-term maintenance medium for PHH (Runge et al., 2000) has helped
with viability of PHH in culture for longer periods of time, however CYP mRNA decreases within
24hrs (Rodríguez-Antona et al., 2002), preventing the use of PHH in prolonged studies of drug
metabolism. Additionally, as we have demonstrated, the viability of frozen PHH following
cryopreservation is poor (Figure 4.3.2E), necessitating their immediate use following procurement.
Thus, the ability to perform rapid high-throughput drug screening with PHH remains difficult.
The human hepatoma cell line HepaRG has been shown to be a comparable alternative to primary
human hepatocytes for studies of drug metabolism (McGill et al., 2011). This cell line is superior
to frozen human hepatocytes for several reasons. First, unlike primary human hepatocytes which
are only sporadically available, HepaRG cells are commercially available. Second, HepaRG cells
have the same level of drug metabolizing enzymes and transporters as primary human hepatocytes
(Anthérieu et al., 2010) making them far more useful for drug metabolism studies than other liver
cell lines such as HepG2, which do not retain CYP levels (Aninat et al., 2006). Third, functional

88
CYP levels in HepaRG cells remain stable over prolonged periods allowing for the possibility of
long term drug toxicity studies (Jossé et al., 2008). Finally, HepaRG have little phenotypic
variation (Lambert et al., 2009) minimizing variation between experiments. Despite these
advantages, the major disadvantage to the use of these cells is a lengthy and inconvenient growth
and differentiation period required prior to the initiation of experiments. Thus, pre-differentiated
cryopreserved (cHepaRG) HepaRG cells represent a convenient alternative.
Interestingly, we found that cHepaRG cells exhibited both decreased basal levels of GSH and
increased CYP2E1 and CYP1A2 mRNA (Figures 4.3.5A, B and Table 4.3.1) when compared to
HepaRG cells. These differences could explain the variation in the magnitude of cell death between
HepaRG and cHepaRG cells observed in the current study (Figure 4.3.1). Although the differences
in CYPmRNA were not statistically significant, the 12-fold increase in CYP2E1, the major CYP
responsible for APAP activation (Manyike et al., 2000), could explain the difference in adduct
formation between the two preparations. With less GSH to detoxify NAPQI, levels of the reactive
intermediate would be expected to increase, leading to greater adduct formation and increased cell
death. This seems likely given the fact that fewer adducts were measured during all time points in
HepaRG cells compared to cHepaRG cells. Nevertheless, the basis for decreased basal levels of
GSH and increased CYP mRNA levels in cHepaRG cells requires further investigation.
Other in vitro models for the study of drug toxicity are lacking in either convenience, availability,
or functional stability. First among these are the use of various immortalized cell lines, such as
HepG2. While the HepG2 line may be useful for certain in vitro studies of liver function, their lack
of CYP enzymes makes them a poor choice for drug metabolism studies (Hewitt and Hewitt,
2004). Other cell lines maintain high CYP levels, such as Huh7, however poor stability at high
confluence in culture prevents their use for long term drug metabolism studies (Guguen-Guillouzo

89
and Guillouzo, 2010). Fresh precision cut liver slices have also been used. While the major
advantage is the retention of the 3D liver architecture, both viability and enzyme level rapidly
decrease following acquisition, as with primary human hepatocytes (Guguen-Guillouzo and
Guillouzo, 2010). Finally, 3D models (spheroids) have been developed which preserve structure
and function of hepatocytes as well as CYP levels (Xia et al., 2012). However, during prolonged
culture of spheroids, extreme care must be taken to maintain spheroid size to optimize results.
Failure to do so would likely lead to differential oxygen or drug delivery to spheroids of various
sizes (Xia et al., 2012) which would be expected to influence the results. Despite multiple in vitro
methods for study of the liver, HepaRG remains the only model which both recapitulates PHH
drug metabolism and possesses the necessary stability in culture for long term studies. The
development of pre-differentiated cryopreserved HepaRG (cHepaRG) cells which are functionally
similar to undifferentiated cryopreserved (HepaRG) cells eliminates the need for lengthy growth
and differentiation required of HepaRG cells.
In summary, we have compared, for the first time, APAP metabolism between freshly
differentiated HepaRG cells (HepaRG) and pre-differentiated cryopreserved HepaRG cells
(cHepaRG). We found that although there were slight differences in the overall magnitude of all
measured parameters between HepaRG and cHepaRG cells, the pattern of toxicity between the
two preparations is remarkably similar following APAP administration. Therefore, we conclude
that pre-differentiated cryopreserved HepaRG cells represent a suitable and convenient alternative
to freshly differentiated HepaRG cells for studies of acetaminophen toxicity.

90
5. DISCUSSION AND FUTURE DIRECTIONS

91
5.1 SUMMARY
In a series of studies, we employed non-invasive methods for the description of the molecular
events leading up to cell death following liver injury from ischemic injury. We explored both cold
and warm ischemic injury in the context of OLT and hypoxic hepatitis, respectively. To do this,
we used a previously established set of biomarkers which are useful in differentiating between
apoptosis and necrosis, determining the role of mitochondria in injury, and identifying a role of
the immune system in injury. Additionally, we demonstrated that there was no significant
difference in acetaminophen metabolism between two preparations of HepaRG cells, paving the
way for the widespread use of the pre-differentiated cryopreserved HepaRG cells in studies of drug
toxicity. This finding will allow for the rapid screening for the potential of hepatotoxicity of
numerous drugs and aid in identification of drugs which may cause idiosyncratic drug induced
liver injury.
5.2 NOVELTY OF THE USE OF BIOMARKERS TO STUDY ISCHEMIC LIVER INJURY
Our findings demonstrate that the use of biomarkers of injury, mode and mechanism of cell death,
and inflammation, are not only novel for the study of ischemic injury in humans, but also
underscore the discrepancy between certain animal models and the ability of these models to
recapitulate the human condition. For instance, following warm ischemia in the rodent, there is a
marked immune response which leads to exacerbation of injury. In contrast, during warm ischemia
in humans, such a response does not occur. One detail of these studies which sets it apart from
other studies using biomarkers is that we collected samples for an extended time frame, rather than
studying a single time point, or a short time course shortly after the ischemic event. The importance

92
of this can be underscored by comparing our findings to previously published data from the mouse
model of ischemic injury. In this model, there are two phases of injury – the early stage, in which
ischemic injury leads to cell death, and the late stage, in which cellular debris (DAMPs) released
from necrotic cells in the early stage leads to activation of macrophages, recruitment of neutrophils,
and subsequent injury. In studies which only examine a short time course following ischemia, the
late phase, during which inflammation plays a major role may be overlooked. Thus, these
biomarkers represent a convenient way to obtain detailed information into the events leading to
liver injury well after the initial injurious event. The fact that the injury pattern in the later stages
of ischemia in humans did not have a similar pattern seen in the mouse model of ischemia,
demonstrates the critical importance of prolonged monitoring and highlights the importance of
selecting appropriate animal models when studying human conditions. In the case of the rodent
model of ischemia, the ischemic time is titrated in order to study mechanisms of injury. A major
drawback to using the rodent model of ischemia is that due to surgical advances, the level of injury
observed is not well represented by a mouse model based on prolonged ischemic times. Future
studies using the rodent model of ischemic injury as a surrogate for human liver transplantation
should be designed and interpreted with this in mind.
5.3 APOPTOSIS VS. NECROSIS IN ISCHEMIC LIVER INJURY
Quite possibly one of the biggest ongoing disputes within the study of ischemic liver injury is
whether cells die via apoptosis or necrosis. While this may seem like an academic argument, there
exists a great deal of clinical significance; targeting the appropriate mode of cell death could be
expected to minimize the progression of injury following ischemic insult in man. While some
literature suggests apoptosis is the primary form of injury following ischemia (Compagnon et al.,

93
2017; Freitas et al., 2017; Ko et al., 2017), we have demonstrated that following warm ischemia,
necrosis appears to be the predominant form of cell death (Weemhoff et al., 2017; Yang et al.,
2014). Likewise, unpublished results from our laboratory demonstrate the same is true with cold
ischemia following liver transplantation. While biopsy with histopathologic analysis would be
needed to confirm necrosis following OLT and HH, our laboratory has shown previously, that
following an episode of warm ischemia, >99% of cells die by necrosis. (Yang et al., 2014). One
problem with many studies claiming that apoptosis is the primary mode of cell death is the use of
only a single time point or inappropriate conclusions drawn from the use of the TUNEL assay.
Even cytokeratin biomarker data can be misinterpreted if not presented or interpreted properly.
For instance, one study demonstrates that following ischemic injury there is an increase in caspase-
cleaved keratin-18 at 6hrs post reperfusion. However, data for full length keratin-18, or additional
time points, are not shown. Indeed, even in our studies, we have shown that in both types of
ischemic injury, caspase cleaved keratin can be elevated during reperfusion relative to healthy
volunteers, and can even be elevated relative to other time points. However, when taken in context
of the entire time course of injury, and in relationship to full length keratin, it becomes obvious
that necrosis is the predominant mode of cell death. Similarly, many studies rely only on TUNEL
staining to conclude that apoptosis is the primary form of cell death. However, it is well known
that the TUNEL assay is not specific for apoptotic cell death (Grasl-Kraupp et al., 1995). Thus,
data obtained from the TUNEL assay should be interpreted with caution.
Although both necrotic and apoptotic cells are identified using the TUNEL assay, we have
previously shown that the pattern of TUNEL staining can be used to help differentiate between the
two forms of cell death (Yang et al., 2014). As discussed previously, apoptotic cells will typically
appear as small, condensed cells, either individually or in clusters, due to the apoptotic process. In

94
contrast, necrotic cells typically appear as large diffuse areas of staining due to membrane rupture
and release of stain into the surrounding area. Because of the propensity for misinterpretation of
the TUNEL assay, researchers intending to differentiate between the two forms of cell death in the
absence of histopathology should use a secondary method in conjunction with the TUNEL assay.
Such methods include, but are not limited to, caspase activity assays, Western blotting for cleaved
caspase-3, and interventional studies using caspase inhibitors and/or necrostatins when possible.
Even still, studies can be misinterpreted; a study claiming that apoptosis predominates after OLT
was based on the fact that caspase inhibitors added to the preservative offered some protection
against cell death. However, this study did not take into the account that the caspase inhibitors
were added to the preservative at a concentration high enough to non-specifically inhibit proteases
which may be responsible for necrotic cell death (Schotte et al., 1999).
5.4 MITOCHONDRIAL INVOLVEMENT IN ISCHEMIC LIVER INJURY
In addition to the differentiation between apoptosis and necrosis, we also demonstrated that
mitochondria play a role cell death following ischemic injury. This finding confirms earlier cell
culture data in which treatment of hepatocytes with mitochondrial protectants minimized injury
following ischemia. In our studies, we measured GDH and mitochondrial DNA to identify
mitochondrial injury and found a rise in GDH which mimicked that of ALT. The rise in GDH is
significant because it implicates the mitochondria as an important component of cell death. An
argument against this could be that the assay is measuring GDH from intact mitochondria released
into circulation following cell death, implying that cell death occurs independently of
mitochondrial injury. However, in our studies, plasma samples were centrifuged to remove intact
mitochondria prior to the measurement of GDH. In addition, it has been shown that cell death can

95
occur in the absence of mitochondrial injury (McGill et al., 2012). Based on these findings, future
research should explore the exact role mitochondrial injury plays in the pathophysiology of
ischemic injury in patients. Currently, mitochondrial targeted therapies (such as Mito-tempo) are
being developed to protect against drug induced liver injury (Du et al., 2017). The use of these
agents could also be explored in the context of ischemic liver injury for potential use in the clinic
in these patients.
5.5 INFLAMMATION FOLLOWING ISCHEMIC LIVER INJURY IN HUMANS
Based on our data, we conclude that inflammation does not play a major role in liver injury
following transplantation or hypoxic hepatitis. This is in stark contrast to conclusions made about
liver transplantation based on the mouse model. The most likely explanation for the discrepancy
between the injury pattern between the two models is the preservation period during the ischemic
period in OLT. Factors such as preservation techniques, optimal surgical strategy, and appropriate
donor-recipient matching all help minimize the degree of injury which occurs during the ischemic
period. As we know from the rodent model, it is the initial injury and release of DAMPs which
leads to macrophage activation, the recruitment of neutrophils, and additional injury (van Golen
et al., 2012; Jaeschke et al., 1990, 1992). Therefore, it stands to reason that with very little injury
to begin with, there would be little to no response by the immune system. Indeed, data from both
studies suggest that inflammation plays little to no role in the development of injury in our patients.
For liver transplantation, the combination of preservatives and limited cold ischemia time could
explain the lack of injury (and subsequent inflammation). However, during hypoxic hepatitis (HH),
the lack of inflammation can less easily be explained, as this condition experiences warm ischemia
for prolonged periods of time, similar to the rodent model. Nevertheless, based on the pattern of

96
liver injury observed in these patients, inflammation does not appear to exacerbate liver injury.
Likewise, with liver transplantation, we would expect an increase in ALT at times well after
reperfusion if inflammation played a key role in the late stages of injury. Furthermore, this rise in
ALT would likely correlate with activation of the immune systems, as in the rodent model.
However, following liver transplantation, we did not observe a change in neutrophil activation
suggestive of an immune component of injury. Instead, we observed an increase in ALT only
shortly after ischemia with a gradual decline to baseline levels over time. Because neutrophil-
depleting antibodies are protective against ischemic injury in mice (Jaeschke et al., 1990), the lack
of neutrophil activation in our patients strongly suggests the lack of an inflammatory component.
However, the direct measurement of pro- and anti-inflammatory cytokines would be necessary for
a more direct and conclusive assessment of the immune response following liver transplantation.
Even still, neutrophil and cytokine data would need to be interpreted in conjunction with liver
injury, as neutrophil infiltration occurs in other models of liver injury, namely acetaminophen
toxicity, without causing additional injury (Williams et al., 2014). In this model, neutrophil
infiltration is thought to be beneficial for initiation of the regenerative response (Williams et al.,
2014).
Not surprisingly, the degree of injury in HH patients was significantly higher than in OLT patients.
In our study however, survival following HH was higher than reported in the literature (93% vs.
50%) (Fuhrmann et al., 2010; Hawker, 1991). While there exist several possible explanations for
this discrepancy, the most likely is that in our study, patients were mostly healthy individuals with
a single documented episode of hypotension, often induced by an opioid overdose. In contrast,
numbers reported in literature often reflect elderly patients with significant health issues including

97
cardiac or respiratory disease (Fuhrmann et al., 2009). Other reasons for the discrepancy could
involve other co-morbidities not identified or accounted for in our study. Another likely cause for
the discrepancy in survival rate amongst hypoxic hepatitis patients is simply the sample size of our
study, which included only 13 patients. The incorporation of more patients into our hypoxic
hepatitis study would be beneficial for the advancement of our knowledge of this field and allow
us to subdivide patients based on co-morbidities and underlying cause of the initial ischemic insult.
Furthermore, a larger patient population would possibly allow us to use this biomarker data to aide
in prognosis of these patients. One major obstacle for the addition of additional patients to this
study is that a diagnosis of HH is made only after ruling out other causes of liver injury (namely
DILI). Therefore, any patient whose clinical symptoms match those of hypoxic hepatitis would
need to be enrolled in a study prior to a diagnosis of HH. This alone does not present much of a
challenge, but multiple blood collections would need to be obtained while a diagnosis is pending.
Furthermore, markers of neutrophil activation, such as CD11b expression, ROS production, and
phagocytic activity need to be measured within hours of blood collection. While none of these are
insurmountable obstacles, an ongoing study of HH would need to account and plan for the
consumption of added time and expenses for patients who, in the end, may not even be diagnosed
with HH.
Due to the discrepancies between the rodent model of ischemia and the pattern of injury following
cold and warm ischemia studied in this dissertation, it is at least clear that the rodent IR models as
they are currently used are not appropriate for translation to OLT patients. Furthermore, based on
the degree of injury in our HH patients, it is equally clear that the HH model in rodents, mainly

98
hemorrhagic shock/resuscitation, needs to be refined to be more consistent and representative of
the degree of injury in humans.
5.6 COMPLICATIONS FOLLOWING ORTHOTOPIC LIVER TRANSPLANTATION
A major conceptual difference between the mouse model of ischemia and extrapolation to human
transplantation is that the mouse model focuses on degree of injury as an end-point. In human liver
transplantation, every effort is made to minimize injury, but the degree of injury as measured by
ALT is not the end-point. In fact, the degree of injury following surgery provides the physician
very little information as to the success or likely outcome of the procedure. This is exemplified by
the fact that graft rejection following transplantation is seldom due to acute hepatocellular injury,
but rather due to complications arising from the biliary system (Seehofer et al., 2013; Song et al.,
2014; Wojcicki et al., 2008). The most common cause of complications from OLT today are, in
fact, biliary strictures (Karimian et al., 2014). Unpublished data from our study show that about
20% percent of patients developed biliary stricture and this is in line with previously published
reports (Giacomoni et al., 2006; Kochhar et al., 2013; Soejima et al., 2006). However, we did not
find any correlation between the development of stricture and graft failure, or survival.
Furthermore, of major importance is that the majority of these strictures were extrahepatic, rather
than intrahepatic biliary stricture. One common cause for these types of strictures are typically due
to surgical technique or donor matching (biliary ductal size mismatch) (Karimian et al., 2014;
Verdonk et al., 2006). In our study, most patients received biliary stents at the time of
transplantation, minimizing or eliminating the risk of stricture formation. Of more concern, are
intrahepatic biliary strictures, which are thought to be caused due to ischemic injury of the biliary
epithelial cells (Buis et al., 2006; Sanchez-Urdazpal et al., 1992). Indeed, it has been shown that

99
biliary epithelial cells are more susceptible to ischemia than hepatocytes (Imamura et al., 1997;
McKeown et al., 1988; Noack et al., 1993) and this leads to areas of stenosis within the biliary
tree, leading to chronic injury and complications. Intrahepatic biliary strictures seem to be more a
result of warm ischemic-time than cold ischemic time because when they occur, they generally
occur in patients who received a liver from a donor after cardiac death (Pine et al., 2009). During
organ harvest, the liver can be harvested following declaration of brain death or cardiac death.
During brain death, the liver may still be receiving adequate blood flow from the heart up until the
time of removal. Thus, there is minimal warm ischemia. Conversely, the organ may be harvested
following cardiac death, which can be a prolonged process involving hypotension, hypoperfusion,
and prolonged warm ischemic injury well before the organ is harvested. In our study, it is unknown
as to which patients received a liver from a donor following brain or cardiac death, but the low
incidence of non-anastomotic biliary strictures suggests that most xenografts were obtained
following brain death. Though it is generally accepted that non-anastomotic biliary strictures are
primarily a function of warm ischemia, (Abt et al., 2003; Cursio and Gugenheim, 2012; Pine et al.,
2009; Taner et al., 2012; de Vera et al., 2009) they are not a commonly reported complication of
hypoxic hepatitis. This is an interesting observation because during hypoxic hepatitis, the liver
undergoes prolonged warm ischemic times and thus these strictures would be expected to occur in
high frequency in these patients. One explanation for this discrepancy could simply be that due to
the high mortality rate with hypoxic hepatitis, many patients do not survive long enough to develop
biliary stricture. Alternatively, the pathophysiology of biliary stricture could be multifactorial and
involve more than ischemic injury to biliary epithelial cells. Thus, long term monitoring of patients
following an episode of hypoxic hepatitis might provide valuable information into the role of warm
ischemia on the pathophysiology of non-anastomotic strictures.

100
The fact that there were very few intrahepatic biliary stricture patients in our study is consistent
with the overall degree of injury following liver transplantation and can also be attributed to both
cold ischemia (vs. warm ischemia) and the use of preservatives. There have been studies
suggesting that certain miRNAs released from biliary epithelial cells upon their death may be
predictive for the formation of intrahepatic biliary stricture (Verhoeven et al., 2013). However,
due to deviation from standard of patient care combined with the invasive nature of the procedure,
the collection of bile over an extended period of time for the measurement of miRNA was not
possible for our study and we were unable to explore this hypothesis. Thus, follow up studies for
this purpose would provide significant information as to the pathophysiology of the development
of biliary strictures. Regardless, our studies show that biomarkers represent a convenient and easy
way to study both these conditions when invasive methods are unavailable or contraindicated.
5.7 UNDIFFERENTIATED VS. PRE-DIFFERENTIATED CRYOPRESERVED HEPARG
CELLS
HepaRG cells have been used in the laboratory since 2002 (Gripon et al., 2002) and are useful
compared to other cell lines for a variety of reasons. Importantly for studies of drug metabolism,
HepaRG cells carry a full complement of active CYP enzymes while other cell lines, such as
HepG2, do not (Aninat et al., 2006; Kanebratt and Andersson, 2008; Sassa et al., 1987). Because
of the time-consuming nature of their growth and differentiation process, HepaRG cells are not
always practical for short experiments in the lab. To overcome this obstacle, and promote the
widespread use of this cell line, methods to cryopreserve differentiated HepaRG cells have been
developed. While the growth and differentiation process remain the same, the cells are preserved
in a differentiated state. Upon initiation of an experiment, the cells are thawed, plated, and allowed
to grow for a short period (approximately 1 week) prior to their use in experiments. In contrast,

101
HepaRG cells purchased at passage 17 would require a minimum of 8 weeks for growth and
differentiation. However, prior to the onset of our study, no group has directly compared the pre-
differentiated HepaRG cells to the undifferentiated cells. Our findings detailed in Chapter 4
demonstrate that the two different preparations respond biologically similarly and thus can be used
interchangeably. Perhaps of equal importance, we demonstrated that these cells are also
comparable to primary human hepatocytes, the gold standard for in vitro hepatotoxicity research.
Since primary human hepatocytes are only sporadically available, require special and lengthy
isolation techniques, and do not tolerate the freeze/thaw cycle well, their use is often limited to
laboratories equipped to handle their immediate isolation and use. These findings set the stage for
the widespread use of HepaRG cells in drug toxicity studies.
Acetaminophen toxicity is the most common cause of liver failure in the United States (Budnitz et
al., 2011; Lee, 2013). This is due, in part to the fact that acetaminophen is readily available as an
over-the-counter analgesic and antipyretic. In fact, according to the FDA, more than 24 billion
doses of acetaminophen were sold in 2008 and more than 48 million people use acetaminophen on
a regular basis. In addition to this, acetaminophen is commonly added to opioid analgesics such as
Vicodin (hydrocodone and acetaminophen) and Percocet (oxycodone and acetaminophen). This
strategy allows for the reduction in opioid, and its potential for habit forming behavior, without
compromising pain relief for the patient. However, if patients are unaware that these medications
contain acetaminophen, they are likely to self-administer additional acetaminophen for the relief
of break-through pain. This can lead to accidental overdose. Indeed, in 2011 there were over
80,000 cases of acetaminophen, 50% of which led to acute liver failure (Budnitz et al., 2011).
While an antidote exists (N-acetylcysteine), this is only effective if given shortly after a toxic dose.
Since many overdoses are either unknown or intentional, this becomes impractical in the clinical

102
setting. Thus, the study of the mechanisms of acetaminophen toxicity and interventions to
minimize injury after the window during which NAC would be effective has tremendous
application in the clinical setting.
APAP hepatotoxicity is well characterized in humans and rodents; it is known to involve CYP-
mediated metabolic activation, glutathione depletion, and mitochondrial injury. Because of the
frequency with which acetaminophen hepatotoxicity occurs, we used the acetaminophen model of
drug induced liver injury to identify any potential differences between freshly differentiated
HepaRG cells and cHepaRG cells. As discussed in the previous chapter, we found that the response
to acetaminophen toxicity between both cell preparations were remarkably similar with respect to
all facets of acetaminophen toxicity.
However, despite the similarities, we did see a difference in CYP mRNA levels. While this
difference was not statistically significant and did not appear to affect the overall behavior of the
cells, cryopreserved pre-differentiated HepaRG cells had a higher expression of CYP2E1, 3A4,
and 1A2 than their counterpart. One possible explanation for this could lie in the growth and
differentiation process, during which approximately 50% of the total cell population become
hepatocytes and the rest develop into biliary epithelial cells (Gripon et al., 2002; Parent et al.,
2004). This, however, is a rough estimate and each individual culture could have more of one type
than the other. Thus, when working with HepaRG cells, CYP mRNA levels should be normalized
to hepatocyte specific proteins, such as albumin. Nevertheless, despite the absolute expression of
CYP enzymes, CYP activity between the two were not different. Thus, we conclude that the pattern
of toxicity and injury is similar between the two preparations suggesting they can be used in other
models of DILI. Since hepatotoxicity is the most common cause of drug failure and post-market
withdrawal, the widespread use of HepaRG cells in the drug development process would likely

103
help identify drugs with the potential for hepatotoxicity before they make it to clinical trials or to
market. By identifying these compounds earlier in the process, there exists not only a financial
benefit to the pharmaceutical company, but more importantly, a significant decrease of risk to the
general public.
The overall convenience of these cells can be extrapolated to other areas of hepatology. In fact,
our laboratory has already demonstrated that in addition to similarities in the metabolism of
acetaminophen, HepaRG cells respond similarly to primary human hepatocytes in studies of bile
acid toxicity, eliminating the need for the primary cell line for these studies.(Woolbright et al.,
2016) HepaRG cells could theoretically replace PHH for ischemic hepatitis studies. Furthermore,
the use of HepaRG cells could expedite the field of biomarker research by serving as a platform
for the identification of additional hepatocyte or biliary biomarkers of injury, or even regeneration,
under a variety of conditions. Indeed, studies are already using these cells in biomarker research
following drug toxicity.(Marrone et al., 2016) Finally, because HepaRG cells are a mixed
population of hepatocytes and biliary epithelial cells, this cell line could potentially be used in
studies of biliary epithelial cells.
5.8 CONCLUDING REMARKS
In summary, we have demonstrated that the use of previously identified biomarkers can be useful
in describing the events following both warm and cold ischemic injury in humans. While our
findings and conclusions provide significant advances to our understanding of the pathophysiology
of ischemic injury in patients, more research is necessary to refine this knowledge. Future studies
should be directed at determining the role of mitochondria in cell death following ischemia,
identifying biomarkers of biliary injury and stricture, and identifying biomarkers of prognosis and

104
outcome. Based on our findings with the HepaRG cell line, the widespread use of these cells may
help to accelerate research and discovery within the field of drug hepatoxicity and safety studies,
particularly acetaminophen.

105
REFERENCES:
Abt, P., Crawford, M., Desai, N., Markmann, J., Olthoff, K., and Shaked, A. (2003). Liver
transplantation from controlled non-heart-beating donors: an increased incidence of biliary
complications. Transplantation 75, 1659–1663.
Aden, D.P., Fogel, A., Plotkin, S., Damjanov, I., and Knowles, B.B. (1979). Controlled synthesis
of HBsAg in a differentiated human liver carcinoma-derived cell line. Nature 282, 615–616.
Alcorn, J.M., and Miyai, K. (1992). Aortic dissection and hepatic ischemia. J. Clin. Gastroenterol.
14, 180–182.
Aldridge, D.R., Tranah, E.J., and Shawcross, D.L. (2015). Pathogenesis of hepatic
encephalopathy: role of ammonia and systemic inflammation. J. Clin. Exp. Hepatol. 5, S7–S20.
Alkhouri, N., Carter-Kent, C., and Feldstein, A.E. (2011). Apoptosis in nonalcoholic fatty liver
disease: diagnostic and therapeutic implications. Expert Rev. Gastroenterol. Hepatol. 5, 201–212.
Amacher, D.E. (2002). A toxicologist’s guide to biomarkers of hepatic response. Hum. Exp.
Toxicol. 21, 253–262.
Andersson, P., Gidlöf, O., Braun, O.O., Götberg, M., van der Pals, J., Olde, B., and Erlinge, D.
(2012). Plasma levels of liver-specific miR-122 is massively increased in a porcine cardiogenic
shock model and attenuated by hypothermia. Shock 37, 234–238.
Aninat, C., Piton, A., Glaise, D., Charpentier, T.L., Langouët, S., Morel, F., Guguen-Guillouzo,
C., and Guillouzo, A. (2006). Expression of cytochromes P450, conjugating enzymes and nuclear
receptors in human hepatoma HepaRG cells. Drug Metab. Dispos. 34, 75–83.
Anthérieu, S., Chesné, C., Li, R., Camus, S., Lahoz, A., Picazo, L., Turpeinen, M., Tolonen, A.,
Uusitalo, J., Guguen-Guillouzo, C., et al. (2010). Stable expression, activity, and inducibility of
cytochromes P450 in differentiated HepaRG cells. Drug Metab. 38, 516–525.
Antoine, D.J., Williams, D.P., Kipar, A., Jenkins, R.E., Regan, S.L., Sathish, J.G., Kitteringham,
N.R., and Park, B.K. (2009). High-mobility group box-1 protein and keratin-18, circulating serum
proteins informative of acetaminophen-induced necrosis and apoptosis in vivo. Toxicol. Sci. 112,
521–531.
Antoine, D.J., Jenkins, R.E., Dear, J.W., Williams, D.P., McGill, M.R., Sharpe, M.R., Craig, D.G.,
Simpson, K.J., Jaeschke, H., and Park, B.K. (2012). Molecular forms of HMGB1 and keratin-18
as mechanistic biomarkers for mode of cell death and prognosis during clinical acetaminophen
hepatotoxicity. J. Hepatol. 56, 1070–1079.
Antoine, D.J., Dear, J.W., Lewis, P.S., Platt, V., Coyle, J., Masson, M., Thanacoody, R.H., Gray,
A.J., Webb, D.J., Moggs, J.G., et al. (2013). Mechanistic biomarkers provide early and sensitive
detection of acetaminophen-induced acute liver injury at first presentation to hospital. Hepatology
58, 777–787.

106
Antoine, D.J., Sabbisetti, V.S., Francis, B., Jorgensen, A.L., Craig, D.G.N., Simpson, K.J.,
Bonventre, J.V., Park, B.K., and Dear, J.W. (2015). Circulating Kidney Injury Molecule 1 Predicts
Prognosis and Poor Outcome in Patients With Acetaminophen-Induced Liver Injury. Hepatol. 62,
591–599.
Antoniades, C.G., Quaglia, A., Taams, L.S., Mitry, R.R., Hussain, M., Abeles, R., Possamai, L.A.,
Bruce, M., McPhail, M., Starling, C., et al. (2012). Source and characterization of hepatic
macrophages in acetaminophen-induced acute liver failure in humans. Hepatol. 56, 735–746.
Arrowsmith, J., and Miller, P. (2013). Trial watch: phase II and phase III attrition rates 2011-2012.
Nat. Rev. Drug Discov. 12, 569.
Bajt, M.L., Knight, T.R., Lemasters, J.J., and Jaeschke, H. (2004). Acetaminophen-induced
oxidant stress and cell injury in cultured mouse hepatocytes: protection by N-acetyl cysteine.
Toxicol. Sci. 80, 343–349.
Bajt, M.L., Cover, C., Lemasters, J.J., and Jaeschke, H. (2006). Nuclear translocation of
endonuclease G and apoptosis-inducing factor during acetaminophen-induced liver cell injury.
Toxicol. Sci. 94, 217–225.
Bajt, M.L., Farhood, A., Lemasters, J.J., and Jaeschke, H. (2008). Mitochondrial bax translocation
accelerates DNA fragmentation and cell necrosis in a murine model of acetaminophen
hepatotoxicity. J. Pharmacol. Exp. Ther. 324, 8–14.
Bajt, M.L., Ramachandran, A., Yan, H.-M., Lebofsky, M., Farhood, A., Lemasters, J.J., and
Jaeschke, H. (2011). Apoptosis-inducing factor modulates mitochondrial oxidant stress in
acetaminophen hepatotoxicity. Toxicol. Sci. 122, 598–605.
Bala, S., Marcos, M., and Szabo, G. (2009). Emerging role of microRNAs in liver diseases. World
J. Gastroenterol. 15, 5633–5640.
Bantel, H., Lügering, A., Heidemann, J., Volkmann, X., Poremba, C., Strassburg, C.P., Manns,
M.P., and Schulze-Osthoff, K. (2004). Detection of apoptotic caspase activation in sera from
patients with chronic HCV infection is associated with fibrotic liver injury. Hepatol. 40, 1078–
1087.
Barbiro, E., Zurovsky, Y., and Mayevsky, A. (1998). Real time monitoring of rat liver energy state
during ischemia. Microvasc. Res. 56, 253–260.
Baskin-Bey, E.S., Washburn, K., Feng, S., Oltersdorf, T., Shapiro, D., Huyghe, M., Burgart, L.,
Garrity-Park, M., van Vilsteren, F.G.I., Oliver, L.K., et al. (2007). Clinical Trial of the Pan-
Caspase Inhibitor, IDN-6556, in Human Liver Preservation Injury. Am. J. Transplant. 7, 218–225.
Bechmann, L.P., Jochum, C., Kocabayoglu, P., Sowa, J.-P., Kassalik, M., Gieseler, R.K., Saner,
F., Paul, A., Trautwein, C., Gerken, G., et al. (2010). Cytokeratin 18-based modification of the
MELD score improves prediction of spontaneous survival after acute liver injury. J. Hepatol. 53,
639–647.

107
Beckwith-Hall, B.M., Nicholson, J.K., Nicholls, A.W., Foxall, P.J., Lindon, J.C., Connor, S.C.,
Abdi, M., Connelly, J., and Holmes, E. (1998). Nuclear magnetic resonance spectroscopic and
principal components analysis investigations into biochemical effects of three model hepatotoxins.
Chem. Res. Toxicol. 11, 260–272.
Bonaldi, T., Talamo, F., Scaffidi, P., Ferrera, D., Porto, A., Bachi, A., Rubartelli, A., Agresti, A.,
and Bianchi, M.E. (2003). Monocytic cells hyperacetylate chromatin protein HMGB1 to redirect
it towards secretion. EMBO J. 22, 5551–5560.
Budnitz, D.S., Lovegrove, M.C., and Crosby, A.E. (2011). Emergency department visits for
overdoses of acetaminophen-containing products. Am. J. Prev. Med. 40, 585–592.
Buis, C.I., Hoekstra, H., Verdonk, R.C., and Porte, R.J. (2006). Causes and consequences of
ischemic-type biliary lesions after liver transplantation. J. Hepatobiliary. Pancreat. Surg. 13, 517–
524.
Bunchorntavakul, C., and Reddy, K.R. (2013). Acetaminophen-related hepatotoxicity. Clin. Liver
Dis. 17, 587–607, viii.
Butterworth, R.F. (2015). Pathogenesis of hepatic encephalopathy and brain edema in acute liver
failure. J. Clin. Exp. Hepatol. 5, S96–S103.
Camargo, C.A., Madden, J.F., Gao, W., Selvan, R.S., and Clavien, P.A. (1997). Interleukin-6
protects liver against warm ischemia/reperfusion injury and promotes hepatocyte proliferation in
the rodent. Hepatol. 26, 1513–1520.
Ceppa, E.P., Fuh, K.C., and Bulkley, G.B. (2003). Mesenteric hemodynamic response to
circulatory shock. Curr. Opin. Crit. Care 9, 127–132.
Chatauret, N., Thuillier, R., and Hauet, T. (2011). Preservation strategies to reduce ischemic injury
in kidney transplantation: pharmacological and genetic approaches. Curr. Opin. Organ Transplant.
16, 180–187.
Chen, M., Suzuki, A., Borlak, J., Andrade, R.J., and Lucena, M.I. (2015). Drug-induced liver
injury: Interactions between drug properties and host factors. J. Hepatol. 63, 503–514.
Cohen, S.D., Pumford, N.R., Khairallah, E.A., Boekelheide, K., Pohl, L.R., Amouzadeh, H.R., and
Hinson, J.A. (1997). Selective protein covalent binding and target organ toxicity. Toxicol. Appl.
Pharmacol. 143, 1–12.
Compagnon, P., Levesque, E., Hentati, H., Disabato, M., Calderaro, J., Feray, C., Corlu, A.,
Cohen, J.L., Mosbah, I.B., and Azoulay, D. (2017). An Oxygenated and Transportable Machine
Perfusion System Fully Rescues Liver Grafts Exposed to Lethal Ischemic Damage in a Pig Model
of DCD Liver Transplantation. Transplantation.
Cortez, M.A., and Calin, G.A. (2009). MicroRNA identification in plasma and serum: a new tool
to diagnose and monitor diseases. Expert Opin. Biol. Ther. 9, 703–711.

108
Cover, C., Mansouri, A., Knight, T.R., Bajt, M.L., Lemasters, J.J., Pessayre, D., and Jaeschke, H.
(2005). Peroxynitrite-induced mitochondrial and endonuclease-mediated nuclear DNA damage in
acetaminophen hepatotoxicity. J. Pharmacol. Exp. Ther. 315, 879–887.
Craig, D.G.N., Lee, P., Pryde, E.A., Masterton, G.S., Hayes, P.C., and Simpson, K.J. (2011).
Circulating apoptotic and necrotic cell death markers in patients with acute liver injury. Liver Int.
31, 1127–1136.
Cursio, R., and Gugenheim, J. (2012). Ischemia-Reperfusion Injury and Ischemic-Type Biliary
Lesions following Liver Transplantation. J. Transplant. 2012, 164329.
Dahlin, D.C., Miwa, G.T., Lu, A.Y., and Nelson, S.D. (1984). N-acetyl-p-benzoquinone imine: a
cytochrome P-450-mediated oxidation product of acetaminophen. Proc. Natl. Acad. Sci. 81, 1327–
1331.
Dear, J.W., Antoine, D.J., Starkey-Lewis, P., Goldring, C.E., and Park, B.K. (2014). Early
detection of paracetamol toxicity using circulating liver microRNA and markers of cell necrosis.
Br. J. Clin. Pharmacol. 77, 904–905.
Dolganiuc, A., Petrasek, J., Kodys, K., Catalano, D., Mandrekar, P., Velayudham, A., and Szabo,
G. (2009). MicroRNA expression profile in Lieber-DeCarli diet-induced alcoholic and methionine
choline deficient diet-induced nonalcoholic steatohepatitis models in mice. Alcohol. Clin. Exp.
Res. 33, 1704–1710.
Du, K., Williams, C.D., McGill, M.R., Xie, Y., Farhood, A., Vinken, M., and Jaeschke, H. (2013).
The gap junction inhibitor 2-aminoethoxy-diphenyl-borate protects against acetaminophen
hepatotoxicity by inhibiting cytochrome P450 enzymes and c-jun N-terminal kinase activation.
Toxicol. Appl. Pharmacol. 273, 484–491.
Du, K., Xie, Y., McGill, M.R., and Jaeschke, H. (2015). Pathophysiological significance of c-jun
N-terminal kinase in acetaminophen hepatotoxicity. Expert Opin. Drug Metab. Toxicol. 11, 1769–
1779.
Du, K., Farhood, A., and Jaeschke, H. (2017). Mitochondria-targeted antioxidant Mito-Tempo
protects against acetaminophen hepatotoxicity. Arch. Toxicol. 91, 761–773.
Duan, L., Davis, J.S., Woolbright, B.L., Du, K., Cahkraborty, M., Weemhoff, J., Jaeschke, H., and
Bourdi, M. (2016). Differential susceptibility to acetaminophen-induced liver injury in sub-strains
of C57BL/6 mice: 6N versus 6J. Food Chem. Toxicol. 98, 107–118.
Ellett, J.D., Evans, Z.P., Atkinson, C., Schmidt, M.G., Schnellmann, R.G., and Chavin, K.D.
(2009). Toll-like receptor 4 is a key mediator of murine steatotic liver warm ischemia/reperfusion
injury. Liver Transpl. 15, 1101–1109.
Eltzschig, H.K., and Eckle, T. (2011). Ischemia and reperfusion--from mechanism to translation.
Nat. Med. 17, 1391–1401.

109
El-Wahsh, M. (2007). Liver graft preservation: an overview. Hepatobiliary Pancreat. Dis. Int. 6,
12–16.
Fisher, K., Vuppalanchi, R., and Saxena, R. (2015). Drug-Induced Liver Injury. Arch. Pathol. Lab.
Med. 139, 876–887.
Freitas, S.H., Dória, R.G.S., Bueno, R.S., Rocha, W.B., Filho, J.R.E., Moraes, J.R.E., Vidane,
A.S., and Ambrósio, C.E. (2017). Evaluation of potential changes in liver and lung tissue of rats
in an ischemia-reperfusion injury model (modified pringle maneuver). PloS One 12, e0178665.
French, S.W., Benson, N.C., and Sun, P.S. (1984). Centrilobular liver necrosis induced by hypoxia
in chronic ethanol-fed rats. Hepatol. 4, 912–917.
Friedman, B.H., Wolf, J.H., Wang, L., Putt, M.E., Shaked, A., Christie, J.D., Hancock, W.W., and
Olthoff, K.M. (2012). Serum cytokine profiles associated with early allograft dysfunction in
patients undergoing liver transplantation. Liver Transplant. 18, 166–176.
Fuhrmann, V., Kneidinger, N., Herkner, H., Heinz, G., Nikfardjam, M., Bojic, A., Schellongowski,
P., Angermayr, B., Kitzberger, R., Warszawska, J., et al. (2009). Hypoxic hepatitis: underlying
conditions and risk factors for mortality in critically ill patients. Intensive Care Med. 35, 1397–
1405.
Fuhrmann, V., Jäger, B., Zubkova, A., and Drolz, A. (2010). Hypoxic hepatitis - epidemiology,
pathophysiology and clinical management. Wien. Klin. Wochenschr. 122, 129–139.
Gasbarrini, A., Borle, A.B., Farghali, H., Bender, C., Francavilla, A., and Van Thiel, D. (1992).
Effect of anoxia on intracellular ATP, Na+i, Ca2+i, Mg2+i, and cytotoxicity in rat hepatocytes. J.
Biol. Chem. 267, 6654–6663.
Giacomoni, A., Lauterio, A., Slim, A.O., Vanzulli, A., Calcagno, A., Mangoni, I., Belli, L.S., De
Gasperi, A., and De Carlis, L. (2006). Biliary complications after living donor adult liver
transplantation. Transpl. Int. 19, 466–473.
van Golen, R.F., van Gulik, T.M., and Heger, M. (2012). The sterile immune response during
hepatic ischemia/reperfusion. Cytokine Growth Factor Rev. 23, 69–84.
Grasl-Kraupp, B., Ruttkay-Nedecky, B., Koudelka, H., Bukowska, K., Bursch, W., and Schulte-
Hermann, R. (1995). In situ detection of fragmented DNA (TUNEL assay) fails to discriminate
among apoptosis, necrosis, and autolytic cell death: a cautionary note. Hepatol. 21, 1465–1468.
Gripon, P., Rumin, S., Urban, S., Le Seyec, J., Glaise, D., Cannie, I., Guyomard, C., Lucas, J.,
Trepo, C., and Guguen-Guillouzo, C. (2002). Infection of a human hepatoma cell line by hepatitis
B virus. Proc. Natl. Acad. Sci.99, 15655–15660.
Guguen-Guillouzo, C., and Guillouzo, A. (2010). General review on in vitro hepatocyte models
and their applications. Methods Mol. Biol. 640, 1–40.

110
Guillouzo, A., Corlu, A., Aninat, C., Glaise, D., Morel, F., and Guguen-Guillouzo, C. (2007). The
human hepatoma HepaRG cells: a highly differentiated model for studies of liver metabolism and
toxicity of xenobiotics. Chem. Biol. Interact. 168, 66–73.
Gujral, J.S., Bucci, T.J., Farhood, A., and Jaeschke, H. (2001). Mechanism of cell death during
warm hepatic ischemia-reperfusion in rats: apoptosis or necrosis? Hepatol. 33, 397–405.
Gunawan, B.K., Liu, Z.-X., Han, D., Hanawa, N., Gaarde, W.A., and Kaplowitz, N. (2006). c-Jun
N-terminal kinase plays a major role in murine acetaminophen hepatotoxicity. Gastroenterology
131, 165–178.
Guy, C.D., Suzuki, A., Burchette, J.L., Brunt, E.M., Abdelmalek, M.F., Cardona, D., McCall, S.J.,
Ünalp, A., Belt, P., Ferrell, L.D., et al. (2012). Costaining for keratins 8/18 plus ubiquitin improves
detection of hepatocyte injury in nonalcoholic fatty liver disease. Hum. Pathol. 43, 790–800.
Hanawa, N., Shinohara, M., Saberi, B., Gaarde, W.A., Han, D., and Kaplowitz, N. (2008). Role of
JNK translocation to mitochondria leading to inhibition of mitochondria bioenergetics in
acetaminophen-induced liver injury. J. Biol. Chem. 283, 13565–13577.
Hart, S.N., Li, Y., Nakamoto, K., Subileau, E., Steen, D., and Zhong, X. (2010). A comparison of
whole genome gene expression profiles of HepaRG cells and HepG2 cells to primary human
hepatocytes and human liver tissues. Drug Metab. Dispos. 38, 988–994.
Hasegawa, T., Malle, E., Farhood, A., and Jaeschke, H. (2005). Generation of hypochlorite-
modified proteins by neutrophils during ischemia-reperfusion injury in rat liver: attenuation by
ischemic preconditioning. Am. J. Physiol. Gastrointest. Liver Physiol. 289, G760-767.
Hausenloy, D.J., and Yellon, D.M. (2013). Myocardial ischemia-reperfusion injury: a neglected
therapeutic target. J. Clin. Invest. 123, 92–100.
Hawker, F. (1991). Liver dysfunction in critical illness. Anaesth. Intensive Care 19, 165–181.
Henderson, N.C., Pollock, K.J., Frew, J., Mackinnon, A.C., Flavell, R.A., Davis, R.J., Sethi, T.,
and Simpson, K.J. (2007). Critical role of c-jun (NH2) terminal kinase in paracetamol- induced
acute liver failure. Gut 56, 982–990.
Hengstler, J.G., Utesch, D., Steinberg, P., Platt, K.L., Diener, B., Ringel, M., Swales, N., Fischer,
T., Biefang, K., Gerl, M., et al. (2000). Cryopreserved primary hepatocytes as a constantly
available in vitro model for the evaluation of human and animal drug metabolism and enzyme
induction. Drug Metab. Rev. 32, 81–118.
Henrion, J., Colin, L., Schapira, M., and Heller, F.R. (1997). Hypoxic hepatitis caused by severe
hypoxemia from obstructive sleep apnea. J. Clin. Gastroenterol. 24, 245–249.
Henrion, J., Minette, P., Colin, L., Schapira, M., Delannoy, A., and Heller, F.R. (1999). Hypoxic
hepatitis caused by acute exacerbation of chronic respiratory failure: a case-controlled,
hemodynamic study of 17 consecutive cases. Hepatol. 29, 427–433.

111
Henrion, J., Schapira, M., Luwaert, R., Colin, L., Delannoy, A., and Heller, F.R. (2003). Hypoxic
hepatitis: clinical and hemodynamic study in 142 consecutive cases. Medicine 82, 392–406.
Herndon, C.M., and Dankenbring, D.M. (2014). Patient perception and knowledge of
acetaminophen in a large family medicine service. J. Pain Palliat. Care Pharmacother. 28, 109–
116.
Hewitt, N.J., and Hewitt, P. (2004). Phase I and II enzyme characterization of two sources of
HepG2 cell lines. Xenobiotica 34, 243–256.
Hewitt, N.J., Lechón, M.J.G., Houston, J.B., Hallifax, D., Brown, H.S., Maurel, P., Kenna, J.G.,
Gustavsson, L., Lohmann, C., Skonberg, C., et al. (2007). Primary hepatocytes: current
understanding of the regulation of metabolic enzymes and transporter proteins, and pharmaceutical
practice for the use of hepatocytes in metabolism, enzyme induction, transporter, clearance, and
hepatotoxicity studies. Drug Metab. Rev. 39, 159–234.
Horvatits, T., Trauner, M., and Fuhrmann, V. (2013). Hypoxic liver injury and cholestasis in
critically ill patients. Curr. Opin. Crit. Care 19, 128–132.
Ilmakunnas, M., Tukiainen, E.M., Rouhiainen, A., Rauvala, H., Arola, J., Nordin, A., Mäkisalo,
H., Höckerstedt, K., and Isoniemi, H. (2008). High mobility group box 1 protein as a marker of
hepatocellular injury in human liver transplantation. Liver Transpl. 14, 1517–1525.
Ilmakunnas, M., Höckerstedt, K., Mäkisalo, H., Siitonen, S., Repo, H., and Pesonen, E.J. (2009).
Hepatic neutrophil activation during reperfusion may not contribute to initial graft function after
short cold ischemia in human liver transplantation. Transplant. Proc. 41, 739–742.
Imamura, H., Brault, A., and Huet, P.M. (1997). Effects of extended cold preservation and
transplantation on the rat liver microcirculation. Hepatol. 25, 664–671.
Jaeschke, H. (1991). Vascular oxidant stress and hepatic ischemia/reperfusion injury. Free Radic.
Res. Commun. 12–13 Pt 2, 737–743.
Jaeschke, H. (2003). Molecular mechanisms of hepatic ischemia-reperfusion injury and
preconditioning. Am. J. Physiol. Gastrointest. Liver Physiol. 284, G15-26.
Jaeschke, H. (2015). Acetaminophen: Dose-Dependent Drug Hepatotoxicity and Acute Liver
Failure in Patients. Dig. Dis. 33, 464–471.
Jaeschke, H., and Farhood, A. (1991a). Neutrophil and Kupffer cell-induced oxidant stress and
ischemia-reperfusion injury in rat liver. Am. J. Physiol. 260, G355-362.
Jaeschke, H., and Farhood, A. (1991b). Neutrophil and Kupffer cell-induced oxidant stress and
ischemia-reperfusion injury in rat liver. Am. J. Physiol. 260, G355-362.
Jaeschke, H., and Farhood, A. (2002). Kupffer cell activation after no-flow ischemia versus
hemorrhagic shock. Free Radic. Biol. Med. 33, 210–219.

112
Jaeschke, H., and Lemasters, J.J. (2003). Apoptosis versus oncotic necrosis in hepatic
ischemia/reperfusion injury. Gastroenterology 125, 1246–1257.
Jaeschke, H., and Mitchell, J.R. (1990). Use of isolated perfused organs in hypoxia and
ischemia/reperfusion oxidant stress. Methods Enzymol. 186, 752–759.
Jaeschke, H., and Smith, C.W. (1997). Mechanisms of neutrophil-induced parenchymal cell injury.
J. Leukoc. Biol. 61, 647–653.
Jaeschke, H., Farhood, A., and Smith, C.W. (1990). Neutrophils contribute to ischemia/reperfusion
injury in rat liver in vivo. FASEB J. 4, 3355–3359.
Jaeschke, H., Bautista, A.P., Spolarics, Z., and Spitzer, J.J. (1992). Superoxide generation by
neutrophils and Kupffer cells during in vivo reperfusion after hepatic ischemia in rats. J. Leukoc.
Biol. 52, 377–382.
Jaeschke, H., Farhood, A., Bautista, A.P., Spolarics, Z., and Spitzer, J.J. (1993). Complement
activates Kupffer cells and neutrophils during reperfusion after hepatic ischemia. Am. J. Physiol.
264, G801-809.
Jaeschke, H., Fisher, M.A., Lawson, J.A., Simmons, C.A., Farhood, A., and Jones, D.A. (1998).
Activation of caspase 3 (CPP32)-like proteases is essential for TNF-alpha-induced hepatic
parenchymal cell apoptosis and neutrophil-mediated necrosis in a murine endotoxin shock model.
J. Immunol. 160, 3480–3486.
Jaeschke, H., Knight, T.R., and Bajt, M.L. (2003). The role of oxidant stress and reactive nitrogen
species in acetaminophen hepatotoxicity. Toxicol. Lett. 144, 279–288.
Jaeschke, H., Williams, C.D., and Farhood, A. (2011). No evidence for caspase-dependent
apoptosis in acetaminophen hepatotoxicity. Hepatol. 53, 718–719.
Jaeschke, H., McGill, M.R., and Ramachandran, A. (2012a). Oxidant stress, mitochondria, and
cell death mechanisms in drug-induced liver injury: lessons learned from acetaminophen
hepatotoxicity. Drug Metab. Rev. 44, 88–106.
Jaeschke, H., Williams, C.D., Ramachandran, A., and Bajt, M.L. (2012b). Acetaminophen
hepatotoxicity and repair: the role of sterile inflammation and innate immunity. Liver Int. 32, 8–
20.
Jain, S., Lee, S.H., Korneszczuk, K., Culberson, C.R., Southard, J.H., Berthiaume, F., Zhang, J.X.,
Clemens, M.G., and Lee, C.Y. (2008). Improved preservation of warm ischemic livers by
hypothermic machine perfusion with supplemented University of Wisconsin solution. J. Investig.
Surg. 21, 83–91.
James, L.P., Letzig, L., Simpson, P.M., Capparelli, E., Roberts, D.W., Hinson, J.A., Davern, T.J.,
and Lee, W.M. (2009). Pharmacokinetics of acetaminophen-protein adducts in adults with
acetaminophen overdose and acute liver failure. Drug Metab. Dispos. 37, 1779–1784.

113
Jassem, W., Koo, D.D.H., Cerundolo, L., Rela, M., Heaton, N.D., and Fuggle, S.V. (2003).
Cadaveric versus living-donor livers: differences in inflammatory markers after transplantation.
Transplantation 76, 1599–1603.
Jin, X., Ye, Y.-F., Chen, S.-H., Yu, C.-H., Liu, J., and Li, Y.-M. (2009). MicroRNA expression
pattern in different stages of nonalcoholic fatty liver disease. Dig. Liver Dis. 41, 289–297.
Jossé, R., Aninat, C., Glaise, D., Dumont, J., Fessard, V., Morel, F., Poul, J.-M., Guguen-
Guillouzo, C., and Guillouzo, A. (2008). Long-term functional stability of human HepaRG
hepatocytes and use for chronic toxicity and genotoxicity studies. Drug Metab. Dispos. 36, 1111–
1118.
Kanebratt, K.P., and Andersson, T.B. (2008). HepaRG cells as an in vitro model for evaluation of
cytochrome P450 induction in humans. Drug Metab. Dispos. 36, 137–145.
Karimian, N., Westerkamp, A.C., and Porte, R.J. (2014). Biliary complications after orthotopic
liver transplantation. Curr. Opin. Organ Transplant. 19, 209–216.
Karmen, A., Wroblewski, F., and Ladue, J.S. (1955). Transaminase activity in human blood. J.
Clin. Invest. 34, 126–131.
Kim, J., Kim, H.-Y., and Lee, S.-M. (2013). Protective Effects of Geniposide and Genipin against
Hepatic Ischemia/Reperfusion Injury in Mice. Biomol. Ther. 21, 132–137.
Kim, J.S., He, L., Qian, T., and Lemasters, J.J. (2003). Role of the mitochondrial permeability
transition in apoptotic and necrotic death after ischemia/reperfusion injury to hepatocytes. Curr.
Mol. Med. 3, 527–535.
Ko, H.M., Joo, S.H., Jo, J.H., Park, W.S., Jung, W.Y., Shin, J.H., and Ahn, H.J. (2017). Liver-
Wrapping, Nitric Oxide-Releasing Nanofiber Downregulates Cleaved Caspase-3 and Bax
Expression on Rat Hepatic Ischemia-Reperfusion Injury. Transplant. Proc. 49, 1170–1174.
Kochhar, G., Parungao, J.M., Hanouneh, I.A., and Parsi, M.A. (2013). Biliary complications
following liver transplantation. World J. Gastroenterol. 19, 2841–2846.
Kodali, S., and McGuire, B.M. (2015). Diagnosis and Management of Hepatic Encephalopathy in
Fulminant Hepatic Failure. Clin. Liver Dis. 19, 565–576.
Kon, K., Kim, J.-S., Jaeschke, H., and Lemasters, J.J. (2004). Mitochondrial permeability
transition in acetaminophen-induced necrosis and apoptosis of cultured mouse hepatocytes.
Hepatol. 40, 1170–1179.
Kota, J., Chivukula, R.R., O’Donnell, K.A., Wentzel, E.A., Montgomery, C.L., Hwang, H.-W.,
Chang, T.-C., Vivekanandan, P., Torbenson, M., Clark, K.R., et al. (2009). Therapeutic microRNA
delivery suppresses tumorigenesis in a murine liver cancer model. Cell 137, 1005–1017.
Krauskopf, J., Caiment, F., Claessen, S.M., Johnson, K.J., Warner, R.L., Schomaker, S.J., Burt,
D.A., Aubrecht, J., and Kleinjans, J.C. (2015). Application of high-throughput sequencing to

114
circulating microRNAs reveals novel biomarkers for drug-induced liver injury. Toxicol. Sci. 143,
268–276.
Ku, N.-O., Strnad, P., Zhong, B.-H., Tao, G.-Z., and Omary, M.B. (2007). Keratins let liver live:
Mutations predispose to liver disease and crosslinking generates Mallory-Denk bodies. Hepatol.
46, 1639–1649.
Lackner, C. (2011). Hepatocellular ballooning in nonalcoholic steatohepatitis: the pathologist’s
perspective. Expert Rev. Gastroenterol. Hepatol. 5, 223–231.
Ladeiro, Y., Couchy, G., Balabaud, C., Bioulac-Sage, P., Pelletier, L., Rebouissou, S., and
Zucman-Rossi, J. (2008). MicroRNA profiling in hepatocellular tumors is associated with clinical
features and oncogene/tumor suppressor gene mutations. Hepatol. 47, 1955–1963.
Lambert, C.B., Spire, C., Renaud, M.-P., Claude, N., and Guillouzo, A. (2009). Reproducible
chemical-induced changes in gene expression profiles in human hepatoma HepaRG cells under
various experimental conditions. Toxicol. Vitro 23, 466–475.
Lanford, R.E., Hildebrandt-Eriksen, E.S., Petri, A., Persson, R., Lindow, M., Munk, M.E.,
Kauppinen, S., and Ørum, H. (2010). Therapeutic silencing of microRNA-122 in primates with
chronic hepatitis C virus infection. Science 327, 198–201.
Larson, A.M. (2007). Acetaminophen hepatotoxicity. Clin. Liver Dis. 11, 525–548, vi.
Laterza, O.F., Lim, L., Garrett-Engele, P.W., Vlasakova, K., Muniappa, N., Tanaka, W.K.,
Johnson, J.M., Sina, J.F., Fare, T.L., Sistare, F.D., et al. (2009). Plasma MicroRNAs as sensitive
and specific biomarkers of tissue injury. Clin. Chem. 55, 1977–1983.
Lee, W.M. (2012). Acute liver failure. Semin. Respir. Crit. Care Med. 33, 36–45.
Lee, W.M. (2013). Drug-induced acute liver failure. Clin. Liver Dis. 17, 575–586, viii.
Lee, R.C., Feinbaum, R.L., and Ambros, V. (1993). The C. elegans heterochronic gene lin-4
encodes small RNAs with antisense complementarity to lin-14. Cell 75, 843–854.
Lee, S.S., Buters, J.T., Pineau, T., Fernandez-Salguero, P., and Gonzalez, F.J. (1996). Role of
CYP2E1 in the hepatotoxicity of acetaminophen. J. Biol. Chem. 271, 12063–12067.
Leers, M.P., Kölgen, W., Björklund, V., Bergman, T., Tribbick, G., Persson, B., Björklund, P.,
Ramaekers, F.C., Björklund, B., Nap, M., et al. (1999). Immunocytochemical detection and
mapping of a cytokeratin 18 neo-epitope exposed during early apoptosis. J. Pathol. 187, 567–572.
Lemasters, J.J., DiGuiseppi, J., Nieminen, A.L., and Herman, B. (1987). Blebbing, free Ca2+ and
mitochondrial membrane potential preceding cell death in hepatocytes. Nature 325, 78–81.
Lemasters, J.J., Nieminen, A.L., Qian, T., Trost, L.C., and Herman, B. (1997). The mitochondrial
permeability transition in toxic, hypoxic and reperfusion injury. Mol. Cell. Biochem. 174, 159–
165.
115
Lentsch, A.B. (2012). Regulatory mechanisms of injury and repair after hepatic
ischemia/reperfusion. Scientifica 2012, 513192.
Leslie, B.R., Head, L.H., and Scharfenberg, J.C. (1989). Ischemic hepatitis from aortic dissection.
Ann. Intern. Med. 110, 495.
Li, S., Chen, X., Zhang, H., Liang, X., Xiang, Y., Yu, C., Zen, K., Li, Y., and Zhang, C.-Y. (2009).
Differential expression of microRNAs in mouse liver under aberrant energy metabolic status. J.
Lipid Res. 50, 1756–1765.
Linder, S., Olofsson, M.H., Herrmann, R., and Ulukaya, E. (2010). Utilization of cytokeratin-based
biomarkers for pharmacodynamic studies. Expert Rev. Mol. Diagn. 10, 353–359.
Manyike, P.T., Kharasch, E.D., Kalhorn, T.F., and Slattery, J.T. (2000). Contribution of CYP2E1
and CYP3A to acetaminophen reactive metabolite formation. Clin. Pharmacol. Ther. 67, 275–282.
Marrone, A.K., Tryndyak, V., Beland, F.A., and Pogribny, I.P. (2016). MicroRNA Responses to
the Genotoxic Carcinogens Aflatoxin B1 and Benzo[a]pyrene in Human HepaRG Cells. Toxicol.
Sci. 149, 496–502.
Marsman, W.A., Wiesner, R.H., Rodriguez, L., Batts, K.P., Porayko, M.K., Hay, J.E., Gores, G.J.,
and Krom, R.A. (1996). Use of fatty donor liver is associated with diminished early patient and
graft survival. Transplantation 62, 1246–1251.
Marubayashi, S., Dohi, K., Ochi, K., and Kawasaki, T. (1986). Role of free radicals in ischemic
rat liver cell injury: prevention of damage by alpha-tocopherol administration. Surgery 99, 184–
192.
Mathurin, P., Durand, F., Ganne, N., Mollo, J.L., Lebrec, D., Degott, C., Erlinger, S., Benhamou,
J.P., and Bernuau, J. (1995). Ischemic hepatitis due to obstructive sleep apnea. Gastroenterology
109, 1682–1684.
McGill, M.R. (2016). The past and present of serum aminotransferases and the future of liver
injury biomarkers. EXCLI J. 15, 817–828.
McGill, M.R., and Jaeschke, H. (2014). Mechanistic biomarkers in acetaminophen-induced
hepatotoxicity and acute liver failure: from preclinical models to patients. Expert Opin. Drug
Metab. Toxicol. 10, 1005–1017.
McGill, M.R., and Jaeschke, H. (2015). MicroRNAs as Signaling Mediators and Biomarkers of
Drug- and Chemical-Induced Liver Injury. J. Clin. Med. 4, 1063–1078.
McGill, M.R., Yan, H.-M., Ramachandran, A., Murray, G.J., Rollins, D.E., and Jaeschke, H.
(2011). HepaRG cells: a human model to study mechanisms of acetaminophen hepatotoxicity.
Hepatology 53, 974–982.

116
McGill, M.R., Sharpe, M.R., Williams, C.D., Taha, M., Curry, S.C., and Jaeschke, H. (2012). The
mechanism underlying acetaminophen-induced hepatotoxicity in humans and mice involves
mitochondrial damage and nuclear DNA fragmentation. J. Clin. Invest. 122, 1574–1583.
McGill, M.R., Lebofsky, M., Norris, H.-R.K., Slawson, M.H., Bajt, M.L., Xie, Y., Williams, C.D.,
Wilkins, D.G., Rollins, D.E., and Jaeschke, H. (2013). Plasma and liver acetaminophen-protein
adduct levels in mice after acetaminophen treatment: dose-response, mechanisms, and clinical
implications. Toxicol. Appl. Pharmacol. 269, 240–249.
McKeown, C.M., Edwards, V., Phillips, M.J., Harvey, P.R., Petrunka, C.N., and Strasberg, S.M.
(1988). Sinusoidal lining cell damage: the critical injury in cold preservation of liver allografts in
the rat. Transplantation 46, 178–191.
Meyers, L.L., Beierschmitt, W.P., Khairallah, E.A., and Cohen, S.D. (1988). Acetaminophen-
induced inhibition of hepatic mitochondrial respiration in mice. Toxicol. Appl. Pharmacol. 93,
378–387.
Mitchell, J.R., Jollow, D.J., Potter, W.Z., Gillette, J.R., and Brodie, B.B. (1973). Acetaminophen-
induced hepatic necrosis. IV. Protective role of glutathione. J. Pharmacol. Exp. Ther. 187, 211–
217.
Moll, R., Divo, M., and Langbein, L. (2008). The human keratins: biology and pathology.
Histochem. Cell Biol. 129, 705–733.
Molnar, A., Haybaeck, J., Lackner, C., and Strnad, P. (2011). The cytoskeleton in nonalcoholic
steatohepatitis: 100 years old but still youthful. Expert Rev. Gastroenterol. Hepatol. 5, 167–177.
Munoz, S.J., Stravitz, R.T., and Gabriel, D.A. (2009). Coagulopathy of acute liver failure. Clin.
Liver Dis. 13, 95–107.
Murakami, Y., Yasuda, T., Saigo, K., Urashima, T., Toyoda, H., Okanoue, T., and Shimotohno,
K. (2006). Comprehensive analysis of microRNA expression patterns in hepatocellular carcinoma
and non-tumorous tissues. Oncogene 25, 2537–2545.
Musso, G., Gambino, R., Cassader, M., and Pagano, G. (2011). Meta-analysis: natural history of
non-alcoholic fatty liver disease (NAFLD) and diagnostic accuracy of non-invasive tests for liver
disease severity. Ann. Med. 43, 617–649.
Nace, G.W., Huang, H., Klune, J.R., Eid, R.E., Rosborough, B.R., Korff, S., Li, S., Shapiro, R.A.,
Stolz, D.B., Sodhi, C.P., et al. (2013). Cellular-specific role of toll-like receptor 4 in hepatic
ischemia-reperfusion injury in mice. Hepatol. 58, 374–387.
Noack, K., Bronk, S.F., Kato, A., and Gores, G.J. (1993). The greater vulnerability of bile duct
cells to reoxygenation injury than to anoxia. Implications for the pathogenesis of biliary strictures
after liver transplantation. Transplantation 56, 495–500.

117
Northup, P.G., and Caldwell, S.H. (2013). Coagulation in liver disease: a guide for the clinician.
Clin. Gastroenterol. Hepatol. 11, 1064–1074.
Oliveros, F.H., Santamaría, M.L., Gámez, M., Murcia, J., Leal, N., Frauca, E., Hierro, L.,
Camarena, C., de la Vega, A., Bortolo, G., et al. (2005). Comparative study between living and
cadaveric donors in pediatric liver transplantation. Transplant. Proc. 37, 3936–3938.
Omary, M.B., Ku, N.-O., Strnad, P., and Hanada, S. (2009). Toward unraveling the complexity of
simple epithelial keratins in human disease. J. Clin. Invest. 119, 1794–1805.
Padgett, K.A., Lan, R.Y., Leung, P.C., Lleo, A., Dawson, K., Pfeiff, J., Mao, T.K., Coppel, R.L.,
Ansari, A.A., and Gershwin, M.E. (2009). Primary biliary cirrhosis is associated with altered
hepatic microRNA expression. J. Autoimmun. 32, 246–253.
Papatheodoridis, G.V., Hadziyannis, E., Tsochatzis, E., Chrysanthos, N., Georgiou, A., Kafiri, G.,
Manolakopoulos, S., Tiniakos, D.G., Giannousis, I., Manesis, E.K., et al. (2008). Serum apoptotic
caspase activity as a marker of severity in HBeAg-negative chronic hepatitis B virus infection. Gut
57, 500–506.
Parent, R., Marion, M.-J., Furio, L., Trépo, C., and Petit, M.-A. (2004). Origin and characterization
of a human bipotent liver progenitor cell line. Gastroenterology 126, 1147–1156.
Perez-Daga, J.A., Santoyo, J., Suárez, M.A., Fernández-Aguilar, J.A., Ramírez, C., Rodríguez-
Cañete, A., Aranda, J.M., Sánchez-Pérez, B., Montiel, C., Palomo, D., et al. (2006). Influence of
degree of hepatic steatosis on graft function and postoperative complications of liver
transplantation. Transplant. Proc. 38, 2468–2470.
Pesonen, E.J., Höckerstedt, K., Mäkisalo, H., Vuorte, J., Jansson, S.E., Orpana, A., Karonen, S.L.,
and Repo, H. (2000). Transhepatic neutrophil and monocyte activation during clinical liver
transplantation. Transplantation 69, 1458–1464.
Pessayre, D., Fromenty, B., Berson, A., Robin, M.-A., Lettéron, P., Moreau, R., and Mansouri, A.
(2012). Central role of mitochondria in drug-induced liver injury. Drug Metab. Rev. 44, 34–87.
Pine, J.K., Aldouri, A., Young, A.L., Davies, M.H., Attia, M., Toogood, G.J., Pollard, S.G., Lodge,
J.P.A., and Prasad, K.R. (2009). Liver transplantation following donation after cardiac death: an
analysis using matched pairs. Liver Transplant. 15, 1072–1082.
Powell, R.D., Swet, J.H., Kennedy, K.L., Huynh, T.T., McKillop, I.H., and Evans, S.L. (2014).
Resveratrol attenuates hypoxic injury in a primary hepatocyte model of hemorrhagic shock and
resuscitation. J. Trauma Acute Care Surg. 76, 409–417.
Qi, R., Weiland, M., Gao, X.-H., Zhou, L., and Mi, Q.-S. (2012). Identification of endogenous
normalizers for serum microRNAs by microarray profiling: U6 small nuclear RNA is not a reliable
normalizer. Hepatol. 55, 1640-1642.

118
Qian, T., Nieminen, A.L., Herman, B., and Lemasters, J.J. (1997). Mitochondrial permeability
transition in pH-dependent reperfusion injury to rat hepatocytes. Am. J. Physiol. 273, C1783-1792.
Qiu, Y., Benet, L.Z., and Burlingame, A.L. (1998). Identification of the hepatic protein targets of
reactive metabolites of acetaminophen in vivo in mice using two-dimensional gel electrophoresis
and mass spectrometry. J. Biol. Chem. 273, 17940–17953.
Rao, J., Qin, J., Qian, X., Lu, L., Wang, P., Wu, Z., Zhai, Y., Zhang, F., Li, G., and Wang, X.
(2013). Lipopolysaccharide preconditioning protects hepatocytes from ischemia/reperfusion
injury (IRI) through inhibiting ATF4-CHOP pathway in mice. PloS One 8, e65568.
Reckendorfer, H., Burgmann, H., and Spieckermann, P.G. (1992). Hepatic energy metabolism
during hypothermic storage and reperfusion using different protecting solutions. Eur. Surg. Res.
Eur. Chir. Forsch. Rech. Chir. Eur. 24, 339–348.
Reuben, A., Koch, D.G., Lee, W.M., and Acute Liver Failure Study Group (2010). Drug-induced
acute liver failure: results of a U.S. multicenter, prospective study. Hepatol. 52, 2065–2076.
Rijntjes, P.J., Moshage, H.J., Van Gemert, P.J., De Waal, R., and Yap, S.H. (1986).
Cryopreservation of adult human hepatocytes. The influence of deep freezing storage on the
viability, cell seeding, survival, fine structures and albumin synthesis in primary cultures. J.
Hepatol. 3, 7–18.
Roderburg, C., Benz, F., Vargas Cardenas, D., Koch, A., Janssen, J., Vucur, M., Gautheron, J.,
Schneider, A.T., Koppe, C., Kreggenwinkel, K., et al. (2015). Elevated miR-122 serum levels are
an independent marker of liver injury in inflammatory diseases. Liver Int. 1172–1184.
Rodríguez-Antona, C., Donato, M.T., Boobis, A., Edwards, R.J., Watts, P.S., Castell, J.V., and
Gómez-Lechón, M.-J. (2002). Cytochrome P450 expression in human hepatocytes and hepatoma
cell lines: molecular mechanisms that determine lower expression in cultured cells. Xenobiotica
32, 505–520.
Runge, D., Runge, D.M., Jäger, D., Lubecki, K.A., Beer Stolz, D., Karathanasis, S., Kietzmann,
T., Strom, S.C., Jungermann, K., Fleig, W.E., et al. (2000). Serum-free, long-term cultures of
human hepatocytes: maintenance of cell morphology, transcription factors, and liver-specific
functions. Biochem. Biophys. Res. Commun. 269, 46–53.
Saito, C., Lemasters, J.J., and Jaeschke, H. (2010). c-Jun N-terminal kinase modulates oxidant
stress and peroxynitrite formation independent of inducible nitric oxide synthase in acetaminophen
hepatotoxicity. Toxicol. Appl. Pharmacol. 246, 8–17.
Sanchez-Urdazpal, L., Gores, G.J., Ward, E.M., Maus, T.P., Wahlstrom, H.E., Moore, S.B.,
Wiesner, R.H., and Krom, R.A. (1992). Ischemic-type biliary complications after orthotopic liver
transplantation. Hepatol. 16, 49–53.
Sassa, S., Sugita, O., Galbraith, R.A., and Kappas, A. (1987). Drug metabolism by the human
hepatoma cell, Hep G2. Biochem. Biophys. Res. Commun. 143, 52–57.

119
Schotte, P., Declercq, W., Van Huffel, S., Vandenabeele, P., and Beyaert, R. (1999). Non-specific
effects of methyl ketone peptide inhibitors of caspases. FEBS Lett. 442, 117–121.
Schwartz, J., Holmuhamedov, E., Zhang, X., Lovelace, G.L., Smith, C.D., and Lemasters, J.J.
(2013). Minocycline and doxycycline, but not other tetracycline-derived compounds, protect liver
cells from chemical hypoxia and ischemia/reperfusion injury by inhibition of the mitochondrial
calcium uniporter. Toxicol. Appl. Pharmacol. 273, 172–179.
Scott, T.R., Kronsten, V.T., Hughes, R.D., and Shawcross, D.L. (2013). Pathophysiology of
cerebral oedema in acute liver failure. World J. Gastroenterol. 19, 9240–9255.
Seehofer, D., Eurich, D., Veltzke-Schlieker, W., and Neuhaus, P. (2013). Biliary complications
after liver transplantation: old problems and new challenges. Am. J. Transplant. 13, 253–265.
Snawder, J.E., Roe, A.L., Benson, R.W., and Roberts, D.W. (1994). Loss of CYP2E1 and CYP1A2
activity as a function of acetaminophen dose: relation to toxicity. Biochem. Biophys. Res.
Commun. 203, 532–539.
Soejima, Y., Taketomi, A., Yoshizumi, T., Uchiyama, H., Harada, N., Ijichi, H., Yonemura, Y.,
Ikeda, T., Shimada, M., and Maehara, Y. (2006). Biliary strictures in living donor liver
transplantation: incidence, management, and technical evolution. Liver Transplant. 12, 979–986.
Song, G.-W., Lee, S.-G., Hwang, S., Kim, K.-H., Ahn, C.-S., Moon, D.-B., Ha, T.-Y., Jung, D.-
H., Park, G.-C., Kang, S.-H., et al. (2014). Biliary stricture is the only concern in ABO-
incompatible adult living donor liver transplantation in the rituximab era. J. Hepatol. 61, 575–582.
Starkey Lewis, P.J., Dear, J., Platt, V., Simpson, K.J., Craig, D.G.N., Antoine, D.J., French, N.S.,
Dhaun, N., Webb, D.J., Costello, E.M., et al. (2011). Circulating microRNAs as potential markers
of human drug-induced liver injury. Hepatol. 54, 1767–1776.
Steven Stockham, and Michael Scott (2002). Fundamentals of Veterinary Clinical Pathology (A
Blackwell).
Strnad, P., Paschke, S., Jang, K.-H., and Ku, N.-O. (2012). Keratins: markers and modulators of
liver disease. Curr. Opin. Gastroenterol. 28, 209–216.
Szczeklik, E., Orlowski, M., and Szewczuk, A. (1961). [Activity of serum gamma-
glutamylotranspeptidase as a new enzymatic test in liver diseases. Comparison with other
enzymatic tests]. Pol. Tyg. Lek. Wars. Pol. 1960 16, 503–510.
Tailor, A., Faulkner, L., Naisbitt, D.J., and Park, B.K. (2015). The chemical, genetic and
immunological basis of idiosyncratic drug-induced liver injury. Hum. Exp. Toxicol. 34, 1310–
1317.
Taner, C.B., Bulatao, I.G., Perry, D.K., Sibulesky, L., Willingham, D.L., Kramer, D.J., and
Nguyen, J.H. (2012). Asystole to cross-clamp period predicts development of biliary

120
complications in liver transplantation using donation after cardiac death donors. Transpl. Int. 25,
838–846.
Tang, D., Loze, M.T., Zeh, H.J., and Kang, R. (2010). The redox protein HMGB1 regulates cell
death and survival in cancer treatment. Autophagy 6, 1181–1183.
Tang, D., Billiar, T.R., and Lotze, M.T. (2012). A Janus tale of two active high mobility group box
1 (HMGB1) redox states. Mol. Med. 18, 1360–1362.
Thawley, V. (2017). Acute Liver Injury and Failure. Vet. Clin. North Am. Small Anim. Pract. 47,
617–630.
Theruvath, T.P., Zhong, Z., Pediaditakis, P., Ramshesh, V.K., Currin, R.T., Tikunov, A.,
Holmuhamedov, E., and Lemasters, J.J. (2008). Minocycline and N-methyl-4-isoleucine
cyclosporin (NIM811) mitigate storage/reperfusion injury after rat liver transplantation through
suppression of the mitochondrial permeability transition. Hepatol. 47, 236–246.
Thummel, K.E., Lee, C.A., Kunze, K.L., Nelson, S.D., and Slattery, J.T. (1993). Oxidation of
acetaminophen to N-acetyl-p-aminobenzoquinone imine by human CYP3A4. Biochem.
Pharmacol. 45, 1563–1569.
Tirmenstein, M.A., and Nelson, S.D. (1989). Subcellular binding and effects on calcium
homeostasis produced by acetaminophen and a nonhepatotoxic regioisomer, 3’-
hydroxyacetanilide, in mouse liver. J. Biol. Chem. 264, 9814–9819.
Tomiyama, K., Ikeda, A., Ueki, S., Nakao, A., Stolz, D.B., Koike, Y., Afrazi, A., Gandhi, C.,
Tokita, D., Geller, D.A., et al. (2008). Inhibition of Kupffer cell-mediated early proinflammatory
response with carbon monoxide in transplant-induced hepatic ischemia/reperfusion injury in rats.
Hepatol. 48, 1608–1620.
Trilok, G., Qing, Y.C., and Li-Jun, X. (2012). Hypoxic hepatitis: a challenging diagnosis. Hepatol.
Int. 6, 663–669.
Trotter, J.F. (2009). Practical management of acute liver failure in the Intensive Care Unit. Curr.
Opin. Crit. Care 15, 163–167.
Tsung, A., Sahai, R., Tanaka, H., Nakao, A., Fink, M.P., Lotze, M.T., Yang, H., Li, J., Tracey,
K.J., Geller, D.A., et al. (2005). The nuclear factor HMGB1 mediates hepatic injury after murine
liver ischemia-reperfusion. J. Exp. Med. 201, 1135–1143.
Ulukaya, S., Ulukaya, E., Alper, I., Yilmaztepe-Oral, A., and Kilic, M. (2010). Soluble cytokeratin
18 biomarkers may provide information on the type of cell death during early ischemia and
reperfusion periods of liver transplantation. Clin. Transplant. 24, 848–854.
Vairetti, M., Richelmi, P., Bertè, F., Currin, R.T., Lemasters, J.J., and Imberti, R. (2006). Role of
pH in protection by low sodium against hypoxic injury in isolated perfused rat livers. J. Hepatol.
44, 894–901.

121
de Vera, M.E., Lopez-Solis, R., Dvorchik, I., Campos, S., Morris, W., Demetris, A.J., Fontes, P.,
and Marsh, J.W. (2009). Liver transplantation using donation after cardiac death donors: long-term
follow-up from a single center. Am. J. Transplant. 9, 773–781.
Verdonk, R.C., Buis, C.I., Porte, R.J., and Haagsma, E.B. (2006). Biliary complications after liver
transplantation: a review. Scand. J. Gastroenterol. Suppl. 89–101.
Verhoeven, C.J., Farid, W.R.R., de Ruiter, P.E., Hansen, B.E., Roest, H.P., de Jonge, J.,
Kwekkeboom, J., Metselaar, H.J., Tilanus, H.W., Kazemier, G., et al. (2013). MicroRNA profiles
in graft preservation solution are predictive of ischemic-type biliary lesions after liver
transplantation. J. Hepatol. 59, 1231–1238.
Vine, W., Link, J., Thoma, W.J., and Uğurbil, K. (1989). Injury and recovery of the liver from
preservation assessed by 31P NMR spectroscopy: the contrast between preservation with Collins’
solution and Ringer’s lactate solution. NMR Biomed. 2, 19–26.
van der Vliet, J.A., and Warlé, M.C. (2013). The need to reduce cold ischemia time in kidney
transplantation. Curr. Opin. Organ Transplant. 18, 174–178.
Voinnet, O. (2005). Induction and suppression of RNA silencing: insights from viral infections.
Nat. Rev. Genet. 6, 206–220.
Volkmann, X., Anstaett, M., Hadem, J., Stiefel, P., Bahr, M.J., Lehner, F., Manns, M.P., Schulze-
Osthoff, K., and Bantel, H. (2008). Caspase activation is associated with spontaneous recovery
from acute liver failure. Hepatol. 47, 1624–1633.
Wang, K., Zhang, S., Marzolf, B., Troisch, P., Brightman, A., Hu, Z., Hood, L.E., and Galas, D.J.
(2009a). Circulating microRNAs, potential biomarkers for drug-induced liver injury. Proc. Natl.
Acad. Sci. 106, 4402–4407.
Wang, K., Zhang, S., Marzolf, B., Troisch, P., Brightman, A., Hu, Z., Hood, L.E., and Galas, D.J.
(2009b). Circulating microRNAs, potential biomarkers for drug-induced liver injury. Proc. Natl.
Acad. Sci. 106, 4402–4407.
Ward, J., Kanchagar, C., Veksler-Lublinsky, I., Lee, R.C., McGill, M.R., Jaeschke, H., Curry,
S.C., and Ambros, V.R. (2014). Circulating microRNA profiles in human patients with
acetaminophen hepatotoxicity or ischemic hepatitis. Proc. Natl. Acad. Sci. 111, 12169–12174.
Weemhoff, J.L., Woolbright, B.L., Jenkins, R.E., McGill, M.R., Sharpe, M.R., Olson, J.C.,
Antoine, D.J., Curry, S.C., and Jaeschke, H. (2017). Plasma biomarkers to study mechanisms of
liver injury in patients with hypoxic hepatitis. Liver Int. 37, 377–384.
Wetzel, G., Relja, B., Klarner, A., Henrich, D., Dehne, N., Brühne, B., Lehnert, M., and Marzi, I.
(2014). Myeloid knockout of HIF-1 α does not markedly affect hemorrhage/resuscitation-induced
inflammation and hepatic injury. Mediators Inflamm. 2014, 930419.
122
Wieckowska, A., Zein, N.N., Yerian, L.M., Lopez, A.R., McCullough, A.J., and Feldstein, A.E.
(2006). In vivo assessment of liver cell apoptosis as a novel biomarker of disease severity in
nonalcoholic fatty liver disease. Hepatol. 44, 27–33.
Wilkening, S., Stahl, F., and Bader, A. (2003). Comparison of primary human hepatocytes and
hepatoma cell line Hepg2 with regard to their biotransformation properties. Drug Metab. Dispos.
31, 1035–1042.
Williams, C.D., Bajt, M.L., Sharpe, M.R., McGill, M.R., Farhood, A., and Jaeschke, H. (2014).
Neutrophil activation during acetaminophen hepatotoxicity and repair in mice and humans.
Toxicol. Appl. Pharmacol. 275, 122–133.
Wojcicki, M., Milkiewicz, P., and Silva, M. (2008). Biliary tract complications after liver
transplantation: a review. Dig. Surg. 25, 245–257.
Woolbright, B.L., Antoine, D.J., Jenkins, R.E., Bajt, M.L., Park, B.K., and Jaeschke, H. (2013).
Plasma biomarkers of liver injury and inflammation demonstrate a lack of apoptosis during
obstructive cholestasis in mice. Toxicol. Appl. Pharmacol. 273, 524–531.
Woolbright, B.L., Dorko, K., Antoine, D.J., Clarke, J.I., Gholami, P., Li, F., Kumer, S.C., Schmitt,
T.M., Forster, J., Fan, F., et al. (2015). Bile acid-induced necrosis in primary human hepatocytes
and in patients with obstructive cholestasis. Toxicol. Appl. Pharmacol. 283, 168–177.
Woolbright, B.L., McGill, M.R., Yan, H., and Jaeschke, H. (2016). Bile Acid-Induced Toxicity in
HepaRG Cells Recapitulates the Response in Primary Human Hepatocytes. Basic Clin. Pharmacol.
Toxicol. 118, 160–167.
Xia, L., Sakban, R.B., Qu, Y., Hong, X., Zhang, W., Nugraha, B., Tong, W.H., Ananthanarayanan,
A., Zheng, B., Chau, I.Y.-Y., et al. (2012). Tethered spheroids as an in vitro hepatocyte model for
drug safety screening. Biomaterials 33, 2165–2176.
Xie, Y., McGill, M.R., Dorko, K., Kumer, S.C., Schmitt, T.M., Forster, J., and Jaeschke, H.
(2014a). Mechanisms of acetaminophen-induced cell death in primary human hepatocytes.
Toxicol. Appl. Pharmacol. 279, 266–274.
Xie, Y., McGill, M.R., Dorko, K., Kumer, S.C., Schmitt, T.M., Forster, J., and Jaeschke, H.
(2014b). Mechanisms of acetaminophen-induced cell death in primary human hepatocytes.
Toxicol. Appl. Pharmacol. 279, 266–274.
Xie, Y., McGill, M.R., Cook, S.F., Sharpe, M.R., Winefield, R.D., Wilkins, D.G., Rollins, D.E.,
and Jaeschke, H. (2015a). Time course of acetaminophen-protein adducts and acetaminophen
metabolites in circulation of overdose patients and in HepaRG cells. Xenobiotica 1–9.
Xie, Y., McGill, M.R., Du, K., Dorko, K., Kumer, S.C., Schmitt, T.M., Ding, W.-X., and Jaeschke,
H. (2015b). Mitochondrial protein adducts formation and mitochondrial dysfunction during N-
acetyl-m-aminophenol (AMAP)-induced hepatotoxicity in primary human hepatocytes. Toxicol.
Appl. Pharmacol. 289, 213–222.

123
Yang, H., Hreggvidsdottir, H.S., Palmblad, K., Wang, H., Ochani, M., Li, J., Lu, B., Chavan, S.,
Rosas-Ballina, M., Al-Abed, Y., et al. (2010). A critical cysteine is required for HMGB1 binding
to Toll-like receptor 4 and activation of macrophage cytokine release. Proc. Natl. Acad. Sci. 107,
11942–11947.
Yang, M., Antoine, D.J., Weemhoff, J.L., Jenkins, R.E., Farhood, A., Park, B.K., and Jaeschke,
H. (2014). Biomarkers Distinguish Apoptotic and Necrotic Cell Death During Hepatic Ischemia-
Reperfusion Injury in Mice. Liver Transplant. 20, 1372-1382
Yang, X., Salminen, W.F., Shi, Q., Greenhaw, J., Gill, P.S., Bhattacharyya, S., Beger, R.D.,
Mendrick, D.L., Mattes, W.B., and James, L.P. (2015). Potential of extracellular microRNAs as
biomarkers of acetaminophen toxicity in children. Toxicol. Appl. Pharmacol. 284, 180–187.
Yoon, E., Babar, A., Choudhary, M., Kutner, M., and Pyrsopoulos, N. (2016). Acetaminophen-
Induced Hepatotoxicity: a Comprehensive Update. J. Clin. Transl. Hepatol. 4, 131–142.
Zamore, P.D., and Haley, B. (2005). Ribo-gnome: the big world of small RNAs. Science 309,
1519–1524.
Zatloukal, K., French, S.W., Stumptner, C., Strnad, P., Harada, M., Toivola, D.M., Cadrin, M.,
and Omary, M.B. (2007). From Mallory to Mallory-Denk bodies: what, how and why? Exp. Cell
Res. 313, 2033–2049.
Zhai, Y., Shen, X.-D., Gao, F., Zhao, A., Freitas, M.C., Lassman, C., Luster, A.D., Busuttil, R.W.,
and Kupiec-Weglinski, J.W. (2008). CXCL10 regulates liver innate immune response against
ischemia and reperfusion injury. Hepatol. 47, 207–214.
Zuckerbraun, B.S., McCloskey, C.A., Gallo, D., Liu, F., Ifedigbo, E., Otterbein, L.E., and Billiar,
T.R. (2005). Carbon monoxide prevents multiple organ injury in a model of hemorrhagic shock
and resuscitation. Shock 23, 527–532.
Related Documents