Mechanisms of radiation in a bat group from the genus Pipistrellus inferred by phylogeography, demography and population genetics P. HULVA,* A. FORNU ˚ SKOVA ´ ,† A. CHUDA ´ RKOVA ´ ,* A. EVIN,‡ B. ALLEGRINI,§ P. BENDA* – and J. BRYJA† *Department of Zoology, Charles University in Prague, Vinic ˇna ´ 7, 128 44 Prague 2, Czech Republic, †Department of Population Biology, Institute of Vertebrate Biology Academy of Sciences of the Czech Republic, 675 02 Studenec 122; and Department of Botany and Zoology, Faculty of Science, Masaryk University, Kotla ´r ˇska ´ 2, 611 37 Brno, Czech Republic, ‡Origine, Structure et Evolution de la Biodiversite ´, Muse ´um National d’Historie Naturelle, C.P. 50, 45 rue Buffon, 75005 Paris, France, §Naturalia Environnement, Site Agroparc, B.P. 41, 223 rue Lawrence Durrell, 84911 Avignon Cedex 9, France, –Department of Zoology, National Museum, Va ´clavske ´ Na ´me ˇstı ´ 68, 115 79 Prague 1, Czech Republic Abstract Here, we present a study of the Pipistrellus pipistrellus species complex, a highly diversified bat group with a radiation centre in the Mediterranean biodiversity hotspot. The study sample comprised 583 animals from 118 localities representatively covering the bats’ range in the western Palearctic. We used fast-evolving markers (the mitochon- drial D-loop sequence and 11 nuclear microsatellites) to describe the phylogeography, demography and population structure of this model taxon and address details of its diversification. The overall pattern within this group includes a mosaic of phylogenet- ically basal, often morphologically distant, relatively small and mostly allopatric demes in the Mediterranean Basin, as well as two sympatric sibling species in the large continental part of the range. The southern populations exhibit constant size, whereas northern populations show a demographic trend of growth associated with range expansion during the Pleistocene climate oscillations. There is evidence of isolation by distance and female philopatry in P. pipistrellus sensu stricto. Although the northern populations are reproductively isolated, we detected introgression events among several Mediterranean lineages. This pattern implies incomplete establishment of reproductive isolating mechanisms in these populations as well as the existence of a past reinforce- ment stage in the continental siblings. The occurrence of reticulations in the radiation centre among morphologically and ecologically derived relict demes suggests that adaptive unequal gene exchange within hybridizing populations could play a role in speciation and adaptive radiation within this group. Keywords: hybrid speciation, introgression, Mediterranean, microsatellites, mitochondrial DNA, phylogeography, Pipistrellus, radiation Received 9 May 2010; revision received 28 September 2010; accepted 30 September 2010 Introduction The process of species formation can be studied effectively in cases of radiations. This phenomenon is traditionally defined as the adaptive multiplication of lineages, typically after colonizing a new environment or obtaining ‘key innovations’ (Schluter 2000). Adaptive radiation is usually approached from a macroevolution- ary point of view; however, important insights can also be gained from a microevolutionary perspective because the great majority of important evolutionary changes are concentrated early in the phylogeny of a radiation (Gavrilets & Vose 2005). Thus, in closely Correspondence: Pavel Hulva, Fax: +420 2 2195 1841; E-mail: [email protected] ȑ 2010 Blackwell Publishing Ltd Molecular Ecology (2010) 19, 5417–5431 doi: 10.1111/j.1365-294X.2010.04899.x

Welcome message from author
This document is posted to help you gain knowledge. Please leave a comment to let me know what you think about it! Share it to your friends and learn new things together.
Transcript
Molecular Ecology (2010) 19, 5417–5431 doi: 10.1111/j.1365-294X.2010.04899.x
Mechanisms of radiation in a bat group from the genusPipistrellus inferred by phylogeography, demographyand population genetics
P. HULVA,* A. FORNUSKOVA,† A. CHUDARKOVA,* A. EVIN,‡ B. ALLEGRINI ,§ P . BENDA*– and
J . BRYJA†
*Department of Zoology, Charles University in Prague, Vinicna 7, 128 44 Prague 2, Czech Republic, †Department of
Population Biology, Institute of Vertebrate Biology Academy of Sciences of the Czech Republic, 675 02 Studenec 122; and
Department of Botany and Zoology, Faculty of Science, Masaryk University, Kotlarska 2, 611 37 Brno, Czech Republic,
‡Origine, Structure et Evolution de la Biodiversite, Museum National d’Historie Naturelle, C.P. 50, 45 rue Buffon, 75005 Paris,
France, §Naturalia Environnement, Site Agroparc, B.P. 41, 223 rue Lawrence Durrell, 84911 Avignon Cedex 9, France,
–Department of Zoology, National Museum, Vaclavske Namestı 68, 115 79 Prague 1, Czech Republic
Corresponde
E-mail: hulva
� 2010 Black
Abstract
Here, we present a study of the Pipistrellus pipistrellus species complex, a highly
diversified bat group with a radiation centre in the Mediterranean biodiversity hotspot.
The study sample comprised 583 animals from 118 localities representatively covering
the bats’ range in the western Palearctic. We used fast-evolving markers (the mitochon-
drial D-loop sequence and 11 nuclear microsatellites) to describe the phylogeography,
demography and population structure of this model taxon and address details of its
diversification. The overall pattern within this group includes a mosaic of phylogenet-
ically basal, often morphologically distant, relatively small and mostly allopatric demes
in the Mediterranean Basin, as well as two sympatric sibling species in the large
continental part of the range. The southern populations exhibit constant size, whereas
northern populations show a demographic trend of growth associated with range
expansion during the Pleistocene climate oscillations. There is evidence of isolation by
distance and female philopatry in P. pipistrellus sensu stricto. Although the northern
populations are reproductively isolated, we detected introgression events among several
Mediterranean lineages. This pattern implies incomplete establishment of reproductive
isolating mechanisms in these populations as well as the existence of a past reinforce-
ment stage in the continental siblings. The occurrence of reticulations in the radiation
centre among morphologically and ecologically derived relict demes suggests that
adaptive unequal gene exchange within hybridizing populations could play a role in
speciation and adaptive radiation within this group.
Keywords: hybrid speciation, introgression, Mediterranean, microsatellites, mitochondrial DNA,
phylogeography, Pipistrellus, radiation
Received 9 May 2010; revision received 28 September 2010; accepted 30 September 2010
Introduction
The process of species formation can be studied
effectively in cases of radiations. This phenomenon is
traditionally defined as the adaptive multiplication of
nce: Pavel Hulva, Fax: +420 2 2195 1841;
@natur.cuni.cz
well Publishing Ltd
lineages, typically after colonizing a new environment
or obtaining ‘key innovations’ (Schluter 2000). Adaptive
radiation is usually approached from a macroevolution-
ary point of view; however, important insights can also
be gained from a microevolutionary perspective
because the great majority of important evolutionary
changes are concentrated early in the phylogeny of a
radiation (Gavrilets & Vose 2005). Thus, in closely

5418 P. HULVA ET AL .
related lineages, the crucial steps of the process are not
masked by long periods of independent evolution. Such
an approach is complicated by several factors. First,
radiation could be viewed as an extension of the specia-
tion process, and it is characterized by considerable
complexity and influenced by many factors. Even iden-
tifying the initial stages of radiation is difficult (as the
evolution of phenotype–environment correlations is not
pronounced in this situation), resulting in a lack of case
studies and an absence of agreement about general pat-
terns and mechanisms of adaptive radiation (Schluter
2000). The role of phenomena studied usually in con-
nection with speciation (e.g. allopatry, processes acting
in small populations, regional selection, secondary con-
tacts with hybridization, intergradation and reinforce-
ment) remains unclear and may differ in particular
cases.
Several attributes might make a model species group
promising for studying ongoing radiation. This model
taxon should exhibit sufficient diversity, indicating the
initial stages of multiple species formation. The group’s
membership of a speciose higher-order taxon would
suggest a high rate of cladogenesis within its portion of
the tree of life. Large ranges provide different kinds of
environments and enable isolation by distance (IBD) to
occur. In addition, radiations are typically connected
with geographically confined areas, and many examples
originate from islands or their equivalents in a biogeo-
graphical sense. Here, we present a study of the Pipi-
strellus pipistrellus species complex, a bat group from a
very species-rich genus that has radiated into a mosaic
of lineages at different stages of diversification and sec-
ondary contact, in particular in the rugged environment
of the Mediterranean biodiversity hotspot.
The discovery of this complex was connected with
analyses of echolocation calls and mitochondrial DNA
(mtDNA) in the widespread and well studied European
bat species, common pipistrelle Pipistrellus pipistrellus
(Schreber 1774). Two sympatric cryptic species within
this taxon were surprisingly revealed in northern Eur-
ope (Barratt et al. 1997), while further lineages and the
radiation centre of this group were later discovered in
the Mediterranean region (Hulva et al. 2004, 2007). The
recent view of this complex encompasses several some-
what distant populations (often also living in allopatry)
inhabiting peninsulas and islands of the Mediterranean
Basin, and two sibling species with secondary range
overlap inhabiting most of the western Palearctic [com-
mon pipistrelle P. pipistrellus sensu stricto (s.str.) and
soprano pipistrelle Pipistrellus pygmaeus s.str.]. Although
the complex is morphologically relatively uniform,
ongoing morphological differentiation is clear using
detailed morphometry (Benda et al. 2004; A. Evin,
unpublished data), especially in Mediterranean demes.
Differences in behaviour, phenology, ecology and other
characteristics are presumed to exist and demand fur-
ther research. Among these populations, Pipistrellus
hanaki was described as separate species considering
its genetic, geographic and morphological distinction
(Benda et al. 2004). For this study, we accepted the divi-
sion of this complex into three species: P. pipistrellus,
P. pygmaeus and P. hanaki [the latter two comprising the
P. pygmaeus sensu lato (s.l.) group in some analyses],
although the taxonomic status of particular demes is
not yet fully resolved.
The studied complex ranks among typical represen-
tatives of the pipistrellus-like, or pipistrelloid bats, a
large phenotypic group (of c. 140 species) of the family
Vespertilionidae, characterized by relatively small size,
a shortened rostrum and a specific reduction of tooth
number (Tate 1942). Recent molecular studies indicate
that this group comprises several parallel radiations,
and according to a recent conception (Hoofer & Van
Den Bussche 2003), the genus Pipistrellus Kaup, 1829
s.str. contains c. 30 species with a Palearctic, Afrotropic
and Oriental distribution. Interestingly, according to
molecular reconstructions based on mtDNA (Hoofer &
Van Den Bussche 2003), the morphologically distant
genus Nyctalus was found to have an inner position
within the Pipistrellus radiation, thus indicating consid-
erable variability within monophyletic group compris-
ing Pipistrellus and Nyctalus. For example, this taxon is
characterized by extremes in body size within the fam-
ily Vespertilionidae, which include the soprano pipist-
relle (P. pygmaeus), with a body weight of 4–7.5 g, and
the giant noctule bat (Nyctalus lasiopterus), with a body
weight of 40–75 g and an ability to prey on migrating
songbirds by aerial hawking (Popa-Lisseanu et al.
2007).
The radiation centre of the group, the Mediterranean
Basin, is the largest of the world’s five regions with a
Mediterranean climate. It stands out among important
biodiversity hotspots due to its position at the intersec-
tion of the Palearctic, Afrotropic and Oriental faunal
regions, its complicated geomorphology and its dra-
matic palaeoclimatological history (Blondel et al. 2010).
The region shows a high degree of endemism in many
groups of organisms; hence, it is reasonable to conclude
that the rate of cladogenesis is higher in the Mediter-
ranean Basin than in other areas, especially among
Mediterranean faunal elements. Moreover, the intricate
nature of the Mediterranean Basin’s biogeography
(the repeated occurrence and disappearance of gene
flow barriers) enables secondary contacts of temporarily
isolated populations.
In our study, we use sampling representatively cover-
ing the ranges of particular lineages, enabling a combi-
nation of phylogeographic and comparative population
� 2010 Blackwell Publishing Ltd

PHYLOGEOGRAPHY OF PI PISTRELLES 5419
genetic approaches. Because the pattern of intraspecific
divergences reconstructed from the cytochrome b gene
(Hulva et al. 2004, 2007) is quite shallow (especially in
the P. pygmaeus lineage), we used fast-evolving markers
(the mitochondrial control region sequence and nuclear
microsatellites). To describe proximate mechanisms of
differentiation within our model group, we aimed to
answer the following key questions based on the
respective rationales:
Markers with a different mode of inheritance may
provide a different picture of the genetic structure (e.g.
Flanders et al. 2009). (i) Therefore, do nucDNA micro-
satellite loci exhibit phylogeographic patterns that con-
trast with those observed in mtDNA?
During the speciation process, differences among nas-
cent lineages evolve due to neutral evolution in allopa-
try, spatially variable selection, character displacement,
etc. (Coyne & Orr 2004). (ii) Are there differences in the
genetic structure of particular lineages, especially
between continental siblings? Is it possible to interpret
these differences from historical and ecological points
of view?
Species with broad distribution often show substruc-
ture or clinal variation in connection with different
demographic histories and regional adaptations to vari-
able environments, which may gradate to speciation
process. Latitudinal differences often exist in the wes-
tern Palearctic region, especially due to varying impacts
of Pleistocene glaciations and different conditions in the
Mediterranean basin compared with northern areas
(Hewitt 2004). (iii) Therefore, do particular clades (espe-
cially continental siblings with large ranges) possess
geographical structure of their gene pools?
During the early stages of speciation, hybridization
and intergradation of particular lineages may occur.
The controversial topic of adaptive potential of these
processes in animals has been the subject of recent
debate (Seehausen 2004). (iv) Do the investigated lin-
eages form stable genotypic clusters in sympatry and in
contact zones between parapatric forms? Are there
signs of cytonuclear conflicts and possible historical
hybridization and introgression events within the com-
plex?
Materials and methods
Sample collection and DNA isolation
Samples for this study were obtained from field expedi-
tions and from cooperating institutions covering most
of the range of the Pipistrellus pipistrellus complex,
including Europe (focusing on its Mediterranean part),
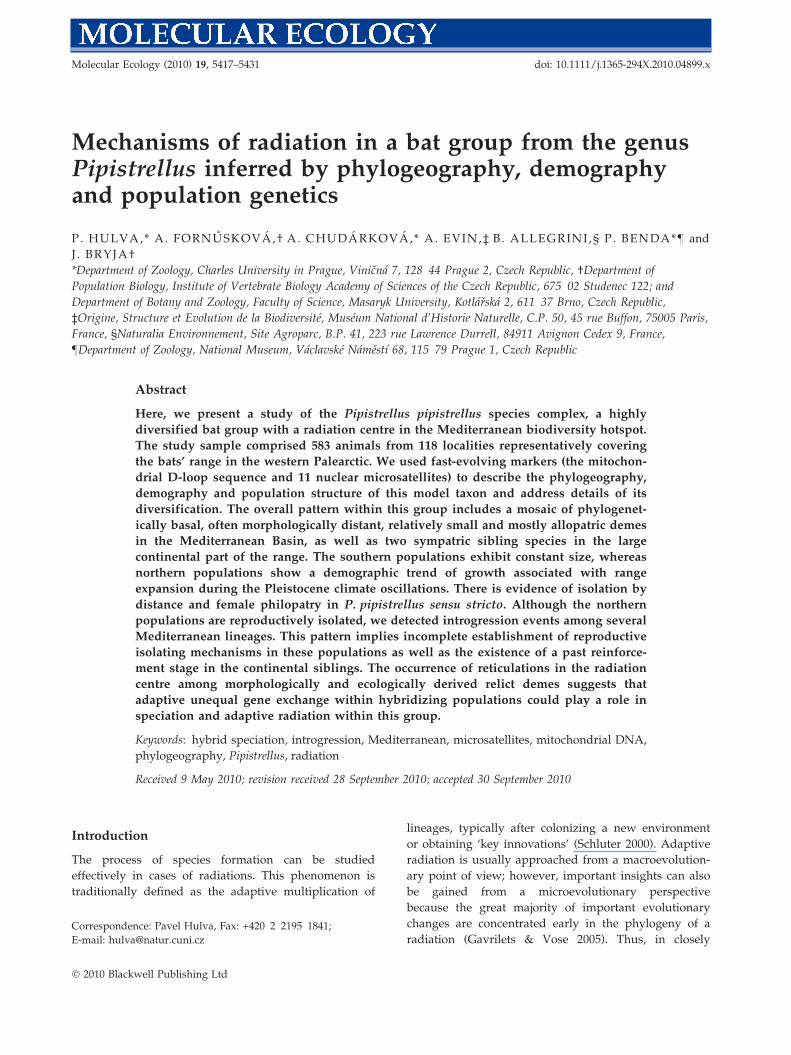
North Africa, the Middle East and Central Asia (Fig. 1,
Table S1, Supporting information). We sampled bats
� 2010 Blackwell Publishing Ltd
from various environments (caves, space over water
bodies, buildings) mostly during the period prior to
potential movements to hibernation sites. Each sample
was georeferenced. We obtained genetic data for 583
bats from 118 localities; the number of specimens
included in the mitochondrial ⁄ microsatellite data sets
varied depending on the sequencing and genotyping
success. The results are based on original data, except
for microsatellites from 237 bats from central Europe
(Bryja et al. 2009). Biopsy samples obtained from the
plagiopatagium according to the method of Worthing-
ton Wilmer & Barratt (1996) or necropsy samples from
pectoral muscle or patagium in cases of museum spec-
imens were stored in pure ethanol at )20 �C. Total
genomic DNA was extracted using the DNeasy Blood
& Tissue Kit (Qiagen).
Mitochondrial DNA sequencing
The control region, a major noncoding sequence of ani-
mal mtDNA, was chosen for this study. This element
consists of two hypervariable domains (HVI and HVII)
separated by a central conserved domain. In HVI of
P. pipistrellus, there is an insertion of R1 tandem repeats
consisting of five to nine 81-bp units (Wilkinson et al.
1997), making amplification of this region difficult.
Therefore, part of the central conserved domain (a
GC-rich segment involved in regulating H-strand repli-
cation and D-loop formation) and part of the right
hypervariable domain [HVII, containing a site for initi-
ating H-strand replication (OH) and the promoters for
H- and L-strand transcription] were analysed. The stud-
ied segment was amplified using the primers L16517
(CATCTGGTTCTTACTTCAGG; Fumagalli et al. 1996)
and HSC (TTGTTTTAGGGGTTTGGCAAGA; Fumagalli
et al. 1996) or H607 (AGGACCCATCTAAGCATTTTC
AGTG; Worthington Wilmer et al. 1994). Polymerase
chain reactions (PCRs) were performed in 20 lL vol-
umes containing 1· Taq buffer, 2.5 mM MgCl2, 200 lM
dNTPs, 0.5 lM primers, 1 U Taq polymerase (Promega)
and 100 ng template DNA. The thermal protocol
included predenaturation (94 �C, 3 min), 10 cycles of
denaturation (94 �C, 1 min), annealing (63 �C with a
decrease of 0.5 �C in each cycle, 1 min) and extension
(94 �C, 1 min), followed by 25 analogous cycles with an
annealing temperature of 58 �C and a final extension
(72 �C, 4 min). PCRs were carried out using an iCycler
Thermal Cycler (Bio-Rad). Reaction mixtures were sepa-
rated on 1% agarose gels. Products were excised from
gels and purified with the QIAquickGel Extraction Kit
(Qiagen), sequenced with the BigDye Terminator v3.1
Cycle Sequencing Kit, and analysed on a 3130 Genetic
Analyzer (Applied Biosystems). Results were edited
and compiled using SeqMan 5.05 (Swindell & Plasterer
(a)
(b)
Fig. 1 Map of the current geographic distribution of the species group and sampling localities for this study (a, Pipistrellus pipistrel-
lus—circles; b, Pipistrellus pygmaeus—circles, Pipistrellus hanaki—squares). Colour codes are used to identify the geographic origin of
haplotypes in a median-joining network (Fig. 2). Borders of the extant range of the species complex are indicated by the bold line
(modified from Courbet 1978). Maps generated using Online Map creation software (http://www.aquarius.geomar.de/omc/omc_
intro.html).
5420 P. HULVA ET AL .
1996) then aligned in ClustalW (Thompson et al. 1994).
Haplotype data were deposited in GenBank (Accession
nos: HM105963–HM106128). The sequence was read
until the R2 repeat insertion site in the conserved
sequence blocks within HVII. The length of the align-
ment within the ingroup was 378 bp. For outgroup
comparison, sequences of Pipistrellus kuhlii, Pipistrellus
nathusii, Nyctalus noctula, Nyctalus leislerii and Nyctalus
azoreum were obtained from our material (HM105960–
HM105962) or from GenBank (AF054869, DQ887608,
AY756612).
Microsatellite genotyping
The investigated bats were genotyped for 11 microsatel-
lite loci using the Multiplex PCR Kit (Qiagen) according
to the manufacturer’s instructions. The primers were
developed either for other vespertilionid bat genera
[EF1, EF4, EF6, Paur05, NN18, NnP217, NnP219
(Kanuch et al. 2007)] or directly for Pipistrellus bats
[Ppip01, Ppip02, Ppip04 and Ppip06 (Racey et al. 2007)].
Fluorescently labelled PCR products were separated by
capillary electrophoresis on an ABI 3130 Genetic Ana-
lyzer (Applied Biosystems), and electrophoretograms
were edited in GeneMapper 3.7 (Applied Biosystems).
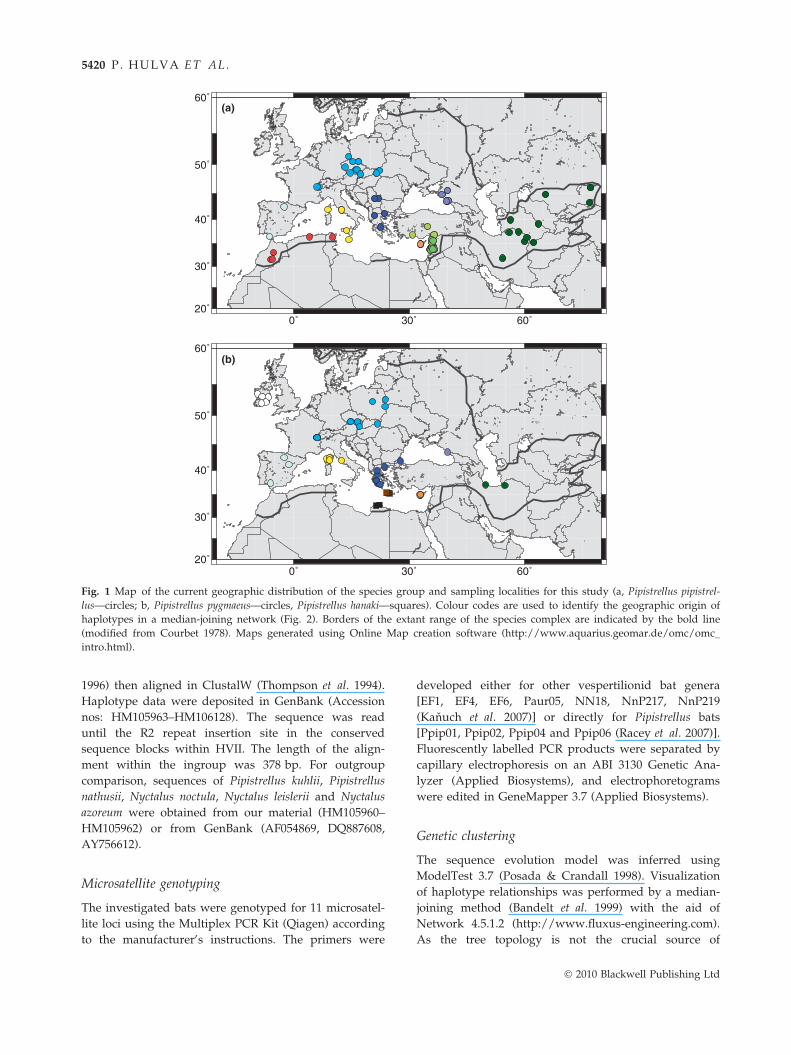
Genetic clustering
The sequence evolution model was inferred using
ModelTest 3.7 (Posada & Crandall 1998). Visualization
of haplotype relationships was performed by a median-
joining method (Bandelt et al. 1999) with the aid of
Network 4.5.1.2 (http://www.fluxus-engineering.com).
As the tree topology is not the crucial source of
� 2010 Blackwell Publishing Ltd
PHYLOGEOGRAPHY OF PI PISTRELLES 5421
information for shallow divergences, this approach
enables visualization of haplogroup structure and alter-
native genealogical hypotheses. Because the median-
joining procedure is sensitive to missing data (Joly et al.
2007), the alignment was cut to a length of 335 bp for
this analysis.
For the microsatellite data set, an individual-based
Bayesian clustering procedure, implemented in Struc-
ture 2.3.1 (Falush et al. 2003; http://pritch.bsd.uchicago.
edu/structure.html), was used to infer the number of
distinct genetic populations represented in the sample
and to assign individuals to these clusters. The Bayesian
model assumes K (unknown) populations with different
allele frequencies at a set of independent loci. The pro-
gram was run with 10 independent simulations for each
K from 1 to 10, each of 106 iterations, following a burn-
in period of 105 iterations. In all simulations, an admix-
ture ancestry model and correlated allele frequency
model (with k = 1) were used. We forced the assign-
ments of individuals to clusters beyond the number
considered to maximize the posterior probability of the
data. This approach can be used to reconstruct the hier-
archical relationships among populations as well as to
distinguish between historical processes that are likely
to shape this structure (e.g. Wang et al. 2007). The
results of 10 replicate runs for each value of K were
combined using the Greedy algorithm of Clumpp 1.1.1
(Jakobsson & Rosenberg 2007), and summary outputs
for each value of K were then displayed graphically
using Distruct v. 1.1 (Rosenberg 2004).
Comparative population genetics
Descriptive characteristics of genetic variability in the
sequence data were computed using DnaSP V5 (Rozas
et al. 2003) with 378-bp alignment, and number of
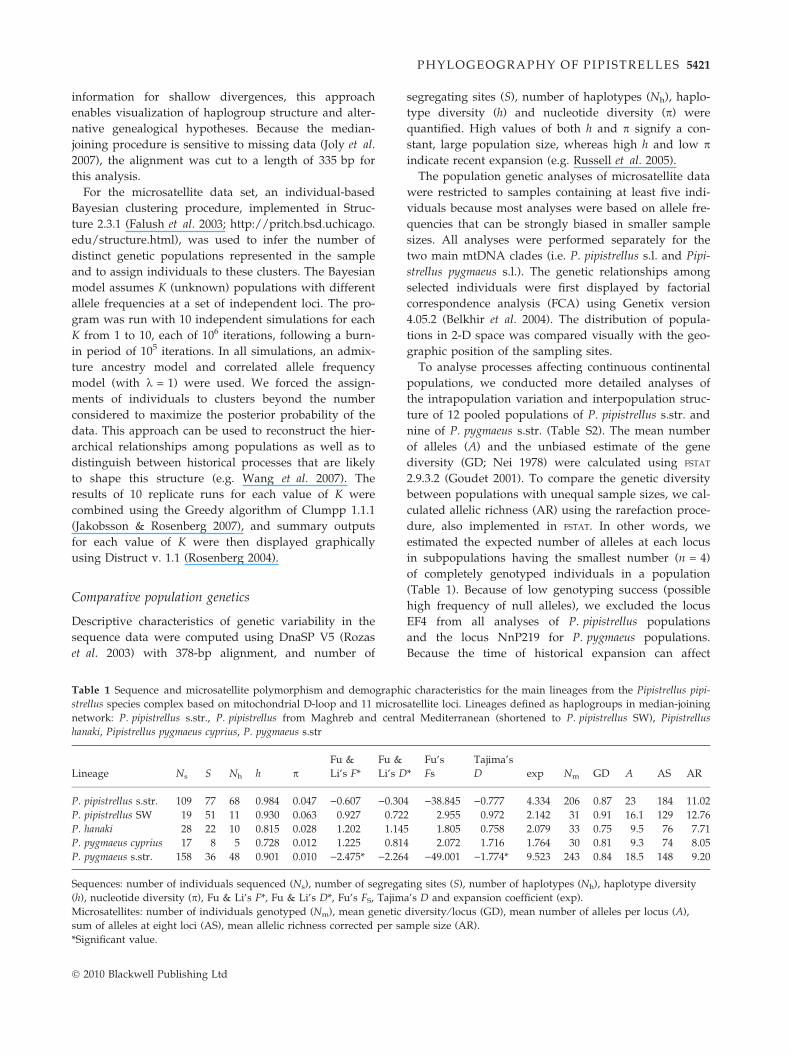
Table 1 Sequence and microsatellite polymorphism and demograph
strellus species complex based on mitochondrial D-loop and 11 micros
network: P. pipistrellus s.str., P. pipistrellus from Maghreb and centr
hanaki, Pipistrellus pygmaeus cyprius, P. pygmaeus s.str
Lineage Ns S Nh h pFu &
Li’s F*
Fu &
Li’s D
P. pipistrellus s.str. 109 77 68 0.984 0.047 )0.607 )0.30
P. pipistrellus SW 19 51 11 0.930 0.063 0.927 0.72
P. hanaki 28 22 10 0.815 0.028 1.202 1.14
P. pygmaeus cyprius 17 8 5 0.728 0.012 1.225 0.81
P. pygmaeus s.str. 158 36 48 0.901 0.010 )2.475* )2.26
Sequences: number of individuals sequenced (Ns), number of segrega
(h), nucleotide diversity (p), Fu & Li’s F*, Fu & Li’s D*, Fu’s FS, Tajim
Microsatellites: number of individuals genotyped (Nm), mean genetic
sum of alleles at eight loci (AS), mean allelic richness corrected per sa
*Significant value.
� 2010 Blackwell Publishing Ltd
segregating sites (S), number of haplotypes (Nh), haplo-
type diversity (h) and nucleotide diversity (p) were
quantified. High values of both h and p signify a con-
stant, large population size, whereas high h and low pindicate recent expansion (e.g. Russell et al. 2005).
The population genetic analyses of microsatellite data
were restricted to samples containing at least five indi-
viduals because most analyses were based on allele fre-
quencies that can be strongly biased in smaller sample
sizes. All analyses were performed separately for the
two main mtDNA clades (i.e. P. pipistrellus s.l. and Pipi-
strellus pygmaeus s.l.). The genetic relationships among
selected individuals were first displayed by factorial
correspondence analysis (FCA) using Genetix version
4.05.2 (Belkhir et al. 2004). The distribution of popula-
tions in 2-D space was compared visually with the geo-
graphic position of the sampling sites.
To analyse processes affecting continuous continental
populations, we conducted more detailed analyses of
the intrapopulation variation and interpopulation struc-
ture of 12 pooled populations of P. pipistrellus s.str. and
nine of P. pygmaeus s.str. (Table S2). The mean number
of alleles (A) and the unbiased estimate of the gene
diversity (GD; Nei 1978) were calculated using FSTAT
2.9.3.2 (Goudet 2001). To compare the genetic diversity
between populations with unequal sample sizes, we cal-
culated allelic richness (AR) using the rarefaction proce-
dure, also implemented in FSTAT. In other words, we
estimated the expected number of alleles at each locus
in subpopulations having the smallest number (n = 4)
of completely genotyped individuals in a population
(Table 1). Because of low genotyping success (possible
high frequency of null alleles), we excluded the locus
EF4 from all analyses of P. pipistrellus populations
and the locus NnP219 for P. pygmaeus populations.
Because the time of historical expansion can affect
ic characteristics for the main lineages from the Pipistrellus pipi-
atellite loci. Lineages defined as haplogroups in median-joining
al Mediterranean (shortened to P. pipistrellus SW), Pipistrellus
*
Fu’s
Fs
Tajima’s
D exp Nm GD A AS AR
4 )38.845 )0.777 4.334 206 0.87 23 184 11.02
2 2.955 0.972 2.142 31 0.91 16.1 129 12.76
5 1.805 0.758 2.079 33 0.75 9.5 76 7.71
4 2.072 1.716 1.764 30 0.81 9.3 74 8.05
4 )49.001 )1.774* 9.523 243 0.84 18.5 148 9.20
ting sites (S), number of haplotypes (Nh), haplotype diversity
a’s D and expansion coefficient (exp).
diversity ⁄ locus (GD), mean number of alleles per locus (A),
mple size (AR).
5422 P. HULVA ET AL .
genetic variation (e.g. due to changes in the effective
population size), we compared observed heterozygosity
(Ho), GD and AR between populations of P. pipistrellus
s.str. and P. pygmaeus s.str. using two-sided permuta-
tion tests (1000 permutations) in FSTAT (loci EF4 and
NnP219 were excluded from these tests).
We quantified genetic differentiation between sam-
pling sites by calculating estimators of FST, as described
by Weir & Cockerham (1984). Null alleles are known to
overestimate genetic differentiation between popula-
tions, and their occurrence is very likely in large-scale
studies. We corrected for this effect using the so-called
ENA method implemented in FreeNA software (http://
www.ensam.inra.fr/URLB/) for estimating FSTcorr at loci
thought to present null alleles. This method efficiently
corrects FST estimates for the positive bias introduced by
the presence of null alleles (Chapuis & Estoup 2007). We
analysed IBD by regressing pairwise estimates of
FSTcorr ⁄ (1 ) FSTcorr) against ln-distance between sam-
pling sites (Rousset 1997). Finally, we used Mantel tests
to test the correlation between matrices of genetic differ-
entiation and geographic distances by 1000 permutations
in Genepop 3.4 (Raymond & Rousset 1995).
Demography
Historical demographic trends in particular lineages of
the complex, defined as haplogroups in the mtDNA
data set, were assessed using several methods. First, to
detect signals of population expansion, we used simple
expansion coefficients (Peck & Congdon 2004), defined
as S ⁄ P, where P is the average number of pairwise
nucleotide differences, and neutrality tests (Ramos-
Onsins & Rozas 2002), which encompass a method
independent from pairwise comparisons (Fu & Li’s F*,
Fu & Li’s D*, Fu’s FS and Tajima’s D). We computed
these parameters with DnaSP V5. Modern approaches
to population dynamics are based on coalescent theory
and take into account the stochasticity of processes
leading to recent genealogies. Bayesian skyline plots
(BSPs) were used to reveal past population size changes
(Drummond et al. 2005). This method is independent of
a priori defined demographic models and tree recon-
structions, so it is suitable for taxa with complicated
population histories and ⁄ or shallow phylogenetic struc-
ture. In comparison with simple parametric and older
coalescent demographic methods, the smoother esti-
mates and sensitivity of this method, together with a
credibility interval, provide a realistic population size
function and enable retrieval of more details than just
summary statistics. Analyses were run in BEAST 1.4.8.
(Drummond & Rambaut 2007) using a GTR model and
a strict molecular clock. The Markov chain Monte Carlo
simulations were run with 30 000 000 iterations three
times for each lineage, while genealogies and model
parameters were sampled, each with 1000 iterations.
The first 10 000 000 iterations of each run were dis-
carded as burn-in, whereas the remaining results were
combined in LogCombiner and summarized as BSPs
after analysing their convergence in Tracer v1.4. For
approximate timing of population events, the time to
the most recent common ancestor of P. pipistrellus s.str.
lineages was set to 800 kyr according to the molecular
clock analysis of Hulva et al. (2004).
Results
Phylogeography
For the entire Pipistrellus pipistrellus complex, the R2
repeat motif was the 6-bp-long sequence TACGTG. For
outgroups, we found a TACGCA unit inserted in the
same site for Pipistrellus kuhlii, whereas a TACGCA unit
was inserted in the 3¢ direction within the structurally
rearranged HVII in Pipistrellus nathusii and the genus
Nyctalus.
The mitochondrial data set included 128 P. pipistrellus,
175 Pipistrellus pygmaeus and 28 Pipistrellus hanaki
sequences. The TrN+I+G model under hierarchical like-
lihood ratio tests and the TIM+I+G model under the
Akaike criterion best fit the data. The network (Fig. 2)
was composed of several haplogroups: P. pipistrellus
s.str., represented by haplotypes from Eurasia, two dis-
tant P. pipistrellus groups from southwestern and central
Mediterranean, P. pygmaeus s.str. from Eurasia, a dis-
tant P. pygmaeus group from Cyprus, and two clades
of P. hanaki from Libya and Crete, interconnecting
the P. pipistrellus and P. pygmaeus subnetworks. The
P. pipistrellus s.str. cluster contained 68 haplotypes and
possessed an internal structure with geographic localiza-
tion of partial haplogroups. The SW haplotypes clus-
tered into two separate, partly sympatric lineages with a
genetic distance of c. 10% (which is, interestingly, com-
parable to the separation between P. pipistrellus and
P. pygmaeus). One lineage showed a disjunct range with
six haplotypes from Morocco, Sicily, Malta and Corsica.
The second, formerly unrecognized lineage, comprised
five haplotypes from Morocco, Algeria and Tunisia. The
syntopic occurrence of both clades was detected in the
Atlas Mountains of Morocco. Pipistrellus pygmaeus s.str.
showed a shallow, geographically unstructured star-like
pattern with 48 haplotypes, dominated by a variant pos-
sessed by 49 animals that was widespread from Ireland
through Europe to the Caucasus and Iran. In the Cypriot
population of P. pygmaeus, we found six haplotypes. The
Libyan and Cretan lineages of P. hanaki comprised 10
haplotypes, and two individuals from Crete possessed a
22-bp-long insertion.
� 2010 Blackwell Publishing Ltd

2
2 24
3
3
3
3
3
7
2
2
3
2
3
322
2
2 2
58
4
5
554
2
23
10
3
4
6
42
2
8 3
28
7
2
10
7
6
2
25
62
19
3
11
2 2
2210
5 9
18
ins 22 bp
22
21
4
21
3 3
33
2
2
P. pipistrellus s.str.i P. pygmaeus s.str.i
P. pygmaeus cypriusi
P. hanakii
P. pipistrellus SWi
a
a
b
b
b
b
Fig. 2 Median-joining network indicating alternative relationships among haplotypes of the Pipistrellus pipistrellus species complex
based on D-loop sequences. Haplotypes are denoted as circles, and their size is proportional to the number of individuals with a par-
ticular variant. Colours indicate the geographic origin of particular haplotypes (according to the map in Fig. 1). Hypothetical haplo-
types are symbolized as grey dots. Numbers at branches represent numbers of mutational steps (displayed for n > 1). Areas a
(Cyprus) and b (SW of the range) denote distant mt clades sharing the same microsatellite cluster, thus indicating nuclear gene flow
between respective lineages.
PHYLOGEOGRAPHY OF PI PISTRELLES 5423
Hierarchical individual-based clustering analyses
applied to 543 microsatellite genotypes revealed an
analogous general phylogeographic pattern similar to
what is seen for mtDNA (Fig. 3). At K = 2, the P. pipi-
strellus individuals were clustered with the P. pygmaeus
cyprius population, while all remaining P. pygmaeus
were grouped with P. hanaki. In a model with K = 3,
the SW populations of the P. pipistrellus clade (Maghreb,
Corsica, Spain, Malta) created a group with P. hanaki
and P. pygmaeus from Cyprus. Increasing the number
of putative clusters resulted in complete separation
of P. pygmaeus cyprius, two different populations of
P. hanaki (Libya and Crete; completely separated at
K = 9), and further diversification within the P. pipi-
strellus clade. The European populations first diverged
from the Asian populations (at K = 5), and subse-
quently (at K = 7) a separate group from the Near East
emerged from within the Asian individuals. The popu-
lations of P. pygmaeus s.str. were much more homoge-
nous, showing only slight diversification of southern
populations (especially from Corsica and Italy) for
K = 6 and greater. Separate analyses for both P. pipi-
strellus s.l. and P. pygmaeus s.l. provided almost identi-
cal results (not shown).
� 2010 Blackwell Publishing Ltd
Strong separation of the populations from Maghreb
and some Mediterranean islands was also confirmed by
FCA (Fig. 4). Within the P. pipistrellus s.l. clade, the
only clearly separated populations were those from
Morocco and Corsica. Within the P. pygmaeus s.l. clade,
the P. hanaki populations from two locations (Crete and
Libya) were clearly separated, as was P. pygmaeus cyprius.
All other individuals from this clade formed a geneti-
cally very uniform cluster.
Hybridization and introgression
To identify the level of gene flow between particular
lineages, the occurrence of cytonuclear conflicts was
assessed via comparison of mitochondrial and microsat-
ellite classifications. Ambiguous determination occurred
in several individuals, all of which originated from the
margins and contact zones of particular lineage ranges.
These specimens were reanalysed, confirming the origi-
nal result in every case. In Cyprus, we analysed 24 sam-
ples from four neighbouring localities in the Troodos
Mountains, representing the only known population on
the island. Based on mtDNA, 17 of these samples
formed a separate haplogroup corresponding to the
Fig. 3 Population structure estimated using the program Structure based on microsatellite data from 543 individuals from 34 geo-
graphic regions. Each individual is represented by a horizontal bar divided into K colour segments. The length of each segment is
proportional to the estimated value of the membership coefficient (Q).
5424 P. HULVA ET AL .
P. pygmaeus cyprius subspecies, and six individuals pos-
sessed two P. pipistrellus haplotypes that were closely
related to Middle Eastern (Turkish and Lebanese)
sequences. However, all individuals represent one clus-
ter in their microsatellite loci (designated in Fig. 2). In
the Moroccan population from the Atlas Mountains (12
samples), a single nuclear gene pool was observed.
However, while four animals belonged to a unique
Maghrebian mitochondrial haplogroup, eight others
clustered with the Italian sequences, thus indicating a
mixing of lineages in the southwestern part of the range
(marked in Fig. 2). Within P. pipistrellus s.l., Spanish
animals possessed European mtDNA but clustered with
the Maghrebian individuals on the basis of microsatel-
lites. Similarly, a Maltese specimen with an Italian mt
haplotype seemed to cluster with Maghrebian nuclear
DNA, but more detailed sampling from this region will
be necessary.
Genetic diversity and structure of P. pipistrellus s.str.and P. pygmaeus s.str.
Genetic diversity measures from microsatellite data are
given in Tables 1 and S2. AR, unbiased GD and HO
were higher in P. pipistrellus s.str. than in P. pygmaeus
s.str. (AR: 5.124 vs. 4.977; GD: 0.850 vs. 0.842; HO:
0.747 vs. 0.680), but this difference was significant only
for HO (two-sample permutation test in FSTAT; P =
0.027). AR and GD in P. pipistrellus s.str. were nega-
tively correlated with longitude (Pearson correlation;
� 2010 Blackwell Publishing Ltd

–2.5
–2
–1.5
–1
–0.5
0
0.5
1
1.5
2(a) (b)
–1 0 1 2 3 4
Fact
oria
l axi
s 2
(14.
47%
)
Factorial axis 1 (16.36%)
–2.5
–2
–1.5
–1
–0.5
0
0.5
1
1.5
2
2.5
–2.5 –2 –1.5 –1 –0.5 0 0.5 1
Fact
oria
l axi
s 2
(25.
77%
)
Factorial axis 1 (28.79%)
P. pipistrellus clade P. pygmaeus clade
Morocco
Corsica
Crete
Cyprus
Libya
Fig. 4 A two-dimensional plot of the factorial correspondence analysis performed using Genetix based on 11 microsatellite loci for
two main clades identified on the basis of mtDNA sequences. Only population samples with more than five genotyped individuals
were included. The genetically distant geographic groups are designated by different symbols bounded by grey lines.
–0.02
0
0.02
0.04
0.06
0.08
0.1
–0.02
0
0.02
0.04
0.06
0.08
0.1(a) (b)
4 5 6 7 8 9
P. pipistrellus s. str. P. pygmaeus s. str.
Ln (distance in km)4 5 6 7 8 9
Ln (distance in km)
F STc
orr/
(1-F
STco
rr)
F STc
orr/
(1-F
STco
rr)
Fig. 5 Correlation between genetic FSTcorr ⁄ (1 ) FSTcorr) and geographic (ln scale) distances for Pipistrellus pipistrellus s.str. (a) and
Pipistrellus pygmaeus s.str. (b). Black squares, population pairs including Iran (both species) and central Asia (only P. pipistrellus s.str.).
Grey triangles, population pairs including Corsica.
PHYLOGEOGRAPHY OF PI PISTRELLES 5425
P < 0.05; Fig. S1). This result was due to low genetic
variation of eastern populations from the Caucasus,
Iran and Central Asia. On the other hand, the absolute
greatest GD and AR were found in Turkey, a region
that straddles Europe and Asia. No such correlation
with latitude or longitude was found in P. pygmaeus
s.str.
A very significant IBD pattern was found for
P. pipistrellus s.str. (Spearman rank correlation Rs =
0.838; Mantel test, P < 0.001). However, the pairwise
� 2010 Blackwell Publishing Ltd
FST-values were very low and relatively constant up
to the distance of c. 1000 km, followed by a steep
increase of pairwise FST-values between more distant
populations (Fig. 5). In contrast, no IBD pattern was
observed for P. pygmaeus s.str. (Rs = 0.098; Mantel test,
P = 0.300), for which even the most distant population
from Iran showed only moderate genetic differentia-
tion from other populations. The most divergent
population within P. pygmaeus s.str. was that from Cor-
sica. However, even after exclusion of this population,

5426 P. HULVA ET AL .
the correlation between genetic and geographic dis-
tances was not significant (Rs = 0.235; Mantel test,
P = 0.135).
Demography
The values for diversity measures and neutrality tests
for the main clades are summarized in Table 1. The
strongest signal for population growth was detected in
lineages with a northern distribution: P. pygmaeus s.str.
(expansion coefficient 9.52, negative values of neutrality
tests) and P. pipistrellus s.str. (expansion coefficient 4.33,
negative values of neutrality tests). Although the FS
results were not significant, the values were strongly
negative. An excess of low-frequency polymorphisms
was also indicated by Tajima’s D-statistic, particularly
for P. pygmaeus s.str. In contrast, populations with a
Mediterranean distribution exhibited substantially dif-
ferent demographic patterns with low expansion coeffi-
cients (2.14 for the SW P. pipistrellus, 1.76 for the
Cypriot P. pygmaeus, and 2.08 for P. hanaki) and non-
significant positive values of neutrality tests, thus indi-
cating a rather constant population size. The coalescent
approach using BSPs (Fig. 6) are consistent with this
pattern. In addition, this sensitive method indicated that
summary statistics may provide an oversimplified pic-
ture of population trends in our model taxa because
the population history may involve several stages with
Time (muta
Eff
ecti
ve p
op
ula
tio
n s
ize
(Neµ
)
1
0.1
0.01
0.001
0.0001
0.1
0.01
0.001
0.0001
1
P. pipistrellus s.str.
P. pipistrellus SW
0.01 0.02
0.01 0.02 0.03 0.04
0.03
0.05
0
0
Fig. 6 Bayesian skyline plots for the main lineages of the complex
(measured in mutations per site). The thick solid line depicts the m
highest 95% posterior density intervals. The plot for Pipistrellus pygma
different characteristics. In P. pygmaeus s.str., strong
expansion was confirmed by an c. 15-fold increase of
the population size in the last 90 kyr. However, in
P. pipistrellus s.str., a more complicated history was
revealed. A subrecent wave of population expansion
was revealed starting c. 180 kyr BP. This expansion was
predated by a period of stationarity and a possible sec-
ond growth phase at c. 800 kyr BP, which is less sup-
ported due to limitations of the power of the method
near the coalescence time and, consequently, a broader
confidence interval around that time.
Discussion
Mitochondrial vs. nuclear phylogeographic patterns
As a standard phylogeographic tool, mtDNA has well-
known advantages in connection with its high speed of
evolution in animals, maternal heredity without recom-
bination, and coalescent genealogy. Nuclear microsatel-
lite assays provide allele frequency data for highly
variable, biparentally inherited markers, enabling a
comparative population approach. Although a high rate
and stepwise mode of mutation may lead to homo-
plasy, high variability and multilocus character can
compensate for these drawbacks (Estoup et al. 2002).
Microsatellites are thereby becoming increasingly popu-
lar in phylogeographic studies (e.g. Koskinen et al.
tions per site)
P. pygmaeus s.str.
P. hanaki
0.020.01 0.03
0.01 0.02 0.03
0
0
showing changes in effective population size (Nel) over time
edian estimate, and the margins of the blue area represent the
eus cyprius is not displayed due to short coalescent time.
� 2010 Blackwell Publishing Ltd
PHYLOGEOGRAPHY OF PI PISTRELLES 5427
2002; Rossiter et al. 2007; Hu et al. 2008). For shallow
divergences, microsatellites have proven even more use-
ful than nuclear sequences, permitting avoidance of
biases associated with shared ancestral polymorphisms
and incomplete lineage sorting (Nichols 2001).
The topology of the mitochondrial D-loop network
that we observed was in good concordance with previ-
ous cytochrome b phylogenetic reconstructions (Hulva
et al. 2004, 2007), although many more haplotypes were
identified due to the relatively higher mutation rate of
the D-loop and more extensive sampling. The similarity
in the phylogeographical signal revealed by autosomal
loci indicates that both gene pools have undergone
similar evolutionary pathways. However, several cases
of cytonuclear conflict indicate mixing of particular
lineages.
Genetic differentiation in the species group
Genetic architecture of this complex was addressed using
phylogenetic approach in Hulva et al. (2004). The roots
of the entire divergence are suggested to be connected
with effects of the Messinian salinity crisis, causing
fragmentation of Mediterranean habitats and enabling
allopatric speciation events. A recent peripatric effect is
also obvious in connection with complicated geomor-
phology of the Mediterranean edge of the range. The
isolation effect could be strengthened by lower abun-
dance of the species in the Mediterranean and its
patchy distribution, resulting from a preference of
mountain habitats and ‘islands’ of forests or humid eco-
systems in dominant maquis shrublands.
The detailed sampling in this study enabled us to
compare differences in genetic structure of particular
lineages and to address proximate mechanisms of
diversification in the group. In the Pipistrellus pipistrellus
s.str. lineage, the haplotype distribution indicates IBD
on a macrogeographic scale and shows that female gene
flow was relatively low in relation to the population
size, thus enabling lineage sorting and drift to develop
shallow genetic substructure. In a microsatellite study
in central Europe (Bryja et al. 2009), no IBD was
observed in either species in the study area (within dis-
tances up to 800 km). Our data suggest that a distance
of c. 1000 km may represent a limit in gene flow for this
species in a landscape free of geographic barriers. The
negative correlation of genetic diversity with longitude
is concordant with presumed range expansion from the
western Mediterranean (Hulva et al. 2004). The Middle
Pleistocene establishment of a longitudinal gradient and
a relatively recent northward spread (Hulva et al. 2004)
is probably also mirrored by the skyline plot. Given
that the second expansion event predates the first
appearance date of these species in central Europe (Pipi-
� 2010 Blackwell Publishing Ltd
strellus s.l. fossils are completely absent in mass cave
thanatocenoses in central Europe and the Balkans prior
to the Holocene and ⁄ or late Weichselian; Horacek &
Jahelkova 2005), it is probable that this phase was
related to the Eemian interglacial period in the Mediter-
ranean region, which has been connected with the
spread of warm open habitats. In the Mediterranean,
the fossil record goes back to the Middle Pleistocene
(Spain, Malta; Horacek & Jahelkova 2005).
Relationships of P. pipistrellus haplotypes within
southwestern parts of the range indicate historical con-
nections of the Maghrebian and central Mediterranean
populations. The tip position of Maltese, Sicilian and
Corsican samples in the network indicates colonization
of these territories from North Africa. More detailed sam-
pling of peninsular Italy will be necessary to resolve this
pattern and the possible contact zone with P. pipistrellus
s.str. in this area. The Iberian area shows no genetic
exclusivity in pipistrelles and, thus, probably did not
play a role as a refugium in this case. In addition, the
Gibraltar strait has been repeatedly referred to as a
barrier for gene flow in bats (Castella et al. 2000; Garcıa-
Mudarra et al. 2009). In pipistrelles, the complete iso-
lation of populations on both sides of the strait was
ascertained from matrilineal mitochondrial markers, but
sharing of microsatellite alleles implies that gene flow in
this group is biased towards males.
The absence of IBD and spatial structure in Pipistrel-
lus pygmaeus s.str. could have been caused by very
recent (Holocene) colonization of the continental range
(especially the Iranian part; Fig. 5) and ⁄ or differences
in biology from P. pipistrellus s.str. (such as different
dispersal of subadults, more pronounced migratory
behaviour, phenology, metapopulation structure with
different gregarious behaviour, colony size, the absence
of mass winter hibernacula in Central Europe and social
system). These differences could be a result of neutral
evolution and regional selection during allopatric
stages, as well as the consequence of niche differentia-
tion in sympatry. In a study of an island population of
pipistrelles in Great Britain by Racey et al. (2007), an
IBD pattern was observed in both sibling species at
shorter distances than on the continent, and the IBD
pattern was more marked in P. pipistrellus s.str. How-
ever, no effect of the sea channel was observed. In our
data, potentiation of the IBD pattern by a sea body was
observed in P. pygmaeus s.str. in Corsica (Fig. 5).
This finding favours ascribing genetic homogeneity of
P. pygmaeus s.str. more to recent range expansion than
to a greater migration capacity. Furthermore, this impli-
cation is supported by the BSP, which showed strong
population growth (c. 15-fold) during the Weichselian–
Holocene, thus indicating an even stronger and later
range expansion in this species, which could also

5428 P. HULVA ET AL .
contribute to the sudden rise of P. pipistrellus s.l. in the
fossil record of central Europe.
The Cypriot population, formally described as the
subspecies P. pygmaeus cyprius, constitutes a relatively
distant mitochondrial and nuclear clade, which reflects
its relatively isolated island position, with the nearest
recently ascertained populations of P. pygmaeus on the
Balkan Peninsula and in proximity to the Black and
Caspian seas. Given that Cyprus was never in contact
with the mainland, the origin of this population is likely
explained by a colonization event. Different characteris-
tics of the Cypriot orphan deme compared with its con-
tinental siblings are probably a consequence of retained
ancestral character states corresponding to a relict pop-
ulation located near the radiation centre of the entire
complex, and an insular syndrome, involving founder
effect, drift and regional selection. Similar factors may
play a role in the evolution of genetic distinctness of
isolated Pipistrellus hanaki populations.
The substantially different nature of the Mediterra-
nean and continental populations was proven not only
by general phylogeographic patterns, but also by demo-
graphic and population analyses. Restrictions of gene
flow and constant population size are characteristic for
the south, whereas the opposite is true for the north.
This pattern may be correlated with the fact that despite
some oscillations also occurred in the Mediterranean
region during the Pleistocene (e.g. Dansgaard–Oeschger
cyclicity), this region could generally be considered
more climatically stable and excluded from glacial fluc-
tuations. The northern siblings have evolved regional
migratory behaviour (and other ecological adaptations,
such as utilization of caves for hibernation) that is con-
nected mainly with the annual cyclicity of the climate
in the part of the range located in the temperate zone.
Spatial behaviour of bats from the P. pipistrellus com-
plex remains enigmatic. It is not clear, for example, dur-
ing which stage of annual cycle mating occurs and
whether gene flow should be ascribed to the dispersal
of subadults to new territories and ⁄ or to seasonal
migrations between summer and winter roosts. Our
data suggest sex differences in site fidelity with female
natal philopatry and male dispersal, as is common
among other bats (Kunz 1982). Because the direct
evidence for long-distance movements from capture-
recapture experiments is scarce due to very low recov-
ery in banding studies, our results represent an
important quantification of patterns of gene flow on the
rangewide scale, which could not be uncovered by
geographically limited studies. A combination of two
contrasting features was relevant in shaping the recent
phylogeographic patterns of these bat species in the
Mediterranean and in the colonization of islands. The
first of these relates to the capacity for flying large
distances that is indicated by their wing morphology,
their phylogenetic proximity to obligate migrants (Pipi-
strellus nathusii, noctules) and occasional observations of
animals moving over the open sea (Ahlen et al. 2009).
The second contrasting feature is associated with the
role of ethological factors and site fidelity as well as
ecological adaptations that prevented the development
of a panmictic pattern (most pronounced in continental
P. pygmaeus s.str.) throughout the entire range. This case
study suggests a role for allopatry in the early stages of
adaptive radiations, which is a phenomenon that is
traditionally studied in connection with speciation.
Hybridization and introgression in Mediterraneanpopulations
The most parsimonious interpretation of the occurrence
of alien P. pipistrellus mitochondria in P. pygmaeus cypri-
us is introgression mediated by P. pipistrellus females
occasionally migrating to the island from neighbouring
Turkish or Levant territories. The interspecific mating
was probably facilitated by the abundance asymmetry
of both species and the absence or incompleteness of
intrinsic reproductive isolating mechanisms (RIMs)
between both primarily allopatric lineages. Neverthe-
less, the clustering of Cypriot microsatellite genotypes
with P. pipistrellus s.str. in the Bayesian procedure with
K = 2 suggests a more intense contribution of P. pipi-
strellus s.str. to this mixed nuclear gene pool and the
possibility of ongoing hybrid speciation. Similar phe-
nomenon, the admixture among Carribean species of
Artibeus, was reported recently in the southern Lesser
Antilles (Larsen et al. 2010). Genomic approaches will
be needed to analyse the Cypriot populations in detail.
Next, we presume that the occurrence of central Med-
iterranean haplotypes within the Maghrebian popula-
tion is a consequence of past hybridization and reflects
historical range shifts and gene flow between the two
lineages. The intergrade classification of the Spanish
and Maltese individuals indicates incomplete isolation
of particular P. pipistrellus lineages, especially in the
case of animals that are vagrant over the Gibraltar Strait
and the Strait of Sicily.
In contrast, in P. pipistrellus s.str. and P. pygmaeus
s.str., secondary contact of ancestral Mediterranean-born
lineages (Hulva et al. 2004) was accompanied by the
evolution of complete RIMs, as the hybridization
between these two forms has never been referred to in
genetic studies (Racey et al. 2007; Bryja et al. 2009).
Compared with the initial stages of secondary contacts
in other lineages, hybridization and reinforcement could
play a role in completing the speciation process. The
reproductive isolation of both lineages was associated
with the development of a broad zone of sympatry,
� 2010 Blackwell Publishing Ltd

PHYLOGEOGRAPHY OF PI PISTRELLES 5429
presumably accompanied by character displacement
(e.g. the shift of P. pygmaeus from its ancestral 45 kHz
to a 55 kHz echolocation frequency). The contrasting
genetic patterns of both sympatric forms indicate that
diversifying selection may also act on other traits con-
nected, for example, with ecology and social systems.
The evolution of assortative mate choice is tradition-
ally viewed as an adaptation to prevent production of
unfit hybrids. Within the concept of a ‘porous genome’,
the loci connected with adaptations may evolve inde-
pendently despite hybridization (e.g. Gavrilets & Vose
2005). However, in recent decades, a positive role of
introgressive hybridization in speciation and adaptive
radiation has been receiving greater attention (Seehau-
sen 2004; Grant et al. 2005), and there is growing evi-
dence of its abundance in nature (e.g. Sota 2002),
including the evolution of modern humans (Green et al.
2010). Higher frequencies of hybridization may have
also occurred during species invasions to new environ-
ments, coinciding with an increasing rate of adaptive
evolution associated with changes in demography and
response to selection. New, advantageous genetic com-
binations could be gained due to partial and unequal
gene exchange between hybridizing species, as medi-
ated by transgressive segregation, which has been
reported both from breeding programmes (Rieseberg
et al. 2003) and from field studies (Martinsen et al.
2001). In bats, which are the only mammals with pow-
ered flight and, thus, a great capacity for movement,
there could be frequent chances of secondary contacts
between geographically isolated lineages that are an
order of magnitude greater than in nonvolant mam-
mals. As multilocus genetic studies are becoming rou-
tine, the number of empirical examples of hybridization
and introgression in bats is growing (e.g. Mao et al.
2010). In pipistrelles, the occurrence of reticulate evolu-
tion in nascent and phenotypically distinct Mediterra-
nean demes supports the view of the complex as a
syngameon with an important role for the anastomose
component in speciation and adaptive radiation.
Although the aim of this work was not taxonomical,
it does address the level of gene flow and biologically
meaningful subunits defined within the group. Some
demes show substantial degrees of isolation and inhabit
relatively small ranges, often in popular tourist destina-
tions on the Mediterranean Sea, and their conservation
status should be assessed.
Acknowledgements
We are grateful to T. Bartonicka, R. Bilgin, B. Bolfikova, Ch.
Dietz, A. Evin, S. Gazaryan, P. Georgiakakis, V. Hanak, I.
Horacek, P. Kanuch, M. Kovar, R. Lucan, M. Paunovic, Z. Rehak,
M. Ruedi, P. Strelkov and the Groupe Chiroptere Corse for
� 2010 Blackwell Publishing Ltd
their help in the field sampling or providing tissue samples.
We thank to three anonymous referees for their helpful com-
ments. The project was funded by the Grant Agency of the
Academy of Sciences of the Czech Republic (KJB601110807),
the Ministry of Education, Youth and Sports of the Czech
Republic (MSMT 0021620828, MSM 0021622416 and Research
Centre LC06073), the Czech Science Foundation (206 ⁄ 09 ⁄ 0888
and 206 ⁄ 06 ⁄ 0954) and the Office National des Forets, Direction
de l’Environnement et du Developpement Durable.
Authors’ contribution
PH initiated the study, performed analyses of mitochondrial
data and wrote the manuscript. AC undertook the laboratory
work for most of the sequences and AF for microsatellites. BA
provided samples from Maghreb, PB from North Africa and the
Middle East and AE from Corsica. JB performed the analyses of
microsatellite data and wrote appropriate parts of the text.
References
Ahlen I, Baagoe HJ, Bach L (2009) Behavior of Scandinavian
bats during migration and foraging at sea. Journal of
Mammalogy, 90, 1318–1323.
Bandelt HJ, Foster P, Rohl A (1999) Median–joining networks
for inferring intraspecific phylogenies. Molecular Biology and
Evolution, 16, 37–48.
Barratt EM, Deaville R, Burland TM et al. (1997) DNA answers
the call of pipistrelle bat species. Nature, 387, 138–139.
Belkhir K, Borsa P, Chikhi L, Raufaste N, Bonhomme F (2004)
Genetix 4.05: Windows software for population genetics. Labora-
toire Genome et Populations, Universite de Montpellier II,
Montpellier, France.
Benda P, Hulva P, Gaisler J (2004) Systematic status of African
populations of Pipistrellus pipistrellus complex (Chiroptera:
Vespertilionidae), with a description of a new species from
Cyrenaica, Libya. Acta Chiropterologica, 6, 193–217.
Blondel J, Aronson J, Bodiou J-Y, Boeuf G (2010) The
Mediterranean Region: Biological Diversity through Time and
Space. Oxford University Press, Oxford.
Bryja J, Kanuch P, Fornuskova A, Bartonicka T, Rehak Z (2009)
Low population genetic structuring of two cryptic bat
species suggests their migratory behaviour in continental
Europe. Biological Journal of the Linnean Society, 96, 103–114.
Castella V, Ruedi M, Excoffier L, Ibanez C, Arlettaz R, Hausser
J (2000) Is the Gibraltar Strait a barrier to gene flow for the
bat Myotis myotis (Chiroptera: Vespertilionidae)? Molecular
Ecology, 9, 1761–1772.
Chapuis MP, Estoup A (2007) Microsatellite null alleles and
estimation of population differentiation. Molecular Biology
and Evolution, 24, 621–631.
Courbet GB (1978) The Mammals of the Palaearctic Region: A
Taxonomic Review. British Museum (Natural History) and
Cornell University Press, London ⁄ Ithaca.
Coyne J, Orr HA (2004) Speciation. Sinauer, Sunderland, MA.
Drummond AJ, Rambaut A (2007) BEAST: Bayesian evolutionary
analysis by sampling trees. BMC Evolutionary Biology, 7, 214.
Drummond AJ, Rambaut A, Shapiro B, Pybus OG (2005)
Bayesian coalescent inference of past population dynamics

5430 P. HULVA ET AL .
from molecular sequences. Molecular Biology and Evolution, 5,
1185–1192.
Estoup A, Jarne P, Cornuet JM (2002) Homoplasy and
mutation model at microsatellite loci and their consequences
for population genetics analysis. Molecular Ecology, 11, 1591–
1604.
Falush D, Stephens M, Pritchard JK (2003) Inference of
population structure using multilocus genotype data: linked
loci and correlated allele frequencies. Genetics, 164, 1567–
1587.
Flanders J, Jones G, Benda P et al. (2009) Phylogeography of
the greater horseshoe bat, Rhinolophus ferrumequinum: con-
trasting results from mitochondrial and microsatellite data.
Molecular Ecology, 18, 306–318.
Fumagalli L, Taberlet P, Favre L, Hausser J (1996) Origin and
evolution of homologous repeated sequences in the mito-
chondrial DNA control region of shrews. Molecular Biology
and Evolution, 13, 31–46.
Garcıa-Mudarra JL, Ibanez C, Juste J (2009) The Straits of
Gibraltar: barrier or bridge to Ibero-Moroccan bat diversity?
Biological Journal of the Linnean Society, 96, 434–450.
Gavrilets S, Vose A (2005) Dynamic patterns of adaptive
radiation. Proceedings of the National Academy of Sciences, USA,
102, 18040–18045.
Goudet J (2001) FSTAT: A program to estimate and test gene
diversities and fixation indices (Version 2.9.3.2). Available from
http://www.unil.ch/izea/softwares/fstat.html.
Grant PR, Grant BR, Petren K (2005) Hybridization in the
recent past. The American Naturalist, 166, 56–67.
Green RE, Krause J, Briggs AW et al. (2010) A draft sequence
of the neandertal genome. Science, 328, 710–722.
Hewitt GM (2004) Genetic consequences of climatic oscillations
in the Quaternary. Proceedings of the Royal Society of London.
Series B: Biological Sciences, 359, 183–195.
Hoofer SR, Van Den Bussche RA (2003) Molecular phylo-
genetics of the chiropteran family Vespertilionidae. Acta
Chiropterologica, 5(Suppl.), 1–63.
Horacek I, Jahelkova H (2005) History of the Pipistrellus
pipistrellus group in Central Europe in light of its fossil
record. Acta Chiropterologica, 7, 189–204.
Hu L-J, Uchiyama K, Shen H-L, Saito Y, Tsuda Y, Ide Y (2008)
Nuclear DNA microsatellites reveal genetic variation but a
lack of phylogeographical structure in an endangered
species, Fraxinus mandshurica, across north-east China. Annals
of Botany, 102, 195–205.
Hulva P, Horacek I, Strelkov PP, Benda P (2004) Molecular
architecture of Pipistrellus pipistrellus ⁄ Pipistrellus pygmaeus
complex (Chiroptera: Vespertilionidae): further cryptic
species and Mediterranean origin of the divergence.
Molecular Phylogenetics and Evolution, 32, 1023–1035.
Hulva P, Benda P, Hanak V, Evin A, Horacek I (2007) New
mitochondrial lineages within the Pipistrellus pipistrellus
complex from Mediterranean Europe. Folia Zoologica, 56,
378–388.
Jakobsson M, Rosenberg NA (2007) CLUMPP: a cluster
matching and permutation program for dealing with label
switching and multimodality in analysis of population
structure. Bioinformatics, 23, 1801–1806.
Joly S, Stevens MI, Jansen van Vuuren B (2007) Haplotype
networks can be misleading in the presence of missing data.
Systematic Biology, 56, 857–862.
Kanuch P, Fornuskova A, Bartonicka T, Bryja J (2007) Multiplex
panels of polymorphic microsatellite loci for two cryptic bat
species of the genus Pipistrellus, developed by cross-species
amplification within the family Vespertilionidae. Molecular
Ecology Notes, 7, 871–873.
Koskinen MT, Nilsson J, Veselev A, Potutkin AG, Ranta E,
Primmer CR (2002) Microsatellite data resolve phylogeo-
graphic patterns in European grayling, Thymallus thymallus,
Salmonidae. Heredity, 88, 391–401.
Kunz TH (1982) Roosting ecology. In: Ecology of Bats (ed. Kunz
TH), pp. 1–55. Plenum Press, New York.
Larsen PA, Marchan-Rivadeneira MR, Baker RJ (2010) Natural
hybridization generates mammalian lineage with species
characteristics. Proceedings of the National Academy of Sciences,
USA, 107, 11447–11452.
Mao X, Zhang J, Zhang S, Rossiter SJ (2010) Historical male-
mediated introgression in horseshoe bats revealed by
multilocus DNA sequence data. Molecular Ecology, 19, 1352–
1366.
Martinsen GD, Whitham TG, Turek RJ, Keim P (2001) Hybrid
populations selectively filter gene introgression. Evolution,
55, 1325–1335.
Nei M (1978) Estimation of average heterozygosity and genetic
distance from a small number of individuals. Genetics, 89,
583–590.
Nichols R (2001) Gene trees and species trees are not the same.
Trends in Ecology & Evolution, 16, 358–364.
Peck DR, Congdon BC (2004) Reconciling historical processes
and population structure in the sooty tern Sterna fuscata.
Journal of Avian Biology, 35, 327–335.
Popa-Lisseanu AG, Delgado-Huertas A, Forero MG, Rodriguez
A, Arlettaz R, Ibanez C (2007) Bats’ conquest of a formidable
foraging niche: the myriads of nocturnally migrating
songbirds. PLoS ONE, 2, e205.
Posada D, Crandall KA (1998) Modeltest: testing the model of
DNA substitution. Bioinformatics, 14, 817–818.
Racey P, Barratt EM, Burland TM et al. (2007) Microsatellite
DNA polymorphism confirms reproductive isolation and
reveals differences in population genetic structure of cryptic
pipistrelle bat species. Biological Journal of the Linnean Society,
90, 539–550.
Ramos-Onsins S, Rozas J (2002) Statistical properties of new
neutrality tests against population growth. Molecular Biology
and Evolution, 19, 2092–2100.
Raymond M, Rousset F (1995) Genepop (version 1.2): population
genetic software for exact tests and eucumenisms. Journal of
Heredity, 86, 248–249.
Rieseberg LH, Widmer A, Arntz AM, Burke JM (2003) The
genetic architecture necessary for transgressive segregation is
common in both natural and domesticated populations.
Philosophical Transactions of the Royal Society of London. Series
B, Biological Sciences, 358, 1141–1147.
Rosenberg NA (2004) Distruct: a program for the graphical
display of population structure. Molecular Ecology Notes, 4,
137–138.
Rossiter SJ, Benda P, Dietz Ch, Zhang S, Jones G (2007)
Rangewide phylogeography in the greater horseshoe bat
inferred from microsatellites: implications for population
history, taxonomy and conservation. Molecular Ecology, 16,
4699–4714.
� 2010 Blackwell Publishing Ltd
PHYLOGEOGRAPHY OF PI PISTRELLES 5431
Rousset F (1997) Genetic differentiation and estimation of gene
flow from F-statistics under isolation-by-distance. Genetics,
145, 1219–1228.
Rozas J, Sanchez-DelBarrio JC, Messeguer X, Rozas R (2003)
DnaSP, DNA polymorphism analyses by the coalescent and
other methods. Bioinformatics, 19, 2496–2497.
Russell AL, Mendellın A, McCracken F (2005) Genetic
variation and migration in the Mexican free-tailed bat
(Tadarida brasiliensis mexicana). Molecular Ecology, 14, 2207–
2222.
Schluter D (2000) The Ecology of Adaptive Radiation. Oxford
University Press, Oxford, UK.
Seehausen O (2004) Hybridization and adaptive radiation.
Trends in Ecology & Evolution, 19, 198–207.
Sota T (2002) Radiation and reticulation: extensive introgressive
hybridization in the carabid beetles Ohomopterus inferred
from mitochondrial gene genealogy. Population Ecology, 44,
145–156.
Swindell SR, Plasterer TN (1996) SEQMAN: contig assembly.
Methods in Molecular Biology, 70, 75–89.
Tate GHH (1942) Results of the Archbold expeditions. No. 47.
Review of vespertilionine bats, with special attention to
genera and species of the Archbold collections. Bulletin of the
American Museum of Natural History, 80, 221–297.
Thompson JD, Higgins DG, Gibson TJ (1994) CLUSTAL W:
improving the sensitivity of progressive multiple sequence
alignment through sequence weighting, position-specific gap
penalties and weight matrix choice. Nucleic Acids Research,
22, 4673–4680.
Wang S, Lewis CM, Jakobsson M et al. (2007) Genetic variation
and population structure in Native Americans. Public
Library of Science. Genetics, 3, 2049–2067.
Weir BS, Cockerham CC (1984) Estimating F-statistics for the
analysis of population structure. Evolution, 38, 1358–1370.
Wilkinson GS, Myer F, Kerth G, Petri B (1997) Evolution of
repeated sequence arrays in the D-loop region of bat
mitochondrial DNA. Genetics, 146, 1035–1048.
Worthington Wilmer J, Barratt E (1996) A non-lethal method of
tissue sampling for genetic studies of chiropterans. Bat
Research News, 37, 1–3.
� 2010 Blackwell Publishing Ltd
Worthington Wilmer J, Moritz C, Hall L, Toop J (1994)
Extreme population structuring in the threatened ghost bat,
Macroderma gigas: evidence from mitochondrial DNA.
Proceedings of the Royal Society of London. Series B, Biological
Sciences, 257, 193–198.
This study was conducted as a part of PH’s postdoctoral pro-
jects at Charles University in Prague in the context of long-term
multidisciplinary research into the Pipistrellus pipistrellus com-
plex as a speciation model and of the Mediterranean region as a
biodiversity hotspot. PH, AC, AF and JB are interested mainly
in molecular evolution of mammals, BA in ecology, AE in
morphology and PB in biogeography and taxonomy of bats.
Supporting information
Additional Supporting Information may be found in the online
version of this article.
Table S1 List of sampling sites and their coordinates, number
of individuals sequenced and ⁄ or genotyped, and GenBank
Accession numbers
Table S2 Populations used for detailed spatial genetics analy-
ses of microsatellite genotypes. Number of individuals geno-
typed (Nm), mean number of alleles per locus (A), observed
heterozygosity (HO), mean genetic diversity ⁄ locus (GD), mean
allelic richness corrected per sample size (AR)
Fig. S1 Correlation of mean allelic richness corrected per sam-
ple size (AR) with longitude in Pipistrellus pipistrellus s.str.
Please note: Wiley–Blackwell are not responsible for the con-
tent or functionality of any supporting information supplied
by the authors. Any queries (other than missing material)
should be directed to the corresponding author for the article.
Related Documents


![Phylogeography of the current rabies viruses in Indonesia · inferred using the BEAST software package ver. 1.7 [13] with the BEAGLE library [3]. A location-annotated XML file was](https://static.cupdf.com/doc/110x72/5ec767010581441c0d0315c3/phylogeography-of-the-current-rabies-viruses-in-indonesia-inferred-using-the-beast.jpg)