Mechanisms of Membrane Fouling by Macromolecules at Multiple Scales during Ultrafiltration Xiafu Shi Hertford College University of Oxford A thesis submitted for the degree of Doctor of Philosophy Michaelmas 2014

Welcome message from author
This document is posted to help you gain knowledge. Please leave a comment to let me know what you think about it! Share it to your friends and learn new things together.
Transcript

Mechanisms of Membrane Foulingby Macromolecules at Multiple
Scales during Ultrafiltration
�Xiafu Shi
Hertford College
University of Oxford
A thesis submitted for the degree of
Doctor of Philosophy
Michaelmas 2014

Statement of Originality
The candidate confirms that the work submitted is his own and that
appropriate credit has been given where reference has been made to the
work of others. This copy has been supplied on the understanding that
it is copyright material and that no quotation from the thesis may be
published without proper acknowledgement.

Mechanisms of Membrane Fouling by Macromolecules atMultiple Scales during Ultrafiltration
Xiafu ShiHertford College, University of Oxford
A thesis submitted for the degree of Doctor of Philosophy in Engineering Science
Michaelmas 2014
Abstract: The thesis aims to gain a better understanding on the mechanisms of
the complicated macromolecular fouling in ultrafiltration (UF). The work is divided
into three main parts. Firstly, comprehensive literature reviews on both membrane
fouling and cleaning were carried out for a better overview on this problem. The
findings such as the identification of the main foulants and the current knowledge on
fundamental fouling mechanisms, directly contributed to further parts of the thesis.
Secondly, a multiscale approach was developed to form generalised framework for
modelling complex fouling scenarios. Two complex fouling models combining multi-
ple fouling mechanisms were derived accordingly. The models were then applied to
the filtration data collected from UF experiments (constant-pressure and dead-end)
on three individual macromolecular solutes, i.e., dextran blue (DB), polyethylene ox-
ide (PEO), and humic acid (HA), respectively. During the experiments, the effect of
macromolecular concentration and transmembrane pressure was investigated. Using
the appropriate combined model, the overall and initial fouling behaviours and the
predominant fouling mechanisms at different stages of filtration were identified. The
fouling parameters in the combined models were determined and found to be con-
sistent with the existing theories. The switch points between the dominant fouling
mechanisms were assessed using two methods (integral and differential), respectively.
Comparing all the information together gave a comprehensive understanding of the
physics involved in the macromolecular fouling.
Finally, the effect of the deformability of a macromolecule on membrane fouling
was studied. The sieving results from the experiments indicated a flux-dependent
permeation during UF of the DB solution, hypothetically due to the elongational
deformation of the large DB molecule (a linear polymer at 2000 kDa MWCO) un-
der high velocity gradient at the pore entrance, allowing the molecule to adapt a
smaller transversal size to enter pores at nominally 100 kDa cutoff. This not only
increased the chances of permeation but also the probability of severe irreversible foul-
ing. Subsequently, a mesoscopic model using dissipative particle dynamics (DPD) was
developed to investigate the blocking event at the pore entrance in the presence of a
deformable linear macromolecule. The simulation results shed lights on the threshold
permeating flux at which the molecular chains start to deform.

To my parents and grandparents

Contents
1 Introduction 1
1.1 Motivation and Objectives . . . . . . . . . . . . . . . . . . . . . . . . 1
1.2 Thesis Layout . . . . . . . . . . . . . . . . . . . . . . . . . . . . . . . 2
2 Literature Review of Membrane Fouling in Ultrafiltration 4
2.1 Overview of Membrane Filtration . . . . . . . . . . . . . . . . . . . . 4
2.2 Membrane Fouling in Ultrafiltration . . . . . . . . . . . . . . . . . . . 7
2.2.1 Nature of Flux Decline . . . . . . . . . . . . . . . . . . . . . . 7
2.2.2 Forms of fouling . . . . . . . . . . . . . . . . . . . . . . . . . . 8
2.2.2.1 Adsorption . . . . . . . . . . . . . . . . . . . . . . . 8
2.2.2.2 Pore Blocking . . . . . . . . . . . . . . . . . . . . . . 9
2.2.2.3 Deposition . . . . . . . . . . . . . . . . . . . . . . . 9
2.2.2.4 Gel Formation . . . . . . . . . . . . . . . . . . . . . 10
2.2.3 Foulants . . . . . . . . . . . . . . . . . . . . . . . . . . . . . . 10
2.2.3.1 Particulates . . . . . . . . . . . . . . . . . . . . . . . 11
2.2.3.2 Macromolecules . . . . . . . . . . . . . . . . . . . . . 11
2.2.3.3 Ions . . . . . . . . . . . . . . . . . . . . . . . . . . . 14
2.2.3.4 Biological Substances . . . . . . . . . . . . . . . . . . 14
2.2.3.5 Mixtures . . . . . . . . . . . . . . . . . . . . . . . . 14
2.2.4 Parameters Affecting Fouling . . . . . . . . . . . . . . . . . . 15
2.2.4.1 pH . . . . . . . . . . . . . . . . . . . . . . . . . . . . 15
2.2.4.2 Ionic Strength . . . . . . . . . . . . . . . . . . . . . 15
2.2.4.3 Divalent Cations . . . . . . . . . . . . . . . . . . . . 15
2.2.4.4 Membrane Materials . . . . . . . . . . . . . . . . . . 16
2.3 The ‘Blocking’ Theory of Fouling . . . . . . . . . . . . . . . . . . . . 16
2.3.1 Classical Blocking Filtration Laws . . . . . . . . . . . . . . . . 16
2.3.1.1 Constant Pressure Blocking . . . . . . . . . . . . . . 17
i

2.3.1.2 Blocking Laws for Other Operational Conditions . . 19
2.3.2 Combined Blocking Models . . . . . . . . . . . . . . . . . . . 21
2.4 Conclusions . . . . . . . . . . . . . . . . . . . . . . . . . . . . . . . . 23
3 Literature Review: Cleaning of Membrane 24
3.1 Introduction . . . . . . . . . . . . . . . . . . . . . . . . . . . . . . . . 24
3.2 Principal of Membrane Cleaning . . . . . . . . . . . . . . . . . . . . . 25
3.3 Physical Cleaning . . . . . . . . . . . . . . . . . . . . . . . . . . . . . 26
3.3.1 Hydraulic cleaning methods . . . . . . . . . . . . . . . . . . . 26
3.3.1.1 Relaxation . . . . . . . . . . . . . . . . . . . . . . . 26
3.3.1.2 Surface flushing . . . . . . . . . . . . . . . . . . . . . 27
3.3.1.3 Backwashing . . . . . . . . . . . . . . . . . . . . . . 27
3.3.2 Mechanical cleaning methods . . . . . . . . . . . . . . . . . . 29
3.3.2.1 Sponge ball scouring . . . . . . . . . . . . . . . . . . 29
3.3.2.2 Pneumatic cleaning . . . . . . . . . . . . . . . . . . . 29
3.3.2.3 Ultrasonic cleaning . . . . . . . . . . . . . . . . . . . 30
3.3.3 Electrical cleaning methods . . . . . . . . . . . . . . . . . . . 33
3.4 Chemical cleaning . . . . . . . . . . . . . . . . . . . . . . . . . . . . . 35
3.4.1 Cleaning agents . . . . . . . . . . . . . . . . . . . . . . . . . . 36
3.4.2 Physical and chemical cleaning combined . . . . . . . . . . . . 41
3.5 Evaluation of Cleaning Efficiency . . . . . . . . . . . . . . . . . . . . 42
3.5.1 Evaluation by flux measurement . . . . . . . . . . . . . . . . . 42
3.5.2 Membrane autopsy . . . . . . . . . . . . . . . . . . . . . . . . 43
3.6 Cleaning Process and Operating Parameters . . . . . . . . . . . . . . 46
3.6.1 Common practice . . . . . . . . . . . . . . . . . . . . . . . . . 46
3.6.2 Cleaning steps . . . . . . . . . . . . . . . . . . . . . . . . . . . 46
3.6.3 Cleaning frequency . . . . . . . . . . . . . . . . . . . . . . . . 47
3.6.4 Cleaning duration . . . . . . . . . . . . . . . . . . . . . . . . . 48
3.6.5 Chemical concentration . . . . . . . . . . . . . . . . . . . . . . 48
3.6.6 Physical conditions . . . . . . . . . . . . . . . . . . . . . . . . 49
3.6.7 Optimisation . . . . . . . . . . . . . . . . . . . . . . . . . . . 50
3.7 Membrane disintegration . . . . . . . . . . . . . . . . . . . . . . . . . 51
3.7.1 Membrane properties . . . . . . . . . . . . . . . . . . . . . . . 51
3.7.2 Chemical degradation . . . . . . . . . . . . . . . . . . . . . . . 53
3.8 Conclusions . . . . . . . . . . . . . . . . . . . . . . . . . . . . . . . . 55
ii

4 Theoretical Developments of Combined Fouling Model 57
4.1 Introduction . . . . . . . . . . . . . . . . . . . . . . . . . . . . . . . . 57
4.2 Complex Membrane Fouling . . . . . . . . . . . . . . . . . . . . . . . 57
4.2.1 Consecutive Fouling Mechanisms . . . . . . . . . . . . . . . . 58
4.2.2 Concurrent Fouling Mechanisms . . . . . . . . . . . . . . . . . 59
4.3 Fouling Dynamics at Pore Scale . . . . . . . . . . . . . . . . . . . . . 60
4.3.1 Model A: Sequential Pore Blocking and Cake Filtration . . . . 63
4.3.2 Model B: Sequential Pore Constriction, Blocking and Cake Fil-
tration . . . . . . . . . . . . . . . . . . . . . . . . . . . . . . . 64
4.4 Probability of Switch Time . . . . . . . . . . . . . . . . . . . . . . . . 66
4.5 Consecutive Models of Multiple Blocking Mechanisms . . . . . . . . . 68
4.6 Conclusions . . . . . . . . . . . . . . . . . . . . . . . . . . . . . . . . 69
5 Investigation of Dilute Macromolecular Fouling in UF 71
5.1 Introduction . . . . . . . . . . . . . . . . . . . . . . . . . . . . . . . . 71
5.1.1 Chapter Outline . . . . . . . . . . . . . . . . . . . . . . . . . . 71
5.2 Materials and Methods . . . . . . . . . . . . . . . . . . . . . . . . . . 72
5.2.1 Macromolecular Samples . . . . . . . . . . . . . . . . . . . . . 72
5.2.2 Filtration Setup and Protocol . . . . . . . . . . . . . . . . . . 74
5.2.3 Bulk Concentration Measurement . . . . . . . . . . . . . . . . 77
5.2.4 Model Numerical Scheme . . . . . . . . . . . . . . . . . . . . . 77
5.3 Results and Discussion . . . . . . . . . . . . . . . . . . . . . . . . . . 78
5.3.1 Molecular Size Distribution of HA . . . . . . . . . . . . . . . . 78
5.3.2 Bulk Concentration during Filtration . . . . . . . . . . . . . . 79
5.3.3 Effect of Bulk Concentration on Fouling . . . . . . . . . . . . 80
5.3.3.1 Case for Dextran Blue . . . . . . . . . . . . . . . . . 81
5.3.3.2 Case for PEO . . . . . . . . . . . . . . . . . . . . . . 85
5.3.3.3 Case for Humic Acid . . . . . . . . . . . . . . . . . . 87
5.3.3.4 Effect of Bulk Concentration on the Blocking Time . 91
5.3.3.5 Sensitivity Analysis of Fouling Parameters . . . . . . 95
5.3.4 Effect of TMP . . . . . . . . . . . . . . . . . . . . . . . . . . . 97
5.3.4.1 Experimental and Model Results . . . . . . . . . . . 97
5.3.4.2 Comparison of Model Parameters . . . . . . . . . . . 99
5.3.5 Fouling Mode Determination . . . . . . . . . . . . . . . . . . . 104
5.3.5.1 Integral Method . . . . . . . . . . . . . . . . . . . . 104
5.3.5.2 Differential Method . . . . . . . . . . . . . . . . . . . 108
iii

5.4 Summary and Remarks . . . . . . . . . . . . . . . . . . . . . . . . . . 115
5.4.1 Model Applicability . . . . . . . . . . . . . . . . . . . . . . . . 115
5.4.2 Filtration Parameters . . . . . . . . . . . . . . . . . . . . . . . 116
5.4.3 Evolution of Fouling Mechanisms . . . . . . . . . . . . . . . . 116
6 Examination of Macromolecular Deformation in UF and Its Impact
on Fouling 118
6.1 Introduction . . . . . . . . . . . . . . . . . . . . . . . . . . . . . . . . 118
6.2 Review on UF of Deformable Macromolecules . . . . . . . . . . . . . 119
6.3 Experimental Observations on Sieving and Fouling . . . . . . . . . . 121
6.3.1 Macromolecular and Pore Size Estimations . . . . . . . . . . . 121
6.3.2 Effect of TMP on Sieving Coefficient . . . . . . . . . . . . . . 123
6.3.2.1 Temporal Variation of Sieving Coefficient . . . . . . 123
6.3.2.2 Permeate Flux vs Sieving Coefficient . . . . . . . . . 127
6.3.3 Fouling Reversibility and Macromolecular Deformability . . . 130
6.4 Impact of Macromolecular Deformation on Fouling . . . . . . . . . . 132
6.5 Conclusions . . . . . . . . . . . . . . . . . . . . . . . . . . . . . . . . 134
7 Mesoscale Simulation of Pore Blocking 136
7.1 Introduction . . . . . . . . . . . . . . . . . . . . . . . . . . . . . . . . 136
7.1.1 The Physical Scale . . . . . . . . . . . . . . . . . . . . . . . . 136
7.1.2 Introduction of the DPD method . . . . . . . . . . . . . . . . 138
7.2 Model and Methods . . . . . . . . . . . . . . . . . . . . . . . . . . . . 139
7.2.1 Outline of the DPD Method . . . . . . . . . . . . . . . . . . . 140
7.2.1.1 Pairwise Interactions and Thermostat . . . . . . . . 140
7.2.1.2 External Forces . . . . . . . . . . . . . . . . . . . . . 143
7.2.1.3 Integration Algorithm . . . . . . . . . . . . . . . . . 143
7.2.1.4 Units in DPD . . . . . . . . . . . . . . . . . . . . . . 144
7.2.2 Model Configuration . . . . . . . . . . . . . . . . . . . . . . . 145
7.2.2.1 System Geometry . . . . . . . . . . . . . . . . . . . . 145
7.2.2.2 Fluid and Flow . . . . . . . . . . . . . . . . . . . . . 146
7.2.2.3 Macromolecules in DPD . . . . . . . . . . . . . . . . 148
7.2.2.4 Choice of Paramters . . . . . . . . . . . . . . . . . . 150
7.3 Results and Discussion . . . . . . . . . . . . . . . . . . . . . . . . . . 151
7.3.1 Pore Flow . . . . . . . . . . . . . . . . . . . . . . . . . . . . . 151
7.3.2 Macromolecular Pore Blocking . . . . . . . . . . . . . . . . . . 153
7.3.3 Mapping Simulated Results to Physical Scales . . . . . . . . . 159
iv

7.4 Conclusions . . . . . . . . . . . . . . . . . . . . . . . . . . . . . . . . 159
8 Concluding Remarks and Future Work 161
8.1 Concluding Remarks . . . . . . . . . . . . . . . . . . . . . . . . . . . 161
8.2 Future Work . . . . . . . . . . . . . . . . . . . . . . . . . . . . . . . . 164
Nomenclature 164
Bibliography 169
v

List of Figures
2.1 Schematic of typical pore size ranges for different types of pressure-
driven membrane filtration processes compared with the relative size
ranges of different solutes removed by each class of membrane (modified
after [1]). Note: reverse osmosis membranes are so dense that discrete
pores do not exist; instead, they can be viewed as a matrix through
which molecules diffuse. . . . . . . . . . . . . . . . . . . . . . . . . . 6
2.2 An example of the complex nature of NOM found in the Neversink
Reservoir, New York, characterised by Wershaw et al. [2]. The legend
“others” includes coarse particulates and solvent extractable organics. 13
2.3 Fouling mechanisms of porous membranes: (a) complete blocking; (b)
standard blocking; (c) intermediate blocking; and (d) cake formation. 17
3.1 Example of a backwashing regime for the crossflow module: (a) Normal
filtration; (b) Forward flow backwashing; and (c) Reverse flow back-
washing. During backwashing, the permeate port is closed. The blue
solid line stands for the feed pressure across the membrane module and
the red dashed line for the permeate pressure. Modified after [3]. . . 28
3.2 The mechanisms of chain scission in PES membrane after prolonged
exposure to hypochlorite (a) proposed in Refs. [4–6], and (b) in Ref [7]. 54
4.1 Schematic of concepts of multiple-stage fouling behaviour. . . . . . . 58
4.2 Schematic diagram for a case of simultaneous pore blocking and cake
formation. . . . . . . . . . . . . . . . . . . . . . . . . . . . . . . . . . 60
vi

4.3 Schematic of the local normalised permeability function in a single
pore for model A (pA, eqn 4.13) and model B (pB, eqn 4.15), respec-
tively. The time τ is the ‘switch’ time when the pore becomes partially
blocked. Model A refers to the sequential pore blocking and cake filtra-
tion model and model B to the sequential internal and external fouling.
. . . . . . . . . . . . . . . . . . . . . . . . . . . . . . . . . . . . . . . 65
4.4 Schematic of the cumulative (eqn 4.16) and (eqn 4.18) density distri-
bution functions of switch time τ . . . . . . . . . . . . . . . . . . . . . 67
5.1 Set-up of constant-pressure ultrafiltration . . . . . . . . . . . . . . . . 74
5.2 Filtration protocol: (a) compaction; (b) stable DI water permeability
test; (c) model feed filtration; (d) repressurising with DI water; (e) DI
water backwashing; (f) water permeability test . . . . . . . . . . . . . 76
5.3 Apparent molecular weight distribution for commercial humic acids
samples (Sigma-Aldrich) against various MWCO. Each bar represents
the fraction of HA retained by the membrane to its right with smaller
MWCO but passing the membrane to its left with larger MWCO. Black
filled bars represent the fractional distribution calculated from HA re-
jection by the whole series of membranes and the grey filled bars rep-
resent the distribution calculated after removing the fraction rejected
by the 0.22 µm Isopore filter. The error bars represent the standard
deviation over three trials. . . . . . . . . . . . . . . . . . . . . . . . . 78
5.4 Bulk concentration in the house-made filtration cell during UF trials
with three different feed types (HUM - humic acid; DEX - dextran
blue; PEO - polyethylene oxide), as a function of the accumulated per-
meate volume. The three individual experiments were kept at same
conditions (100 kPa TMP, 50 mg/L feed solution, 100 kDa RC mem-
brane and no-stirring). The bottom x-axis is the permeate volume
through the current cell (4.9 cm2 membrane area) while the top x-
axis is the equivalent permeate volume corresponding to the Millipore
8050 cell (13.4 cm2 membrane area) by assuming the permeate volume
per unit membrane area is same in the two cells. Bulk concentration
was sampled at the middle height of the retentate side of the cell and
normalised by the feed solution concentration. . . . . . . . . . . . . 79
vii

5.5 UF of Blue Dextran (MW = 2000 kDa) solutions at different concen-
trations by RC membranes (MWCO = 100 kDa) under 100 kPa TMP.
Plots of variables as functions of filtration time: (a) Top plate: nor-
malised flux (Jn); (b) Middle plate: accumulated permeate volume
(V ); (c) Bottom plate: total resistance (Rt). Solid curves are model
calculations using eqn 4.22 with parameters determined by best-fitting
to the J − t data. . . . . . . . . . . . . . . . . . . . . . . . . . . . . . 82
5.6 UF of PEO (MW = 100 kDa) solutions at different bulk concentra-
tions through RC membranes (MWCO = 100 kDa) under 100 kPa
TMP. Plots of variables as functions of filtration time: (a) Top plate:
normalised flux (Jn); (b) Middle plate: accumulated permeate volume
(V); (c) Bottom plate: total resistance (Rt). Solid curves are model
calculations using eqn 4.22 with parameters determined by best-fitting
to the J − t data. . . . . . . . . . . . . . . . . . . . . . . . . . . . . . 86
5.7 UF of prefiltered HA (MW distribution shown in Fig. 5.3) solutions at
different bulk concentrations filtered by fresh RC membranes (MWCO
= 100 kDa) under 100 kPa TMP. Plots of variables as functions of
filtration time: (a) Top plate: normalised flux (Jn); (b) Middle plate:
accumulated permeate volume (V ); (c) Bottom plate: total resistance
(Rt). Solid curves are model calculations using eqn 4.23 with 4 param-
eters determined by best-fitting to the corresponding J − t data. . . . 89
5.8 Filtration variables as functions of filtration time (a) top: normalised
flux; (b) middle: accumulated permeate volume; (c) bottom: total
resistance, showing trials of DB, PEO and HA solutions at 50 and 100
mg/L, respectively. . . . . . . . . . . . . . . . . . . . . . . . . . . . 90
5.9 The effect of the bulk concentration on the probability density function
(eqn 4.18) of the blocking time τ using the mean value of σ for DB in
Table 5.2. . . . . . . . . . . . . . . . . . . . . . . . . . . . . . . . . . 92
5.10 The effect of the bulk concentration on the accumulated distribution
function (eqn 4.16) of the mechanisms-switching time τ using the mean
value of σ for DB trials in Table 5.2. . . . . . . . . . . . . . . . . . . 92
5.11 Model calculations of total resistance Rt normalised with R0 = Rm +
Rb as a function of the blocked portion, F , using best-fit parameters
obtained in Fig. 5.5 for 25 mg/L DB solution filtered through RC 100
kDa membrane at TMP 100 kPa. . . . . . . . . . . . . . . . . . . . . 94
viii

5.12 Local sensitivity analysis for the pore blocking coefficient, σ, in the
case of 50 mg/L DB filtration at 100 kPa. The dotted points are the
original experimental data, while the red solid line is calculated using
the optimised value determined in Table 5.2. The dash lines represent
the outputs calculated at variant σ values. The numbers next to these
dash lines show the scale factors of σ. . . . . . . . . . . . . . . . . . . 95
5.13 Local sensitivity analysis for specific cake resistance, α, in the case of
50 mg/L DB filtration at 100 kPa. The dotted points are the original
experimental data, while the red solid line is calculated using the op-
timised value determined in Table 5.2. The dash lines represent the
outputs calculated at variant α values. The numbers next to these
dash lines show the scale factors of α. . . . . . . . . . . . . . . . . . . 96
5.14 Local sensitivity analysis for the pore blocking coefficient, Rb, in the
case of 50 mg/L DB filtration at 100 kPa. The dotted points are the
original experimental data, while the red solid line is calculated using
the optimised value determined in Table 5.2. The dash lines represent
the outputs calculated at variant Rb values. The numbers next to these
dash lines show the scale factors of Rb. . . . . . . . . . . . . . . . . . 96
5.15 Effect of TMP on UF of 50 mg/L DB (MW = 2000 kDa) solutions
through fresh RC membranes (MWCO = 100 kDa). Plots of variables
as functions of filtration time: (a) top: normalised flux (Jn); (b) mid-
dle: accumulated permeate volume (V ); and (c) bottom plate: total
resistance (Rt). Dots are sample date acquired from their respective
experiments and solid curves are model calculates using eqn 4.22 with
3 parameters determined by best-fitting to the corresponding J−t data. 98
5.16 Effect of TMP on UF of 50 mg/L PEO (MW = 100 kDa) solutions
through fresh RC membranes (MWCO = 100 kDa). Plots of variables
as functions of filtration time: (a) top: normalised flux (Jn); (b) mid-
dle: accumulated permeate volume (V ); and (c) bottom plate: total
resistance (Rt). Dots are sample date acquired from their respective
experiments and solid curves are model calculates using eqn 4.22 with
3 parameters determined by best-fitting to the corresponding J−t data. 100
ix

5.17 Effect of TMP on UF of 50 mg/L prefiltered HA (approx. 60 % <=
100 kDa) solutions through fresh RC membranes (MWCO = 100 kDa).
Plots of variables as functions of filtration time: (a) top: normalised
flux (Jn); (b) middle: accumulated permeate volume (V ); and (c) bot-
tom plate: total resistance (Rt). Dots are sample date acquired from
their respective experiments and solid curves are model calculates us-
ing eqn 4.22 with 3 parameters determined by best-fitting to the cor-
responding J − t data. . . . . . . . . . . . . . . . . . . . . . . . . . . 101
5.18 The best-fit parameters determined for trials with 50 mg/L bulk con-
centration at different TMP values. Parameters were presented as a
function of TMPs: (a) top left: pore blocking rate, σ ; (b) top right:
specific cake resistance, α; (c) bottom left: the additional resistance
caused by particles blocking a pore, Rb, and (d) bottom right: pore
constriction coefficient, β, only applicable to HA trials. . . . . . . . . 102
5.19 Specific macromolecular surface layer resistance (α) as a function of
transmembrane pressure. Circle markers represent the best-fit results
from the flux decline curves of the DB trials; squares are for PEO;
triangles for HA. The solid lines are linear regression based on eqn 5.3,
respectively. . . . . . . . . . . . . . . . . . . . . . . . . . . . . . . . . 103
5.20 Plots of normalised expressions of LHS of eqn 5.4 for different fouling
constant n vs. volume of permeate per filter area; First step in the
integral analysis to determine the breakpoint for trials of 50 mg/L DB
solutions under various TMPs. . . . . . . . . . . . . . . . . . . . . . . 106
5.21 Plots of the normalised expressions of LHS of eqn 5.4, at different n val-
ues, divided by the corresponding filtration time respectively, against
the volume of permeate per filter area divided by the filtration time
using the time-volume-flux data after the switch point determined in
Fig. 5.20 (200 kPa 50 mg/L DB trial) ; The dotted points represent
the calculations from the measured data; the solid lines represent the
linear regression to the measured data. . . . . . . . . . . . . . . . . . 107
5.22 Plots of d2tdV 2 versus dt
dVfor DB trials: (a) at various Cb but same TMP
(100 kPa) from Fig. 5.5; (b) at various TMPs but same Cb (50 mg/L)
from Fig. 5.15. Dots represent experimental data. Solid curves repre-
sent model calculations. . . . . . . . . . . . . . . . . . . . . . . . . . 109
x

5.23 The change of filtration constant, n against filtration time, calculated
from the simulation using model A for DB trials: (a) at various Cb
(same 100 kPa TMP) ; (b) under various TMP (same 50 mg/L Cb). 109
5.24 Plots of d2tdV 2 versus dt
dVfor PEO trials: (a) at various Cb but same
TMP (100 kPa) from Fig. 5.6; (b) at various TMPs but same Cb (50
mg/L) from Fig. 5.16. Dots represent experimental data. Solid curves
represent model calculations. . . . . . . . . . . . . . . . . . . . . . . 110
5.25 The change of filtration constant, n against filtration time, calculated
from the simulation using model A for PEO trials: (a) at various Cb
(same 100 kPa TMP) ; (b) under various TMP (same 50 mg/L Cb). 110
5.26 Plots of d2tdV 2 versus dt
dVfor HA trials: (a) at various Cb but same TMP
(100 kPa) from Fig. 5.7; (b) at various TMPs but same Cb (50 mg/L)
from Fig. 5.17. Dots represent experimental data. Solid curves repre-
sent model calculations. . . . . . . . . . . . . . . . . . . . . . . . . . 111
5.27 The change of filtration constant, n against filtration time, calculated
from the simulation using model B for HA trials: (a) at various Cb
(same 100 kPa TMP) ; (b) under various TMP (same 50 mg/L Cb). 111
6.1 Obsersved sieving coefficient, So, as a function of the filtration time
during UF of 2000 kDa DB through the 100 kDa RC membrane at 50
mg/L feed concentration and various TMPs. . . . . . . . . . . . . . 125
6.2 Fractions of blocked pores as a function of the filtration time during
UF of 2000 kDa DB through the 100 kDa RC membrane at 50 mg/L
feed concentration and various TMPs. . . . . . . . . . . . . . . . . . 125
6.3 Obsersved sieving coefficient, So, as a function of the filtration time
during UF of 100 kDa PEO through the 100 kDa RC membrane at 50
mg/L feed concentration and various TMPs. . . . . . . . . . . . . . 126
6.4 Fractions of blocked pores as a function of the filtration time during
UF of 100 kDa PEO through the 100 kDa RC membrane at 50 mg/L
feed concentration and various TMPs. . . . . . . . . . . . . . . . . . 126
6.5 Plot of observed sieving coefficient (So) against the permeate flux (Jt)
for both DB (◦) and PEO (M) trials at the bulk concentration of 50
mg/L. Both quantities were obtained at the 2nd min of each filtration.
Data from duplicate experiments were plotted together. . . . . . . . . 128
6.6 Plot of ln(1/So − 1) against the permeate flux (Jt) for data in Fig. 6.5. 128
xi

6.7 Normalised fouling irreversibility index (nIF) determined for 50 mg/L
DB and PEO filtration trials at different TMPs and different filtration
duration. No data available for PEO trials at 30 kPa. . . . . . . . . . 131
6.8 Fouling irreversibility index (IF) determined for 50 mg/L DB and PEO
filtration trials at different TMPs and different filtration duration. . . 132
7.1 Schematics of the DPD simulation setup for the study of a linear poly-
meric chain blocking a cylindrical membrane pore. . . . . . . . . . . 147
7.2 2D vector field of the velocity in the z direction for the middle plane
of the simulation box. Poiseuile flow is achieved after equilibrium for
simulation with a body force of 0.1. . . . . . . . . . . . . . . . . . . . 152
7.3 The steady-state mean convective flux through the pore as a function
of the strength of the constant body force applied to the system. . . . 153
7.4 The root of the mean-square radius of gyration as a function of the
length of the polymer. Dotted data were obtained from simulation and
the curve stands for the theoretical values obtained from < R2g >
0.5=
(16Nr20)
0.5 for a freely jointed polymer model [8]. . . . . . . . . . . . . 154
7.5 Pore blocking probability, Pblock, at different system conditions, i.e.
pore convective flux and polymer chain length. . . . . . . . . . . . . . 156
7.6 The probability of successful translocation of the polymer chain, Ppass,
versus the average pore convective flux for various polymer chain lengths.156
xii

List of Tables
2.1 Examples of foulants, and their fouling modes in major membrane
applications involving liquid-solid separation (modified after [9]). . . . 12
2.2 Blocking models for constant pressure filtration . . . . . . . . . . . . 19
3.1 Selective lists of studies on UF chemical cleaning in recent publications 36
3.2 Common cleaning agents and possible interactions between cleaning
agents and foulants . . . . . . . . . . . . . . . . . . . . . . . . . . . . 37
3.3 Mechanical, thermal and chemical resistances of common membrane
materials of UF. Sources from [10–12]. . . . . . . . . . . . . . . . . . 52
5.1 Summary of materials used in the constant pressure UF experiments 74
5.2 The mean fouling model parameters from the best-fitting to the sets
of UF at constant pressure of 100 kPa with varying bulk concentrations. 84
5.3 Expression in terms of absolute flux J or normalised flux J/J0 after
integration of LHS of eqn 5.4 for all four fouling constant n, respectively105
xiii

Chapter 1
Introduction
1.1 Motivation and Objectives
Ultrafiltration (UF) is a type of pressure-driven, membrane-based separation technol-
ogy that has been widely used in many industries, spanning from water treatment,
wastewater reclamation, dairy making, juice concentration, medical usage, chemical
recovery, to harvesting of cells [13]. Since the 1960s when the breakthrough in manu-
facturing economical and strong membranes was made, modern UF techniques have
continuously developed. However, there is a long-lasting and severe problem still lim-
iting its potential in many processes. This problem is membrane fouling, which results
in an increase in operational costs, increased energy demand, additional labour for
maintenance, extra needs of cleaning chemicals, and a shortened membrane lifetime.
It requires effective and efficient methods for its control and minimisation. Though
much investigation on fouling has been carried out since the birth of membrane tech-
nology, understanding of it is far from being complete.
The foulant, i.e., the culprit causing membrane fouling, varies with different UF
applications. Numerous types have been identified. They can be roughly categorised
into particles, organic matters and ions. For UF, the organic matters are arguably the
most detrimental foulants and extremely difficult to deal with. For example, in water
industry, natural organic matters (NOMs), which are a mixture of many different
macromolecules such as humic acid (HA), polysaccharides and proteins, cause the
most severe and irreversible fouling. Although there is a number of literature on the
topic of membrane fouling, the study of macromolecular fouling is still an ongoing
1

area because they often exhibit complex fouling behaviours, still puzzling researchers
over the globe.
Therefore, the work presented here focuses on understanding macromolecular foul-
ing in ultrafiltration, particularly on the points listed below:
• Which types of the macromolecules are mostly interesting in terms of UF fouling
in water industry?
• What are the mechanisms involved in their fouling process?
• Is there a comprehensive theory to model the process?
• What are the overall fouling behaviours?
• What are the fouling processes at a single pore level?
• Can the understanding of pore scale mechanisms contribute to predicting the
macroscopic fouling behaviour?
1.2 Thesis Layout
The structure of this thesis is as the follows:
Chapter 1 (this chapter) contains a brief introduction to the background of the
subject, the research questions and an outline for the whole thesis.
Chapter 2 reviews the existing knowledge on membrane fouling related to macro-
molecular ultrafiltration, including the general background on filtration, different foul-
ing mechanisms and classical fouling models.
Chapter 3 contains a critical review on the issues in membrane cleaning, particu-
larly regarding cleaning macromolecular fouling.
Chapter 4 discusses the theoretical development of the combined models for two
complex fouling scenarios.
Chapter 5 presents the results from bench-scale experiments with three types of
macromolecular feeds. The appropriate fouling model is fit to the measured data and
model parameters are determined in the process. Insights of membrane fouling are
gained by analysing both the experimental data and model calculations. The effect
of filtration parameters such as bulk concentration and transmembrane pressure is
evaluated and compared between different feeds. The evolution of fouling mechanisms
is evaluated using both integral and differential methods.
2

Chapter 6 demonstrates the solute sieving and fouling irreversibility results ob-
tained in the UF experiments. Discussion on the links between these results and the
flow-induced deformation of polymers is included.
Chapter 7 shows the development of a mesoscopic model from the method of Dis-
sipative Particle Dynamics to simulate the macromolecular capture and flow-induced
deformation at the pore entrance. The simulation results are to be compared with
the sieving results obtained in Chapter 6 to elucidate the flux-dependent event of
macromolecular entrance to pores via conformational change, which fundamentally
affect the fouling mechanism.
Chapter 8 concludes the whole thesis and a few remarks on future work are pre-
sented.
3

Chapter 2
Literature Review of Membrane
Fouling in Ultrafiltration
This thesis is concerned with problems during the ultrafiltration (UF) of macromolec-
ular solutions. Therefore, the focus is constrained to the filtration of liquids. It is
worth introducing the general aspects of membrane filtration and particularly of UF
before any specific problem is presented. Hence, some background information on
membrane filtration of liquids is introduced in the first section, followed by a discus-
sion of membrane fouling, which is the long-lasting problem occurring in many UF
processes, in the next section. Finally, theoretical work on fouling is introduced.
2.1 Overview of Membrane Filtration
UF belongs to the family of pressure-driven membrane processes, which also include
microfiltration (MF), nanofiltration (NF) and reverse osmosis (RO) [14]. In these
processes, a membrane is simply a physical barrier splitting the feed stream into two
parts, i.e., a retentate and a permeate fraction; and a hydraulic pressure difference
is created between feed and permeate side as a driving force to push (ideally) pure
solvent through the membrane, leaving unwanted molecules or particles in the reten-
tate. This pressure difference is measured as transmembrane pressure (TMP). The
distinction between these processes is somewhat arbitrary, and chiefly depends on the
size of the solutes retained by the membrane, which ranges from suspended particles
in MF to small molecules and ions in RO, as shown in Fig. 2.1 [15].
4

The differences between the four membrane processes are also manifested in their
membrane structures as well as the solute retention mechanisms. UF and MF are
basically similar. Their membranes have distinct pores, and the separation is largely
due to the physical sieving effect as a result of the relative sizes of the solute/particles
and the membrane pores. MF membranes have the largest pores and deal with
suspensions containing particles and colloids in the range of 0.1 µm to 10 µm, such
as microbial cells, while UF membranes, having smaller pores (1 nm to 100 nm), are
mostly used for concentration and purification of macromolecules, such as protein
[3]. UF requires greater TMP than MF, as a result of its smaller pore sizes. The
higher pressure demand also comes partly from the osmotic pressure of the solution
adjacent to the membrane, which creates an osmotic ‘back pressure’ that opposes
the applied pressure [16]. RO membranes are very dense and do not have distinctive
pores. Solute retention is not a result of sieving but of charge effects [16]. Through the
matrix of an RO membrane, solvent and solutes diffuse at different rates to manifest
the semi-permeability. As a result, RO has a low permeability and consequently,
requires high TMP. NF occupies the transition zone between UF and RO and may be
porous or non-porous depending on the material [17]. NF is usually used to remove
multivalent ions and small organic compounds. Its solute-retention mechanism is
complex, involving both size exclusion and charge effects [18].
Different processes involve different aspects. It is out of the scope of this thesis
to cover the whole range of membrane processes. Since our interest is in UF, in the
remaining chapter and throughout the thesis, unless specified, the present topics are
tailored for UF.
Regarding the general operation in pressure-driven membrane processes, some
terminologies are worth mentioning. The feed flows can occur normal (perpendicular)
or parallel (tangential) to the membrane. The former configuration is termed dead-
end and the latter is termed crossflow. The dead-end configuration is simple to
implement, but it is a batch process by nature. As the retained material continues
to accumulate on the membrane surface, the permeate flux eventually becomes lower
than the acceptable value, at which point the process needs to stop for cleaning and
restoration. However, it can be incorporated into a continuous process with certain
mechanisms to limit material accumulation [16]. In crossflow, the tangential flow
has a sweeping effect and re-entrains the polarised and deposited particles from the
surface of a membrane by wall shear stresses [19]. In principle, a crossflow process
can reach a steady state.
5

10−4
10−3
10−2
10−1
100
101
102
Physical Size (µm)
Fibrous Media
Membrane
NF
UF MFRO
Ions Proteins Virus Bacteria Pollens
Figure 2.1: Schematic of typical pore size ranges for different types of pressure-driven membrane filtration processes compared with the relative size ranges of differentsolutes removed by each class of membrane (modified after [1]). Note: reverse osmosismembranes are so dense that discrete pores do not exist; instead, they can be viewedas a matrix through which molecules diffuse.
Membranes are usually installed in modules for practical use. The common designs
in industries include flat sheet, spiral wound, tubular and hollow fibre [3]. In small
scale operations and laboratory work, stirred cell apparatuses are frequently used
[16]. A flat sheet membrane is placed in a pressurised container (the cell) and filled
with feed solution. A magnetic impeller is placed just above the membrane and can
be externally controlled by a magnetic stirrer to limit the concentration polarisation
effect. The cell can be directly connected to the pressure source or to a fluid reservoir.
Currently, the majority of commercially available membranes are made from ther-
malplastic polymers, including cellulose acetate (CA), polysulfone (PS), polyethersul-
fone (PES), polyacrylonitrile (PAN), or polyvinyldifluoride (PVDF) [6]. During the
last two decades, ceramic membranes have emerged as a major advance in UF tech-
nology [11] due to their robuster mechanical strength, higher temperature tolerance,
and better chemical stability. However, they are currently more expensive, heavier,
and thicker than polymeric membranes and require higher TMPs because they have
greater resistance to water transport [11, 20].
Membranes have different morphologies. MF membranes are typically symmetric,
with a sponge-like structure, which means that the pore size and porosity are the
6

same throughout the depth of the membrane. On the contrary, UF membranes are
typically asymmetric, i.e., they have a thin layer of well-defined molecular weight
cut-off (MWCO), supported by a thicker and highly porous layer. It is important to
note that this asymmetry arises inherently from the membrane synthesis process. The
permeation and sieving are mostly determined by the membrane skin layer, while the
less-dense part of the membrane has little resistance to filtration flow and functions
as a supporting layer to give the membrane mechanical strength [16].
2.2 Membrane Fouling in Ultrafiltration
2.2.1 Nature of Flux Decline
Under constant TMP operation, the permeate flux of a filtration process declines
over time due to two important effects [9]. Firstly, concentration polarisation, which
is a natural consequence of the semi-permeability and selectivity of a membrane,
results in an accumulation of rejected solutes or particles in a mass transfer boundary
layer (polarisation layer) adjacent to the membrane surface [9, 15, 21, 22]. In UF,
this is particularly problematic during filtration of low molecular-weight solutes or
macromolecules [15]. When these solutes are carried towards the membrane surface by
the permeation flow, solvent molecules pass through the membrane but large solutes
may be partially or even completely rejected by the membrane. For those being
rejected, they are retained and concentrated over time at the upstream membrane
surface, forming a concentration gradient from the membrane surface where the solute
concentration is at its highest to the bulk solution where it is at its lowest [16, 23]. The
concentration gradient causes back-transport (e.g. by diffusion) of solutes from the
polarisation layer to the bulk. In fact, the concentration of those near the membrane
surface can reach 20-50 times that in the bulk solution [3]. The accumulation of such
a high amount of solute molecules at the membrane surface impedes the solvent flow
through the membrane [9].
Concentration polarisation is an inevitable but reversible phenomenon that does
not itself affect the intrinsic properties of a membrane [15]. The flux loss can be
fully recovered by switching the feed to a pure-solvent stream. However, the resulting
highly localised high concentration of the solutes may lead to macromolecular precip-
itation, which is relevant to the other flux-decline mechanism, i.e., the phenomenon
of membrane fouling [3].
7

Membrane fouling, by definition, happens when the material in the feed solution
leaves the liquid phase to form a deposit on either the surface (i.e., external fouling)
of a membrane or inside its porous structure (i.e., internal fouling) [24]. In contrast to
the reversible nature of concentration polarisation, fouling may cause irreversible loss
of the permeability of a membrane. In fact, reversibility is a defining characteristic of
fouling. Many studies distinguished reversible and irreversible fouling based on their
relative resistance to cleaning [25, 26]. Reversible fouling can be removed easily with
certain cleaning methods, while irreversible fouling still remains after the cleaning.
The part of fouling that cannot be cleaned by hydraulic means is termed as hydrauli-
cally irreversible fouling. Similarly, the one left over after chemical cleaning is named
chemically irreversible fouling. In general, membrane fouling is a more complicated
phenomenon. It manifests in various forms during different UF processes.
2.2.2 Forms of fouling
By recognising the complex nature of fouling, the categorisation of fouling mechanisms
is not universally same in literature. Following the more recent practice in Field [9],
membrane fouling has generally four forms according to the nature of the solutes.
2.2.2.1 Adsorption
Adsorption occurs whenever specific interactions between solutes and the membrane
surface exist. It is a consequence of surface energy, and a process of thermodynamic
equilibrium. The interactions are of generally three types including weak van der
Waals forces, electrostatic attraction, and chemical bonding, depending on the func-
tional groups involved. A monolayer of solutes can adsorb on the surface of a mem-
brane, even in the absence of a permeation flux. It occurs spontaneously and almost
instantaneously. This is a common problem which occurs when separating macro-
molecules such as protein and humic acid (HA), and is often irreversible [15, 27].
The strong affinity of these species towards the membrane surface originates in the
heterogeneity of their molecular constituents. Their molecules contain various func-
tional groups, some of which (e.g., hydrophobic acids) make them partially lipophilic.
This allows these macromolecules to participate in different surface interactions, in-
volving electrostatic, hydrophobic, or van der Waals forces. Membranes fouled by
such molecules cannot be completely restored without chemical cleaning, because
desorption is thermodynamically unfavourable.
8

The adsorbed material on the membrane can alter its surface characteristics, such
as hydrophobicity or charge [18]. For example, the adsorption of negatively charged
HA was found to increase the negativity of the streaming potential of a membrane [28].
As the pore-sizes of UF membranes are comparable to that of many macromolecules,
internal fouling caused by in-pore adsorption can contribute largely to the overall flux
drop.
The thermodynamic nature of adsorption distinguishes it from other forms of de-
position which result from body forces (e.g., hydrodynamic forces) exerted on the
solutes, because the other fouling forms (discussed below) do not reach thermody-
namical equilibrium [29]. Note also that a deposit of multilayers is usually not as
strongly bound to the membrane as an adsorbed monolayer [24].
2.2.2.2 Pore Blocking
Pore blockage occurs when particles fully or partially seal the membrane pores [30, 31].
It usually happens rapidly in the initial stages of filtration, at which the membrane
surface is free of deposits and the incoming particles can interact directly with a
membrane pore.
2.2.2.3 Deposition
Particles, due to deposition, build up layer by layer on the external surface of a mem-
brane, leading to dynamic foulant layers (secondary membrane) with an additional
resistance to the permeate flow. This is often referred to as cake formation, and
the extra resistance is called a cake resistance. A fouling layer or cake can consist
of different types of solutes, including chemically inert colloids or active ones. The
formation of an initial cake layer of inert colloids near the membrane surface prevents
a direct contact between further foulants and the membrane surface, even if the later
foulants can potentially bind to the membrane surface. Hence, the inert cake layer
acts as a pre-filter or ‘filter-aid ’, which screens out those materials with a high foul-
ing potential [32, 33]. On the other hand, active foulants may reach the membrane
surface first and bridge inert deposits to it [34, 35]. This forms a more adhesive cake,
and hence fouling becomes more irreversible. Sometimes, ‘over-clogging ’ may take
place when small macromolecules enter and fill the interstices of a cake formed by
large particles, leading to a greater hydraulic resistance [33, 36]. The morphology of
the fouling cake dictates the flux decline, while the interaction between the cake layer
and the membrane surface determines the fouling reversibility [35].
9

2.2.2.4 Gel Formation
For certain macromolecules, they form gel layers in the immediate vicinity of the
membrane surface where the concentration of the molecules reaches its solubility
limits due to concentration polarisation [3, 9, 18, 37]. The transition between con-
centration polarisation and gel formation occurs when the attractive forces become
greater than the repulsive electrostatic forces between molecules in the layer [38]. The
flux at which the gelation occurs marks the ‘limiting flux’ representing the maximum
stationary permeation flux that the system can reach [21]. The term “gel formation”
is conventionally used to describe this process of macromolecular gelation under high
solute concentration.
It is necessary to clearly note the distinction between gel formation and cake for-
mation although both form layers of foulants on the membrane surface. Cake forma-
tion is a non-specific process of particulate deposition, while gel formation specifically
represents the gelation of macromolecules as a consequence of concentration polari-
sation. The fouling cake is bound to the membrane surface via particle-membrane
interactions. The macromolecular gel layer is formed in the solution immediately
above the membrane surface, which is like a blanket covering the surface. Gel layer is
largely reversible due to the low interaction with the membrane surface. In some liter-
ature such as Jermann et al. [39], however, the term “gel formation” has been loosely
used to describe general macromolecular deposits. In this context, gel formation
strictly refers to macromolecular gelation process due to concentration polarisation.
For other macromolecular depositions, they are classified as a process of general de-
position (section 2.2.2.3).
In practice, typically, during filtration with complex or mixed feeds, fouling involves
more than one mechanism working simultaneously. The relative importance of dif-
ferent fouling mechanisms will depend on the operating condition, the feed stream
quality, and the membrane property [15].
2.2.3 Foulants
Foulants, the trouble-causing substances commonly found in UF, are roughly divided
into four categories: particulates, macromolecules, ions, and biological substances
[40]. For example, Ahn et al. [41] have analysed the composition of the fouling layers
when lake water (Lake Michigan and Lake Decatur, USA) was ultrafiltered. Their
10

results showed that NOM, calcium and magnesium ions, and silicon of clay miner-
als were the main components in the fouling cake. A detailed category of common
foulants is listed in Table 2.1.
2.2.3.1 Particulates
Particulates range from 1 nm to 1 µm in size and have a relatively rigid shape [19].
Depending on the ratio of the size of the particle to the size of the membrane pore,
particles may completely seal, partially block or internally constrict pores [42]. Over
the length of a filtration process, a particular cake layer usually dominates after
pores have been blocked. Colloidal characteristics (surface charge, roughness, size,
hydrophobicity, and stability) will determine the inter-particle interactions and hence
the properties of the fouling cake.
2.2.3.2 Macromolecules
Macromolecular foulants range in molecular weight (MW) from around a few thou-
sand to above one million daltons [43]. Macromolecular fouling is characterised by the
functional groups in the molecules, since they contribute to the specific interactions
with the membrane surface.
Protein fouling presents a major concern in the therapeutic and food industries
[24, 44]. Native (non-aggregated) proteins are typically tens of nanometers in size,
and have complex molecular structures with multiple charge points; the overall net
charge depends on the solution pH, while the size is affected by the ionic strength
and intermolecular interactions [44, 45]. Protein molecules are inherently unstable
and subject to denaturation by heating, solvents or shearing. Protein rapidly and
strongly adsorbs onto a clean membrane surface. The resultant fouling is largely
irreversible and extremely complicated [44]; chemical cleaning is thus inevitable in
most industrial applications [24].
Natural organic matter (NOM) is considered to be the major foulant type in water
treatment processes. According to its origin and genesis, NOM can be categorised
as: (i) allochthonous organic matter originated as flora debris from terrestrial sources;
(ii) autochthonous organic matter, consisting of extracellular and intracellular macro-
molecules and cellular debris; and (iii) wastewater effluent organic matter (EfOM),
composed of background NOM plus soluble microbial products (SMPs) derived from
biological wastewater treatment units [40]. Complex chemistry is involved, as NOM
consists of a heterogeneous mixture of macromolecules with a wide range in size,
11

Table 2.1: Examples of foulants, and their fouling modes in major membrane appli-cations involving liquid-solid separation (modified after [9]).
Foulants Fouling modes
Large suspended particles Particles present in the original feed or developed due toaggregation can form a cake layer and/or block modulechannels.
Small colloidal particles Colloids present in the recovery of cells from fermenta-tion broth can form a dense cake layer. They can alsoblock the entrance of a membrane pore or clog inside ofit.
Inert macromolecules Gel or cake formation on membrane surface.
Adsorptive macromolecules Proteins and HAs are known for their adsorption to sur-faces of membranes or in the pores.
Small molecules Some small organic molecules tend to have strong in-teractions with some polymeric membranes (e.g.. anti-foaming agents, such as polypropylene glycols used dur-ing fermentation, adhere strongly to certain polymericmembranes).
Biological substances The growth of biologically active organisms such asbacteria and their excreted material (e.g. EPS) formsbiofilms on membrane surfaces.
Cations Precipitation of salts and hydroxides leads to scaling.Certain cations such as Ca +
2 can facilitate macromolec-ular fouling.
12

functional groups and sub-structures. The majority are humic substances (HSs), rep-
resenting up to 80 % of the total organic carbon in the water [46, 47]. HSs can be
divided into three fractions according to their solubility in acidic solutions: humin
(defined as insoluble), humic acid (HA, insoluble at pH < 2), and fulvic acid (FA, sol-
uble at any pH, less molecular weight than HA) [48–50]. The other fractions of NOM
include polysaccharides, carbohydrates, amino acids and proteins etc. [51–53]. Using
robust fractionation methods and characterisation tools, Wershaw et al. [2] divided
the fractions of NOM samples from a natural reservoir into nine categories, as shown
in Fig. 2.2, and quantified each of them. However, the quantitative amount and the
Figure 2.2: An example of the complex nature of NOM found in the Neversink Reser-voir, New York, characterised by Wershaw et al. [2]. The legend “others” includescoarse particulates and solvent extractable organics.
relative percentage of each fraction is case-specific [49]. Results of experiments and
studies on NOM taken from different sources showed a disagreement on the role of
each NOM fraction in the rate and extent of membrane fouling. For hydrophobic
membranes, some found that the hydrophilic neutral parts had a primary role in
promoting fouling [54], while others found that hydrophobic portions had a higher
potential to foul the membranes [27, 48, 55].
13

2.2.3.3 Ions
Although scaling is a more significant problem in NF and RO, metal ions may form
scaling precipitates on UF membranes under certain extreme conditions. Calcium
salt precipitation can appear in cheese/whey processing. Hanemaaijer et al. [56]
found that the UF of pure whey salts produced considerable amounts of calcium
phosphate throughout the porous structure of the membranes. This precipitation
is less significant in the presence of whey proteins [29]. Coagulation agents, e.g.,
Fe(OH)3, added from pretreament before UF, may form a slimy brown fouling layer
[57]. However, cations in most UF processes are more of a concern regarding their
role in fouling facilitation than foulants themselves. Divalent cations can bridge the
negatively charged NOM molecules with the negatively charged membrane surface,
while monovalent cations contribute to the increased ionic strength which screens out
the electrostatic repulsion forces between colloids or between solutes and membrane,
causing colloidal aggregation or solute adsorption [58].
2.2.3.4 Biological Substances
Biologically active organisms cause membrane biofouling, as they adhere to the mem-
brane and grow to form biofilms. Biofouling is a major concern in membrane biore-
actors (MBRs) [59]. The process starts with the formation of a conditioning film
on the membrane surface by adsorption of both macromolecules originally existing
in the feeds (such as proteins, HAs, and polysaccharides) and extracelluar polymeric
substances (EPS) secreted from the microorganisms. The gel-like film provides an im-
mediate additional resistance to permeate flow. After conditioning, the attachment
of microorganisms onto the membrane surface occurs as patchy deposition. The con-
vective flows and concentration gradients in the filtration system bring organics and
nutrients in the feed to the membrane surface. The colonisers flourish on these and
grow to form a confluent biofilm [60]. These biofilms can be heterogeneous, housing
different species of microorganisms, and stratified, having different layers with aerobic
populations at the top and anaerobic populations underneath [18].
2.2.3.5 Mixtures
In many situations such as NOM filtration or biofouling, it is difficult to single out
an individual mechanism due to the complexity of the feeds. Sometimes, synergistic
effects can occur [43]. For instance, HAs were found to bridge between alginate gel
14

and membrane polymers, leading to a more irreversible fouling layer [39]. HAs in the
feeds may also alter the state of a colloidal particle by compressing the electrostatic
double layer and facilitating colloidal aggregation [61–65].
2.2.4 Parameters Affecting Fouling
Several parameters can influence the fouling rate, including the nature and concen-
tration of solutes and solvents, membrane materials and surface characteristics, pore
size and its distribution, and hydrodynamics of the membrane modules [9, 19, 66, 67].
2.2.4.1 pH
The lower pH reduces the deprotonation of acidic functional groups in macromolecules
such as protein and HAs. This will reduce electrostatic repulsion between these
molecules, promoting gel formation and fouling [65, 68].
2.2.4.2 Ionic Strength
High ionic strength can compress the electrical double layer (EDL) of counter-ions,
according to the Derjaguin-Landau-Verwey-Overbeek (DLVO) theory. This nullifies
the repulsive energy barrier between molecules, which allows the van der Waals at-
traction forces to dominate [63]. This in turn causes colloidal instability and hence
intensified aggregation and greater fouling cakes. High ionic strength can also com-
press the hydrodynamic radius of a molecule such as HA, which promotes significant
diffusion of it into the pores, and this in turn results in higher pore adsorption [50].
2.2.4.3 Divalent Cations
Exacerbated membrane fouling in the presence of divalent cations (e.g., Ca2+ which is
abundant in surface water) has been frequently reported in the literature [39, 46, 51,
68]. The negative effect of Ca2+ on permeate flux may be attributed to its ability to
react with foulant molecules (e.g., NOM), as well as with membrane surfaces, leading
to the alteration of surface chemistry for either case [69]. Ca2+ can form complexes
with the deprotonated carboxylic groups in macromolecules and partially shield their
charges, particularly at a neural pH level [70]. As Ca2+ has a valence of two, it can
link two negatively charged functional groups together. If these two groups are in the
same molecule, the complexation happens intramolecularly, rendering the molecule of
15

a HA into a small and coiled conformation. Otherwise, this linkage happens between
two molecules, which leads to intermolecular bridging [41, 71]. Therefore, the gel layer
of macromolecules becomes more compact and cohesive by the cross-linking effect of
Ca2+ [39, 72].
2.2.4.4 Membrane Materials
Membranes are made from different materials and have different properties with re-
spect to surface charge, degree of hydrophobicity, chemical and thermal tolerance,
mechanical strength and flexibility etc. [1, 73]. These properties may affect foul-
ing and cleaning to some extent, while, at the same time, membrane properties are
influenced by fouling and cleaning procedures.
2.3 The ‘Blocking’ Theory of Fouling
For porous membranes, i.e. MF and UF, the pores are usually considered to be the
active part of a membrane. Hence, most theories about fouling are subject to the
processes involved in the reduction of the number of active pores. In this respect,
‘blocking’ is arguably the most frequently-appearing term used in studies about foul-
ing mechanisms in MF and UF.
2.3.1 Classical Blocking Filtration Laws
In the ‘blocking’ theory of fouling, foulant and foulant aggregates are treated as par-
ticulates. When these particles contact the surface of the membrane, they cause
closure of the effective pore areas in certain ways. Based on empirical observations,
a series of time and filtrate volume correlations for various filtration situations were
first developed by Hermans and Bredee [74], and subsequently systemised by Grace
[75]. These laws include four general fouling modes: complete blocking, interme-
diate blocking, standard blocking and cake formation (see Fig. 2.3), with the
switching between the modes depending on the ratio of the particle size to the pore
opening size. After Hermia [30] derived the theoretical model for intermediate block-
ing, which had originally been considered as purely empirical, constitutive models
for each of the four modes can now be derived from their own physics, respectively,
16

based on some common assumptions such as a homogeneous bulk solution and a
porous filter medium to which Darcy’s law;
Q =∆PA
µR(2.1)
is applicable [30], where Q is the permeation flow rate, ∆P is the pressure difference
across the porous medium, A is the surface area of the medium, µ is the solution
viscosity and R is the resistance of the porous medium.
Figure 2.3: Fouling mechanisms of porous membranes: (a) complete blocking; (b)standard blocking; (c) intermediate blocking; and (d) cake formation.
2.3.1.1 Constant Pressure Blocking
In the derivation of the blocking models for constant pressure filtration, Hermia [30]
showed that the respective models for the four fouling modes can all be conveniently
unified into a single differential equation with only two coefficients to determine,
d2t
dV 2= k(n)
(dt
dV
)n(2.2)
17

where t is the filtration time, V is the total filtered volume, k(n) is a constant deter-
mined by fitting the equation to the experimental flux decline data, and the exponent
n (called the filtration constant) characterises the filtration model, with n = 0 for
cake filtration, n = 1 for intermediate blocking, n = 3/2 for standard blocking (also
called pore constriction or filling, or internal pore blocking), and n = 2 for complete
pore blocking [31]. In eqn 2.2, dt/dV is the differential time needed to collect a unit
differential volume of filtrate.
Given that the observed (superficial) permeate flux J = 1A∗
dVdt
, eqn 2.2 can be
conveniently converted to a form in terms of filtration fluxes [76]:
− dJ
dt= k(n)J(JA∗)2−n , (2.3)
where A∗ is usually taken as the total membrane area for convenience. This depicts
explicitly the time-dependent flux profile.
Table 2.2 lists the details of the four models. The analysis and assumptions from
the derivation of Hermia [30] are described below. The complete blocking law implies
the scenario that particles have a size larger than that of the membrane pores. When
they arrive at the surface, they completely seal the entrances of the pores. It assumes
that particles settle evenly onto the pores open at that time, without superimposition
of further particles upon those already deposited. Therefore, the instant permeate
flow is proportional to the number of pores still open at the time.
The assumptions for intermediate blocking are akin to those in the complete block-
ing case, but the restriction of ‘perfect’ sealing has been loosened. Instead, particles
are allowed to superimpose on the deposits, which means that only a partial fraction
of the particles arriving at an instant will block the pores. Hence, this scenario is also
named as partial blockage.
Standard blocking, also known as pore constriction or internal fouling, happens
when particle sizes are smaller than pore sizes. Particles deposit on the pore walls
and are captured inside the filter medium. The governing equation in Table 2.2 is
derived from the equation of Hagen-Poiseuille flow, with the assumption of straight
pores that have uniform radius and constant length. Hence, the permeate flow rate
decreases at a rate proportionate to the pore volume.
Cake filtration is to model the cake formation phenomenon. This law accounts
for the increase of the resistance as the fouling cakes increases. The filter resistance
consists of membrane intrinsic resistance Rm and a time-dependent cake resistance
18

Rc. The rate of the permeate flow is proportional to the change of the filter resistance.
Table 2.2: Blocking models for constant pressure filtration
Blocking modes n Governing equations k Flow rate equations
Complete 2dA
dt= −kbA kb = J0Cbσ, [s−1] Q = Q0exp(−kbt)
Standard 3/2dr2pdt
= −ksr20Q ks =φCb
Npπr2p0δm, [m−3] Q =
Q0
(1 + ksQ0t)2
Intermediate 1dA
dt= −kiA2 ki =
J0Cbσ
A0
, [m−2 s−1] Q =Q0
1 + kiA0t
Cake filtration 0dRt
dt= αCb
∆P
µRt
kc =αCbµ
∆PA20
, [sm−6] Q =Q0√
1 + 2kcQ20t
1. Relationship with k(n) in eqn 2.2: k(2) = kb, k(3/2) = ksQ1/20 , k(1) = ki/J0, and
k(0) = kc2. Physical meaning: σ is the blocked area per unit mass of particles being filtered,[m2 kg−1]; φ is the volume of particles, deposited onto the pore wall, per unit weightof solutes being filtered, [m3 kg−1]; and, α is the specific cake resistance, [mkg−1]3. The subscript 0 means the physical quantity at its original state, e.g. Q0 is theflow rate through a fresh membrane.
As we can see from the assumed mechanisms related to each law, they are purely
physical and mostly extreme situations. The filter medium has been treated as ideal
with a perfect geometry, where pores have uniform size and distribute evenly over
the whole membrane area. The size distribution of the solutes is also assumed to be
ideally narrow. Nevertheless, due to their simplicity, these laws have been extensively
used in the analysis of the clogging behaviours of pore-flow membranes during liquid
filtration [77].
2.3.1.2 Blocking Laws for Other Operational Conditions
When the flux is kept constant, TMP increases as fouling grows. Based on a similar
analysis to the above, one can readily derive blocking equations for the constant flux
filtration. For the four blocking modes mentioned previously, there is a common
characteristic form analogous to eqn 2.2 for the time dependence of the pressure
19

necessary to maintain constant flux during operation [78];
d2t
d(∆P )2= k′
(dt
d∆P
)m′(2.4)
Alternatively, the characteristic form can be written as a function of the pressure and
the permeate volume [79]
d2∆P
dV 2= k′′
(d∆P
dV
)m′′. (2.5)
The original blocking laws (eqn 2.2) are limited to dead-end operation, because
they do not include the mechanism of particle removal induced by the cross-flow.
Field et al. [76] first incorporated removal terms into the classical blocking laws by
assuming that the permeation flux tends to have a value of J∗ in the long term.
Equation 2.3 will then have the form:
dJ
dt= −K(n)J2−n(J − J∗) (2.6)
The coefficient K(n) equals (A∗)2−nk(n), where k(n) is the coefficient used in eqn 2.2.
The value of J∗ can be considered as the ‘steady-state’ flux, since crossflow filtration
tends to a pseudo-steady state in the long run. The new equation is valid for all n
values except for n = 3/2, i.e. the pore constriction, because this form of fouling
is not affected by the back-diffusion induced by the crossflow shear forces [76]. The
standard blocking law will be the same in both dead-end and crossflow operations.
Blocking laws can also be extended to non-newtonian fluids, for example, in the
case of a power-law model where the viscosity is proportional to some power of the
shear rate γ;
η = MγN−1 , (2.7)
with the two correlational parameters, M and N , depending on a particular power-law
fluid. Thus, the flow velocity through a cylindrical pore is obtained as [30]:
v =N
3N + 1
(∆P
2LM
)1/N
r(N+1)/N . (2.8)
where L and r are the length and radius of the pore, respectively. Hermia [30] showed
20

that the two parameters, k and n in eqn 2.2 could accommodate power-law rheological
model in an elaborate way according to each fouling mode, except in the intermediate
blocking case.
2.3.2 Combined Blocking Models
The four classical blocking models are extreme cases of fouling, and are overly ideal-
istic as judged by today’s knowledge [80]. In practice, membrane fouling is far more
complicated, especially with complex feeds. The underlying physics are difficult to
identify. It is usually too ambiguous to determine a classic blocking mode for many
real cases by simply plotting a t − V graph and fitting any classic mode of blocking
to it.
Many studies have shown that the flux decline in membrane filtration consists
of multiple steps: for example, pore blockage and/or pore constriction at the initial
stage, followed by cake filtration in the long term [77]. In fact, complete and inter-
mediate blocking laws are both frequently present during the initial stages of cake
filtration [77]. Bowen et al. [81] showed that the value of the filtration constant n
in eqn 2.2 varied with the progress of filtration during MF of BSA solution. Similar
trend in particulate microfiltration was observed in a study by Hwang et al. [82].
In spite of the complex nature of most fouling, the concept in the derivation of
the classic blocking laws is still useful in formulating more advanced fouling models.
Recently, there has been a trend towards combining various fouling laws to construct
more comprehensive models, to account for the complex nature of fouling with which
multiple processes may develop either simultaneously or sequentially during filtration.
The first such example is the work conducted by Ho and Zydney [83]. They assumed
that during MF of protein solution, the filter got blocked by protein aggregates first,
and until a certain time when sufficient pore areas were blocked, further deposits
built on the blocked pores to form cakes gradually. Hence, based on classical blocking
analysis, they combined complete blocking and cake filtration models consecutively
to describe the two-step fouling processes . Their results, by comparing with the
experimental data, confirmed a nice transition from one mechanism to the other on
a double logarithmic plot of d2t/dV 2 versus dt/dV [83]. Thereafter, Taniguchi et al.
[84] successfully applied this model to NOM fouling in UF.
Different fouling modes may also occur simultaneously. For example, fouling may
develop inside pore structures and on the surface of membranes at the same time.
This increases the complexity of the system to an even greater extent. However,
21

classical blocking laws come in handy in this case as well. Bolton et al. [85] derived
several formulas resulting from two concurrent mechanisms of classical laws. Their
scheme originated from Darcy’s law (eqn 2.1), in which different variables may vary
according to respective mechanisms. Under constant pressure filtration, complete or
intermediate blocking contribute to the reduction of the effective area, A, by sealing
the open pores, while pore constriction and cake filtration have an effect on the
increase of the filter resistance R. By comparing the time-dependent flow rate Q(t)
with the initial flow rate through the clean membrane Q0;
Q(t)
Q0
=
(A(t)
A0
)(R0
R(t)
), (2.9)
from which it is possible to combine, for example, complete and standard blocking
since they contribute to the variation of the different items in the equation. Similarly,
if the filter can be idealised as a bundle of N capillaries with uniform diameter D
and length L, the normalised flow rate in eqn 2.9 can be expressed using the Hagen-
Poiseuille equation [86]:
Q
Q0
=
(N
N0
)(D
D0
)4(Leff0Leff
)(2.10)
where Leff accounts for the tortuous paths through which the flow passes, and the
subscript t for time dependence is omitted for clearance. This equation separates
the contributions of different fouling mechanisms into three variables. For example,
the effect of pore constriction can be explicitly represented in the second term on the
right, since the pore diameter reduces while materials deposit onto the pore walls; cake
filtration increases the Leff ; and both complete and intermediate blocking reduces
the N . Equation 2.10 works with consecutive combined fouling as well, by simply
assuming the contributions of fouling mechanisms are additive when they happen
sequentially. Using this, Cheng et al. [86] demonstrated that the same form as the
approximate solution in the work by Ho and Zydney [83] can be derived for the
consecutive model of pore blocking and cake filtration. Similarly, assuming that the
contributions of different fouling mechanisms are additive, de Bruijn et al. [87] used
a weight coefficient Wn to explicitly account for the different degrees of participation
of the four classical blocking laws. The accumulated permeate volume could then be
22

expressed as:
V =4∑
n=1
WnVn (2.11)
where Vn accounts for the permeate volume obtained under the nth blocking laws,
and the sum of all weight coefficients is unity.
An important assumption in the analysis of both Bolton et al. [85] and Cheng
et al. [86] is that the fouling phenomena happen homogeneously over the membrane
surface. However, the surface heterogeneity may significantly affect the interaction
between particles and membrane locally [80]. In fact, Ho and Zydney [83] have taken
into account the heterogeneity of the occurrence of protein deposit over the whole
membrane surface in their ‘absolute’ solution. They assigned a critical time for the
transition of mechanisms occurring in the local region so that this characteristic time
varied over the whole surface area. This means fouling modes occur consecutively at
local areas but overall blocking and cake filtration can occur simultaneously at differ-
ent regions. Based on Bolton and Ho’s derivation, Duclos-Orsello et al. [88] derived
a three mechanism model combing pore constriction, blocking, and cake filtration for
MF cases. Their results were compatible with experimental data for both protein and
colloidal particles.
2.4 Conclusions
The relevant literature on the fouling of UF membranes has been reviewed. This area
is important for many industries and has been extensively studied. Macromolecules
have been identified as the major foulants in many UF applications and its foul-
ing is recognised as a highly complicated process. The underlying mechanisms are
not completely understood currently and remain exceptionally challenging to study.
Theoretically, the macromolecular fouling (mostly during the filtration of protein so-
lutions) has been approached by the classical blocking laws. Different fouling models
were combined in either series or parallel to form complex models in order to address
the dynamics of the fouling curves. From the review, the development of comprehen-
sive models to simulate the complex behaviours in macromolecular fouling is still in
a rudimentary stage and there exists the need for theoretical techniques to address
the finer details of a particular fouling problem.
23

Chapter 3
Literature Review: Cleaning of
Membrane
3.1 Introduction
It may be possible to prevent severe fouling before its occurrence by methods such as
pre-treatment of the feed streams, chemical modification to improve the anti-fouling
properties of a membrane, and optimisation of the operational conditions. However,
periodic membrane cleaning is still inevitable currently. As an integral part of the
modern membrane processes in most industries, cleaning must be regularly carried
out to remove the fouled materials and restore the productivity of the operation [24].
Study of membrane cleaning has often been a complement to developing deeper
knowledge of fouling. The dedicated literature on membrane cleaning is notably
less than that on fouling studies [89]. Many previous cleaning studies were actually
subsidiary to that of relative fouling, and for which the study was far from compre-
hensive. However, owing to the greatly improved understanding of fouling in the last
two decades, there have been an increasing number of dedicated studies on membrane
cleaning. In particular, systematic studies have been made in many respects in recent
years.
A quick scan in bibliographic databases (Scopus and Web of Science) showed that
the number of research papers with respect to membrane cleaning has boomed in the
last decade. This corresponds to the large expansion of UF processes in industries
such as water, wastewater, food and biotechnology at the same time. The up-to-date
24

information of membrane cleaning is constantly in demand because it is a vital part
for any operation of most membrane systems. An updated review is therefore timely
and useful.
The comprehension of membrane cleaning involves gaining the knowledge in many
patches and of the linkages between them. It should include the target (common foul-
ing problems in these industries), removal (various cleaning methods), results (clean-
ing effectiveness and any side effects such as membrane damage) and optimisation
(effect of operational parameters). Since UF fouling is introduced in the previous
chapter, we will start to discuss the general concepts about membrane cleaning be-
low, followed by cleaning methods including both conventional and non-conventional
means. A discussion of the cleaning processes, important operational variables and
general considerations for optimisation is presented afterwards. Finally, the side ef-
fects of cleaning are discussed.
The material of this chapter has been published in the journal paper: [90] X. Shi,
G. Tal, N. P. Hankins, V. Gitis, Fouling and cleaning of ultrafiltration membranes: A
review.
3.2 Principal of Membrane Cleaning
Cleaning can be defined as “a process whereby material is relieved of a substance
that is not an integral part of the material [91]”. Membrane cleaning should result in
a membrane that is physically, chemically and biologically clean, and thus can pro-
vide adequate flux and separation [92]. It should do so, while also meeting following
criteria: (1) restoring of the initial flow through a pristine membrane without ad-
versely changing its surface; (2) keeping dislodged foulants in dispersion or solution,
to prevent re-fouling of already cleaned surfaces; (3) being compatible with both the
membrane and other system components, such as joints and spacers; (4) being com-
patible with water; (5) possessing good buffering capacity and stability with time; (6)
promoting disinfection of the wet surfaces; and (7) being available and cost effective.
There are many ways to clean a fouled membrane. Generally, they can be divided
into two categories: physical and chemical methods, based on whether any chemical
agent is applied in the procedure. Physical cleaning changes hydrodynamics, applies
turbulence or varies temperature to the system in order to kinetically force foulants
to leave the membrane material. Chemical cleaning applies chemical agents to modify
the solution chemistry and change the EDL in favour of electrostatic repulsion between
25

foulants and membrane material, or rapidly react with the foulants to decompose them
into the liquid stream. In practice, physical and chemical methods are often applied
together to enhance the cleaning effectiveness. However, there are always limitations
of conventional methods preventing them from achieving good results in some difficult
cases. Therefore, innovative ways to do the job more effectively or economically are
in demand. Some emerging techniques studied and developed in recent years, such
as applications of ultrasonic and electrical fields, have shown the potential.
3.3 Physical Cleaning
Physical cleaning generally involves applying physical forces such as hydraulic, me-
chanical and electrical forces to remove foulants. Both hydraulic and mechanical
cleaning alternate the shear forces on the membrane surface, in order to loosen and
dislodge the deposits. The way to achieve this includes reversing TMP (e.g. back-
washing), increasing turbulence (e.g. rotating disks), or applying mechanical scouring
(e.g. air, sponge balls). Electrical cleaning is achieved by applying a voltage across
the membrane, thus pushing charged deposits away [93]. In current industry, hy-
draulic and mechanical methods are more widely used, while electrical cleaning, as a
non-conventional method, is not commonly applied at large scale. Another innovative
method, ultrasonic cleaning, is discussed under the category of mechanical cleaning.
3.3.1 Hydraulic cleaning methods
3.3.1.1 Relaxation
Relaxation is basically a non-continuous operation of the membrane, giving break for
concentrated foulants at the membrane surface to diffuse away via the concentration
gradient [59, 94]. This is a simple yet effective method for removing reversible fouling
[95], allowing filtration to be maintained for longer periods before the need for further
cleaning [59]. The removal efficiency of this method can be further increased when
air scouring is applied during relaxation [94]. However, relaxation is only suitable for
higher membrane surface. It also requires sufficient relaxation time and hence lowers
the overall production. If the relaxation time is too short, increased membrane fouling
may occur [96].
26

3.3.1.2 Surface flushing
Surface flushing/rinsing, in principle, removes surface deposits with a turbulent cross-
flow through the membrane surface facing the retentate side [97]. The rinsing flow
can be pumped in the forward direction as that of a feed stream in filtration or in
its reverse direction. Rinsing is, in practice, often employed to rinse off the debris
loosened by other cleaning methods, e.g., backwash and chemical cleaning. Feed
water may be used as the rinsing solution to save the usage of clean water [98].
3.3.1.3 Backwashing
Backwashing is performed with a reversed flow pushed from permeate side to the feed
side of a membrane. The reversed flow dislodges the deposits in the membrane pores
and loosens fouling cakes on the external side [99]. Backwashing typically requires a
working flux at least two times higher than the typical filtration flux. It should be
executed carefully to avoid membrane damage, and therefore, it is usually used for
capillary and ceramic membranes which can withstand a reversed permeate flow [3].
Backwashing employed for submerged membrane systems such as MBRs is able
to remove most of the debris blocking the pores as well as loosely attached sludge
cakes [59]. Backwashing has been found to be more effective than forward flushing in
many cases but it requires more energy [98, 100].
A typical regime for backwashing capillary fibre modules is to close the permeate
port and apply crossflow as shown in Figure 3.1, such that a differential pressure
is established across the length of the membrane. At the higher pressure end of the
module, the feed water flows through the membrane and permeate is produced; at the
lower pressure end, the permeate produced earlier becomes a backflushing solution
and flows through the membrane to the feed side. If the direction of the feed flow
is reversed, the other half of the module will undergo backwashing, and hence the
whole membrane is cleaned [3]. This regime has a minimal interference to the normal
operation but is limited by the maximum flow rate and backwash pressure achievable
[101].
The compositions of backwash solution affect the cleaning efficacy. UF permeate
is commonly used as backwash media. However, studies have indicated ions in the
permeate reduces the removal efficiency of NOM fouling [102]. It is hence better to use
demineralised water to do the cleaning [102, 103], because the reduced ionic strength
in demineralised water helps restore the electrical double layer on the surfaces of the
27

Figure 3.1: Example of a backwashing regime for the crossflow module: (a) Normalfiltration; (b) Forward flow backwashing; and (c) Reverse flow backwashing. Duringbackwashing, the permeate port is closed. The blue solid line stands for the feedpressure across the membrane module and the red dashed line for the permeate pressure.Modified after [3].
28

membrane and the foulants (both are negatively charged at the common pH range
occurring in UF) and hence enhance electrostatic repulsion between them [58, 104].
Backwash effectiveness also depends on the fouling it deals with. The more adher-
ent foulants require higher forces to remove. In the study conducted by Katsoufidou
et al. [72], backwashing was found to be more effective in reviving the membrane
fouled by sodium alginate than that by HA. Therefore, for more robust cleaning,
chemicals need to be dosed into backwash solution. This is discussed in Section 3.4.2.
Backwashing, in industry, has now been made fully automatic, initiated either
when TMP increases to a set point or at a fixed interval of operation [105]. For
example, backwashing with the permeate only has been set at regular intervals (10
- 120 min) for UF processes in German water companies [106]. Generally, UF back-
washing needs to be performed every 15 min to several hours of normal operation for
a duration of 30 s to 5 min [101].
3.3.2 Mechanical cleaning methods
3.3.2.1 Sponge ball scouring
Sponge balls are only applicable to big tubular membranes due to their size limitation.
They can effectively scrape deposits off the membrane modules, but the method is
time-consuming and may cause scratches on the membrane surface [3]. Therefore,
their usage has been limited in practice and can only be found in the early electro-
coat paint recovery and some small-scale studies in conjunction with other cleaning
methods [3, 107, 108].
3.3.2.2 Pneumatic cleaning
The application of compressed air to a filtration system (e.g. air sparging [97], air
scrabbling [109], etc.) varies with the way of injecting or incorporating air into a
membrane module, either intermittently or continuously, through retentate side or
permeate side, for capillary or flat-sheet membranes, etc.
As a cleaning method, air can be used in a surface flushing and backwashing
medium. However, air backwashing is not usually applicable in UF because the typical
size ranges of air bubbles (from hundred nm to µm) are about two orders of magnitude
higher than the average pore sizes in UF membranes. Therefore, in UF, air is usually
periodically introduced into flushing stream for removal of particulates on the surface,
before backwash takes place. Compared to hydraulic surface flushing, the injected air
29

bubbles promote higher turbulence at the membrane surface and hence can improve
the removal effectiveness under the same conditions [97]. Pneumatic cleaning has
been proved effective to clean fouling during UF of natural and simulated surface
water [108]. In a pilot-scale experiment where an inside-out hollow-fibre UF module
had been filtering water spiked with synthetic colloids, the rate of colloidal removal
during cleaning was improved by 30% to 130% (the variation was due to the difference
in the hydrodynamic operating conditions) with air enhanced flushing compared to
pure hydraulic cleaning, while its energy consumption was kept at almost the same
level as that using only regular backwashing [110]. Air sparging has also been used
in biological processes. In experiments with an MBR operated in an outside-in mode
[111], cleaning with air sparging alone maintained the membrane permeability at
approximately 50% of the initial value after 5-days operation, which was almost 30%
more than that achieved by conventional backwash. Moreover, the best results of
no flux decline for one week were obtained by sequentially using air sparging and
backwashing together under a low TMP [111].
Air sparging can be used as a continuous fouling control or flux enhancement
method to maintain the filtration process with good productivity. For this, air is
continuously pumped into the feed stream to form a gas/liquid two-phase flow paral-
lel to the membrane surface [112], reducing concentration polarisation and colloidal
settlements under a certain degree [113, 114]. Technically, this method can be applied
to crossflow but not to dead-end configuration in UF [110].
Currently, there are challenges and drawbacks in applying pneumatic cleaning in
practice. Firstly, it is difficult to achieve an equal distribution of air flow over/through
the whole membrane module [97]. Secondly, compressed air has the potential to cause
membrane damage and rewetting [59]. Thirdly, its mechanism of particle removal is
not yet wholly clear. Parameters such as the membrane module, the duration to
inject air, the velocity of air passing over/through the membrane and the size and
direction of the air bubbles have effects on the removal efficiency [99, 109, 110, 112].
More fundamentally, studies are required to understand the cleaning mechanisms in
the solid-liquid-gas interfaces in order to more efficiently utilise the air bubbles.
3.3.2.3 Ultrasonic cleaning
Ultrasonic membrane cleaning uses high frequency sound waves to agitate the aqueous
medium that in turn acts on the foulants adhering to the membrane surface. This
offers several advantages compared to conventional methods. For example, it can be
30

incorporated in the filtration process without interrupting the production flow, while
backwashing or chemical cleaning requires a stop to the normal operation; since it
does not use chemicals and backwashing water, it avoids the difficulties of chemical
costs, waste disposal and environmental concerns.
An ultrasonic cleaner consists of an ultrasound generator and special transduc-
ers. The produced ultrasonic pressure waves propagate through the liquid medium,
resulting in a cyclic succession of compression and rarefaction (expansion) phases.
Compression exerts a positive pressure and pushes the liquid molecules together,
while rarefaction cycles exert a negative pressure and pull the molecules apart. When
the negative pressure amplitude exceeds the tensile strength of the liquid in the rar-
efaction phase, small vapour-filled cavities known as cavitation bubbles are formed
[115]. The cavitation bubble pulsates with its size under the propagation of ultra-
sound. This sets the surrounding fluid into small amplitude oscillatory motion, known
as micro-streaming. Otherwise, the cavity can grow to a size at which the surface
tension of the liquid cause it collapse on itself [116]. Consequently, this asymmetric
collapse results in an inrush of liquid to fill the void, forming a high-speed liquid jet,
referred to as micro-jets [117]. These two phenomena both apply to a short distance
on the order of microns. In favour of the occurrence of cavitational collapses, the
frequencies between 21 and 620 kHz are used in membrane cleaning [116]. On the
membrane surface, cavitation bubbles that form at nucleation sites may travel along
ribbon-like tortuous pathways to a mutual location (e.g., antinodes) [115]. Their
motion can be much faster than that of the surrounding fluids. This phenomenon
is called micro-streamers [118]. At a macroscopic scale, strong convective currents,
known as acoustic streams, resulting from the absorption of acoustic energy, circulate
from the transducer to membrane surface [119]. These four effects mentioned above
lead to mechanical scouring over the fouling layers and breaking down of particles
and macromolecules, and are recognised as the main cleaning mechanisms.
There are also chemical effects when an ultrasonic field applies. Radical species
may be formed from, for example, the sonolysis of water molecules during cavitation
[115]. Their effects on membrane cleaning are not yet clear.
Owing to the recent improvement in the transducer technology, application of
ultrasonic field in membrane modules is now more feasible and plausible. Within
the last fifteen years, membrane systems coupled with ultrasonic devices have been
extensively studied in the lab to simulate UF and MF in dairy industry [120, 121],
water [122–124] and wastewater [125] treatment. Most studies were tested in flat sheet
31

systems [119, 120, 126] due to easy placement of the transducers. Lately, ultrasonic
field has also been applied to hollow-fiber UF membranes [127].
In recent studies, the use of ultrasound has been found to improve the cleaning
efficiency by 5 − 10 % in treating PS membranes fouled by dairy whey solutions [126].
A sonication period of approximately 10 min achieved the optimum cleaning results.
Further exposure did not improve cleaning [120]. Experiments also demonstrated
that the ultrasonic effect is only remotely influenced by temperature and TMP, and
increases linearly with ultrasonic power [126]. Increasing the power level which reaches
the membrane can improve the cleaning efficiency.
Although studies have shown great potential for ultrasonic membrane cleaning, it
must prove to be cost effective to be a viable option, regarding both the capital cost
(e.g., instalment of transducers) , and the operating cost (e.g., energy consumption).
In order to overcome the potentially high costs throughout longer production periods,
Muthukumaran et al. [120] advised the use of an intermittent series of short pulses
instead of continuous operation. It was also observed that adding surfactants to the
system during sonication could substantially improve the flux recovery [120].
Technically, membrane disintegration is a major concern for ultrasonic cleaning.
Firstly, ultrasound can only be applied to membranes synthesised from one type of
polymer, because it can disintegrate composite membranes. Secondly, the mechanical
forces created from the collapses of cavities and the radicals formed from sonolysis
can erode the membrane surfaces. Masselin et al. [128] found that PES flat-sheet
membranes were damaged after 5 min of exposure to a 47 kHz stream of ultrasound.
Li et al. [127] observed similar damage in a PS hollow-fibre membrane after exposure
to ultrasonic irradiation with low frequency and high intensity. Even for ceramic
membranes (most reported are MF), changes in membrane structure were found under
different power and frequency of ultrasound irradiation [129]. However, other studies
[120, 121, 130] showed it was safe to apply ultrasound on flat-sheet membranes such
as PS [120, 131], PAN [130]. No damage and change in intrinsic permeability of
the membranes were observed. The significance of the tolerance of a membrane to
ultrasonic irradiation is listed in Table 3.3 for different materials. However, this
information is limited in literature and difficult to compare in parallel, due to lack of
a standardised testing protocol [116].
32

3.3.3 Electrical cleaning methods
Electrical cleaning utilises an electric field generated across a membrane by placing
two electrodes on either side of a membrane to enhance the permeation flux and
prevent fouling in UF. The process is sometimes known as electrofiltration [132].
Sometimes only one electrode is used when a membrane itself can act as an electrode if
it is made of conductive materials [133]. The applied electric field can induce charged
molecules or particles to move towards the electrode with the opposite sign. This
effect is referred to as electrophoresis. By this, an electrostatic force lifts the deposits
from the membrane surface and carries them away [134]. This is the main mechanism
on which the electrical membrane cleaning is based. The other electrokinetic effect,
electro-osmosis, where a liquid is caused to move relative to a charged surface (e.g.
of a membrane pore), may also contribute to an increase in the flux, although with
minor importance in the case of membrane cleaning.
The limitation in conventional electrofiltration is the high energy demand for con-
tinuous application of an electric field, which could be up to 10 kWh/m3 of permeate
[135]. In order to save energy, modern electric membrane cleaning often utilises the
intermittent (pulsed) operation of an electric field and the advance in electrodes and
modular design in recent years makes the process more efficient. Therefore, the energy
consumption can be lower than 1 kWh/m3 [136].
It is usual to apply the electric fields with direct current (DC) in UF because it
is of a great effect for the foulants with a uniform charge. Otherwise, an alternating
(AC) field can be used, which can cause the vibration of charged particles in the
fouling layer or membrane pores , enhancing fouling removal [137]. Electrodes can
be installed for flat-sheet and tubular membranes. Operation usually takes place in
crossflow configurations, but can apply to the dead-end as well [138].
An important parameter in the operation of electric fields is the electric field
strength (E). An effective cleaning requires E is high enough to achieve a negative
net migration of particles towards the membrane [133]. The electrophoretic forces
on particles increase when E increases. There exists a critical E value above which
the electrophoretic forces become greater than the convective forces, as the increase
of electrophoretic forces corresponds to the rise in E. Below the critical value, the
membrane permeate flux depends on the strength level. However, once above it,
the permeate flux will not change much with further increasing E level [133, 138,
139]. This means that, by reaching the critical E, the resistance due to fouling or
concentration polarisation has been reduced to its minimum. After that, a further
increase in E has minor effect on increasing the flux.
33

Other parameters such as frequency, feed conductivity, properties of the solutes
(concentration, zeta potential and charge), and membrane materials also have effects
on electric cleaning.
Protein is the common target to test the effect of electrical cleaning [140, 141].
Tarazaga et al. [142] studied this using a ceramic (ZrO2-TiO2) membrane fouled with
bovine plasma in a tubular crossflow module. The pH was set above the isoelectric
point of the proteins, so that they were negatively charged in the solution. The
membrane itself was charged to be the cathode with a wire through the centreline of
the channel as the anode. Their results showed an electric field, intermittently applied
for 2 to 3 min after the permeate decreased to a constant plateau, achieved more than
100% flux recovery as long as the applied voltage was above certain values, such as
15 V for 0.5 wt% solution in their cases. The higher the voltage, the better the flux
recovery and the faster the cleaning. They also found the concentration of the feeds
affected the cleaning results. Under the same voltage, the higher the concentration,
the less effect of the cleaning.
Electric fields have been recently applied to MBRs [139], resulting in a novel
system named EMBRs (Electric-field attached MBRs). Akamatsu et al. [143] applied
an intermittent electric field (E = 6 V/cm; switching on and off every 90 s) to MBRs,
which replaced any air sparging. Their results indicated that the negatively charged
sludge particles were removed from the membrane surface by electrostatic repulsion,
once the electric field was turned on for enough duration. The intermittent operation
was as effective as the continuous application of the same electric field strength. By
operating intermittently, the energy consumption could be kept lower than that in
a conventional aeration system. Positive results about this application were also
obtained by other researchers such as Liu et al. [136], who used newly configured
electrodes to apply an electric field at very low strength (0.036 and 0.073 V/cm). This
kept energy consumption at very low level, despite occasional air bubbling. Although
currently the studied EMBRs were all equipped with MF-sized membranes, similar
results were expected in UF.
The most obvious advantage of an electrical cleaning is an incorporated in-line
technique, like ultrasonic cleaning, keeping filtration running without interruption.
Electric fields may be used in conjunction with other cleaning methods, e.g. chemical
cleaning. For example, when charged surfactant micelles accumulated on a crossflow
UF membrane, an external DC electric field helped lift them back to the flow region
and break the gel layer [144]. However, it requires a substantial capital instalment. Its
cleaning effectiveness has also limitation. It may be effective in removing reversible
34

foulants [140, 142], which have to be charged in order for electrophoresis to take place.
For irreversible fouling, the effect of electric fields may not be great. This requires
more research, as currently there is a lack of clear information. Electric fields are also
of little use for feed streams with relatively low conductivity.
The imposed electric fields may result in Joule’s heating which can be substantial.
It also impacts the chemistry in the feed, due to the electrochemical effects such
as electrolysis and pH shifting. Their effects in membrane filtration are not fully
understood. The literature contains limited information about them. Sometimes, the
effect can be positive. For example, gases generated during electrolysis are considered
to have a positive scouring effect on the membrane surface [145]. However, at other
times, electrolysis imposes serious problems such as electrocoating on membranes
and corrosion of the electrodes [137]. Electric fields also affect biological activities.
The applied electricity may stimulate the secretion of EPS from cells; this has been
observed in EMBRs [136]. Before this technique can be scaled up to large-scale
application, these issues need to be studied more thoroughly.
3.4 Chemical cleaning
Chemical cleaning of fouled membranes is based on chemical reactions between the
chemical agents and the foulants. Chemical cleaning is generally applied to hydrauli-
cally irreversible foulants, i.e., to the tough parts of fouling. It can be carried out
in situ, also known as cleaning-in-place (CIP), by replacing the original feed with
cleaning solution in the membrane module, or ex situ, referred to as cleaning out of
place (COP), by taking the membrane out of the main process stream and placing
it into an off-site tank to soak with chemicals [146, 147]. Chemical cleaning can be
done statically without circulation of the cleaning solution or kinetically with flow.
A selective list of recent studies on UF chemical cleaning is presented in Table 3.1
A cleaning agent works by dissolving, displacing or chemically modifying the
foulants or the fouling layer [71]. From a process point of view, it usually takes
six stages to complete the cleaning [89, 93, 164]: (1) bulk dispersal and formation of
cleaning agents; (2) transport of the agents to the fouled surface; (3) transmission
through the fouled layers; (4) chemical reactions; (5) transport of reaction products
back to the interface; and (6) transport of products back to the bulk solution. The
mass transfer stage of the cleaners to the fouling layer may become the limitation of
the whole process.
35

Table 3.1: Selective lists of studies on UF chemical cleaning in recent publications
Application Fouling types Membrane Cleaning agents References
Org
anic
Inorg
anic
Mic
robia
l
Aci
d
Alk
ali
Ch
elate
Oxid
ant
Surf
act
ant
Enzy
me
Ble
nd
Milk + PS + o + + + o [148]Skim milk + PES + + + + [149]Glutamic fermentation broth + + PS + + + + + [150]Protein + PES, PVDF + [151, 152]Protein + PES + [153]Protein + PES, PVDF + + + o [154, 155]Tea solutions + PS + [156]Pulp effluent + PES + + + + o [107]NOM + PES + + + [157]DOM + PVC + [158, 159]Surface water + + + PAN + [160]Algal-rich water + + PVC + + + o [161]Municipal wastewater + + + PES + [100]Activated sludge effluent + + + PVDF + + + o o o + [162]Spent sulphite liquor + + PES, PS + + [163]
Notes: “o” – optimal; “+” – tested
3.4.1 Cleaning agents
Six categories of cleaning agents, shown in Table 3.2 are commonly used: acids,
alkalis, oxidants, surfactants, chelants and enzymes [91, 148]. Commercial cleaning
products are often mixtures of these compounds, but the actual composition is often
proprietary and unknown in the public domain [71]. Chemical agents, particularly
oxidants, are also used for disinfection to maintain the system free of microorganisms.
Acids Acids are mainly used to dissolve precipitates of inorganic salts or metal ox-
ides and hydroxides [29, 91]. Mineral acids such as hydrochloric (HCl), nitric (HNO3),
and sulphuric (H2SO4) acids can perform efficiently and effectively for this. HNO3,
especially, is increasingly favoured in many plants to remove calcium precipitates
[24, 29]. Besides this, HNO3 is a strong oxidising agent, and in some cases, used to
clean many organic and biologic foulants by nitration.
However, the major drawback of strong acids is their great impact on pH of the
solutions. Too low pH can threaten the integrity of membranes. In this respect, weak
acids are usually preferred as cleaning agents in membrane plants. Phosphoric acid
(H3PO4) and some organic acids, such as citric acid, are good buffers in maintaining
pH during cleaning, and therefore much less corrosive. Many of weak acids are also
chelating agents, extremely effective at removing metal cations. However, they have
36

Table 3.2: Common cleaning agents and possible interactions between cleaning agentsand foulants
Family Examples General functions ConcernsAcids Strong: HCl, HNO3, pH regulation, dissolution of inorganic
precipitates, acidic hydrolysis ofcertain macromolecules
Strong ones corrosive;Weak ones expensive;Possible insoluble products
Weak: H3PO4, Citric
Alkalis Strong: NaOH, KOH, pH regulation, alteration of surfacecharges, alkaline hydrolysis of proteins,catalysing saponification of fats
Strong ones caustic; Weakones may form insolublesalts
Weak: Na2CO3
Oxidants NaClO, H2O2 Oxidation of organics; Disinfection Membrane disintegration;chlorination by-products;H2O2 explosive; highconsumption
Surfactants Anionic: SDS, Dispersion/suspension of deposits Long cleaning time; surfaceadsorption; re-foulingCationic: CTAB
Non-ionic: Tween 20
Chelants EDTA Complexion with metals, removal ofmineral deposits
Environmental concerns;legislation; costs
Enzymes Proteases , Lipases Catalysing lysis of specific substrates(e.g., proteins, lipids)
Costs; effectiveness
relatively high cost [165]. It may also be a concern that some reaction products of
HNO3 and H3PO4 are of limited solubility, which may cause re-deposition.
Alkalis Hydroxide solutions, such as sodium hydroxide (NaOH), potassium hydrox-
ide (KOH) or their mixtures, can promote rapid hydrolysis of proteins and polysaccha-
rides into small amides and sugars; efficient neutralisation of acidic organics; expan-
sion of HA molecule to reduce its bond to the membrane surface; saponification of fats
and oils and hence solubilisation of the cleaning products; dispersion/emulsification
of colloidal material; and regulation of pH to the effective working condition for other
chemical cleaners (e.g. oxidants on breakdown of HAs) [24, 89, 157, 166]. A draw-
back with these hydroxide solutions is their lack of a buffering capacity (or hydroxide
reserve). Therefore, most cleaning must begin with high pH levels of 11 - 12 in order
to sufficiently neutralise all the acidic components and saponify all fats [24, 29].
Weak bases such as soda ash (sodium carbonate (Na2CO3)) and sodium metasil-
icate (Na2SiO3), as opposed to those strong bases, is of high alkaline reserve with
comparatively mild pH values, making them less caustic. Polyphosphates, another
types of weak bases, sometimes included in some built detergents, has an additional
37

chelating capability [24]. However, one disadvantage of these mentioned weak bases is
that they may form insoluble salts with divalent metal ions. For complex phosphates,
there are also environmental ramifications to bear in mind, due to the concern over
water source eutrophication.
Oxidants Oxidants are strong cleaners such as sodium hypochlorite (NaOCl), hy-
drogen peroxide (H2O2) and peracetic acid (CH3COCOOH). Their primary role is
for disinfection to eliminate all pathogenic microorganisms. Water and wastewater
treatments need disinfection frequently to reduce biofilm growth, while the food and
dairy industries require their membranes to be disinfected on a daily basis and the
pharmaceutical manufacturers require their process systems to be sterilised prior to
each use. Therefore, the usage of oxidants is almost inevitable in many industrial
membrane systems.
Sodium hypochlorite (NaOCl) is the most commonly used oxidant, which hydrol-
yses in water rapidly to form hypochlorous acid (HOCl), a weak acid that dissociates
depending on pH. HOCl possesses high microbicidal activity especially at low pH
which preserves HOCl undissociated. Besides its oxidising capability, hypochlorite
may cause membrane swelling [13], and this assists in flushing out material that may
be lodged within the pores [167]. However, these agents can oxidise the membrane
surface and cause a partial scission of the membrane polymers, thus shortening the
membrane lifetime by causing changes in membrane functional groups, mechanical
properties, physical structure and hence hydraulic and retention performance. More
information on membrane damage is discussed in later section. The by-products of
the chlorination of NOM can have health and environmental concerns. Therefore,
industrial users are looking for alternative cleaning methods to reduce the usage of
NaClO [168].
The other oxidants, H2O2 and CH3COCOOH, are compatible with almost all
membranes and are easy to rinse off. CH3COCOOH can be used for many biological
applications, for example, cleaning hemodialysis membranes for subsequent reuse,
since it decomposes into the non-toxic acetic acid [29]. However, the consumption of
them in membrane cleaning (e.g., for MBR) is very high. They also possess safety
issues as both of them are explosive, and therefore expensive safety precautions are
required for their storage in plants [168]. They were chosen as surrogates for NaClO
in a large scale MBR plant in Germany, but found not as effective [168].
Sometimes, a reducing agent, such as sodium metabisulphite (Na2S2O5) and
sodium bisulphite (NaHSO3), is used to neutralise any unwanted free chlorine in
38

the membrane system. These reducers were considered for disinfection in oxidant-
sensitive membranes as well [169]. However, their reaction takes too long and may
be of little effect on bio-activity. A study on PAN spiral-wound membranes showed
immersion with the Na2S2O5 solution for 24 hours had no impact on biofouling [160].
Surfactants Surfactants are amphiphilic compounds which can lower the interfacial
tension between two liquids or between liquids and solids. They may act as disper-
sants, emulsifiers, detergents, wetting agents and biocides. They help to solubilise
and disperse deposits such as proteins, and improve the wettability and rinseability
of the membrane surface [91, 170, 171]. Consequently, surfactant cleaning can reduce
the rinsing time and water consumption.
The functional properties of surfactants are due to their amphiphilic nature, i.e.,
their molecules containing both hydrophilic and hydrophobic groups. They diffuse in
water and adsorb at interfaces, e.g., between air and water, or foulants and water.
When the concentration of surfactant is greater than the critical micelle concentration
(CMC), the surfactant molecules aggregate in aqueous solution to form micelles, with
the hydrophilic ‘shells’ in contact with surrounding water and the hydrophobic ‘cores’
tucked into the centre, . In membrane cleaning, surfactant concentration is usually
kept above CMC and the micellization process has been recognised as a key compo-
nent in the cleaning process [151]. A mechanistic model was developed by Naim et al.
[151] for surfactant cleaning above its CMC. It starts with the formation of micelles
at the air-water interface, followed by their transfer towards membrane surface, where
the micelles start to partially disassemble and release surfactant monomers which are
bound to the foulants. This causes “roll-up” of the foulant, which is lifted away from
the membrane into the bulk solution. However, it is possible that over time surfactants
will adsorb onto the available membrane surface where the foulants have left. This
will eventually cause a more hydrophilic membrane surface and attract free micelles
to form a cake layer reducing the flux. The micelle migration towards the membrane
surface is quite slow, the speed of which was estimated at about 2× 10⁻⁵m/hr [151].
Therefore, it has suggested that surfactant cleaning is controlled by its transfer limits.
Chemically, surfactants have four main subgroups: cationic, anionic, nonionic,
and zwitterionic (or amphoteric) [91]. Cationic surfactants such as cetyltrimethyl-
ammonium bromide (CTAB) have a positive charge and consist of an amino or
quaternary nitrogen group. They can be used with acid cleaners, but are gener-
ally insoluble in alkali solution. Their main disadvantage is that they can strongly
39

adsorb onto a negatively charged membrane, the latter often being the natural mem-
brane state under near-neutral pH conditions [29]. Anionic surfactants have negative
charges when dissociated in water. Typical examples include household soaps (of-
ten salts of carboxylic acids), alkyl sulphates (e.g., sodium dodecyl sulphate (SDS)),
alkyl sulphonates and phosphates [24]. Nonionic surfactants (e.g., polysorbate 20,
commercially branded as Tween 20) usually have long chains of hydrophilic groups
in combination with alcohol, alkyl phenyl or polypropylene oxide chains. Nonion-
ics are unaffected by metal cations, and thus can be used in hard water. They are
stable in both acidic and alkali solutions, and are therefore commonly used in the
blended cleaners formulated for organic fouling. They are also low foaming and easy
to rinse off, but are usually less effective than anionic agents [91]. However, like
cationics, many nonionic agents can strongly adsorb onto a negatively charged mem-
branes. Naim et al. [151] confirmed the adsorption of Tween-20 on PES and PVDF
membranes by testing their contact angles through the cleaning and it altered the
hydrophobicity of both membranes from slightly hydrophobic before cleaning to ob-
viously hydrophilic after. The adsorption of surfactant cleaners may be detrimental
to filtration as these cleaners can cause severe re-fouling, just like those surfactants
naturally present in some filtration streams, such as fatty ester, polyols and silicones,
which can cause severe irreversible fouling [91, 172].
Chelants Chelants or sequesterants such as ethylenediamine tetra-acetic acid (EDTA)
form strong complexes with multivalent metal ions such as calcium and dispersal min-
erals in general [29, 89]. Thus, EDTA is effective in destroying the otherwise tough,
cross-linked Ca2+-HA fouling layer by taking Ca2+ away via a ligand exchange reac-
tion [71]. Moreover, EDTA is often blended into proprietary cleaning agents (e.g., P3
Ultrasil 11) as an enzyme disruptor and studies have demonstrated the latter inhibits
biofilm reformation [93]. The cleaning efficiency of EDTA is pH dependent, as the
number of deprotonated carboxylic groups in EDTA is a function of pH [71]. How-
ever, there are environmental concerns and legislation limits about using EDTA, for
example, in water industry [89]. This is because EDTA is persistent in the environ-
ment although it has low toxicity. Chelating cleaners have also relatively high cost.
Therefore, their usage in membrane cleaning is generally limited.
Enzymes Enzymes are selective catalysts, designed for specific targets. For ex-
ample, protease, an enzyme that can degrade proteins by cutting the molecular
chain at strategic points, has been used to remove protein foulants in industrial UF
40

[24, 153, 173]. Their reaction is highly efficient. In a study conducted by Arguello
et al. [174], a greater than 90% cleaning efficiency was achieved, when dealing with
ceramic membranes fouled with whey protein solutions, and the efficiency was influ-
enced by pH, enzymic concentration, cleaning duration, the operation of permeate
recycling. Their maximum efficiency can be achieved at high pH and at tempera-
tures below 60 ◦C[171]. Increasing pH by addition of alkali can permit hydrolysis of
proteins, which can further favour the cleaning [174]. After enzymatic cleaning, it is
effective to apply detergents to solubilise any small loose protein fragments [173].
Enzymatic cleaning has many advantages over other types of cleaning agents
[24, 29]. For example, it prolongs membrane life, because enzymatic reactions take
place at low temperature, mild pH ranges and enzymes themselves are safe for most
membranes. Therefore, they are suitable for membranes that are unable to withstand
elevated temperature, extreme pH values, or strong chemicals. Their reactions are
very efficient and require less rinsing, which cuts chemical cost and produces less
waste water. They don’t require high temperature, which saves energy. They are also
biodegradable and environmentally friendly. However, its cost efficiency is difficult to
control [24] because there exists an optimal enzymatic concentration that maximises
the chain scission effect. Lower amounts of enzyme can result in low cleaning effi-
ciency or high cleaning duration, whereas a higher enzymatic concentration does not
necessarily increase cleaning efficiency but does increase costs and even causes further
membrane fouling [173, 174].
Enzymatic cleaners are especially useful for biofilm removal, since they break down
proteins at bacterial attachment sites. Most alkaline or acid cleaners struggle to do
this.
3.4.2 Physical and chemical cleaning combined
One of the current trends is towards merging physical and chemical cleaning, for
example, a chemically enhanced backwashing (CEB), to improve cleaning efficiency.
A CEB usually follows the steps of a normal backwash, except the backwashing
solution is dosed with chemicals [175]. The choice of dosing chemicals is process-
oriented, typically involving an acid or base combined with an oxidant, normally
chlorine [101, 176]. During CEB, a soaking step for 5 - 20 mins is usually applied to
allow thorough chemical reactions [175]. Alternatively, the membrane is soaked for
several hours and air sparging may be employed during soaking.
41

Compared to cleaning-in-place (CIP) where the cleaning solution flow is conducted
across the membrane surface, CEB needs less equipment and interrupt the filtration
process less, despite that CIP allows the use of elevated temperatures and special
cleaning agents. A survey of 83 UF plants in Germany [106] showed that these plants
with a routine CEB required chemical CIP once every 1-5 years at maximum, while
those without CEB needed CIP at least 1-4 times per year. However, CEB cannot be
performed at any installation. And it is high energy demand, which makes the gain
not always obvious.
3.5 Evaluation of Cleaning Efficiency
3.5.1 Evaluation by flux measurement
The most common way to evaluate the effectiveness of a cleaning process is to compare
the pure water flux through fresh and cleaned membranes under the same operating
conditions. For example, the flux recovery (FR) is defined as the ratio of the water
flux of the membrane after cleaning (Jc) to the flux through the virgin membrane
(J0) at the same TMP.
FR =JcJ0
. (3.1)
Based on this, Astudillo et al. [177] proposed an upgraded characterisation pa-
rameter named “membrane performance recovery (MPR) ”. It is defined as the ratio
between the average membrane flux after cleaning and the average value of the original
membrane flux:
MPR =
∫Jc d∆P∫J0 d∆P
. (3.2)
As the flux is averaged out over a range of TMP, this parameter can provide more
information than the FR value at a particular TMP.
However, the evaluation method based on measurements of pure water flux may
not be reliable because a good water flux does not necessarily assure a good op-
erational flux [145]. Even when the permeate flux is fully restored after cleaning,
it may drop immediately after a new filtration cycle starts [178]. Moreover, many
physical and chemical properties of a membrane can change with the cleaning pro-
cess, especially those on its surface since this has direct contact with foulants and
cleaning chemicals. Flux measurement does not necessarily reflect the changes. Nev-
42

ertheless, FR or MPR is a good indicator for cleaning effectiveness due to the quick,
non-invasive, and simple nature of this method.
3.5.2 Membrane autopsy
For a more comprehensive evaluation of cleaning performance, it needs not only the
immediate cleaning result represented by flux recovery, but also information on the
effect of cleaning on membrane properties and fouling removal. Therefore, the more
sophisticated way of studying the cleaning performance is membrane autopsy with
different material characterisation techniques. By saying autopsy, we mean the mem-
brane needs to be removed from its normal filtration module and characterised ex
situ. Sometimes, it is even necessary to break the membrane for sampling and test-
ing. This way is intrusive, complicated and often expensive, but it does generate
extra information relating to the membrane and fouling residuals, and brings more
insights into the cleaning efficiency and mechanisms, for example, identifying which
foulants remain on the membrane after cleaning and indicating any damage caused
by cleaning. Some methods, particularly those involving imaging techniques, may
also be applied in situ without moving the membrane. This reduces unknown effects
on the membrane or fouling layer during removal, but the techniques require specially
designed membrane modules, i.e., modifications to the filtration process, which means
they are still invasive [179]. However, compared to ex situ methods, their impact has
been kept minimal and therefore, they may be referred to as quasi-non-invasive [180].
Moreover, most of the in situ techniques are only applicable to bench-scale studies
and not to the full-scale operation. For real-life analyses in a membrane plant, the
only in situ testing possible is perhaps the flux measurement.
The membrane properties can be determined through several parameters such
as charge, hydrophilicity, strength and thermal stability. The measurement of the
streaming potential of a membrane is a convenient means to indicate the changes
in the surface charge of a membrane. Experiments have shown that a change in
streaming potential is highly dependent on the interactions between the membrane
and foulants or cleaning chemicals [163]. Hence, it is an important tool in deter-
mining the quality of a cleaning. The hydrophilicity of a membrane top surface can
be determined by measuring contact angles. After cleaning by NaClO, PVDF mem-
branes tend to become more hydrophilic [181]. These changes may be attributed to
the fact that either foulants or cleaning chemicals, or both of them have modified
43

the membrane surface. Membrane’s mechanical strength can be measured by mate-
rial stress tests, including valuing the ultimate tensile strength (i.e., the amount of
force required to pull a filter apart), ultimate elongation (i.e., the degree to which the
filter stretches before it breaks), and Young’s modulus [182]. Their change in value
(normally decreasing) reflects the deterioration in the material integrity. The thermal
stability of a membrane is examined by thermogravimetric analysis (TGA). Modern
UF membranes often have a double layered structure (a thin active semi-permeable
layer on top of a thick supporting layer). The analysis of thermal-mechanical stability
of a membrane ideally requires measurement on each layer separately in order to gain
accurate results [7].
Fourier Transform Infrared (FTIR) spectroscopy in conjunction with attenuated
total reflectance (ATR) sampling technique has been widely used to analyse the sur-
face chemical composition on a membrane. It can detect the changes in the functional
groups of the membrane polymers after being fouled or cleaned [181, 183]. By using
this technique, Arkhangelsky et al. [6] observed a reduction of the number of C−S
bonds in chlorine-treated PES membranes, indicating the breaking-down of some
chains between phenyl and sulfonyl groups in PES polymers.
Besides characterising membrane materials, the fouling residues on the membrane
are the other important factor to be delineated. The surface chemistry analysing tool,
ATR-FTIR, can identify remaining organic foulants such as protein on the membrane
surface and even quantify it, given that the protein has been well determined as
the only fouling-causing material [184]. Energy dispersive X-ray spectroscopy (EDX
or EDS), often coupled with scanning electron microscopy, is an elemental analysis
technique [184–186]. It can determine mineral foulants on the membrane [187].
Imaging techniques such as electron microscopy can achieve nanometre resolutions,
which makes them suitable for works in the UF range. For example, scanning electron
microscopy (SEM) can reveal the morphology of the membrane surface and its cross-
sections and has become a common tool to identify and visualise macromolecular
(e.g. protein) depositions on the surface or within the matrix of the membrane [188].
SEM requires membranes being removed from the module and to undergo special
treatments before imaging, and it cannot, generally, differentiate the species, for
instance, if fouling is caused by a mixture of proteins [179].
An alternative to electron microscopy is fluorescence microscopy, for example,
confocal laser scanning microscopy (CLSM). It produces 3D images with resolutions
close to the SEM. It requires foulants and/or membranes labelled with fluorophores
before filtration experiments, but it can distinct between foulants with different dyes
44

[189]. With specially designed membrane module, CLSM can be used in-situ [189].
Although it has been used in studying protein fouling, there is as yet no informa-
tion about its usage in evaluating membrane cleaning. While CLSM uses a single
high-energy photon to evoke fluorescence, multi-photon microscopy (MPM), a simi-
lar fluorescence technique, uses two or more photons excitation, which increases the
photon penetration and reduces sample damage [189]. As MPM can be designed as a
non-intrusive, in situ tool, it can visualise the development of a cleaning process. It
has successfully captured the re-fouling of a membrane after a prolonged cleaning by
the previously removed foulant (ovalbumin) present in the cleaning solution [190].
Atomic force microscopy (AFM) is a type of scanning probe microscopy, i.e., it uses
a probe (cantilever) to measure the interactions between its tip and the sample surface.
By scanning a sample area, the measured interactions from different points can be
mapped spatially into a high-resolution 3D surface topography, e.g., of a pristine or
fouled membrane. Unlike SEM, AFM does not need special sample preparation and
can be performed in liquid environment, which means it can operate in situ [191].
AFM has been used to quantify the reduction in intermolecular adhesion between
foulants and membrane surface during cleaning [71, 185]. However, AFM pictures
may not be clear for comparing cleaning results [185].
Among the less traditional characterisation methods is membrane staining (or dye
tests), which is a qualitative colorimetric assay to help determine the existence and
location of proteins on the membrane. The membrane needs to be stained with dyes
for certain amount of time and then distained several times [192]. This leaves the
protein fouling area a darker colour than other areas. However, the sensitivity of this
method is affected by undesired background staining [193]. Nevertheless, by changing
the dye from Coomassie blue [192, 193] to Amido black [194], the background staining
can be reduced. Therefore, it was proven to be capable of identifying any remaining
protein foulants and adsorbed surfactant cleaners on the cleaned membranes [194].
The staining method also provides an interesting insight regarding the traditional flux
measurement when they are both used in the analysis. Membranes that had recorded
similar fluxes were found containing different amounts of protein residues [194]. Thus,
it is yet more proof that the flux measurement is not always representative of the
degree of membrane fouling.
In summary, most cleaning characterisation techniques are also methods that can
be used for studying membranes and fouling. In the scope of this review, it is un-
realistic to include all the information about these techniques and their usage. For
45

more details, there are more focused review papers available, for example, by Chan
and Chen [188] and Chen et al. [180].
3.6 Cleaning Process and Operating Parameters
3.6.1 Common practice
Membranes in industry are regularly maintained and cleaned in place. At industrial
scale, a typical cleaning-in-place (CIP) practice requires several stages including, (1),
emptying the filtration rack from the liquid on both permeate and feed sides, followed
by water rinsing to remove product residues and reversible foulants; (2), chemical
cleaning which often consists of multiple steps in sequence for addition of different
agents with/without rinsing in-between but definitely with water rinsing at the end to
eliminate chemical agents and foulant residues; (3), disinfection and rinsing (maybe
with the addition of sodium bisulphate).
However, the permeate flux and productivity will gradually deteriorate to a level
unrecoverable by CIP. CIP is relatively simple and convenient but its effectiveness is
limited. An intensive COP is usually required periodically. Although MBRs usually
incorporate an online backwash system, chemical cleaning can only take place off-line
for submerged systems where membranes are installed in the main reactor. During
cleaning, membrane modules are taken out of the reactor and immersed in a separate
washing basin filled with cleaning solution. For an MBR with a separate membrane
tank, cleaning agents can be injected to the tank after the sludge has been drained out
[195]. As better and better cleaning strategies are applied nowadays, this intensive
COP process can be delayed now for years, for example, in some large scale municipal
MBR plants [168].
3.6.2 Cleaning steps
The requirement of different cleaning steps is process-oriented. The sequence of these
steps affects the overall cleaning efficacy [89, 91]. For example, backwash followed
by forward flushing was observed more effective than the reverse sequence [98]. It
is not difficult to envisage that backwash dislodges the otherwise difficult-to-reach
foulants in the pores and then forward wash helps remove them from the stream. As
for the sequence of adding chemicals, an alkaline cleaning followed by an acid step is
46

widely used in diary and surface water industry in order to remove macromolecular
and mineral foulants respectively [24, 89, 149]. This order has proven more effective
than the reversed in several studies [89, 149].
However, the acid clean step was thought to be redundant and not effective in
cleaning protein fouling if no minerals present in the fouling layer. Acids such as
HNO3 and HCl can not remove irreversible protein residuals at all (based on ATR-
FTIR results) [149]. Therefore, it is vital to determine the composition of foulants
before constructing a cleaning strategy. Then, a ‘standard’ cleaning process can be
tailored to a particular case for optimisation.
In order to simplify the process, multiple cleaning steps may be cut into a single
stage by using an optimised cleaning solution [183]. The first choice of all is the right
cleaning agents for a particular job. It is critical to the cleaning effect and efficiency
and depends on the filtration system components, including both membrane and
foulant, of which the complexity of the latter increases with the number of species
or functional groups involved. Currently, the choice is usually done empirically [183].
For example, a combined NaOH (0.02N) and NaClO (100 mg/L) solution was shown
optimal in a study to clean a membrane fouled by algae-rich reservoir water [98].
More advanced and theoretical methods include correlating the interfacial energy to
the fouling-removal capability of a cleaning solution for formulating more chemically
efficient solution [183].
3.6.3 Cleaning frequency
More frequent cleaning means a shorter period of filtration. This usually causes a less
condensed fouling layer liable to be removed by simple physical forces, leaving only
small amount of irreversible foulants scattering over the membrane. Therefore, mem-
brane properties, such as porosity, surface roughness, and expression of end groups,
become the major controlling factors in the cleaning process [163]. On the other
hand, less frequent cleaning allows more time for the condensation of fouling layers,
which may be difficult to rinse off. Therefore, the membrane is possibly covered with
fouling layers when chemicals are applied. Then, the reaction between cleaners and
foulants, rather than membrane properties, becomes the control factor to a cleaning
practice.
47

3.6.4 Cleaning duration
For chemical cleaning stages, a minimum cleaning duration should be set so as to
allow chemical reactions within fouling layers to be completed, while an up-limit
should also be determined for an optimal cleaning efficiency. There are currently
two concepts of the maximum time of cleaning in the literature [155]. They are
cleaning to the maximum flux restoration or cleaning up to the level when the flux
after cleaning will be equal to that of a fresh membrane. The former view suggests
cleaning should continue till membrane is completely clean and the flux restores to
a steady-state maximum value if the cleaning efficiency continues to increase as the
cleaning time lasts. Therefore, the longer the cleaning, the cleaner the membrane.
The latter considers a shorter cleaning period should be performed if short and long
cleanings are equally effective. It can be postulated that the cleaning efficiency passes
through a peak value to a lower stable level. This secondary drop during the later
stage of cleaning may be caused by redeposition or denaturation of the foulants on
the membrane surface.
The re-fouling phenomena were observed in some studies, e.g., the one with protein
determined by the MPM technique [190]. Some researches [196, 197] have suggested
that the re-fouling is caused by the decomposition of large flocs, previously dislodged,
into smaller segments due to a prolonged cleaning. As foulants become smaller, they
have higher chance of entering membrane pores and plugging them.
Prolonged exposure to certain chemicals can induce membrane disintegration as
well [181, 198]. This is discussed in the next section.
Operational time is important for water rinsing as well. It should be sufficient so
as to make sure the outlet stream is clean from permeate and foulants [199], especially
for solutions containing surfactants [183].
3.6.5 Chemical concentration
Concentration affects the rate and the equilibrium of a reaction. The concentration of
the cleaning agents in bulk solution does not necessarily reflect the effective amount
engaged in the reaction with the foulants because the foulants have indeed left the
liquid phase into a solid-like state on the membrane surface. Therefore, reactions
between cleaning agents and foulants occur in the liquid-solid interface. There exists
a mass-transfer boundary controlling the amount of reagents entering the fouling
layer [200]. Hence, the dosage must be higher enough to overcome this mass-transfer
barrier as well as to maintain the reaction in a reasonable rate.
48

As formerly mentioned, the previously accepted consensus that an increase in
the agent’s concentration results in an improvement in the cleaning efficiency has
been proven incorrect. Researchers have repeatedly shown that there is an optimum
concentration, above which cleaning efficiency does not improve and at times may , on
the contrary, cause deterioration [201, 202]. For example, in cleaning a UF membrane
fouled with whey protein concentrate (3 wt%), the membrane flux recovered by NaOH
solution at mass fraction of 0.2 % was almost two times higher than those by 0.3 %
and 0.5 % solutions [203]. Similar trend was observed in the work of Vaisanen et al.
[185] on a PA (50 kDa) membrane. In their work, the optimal concentration is
even at lower value of 0.075 wt% though their whey protein solution has as high a
concentration as 16 wt%. It was suggested that the higher concentration of NaOH
could have enhanced the swelling of the deposits, resulting in additional pore blockage
[203].
Interestingly, while investigating the optimum concentration of NaClO on cleaning
PVDF membranes, Puspitasari et al. [198] reported the repeated cleaning with 0.5%
NaClO was as effective as a single clean performed with 1%.
3.6.6 Physical conditions
The physical conditions such as hydrodynamics and temperature of the system affect
the cleaning efficacy as well. Hydrodynamic conditions that promote contacts between
cleaning agents and fouling materials during the cleaning are favoured. Dynamic
cleaning can be more effective than static soaking of membranes with chemicals with
respect to mass-transfer. Under static conditions, diffusion dominates the transport
mechanism. It may not be efficient in many cases such as the internal fouling within
the membrane matrix. Mass transfer can be enhanced dramatically by circulating
cleaning solution through the system, which convects chemicals to the foulants at a
faster pace.
For crossflow operation, the flow parallel to the membrane surface can provide
a constant shear force with the effect of carrying away reversible foulants. Some
studies concluded that, for a good mechanical cleaning effect, CFV is recommended
to be higher, and the TMP lower, than those values used during normal operation
[204]. Other studies found that hydraulic and chemical cleaning bear a negligible
relationship to CFV [92, 201]. In practice, the pump capacity and mechanical forces
on the membranes limit the possible increase to the flow rate.
49

It is recommended that permeate flux is kept lower in the cleaning process than
that used during normal filtration, in order to prevent dislodged foulants from pene-
trating and adsorbing or compacting within the pores [169, 201]. Some studies have
been carried out on cleaning with as low as possible a transmembrane flux, which can
eliminate any possibility of redeposition within the pores.
An elevated temperature can increase the kinetics of the reaction. The higher
the temperature, the more soluble both the foulants and the cleaning agents become.
Higher temperature also improves diffusion and reaction rates. However, temperature
has a non-linear effect on the cleaning efficiency. Whilst increasing temperature, one
must keep in mind two major drawbacks: the membranes may be susceptible to high
temperatures [29], and the possibility that the fouling will become less amenable to
loosening and breakup [24, 201]. It is suggested that temperature is kept at around
50 ◦C and not higher for cleaning [24, 197].
3.6.7 Optimisation
A cleaning process can be optimised in order for: (i) improving and maintaining the
cleaning efficiency, (ii) lengthening the service life, (iii) reducing the consumption of
chemicals, water and energy, and (iv) minimising the environmental impact of the
waste effluent. If the first two goals are fulfilled while chemical usage can be reduced,
it will beneficially cut down the total cost and emission of unwanted substances into
the effluents, and minimising the plant downtime, labour input and hazards to plant
operators [168]. There are many studies about optimising membrane cleanings from
almost every means. However, at current state, chemical cleaning is still inevitable
in most practical cases
Optimisation is usually studied by adjusting one chemical or physical condition at
one time. However, given the complex nature of fouling, cleaning involves many vari-
ables such as process sequence, hydrodynamic conditions, solution temperature and
pH, chemical dosage, and cleaning duration etc. Apparently, by the one-parameter-
each-time method, a comprehensive understanding of them requires a large number
of experiments to cover all of the parameters for a specific membrane application [89].
To reduce the total workloads, researchers have started to use multi-variables statisti-
cal methods recently [100]. In these methods, full factorial experiments are designed
to aid identifying the major independent parameters affecting cleaning efficiency and
their optimal conditions as well as the interactions between factors. The experimental
results can be analysed by the analysis of variance (ANOVA) method. Chen et al.
50

[100] first designed a factorial experiment to study the chemical cleaning efficiency in
a spiral-wound UF of the secondary effluent of municipal wastewater. Porcelli et al.
[205] factorised concentration, soaking time and temperature with Box-Behken design
to study chemical cleaning on a biofouling case with upland surface water. They later
incorporated a cost model into their factorial experiments [206].
3.7 Membrane disintegration
3.7.1 Membrane properties
Membranes possess mechanical strength, thermal stability and chemical resistance,
which depend on the material of construction. And it is not necessarily the membrane
that is stable against one of the factor can perform well against all of them. The
mechanical, thermal and chemical factors regarding these materials are listed in Table
3.3.
CA membranes are naturally hydrophilic with low binding to proteins, but have
limited range of operational pH. A lower pH can degrade the β-glucosidic linkages in
the backbone of the cellulose polymer, reducing the effective molecular weight and
eventually causing loss of structural integrity. At higher pH values, CA membranes
will deacetylate [29]. Free chlorine higher than 1 ppm for long term applications or
higher than 50 ppm in short term applications will oxidise and damage the membrane
[207].
PAN membranes have good tolerance to organic solvents and, hence, been widely
used in treatment of industrial wastewater.
PES and PS membranes have high rigidity and good chemical resistance due to
their structures consisting of phenylene rings connected by sulfonyl (SO2) groups.
Operating temperature for these membranes can reach as high as 75 ◦C. Operating
pH can range from 1 to 13 [3]. These membranes have strong alkali resistance. How-
ever, PS and PES membranes are susceptible to oxidising agents, such as chlorine or
hydrogen peroxide. The maximum allowed chlorine concentration is up to 200 ppm
for short term applications and 50 ppm for long term applications [207].
PVDF membranes are even more stable than PES and PS ones. They usually
have remarkable chemical resistance and can be repeatedly autoclaved, and thus are
suitable for food and pharmaceutical applications. However, in alkaline streams with
pH greater than 12, PVDF can dehydrofluorinate [29].
51

In many practices, increased hydrophilicity of a membrane is favoured. Then,
polymeric additives such as polyvinylpyrrolidone (PVP), which is mostly used, are
often blended into or grafted onto these polymeric back-bone matrices [4].
It is worth mentioning that even small differences in the chemical composition of
the base polymer, the presence of blended-in polymeric additives, the specific mem-
brane casting processes, or the use of any post formation modification, can cause
significant differences in its chemical and mechanical stability. Thus, detailed infor-
mation on the operational limits for different membranes should be obtained directly
from the manufacturer [24].
Besides these polymeric membranes, ceramic membranes have emerged as an
major advance in UF technology during the last two decades [11]. Compared to
their polymeric counterparts, ceramic membranes have robuster mechanical strength,
higher temperature tolerance, better chemical stability [20], despite the fact that
they are currently more expensive, heavier and thicker than polymeric membranes
and require higher TMP because they have greater resistance to water transport [11].
Consequently, they generally have higher tolerance to ultrasonic irradiation as shown
in Table 3.3 [116]. However, they may still be impaired by ultrasound cleaning based
on limited published results [129, 208, 209].
Proper cleaning procedures should not exceed the limits of any of these properties.
Excessive cleaning may accelerate wear or damage to the membrane structure, result-
ing in enlarged pore sizes, fractured surfaces, or compromised and even broken fibres
[10, 210]. This implies that the membrane gradually loses its functionality during the
course of cleaning, which manifests as a reduction in the quantity or quality of the
filtrate products, or a mechanical failure such as fibre embrittlement [211]. In prac-
tice, membranes need to be monitored regularly to ensure its integrity. An average
annual fibre failure rate in hollow fibre membrane plants was found to be around 1-10
per million fibres [210].
Table 3.3: Mechanical, thermal and chemical resistances of common membrane ma-terials of UF. Sources from [10–12].
CA PAN PES PS PVDF CeramicMechanical strength good good good good good excellentThermal limit, ◦C 30 40 80 75 40 highpH 4 - 8 2 - 10 2-12 1-13 2 - 10.5 superiorOxidant tolerance moderate moderate good good excellent superiorUltrasonic irradiation [116] moderate moderate poor good good excellent
52

3.7.2 Chemical degradation
There are many factors affecting the failure in membrane integrity in a membrane
plant. For example, manufacturing fault, incidents and the shocks caused by the
accumulation of air in the system can all lead to physical damage [210]. Most im-
portantly, contact with chemicals during membrane cleaning can alter the functional
groups in the membrane materials [6]. It is only recently this effect on membrane
integrity has been systematically studied by various characterisation techniques such
as membrane thermo-mechanincal strength and chemical composition analyses. Most
focuses are on the effects of hypochlorite cleaners. Prolonged exposure to them has
been revealed to be the primary cause of chemical degradation in membrane poly-
mers ( e.g., PVDF [181, 198] and PS [4, 212]) The degradation rate depends on total
chlorine dosage (concentration × time) and pH [4]. Excessive dosage of NaClO has
been found to cause the enlargement of pores in PAN membranes [213] and pitting
and cracking on the surfaces of PES membranes [7]. These changes were clearly dis-
played in SEM images. As a consequence, these changes affect the filter behaviour in
terms of flux and filtrate rejection and also alter foulant-PES interactions. A denser
protein fouling layer was observed in the membrane with determined PES scission
after extreme NaClO exposure [214]. Furthermore, the degradation was found as a
surface process with no obtainable effect on the supporting layer [7].
It has been proposed that these changes are due fundamentally to the reactions
between the cleaners and some specific functional groups. These reactions cause
breakdown of membrane polymers and attachment of new end groups. This process
is often described as a chain scission phenomenon. Chemical analyses have revealed
the formation of various functional groups (e.g., carboxyl, aldehyde and ketone) on
the skin layer of cellulose membranes [215] and the oxidation of sulphonyl (−SO2)
groups to sulphonate acids (−SO –3 ) in PES chains [6] after prolonged exposure to
NaClO solution, the latter being shown in Fig. 3.2. The mechanism in Fig. 3.2a
was proposed by Thominette et al. [5] and later Arkhangelsky et al. [6] based on
their analyses results. However, Yadav et al. [7] detected the chlorine element in
membranes aged at pH 9 (in contrast to pH 12) from EDS analysis, so that a different
chain scission mechanism (see Fig. 3.2b) was suggested at pH 9, where one end of the
broken PES chain is still terminated with a sulphonic acid group but the other broken
end has now a phenyl-Cl group. The pH value affects the concentration between ClO–
and HClO in aqueous solution, with a acid dissociation constant (pKa) value of, e.g.,
7.58 at 20 ◦C[216]. These two species are known to have different oxidising potential,
53

with a higher value for HClO [7, 217]. Therefore, the chain scission phenomenon may
be controlled by pH. More studies need to address the details.
Figure 3.2: The mechanisms of chain scission in PES membrane after prolongedexposure to hypochlorite (a) proposed in Refs. [4–6], and (b) in Ref [7].
The coexistence of HClO and ClO– in the solution, i.e., around pH 7 to pH 8,
may induce the formation of hydroxyl radicals (HO·) [218]. The formed HO· can
attack the sulphonyl group, which may become the cause of chain scission [212]. The
repeating isopropylidene groups in PS monomers are also susceptible to free radicals
and can be oxidised into an alkene group [4].
Radicals are also responsible for chain scission in PVP, the additive used in PES
membrane manufacturing [4, 218]. PVP degradation in contact of NaClO has been
observed in various membranes such as PS/PVP [4, 219], PAN/PVP [213], CA/PVP
[220]. Pellegrin et al. [217] found the worst degradation of PES/PVP membranes
at pH 8. With a comprehensive analysis protocol, they found it was related to the
PVP chain scissions due to radical attack and being washed away from the membrane
matrix. They didn’t observe the PES chain scission but the evident PES oxidation
was found within a thin layer from the surface (40 µm) in the presence of PVP or PVP
degraded products. Thence, in their case, they concluded that the membrane integrity
54

loss was due to a radical induced PVP degradation. Prulho et al. [221] fundamentally
studied the hypochlorite and radical effect on PVP, PES and PES/PVP blended films,
separately. Their findings agreed well with the aforementioned results.
Prolonged exposure to NaClO have also been observed to cause alterations in
PVDF membranes, leading to changes in structure, compromised filtration perfor-
mances and weakened mechanical properties [181, 198], although PVDF membranes
have been considered one of the most stable membranes amongst the other commer-
cially available polymeric membranes [210].
Most membrane disintegration studies, sometimes referred to as ageing experi-
ments, are conducted in the laboratory by soaking the membrane under static con-
ditions at an elevated concentration of oxidants [4, 6, 7]. Although the experimental
dosage (ppm × days) could be set comparable to on-site operation, the question is
whether these accelerated lab-scale experiments can represent the real situation in
the plants. Pellegrin et al. [217] studied the impact of hypochlorite concentration on
membrane degradation while the eventual dosage was kept the same by varying the
exposure duration. The results showed higher concentration obviously worsened the
degradation. Therefore, accelerated ageing experiments using higher concentration
and shorter exposure time may overestimate the real situation.
3.8 Conclusions
This chapter presented a comprehensive review of membrane cleaning in UF appli-
cations. The goals, methods, mechanisms and processes of membrane cleaning were
discussed in great detail. The principal findings are listed as following:
• Membrane cleaning is a vital step in maintaining the permeability and selec-
tivity of the membrane. It is also necessary to return the plant to its original
capacity, to minimise bacteriological contamination and to produce acceptable
products.
• There are as many types of cleaning regimes as there are fouling types and mech-
anism. Generally, the commercially popular means include groups of physical
and chemical methods. Non-conventional methods, including ultrasonic and
electrical cleaning, are alternative and innovative means under study.
• A cleaning process can include several steps, depending on the fouling situation.
Common cleaning protocols adopted by various industries consist of a hydraulic
55

wash prior to and after chemical/biological cleaning. However, in order for opti-
misation, the detailed cleaning flow has to be specially designed for a particular
job.
• Cleaning process parameters include choosing suitable cleaning agents and their
concentration, order and duration of cleaning steps, system hydrodynamics and
operation temperature.
• The methods of evaluation of cleaning efficiency are listed, especially, containing
a number of modern characterisation techniques (mainly microscopic methods)
which help gain more insights into the results, impacts and mechanisms of
cleaning process.
• Membrane disintegration is revealed as membrane structure changes, embrittle-
ment of membrane fibres and compromised filtration performance. The mech-
anism mostly studied is the polymeric chain scission occurring in membrane
materials, owing to the attacks from the oxidants in the cleaning solution.
56

Chapter 4
Theoretical Developments of
Combined Fouling Model
4.1 Introduction
The classical blocking laws dissect membrane fouling into four extreme but simple
scenarios. However, in reality, the phenomena of membrane fouling is a far more
complex, involving multiple mechanisms that may emerge in series or in parallel.
The overall behaviour is dictated by a certain combination of these mechanisms.
The aim of this chapter is to develop suitable models for complex fouling processes.
Here, we use a ‘bottom-up’ multiscale approach to the problem. Fouling dynamics
are resolved first at an individual pore randomly chosen on a membrane and then
statistically averaged over the whole membrane area.
To begin with, a description is given of the complex nature of the relevant fouling
phenomena. Subsequently, the multiscale approach is used to form complex models
from the classical blocking laws for, respectively, two fouling scenarios commonly
encountered in UF of macromolecules.
4.2 Complex Membrane Fouling
Fouling, in many situations, consists of a set of physicochemical processes, occurring
either consecutively or concurrently. The mechanisms responsible for each process
cooperate in a certain way, dictating the overall behaviour of the fouling.
57

4.2.1 Consecutive Fouling Mechanisms
Multiple consecutive steps have been frequently observed on the flux-decline curve
of a filtration process. The progression from one step to the other is manifested in
the noticeable variation of the decline rate of the flux. This phenomenon is often
considered to be the evidence of the evolution of a fouling process, where membrane
fouling develops into different stages as filtration proceeds. These stages may be
characterised by distinctive fouling mechanisms.
For UF of macromolecules, the common fouling stages involved are illustrated in
Fig. 4.1. The first stage represents a rapid process of macromolecular adsorption
Figure 4.1: Schematic of concepts of multiple-stage fouling behaviour.
onto the exposed membrane surface. This causes a sharp decline in permeate flux.
However, if the macromolecules are inert with the membrane material, adsorption
will not happen; or when the molecules are larger than the pore size, size exclusion
occurs [83]. After most of the binding sites are occupied, the first sublayers or the
first few patches of foulants start to build up at some regions of the membrane surface
(stage 2, Fig 4.1). The flux declines rather slowly in this stage but it will not last
long since solutes continue to accumulate onto the surface, leading to the inevitable
pore blocking. The blocking process (stage 3, Fig 4.1) usually takes place in an
58

exponential rate and dramatically reduces the passage for the solvent. This manifests
a steep decline in the flux curve. Subsequently, patches of these sublayers grow
together into multiple layers and cover the whole membrane surface, forming the
fouling cakes. While the cake continues to grow thicker, the layers are compressed
under TMP (stage 4, Fig 4.1). Eventually, the particles of the deposits are rearranged
into a more densified state. This is usually a slow process and the decline of permeate
flux will become more gradual. Flux tends to a pseudo-steady state. There are, of
course, exceptional cases, but such a flux-decline pattern has been found in many
studies [19, 81, 83, 88, 222, 223]. Belfort et al. [19] also considered a non-Newtonian
viscous effect as a further stage taking place after cake compaction for filtration of
mixtures of macromolecules and particles.
4.2.2 Concurrent Fouling Mechanisms
Every so often, more than one fouling mechanism may occur at the same time in a
filtration stage [77], especially when the feed solution contains a mixture of foulants.
For example, a mixture containing small and large fractions can cause simultaneous
internal fouling and external deposition [224]. In such a case, even during cake fil-
tration stage, pore blockage may still take place because small solutes may reach the
membrane surface through the interstices of a coarse cake layer composed of large
particles [225].
Based on the classical blocking models, Bolton et al. [85] and Duclos-Orsello et al.
[88] have both derived a combined blocking model to account for the decrease of the
unblocked membrane areas under the simultaneous standard (internal) and complete
blocking;dAopen(t)
dt= −σCbJopen(t)Aopen(t) (4.1)
where Jopen(t) is the superficial flux through the open pore areas, given by the stan-
dard blocking model:
Jopen(t) =J0
(1 + βCbQ0t)2(4.2)
where the coefficient β [kg−1] is equal to the part of ks in Table 2.2 with Cb removed;
β =ksCb
=φ
A0δm(4.3)
Hence, the area containing opening pores (i.e. the effective membrane surface) can
59

be explicitly expressed as the function of the filtration time:
A(t)
A0
= exp
(− σCbJ0t
1 + βCbQ0t
). (4.4)
In fact, the model of the classical intermediate blocking may be interpreted as a
situation where complete pore blocking and cake formation simultaneously contribute
to the apparent flux decline. As described in the classical model, the particles have
an even probability to fall onto the open pores or onto the previously settled deposits.
Therefore, the particles, which directly contact the pore entrance, contribute to the
pore blockage mechanism; others, superimposing on the first sublayer, contribute to
cake growth. This concept is shown in Fig. 4.2.
Figure 4.2: Schematic diagram for a case of simultaneous pore blocking and cakeformation.
4.3 Fouling Dynamics at Pore Scale
The study of fouling at pore scale is to zoom into the local region of a single pore on
a membrane to see how solutes or particles interact with the pore locally. Once the
60

fundamental mechanisms at pore scale are resolved, it is only a matter to upscale to
the macroscale.
The pore size in a UF membrane typically ranges from 10 nm to 100 nm. In fluid
systems, this range is within the mesoscale, where flow is still treated as continuum
but solutes are commonly modelled as particles. By analysing all the forces acting
on the particle, its trajectory and its deposition can be studied from the first prin-
cipal. However, this method can rarely give analytical solutions, and often requires
expensive computing to produce simulation results.
On the contrary, the classical phenomenological blocking laws are computation-
ally simple and easy to implement in the pressure-driven filtration. Although these
classical models were derived semi-empirically for the phenomena observable at the
macroscale, their derivation [30] was deeply established in the analysis of the mass
transport at about the pore scale. The assumption of uniform pore arrays in the
membrane serves key for simplification in the classical theory. By the assumption,
the classical models essentially represent the average behaviour of the many pores
constituting the membrane and the parameters used are statistically averaged over
the whole membrane area.Thus, the following context shows the development of a
dynamic model based on the classical blocking theory to predict the permeability of
an individual pore being randomly chosen.
Under classic blocking theories, fouling either causes membrane to lose the effective
pore areas via either pore blockage or pore constriction, or adds extra resistance to
the membrane by forming cake layers on the upstream surface of the membrane.
The ratio of the particle size to that of the pore determines where the particle
will be captured by the pore, either outside or in the pore channel. When the size
of the particles are much smaller than the pore diameter, pore constriction (internal
fouling) takes place if the surface of the pore channel is attractive to the particles.
With the assumption of straight channel in which Hagen-Poiseuille flow can develop,
the normalised permeability1 of the pore has an expression following the standard
blocking model in Table 2.2 as
pn(t) =1
(1 + βCbQ0t)2, (4.5)
where βCb equals to the constant ks as described in eqn 4.3. Pore constriction causes
the relative permeability a gradual decline along the filtration time.
1 The permeability of a medium is the inverse of its resistance; the normalised permeability isthe temporal permeability normalised by its initial value.
61

Unlike the pore constriction, the pore blocking has a sudden effect on the local
permeability of a single pore. Pore blocking happens when the size of the particles are
comparable to the pore diameter. It seals the pore gateway completely or partially.
In the macroscopic model, the effect of pore blockage is reflected by an increase in
the average membrane resistance, which can be attributed to 〈Rb〉 (note that bracket
〈...〉 means average), and the closure of pore entrance contributes to the loss of the
membrane porosity. While 〈Rb〉 is the mean value averaged over all the pores on the
membrane, for each pore, there is a local resistance, denoted by Rb, representing the
local effect of pore blocking on a single pore. If it is completely blocked, Rb tends to
infinity. However, due to the imperfect shape of both the particles and the pore in
many practical cases or due to the porous body of the blockage material, for instance,
in the case of many naturally coiled polymers [226], Rb is likely to be a finite number,
which resembles a pore being partially blocked. Hence, blocked pores exclude large
particles to enter pore channel but still allow water or small solutes to pass through
the interstices between the pore surface and the plugging particles.
Another fouling mode in the single-pore dynamics is the accumulation of solutes
above the pore entrance. Though it usually happens for particles with size apparently
larger than the pore’s to form gel or cake layers above the membrane upstream surface
[227], smaller particles (ds < dp) can also build up on the pore entrance according to
computational studies on MF [228], in which particles deposit on the edge of the pores
first and then bridge across the pore through certain interactions such as electrostatic
forces when further particles from the bulk continuously deposit onto each other
[229]. Cake formation above a single pore contributes to an additional resistance,
Rc, locally, while the effect of the cake on the entire membrane is expressed as the
overall cake resistance which is an average value over the whole surface area, denoted
by 〈Rc〉. Note that the relationship between the resistances at pore scale and that
at macroscale is far more complex in reality due to factors such as inter-particle
interactions. Assuming Darcy’s law is applicable to the pore under study, the local
total resistance Rt(t) is simply derived from the governing equation for cake filtration
in Table 2.2 by assuming the rate of increase in total resistance is proportional to the
instant flux through the area:dR
dt= αCbJ(t) . (4.6)
62

Integrating the equation above with Darcy’s law, one can obtain:
Rt(t) = Rt(t0) +Rc(t) = Rt(t0)
√1 +
2αCb∆P
µRt(t0)2(t− t0) . (4.7)
where Rt is the total local resistance and Rt(t0) is the local resistance at t0 when cake
formation starts. The normalised permeability of the pore can be obtained from
pn(t) =Rm
Rt(t)(4.8)
and it gives by combining eqn 4.7 and 4.8;
pn(t) =Rm√
Rt(t0)2 + 2αCb∆Pµ
(t− t0). (4.9)
With the three basic pore-level fouling modes mentioned above, it is possible to
construct models for complex particle-capturing dynamics at pore scale.
4.3.1 Model A: Sequential Pore Blocking and Cake Filtration
This model is developed for constant pressure filtration. In its scenario, the solutes
are inert and have sizes comparable to the pore diameter so that the pore constriction
is unlikely to happen. Initially, the solvent flows freely through the pore channel until
an oncoming particle of the solute blocks the pore at time τ , which abruptly increases
the overall local resistance by an additional Rb. The value of Rb is assumed to be
finite given that the pore blockage is likely to be incomplete as described previously.
As a result, the solvent flow continues at a reduced rate, so that solutes from the bulk
phase can further deposit onto the blocked areas and gradually build up a fouling
layer above the entrance, exerting an additional resistance 〈Rc〉 on the flow.
Since the cake filtration only takes place after the pore is plugged, its growth can
only start after the blocking time τ . Therefore, τ is the value of the initial time for
cake formation, t0, in eqn 4.7, i.e., the cake growth being delayed by an amount of τ
from the initial filtration time. Meanwhile, the total pore resistance at the onset of
cake formation (t = τ) includes the resistance due to pore plugging (Rb) in addition to
the intrinsic resistance (Rm) and can be represented in a resistance-in-series fashion
63

[9], i.e.,
Rt(t0) = Rt(τ) = Rm +Rb . (4.10)
Combining all the mechanisms in a sequence, the normalised permeability can be
generalised as a single expression in terms of the filtration time, t, as
pn(t, τ) = pn1(t)H(τ − t) + pn2(t− τ)H(t− τ) (4.11)
in which H(x) is the Heaviside function defined as:
H(x) =
1 if x ≥ 0 ,
0 if x < 0 .
(4.12)
The blocking time τ accounts for the transitional moment from one mechanism to
the other. Function pn1 acts during filtration before the blocking, when t ∈ [0, τ);
while function pn2 commences after pore blocking, when t ∈ [τ,∞). In this present
scenario, pn1 = 1 is the normalised permeability of a clean pore channel before a
particle blocks the pore, while pn2 is a decay function of the permeability due to cake
formation, given by eqn 4.9. Applying their expressions to eqn 4.11, one can obtain
the specific expression for the normalised permeability of model A as a function of t:
pn(t) = H(τ − t) +Rm√
(Rm +Rb)2 + 2αCb∆Pµ
(t− τ)H(t− τ) . (4.13)
which is a two-steps curve on a p− t plot shown as pA in Fig. 4.3.
4.3.2 Model B: Sequential Pore Constriction, Blocking and
Cake Filtration
In model B, the solutes in the feeds are assumed to have a wide size distribution,
containing not only big colloids, which can block the pores like in the scenario of model
A, but also a portion of small macromolecules which can cause pore constriction.
Therefore, before the pore is blocked by any large particle, small macromolecules can
enter the pore channel to cause internal fouling. Such a fouling scenario has been
64

observed during filtration of protein solutions, where small protein monomers coexist
with large protein aggregates [88, 230].
0
0.2
0.4
0.6
0.8
1
Time
Perm
eabili
ty
0 τ
pA
pB
Figure 4.3: Schematic of the local normalised permeability function in a single porefor model A (pA, eqn 4.13) and model B (pB, eqn 4.15), respectively. The time τis the ‘switch’ time when the pore becomes partially blocked. Model A refers to thesequential pore blocking and cake filtration model and model B to the sequential internaland external fouling.
By using similar assumptions to those in Model A, one can readily derive the
dynamics in an individual pore with for model B. The expression of pn1 in eqn 4.11
adopts the form of eqn 4.5 for pore constriction model; while pn2 still uses eqn 4.10
but Rt(τ) is modified as
Rt(τ) = Rm(1 + βCbQ0τ)2 +Rb (4.14)
which means that the initial resistance for cake formation at the transitional moment,
when cake filtration just starts, includes not only the clean membrane resistance but
also the effects of pore constriction (the factor (1 + βCbQ0τ)2) and pore blocking
(Rb). Thus, the relative permeability is again given as a function of filtration time
65

with specific components relative to model B:
pn(t) =1
(1 + βCbQ0t)2H(τ−t)+ Rm√
[Rm(1 + βCbQ0τ)2 +Rb]2 + 2αCb∆Pµ
(t− τ)H(t−τ)
(4.15)
which is shown as pB in Fig. 4.3.
4.4 Probability of Switch Time
In the last section, the dynamics of fouling in a single pore has been modelled with
multiple mechanisms combined in sequence. In this section, the linkage from a single
pore to the whole membrane is built to develop macro-scale combined models for
predicting the observable flux decline behaviour during the filtration.
The general form of fouling dynamics at pore level (eqn 4.11) is applicable to all
pores in the membrane. In the equation, the switch time τ , at which the cause of
fouling transitions from one mechanism to the other, is a random variable. It varies
between pores at different location. Under the assumption that membrane consists of
an array of independent pores, the overall permeability of a membrane is essentially
an average over all the pores within it.
In both model A and B, the cause of the switch is pore blocking. In classical
blocking laws, Therefore, the distribution function of τ is related to
The cause of switch is due to pore blockage. Moreover, the governing equations
for classical complete and intermediate blocking laws (see Table 2.2) give the decay
function of the effective pore areas. This means the total number of the blocked
pores is a function of the blocking time if still holding the approximation of mem-
brane structures to an array of microfluidic channels. Since the classical intermediate
blocking model is considered as a special case of combining complete blocking and
cake formation mechanisms, the derivation below has only used the complete case.
For model A, the total number of blocked pores at time τ is obtained in percentage
over the total pore numbers , using the classical complete blocking model, as
F = 1− exp(−kbτ) (4.16)
where τ ∈ [0,∞) and
kb = σCbJ0 . (4.17)
66

For a single pore, F is the probability that pore blockage happens at time τ . Then,
eqn 4.16 represents the cumulative distribution function of the random variable τ that
stands for the switch time at which a pore enduring a transition from one fouling mode
to the other.
The distribution density function of τ , denoted by f(τ), is, hence,
f(τ) =dF (τ)
dτ= kbexp(−kbτ) (4.18)
which stands for the number of pores being blocked at a particular point of τ . The
two probability functions for model A are portrayed in Fig. 4.4.
0
0.2
0.4
0.6
0.8
1
Cum
ula
tive D
istr
ibution F
unction F
(τ)
Switch Time τ0
1
x 10−3
Density F
unction f(τ
)
Figure 4.4: Schematic of the cumulative (eqn 4.16) and (eqn 4.18) density distributionfunctions of switch time τ .
67

For model B, which is the sequential standard, complete and cake blocking, the
cumulative distribution function of τ takes the form from eqn 4.4:
F = 1− exp(− σCbJ0τ
1 + βCbQ0τ
), (4.19)
since the pore blocking rate will be affected by the internal fouling as discussed in
the concurrent fouling models (see section 4.2.2). And the density function hence is
f =σCbJ0
(1 + βCbQ0τ)2exp
(− σCbJ0τ
1 + βCbQ0τ
). (4.20)
4.5 Consecutive Models of Multiple Blocking Mech-
anisms
With the mechanisms-switching model for an ‘averaged’ individual pore and the
switch time distribution density function obtained, the sequentially combined ‘mi-
croscale’ models are to be correlated to macroscale, i.e., application from a single
pore to the whole membrane, in this section.
The procedure is to add up the contributions from all the pores to calculate the
total flow rate through the whole membrane relative to the filtration time, t. As
the assumption of uniform pores is kept valid here, the difference between fouling in
different pores is due to the variety of τ . Since the distribution function for τ was
obtained in eqn 4.18, the overall flow rate Qn(t) (normalised by the initial flow rate
Q0) can be calculated from the mean permeability, p, at a particular filtration time,
i.e.
Qn(t) =
∫ ∞0
p(t, τ)f(τ) dτ (4.21)
where p(t, τ) and f(τ) are eqn 4.11 and 4.18 respectively. The integration in the
above equation accounts for the temporal heterogeneity of the switching time from
pn1 to pn2 in eqn 4.11 and the resultant Qn is an average over all the possible τ .
Using eqn 4.13, 4.18, and 4.21 , we can derive the macroscale equation for model
68

A scenario,
Qn(t) = exp(−σCbJ0t) +
∫ t
0
σCbJ0Rm
(Rm +Rb)√
1 + 2αCb∆Pµ(Rm+Rb)2
(t− τ)exp(−σCbJ0τ) dτ .
(4.22)
where the first part accounts for the flow through the open-pore area while the latter
for that through the blocked area. This expression agrees with the model, for the same
scenario, derived by Ho and Zydney [83] using purely phenomenological arguments.
For model B, using eqn 4.15, 4.18 and 4.21 it derives
Qn(t) =1
(1 + βCbQ0t)2exp(− σJ0t
1 + βCbQ0t)
+
∫ t
0
RmσCbJ0
(1+βCbQ0τ)2exp
(− σCbJ0τ
1+βCbQ0τ
)(1 + βCbQ0t)2
√[Rm(1 + βCbQ0t)2 +Rb]2 + 2αCb∆P
µ(t− τ)
dτ .(4.23)
Compared to the model A, this one has an extra parameter, ks, to determine. It’s a
model containing three sequential fouling mechanisms and four parameters and equal
to the one derived by Duclos-Orsello et al. [88].
4.6 Conclusions
A multiscale approach to complex fouling scenarios has been postulated and demon-
strated with examples in this chapter. In this approach, the membrane is idealised to
contain only independent pores. The fouling dynamics are resolved first at a single
pore with average properties. The resultant microscopic (strictly the pore scale is at
the mesoscale) model is then statistically summarised over the whole membrane to
derive the macroscopic model to be comparable to experimental observations. The
generalised framework is flexible to incorporate different mechanisms.
The application of the approach has been demonstrated in two proposed complex
scenarios, which are later used to represent for the macromolecular fouling exper-
iments in the following chapters. In these two scenarios, the microscopic fouling
models consist of multiple steps and a switch time is given for changing the mech-
anisms. The switch time is a random variable and has a probability distribution
function over different pores, dictating how many pores are blocked at a particular
time. The informations then lead to the derivation of the macroscopic models. The
69

detailed derivation involves combining the relevant classical blocking models. Bene-
fiting from the simplicity of those models, the final expressions for the two scenarios
are easy to implement computationally.
Compared to conventional approaches which incorporate multiple mechanisms,
the multiscale approach proposed here is a more general scheme. The generalised
equation 4.11 can be adapted to wider fouling scenarios. The multiscale scheme has
also a more sound physical meaning, which can produce more accurate solution.
70

Chapter 5
Investigation of Dilute
Macromolecular Fouling in UF
5.1 Introduction
The main purpose of this chapter is to understand the general fouling behaviour dur-
ing UF of dilute macromolecular solutions via the theory developed in Chapter 4.
The conducted work involves mainly obtaining the primary data from bench-scale
UF experiments with three different macromolecular feeds, verifying the applicability
of the combined models to the measured data, and evaluating the fouling mecha-
nisms behind. Two series of experiments were designed to study the different fouling
behaviours under various bulk concentration and under different TMPs. The flux-
volume-time data were obtained and further analysed with the fouling models. The
fouling mechanisms were evaluated using two methods, i.e., integral and differential,
over the filtration time.
5.1.1 Chapter Outline
The rest of the chapter starts with the section introducing the materials and method-
ology used in the present work, and outlining the filtration protocol and the model
numerical scheme. The following section presents the results from both experiments
and numerical stimulations. Two sets of the results on the study of bulk concentra-
tion and TMP are included in Section 5.3.3 and 5.3.4 for each macromolecular feed,
71

respectively. The models have been fit to the experimental results and are presented
along with them. The resultant model parameters are discussed in Section 5.3.4.2.
There are also some non-trivial parts from the experiments reported here, including
the determined size distribution of the humic acid, one of the three macromolecules
under study (Section 5.3.1); and the verification of an invariant bulk concentration
under the experimental condition (Section 5.3.2). Subsequently, the evolution of the
fouling mechanisms and its evaluation methods are presented in Section 5.3.5. At
last, a summary concludes the findings in this chapter.
5.2 Materials and Methods
Three model feeds, representing two common types of macromolecules encountered
in water treatment, i.e., polymeric and humic substances, are used in a dead-end
filtration protocol. Two polymers, blue dextran and polyethylene oxide, were used
to model sequential pore blocking and cake filtration, while commercial humic acids
with a wide distribution of molecular weight were tested to perform the sequential
pore constriction, blocking and cake filtration model.
5.2.1 Macromolecular Samples
The chosen polymers are dextran blue (DB) (MW = 2000 kDa, Blue Dextran 2000,
GE Healthcare), a neutral polysaccharide, and polyethylene oxide (PEO) (MW = 100
kDa, Sigma-Aldrich). They are both linear flexible macromolecules, being neutral,
stable and water soluble, not interacting with most of the material of UF membranes.
Both of the polymeric samples were dissolved in filtered deionised (DI) water (MilliQ,
Millipore) and continuously stirred for 24 hours at room temperature (22 ◦C) before
the solution pH was adjusted to the range between 7.0 and 7.5 by doping small
amounts of 0.1 M HCl or NaOH solution, to make the 1.0 g/L stock solutions. Com-
mercial humic acids (HA) (Sigma-Aldrich) were used as model surrogates of humic
substances. Pre-weighed HA powder was dissolved in DI water (1 g/L) with the aid
of an increasing pH (to about 8 - 9) and constant stirring for 24 hours. The pH
values were measured using an Jenway 3345 ion meter (Bibby Scientific, UK). All
stock solutions were stored at 4 ◦C in the dark. The properties of materials were
summarised in Table 5.1.
72

Prior to filtration experiments, stock solutions were directly diluted with DI wa-
ter to prepare the working solution at the designated concentrations and the working
solutions were left in the environment for enough time to reach the working temper-
ature. The pH of the working solution was checked and kept at 7.25± 0.25. Except
for the HA stock, it was pre-filtered through 0.22 µm filter (PVDF, Millipore) to
remove non-dissolvable large particular debris before making any trial samples. The
pre-filtration of 1 L raw HA solution was conducted under TMPs between 30 and 50
kPa in a stirred cell (Model 8200, 63.5 mm diameter, Millipore) at a stirring speed of
275 rpm. After the filtration, the filter that contained rejected portions from the HA
raw stock, was carefully removed from the filtration rig, and dried at 105 ◦C for 3
hours in a furnace and cooled in a desiccator. After it has been dried, the fouled filter
was weighed on an analytical balance ( repeatability <= ±0.1mg, Model ED224S,
Sartorius), from which the weight of the fresh filter, predetermined before filtration,
was then taken out to derive the net weight of the rejected portion of the HA raw
stock. Based on this, a 200mg/L prefiltered HA stock solution was made from the
collected filtrate and pH was adjusted to 7.0− 7.5.
The concentration of DB was determined using UV/Vis spectroscope (UV1800,
Shimadzu, Japan) at 620 nm wavelength, while that of PEO was evaluated by the total
organic carbon (TOC) analyser (TOC-VCPH, Shimadzu, Japan) using the purgeable
organic carbon (NPOC) method. The TOC analyser was calibrated externally with
the solution of potassium hydrogen phthalate. The concentration of HA solutions
was determined spectroscopically at 254 nm wavelength and correlated with TOC
measurement.
The apparent molecular weight distribution of the HA samples was measured using
a membrane fractionation method originally developed by Aiken [231]. 50.0 mg HA
powders were dissolved in 1 L DI water for 24 hours and 50 ml of the sample solution
was then sequentially filtered by 0.22 µm PVDF microfilter, followed by PES 300 kDa
(Millipore) and RC 100, 50, 30 and 10 kDa ultrafilters (Ultracel YM, Millipore). The
filtration was performed in a stirred cell (Model 8050, capacity 50 ml, Millipore) at
dead-end mode under 50 kPa for the micro-filter, 100 kPa for the 300 kDa membrane
and 200 kPa for all the other UF membranes, respectively. A stirring speed of 275 rpm
was employed for all the filtration in the fractionation process. The fractional amount
within each MWCO range was calculated from the difference in the UV absorbance
between adjacent HA filtrate samples.
73

Table 5.1: Summary of materials used in the constant pressure UF experiments
Model material Dextran Blue Polyethylene Oxide Humic Acids
Source GE Healthcare Sigma Aldrich
Molecular Weight (kDa) 2000 100 <100 (ca. 70%)
Membrane RC, 100 kDa, hydrophilic, Millipore
Solution condition pH 7.25± 0.25, 22 ◦C
Concentration measuring TOC UV 623nm UV 254 nm, TOC
5.2.2 Filtration Setup and Protocol
All filtration experiments were conducted in a stirred cell (Amicon 8050, 43 mm
diameter, 50 ml capacity, Millipore) with an effective membrane area of 13.4 cm2. The
feed solution was stored in a metallic pressure vessel (5 L max. capacity, Millipore)
that was connected to the cell unit.
Figure 5.1: Set-up of constant-pressure ultrafiltration
The UF unit was operated in the dead-end mode at a constant TMP, supplied
and controlled by a nitrogen gas cylinder, without stirring for all experimental tri-
als. The avoidance of stirring in the cell is to minimise re-lifting of macromolecular
deposits from the membrane to the bulk phase by eliminating any removal forces at
the membrane surface, since the models to be verified assume that deposits will not
be released from the membrane. However, without stirring, the complete or partial
blocking process is promoted while pore constriction is reduced since large particles
will block the pores more easily. On the contrary, stirring can create shear forces on
74

the surface to remove large particles so that small particles will have more chances
to enter the pores.
TMPs were monitored using a pressure gauge. Permeate weight was monitored
continuously over the course of filtration and recorded in a known time interval
via a digital balance (Model FX-2000i, capacity 2200 g, readability 0.01 g, AND,
Japan) with a data-acquisition software (WinCT, AND, Japan) onto a computer (see
Fig. 5.1). The experimental trials were all conducted at 22 ± 1 ◦C in a temperature
controlled room.
The membranes used are made of composite regenerate cellulose (RC) with a
MWCO of 100 kDa (Ultracel YM, Millipore). This RC membrane is chosen for its
relatively low macromolecular binding and uniform structure, which serves better
for verification of the models proposed in Chapter 4, in spite of the fact that PES
and PVDF membranes are currently dominating the UF market. For each filtration
trial, fresh membranes were used. The new membranes were rinsed several times and
soaked in DI water overnight to remove the wetting agent before conducting filtration
experiments.
A typical UF protocol [84, 232] shown in the schematic of Fig. 5.2 was employed
to study the change of flux over the time as well as test the fouling reversibility for
different macromolecular feeds. At the beginning of each trial, fresh membrane was
first filtered with DI water at TMP of 200 kPa to allow membrane to be compacted
for about 2 hrs till the permeate flux became stable. Then, DI water filtration was
conducted sequentially at TMPs of 200, 150, 100 and 50 kPa respectively. The
temporal permeate flow was then calculated from the permeate weight measured
every 10s and the average flow rate over 30 min filtration under each TMP was used
to deduce, by linear regression, the hydraulic resistance of the clean membrane (Rm).
Afterwards, the feed solution in the pressure vessel was switched to macromolecu-
lar samples while the stirred cell was still filled with DI water. Resuming the hydraulic
pressure to the working TMP and keeping it constant, macromolecular UF started.
The permeate weight was again measured at the time interval of 10s and the macro-
molecular concentration in the permeate were examined at certain filtration time.
Most of the macromolecular filtration experiments were conducted for up to 4 hrs
unless the accumulated permeate weight was over the capacity of the balance.
After the filtration of sample feeds, the cell and vessel were emptied and refilled
with DI water and repressurised to the same working TMP to conduct water filtration
for evaluating the hydraulic resistance of a fouled membrane. The fouled membrane
75

Figure 5.2: Filtration protocol: (a) compaction; (b) stable DI water permeability test;(c) model feed filtration; (d) repressurising with DI water; (e) DI water backwashing;(f) water permeability test
76

was then taken out of the cell, rinsed with DI water and placed back to the cell in
a reverse orientation on a glass microfibres paper (as a supporting layer protecting
the membrane’s thin film from scratching). Backwashing at 250 kPa took place
to physically clean the membrane for a time sufficient to pass 1 L DI water and the
permeate concentration at the end was checked to make sure that a thorough cleaning
had been done. Then, the membrane was reoriented to its original position and the
hydraulic resistance to DI water permeation was again measured at the working TMP.
5.2.3 Bulk Concentration Measurement
In order to examine whether the bulk concentration changes during filtration under
the protocol used in this thesis, parallel filtration experiments were conducted for
taking the sample from the bulk at real time. A house-made stirred cell (25 mm
diameter, 16.5 ml capacity) with an extra outlet at the retentate side [233] replaced
the Millipore 8050 cell in the process train. Except this, all other experimental
conditions and protocols were kept same to replicate the situation in the experiments
discussed in section 5.2.2. During UF of macromolecular feeds, the point when the
TMP reached the designated value was counted as the start of filtration and 5 ml
retentate each time was collected from the middle height of the cell to a TOC vial
at certain volume intervals and the concentration was measured externally in either
spectrophotometer or TOC machine, depending on the feed type.
5.2.4 Model Numerical Scheme
The expressions of the complex fouling model took two forms depending on whether
or not there is pore constriction. The prediction of the permeate flux as a function of
filtration time is given by eqn 4.22 for Model A and by eqn 4.23 for Model B. Both the
equations involve a convolutional integration. In general, analytical solutions are not
available. Therefore, a numerical scheme of Euler integration was employed to solve
the equations; while the model coefficients were determined using the least square
curve fitting method by minimising the sum of the squared residuals between the
selected set of experimental flux-time data and the model calculations. For efficiency,
the time step in most cases was set at 1.0 s.
77

5.3 Results and Discussion
5.3.1 Molecular Size Distribution of HA
The goal of molecular size evaluation by the filtration fractionation method [231] was
to characterise the size of sample HA relative to the pore sizes of the membranes used
rather than to yield the absolute measures of the molecular weight. This technique
has been frequently used to evaluate the size distribution of NOM [68, 84]. A 50
ml unfiltered HA sample of 50 mg/L was filtered through a series of MF and UF
membranes in an order of descending pore sizes. The volume of each filtrate and its
concentration of HA were measured to evaluate the differences in the fraction of HA
passing successive membranes. This yielded a discrete size distribution of the HA
sample shown in Fig. 5.3.
Figure 5.3: Apparent molecular weight distribution for commercial humic acids sam-ples (Sigma-Aldrich) against various MWCO. Each bar represents the fraction of HAretained by the membrane to its right with smaller MWCO but passing the membraneto its left with larger MWCO. Black filled bars represent the fractional distributioncalculated from HA rejection by the whole series of membranes and the grey filled barsrepresent the distribution calculated after removing the fraction rejected by the 0.22µm Isopore filter. The error bars represent the standard deviation over three trials.
About 13% of the weight of the original HA sample was rejected by the 0.22 µm
filter. On the other hand, approximately 87% HA passing the MF membrane made
up of the prefiltered HA samples that would be used in the flux decline experiments.
For convenience, the molecular weight distribution was also calculated after taking
78

out the fraction rejected by the microfilter, represented by the grey bars in Fig. 5.3.
Therefore, more than 60% weight of HA in a prefiltered feed could pass the 100 kDa
UF membrane, of which the MW mainly lay between 50 and 10 kDa (approx. 40% of
the total weight), while 27% of the HA mass in the prefiltered feed would be rejected
by 300 kDa membrane.
5.3.2 Bulk Concentration during Filtration
Bulk concentration is assumed constant during filtration courses in the consecutive
fouling model, type A (eqn 4.22) and B (eqn 4.23), developed in Chapter 4. Therefore,
0 200 400 600 800 1000
Equivalent volume in cell 8050 (ml)
0 50 100 150 200 250 300 350 4000
0.2
0.4
0.6
0.8
1
1.2
1.4
Accumulated permeate volume, V (ml)
Norm
alis
ed b
ulk
concentr
ation, C
b (
−)
HUM
DEX
PEO
Figure 5.4: Bulk concentration in the house-made filtration cell during UF trials withthree different feed types (HUM - humic acid; DEX - dextran blue; PEO - polyethyleneoxide), as a function of the accumulated permeate volume. The three individual exper-iments were kept at same conditions (100 kPa TMP, 50 mg/L feed solution, 100 kDaRC membrane and no-stirring). The bottom x-axis is the permeate volume throughthe current cell (4.9 cm2 membrane area) while the top x-axis is the equivalent per-meate volume corresponding to the Millipore 8050 cell (13.4 cm2 membrane area) byassuming the permeate volume per unit membrane area is same in the two cells. Bulkconcentration was sampled at the middle height of the retentate side of the cell andnormalised by the feed solution concentration.
stirring was omitted in the filtration cell during our experiments in order to hold this
assumption, since this should prevent creating any mechanical forces above the mem-
brane upstream surface, which might release particles from the deposits. Although
79

deposited macromolecules may still return to the bulk phase via diffusion, this is not
likely to happen under high TMPs such as those involved in the experiments here
ranging from 50 to 200 kPa, given that the osmotic pressure of the macromolecules
is much less to be considered. For the size of the membrane pore and the macro-
molecules, used in the current experiments, the dead-end filtration is assumed.
Before the main set of fouling experiments started, the assumption of constant bulk
concentration under our UF protocol was evaluated in a specially designed filtration
cell [233], which has a capacity of 16.5 ml. The measurement of the bulk concentration
during selected UF experiments, covering all three feeds, is shown in Fig. 5.4. After
the DI water in the cell passed through the membrane within the first 20 ml permeate,
the bulk concentrations in the cell rose to the value of the feed solution in the external
vessel. Afterwards, the concentrations were kept relatively stable for all three cases
during a considerably long filtration course, where 400 ml (i.e., equivalent to over
1000 ml in Amicon 8050 cell with 50 ml capacity) solution was filtered.
The bulk concentration during UF of DB solution had a slight increase from
50 mg/L to approximately 60 mg/L at the end of filtration, while changes in the
other two cases were even less noticeable. The relatively small variation in the bulk
concentration over a long filtration time was also observed by Sarkar [223] in their
dead-end UF experiment of polysaccharides (pectin), where the feed concentration
was 3 g/L and stirring speed was set at zero. Therefore, the evaluation results should
verify the assumption that a constant bulk concentration held during filtration under
the experimental protocol used in this work. The value for the feed concentration can
be taken as the constant value for the bulk concentration during a filtration.
5.3.3 Effect of Bulk Concentration on Fouling
The effect of bulk concentrations of macromolecules on fouling was studied during
UF of sample solutions containing a single type of macromolecules. Meanwhile, the
consecutive fouling models were applied to compare with experiments and the model
parameters were determined for the three feed types respectively.
UF experiments were conducted in a filtration cell with a 50 ml capacity (Amicon
8050, Millipore )to evaluate the effect of bulk concentration on the behaviour of flux
decline for the three types of feeds, respectively. All UF trials carried out under
this investigation shared some common conditions, i.e., single type of membrane (RC
100 kDa) and one fixed TMP (100 kPa), except for varying the bulk concentration.
The subject of this study requires the macromolecular solution to be dilute to avoid
80

polymeric entanglement or aggregation of humic acids, and to allow a macromolecule
to be treated as a single particle. Therefore, the upper limit of the feed concentration
was set at 500 mg/L for DB and PEO solutions and 200 mg/L for HA. For each
condition, the filtration experiments were conducted in duplicates.
The resistance of a fresh membrane was determined first for each trial. The mean
value of the intrinsic membrane resistance for the batch of the RC 100 kDa membrane
based on 48 samples was calculated to be 8.24 ± 0.49 × 10¹¹ m−1. The steady-state
pure water flux under 100 kPa TMP was also determined in the meantime. Due to
the inherent membrane variability, the pure water fluxes for different trials varied,
but, within a relatively small range.
After the water flux was determined, the external reservoir was switched to a fresh
macromolecular working solution. In order to avoid any pre-deposition or adsorption,
the filtration cell would be left filled with DI water.
During UF of macromolecular feeds, the accumulated permeate weight was recorded
every 10 s to constitute the raw volume-time data set. Then, the permeate flux was
derived numerically using a Savitzky-Golay filter [234] to take the derivative of a series
of piecewise cubic polynomials fitting to the primary V -t data, in order to reduce the
noise existing in the raw data. The deduced permeate flux data were then normalised
by the initial pure water flux.
It took about 10-20 s to reach the designated TMP in the filtration cell after
the gas valve was switched on, which led to a flux-increase at the initial moment.
Therefore, the starting time for an experimental run was chosen at the moment when
the peak flux was achieved. This peak value was in close agreement with the pure
water flux at the same working TMP.
5.3.3.1 Case for Dextran Blue
The results for DB solutions are shown in Fig. 5.5. Its top plate displays the nor-
malised permeate fluxes (Jn) as a function of the filtration time for five trials with
different DB bulk concentrations (Cb). Generally, the scattered data points for each
trial at a particular Cb appear to resemble an exponentially decaying curve and can be
generally divided into two stages. The normalised flux declined rapidly at the initial
stage of the filtration, with an increased declining-rate at higher bulk concentration.
At later stage, i.e., towards long times, the flux tended to drop more gradually, and
even approach quasi-steady values for the higher Cb case. These curves were highly
81
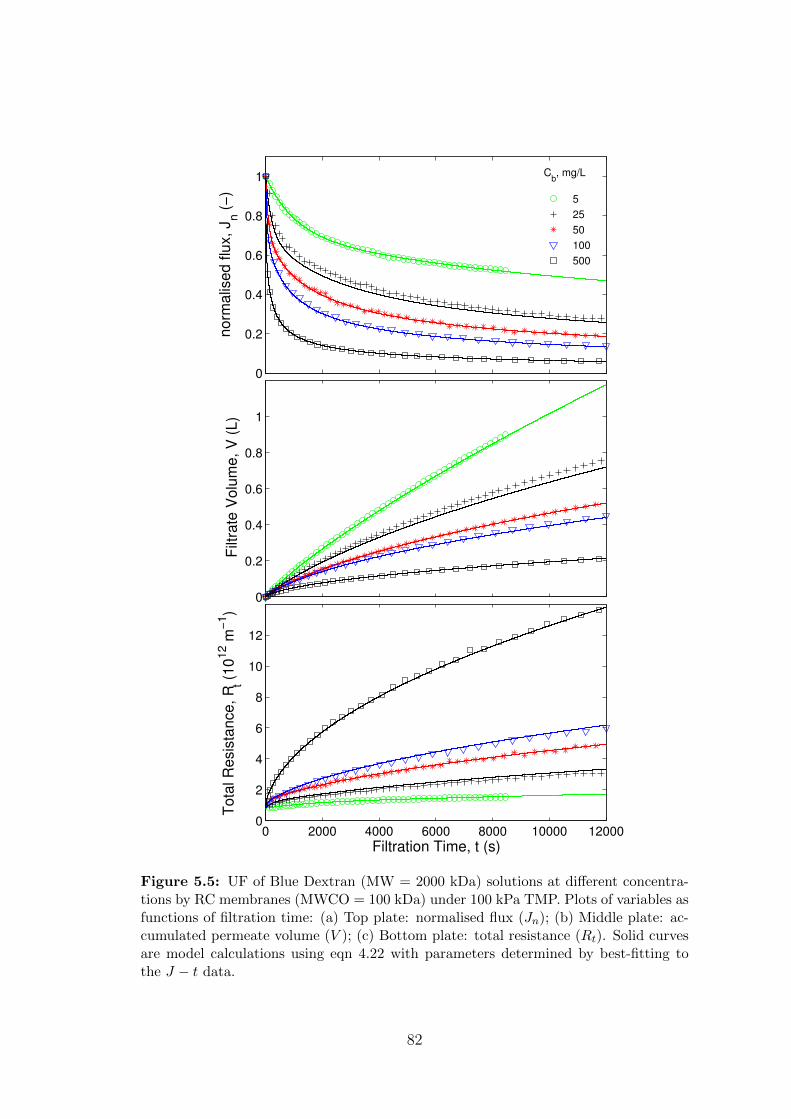
0
0.2
0.4
0.6
0.8
1
no
rma
lise
d f
lux,
Jn (
−)
0
0.2
0.4
0.6
0.8
1
Filt
rate
Vo
lum
e,
V (
L)
5
25
50
100
500
Cb, mg/L
0 2000 4000 6000 8000 10000 120000
2
4
6
8
10
12
Filtration Time, t (s)
To
tal R
esis
tan
ce
, R
t (1
012 m
−1)
Figure 5.5: UF of Blue Dextran (MW = 2000 kDa) solutions at different concentra-tions by RC membranes (MWCO = 100 kDa) under 100 kPa TMP. Plots of variables asfunctions of filtration time: (a) Top plate: normalised flux (Jn); (b) Middle plate: ac-cumulated permeate volume (V ); (c) Bottom plate: total resistance (Rt). Solid curvesare model calculations using eqn 4.22 with parameters determined by best-fitting tothe J − t data.
82

reproducible, with the data from repeat experiments differing by less than 10% for al-
most all sample points on the J− t plot. For clarity reason, only one of the duplicates
at each bulk concentration was selected to display.
Since the nominal size of the DB samples (MW = 2,000 kDa) is much larger than
the membrane MWCO of 100 kDa, the DB molecules are less likely to enter mem-
brane pores to cause internal fouling. Therefore, the potential fouling mechanisms
are limited to consecutive pore blocking and cake formation (Model A). Hence, the
solid curves in the J−t plot of Fig. 5.5 are the model calculations using eqn 4.22. The
values of the model coefficients, including the blocking constant (σ), the additional
blockage resistance (Rb), and the specific cake resistance (α) are determined by best
fitting to the experimentally measured permeate flux data in Fig. 5.5a. For each J− tcurve (one Cb condition) in this plot, a set of the three coefficients are produced. The
average value of each coefficient and its standard deviation are calculated among the
five curves and the results are listed in Table 5.2. This approach hence shows that
the model curves are almost perfectly fitted to each set of data in Fig. 5.5a since the
coefficients are chosen for each set (of different Cb). The verification of the model is
based on evaluation of the individually determined fouling coefficients in Table 5.2.
Under same TMP, for each macromolecular type, the coefficients are expected to be
independent of the change of Cb.
It is worth mentioning that not all of the measured data (originally obtained at
every 10 s) were used during the procedure of curve fitting in order to preserve the
shapes of the curve, because the two stages of flux decline were not equal in length.
For most trials, the early stage, that is characterised by the rapid flux decline, lasts
less than one-fifth of the total filtration time in Fig. 5.5, although the majority of flux
decline, in fact, takes place in this stage. In order to have the characteristic shape of
the rapid flux decline well preserved in the model, it is desired for curve fitting to have
a more balanced data sets, where the respective data points in the two stages should
be more or less equal. Therefore, most of the data points at the early stage were kept,
while the number of points at later stage were reduced. An automatic data selection
protocol based on volume-steps was developed for the purpose. In this protocol, it
only reads the data at a point when the amount of permeate volume increased from
the last selected point exceeds the required critical value, which was set typically
between 20 and 30 mL. Hence, Fig. 5.5 only shows these selected measures.
The model results show a very good agreement to the experimental data over the
entire filtration time for all five trials in Fig. 5.5. The model accurately describes
a rapid flux decline at the early stages of the filtration and a more gradual decline
83

towards the long time. Moreover, all of the three best-fit parameters were consistent
among the five trials, respectively. Their mean values along with standard deviation
were listed in Table 5.2. This proves these three parameters are all independent of
the bulk concentration, complying with the theory [30].
Table 5.2: The mean fouling model parameters from the best-fitting to the sets of UFat constant pressure of 100 kPa with varying bulk concentrations.
σ (m2/kg) Rb/Rm α(m/kg) β (kg−1)
DB (Fig. 5.5a) 1.7± 0.3× 10³ 0.46± 0.04 1.6± 0.2× 10¹⁴ 0
PEO (Fig. 5.6a) 3.1± 0.6× 10² 2.2± 1.6 4.1± 0.5× 10¹³ 0
HA (Fig. 5.7a) 81± 26 0.44± 0.31 4.2± 1.2× 10¹³ 7.2± 5.5× 10³
The middle plate in Fig. 5.5 displays the accumulated permeate volume (V ) against
the filtration time (t). The sample points are the raw experimental data at the se-
lected time. The solid curves represent the theoretical calculations obtained from
integrating the simulated J − t curves in the top plate of the same figure. As it dis-
plays, the model results fit well to the experimental data. Generally, the V − t curves
steadily rise but are gradually concave downward, deviating more and more from the
pure water curve towards the long time. For trials with higher bulk concentration,
this deviation is more obvious, i.e., the higher Cb the lower V . This complies with
the trend in the flux curves since lower fluxes lead to less permeation. At the end
of the filtration experiment, more than 1 L solution was filtered in the trial with Cb
equal to 5 mg/L, while only about 0.2 L solution passed through the membrane in
the one at 500 mg/L.
The filtrate flux data can be replotted as the total filtration resistance using the
relationship,
Rt =∆P
µJ. (5.1)
The results are shown in the bottom plate of Fig. 5.5, with the solid lines representing
the derived data from the fouling model calculations. Higher DB concentration led
to greater and faster increase in Rt, especially in the early stage. Towards the later
stage of the filtration, all five curves are concave down, which means the growth of
the resistance has become more gradual. As clear as those on the J − t plots, the
transitions from early to late stages are easily identified. This is especially apparent
for the curve with 500 mg/L bulk concentration.
Since the curves in the three graphs of Fig. 5.5 became more linear at the later
stage of filtration, the changes in the filtration status, then, tended to be slower.
84

Based on the model, this indicated the majority of membrane pores would have been
closed at the late stage and cake filtration played the major role in fouling. More
details on evaluation of fouling mechanisms were discussed later.
5.3.3.2 Case for PEO
The same experiments have also been conducted with solutions of PEO. The results
are shown in Fig. 5.6. Due to the size of PEO molecules (MW = 100 kDa) used was
about the size of the membrane pore size (MWCO = 100 kDa), the pore constriction
mechanism should not play any important role. Hence, the fouling model used here
was still A type (eqn 4.22) same to that employed in the case of DB, with two
possible mechanisms, i.e. pore blocking and cake filtration participating, and three
fouling parameters to determine.
Overall, the effect of bulk concentration on PEO fouling is similar to that in the
DB cases. Basically, higher concentration leads to more flux decline, less collected
permeate volume, and higher hydraulic resistance. However, in detail, the shapes
of their fouling curves were not exactly the same between PEO and DB cases. The
difference has been made quite clear on the J− t and R− t plots, which lies mainly at
the initial stage. The fluxes of PEO trials declined more rapidly at the early stage than
those DB counterparts at the same bulk concentration. For the trial with 100 mg/L
bulk concentration, the permeate flux dropped to approximately 30 % of its initial
value within 10 min of filtration. The decline was even more dramatic for the trial at
Cb = 500 mg/L, where the flux had plunged more than 80 % its original value in less
than 5 min. After this dramatic early stage, the flux decline turned into a much slower
and more steady phase, especially for trials at higher bulk concentrations, which had
a very sharp change in their curves. For example, the normalised permeate flux in
the 100 mg/L case was approximately 0.20 at the end of the 200 min filtration; while
it had already been about 0.26 by 20 min filtration. This means the last 3 h filtration
had only approximately 6 % contribution to the overall decline, which was marginal
compared to over 70 % drop in the first 15 min. Although when the bulk filtration
is lower than 50 mg/L the fouling curves are relatively smoother, the transitions
between the fast and slow decline stages in PEO trials were generally sharper than
those in the case of DB at each bulk concentration. This was exhibited in both the
J − t and R− t plots. On the other hand, the V − t plots didn’t reveal the distinctive
difference between PEO and DB trials, partly due to the present time scale, where a
comparatively long filtration course (up to 200 min) is displayed. The other part of
85

0
0.2
0.4
0.6
0.8
1
no
rma
lise
d f
lux,
Jn (
−)
0
0.2
0.4
0.6
0.8
1
Filt
rate
Vo
lum
e,
V (
L)
10
25
50
100
500
Cb, mg/L
0 2000 4000 6000 8000 10000 120000
2
4
6
8
10
12
Filtration Time, t (s)
To
tal R
esis
tan
ce
, R
t (1
012 m
−1)
Figure 5.6: UF of PEO (MW = 100 kDa) solutions at different bulk concentrationsthrough RC membranes (MWCO = 100 kDa) under 100 kPa TMP. Plots of variablesas functions of filtration time: (a) Top plate: normalised flux (Jn); (b) Middle plate:accumulated permeate volume (V); (c) Bottom plate: total resistance (Rt). Solid curvesare model calculations using eqn 4.22 with parameters determined by best-fitting to theJ − t data.
86

the reason is due to the intrinsic character of the permeate volume data, which will
be elaborated in Section 5.3.5.1.
Although PEO trials have more dramatical flux drop at early stage, DB trials
generally had lower fluxes at long times, comparing trials at the same feed concen-
tration. This trend is revealed more clearly on the R − t graph. Comparing the 500
mg/L trials from Fig. 5.5 and 5.6, the total resistance (Rt) of the PEO trial was
twice as much as that of the DB trial by 15 min. However, the increasing rate of the
resistance then slowed down greatly in the PEO trial, while the resistance growth in
DB trial decelerated as well but much more gradually and eventually became higher
than its counterpart until the end. Thus, at the end of the 200 min filtration, Rt of
DB filtration became 7 times of its initial value and almost double the final value in
the PEO trial.
The fouling model (type A) fitted well to PEO experimental data on the graphs,
but one of the best-fit parameters, the additional blocked-pore resistance, Rb, had
apparently greater variance between the values for each curve than that determined
in DB cases (see Table 5.2), of which the standard deviation was up to 73% of the
mean value; while the blocking rate, σ, and specific cake resistance, α, still had small
deviations in their values. The great deviations in the Rb values are possibly due to
the fact that the nominal size of the PEO molecules used in the study are of the same
order of magnitude with that of the pores in the RC membrane used. This might
cause a great varity in the way that a particular pore got blocked by the molecules,
which is an interesting topic by itself.
Comparing the mean values of the three parameters between the two types of
polymeric feeds, PEO trials resulted in greater Rb but smaller σ and α than DB
trials. The mean Rb value is nearly 5 times that in the DB cases, although its
blocking constant is about 5 times lower. Moreover, the Rb values of the PEO trials
were larger than the intrinsic membrane resistance while those of the DB trials were
smaller. This might be the reason for the great decrease in PEO fluxes occurring at
the early stage of filtration.
5.3.3.3 Case for Humic Acid
Besides these two polymeric macromolecules were used in experiments, HA solutions
were also filtered for comparing the effect of feed concentration. The results were
depicted in Fig. 5.7. However, the fouling model in this case was type B assuming
the participation of an additional blocking law, i.e. pore constriction, since the HA
87

samples had a big fraction (> 70%) could not pass the 100 kDa membrane. The
model fitted well to the experimental data in all the three plots of Fig. 5.7. The
values of the four best-fit parameters between trials at different bulk concentration
are, respectively, in good agreement. Their mean values were listed in Table 5.2 along
with those in DB and PEO cases.
Due to the low solubility of the HA at neutral pH, the feed concentration was
only tested up to 100 mg/L. Similar to the cases of DB and PEO, the fluxes of HA
trials declined constantly over the whole course and more rapidly at the beginning
for those with higher bulk concentration. However, comparing the trials at the same
bulk concentration across different feeds, trials of HA had overall higher fluxes, higher
volumes of permeate and lower total resistance than the other two feeds. Moreover,
in terms of the shape of the curves, HA trials have smoother transition between fast
decline at early time, and gradual decline being almost linear at late times, especially
when high concentrated trials are compared. For HA trials at low feed concentrations,
such as 10 mg/L, its flux decline curve cannot be staged in terms of the gradient, which
is almost in a nearly linear fashion over the whole filtration course. Its volume-time
and resistance-time curves have the similar linearity.
In order for better comparison across the three feed types, trials at 50 and 100
mg/L feed concentration, regarding all feed types, were all plotted in Fig. 5.8. At
both concentrations, HA trials maintained their fluxes higher than the other two
feeds, respectively. Therefore, they passed more permeates since the very beginning
of filtration as shown in the V − t plot.
All the J − t curves seem to possess multiple stages. The early stage is charac-
terised by its great and rapid flux descend. The curve is at its steepest in this stage.
The later stage is marked by the small and gradual decline in flux with a flatter
curve. PEO trials have clearly the most distinctive breakpoints between early and
later stages. They have the steepest descend at the early stage and most flat curves
afterwards. The switch between the stages is very sharp and sudden. The curves look
like being snapped into two almost straight sections. Especially for the curve after
the breakpoints, it has a good linearity (R2 > 0.99). HA trials do not have a clear
switching to divide curves into two distinctive phases on the graph. Their curves are
overall smoothest among all present curves. Therefore, the range of the fluxes in HA
trials is the least wide. DB curves have a shape, overall, similar to those of HA trials,
with gradual and continuous switch between stages, but they have great negative
gradients coinciding with the PEO curves at the beginning of filtration. Comparing
at 100 mg/L bulk concentration, the DB trial had as rapid flux decline as the PEO
88

0
0.2
0.4
0.6
0.8
1
no
rma
lise
d f
lux,
Jn (
−)
0
0.5
1
1.5
Filt
rate
Vo
lum
e,
V (
L)
10
25
50
80
100
Cb, mg/L
0 2000 4000 6000 8000 10000 120000.5
1
1.5
2
2.5
3
3.5
Filtration Time, t (s)
To
tal R
esis
tan
ce
, R
t (1
012 m
−1)
Figure 5.7: UF of prefiltered HA (MW distribution shown in Fig. 5.3) solutionsat different bulk concentrations filtered by fresh RC membranes (MWCO = 100 kDa)under 100 kPa TMP. Plots of variables as functions of filtration time: (a) Top plate:normalised flux (Jn); (b) Middle plate: accumulated permeate volume (V ); (c) Bottomplate: total resistance (Rt). Solid curves are model calculations using eqn 4.23 with 4parameters determined by best-fitting to the corresponding J − t data.
89

0
0.2
0.4
0.6
0.8
1
Norm
alis
ed F
lux, J
n (
−)
0
0.2
0.4
0.6
0.8
1
Accum
ula
ted P
erm
eate
Volu
me, V
(L)
50 mg/L
100 mg/L
0 0.2 0.4 0.6 0.8 10
1
2
3
4
5
6
Normalised Filtration Time, t (−)
Tota
l R
esis
tance, R
t (10
12 m
−1)
DEX
PEO
HUM
Figure 5.8: Filtration variables as functions of filtration time (a) top: normalised flux;(b) middle: accumulated permeate volume; (c) bottom: total resistance, showing trialsof DB, PEO and HA solutions at 50 and 100 mg/L, respectively.
90

at the first 5 min of filtration and then it slowed down and gradually switched to
its later stage. Hence, its flux was higher than that of the PEO trial after the first
5 min, but this didn’t last long. As the PEO trial proceeded into the slow-decline
stage at around 20 min, its rate of decline became, in fact, smaller. Although the
flux-decline rate in the DB trial gradually decreased till the end of 200 min filtration,
it was still higher than that of the PEO trial at the end. Therefore, at nearly 60
min, the DB trial eventually dropped its flux lower than the PEO. The R− t curves
basically inverse to the J − t ones have similar trends.
Comparing the mean values of fouling model coefficients σ, Rb, α and β in Table
5.2 for all three feeds, trials with HA had the least pore blocking coefficient (σ) while
DB cases had the highest. A hypothesis for the high σ in DB cases is that since
the size of DB molecules is much larger (MW=2000 kDa) than the membrane pore
size (MWCO = 100 kDa), it should be completely rejected by the membrane and
therefore contribute more to the surface coverage. The feed rejection was checked
during filtration, which had confirmed no trace of DB was detectable in the permeate
from the start to the end of filtration (10 ml each collected at certain time interval
). In terms of the membrane retention, HA was the least feed type among the three.
At the beginning, almost 50% weight of HA passed through the membrane with
flow. PEO had The 100 kDa PEO had the modest pore blockage rate on 100 kDa RC
membrane, but caused the highest resistance (1.7±1.1×10¹² m−1) when blocking the
pores, about 5 times greater than those in DB and HA cases where they had similar
values (3.9±0.3×10¹¹ and 3.6±2.5×10¹¹ m−1 respectively). Based on the molecular
size ratio hypothesis, PEO molecules can enter the depth of a membrane pore since
its size is close to the membrane’s while DB molecules cannot, which causes Rb from
UF of PEO molecules becomes greater than Rm of the membrane used. However,
PEO is not completely rejected by the chosen membrane, especially, at the initial
stage of filtration. The determined specific cake resistances, α, were similar between
PEO and HA feeds, but 3 times higher in DB cases. This attributed to the lowest
fluxes achieved in DB trials at the end of a long filtration.
5.3.3.4 Effect of Bulk Concentration on the Blocking Time
In order to see better the effect of bulk concentration on fouling, the density function
(eqn 4.18) and the cumulative distribution function (eqn 4.16) of the switching time
τ between different fouling mechanisms were depicted in Fig. 5.9 and 5.10 using the
parameters for DB cases.
91

0 100 200 300 400 5000
0.005
0.01
0.015
0.02
0.025
τ (s)
f (−
)
5
25
50
100
500
Cb, mg/L
Figure 5.9: The effect of the bulk concentration on the probability density function(eqn 4.18) of the blocking time τ using the mean value of σ for DB in Table 5.2.
0 1000 2000 3000 4000 50000
0.1
0.2
0.3
0.4
0.5
0.6
0.7
0.8
0.9
1
τ (s)
F (
−)
5
25
50
100
500
Cb, mg/L
Figure 5.10: The effect of the bulk concentration on the accumulated distributionfunction (eqn 4.16) of the mechanisms-switching time τ using the mean value of σ forDB trials in Table 5.2.
92

Physically, the density and cumulative distribution functions represent the block-
ing rate, i.e. the number of pores being blocked at time τ and the blocked portion,
i.e. the number of blocked pores by the time τ normalised by the total pore num-
bers, respectively. Since the distribution function took the form from the classical
complete blocking law, pore blocking has taken place very fast and the blocking rate
has decreased exponentially against the filtration time as shown in Fig. 5.9 while
the percentage of the blocked pores increased exponentially with the time as shown
in Fig. 5.10. According to these two figures, the bulk concentration has significant
impact on the blocking rate and percentage. For the feed solution at 5 mg/L, the
initial rate was very low so that only 1% pores would be covered at the very beginning
and afterwards decreased very gradually, almost levelling for the first 9 min. It took
more than 80 min to cover more than 99% areas in this case. On the other hand, for
the trial with 500 mg/L bulk concentration, the initial blocking rate was 10.3%, 100
times (exactly the ratio between the two Cb values) that of the trial with 5 mg/L.
It only took 1.2 min for the whole area being covered by the dextran deposits and
its blocking rate had an sharp exponential decay within such a short period for the
high concentrated trial. In order to quantify the impact of the bulk concentration,
we introduce a statistical term, i.e. the mean blocking time, 〈τ〉, which is the average
time before a random pore is blocked. It can be calculated as
〈τ〉 =1
kb. (5.2)
This yielded 994, 199, 100, 50 and 10 s for trials at 5, 25, 50, 100 and 500 mg/L,
respectively. This leads to the great divergence between curves of Cb = 5 and 500
mg/L in Fig. 5.10.
The distribution of the blocking time affects the growth of fouling cakes over the
membrane surface. The interplay between these two mechanisms is illustrated in
Fig. 5.11 for the trial with 25 mg/L DB solution. The total membrane resistance,
Rt, at each filtration time t was evaluated as a function of the blocking time τ using
eqn 4.7 with t0 = τ and the two parameters α and Rb previously determined in Fig.
5.5, and then normalised with Rm +Rb in order to show only the contribution of the
fouling cake. The blocked portion of the whole membrane area, F , was evaluated
using eqn 4.16, as a function of τ as well. These two quantities were then related to
each other via τ and drawn onto the same graph.
Figure 5.11 shows that the normalised resistance falls when the blocked portion
rises at every time during filtration. This reflects the calculation from the eqn 4.16
93

0 0.2 0.4 0.6 0.8 11
1.1
1.2
1.3
1.4
1.5
1.6
1.7
1.8
t = 1 min
t= 5 min
t= 10 min
t= 30 min
t= 60 min
Blocked Portion, F
No
rma
lise
d T
ota
l R
esis
tan
ce
, R
t/R0
Figure 5.11: Model calculations of total resistance Rt normalised with R0 = Rm +Rbas a function of the blocked portion, F , using best-fit parameters obtained in Fig. 5.5for 25 mg/L DB solution filtered through RC 100 kDa membrane at TMP 100 kPa.
and 4.7, i.e. the fraction of the blocked areas becomes larger when the blocking time
τ delays, while the cake resistance is lowered. The value for the total resistance
during cake-controlled fouling varies from the maximum at the region being blocked
at the very beginning when τ = 0, to the minimum, Rm +Rb at the region where the
pores are just blocked at τ = t. When the filtration time is short, large areas of the
membrane (approx. 78%) remained open in Fig. 5.11. The effect of cake filtration
was minor. Until after 10 min filtration, the majority of the membrane was blocked.
By 30 min filtration, all areas had been blocked. This figure also tells that since
the early stage, the inhomogeneity of the cake resistance over the membrane surface
existed. Area blocked earlier had the highest resistance over the whole filtration time.
As the filtration ran longer, the variation of the resistance between different regions
became larger (see the difference between the curves at t = 1 min and t = 30 min),
although the resistance was fairly close over much of the membrane surface. The most
difference occurred at areas only recently got blocked. Ho and Zydney [83] observed
similar trends in their protein MF experiments and explained that the cake growth
should be a self-levelling process, i.e., pores blocked first would have the greatest
resistance and thus the lowest flux, leading to the slowest rate of deposition of new
foulants.
94

5.3.3.5 Sensitivity Analysis of Fouling Parameters
The three fouling parameters (σ, α, and Rb) determined in this section are evaluated
using local sensitivity analysis. For each parameter, its sensitivity to the output of
the model, i.e., normalised flux, is evaluated individually by varying its value around
its optimised value shown in Table 5.2, while keeping all other parameters constant.
Figure 5.12 shows the sensitivity results for the pore blocking coefficient σ. The
0 1000 2000 3000 4000 5000 60000
0.1
0.2
0.3
0.4
0.5
0.6
0.7
0.8
0.9
1
filtration time, t (s)
norm
alis
ed
flu
x,
Jn
σ
100
0.01
10
0.10.5
Figure 5.12: Local sensitivity analysis for the pore blocking coefficient, σ, in the caseof 50 mg/L DB filtration at 100 kPa. The dotted points are the original experimentaldata, while the red solid line is calculated using the optimised value determined inTable 5.2. The dash lines represent the outputs calculated at variant σ values. Thenumbers next to these dash lines show the scale factors of σ.
effect of σ mainly contributes to the initial stage of flux decline. High values of
σ causes sharper and faster decline, while small values can have longer effect during
filtration although the flux decline curve shows less obvious transition between fouling
mechanisms. Small degree change of σ (10% difference, i.e. between 0.9 times and
1.1 times) does not change the shape of the curve visibly. When σ becomes 2 times
larger or half times smaller, the curves are affected visibly during the first 1000 s of
filtration, but are negligibly affected towards long time. However, once the change
becomes larger than 1 order of magnitude, the effect is apparent.
Figure 5.13 shows the results for the coefficient of specific cake resistance α. It
affects the later stage of filtration and the overall degree of flux decline. Its value
does not affect the filtration performance at a short period but flux becomes more
95

0 2000 4000 6000 8000 10000 120000
0.1
0.2
0.3
0.4
0.5
0.6
0.7
0.8
0.9
1
filtration time, t (s)
norm
alis
ed
flu
x,
Jn
α
0.01
100
0.1
10
0.5
2
0.9
1.1
Figure 5.13: Local sensitivity analysis for specific cake resistance, α, in the case of 50mg/L DB filtration at 100 kPa. The dotted points are the original experimental data,while the red solid line is calculated using the optimised value determined in Table 5.2.The dash lines represent the outputs calculated at variant α values. The numbers nextto these dash lines show the scale factors of α.
0 2000 4000 6000 8000 10000 120000
0.1
0.2
0.3
0.4
0.5
0.6
0.7
0.8
0.9
1
filtration time, t (s)
norm
alis
ed flu
x,
Jn
Rb
0.01
100
10
2
Figure 5.14: Local sensitivity analysis for the pore blocking coefficient, Rb, in the caseof 50 mg/L DB filtration at 100 kPa. The dotted points are the original experimentaldata, while the red solid line is calculated using the optimised value determined inTable 5.2. The dash lines represent the outputs calculated at variant Rb values. Thenumbers next to these dash lines show the scale factors of Rb.
96

sensitive to the variance of α at long time. 10% difference in its value has visible
effect on the flux values after approximately 2000 s filtration.
Figure 5.14 displays the effect of additional resistance of pore blocking, Rb, on the
overall flux decline curve. The effect of Rb is similar to that of σ since they are both
caused by pore blocking process. Small variations between 0.01 times and 2 times do
not affect the long term flux but have apparent impact on the flux in the short time.
The larger Rb becomes, the greater and faster flux decline appears. The flux decline
is relatively less sensitive to small Rb values but greater to large values. When Rb
becomes 2 order of magnitude larger, the flux decline process is controlled by it. Flux
at Rb at 100 times its optimal value drops to as low as approx. 0.03 after the first
500 s of filtration.
5.3.4 Effect of TMP
5.3.4.1 Experimental and Model Results
Figure 5.15 shows the effect of the TMP on the normalised filtrate flux, accumu-
lated permeate volume and membrane total resistance during the constant pressure
filtration of 50 mg/L Blue Dextran solutions, respectively. Before macromolecular
filtration, the pure water fluxes were determined at a wide range of TMP. The results
showed the RC 100 kDa membranes were almost incompressible within the test range
achieved up to 200 kPa and the pure water fluxes were reproducible after re-applying
the working pressure. Once macromolecular filtration started, the initial fluxes de-
scended more rapidly at higher TMP. Particularly, the flux decreased to less than 30
% of its initial value within the first 5 min of filtration at TMP 200 kPa. Then, the
decline of the fluxes became more gradual towards longer filtration time. Especially
for the trials with TMPs above 100 kPa, their curves almost reached a flat slope,
which were similar to those of the trials with high concentrations at 100 kPa. The
differences between the normalised final flux values at the end of the experiments be-
came narrower between those with high TMPs. The smallest gap occurred between
runs at 150 and 200 kPa, where fluxes dropped to approximately 15 % and 10 % of
their respective initial values.
On the V − t plot, the total volume of filtrate didn’t differ much between different
trials over the whole course of 200 min. Initially, these trials with higher TMP
cumulated more permeates at the same filtration time, indicating that they had higher
absolute fluxes at the beginning. However, higher pressure also caused higher decline
97

0
0.2
0.4
0.6
0.8
1
norm
alis
ed flu
x, J
n (
−)
DB
0
0.1
0.2
0.3
0.4
0.5
Filt
rate
Volu
me, V
(L)
50
100
150
200
TMP, kPa
0 50 100 150 2000
2
4
6
8
10
Filtration Time, t (min)
Tota
l R
esis
tance, R
t (10
12 m
−1)
Figure 5.15: Effect of TMP on UF of 50 mg/L DB (MW = 2000 kDa) solutionsthrough fresh RC membranes (MWCO = 100 kDa). Plots of variables as functionsof filtration time: (a) top: normalised flux (Jn); (b) middle: accumulated permeatevolume (V ); and (c) bottom plate: total resistance (Rt). Dots are sample date acquiredfrom their respective experiments and solid curves are model calculates using eqn 4.22with 3 parameters determined by best-fitting to the corresponding J − t data.
98

rate in flux as indicated in the J− t plot above, the slope of the volume-accumulating
curves became less steep, especially for the one with highest TMP. The total amount
of the permeate through the membrane at 200 kPa became less than that at 150 kPa
after only 30 min filtration and the gradient of its curve further decreased to be the
lowest among the whole sets. The 200 kPa trial collected even less volume than that
at 100 kPa at the end of the 200 min experimental run.
The effect of TMP on the total resistances became clearer when the filtration ran
longer as the discrepancy between each trial at different TMPs became larger and
larger with increasing filtration time. Due to the relatively small variance in intrinsic
membrane resistances, the initial values of Rt lay almost at the same position on
the y-axis in the scale presented in Fig. 5.15(c). Then, higher pressure led to more
rapid increase in Rt. Within merely 5 min, the value doubled for the run at 200
kPa. Although the great rate reduced soon after for the same set, the Rt still kept
increasing. To the end of 200 min, Rt at 200 kPa increased almost 10 times of its initial
value, and it was approximately 30 % greater than that at 150 kPa. In comparison,
the trial with the lowest TMP, i.e., 50 kPa had the least increase in Rt, of which the
end value is only about 1.5 times its initial value.
The solid curves in Fig. 5.15 represent the model calculations using eqn 4.22 of
the A model of the consecutive blocking scenario. Model parameters for each TMP
cases were determined by best-fitting to its corresponding J − t data. The model
results fit experimental data points well for all three graphs.
Similarly, Fig. 5.16 and 5.17 show the effect of TMP on the UF of PEO and HA
solutions, respectively. Both of their trials were at 50 mg/L bulk concentrations same
to those DB trials. The range of TMPs was between 50 and 200 kPa for all cases.
5.3.4.2 Comparison of Model Parameters
Figure 5.18 depicts the values of the four best-fit parameters as a function of TMPs,
for all trials shown in Fig. 5.15, 5.16 and 5.17. DB trials had the highest pore
blockage rate (σ) over those of other feed types in the range of TMPs tested. It
decreased almost linearly with increasing TMPs, of which the lowest value occurred
at 200 kPa, i.e. about one third of the peak value at 50 kPa. The blocking constants
for PEO trials were almost unaffected by the change of TMPs, which had a mean
value of 282.4±19.8 m2/kg, while those for HA trials had the lowest values, although
they slightly increased from only 11.9 m2/kg at 50 kPa to 184.6 m2/kg at 200 kPa.
99

0
0.2
0.4
0.6
0.8
1
norm
alis
ed flu
x, J
n (
−)
PEO
0
0.2
0.4
0.6
0.8
Filt
rate
Volu
me, V
(L)
50
100
150
200
TMP, kPa
0 50 100 150 2000
1
2
3
4
5
6
7
Filtration Time, t (min)
Tota
l R
esis
tance, R
t (10
12 m
−1)
Figure 5.16: Effect of TMP on UF of 50 mg/L PEO (MW = 100 kDa) solutionsthrough fresh RC membranes (MWCO = 100 kDa). Plots of variables as functionsof filtration time: (a) top: normalised flux (Jn); (b) middle: accumulated permeatevolume (V ); and (c) bottom plate: total resistance (Rt). Dots are sample date acquiredfrom their respective experiments and solid curves are model calculates using eqn 4.22with 3 parameters determined by best-fitting to the corresponding J − t data.
100

0
0.2
0.4
0.6
0.8
1
norm
alis
ed flu
x, J
n (
−)
HA
0
0.2
0.4
0.6
0.8
Filt
rate
Volu
me, V
(L)
50
100
150
200
TMP, kPa
0 50 100 150 2000
1
2
3
4
5
6
7
Filtration Time, t (min)
Tota
l R
esis
tance, R
t (10
12 m
−1)
Figure 5.17: Effect of TMP on UF of 50 mg/L prefiltered HA (approx. 60 % <= 100kDa) solutions through fresh RC membranes (MWCO = 100 kDa). Plots of variablesas functions of filtration time: (a) top: normalised flux (Jn); (b) middle: accumulatedpermeate volume (V ); and (c) bottom plate: total resistance (Rt). Dots are sampledate acquired from their respective experiments and solid curves are model calculatesusing eqn 4.22 with 3 parameters determined by best-fitting to the corresponding J − tdata.
101

Overall, the difference on blocking rate between trials with different feeds became
narrower with higher TMPs.
0
500
1000
1500
2000
2500
σ (
m2 k
g−
1)
0
1
2
3
4
5x 10
14
α (
m k
g−
1)
DB
PEO
HA
Feed Type
0 50 100 150 2000
0.5
1
1.5
2
2.5
3x 10
12
Rb (
m−
1)
TMP (kPa)0 50 100 150 200
0
2
4
6
8x 10
4
TMP (kPa)
β (
kg
−1)
Figure 5.18: The best-fit parameters determined for trials with 50 mg/L bulk con-centration at different TMP values. Parameters were presented as a function of TMPs:(a) top left: pore blocking rate, σ ; (b) top right: specific cake resistance, α; (c) bottomleft: the additional resistance caused by particles blocking a pore, Rb, and (d) bottomright: pore constriction coefficient, β, only applicable to HA trials.
The additional resistance caused by pore blocking (Rb), increased with increasing
TMPs in a similar fashion for both PEO and DB trials. PEO molecules, the one
with smaller sizes, caused higher resistances at each TMPs. Different from the two
polymeric feeds, HA caused the least resistance when it partially closed the pores at
most TMPs except for 50 kPa, where it had a slightly higher value than that for DB
trial. For HA trials, the additional resistance was almost invariant to the change of
TMPs.
The specific resistance of cake filtration (α) increased with increasing TMPs for
all three feed types. Over the whole pressure range, the highest values were obtained
in DB trials, while PEO and HA trials had similar values. The increasing rate of the
cake resistance was also higher in DB trials than those of the other two.
102

104
105
106
1013
1014
1015
TMP (Pa)
Sp
ecific
Ca
ke
Re
sis
tan
ce
, α
(m
kg
−1)
log α =1.1412*log TMP +8.5944
R2 =0.99624
log α =1.5763*log TMP +5.764
R2 =0.99535
log α =1.5806*log TMP +5.7005
R2 =0.98463
DB
PEO
HA
Feeds
Figure 5.19: Specific macromolecular surface layer resistance (α) as a function oftransmembrane pressure. Circle markers represent the best-fit results from the fluxdecline curves of the DB trials; squares are for PEO; triangles for HA. The solid linesare linear regression based on eqn 5.3, respectively.
103

The specific cake resistance data for the three macromolecular deposits are all
highly linear when plotted on a log-log graph in Fig. 5.19. This is consistent with the
commonly used power law relationship [16]:
α = a(∆P )s (5.3)
where a and s are empirical constants. The multiplier a is related to the size and
shape of the particles within the deposits, while the power s represents the cake
compressibility [83]. By linear regression, s and a have the values of 1.1 and 3.9 ×10⁸ mkg−1 Pa−1.14, with correlation coefficient r2 = 0.996. For both PEO and HA
trials, they had almost same s = 1.6 and very close a values, i.e. 5.8 × 10⁵ and
5.0× 10⁵ mkg−1 Pa−1.6, respectively.
5.3.5 Fouling Mode Determination
In the frame of classical blocking laws, the filtration constant, n, in eqn 2.2 determines
the fouling mode or mechanism according to the blocking laws. Numerical differenti-
ation of experimental data is sensitive to minor changes in the shape of the data sets,
since differentiation describes the slopes of a function at a point, i.e. a microscopic
property of a function. Any small noise in the original data can easily be enlarged
in its differential derivatives. Due to this inherent sensitivity of differentiation, the
Savitzky-Golay filter had to be used to smooth the flux data in the previous section.
Since eqn 2.2 is a second order differential equation, direct calculation from the orig-
inal volume-time data may cause a large deviation from the truth. Therefore, two
methods are tested using here, integral analysis by integration of the original data or
differentiating the polynomial resulting from the fitted model.
5.3.5.1 Integral Method
Integral analysis was recently proposed by Field and Wu [31]. The concept is to avoid
differentiation of the flux data. Since integration describes an overall or macroscopic
property of a function, it is not sensitive to minor changes in the shape of a function.
Equation 2.6 is rewritten into the integral form below,
∫ J
J0
−dJ
J2−n = K(n)
∫ t
0
(J − J∗n) dt = K(n)(v − J∗(n)t) (5.4)
104

where J∗ stands for a ’steady-state’ flux obtained when t towards infinity and its
value depends on the fouling mode, i.e. the n value. The v is the volume of permeate
per unit area defined in V = Av. The left-hand side (LHS) of eqn 5.4 is an integral
function of J and n, which has the integrated expression in terms of each n value
listed in Table 5.3.
Table 5.3: Expression in terms of absolute flux J or normalised flux J/J0 after inte-gration of LHS of eqn 5.4 for all four fouling constant n, respectively
n value 2 1.5 1 0
fn(J, n) J0 − J J0.50 − J0.5 ln(J0/J) 1/J − 1/J0
fn(J/J0, n) 1− J/J0 1− (J/J0)0.5 1− ln(J/J0) J0/J − 1
The first step is to qualitatively evaluate the existence of any change in mechanisms
during the filtration by assuming that J∗ tends to 0 and checking the linearity on the
plots of fn(J, n) vs v. If the filtration is a single-mechanism process, the plot should
show a straight line according to eqn 5.4. Otherwise, any non-linear behaviour on the
curve (fn(J, n) vs v) indicates more complex fouling mechanisms. Field and Wu [31]
have shown that ‘artificial’ fouling data involving consecutive two mechanisms will
manifest two sections of straight line with a breakpoint dividing them. For the present
experiment, the 50mg/L PEO filtration data under four different TMP are evaluated
in this way as shown in Fig. 5.20, which depicts non-linearity in the curves for all four
sets. The changing in the slopes of the curves in Fig. 5.20(a)-(c) is apparent, while in
Fig. 5.20(d) it is subtle. Therefore, Fig. 5.20 graphically shows the fact that complex
mechanisms are involved in the fouling and for all four subplots in Fig. 5.20, the data
towards the long term present a relatively straight line for each TMP. However, it is
still hard to tell which mechanisms are exactly involved.
Since the flux data at long time tend to be linear, they are plotted as fn(J, n)/t
against v/t to extrapolate the J∗ value. This is the second step in the integral analysis.
One of them (DB trial under TMP 200 kPa) is shown in Fig. 5.21. The fit for all four
n values are apparently all very good. From the gradient and intercept of the linear
regression , the long term flux, J∗ can be obtained in terms of different n values. For
the 200 kPa DB case, the values for J∗ are 78.4, 74.5, 71.7, and 13.4 Lm−2hr−1 for
n = 2, 1.5, 1, and 0, respectively. However, the fluxes derived from the primary data
had clearly the values below 70 Lm−2hr−1, which rules out the lines for n with values
other than 0. Therefore, the membrane in the 200 kPa DB case is likely to experience
cake formation at the late stage of filtration.
105

0
0.1
0.2
0.3
0.4
0.5
0.6
0.7
0.8
0.9
1
(a) n=2
1 −
J/J
0
0
0.1
0.2
0.3
0.4
0.5
0.6
0.7
0.8
(b) n=1.5
1−
(J/J
0)0
.5
0 10 20 30 40 501
1.5
2
2.5
3
3.5
v, cm3/cm
2
1−
ln(J
/J0)
(c) n=1
0 10 20 30 40 500
2
4
6
8
10
12
v, cm3/cm
2
J0/J
− 1
(d) n=0
50
100
150
200
TMP, kPa
Figure 5.20: Plots of normalised expressions of LHS of eqn 5.4 for different foulingconstant n vs. volume of permeate per filter area; First step in the integral analysis todetermine the breakpoint for trials of 50 mg/L DB solutions under various TMPs.
106

0.25
0.3
0.35
0.4
0.45
0.5
0.55
0.6
0.65
0.7
y =0.072297x + (−0.56652)
R2 =0.99762
(a) n=2
(1−
J/J
0)
/ t ,
hr−
1
0.2
0.25
0.3
0.35
0.4
0.45
0.5
y =0.051999x + (−0.38735)
R2 =0.99811
(b) n=1.5
1−
(J/J
0)0
.5)
/ t ,
hr−
1
10 12 14 16 181
1.5
2
2.5
y =0.24193x + (−1.734)
R2 =0.99814
v/t, cm/hr
(1−
ln(J
/J0)
/ t , h
r−1
(c) n=1
10 12 14 16 183.5
4
4.5
5
5.5
6
y =0.37443x + (−0.50077)
R2 =0.98976
v/t, cm/hr
(J0/J
−1)
/ t ,
hr−
1
(d) n=0
200
TMP, kPa
Figure 5.21: Plots of the normalised expressions of LHS of eqn 5.4, at different nvalues, divided by the corresponding filtration time respectively, against the volume ofpermeate per filter area divided by the filtration time using the time-volume-flux dataafter the switch point determined in Fig. 5.20 (200 kPa 50 mg/L DB trial) ; The dottedpoints represent the calculations from the measured data; the solid lines represent thelinear regression to the measured data.
107

In conclusion, integral analysis is a neat tool to qualify and visualise whether more
than one mechanisms involved during filtration. It may also give a quick evaluation
on the mode of fouling. It better uses the primary data obtained from filtration
experiments by avoiding the need to differentiate. Therefore, it barely requires com-
putational power. However, there lacks of physical meaning on the variables in the
plots. It is limited when there is no clear separation between different fouling mech-
anisms. For fouling at the initial stage, this method cannot distinguish the exact
modes.
5.3.5.2 Differential Method
By calculating the two derivative terms in eqn 2.2 from filtrate flux data, the constant
n can be calculated as:
n =d[log(d2t/dV 2)]
d[log(dt/dV )](5.5)
The required derivatives can be evaluated in terms of the filtrate flow rate;
dt
dV=
1
Q(5.6)
d2t
dV 2= − 1
Q3
dQ
dt(5.7)
with dQ/dt being a second-order derivative.
Direct differentiation on the experimental V − t data may enlarge the noise to a
great extent, especially at the second order. Therefore, the Q − V − t data, used in
this analysis, are from the model calculations, with the parameters predetermined,
since the fouling models have been proven capable of accurately predicting the flux
(or flow rate) and permeate volume with respect to the filtration time. Then, the
second derivative, dQ/dt, was evaluated numerically by taking the derivatives of many
third-order polynomials, piecewisely fitted to the simulated Q− t dataset, instead of
analytically differentiating the equation of the curve.
Figure 5.22, 5.24 and 5.26 show d2tdV 2 against dt
dVin log-log scale for both exper-
imental and simulated data of DB, PEO and HA trials presented in Sections 5.3.3
and 5.3.4, while Fig. 5.23, 5.25 and 5.27 show the evolution of filtration constant, n,
calculated from Fig. 5.22, 5.24 and 5.26, respectively.
In Fig. 5.22(a), the values for d2t/dV 2 reached a maximum value at low dt/dV ,
corresponding to the early time of filtration. After the peak value, d2t/dV 2 started to
108

106
107
108
109
109
1010
1011
1012
1013
dt/dV (s/m3)
d2t/
dV
2 (
s/m
6)
(a) TMP = 100 kPa
5
25
50
100
500
Cb, mg / L
106
107
108
1010
1011
1012
dt/dV (s/m3)
(b) Cb = 50 mg/L
50
100
150
200
TMP, kPa
Figure 5.22: Plots of d2tdV 2 versus dt
dV for DB trials: (a) at various Cb but same TMP(100 kPa) from Fig. 5.5; (b) at various TMPs but same Cb (50 mg/L) from Fig. 5.15.Dots represent experimental data. Solid curves represent model calculations.
0 10 20 30 40 50−5
−4
−3
−2
−1
0
1
2
t, min
n
(a) Feed = DEX, TMP = 100 kPa
5
25
50
100
500
Cb, mg / L
0 10 20 30 40 50−5
−4
−3
−2
−1
0
1
2
t, min
(b) Feed = DEX, Cb = 50 mg/L
50
100
150
200
TMP, kPa
Figure 5.23: The change of filtration constant, n against filtration time, calculatedfrom the simulation using model A for DB trials: (a) at various Cb (same 100 kPaTMP) ; (b) under various TMP (same 50 mg/L Cb).
109

106
107
108
109
1010
1011
1012
1013
dt/dV (s/m3)
d2t/
dV
2 (
s/m
6)
(a) TMP = 100 kPa
10
25
50
100
500
Cb, mg / L
106
107
108
109
1010
1011
1012
dt/dV (s/m3)
(b) Cb = 50 mg/L
50
100
150
200
TMP, kPa
Figure 5.24: Plots of d2tdV 2 versus dt
dV for PEO trials: (a) at various Cb but same TMP(100 kPa) from Fig. 5.6; (b) at various TMPs but same Cb (50 mg/L) from Fig. 5.16.Dots represent experimental data. Solid curves represent model calculations.
0 50 100 150 200−60
−50
−40
−30
−20
−10
0
10
t, min
n
(a) Feed = PEO, TMP = 100 kPa
10
25
50
100
500
Cb, mg / L
0 50 100 150 200−14
−12
−10
−8
−6
−4
−2
0
2
t, min
(b) Feed = PEO, Cb = 50 mg/L
50
100
150
200
TMP, kPa
Figure 5.25: The change of filtration constant, n against filtration time, calculatedfrom the simulation using model A for PEO trials: (a) at various Cb (same 100 kPaTMP) ; (b) under various TMP (same 50 mg/L Cb).
110

106
107
108
109
1010
1011
dt/dV (s/m3)
d2t/
dV
2 (
s/m
6)
(a) TMP = 100 kPa
10
25
50
80
100
Cb, mg / L
106
107
108
109
1010
1011
dt/dV (s/m3)
(b) Cb = 50 mg/L
50
100
150
200
TMP, kPa
Figure 5.26: Plots of d2tdV 2 versus dt
dV for HA trials: (a) at various Cb but same TMP(100 kPa) from Fig. 5.7; (b) at various TMPs but same Cb (50 mg/L) from Fig. 5.17.Dots represent experimental data. Solid curves represent model calculations.
0 50 100 150 200
−0.4
−0.2
0
0.2
0.4
0.6
0.8
1
1.2
1.4
t, min
n
(a) Feed = HUM, TMP = 100 kPa
10
25
50
80
100
Cb, mg / L
0 50 100 150 200
−0.4
−0.2
0
0.2
0.4
0.6
0.8
1
1.2
1.4
t, min
(b) Feed = HUM, Cb = 50 mg/L
50
100
150
200
TMP, kPa
Figure 5.27: The change of filtration constant, n against filtration time, calculatedfrom the simulation using model B for HA trials: (a) at various Cb (same 100 kPaTMP) ; (b) under various TMP (same 50 mg/L Cb).
111

decrease, resulting in a negative slope, i.e., a negative filtration constant n in eqn 2.2.
At the later stage, the curves reaches an asymptotic plateau in the plot for all the
cases, at which the filtration reaches a ‘pseudo-steady’ state, where the ratio between
dQ/dt and Q3 becomes constant. This typical pattern of the curves (the maximum
and asymptote) was also observed during MF of protein solution by Ho and Zydney
[83], and Duclos-Orsello et al. [88]. The derivations from experimental primary data
(scattered points with markers) matched relatively well with those from simulation
(solid curves), although more noises appeared in the former.
The difference between trials with different feed concentration manifested in the
position and the shape of the curves. Higher bulk concentration caused faster fouling,
higher flux decline rate, dQ/dt (see Fig. 5.5), and lower absolute fluxes in most times,
hence, leading to higher d2t/dV 2 in eqn 5.7. Therefore, curves with higher bulk
concentration are generally at higher positions in Fig. 5.22. The initial fluxes between
the trials of different Cb were almost same since these trials were all conducted under
the same TMP, while the long-term fluxes became much lower in the trials with higher
Cb since fouling was more severe under higher Cb . Therefore, the difference between
initial and long-term fluxes became larger when bulk concentration was higher. Hence,
the data range, corresponding to higher Cb, spreads wider on the axis of dt/dV .
Furthermore, the asymptotic plateau of the ‘pseudo-steady’ state at high dt/dV was
also across larger range of dt/dV for higher Cb trials.
The filtration constant n in eqn 2.2 were plotted in Fig. 5.23 against filtration
time, which was calculated from the slopes of the curves in Fig. 5.22. The initial n
values were 0.14, 0.18, 0.27, 0.49 and 1.4 for feed concentrations at 5, 25, 50, 100
and 500 mg/L, respectively. None of them approached to 2.0, i.e., a pure complete
blocking case. From the beginning of filtration, n values kept decreasing till a lowest
value well below 0. After the bottom stage, n rose back and held constant at a value
approximate to 0 for the rest of filtration time, indicating cake filtration dominant in
the long run. However, none of the initial and negative n values could be explained
by any single mode of classical blocking laws, indicating that these filtration trials
underwent complex fouling phenomena. Based on the consecutive complex fouling
model developed in Chapter 4, the irregular n values were likely to result from the
simultaneous interactions between different mechanisms, i.e. pore blocking and cake
filtration. However, since the coefficient n is calculated by differentiating twice V
with respect to t (eqn 5.5), the possible errors in the model used to generate the data
can have large impact on the values of n.
112

Bulk concentrations affect the duration of the transition from the initial positive
n values to eventual 0. Higher concentration has the shorter transitional time. For
example, 500mg/L filtration took less than 4 min to reach a constant n value, while
the 5mg/L run needed more than 180 min. This was the reason that the curve
for 5 mg/L solution in Fig. 5.22(a) had a short plateau at high values of dt/dV ,
corresponding to later filtration time, since the recorded filtration lasted only 200
min while the transition took 180 min to reach the pseudo-steady state.
Given that the assumption of no back transport of deposits, the total weight of
deposits was simply calculated from the corresponding permeate volume collected at
the time, times the feed concentration. At the time when n approximated to 0, the
amount of DB deposits were between 5−10 mg for all the five cases in Fig. 5.23a.
Fig. 5.22b and 5.23b show the comparative results for 50 mg/L DB trials under
different TMPs. Since the initial fluxes changed under different pressures, these foul-
ing curves started at different dt/dV . The data obtained at the higher TMPs started
at lower values of dt/dV due to the higher initial flux. At low TMP, e.g, 50 kPa,
the curve does not have the characteristic peak plateau, where its slope transits from
positive values to negative; instead, it starts with a negative slope (n = −2.9) at
the beginning of filtration. On the other hand, the other curves, representing the
trials with TMPs higher than 100 kPa, all had the transitional peaks in their shape.
Especially at 200 kPa, both experimental data and model calculations showed a more
distinctive linear increase of d2t/dV 2 in terms of dt/dV on the log-log graph during
early stage of filtration. The resultant slope for the first 150 s filtration was equal
to 1.23 calculated from linear regression of the limited experimental data points with
a correlation coefficient, r2 = 0.994. It is known that the slope should be equal to
2 given that the filtration is controlled by only complete pore blocking. Apparently,
this is not the case. After approximately 25 min filtration, the fouling was dominated
by the cake filtration for all the four trials. The period of mechanisms transition
is similar between trials under different TMPs in Fig. 5.23b, which is different from
the Cb-varying case in Fig. 5.23a. The fouling curves at high TMPs (150 and 200
kPa) have a slightly less steep decline between the peak and the asymptotic values of
d2t/dV 2 . This corresponds to generally less negative n values in Fig. 5.23b.
In comparison with the DB cases, the fouling curves for PEO trials in Fig. 5.24 also
show the characteristic peak and asymptotic plateaus. However, PEO curves have
more distinctive steady-increase in d2t/dV 2 at the low dt/dV range corresponding to
early filtration time. This trend is more noticeable in curves associated with high Cb
or high TMPs, since the degree of flux decline at high Cb (see Fig. 5.6) or high TMP
113

(see Fig. 5.16) was greater, leading to a longer rising stage of the curves at small dt/dV
values in Fig. 5.24. The steady increase appears almost linear in the log-log scale.
Fouling curves at higher Cb or higher TMP possess more positive slopes. For example,
the initial n value calculated using eqn 5.5 is nearly at 2 for the 500 mg/L case (see
Fig. 5.25a), which is a strong indication of the classical complete pore blocking since
it predicts a slope at 2 on the same type of plot. The derivatives from experimental
measure in the 500 mg/L trial were not placed around the corresponding theoretical
curve in Fig. 5.24a. This is due to the fact that the fouling in this case took place
too fast (within the first 10s, its permeate flux had dropped 70 %) to be recorded
in the experimental condition used here (the interval between each record was set at
10 s). For other PEO trials, the theoretical derivatives coincide relatively well with
experimental derivatives.
Similar to DB cases, the temporal n values in Fig. 5.25, calculated from the
theoretical curves in Fig. 5.24, reveal the intrinsic difference between the different
trials. At high bulk concentration, the fouling exponent index n drops faster and
deeper in Fig. 5.25a, corresponding to the fact that the curves of d2t/dV 2 vs. dt/dV ,
at higher Cb in Fig. 5.24, have steeper slopes at the transition from the peak to the
asymptotic plateau. It appears that the filtration at 10 mg/L and 100 kPa has not
reached the pseudo-steady state at the end, since the derived n index did not reach
the stable value at 0 yet in 200 min filtration, shown in Fig. 5.25a. For the trials at
50 mg/L, the difference in TMP causes the variance in the n profiles in a similar way
as those in DB cases. The index n varies greater at low TMP. However, unlike those
in DB cases, the trials of PEO at low TMP requires more time to approach to the
eventual 0 point.
Figure 5.26 and 5.27 depict the fouling curves for HA filtration. The curves in
both figures have generally different shapes to those of DB and PEO trials. In Fig. ??,
the fouling curves of HA trials only show a diminished hump. For the smaller dt/dV ,
the second-derivative term slowly increases and gradually flattens out so that the
positive slope decreases. For the trial at Cb = 100 mg/L, after a vague peak, the
curve dip marginally and level off eventually, and for trials at Cb < 100 mg/L, their
curves have not yet held steady at the end of 200 min filtration; while for trials at
Cb = 10 mg/L or TMP = 50 kPa, their curves have only a rising stage within the
studied range.
The flattened shape of HA fouling curves is reflected in the corresponding n profiles
in Fig. 5.27, which do not display the nearly symmetric ‘U’ shape like those in PEO
and DB cases, but, instead, a drop to certain values slightly below 0 at a moderate
114

rate followed by a gradual bounce back towards 0. However, for bulk concentrations
lower than 50 mg/L, n profiles only consist of a constantly declining curve within the
200 min filtration. It is only in the curve associated with conditions of 50 mg/L feed
solution and 200 kPa TMP that a relatively sharper transition can be observed.
The unique pattern in the fouling curves and n profiles in the case of HA ul-
trafiltration, compared to the other two large macromolecular cases, is likely due to
the smaller size of the HA molecules, which allows the pore constriction to process
gradually and longer, and prevents the fast complete blocking process. Therefore, the
transition between different phases of fouling is less dramatic in the case.
5.4 Summary and Remarks
Macromolecular fouling is a complex phenomenon even when only one type of macro-
molecules existing in the feed. In order to describe the process preciously, the com-
bined blocking models formulated in Chapter 4 were employed to fit experimental
filtration data for three types of feeds, including Dextran Blue (DB), Polyethylene
Oxide (PEO), and Humic Acid (HA), to obtain a better understanding of the fouling
mechanisms involved in UF of dilute macromolecular solutions under constant TMP.
There were several findings concluded in the three main areas as follows:
5.4.1 Model Applicability
In the study, size exclusion is assumed to be the main filtration mechanism. Then,
the relative size of the macromolecule to the pore size of the membrane is the criterion
to choose the form of the model.
For DB and PEO molecules, they have sizes larger than or comparable to the pore
size. Their fouling behaviours were expected to be similar, which was indeed verified
in the work. For them, the model (namely Model A), then, comprises two blocking
laws, i.e., pore blocking and cake formation, with three coefficients to be determined
by curve-fitting, namely pore blocking rate (σ), additional resistance (Rb), and specific
cake resistance (α).
The HA used in the study has a broad size distribution, with main portions smaller
than the pore size of the 100 kDa membrane. The model for this case (namely Model
115

B) has one additional mechanism, i.e., pore constriction, including an extra coefficient,
i.e., pore constriction rate (β).
Models were fit to the experimental flux-time data to determine the coefficients.
The results showed a good fit between the model and experimental data, on the flux-
time, volume-time, and resistance-time plots for each feed type, respectively. The
consistency in the values for each coefficient determined under conditions of various
bulk concentration (Cb) has been proven good, especially, in the case of DB.
5.4.2 Filtration Parameters
The effect of bulk concentration (Cb) and TMP was investigated in the experiments,
respectively. Generally, higher Cb or higher TMP is found to cause faster pore clo-
sures. In the flux decline graph, trials under these conditions have faster and greater
decline at the early stage, and hence more obvious transitions between early and late
stages.
The four model coefficients are dependent of the macromolecular type. In theory,
they are expected to be independent of Cb which are well verified in the case of DB
but there are rather large variations in some coefficient values in the case of DB and
HA, for example, Rb of DB and β of HA. Some coefficients also change with a varying
TMP. For example, the effect of TMP on the specific cake resistance (α) has been
shown following a well-known power-law correlation for all three feeds.
Moreover, for other coefficients, TMP has inconsistent effects for different feeds.
For instance, DB case has the pore blocking rate (σ) decreasing under an increasing
TMP, while the PEO and HA cases have constant σ within the tested TMP range
(50 - 200 kPa). The increase in TMP also results in an increasing Rb in the case of
DB and PEO, but does not affect that in HA case. The specific functions for the
coefficients, σ, Rb and β, are not totally clear. In general, the four model coefficients
are determined by the characteristics of the feed macromolecules.
5.4.3 Evolution of Fouling Mechanisms
Experimental results showed multiple stages during flux decline and resistance rise
in UF of any one of the three feeds. The explanation, based on the complex fouling
scenarios related to the models, is due to the sequential change of dominant fouling
mechanisms through the filtration course.
116

At the pore scale, Model A predicts that pore blocking takes place first and then
further deposits can build upon the blocked areas to form fouling cakes, while Model
B, being essentially a more general case of Model A, assumes that small particles
deposit inside the membrane pore before it is blocked by large particles, i.e., pore
constriction can happen only before the pore is closed. Over the whole surfaces,
spatial variance exists, which permits different areas in the membrane surface to be
in different stages.
Applying integral analysis to the primary experimental data clearly showed the
breakpoint of fouling mechanisms switching and helped determine the dominance of
cake filtration at the later stage of filtration. Differential method using the model
calculations confirmed this finding, and further revealed that the early stage of fouling
is a complex situation, controlled by the interplay of different mechanisms at the
same time. This mixture of mechanisms at the macroscopic level is due to the spatial
variation, represented by the blocking time distribution in the models.
Differentiation on the model calculations can explicitly determine the fouling index
n used in the classical blocking theory, and hence can be considered superior in terms
of fouling mechanisms study. However, integral analysis avoids complicated numerical
computation and prevents amplifying the noise existing in the experimental data, and
is really useful when there is a clear cut in the data. Therefore, integral analysis is
preferable for being a quick and neat tool to check the raw data at the first place.
117

Chapter 6
Examination of Macromolecular
Deformation in UF and Its Impact
on Fouling
6.1 Introduction
In the last chapter, membrane fouling was analysed using combined fouling mod-
els. The determined fouling parameters indicate the changing in the experimental
conditions may trigger behavioural changes in the macromolecules, leading to some
specific impacts on fouling. The large macromolecules used in this work, including
both DB (MW = 2000 kDa) and PEO (MW = 100 kDa), are linear polymers, pos-
sessing flexible long chains in their molecular structure. In general, such molecules
are well known for their deformability in a flow field [235]. There have been a few
extensive studies both theoretically and experimentally on the relative flow-induced
transformation of linear chains. Although some researchers [236–239] have observed
the forced permeation of macromolecules in UF during recent years, none of them
have studied linkage between the polymeric deformability and membrane fouling.
Therefore, in this chapter, the effect of macromolecular deformability on UF fouling
will be discussed in the light of some observations during experiments conducted in
the previous chapter. Before presenting our results, a brief review of the literature
regarding UF of deformable macromolecules is introduced. Note that the present
work is restricted to dilute macromolecular solutions.
118

6.2 Review on UF of Deformable Macromolecules
From a pure steric viewpoint of UF, regardless of any specific interactions between
solutes and the membrane, the solutes with smaller sizes than the pores can pass
through the membrane while those of a size comparable to or larger than the pore
sizes will be retained by the filter. This is true for rigid solutes with fixed shapes. For
example, protein typically having a globular structure with relatively little molecular
flexibility is often treated as a rigid sphere in UF studies [240]. In the dilute regime,
therefore, the parameter that controls the passage of a macromolecule is the ratio
λ of the molecular dimension to the pore size. For λ > 1, the macromolecule will
be excluded by the membrane. For λ < 1, macromolecules can enter the pores and
may eventually transfer into the permeate side, and their transport in the pores
has been well studied using the hydrodynamic hindrance theory by assuming each
macromolecular solute as a hydrodynamic particle enduring hindered movement in
the confined space, i.e., a pore [241–243].
However, this theory does not work well with deformable macromolecules when
they have λ > 1 in a filtration process due to some other aspects related to their
characteristic molecular structures. For example, their non-spherical molecular shape
solutes will cause them to sacrifice rotational freedom [244], and their flexible nature
will lead them to sacrifice conformational freedom to enter the channel [245]. This
will come at an entropic energy cost which can greatly reduce the partitioning effect
at the pore entrance, i.e., the probability to enter membrane pores [246].
Moreover, soluble polymeric macromolecules naturally adopt a conformation of
random coils and are tightly filed in a static and dilute condition. Their molecular
chains undergo random motions in the solution, and hence, the random variations in
their molecular shapes are constant.
Furthermore, these randomly-coiled polymeric chains are well-known to be flexi-
ble, which can deform when they are perturbed. For example, when such a macro-
molecule is exposed to a shear flow, its molecular shape may be distorted because of
the difference in velocity between the two sides of the random coil [247]. In theory,
the conformation of a deformable linear polymer chain can change from a random coil
to a stretched one under a flow velocity gradient if the product of the strain rate and
the largest relaxation time of the unperturbed chain is larger than a certain threshold
[236]
In UF, a relatively fast converging flow field will exist at the pore entrance when
a TMP applies. If the flow is fast enough to set up a sufficiently high longitudinal
119

gradient at the pore entrance, a flexible macromolecule will be stretched in the flow
direction to such a point that the macromolecule arrives at the pore entrance with
a transversal section smaller than the entrance diameter [248]. Then, this macro-
molecule may enter and eventually pass through a pore much smaller than its unper-
turbed size. This phenomenon is often regarded as the flow-induced translocation of
linear polymer chains.
According to the theory of de Gennes [249], a linear polymer chain can undergo a
sharp transition from coiled to stretched state when its surrounding velocity gradient
reaches a ‘critical’ value. Such phenomenon has been observed in several experimental
studies. For example, Perkins et al. [235] and Smith et al. [250] observed the con-
formational change of a single DNA molecule in an elongational and a steady shear
flow field, respectively. Although the ‘sharpness’ of the transition is still in debate,
the theory essentially guided to develop the ‘affine stretching model’ to describe the
penetration of linear polymer chains into cylindrical pores driven by solvent flow. To
apply their theoretical calculation to membrane filtration case, Nguyen et al. [247]
assumed that:
• The membrane surface has only circular, uniform, equidistant pore openings.
• The polymer adsorption on the solid surface is negligible.
• The flow near the membrane surface is laminar, unperturbed and of negligible
inertia.
• The fluid is not agitated
Using the scaling approach [249], Daoudi and Brochard [248] evaluated the static
partition coefficient (i.e., the ratio of the solute concentration inside the pore to the
solute concentration outside ) of polymers in a good solvent for both dilute and semi-
dilute solutions.
Hirasaki et al. [251] examined DNA filtration through membranes with mean pore
diameters of 15 and 35 nm. They observed that the fractional transmission for the
DNA was significantly larger than that for globular proteins of comparable molecular
weight and transmission of larger linear DNA increased with increasing TMPs. The
high transmission of the DNA was attributed to the elongation or deformation of the
DNA molecules due to the shear stress associated with the filtrate flow.
120
Recently, Jin and Wu [236] observed a discontinuous transmission during UF
experiments of flexible linear polymer chains (Polystyrene, λ > 1) using a specially-
designed double-layered membrane, which was specially designed to prevent interac-
tion among flow fields generated by different pores. This was the first experimental
proof of the predicted ‘first-order’ transition by de Gennes [249]. Then, the flow-
dependent permeation of long linear macromolecules of high molecular weight through
small pores has also been reported during UF of dextran (2000 kDa) [238], PEO (1000
kDa) [239], and biopolymers such as DNAs [237, 240, 252]. It is worth mentioning
that the later experiments were conducted on common polymeric membranes and the
results showed a gradual change in polymeric permeation by varying the permeate
flux instead of a sharp change observed by Jin and Wu [236].
6.3 Experimental Observations on Sieving and Foul-
ing
During the experiments presented in the last chapter, the permeate concentration,
Cp, was measured by collecting 5 ml permeate at particular time points during a
filtration. Then, these data were used to calculate the observed sieving coefficient;
So =CpCb
(6.1)
where the bulk concentration, Cb, has been proved to be same as the feed concen-
tration. This type of information was commonly used in other studies [237–239] to
evaluate the flow-induced transmission of large polymers in UF, while in the present
work, this information was used to investigate the relationship with the membrane
fouling, particularly, pore blocking phenomena at the early stages of filtration.
6.3.1 Macromolecular and Pore Size Estimations
Firstly, the dimensions of the macromolecules and membrane pores were quantified
in order to show the size comparison between them.
The Ultracel RC 100 kDa membrane used in the present experiments has been
estimated to have porosity (ϕ) at 0.5 in several studies [252, 253]. The thickness of
121

the membrane skin layer (δm) was estimated as 1.0 µm [252]. The mean pore radius
(rp) was then calculated using the Hagen-Poiseuille equation as :
rp =
(8δmLpϕ
)1/2
(6.2)
where the membrane hydraulic permeability was determined using
Lp =1
Rm
=Jµ
∆P(6.3)
from the DI water filtration experiments conducted for each fresh membrane, which
gave a mean value at 1.22± 0.07× 10⁻¹² m. The mean pore radius is thus estimated
to be approximately 4.4 nm. The estimated value depends upon the assumptions and
varies between 1.6 and 7.0 nm when it is calculated using assumed thickness from 0.2
to 1 µm and porosity from 20 to 80 %.
The dimensions of polymers in solution are usually measured using the radius of
gyration, rg, and hydrodynamic radius, rs. They are both statistical averages over
the many configurations of the molecule due to its random motion. For the two
polymers, DB and PEO, used in this work, their sizes were estimated using empirical
correlations in the literature.
For general dextran solutions, the following correlation was used to estimate the
hydrodynamic radius [238, 254]:
rs = 0.0282(MW )0.47752 (6.4)
with rs in nm and MW in Da. Hence, the dextran blue used in the work with a
nominal molecular weight (MW ) of 2×10⁶ Da was calculated to give rs equal to 28.8
nm, and its radius of gyration (rg) was then estimated from the rs value according
to the Zimm model [8, 238] to approximately 45.0 nm. These two estimated values
were in good agreement with those recorded in the literature [255].
For the PEO (MW = 1× 10⁵ Da) used here, the following relationship [256] was
used to determine the hydrodynamic radius;
rs = 0.0145(MW )0.57 (6.5)
which gave rs equal to 10.3 nm. Then, from the Zimm model [8], the radius of
122

gyration was estimated approximate to 16.1 nm.
6.3.2 Effect of TMP on Sieving Coefficient
6.3.2.1 Temporal Variation of Sieving Coefficient
Fig. 6.1 shows that the observed sieving coefficient, So, changes during 50 mg/L DB
filtration experiments under different TMPs. At the beginning of the filtration, higher
sieving coefficients were observed in trials under higher TMPs. For trials under 50
kPa TMP, negligible amounts of DB molecules passed through the membrane at all
times, but the sieving coefficient reached almost 0.7 and 0.6 for trials under 200 and
150 kPa, respectively.
From the estimation, the molecules of DB samples used in this work have a consid-
erable larger size than that of the pores. Therefore, if the molecule is not deformed,
it should not be able to pass the pores, and instead, it will block the pores when ar-
riving at the membrane surface. At 50 kPa, it appears that the hydrodynamic forces
related to the flow field are not able to elongate the macromolecular chains to a shape
with a transverse section smaller than the pore diameter. Therefore, no DB could
pass through the membrane to the permeate side at all times. On the contrary, there
may be forced permeation of DB chains happening when TMP is larger than 50 kPa
at the beginning of filtration. Higher TMP caused apparently more DB molecules
permeating through the membrane at 2 min of filtration as shown in Fig. 6.1. The
difference in So between the 50 and 200 kPa trials reached about 70 %.
After 20 min filtration, the membranes in all trials became almost impermeable to
the DB molecules. This is likely due to the pore blocking developed over time, which
is discussed and shown following. The fractions of blocked pores, F , are plotted in
Fig. 6.2 using eqn 4.16, with the coefficients determined from Fig. 5.15. It shows that
the membrane pores have been fully blocked by 20 min filtration for all trials. The
blocking curves for 50 kPa has the slowest growth rate so that it takes nearly 15 min
to reach >99 % pore coverage. For other curves, their membranes have almost all
been blocked by 10 min. This is mainly because of the smaller value of J0 arising
from a lower TMP in the combined blocking parameter kb equal to σCbJ0 defined in
eqn 4.16. Hence, in general, higher TMP causes a faster increase in F , except for
the curve at TMP equal to 200 kPa, which apparently had a slightly slower trend
than those at TMP equal to 100 and 150 kPa. This exception is caused by the other
123

component in kb, i.e., the blocking rate σ (see eqn 4.17), since σ decreases as TMP
increases (see Fig. 5.18).
At high TMP, the molecules are more likely to be stretched under the elongational
flow field just above the pore entrance. DB molecules have higher probability to enter
the permeate side, and hence less chance for pore clogging taking place. At the same
time, since the stretched DB molecules more easily enter the membrane pores, they
may form deep bed clogging inside the pores, instead of surface clogging. This may
be the cause for a higher blocking resistance, Rb, at high TMP in Fig. 5.18.
Figure 6.3 shows the decline of the sieving coefficient So during 50 mg/L PEO
filtrations under different TMPs. Similar to those in DB case, the So is apparently
higher at the beginning of each trial. Then, it drops as membrane fouling proceeds.
Unlike the DB case, there are still fractions of PEO molecules in the permeate at the
beginning of filtration under TMP equal to 50 kPa. This is likely due to the close
sizes between the PEO molecules and the membrane pores, allowing easy passing of
unstretched PEO molecules through the membrane at low TMP.
Figure 6.4 gives the total blocked areas (F ) of a membrane in the case of PEO
discussed above in Fig. 6.3. Compared to the filtration of DB solutions, the blocking
rate is generally smaller in PEO cases. For example, it took almost 120 min to achieve
more than 99 % pore blockage at TMP equal to 50 kPa. In higher TMP cases, the
fastest case is with TMP equal to 200 kPa, which still needs more than 30 min to
reach a full blocking coverage.
Unlike the DB case, there is no exception to follow the general trend that the
higher the TMP, the higher the rate of the increase of F in this case. The curve
associated with 200 kPa is the one that rises fastest and approaches earliest to unity.
The explanation is that the blocking rate, σ, is not significantly affected by the change
of TMP, which can be seen in Fig. 5.18 of the previous chapter; and therefore the
change of pore blocking constant, kb, according to eqn 4.17, is mainly controlled by
the change in J0 between curves, which monotonically increases with the rise of TMP.
Similar to the DB case, Fig. 6.3 also shows the difference between the So curves
from trials under different TMP. In general, higher TMP leads to a higher So at the
initial stage until 30 min of filtration, when the trial at TMP equal to 150 and that
at 200 kPa have their So values dropping below those from the curves at TMP equal
to 50 or 100 kPa. This may correspond to the fact that the majority of the pores
for the cases with higher TMP (≥ 150 kPa) had been clogged by 30 min shown in
Fig. 6.4, while trials at lower TMP (≤ 100 kPa) still had significant fractions of pores
124

0 20 40 60 80 100 1200
0.1
0.2
0.3
0.4
0.5
0.6
0.7
0.8
0.9
1
Filtration Time, t (min)
Observ
ed S
ievin
g C
oeffic
ient, S
o
DB, Cb=50 mg/L
050
100
150
200
TMP, kPa
Figure 6.1: Obsersved sieving coefficient, So, as a function of the filtration time duringUF of 2000 kDa DB through the 100 kDa RC membrane at 50 mg/L feed concentrationand various TMPs.
0 5 10 15 200
0.1
0.2
0.3
0.4
0.5
0.6
0.7
0.8
0.9
1
τ (min)
F (
−)
DB, Cb = 50 mg/L
50
100
150
200
TMP, kPa
Figure 6.2: Fractions of blocked pores as a function of the filtration time during UFof 2000 kDa DB through the 100 kDa RC membrane at 50 mg/L feed concentrationand various TMPs.
125

0 20 40 60 80 100 1200
0.1
0.2
0.3
0.4
0.5
0.6
0.7
0.8
0.9
1
Filtration Time, t (min)
Observ
ed S
ievin
g C
oeffic
ient, S
o
PEO, Cb=50 mg/L
050
100
150
200
TMP, kPa
Figure 6.3: Obsersved sieving coefficient, So, as a function of the filtration time duringUF of 100 kDa PEO through the 100 kDa RC membrane at 50 mg/L feed concentrationand various TMPs.
0 20 40 60 80 100 1200
0.1
0.2
0.3
0.4
0.5
0.6
0.7
0.8
0.9
1
τ (min)
F (
−)
PEO, Cb = 50 mg/L
50
100
150
200
TMP, kPa
Figure 6.4: Fractions of blocked pores as a function of the filtration time during UFof 100 kDa PEO through the 100 kDa RC membrane at 50 mg/L feed concentrationand various TMPs.
126

remaining open. After 30 min, the 50 kPa trial has the highest PEO permeation, just
followed by the 100 kPa trial, until the end of 120 min when membranes in all four
conditions become almost all impermeable to the solutes. In fact, both the 150 and
200 kPa trials have nearly reached the bottom of So by 60 min.
Comparisons were drawn between the sieving results of the two feeds (see Fig. 6.1
and 6.3). In general, PEO trials have higher sieving coefficients than the counterpart
trials in the DB case in most of the time shown in these two figures. This is much
expected since DB has much larger sizes than those of PEO and membrane pores. In
fact, if there were no deformation of DB macromolecules, the permeation in all DB
trials should have be insignificant just like the one at 50 kPa in Fig. 6.1. However, in
the actual results, the So of the DB trial at high TMP (150 or 200 kPa) is very much
comparable to that of the counterpart in the PEO case by 2 min of filtration.
6.3.2.2 Permeate Flux vs Sieving Coefficient
Figure 6.5 collates and displays the observed sieving coefficients (So) by the end of
2 min of every trial depicted in Fig. 6.1 and 6.3 versus the corresponding permeate
fluxes at the same time. For the DB case, the results from extra experiments under
30 kPa TMP with Cb equal to 50 mg/L are included. Instead of showing the mean
values, data from the duplicates conducted under the same condition are both plotted
in the graph. Fig. 6.5 is a semi-log graph with the x-axis, representing the permeate
flux, in log scale. Shown in the graph, the sieving coefficient is a strong function
of the permeate flux in the case of DB filtration, with So having increased by more
than 70 % when Jt increases from approximately (55 to 133) µm/s (corresponding
to TMPs from 50 kPa to 200 kPa). At lower TMPs of (30 to 50) kPa, i.e., flux
lower than 55 µm/s, the sieving coefficient was not significant (So < 0.02). By
linear regression of the data corresponding to trials above 50 kPa TMP, the intercept
on the x-axis gives a flux value of approximately 60 µm/s, equivalent to a shear
rate at the inner wall of the pore channel (γ) of around 5.45 × 10⁴ s−1 (using the
relationship of γ = 8v/d, where d is the average diameter of a membrane pore and v,
the linear velocity, equals to the average flux). This is an important quantity which
is related to the threshold between passing or non-passing of a polymer, undergoing
the flow-induced deformation, through a small pore, which is discussed in detail in
next section.
127

101
102
103
0
0.1
0.2
0.3
0.4
0.5
0.6
0.7
0.8
0.9
1
Permeate Flux, Jt (µm / s)
Observ
ed S
ievin
g C
oeffic
ient, S
o
DB
PEO
Feed Type
Figure 6.5: Plot of observed sieving coefficient (So) against the permeate flux (Jt) forboth DB (◦) and PEO (M) trials at the bulk concentration of 50 mg/L. Both quantitieswere obtained at the 2nd min of each filtration. Data from duplicate experiments wereplotted together.
0 50 100 150 200−2
−1
0
1
2
3
4
5
Permeate Flux, Jt (µm / s)
Sie
vin
g F
unction, ln
(1/S
o−
1)
DB
PEO
Feed Type
Figure 6.6: Plot of ln(1/So − 1) against the permeate flux (Jt) for data in Fig. 6.5.
128

For the PEO case, the sieving coefficient increases with the permeate flux in gen-
eral. For high fluxes corresponding to 150 and 200 kPa TMPs, such increasing trend
appears quite linear on the graph. However, at low fluxes corresponding to 50 and 100
kPa TMPs, there are large deviations in sieving coefficient between duplicate trials.
Within the range of TMPs tested, some PEO transmission is present in all trials.
This is partly due to the similar dimensions between the pores and macromolecules.
Although the calculated values of the hydrodynamic radius of PEO is about 2 times
larger than the mean radius of the membrane pores, PEO chains are flexible enough
to enter the pores or at least those larger ones, and go through.
It should be noted that in the present experiments, no mechanical agitation was
applied during filtration. Therefore, on top of the effect of forced permeation, the
effect of concentration polarisation on the sieving coefficient should not be neglected.
Using the classical ‘stagnant film theory’ [242], the membrane sieving coefficient can
be expressed as;
So =Sa
(1− Sa)exp(−J/km) + Sa(6.6)
where Sa is the actual sieving coefficient, equal to Cp/Cm, i.e., the ratio of the per-
meate concentration to the solute concentration at the upstream surface of the mem-
brane; J is the permeate flux; and km is the mass transfer coefficient averaged over
the membrane surface. By rearranging eqn 6.6, it can obtain:
ln
(1
So− 1
)= ln
(1
Sa− 1
)− J
km(6.7)
According to this equation, the sieving and flux data from Fig. 6.5 were plotted as
ln(1/So− 1) and J in Fig. 6.6. From the plot, the change in the ln(1/So− 1) term is
roughly linear with the flux change at the low TMP range but it appears non-linear
towards high flux range for both DB and PEO cases. This increase in sieving coeffi-
cient with increasing permeate flux may not be solely contributed to the concentration
polarisation effect. The flow-induced deformation of the macromolecules is likely to
be one of the cause.
129

6.3.3 Fouling Reversibility and Macromolecular Deformabil-
ity
Fouling reversibility is evaluated using the indices [39] deduced from the flux data
obtained in experiments. Referring to the filtration protocol in Fig. 5.2, the initial
DI water flux was measured using DI water (stage b) just before solution filtration
and referred to as J0; the permeate flux achieved at the end of the macromolecular
filtration (stage c) as Jf ; and the DI water flux determined after backwashing (stage
f) as Jc. The index for the total fouling is:
TF = 1− JfJ0
(6.8)
representing the total flux decline at the end of the fouling experiment; while the
index for the irreversible part of fouling is expressed as:
IF = 1− JcJ0
(6.9)
representing the unrecoverable part of the flux loss after backwash. One can also
normalise IF with TF to obtain:
nIF =IF
TF× 100 . (6.10)
Therefore, nIF represents the percentage of hydraulic irreversible fouling with respect
to the total fouling.
The reversibility tests were routinely conducted for the set of fouling experiments
running in the course of 200 min. Results for DB and PEO trials at Cb equal to 50
mg/L are shown in Fig. 6.7. In general, higher TMP leads to a more irreversible
fouling for both feed types. This is obvious in the case of DB. At low TMP (< 100
kPa), DB fouling is relatively reversible but, at high TMP (> 100 kPa), it is much
more irreversible. The gap between the trials at 50 kPa and 200 kPa is more than
40 %. For PEO trials, their fouling has relatively high irreversibility (> 50 %) at the
whole range of TMPs. The differences between all PEO trials are subtle and within
a range less than 10 %. Hence, the disparity in nIF between DB and PEO trials
at the same TMP narrows down as TMP increases. At 200 kPa, the irreversibility
indices are both slightly above 60 %, with the one for PEO being marginally a little
130

bit higher.
Figure 6.7: Normalised fouling irreversibility index (nIF) determined for 50 mg/L DBand PEO filtration trials at different TMPs and different filtration duration. No dataavailable for PEO trials at 30 kPa.
Another set of timely shortened experiments, where the macromolecular filtration
(stage c in Fig. 5.2) was only run for 10 min, were conducted in order to investigate
the degree of the contribution of the initial stage of filtration to the irreversibility of
fouling. Results of this set are also included in Fig. 6.7 for both DB and PEO. It
appears that the shortened filtrations generally lead to less irreversible fouling than
their corresponding 200-min filtration trials, especially for those at low TMPs. For
DB, the 10-min fouling at 30 kPa and 50 kPa is almost totally reversible (nIF < 5 %),
but when TMP increases above 100 kPa , the irreversibility of the fouling increases
dramatically to a level not too shy of those of the 200-min correspondents. In the
PEO case, the fouling irreversibility also increases with increasing TMPs but within
a smaller range from approximately 23 % at 50 kPa to 38 % at 200 kPa. Comparing
the two feeds in the 10-min set, DB fouling is apparently less irreversible at low TMP
(50 kPa and 100 kPa), while it becomes more than that of the PEO correspondents
at high TMP (150 kPa and 200 kPa). This is slightly different to the comparison
results in the 200-min set, where PEO fouling is consistently more irreversible from
50 kPa to 200 kPa.
131

In summary, TMP appears to have more impact on the fouling reversibility in
the DB case. The increase in TMP apparently causes the DB fouling to become
more irreversible in both short and long filtration experiments. In the PEO case,
the percentage of irreversible fouling with respect to the total fouling is relatively
consistent against TMP changing for both filtration durations.
The initial stage appears to have more profound impact on the fouling irreversibil-
ity in the DB fouling at higher TMP (> 100 kPa) since the nIF difference between
these results is narrow. In order to clearly show this, the corresponding absolute
irreversibility indices (IF) are displayed in Fig. 6.8 for all normalised data shown in
Fig. 6.7. The results are consistent between the two figures. At the high TMP range,
the majority of irreversible fouling is attributed to the first 10-min filtration for DB
experiments.
Figure 6.8: Fouling irreversibility index (IF) determined for 50 mg/L DB and PEOfiltration trials at different TMPs and different filtration duration.
6.4 Impact of Macromolecular Deformation on Foul-
ing
The flow-dependent permeation and highly irreversible fouling of DB filtration at
high TMP (> 100) likely stem from the macromolecular deformation under a high
132

shear flow. Theory [248] suggests that the onset of the macromolecular deformation
occurs at a critical filtrate flux. Below this value, filtration is simply governed by size
exclusion. The large DB molecules are retained on the membrane surface. However,
once above the threshold, the converging flow at the pore mouth theoretically can
sustain a strong elongational flow field to stretch the macromolecule to a transversal
diameter smaller to that of the pore opening. A macromolecule would then be able
to permeate through the pore with an opening size smaller than the unperturbed size
of the molecule. The sieving results of DB have shown such a turn in Fig. 6.5 from
a nearly impermeable state at small fluxes to appreciable permeation at high fluxes.
The critical flux is roughly determined at 6× 10⁻⁵ m/s from the turning point in the
sieving curve.
With respect to the critical deformation-flow theory, a hypothesis can then be
formed to regard the macromolecular deformability to membrane fouling. It states
that a high flow field can induce the deformation of a linear flexible macromolecule
and drag the stretched molecule into a pore which is usually too small for it to
enter, and this phenomenon increases the permeation as indicated by the sieving
coefficient as well as increases the opportunity of internal fouling. Since membrane
pores are not perfectly shaped, the irregular pore geometry may cause trap of the
‘squeezed’ macromolecule inside the pore structure. Moreover, a pore radius in the
present UF membrane is within 10 nm while a pore length can be 100 times larger
since the effective membrane thickness is at a few µm. Such large difference in the
two dimensions may allow enough space for the chains to recoil, returning from a
stretched state to a coiled conformation. Therefore, when the large macromolecules
are not deformed, they can only cause the surface pore blockage; while when they are
stretched by the hydrodynamic force, they may be captured inside the pore matrix,
causing severe internal pore clogging. This deep-bed type of fouling is more difficult
to recover than surface blockage.
Therefore, high TMP corresponding to high extensional flow field can cause a more
irreversible fouling as depicted in Fig. 6.7. The process of internal pore clogging takes
place quickly at the beginning of fouling when the permeate flux is at its highest. This
was shown in the irreversibility results for the 10 min filtration. At high TMPs, 10
min filtration of DB solution could cause irreversible fouling comparable to the 200
min filtration. At the early filtration time, the sieving results (see Fig. 6.1) were also
high for DB filtration under high TMPs since macromolecules were dragged into the
pores, they have both probabilities to clog or pass through. At low TMPs, i.e. 30 and
50 kPa (the corresponding fluxes were lower than the threshold shown in Fig. 6.5),
133

most of the DB molecules cannot enter the membrane pores, and hence, can most
likely only cause surface blockage. Therefore, fouling in these cases are more reversible
especially for a short period. For long-term filtration, the consolidation in the fouling
layers via certain mechanisms may have contributed to some of the irreversibility in
the fouling. These mechanisms involving the entangled macromolecules (no longer in
dilute regime) are more complicated to determine.
For PEO cases, since their sizes are comparable to the pore sizes, they can
more easily enter the pores, even without the requirement of molecular deforma-
tion/elongation for entrance. The TMPs and the strength of the flow field do not
affect them as much as they do to DB molecules. Therefore, their fouling irreversibil-
ity does not vary too much between different TMPs.
In practice, there are numerous pores in a filter and their sizes are not exactly
same. The macroscopic flux is only an average value over the many pores. Sometimes,
although the macroscopic flux is below the threshold, there may be a fraction of the
pores passing flow at a speed greater than the critical value to stretch macromolecules.
Therefore, the true value of the critical flux may be in fact higher than the one
determined purely based on the sieving results.
6.5 Conclusions
The sieving and fouling irreversibility results have been presented for the two large
polymers, i.e., the DB and PEO used in the experiments. For DB, noticeable perme-
ation was only observed under high TMPs (≥ 100 kPa) and at the very early stage
(< 10 min out of 120 min) of the filtration. For PEO, the molecular permeation was
also found to be affected by TMPs but less noticeable. Permeation was observed
under all TMPs conditions and decreased more gradually than that in the DB case.
The decrease of the sieving coefficients as the filtration proceeds coincides with the
build-up of membrane fouling. Given that the mean pore radius of the membrane is
estimated at 4.4 nm and the hydrodynamic radius for DB (MW = 2000 kDa) and PEO
(MW = 100 kDa) samples are at 28.8 and 10.2 nm, respectively, the low permeability
at low TMPs is due to the size exclusion. However, the variance in the characteristic
sizes allows a fraction of PEO molecules to pass through the membranes naturally.
The initial sieving coefficients have been demonstrated to depend on the fluxes
with only exceptions in the DB case when fluxes are low. The change from being
impermeable to permeable for DB occurs at a certain value of the flux, which can
134

be roughly determined from curve fitting. This agrees with the profile of the con-
formational change of a polymer molecule suggested by the ’coil-to-stretch’ theory
[248, 249].
The results of the fouling irreversibility have also demonstrated that DB fouling is
more susceptible to the TMPs change. At low TMP, DB fouling is totally reversible
after 10-min filtration and only slightly irreversible after 200-min, while at high TMP,
its fouling becomes much more irreversible since the initial time. In contrast, PEO
fouling is less affected although it is not totally independent of the TMPs change.
The increased irreversible fouling in the DB case is, hypothetically, caused by the
flow-induced deformation of the macromolecules. The high permeate flux leads to
an elongational velocity gradient at the pore entrance which can deform the coiled
molecule to a stretched state, when the flux is higher than a certain threshold. The
elongated molecules are much easier to enter the pores. This leads to high permeation
while also enables the molecules to be engaged in the internal pore clogging.
135

Chapter 7
Mesoscale Simulation of Pore
Blocking
7.1 Introduction
Solute molecular deformation due to the elongation flow near the pore entrance may
change the state of the filtration process, or the extent of fouling; Chapter 6 has pro-
posed that a transition between surface fouling and possible internal fouling under a
high converging flow at the pore entrance may occur during UF of macromolecules.
In order to determine the relationship between the macromolecular fouling and flow-
induced deformation, a mesoscale model using Dissipative Particle Dynamics (DPD)
was built for investigation. Choice of this method is because of the particularly
small scale involved at the pore entrance, where the flow field is important for the
flow-induced deformation of macromolecules, and may dramatically affect the fouling
behaviour. At such a small scale, numerical simulation can provide detailed informa-
tion on flow and molecular conformations [257].
7.1.1 The Physical Scale
The observable behaviour of membrane fouling and flux decline is affected in a funda-
mental way by many non-trivial details at the smaller scales. Following the previous
chapters, macromolecules capture and size exclusion at the pore entrance are con-
sidered to be particularly important in UF fouling. Therefore, we zoom into the
136

confined region surrounding the opening of an individual pore on the surface of a
UF membrane and study the physic-chemical processes at this scale, affecting the
fouling behaviour. Given that the chemical and electrostatic interactions can be ne-
glected for the present, the focus is on the permeate flow at this region and how the
macromolecule behaves in the flow and interacts with the pore wall.
The model system should consist of the pore, the solvent and the macromolecule.
The pore in the UF membrane studied in the thesis has a diamerter typically ranging
from 1 nm to 10 nm. The macromolecule has size at the same order to the pores. For
a dilute solution, one molecule studied at a time is adequate.
To simulate the flow, the first choice is the continuous fluidic dynamics (FD) using
the Navier-Stokes equation. It can well describe a simple fluid passing through a pore
in a phenomenological manner without consideration of any microscopic detail, but
it may not suit the system of present interest. Firstly, the continuum assumption
may no longer be held when the length scale is smaller than 10 nm. Secondly, it is
difficult to couple the dynamics of the macromolecule into the FD, since the molecule
is too large in the system to neglect its conformational effect. Alternatively, it may
resort to a simulation on the atomistic level. Molecular dynamics (MD) is such a tool
modelling single atoms in a system by following the position and momentum of every
particle [258, 259]. It can be extremely useful in the simulation of small numbers
of particles and has been scaled up to model even large biomolecules via improved
algorithms [260]. However, MD is restricted to a small space-time domain, typically
for dimensions smaller than 100 nm and time intervals less than 5 ns [261]. Attempts
to apply MD to large systems often consume unrealistic computational powers.
Both atomistic (microscopic) and continuum methods are not ideal for our system.
What one needs is a model that can study both hydrodynamics and thermodynamics
of a system and bring out the infromation on the flow and the molecular conformation
together. This is where the mesocopic models come into play. The mesoscale is larger
than the atomistic scale but smaller than the continuum scale in the temporal and
spacial chart. A mesocopic system can have the length between 10 nm and 1 µm and
the characteristic time from 10 ns to 1 s. In mesoscopic models, the macromolecule
will be modelled with coarse-grained particles, i.e. a cluster of many atoms, and
the atomic interactions are omitted since the exact structure of the molecule is not
of interest. The relevant phenomena can then be assumed to only occur above the
mesoscopic scale and nothing of interest should occur faster than the characteristic
time [262].
137

7.1.2 Introduction of the DPD method
In general, the DPD method as a mesoscopic modelling technique bridges micro-
scopic simulation methods such as MD and macroscopic approaches involving the
solution of the fluid flow equations [263]. DPD can model both thermodynamics
and hydrodynamics. It can obtain both atom-like and fluid-like effects. Therefore,
DPD can be used to simulate systems that are too large to be simulated by MD but
small enough for thermal fluctuations to play an important role. Important exam-
ples include polymer solutions, gels, small particle suspensions and membranes. In
these applications inter-particle and intra-molecular hydrodynamic interactions are
automatically included.
In form, DPD closely resembles MD. Both are particle methods. A DPD system
is made up of off-lattice, discrete, and free particles. They have continuous spatial
positions and velocities though updated discretely in time according to Newton’s law
of motion. This differs from other mesoscopic methods such as Lattice-Boltzman and
lattice Monte Carlo methods [264, 265], where the particles are restricted to a set of
discrete positions.
Fundamentally, DPD is different from MD in the concept that each DPD particle
is a soft sphere and represents a large number of solvent or polymeric monomer units,
and might be better thought of as a carrier of momentum [266, 267]. In a three-
dimensional space, they are associated with constant masses and interact pairwise
over a range that is usually of the same order as their diameters. DPD particles,
being ‘soft’, do not have hard-sphere repulsions, like the Lennard-Jones interaction
used in MD, with each other. As a result, they can overlap with each other to a
significant degree. Then, the distance between two overlapped particles is less than
the sum of radii of their interaction range.
DPD obtains the hydrodynamics because it is Galilean invariant so that momen-
tum is conserved via the laws of pairwise interaction. Compared to computational
fluidic mechanics, particle methods are much less computationally efficient than grid
based numerical solution of the Navier-Stokes equation, and they have been used less
extensively, particularly for engineering applications. However, they have important
advantages in respect of (1) rigorous mass and momentum conservation; (2) being
isotropic ; (3) being simple to simulate flows with moving boundaries; (4) easy cou-
pling of fluid flow with other physical phenomena such as a phase separation; (5)
no need for explicit interface tracking and capturing; and (6) relatively simple code
development.
138

The history of DPD models is not long. The concept was first introduced in 1992
by Hoogerbrugge and Koelman [266], as an alternative method for the mesoscopic
simulation of complex fluids on physically interesting length and time scales. Later,
Espanol and Warren [268] proposed a constraint on the coefficients and weighting
functions of the dissipative and random forces, satisfying the fluctuation-dissipation
theorem. Groot and Warren [263] contributed to the next major step in its develop-
ment, which established an integration algorithm for Newton’s equations of motion,
and made the first theory-based argument for the value of the conservative force
coefficient.
DPD is a relatively young mesoscopic method and is still under development,
whereas this method has been adopted by a number of researchers who recognised
that the form of this model would allow for a great deal of flexibility in building
complex molecules and systems. Most applications of DPD involve systems of either
large, inter-connected particle structures immersed within fluid, or fluid flow through
complex surfaces. Willemsen et al. [269] used frozen particles to build a wall exhibiting
no-slip boundary conditions, later using the method to simulate pressure-driven flow
in a chromatography channel. Clarke [270] developed DPD models for performing
shear and planar elongational flow over a wide range of strain rates. The results
showed that the polymer molecules were significantly deformed only at high strain
rates, which complied well with other experimental and theoretical works. Guo et al.
[271] used DPD to model the flow-induced permeation of a polymer chain through a
small pore.
7.2 Model and Methods
In this chapter, DPD simulations of the deposition of a single macromolecule onto a
permeable membrane surface in a normal flow field were performed. In a sense, it is
similar to particle deposition studies in the continuum domain (MF range) [228, 229],
where the flow field was modelled as a continuum predicted by the Navier-Stokes
equation directly, and the particles were modelled as rigid spheres and their motions
were described by the phenomenological forces, such as the Stokes hydrodynamics
force [229]. However, in the present work, the physical scale in UF of the macro-
molecule is much smaller than the colloidal system in those MF studies. It is at the
mesoscopic scale, therefore, that significant contributions from molecular interactions
are expected.
139

The DPD method was used to study the dynamics of a linear flexible macromolec-
ular chain in the converging flow field above a narrow pore in a three dimensional
space. The DPD simulation code was developed based on a Fortran code for the DPD
model named DL-MESO [272], with case-specific modifications as required.
7.2.1 Outline of the DPD Method
This work follows standard DPD protocol. The model consists of an ensemble of N
point-particles existing in continuous space. Each particle has its associated vector
position (ri), velocity (vi) and its mass (mi) registered in the system, where i is the
index to distinguish between particles. The mass of a particle is usually set constant
during a simulation; while its position and velocity vectors are temporally updated
according to Newton’s second law of motion:
dridt
= vi (7.1)
anddvidt
=Fi
mi
(7.2)
The total force on a particle i is simply a sum of all distinct forces applied to this
particle;
Fi =∑i 6=j
f ij + Fexti (7.3)
where f ij is the interparticle force on particle i exerted by particle j, and Fexti repre-
sents other external body forces.
7.2.1.1 Pairwise Interactions and Thermostat
In any DPD system, f ij consists of three distinct forces: a conservative force (FC), a
dissipative (drag) force (FD), and a random force (FR), which are all assumed to be
pairwise additive;
f ij = FCij + FD
ij + FRij (7.4)
Between a pair of particles, these forces are always equal and opposite, so that mo-
mentum is conserved both locally and over the entire system. The summation in
eqn 7.3 runs over all particles found within a cutoff radius designated by rc.
140

The three basic forces have the usual forms [268]:
FCij = −∂Vij
∂rijeij (7.5)
FDij = −γijωD(eij · vij)eij (7.6)
FRij = σijω
Rθij∆t−1/2eij (7.7)
where Vij is a two-particle interaction potential; eij is the unit vector in the direction
of the interparticle vector rij ≡ ri− rj; both ωD and ωR are distance-based screening
functions (i.e. weighting functions), relating the interparticle distance rij (equal to
|rij|) to the magnitude of the forces respectively.
The pairwise conservative force is to generate local thermodynamics. Its interac-
tion potential is often chosen as:
Vij =1
2aijrc
(1− rij
rc
)2
(7.8)
where aij is the interaction strength, i.e., the maximum repulsion between the two
particles; The interaction distance rij is set no more than the cutoff rc so that the
conservative interaction is purely repulsive. Note that it is not forbidden in DPD to
use other kinds of potential, e.g., the Lennard-Jones, which is commonly used in MD
[258] and has both attractive and repulsive terms in its form.
Inserting eqn 7.5 into eqn 7.8 with the cutoff constraint gives rise to the form of
the conservative force:
FCij =
aij
(1− rij
rc
)eij if rij < rc,
0 if rij ≥ rc.
(7.9)
The resultant FCij is a ‘soft’ (i.e. weakly) repulsive force set to be finite at very
small separation distances. This allows for large time steps in computing [267]. In
comparison, the Lennard-Jones force (in MD) approaches infinity at small particle
separations, limiting the permissible timesteps to very small values. Therefore, DPD
can usually simulate in larger time scales than MD. Moreover, it is possible for two
DPD point masses to coincide, since the maximal repulsion achieved at rij = 0 is
large but finite.
141

The most distinctive feature in DPD is its thermostat consisting of the pairwise
dissipative and random forces. The thermostat couples a DPD system to a heat bath
so that system momentum can be conserved correctly.
The dissipative force FDij acts in such a manner as to reduce the relative velocity, vij
between two particles and hence drain the kinetic energy from the system. This force
originates from the friction between the particles that pass each other. A particle
moving more slowly receives momentum from a faster particle, and in return, the
faster one is slowed down. The constant γ in eqn 7.6 is the frictional coefficient
controlling the force amplitude, and is an important parameter in determining the
viscosity of the fluid [262]. A large value of γ will produce a system sensitive to
fluctuations in temperature, which relaxes quickly [263, 273].
The random force FRij is a stochastic force originated from the Brownian motion. It
can be understood as the random fluctuations of the fluid due to the local temperature
[262]. In a DPD system, it counteracts the dissipative force to provide the system with
energy. By viewing the DPD particle as a coarse-grain of many atomistic particles, it
can be interpreted that the energy flows from the invisible microscopic entities which
DPD ignores into the mesoscopic DPD grains. The strength of the random force is
governed by the coefficient σ. The randomness in eqn 7.7 is contained in θij, which
generates Gaussian random numbers with zero mean and unit variance [262], and ∆t
is the timestep size.
The strength of the random force is related to that of the dissipative force by the
fluctuation-dissipation theorem [268], which ensures the balance between the energy
resulting from the two forces and hence brings the system to the desired equilibrium
temperature (kBT ) over time. This brings out the following correlations between the
two forces in order for thermodynamic equilibrium to be achieved:
σ2 = 2γkBT (7.10)
(ωR)2 = ωD (7.11)
The form of the weighting functions are not specified by the model itself. A common
choice [263] is
ωD = (ωR)2 =
(1− rij
rc)2 if rij < rc,
0 if rij ≥ rc.
(7.12)
142

The combination of the dissipative and random forces comprise the DPD ther-
mostat. It connects the model system to a heat bath so that a highly controllable
environment is created to allow a finite number of spherical beads to model complex
fluids with accuracy. The effect can be analogous to bouncing balls in a can: by filling
the can with water and skating it consistently, the movements of the balls become
more stable and predictable [267].
7.2.1.2 External Forces
An external body force can be explicitly exerted on DPD particles of interest, as
shown in eqn 7.3 in addition to the pairwise interactions.
Fexti = giei (7.13)
where g is the modulus of the body force, and ei is a unit vector in the force direction
for particle i. The body force can represent the constant acceleration that the particles
receive under an external force field, for example, a gravitational or electric field
[272]. By this, a pressure-driven Poiseuille flow, for example, can be generated [257].
Application of the body force can be used to investigate a system in non-equilibrium.
7.2.1.3 Integration Algorithm
The simulation is performed by iterating the Newtonian equations of motion for DPD
particles (eqns 7.1 and 7.2) through a series of timesteps to obtain the instantaneous
position, velocity and acceleration of all particles at each timestep. The integration
algorithm uses a modified velocity-Verlet (DPD-VV) scheme [263]:
ri(t+ ∆t) = ri(t) + vi(t)∆t+f i(t)
2mi
(∆t)2, (7.14)
vi(t+ ∆t) = vi(t) + λ∆tf i(t)
mi
, (7.15)
f i(t+ ∆t) = f(ri(t+ ∆t), vi(t+ ∆t)), (7.16)
vi(t+ ∆t) = vi(t) +(f i(t) + f i(t+ ∆t))
2mi
∆t. (7.17)
143

The steps are as follows: (1) forces are applied to particles at each timestep, de-
pending on their position and velocity at the instant, t; (2) the velocity vi serves as
an intermediate guess for the velocity at t + ∆t, and λ is an empirically-introduced
parameter, for which Groot and Warren [263] found an optimal value at 0.65; (3) the
total force (acceleration) at the next timestep is then calculated using eqn 7.4, based
on the updated position, and the intermediate velocity vectors; and (4) the velocity
at the next timestep is recalculated using half the forces from the previous timestep
and half from the current timestep.
The introduction of the intermediate velocity vi allows the calculation of the dis-
sipative force (eqn 7.6), since it depends on the particle velocity, which is the main
modification to the original velocity-Verlet algorithm widely used in the conventional
MD simulation [259]. However, this algorithm is not a self-consistent procedure be-
cause of the cyclic dependence between the dissipative force and the velocity [272].
This also means that the DPD-VV is not time-reversible due to the calculation of
the stochastic force, involved in each time step [274]. Hence, the effective equilibrium
temperature depends on the time step used in the scheme [275]. Therefore, the max-
imum attainable ∆t is limited in order not to compromise the stability of the system.
Extra care is required for the choice of the timestep size.
During simulation, the convergence of the algorithm is constantly monitored
through each timestep by checking the system temperature with the desired value.
7.2.1.4 Units in DPD
The DPD code uses fundamental units for mass, length and energy. For the conve-
nience of editing, their units are reduced using the respective characteristic scales in
the system [263]. The unit of length is defined by the cutoff radius, rc, since DPD
contains no other inherent length scales. This cutoff radius also represents the size of
a particle.
The unit of mass is defined to be the mass of a DPD particle, mi. The unit of
energy is set as kBT , i.e., two-thirds of the kinetic energy per particle.
The time unit in the DPD system is the result of the three fundamental units. A
unit time is then:
t = rc
√mi
kBT(7.18)
which represents the time in the system being scaled such that a particle with speed
v = 1 will move a distance rc in one unit time.
144

7.2.2 Model Configuration
The model configuration here is similar to those in the previous studies [236, 271, 276]
of flow-induced translocation of a polymer through a narrow pore. Instead of trying
to pull the polymer through the pore [276], the relationship of the hydrodynamic
force to fouling is studied here. A state of fouling is defined as that occurring when
a polymer is captured by the pore and stopped entering further. Therefore, in this
fashion, the goal of the present model is to study the surface fouling phenomenon,
i.e., the deposition of a macromolecule onto the pore mouth, which is the mode of the
pore blocking as described in the classical blocking theory. Furthermore, fouling is
assumed to be caused purely by steric effects so that other effects such as electrostatics
are not considered.
7.2.2.1 System Geometry
The system is modelled in a rectangular simulation box, with a square base in the x-y
surface and its longitudinal direction along the z-axis (see Fig. 7.1). Within the box,
there are three components: the pore structure (denoted by W), the solvent fluid (S),
and the macromolecule (P).
The pore structure represents a small surface portion in a UF membrane, con-
taining a single pore. The pore wall extends in the x and y-axes and is placed in
the middle of the simulation box. It divides the flow space into two regions: the
upstream feed side and the downstream permeate side. A straight cylindrical pore
with a radius of rp is then dug through the membrane wall material to connect the
flow regions. During this work, two values of rp, i.e., 1.0 and 2.0 (units normalised
by rc), are investigated respectively. The length of the pore channel, l, is fixed at
8.0, i.e., the thickness of the membrane in the system. The ratio of l to rp here is
not realistic (UF membranes have their thickness typically more than 100 times their
pore radius). The choice is for the sake of the limited computational power. A large
chunk of the pore channel is actually omitted in the present work. Therefore, this
simulation work is limited to studying pore blocking phenomena at the pore entrance
region. It is not suitable for an internal fouling study.
The pore wall is constructed with layers of frozen DPD particles which are set
stationary during the simulation but can still interact with all other particles. The
wall particles are placed in a lattice with its grid size determined by the particle
number density (ρ).
145

At the wall surface, the no-slip boundary condition is assumed. In order to avoid
the freely-moving particles penetrating the solid walls, the density of the wall particles
(ρW = 8) is set higher than the density of the fluid particles (ρS = 3) in the free flow
space. No extra bounce-back rule is set at the surface, since the goal is to study
macromolecular deposition.
The flow is later created from the −z direction so that the inlet of the system is
at the upstream boundary and the outlet the downstream in Fig. 7.1.
The length of the simulation box, L, varies slightly in different simulation runs,
depending on the size of the macromolecule in the system, because the centre of the
molecule is always placed at a distance of 15.0 rc in the z-direction away from the
centre of the pore entrance and the size of the molecule was varied in the study.
7.2.2.2 Fluid and Flow
The fluid in the system is modelled with unbounded DPD particles. Its particle
density is required to be enough to fill the entire system to ensure plentiful short-range
interactions in the system in order to accurately control the temperature and form
incompressible fluid. If there is an abundance of free space, particles will move freely
without experiencing dissipation. Also in consideration of the minimal computational
cost, most DPD studies have chosen the number density between 3 and 4 [270]. In
the present work, the number density of the fluid particle is chosen at ρS = 3, the
same as that in a previous pore-flow simulation [271] Then, the total number of fluid
particles is determined by multiplying ρS by the free volume (not occupied by the
wall) in the simulation box.
DPD obeys the Navier-Stokes equation [277] so that hydrodynamic flow can be
generated within the model. However, unlike continuum methods, it is not an easy
task to assign a given pressure difference in a stochastic particle method. Strictly,
it requires to specify (statistically) appropriate chemical potentials at the two ends
of the fluidic system in the grand-canonical ensemble [278]. Technically, the chem-
ical potential is maintained by continuously creating and deleting particles in the
source (inlet) and sink (outlet) regions respectively. However, this method is prone
to instabilities and cumbersome to implement in practice [279].
Alternatively, the reflecting boundary method [280], setting a biased boundary
condition to allow the particles to freely cross from one side but partially reflect those
from the other side according to a probability, can also lead to the effect of a pressure
difference. This method is technically simple and can coincide with the periodic
146

Figure 7.1: Schematics of the DPD simulation setup for the study of a linear polymericchain blocking a cylindrical membrane pore.
147

boundaries, but it is difficult to achieve a desired flow field by simply adjusting the
reflection probabilities [279]. These ‘reservoir’ methods [280] may be further modified
with some smart ‘water pumping’ mechanisms, but the steady flow is difficult to
maintain in these methods.
Therefore, in this work, the flow generation is simply resolved with the application
of an artificial acceleration field to every flow region of the system [271, 281]. In
this method, a constant body force, Fexti (eqn 7.13), in the −z direction is imposed
directly on each solvent particle to force them to flow in a uniform direction. A
constant pressure gradient can be generated in this fashion. By carefully choosing
the magnitude of the body force, a steady state Poiseuille flow is expected in the
pore region. This scheme is simple, effective and computationally efficient, but there
are also some artefacts in it. Firstly, the body force has to be unrealistically large
compared to the earth gravity in order to generate an appreciable flow in DPD system.
Secondly, effects on local dynamics induced by constant acceleration are different from
those induced by pressure gradient, which have microscopic spatial and temporal
fluctuations associated with molecular collisions. Thirdly, the flow near the complex
geometry such as the membrane structure in the present simulation will deviate from
the Navier-Stokes equation. Hence, it may not faithfully model the flow region next
to the solid surface away from the pore entrance in the present simulation geometry.
However, since the flow region at the pore entrance is of the main interest, this method
is currently the most suitable.
Periodic boundary conditions [258] are applied to the six surfaces of the or-
thorhombic simulation box. The fluid particles leaving one end are instantly placed
back to the box from the opposite side. Hence, the total number of the DPD particles
are conserved.
7.2.2.3 Macromolecules in DPD
It is straightforward to incorporate macromolecules into the DPD simulation using the
bead-spring model. A linear polymer is represented by a freely-jointed chain, which
consists of N number of DPD particles. These beads are connected consecutively
by massless spring-like bonds. The bond imparts an elastic constriction to the two
beads it connects. Each bead in the chain represents a monomer of the polymer.
This simple model does not allow any tertiary forces, e.g. hydrogen bonding. It is a
coarse-grained description of the macromolecule, omitting the details at the atomic
148

level. A dilute solution of macromolecules can then be formed by immersing a single
chain into a sea of fluid particles.
The bonded interaction between monomers contributes to the total force calcula-
tion in eqn 7.3, in addition to the basic DPD forces [263]. In the present work, it is
represented by the harmonic (Hookean/Fraenkel) force [271, 276], expressed as
Fbondij = H(1− rij
r0)eij (7.19)
where H is the spring constant governing the strength of the force, and r0 is the
equilibrium bond length between the two connected beads.
In order to avoid chain-crossing, we firstly need the bead particles to become im-
penetrable [282], and therefore the soft potential in the conservative force expression
(see eqn 7.5) is modified. A segmental repulsion model has been adopted to mix a
hard and a soft potential in sequence [283, 284], i.e., adding a hard core to the poly-
mer beads. The Morse potential [271] is used to model the strong repulsion at the
adjacent space of the particle centre, of which the corresponding force is expressed as
FMij = 2Deν
(e2ν(2re−rij) − eν(2re−rij)
)eij (7.20)
where De is the well depth of the Morse potential, ν controls the ‘width’ of the depth,
and re is the equilibrium bond distance representing the radius of the core of the
particle, which is set at 0.30 rc. The Morse force is assumed only effective within the
distance, re, and then the modified conservative force has segments as follows:
FCMij =
FMij + FC
ij if rij 6 2re,
FCij if 2re < rij 6 rc,
0 if rij > rc.
(7.21)
Secondly, an extra topological constraint is added to the system to prevent chain
crossings. [282] has demonstrated that chains crossing cannot occur if the bond length
r0 in eqn 7.19 and the core radius re of the polymer particle satisfy the following
relationship:
r0 < 2√
2re . (7.22)
Geometrically, this is easy to prove as r0 represents the maximum length that a bond
149

can reach, while 2re represents the minimum distance that a bond can be compressed
to. Therefore, r0 is set to 0.70rc herein according to the preset value of re [271] .
7.2.2.4 Choice of Paramters
The choice of DPD parameters is made based on a combination of physical rational-
isation and practical computational necessity.
The parameters in the pairwise particle interactions can be specified for each
species pair in DPD. The strength coefficients of dissipative forces, λ, and random
forces, σ, are set to 4.5 and 3.0 for all pairs in the system, respectively. The combi-
nation satisfies the relationship in eqn 7.10 and has been chosen in many studies in
the literature [257, 263, 271, 285].
The value for the conservative coefficient, aij, is chosen for each species in the
system with care. Note that we use subscriptions, S, W, and P to denote the species
of solvent, wall, and polymer beads respectively.
In order to set the compressibility of the fluid to the correct value for water under
room temperature, Groot and Warren [263] found that the parameter between two
water particles, aSS, should satisfy:
aSS =75kBT
ρS. (7.23)
Since ρS is set to 3.0 and kBT to 1.0, aSS should be equal to 25.0 . This value will
be kept constant through a simulation.
For stationary wall particles, the coefficient between them, aWW , is set to 10.0.
Given that the interaction between unlike particle pairs can be estimated from
aαβ =√aααaββ (7.24)
where α and β represent the denotations for two different species, the coefficient for
interactions between solvent and wall particles is given as aSW ≡ aWS = 15.81, which
is slightly lower than aSS. This means the repulsion between wall and fluid particles
is softened in the simulation, which can help reduce the distortion of the particle
density near the wall boundary [257].
For the interaction between polymer beads, aPP is set to 25.0. Then, the conser-
vative coefficient for interactions between the molecule and the fluid, aPS, is given by
eqn 7.24 as 25.0. This is a reasonable value for freely jointed polymer chains in a good
150

solvent [286]. Between the wall and the polymer particles, the repulsive coefficient,
aPW , then has a value of 15.81.
The well depth and width in the Morse potential for the polymer beads are set
to De = 500.0 and ν = 0.50, respectively, and the spring constant, H, governing the
bond interactions is set to 500.0, to reinforce the rigidity in the respective properties
of a polymer chain, according to a previous study [271].
The external body force is added to all solvent particles in the system. Its direction
is set parallel to −z axis. Its strength, g, is set between 0.001 and 1.0 to investigate
its effect on the macromolecular deposition.
The time step, ∆t, in the modified velocity-Verlet algorithm is set at 0.01. The
desired energy (temperature) is set to 1.0 kBT and assumed to be uniform over the
entire system.
7.3 Results and Discussion
In the simulations, two system variables are studied: polymer chain lengths N ranging
from 25 to 250; and external body force g from 0.01 to 1.0.
For each simulation, the general procedure is to build the pore geometry, add
fluids and equilibrate, relax and add a polymer chain, re-equilibrate, and then, add
the body force to solvent particles, set the polymer free when a steady flow field
is generated, and, finally, allow the resulting hydrodynamic flow to drive the chain
towards the pore entrance. The instantaneous position of each bead of the chain is
recorded at each time step.
At the end of the simulation, the polymer either travels through the pore or fails
to do so. In these failure cases, if the polymer mostly resides at the pore entrance
because of the size exclusion, these cases are then defined as fouling cases.
For each experimental condition, 100 independent simulations were conducted. In
each run, the initial conformation of the polymer was set completely randomly. For
each set, the number of runs which successfully translocates the polymer and the
number of runs where fouling occurrs were recorded.
7.3.1 Pore Flow
The membrane in this study consists of about 10,000 frozen particles (ρW = 8.0).
The exact number slightly varies with the choice of the pore radius. After the pore
151

structure is built, the system is filled with water particles at the number density of 3.0
(ρS = 3.0). The total number of these unbounded solvent particles is around 36,000.
The polymer molecule is initially placed near the system inlet and fixed at its cen-
tre point. After solvation, the external body force is applied to the solvent particles.
The hydrodynamic flow is, then, generated in the pore channel. After an equilibrium
of 160, 000 timesteps (i.e. 1,600 t), a steady-state Poiseuille flow in the pore channel
is achieved for each applied body force ranging from 0.01 to 10.0. Figure 7.2 shows
an example of the velocity field achieved in the simulation with the application of a
body force at 0.1 with a standard DPD unit. The parabolic shape of the velocity
profiles indicate a Poiseuille flow. Note that, when the body force is lower than 0.01,
the effect of transverse diffusion is too large to form an appreciable uniform flow in
the pore channel.
0
0.25
0.5
0.75
1
Velocity z
-0.0795
1.06
Figure 7.2: 2D vector field of the velocity in the z direction for the middle plane ofthe simulation box. Poiseuile flow is achieved after equilibrium for simulation with abody force of 0.1.
152

The average convective flux < jz >, through the pore is calculated as the mean
flow velocity in the z direction over the cross-section of the pore and averaged over
4,000 timesteps after the steady-state flow is achieved. It is found that increasing the
body force can effectively increase the convective flux. A power-law relationship is
obtained between < jz > and the strength of the corresponding body force, g, and
depicted in Fig. 7.3. The exponent is found at about 0.883.
10−3
10−2
10−1
100
101
102
10−3
10−2
10−1
100
101
102
103
log jz =0.88271*log g
z +0.50051
R2 =0.99783
External Body Force, gz
Avera
ge C
onvective F
lux, <
j z>
Figure 7.3: The steady-state mean convective flux through the pore as a function ofthe strength of the constant body force applied to the system.
7.3.2 Macromolecular Pore Blocking
The macromolecular model is represented by a freely jointed chain, which is con-
structed by connecting particle beads with a harmonic bond of length, r0. These con-
stituent beads are modelled as unique beads. The interactions between these beads
are only derived from the basic DPD forces (conservative, dissipative and random)
and the bond interaction. Other intramolecular interactions, such as electrostatic
forces, are neglected in the present model.
153

Differently sized polymer chains are constructed by varying the number of con-
stituent beads, N . Therefore, for convenience, N is used to represent the size of the
chain. After construction, the polymer chain is immersed in the simulation box filled
with water particles to equilibrate. The equilibrated polymer possesses a randomly
coiled shape. The unperturbed size of the polymer chain is then determined as the
root of the mean-square radius of gyration, < R2g >
0.5 over 10,000 samples. The
results are shown in Fig. 7.4. Compared with the theoretical results [8], the model
0 50 100 150 200 250 3001
1.5
2
2.5
3
3.5
4
4.5
5
Polymer Length, N
< R
g2>
0.5
Simulated
Theoretical
Figure 7.4: The root of the mean-square radius of gyration as a function of the lengthof the polymer. Dotted data were obtained from simulation and the curve stands forthe theoretical values obtained from < R2
g >0.5= (16Nr
20)0.5 for a freely jointed polymer
model [8].
behaves well as an ideal flexible polymer.
The ratio of the unperturbed radius of the polymer to the pore radius, λ, is an
important parameter during pore blocking. Since the model pore has a radius of 2.0,
this means λ ≈ 1.0 when the polymer has N = 50.
The equilibrated polymer chain is added to the near-inlet end of the simulation
box and its molecular centre is fixed at the same spot until a steady flow is generated
in the pore channel. The polymer chain is, then, set free to be carried away by
the flow towards the pore entrance. For most runs, the molecule drifted in the flow
direction, i.e., the longitudinal direction. However, under smaller body forces (g <
0.1), the intermolecular interactions (i.e. mainly attributed to the random force) are
154

strong enough to cause slow diffusion of the polymer in the transverse sections of the
simulation box. Therefore, it usually takes a longer simulation time for the molecule
to approach the pore entrance under a small body force.
When the polymer chain arrives at the region just above the pore entrance, the
strong converging flow field creates a pulling force on the chain beads. If the chain
diameter is smaller than the pore diameter (λ < 1), the molecule enters the pore and
is eventually transferred to the permeate side of the simulation box. Otherwise, if the
chain has a larger diameter (λ > 1), the size of the pore becomes a physical barrier for
it to pass through to the other side. Thus, the polymer has a higher probability to be
retained on the feed side and, due to a continuous push by the water particles coming
from the inlet, the polymer would be likely to dwell at the pore entrance and hence
partially block the pathway of the water particles. Note that this blockage is only
partial because the molecule is not completely solid in the model and allows water
particles to continue travelling to the permeate side but at a reduced rate. When
such blockage is observed in a simulation, the run is marked as a fouling case. For
each simulation condition, i.e. various combinations of the imposed body force and
polymer size, a total of 100 runs were conducted. The number of cases where the
pore blockage occurred are recorded and presented as the fouling probability, Pblock.
The results are plotted in Fig. 7.5.
According to the simulation results, when the external body force is small and
the resultant water flux in the channel, measured when it is still fully open, is low
(i.e. 〈j〉 < 0.2 corresponding to gz < 0.05), the size exclusion phenomena are more
frequently observed, especially for longer chains (i.e. N > 100). For chains with N
equal to 250, a total of 99 out of 100 simulation runs experience pore blocking at the
lowest flux, 〈j〉 = 0.05 (i.e., at g = 0.01), used in the experiment, while for chains
with N less than 75, there is no blocking (Pblock = 0) observed in all the simulations
because their size is too small to be retained by the pore used in the simulations. In
fact, small chains with N equal to 25 and 50 does not demonstrate blocking through
the whole range of pore fluxes studied.
When the imposed body force increases, the average water flux through the open
pore increases. For small chains, it does not have a large effect since the blocking cases
are already rare at low fluxes. However, in general, an increased flux dramatically
reduces the occurrence of pore blocking. When the fluxes are higher than 1.0 (i.e.,
g > 0.2) , fouling is only observed in less than 10 % of simulations for long chains
(N > 100). When the fluxes are even higher (〈j〉 = 2.0 at g = 1.0), there are only a
155

10−2
10−1
100
101
0
10
20
30
40
50
60
70
80
90
100
Average Open Pore Water Flux, <j>
Pro
ba
bili
ty o
f F
ou
ling
, P
blo
ck (
%)
25
50
75
100
150
200
250
Chain Contour Length, N
Figure 7.5: Pore blocking probability, Pblock, at different system conditions, i.e. poreconvective flux and polymer chain length.
10−2
10−1
100
101
0
0.1
0.2
0.3
0.4
0.5
0.6
0.7
0.8
0.9
1
Average Open Pore Water Flux, <j>
Pro
ba
bili
ty o
f S
ucce
ssfu
l T
ran
sm
issio
n,
Ppass
25
50
75
100
150
200
250
Chain Contour Length, N
Figure 7.6: The probability of successful translocation of the polymer chain, Ppass,versus the average pore convective flux for various polymer chain lengths.
156

few observed blockages in those cases with chains of length 200 and 250. For other
smaller chains, the high flow field allows a completely successful passing through the
pore.
When the blocking is reduced at higher fluxes, more successful cases of transloca-
tion of a long chain through a small pore is observed correspondingly. By conjugating
the blocking probability, the probability of the successful transmission is plotted in
Fig. 7.6. The state of high is, in general, at high permeate fluxes while the state of low
pass at low fluxes. Between these two states, the transitional phase is when fluxes are
between 0.1 to 1.0 with reduced DPD units. For large polymer chains, the shape of
the curves resembles that of the sieving curves obtained in the laboratory experiments
in Fig. 6.5. When the flux is higher than certain values which are highly likely within
the transitional range, the high probability of transmission of the polymer essentially
contributes to the increased sieving rate. Hence, the simulation results prove the
flux-dependent transmission during UF of macromolecules and support the theory of
the threshold flux, of which the value lies within the transitional range.
However, the sharp decay of the sieving coefficients in Fig. 6.1 and the high ir-
reversible fouling of DB at high TMPs (corresponding to high permeate fluxes) also
indicate that, controversially, the high transmission probability in the simulation may
relate to the eventual formidable macromolecular fouling in reality. This is not a prob-
lem of divergence between simulations and observations but it rather reflects on the
limitation of the present model. The confinement of the length and time scales in the
DPD method limits its capability to model the complete UF fouling event, currently.
Our model only represents a tiny portion on the membrane skin. The pore length in
the simulation is not in proportion to that in the reality. Nevertheless, the simulated
transmission event can precisely represent the transfer of the polymer from the surface
into the inside of the pore structure, which is likely a phenomenon existing during
the initial state in the UF of dilute macromolecules. Therefore, the probability of
the chain transmission can be related to the probability of successful translocations
of a polymer into the pore structure. As for what happens next, the present model
cannot simulate that.
The detailed translocation of large polymers (N > 100) in the simulation is dis-
cussed following. The event starts when the chain approaches the pore entrance,
where the flow converges. The converging flow is known to be elongational, pos-
sessing extensional strain components in the velocity gradient. For a polymer chain
157

within the gradient, the hydrodynamic drag forces (i.e., the dissipative force) expe-
rienced by different chain beads are of different magnitude depending on the relative
distance of a particular bead to the pore opening. Theory [248] suggests that once
the velocity gradient reaches a critical value, the difference between the drag forces on
the two ends of the chain becomes large enough to stretch it. The simulation results
have confirmed this. It appears that, at a close distance to the pore entrance, one end
(closest to the pore opening) of the chain is pulled into the pore first, while the other
parts of the chain are still on the outside of the pore. The chain then undergoes a
conformational deformation from a randomly coiled shape to an elongated state due
to the space confinement in the small pore. At intermediate degrees of penetration,
the part of the chain that remains out of the pore struggles to retain the coiled con-
formation. This phenomenon was also observed in previous Monte-Carlo simulations
[287, 288]. These polymer translocations have also been studied elsewhere recently
[271, 276].
The theory [249] also predicts the ‘coil-to-stretch’ transition to be sharp, but
this does not apply here. For polymers of length 250 and 200, before they can
be largely predicted for successful transmission, the probability is at intermediate
values over a noticeable range of fluxes as Fig. 7.6 shows. The reason for the gradual
increase of the probability in the simulation is first that the pore geometry used in the
simulation causes a more complex velocity gradient, having other components besides
the elongational strain rate. This causes more unpredictable movements of the chain
beads. Secondly, the polymer bead has a finite size comparable to the pore radius
and the chain is not pre-directed towards the pore centre. The transmission somehow
depends on which parts of the chain reach the pore first. When the end of the chain
is first dragged into the pore, the chain will be stretched out into a single chain of
beads through the pore. In this case, the chain can go through the pore channel
more smoothly. In other cases when the middle part of the chain penetrates into the
pore first, the chain will enter the pore in a double-folded shape. In this situation,
the chain beads are more squeezed in the confined pore region so that the polymer
experiences more resistance from the pore channel. The flux may be adequate to
elongate the chain but not high enough to further push the beads down the channel.
Hence, the polymer may just be stopped at the pore entrance while the majority of
its beads is still outside of the pore to form a surface blocking.
158

7.3.3 Mapping Simulated Results to Physical Scales
There is not yet a direct connection between the model parameters used in DPD
and actual molecular parameters, such as molecular weight. Therefore, only a rough
mapping strategy, which tries to link the simulation results to the empirically obtained
quantities [289], has been used in the current study. Since the actual pores in the
UF membranes discussed in Chapter 6 have been estimated to possess an average
pore radius of 4.4 nm, the length scale in the DPD simulation can then be assigned
accordingly using the relationship, i.e. rp = 2.0rc ≡ 4.4nm. Thus, the radii of
gyration of the unperturbed polymers determined in Fig. 7.4 correlate to the physical
sizes ranging from 3.12 nm (N = 25) to 10.0 nm (N = 250). Assuming the neutral,
linear, and flexible polymer chain considered here can represent a generic group of
macromolecules such as dextran and PEO, the longest chain used in the simulation
(λ ≈ 2.0) may in fact represent the DB samples used in the experiments.
Since the threshold flux was estimated at approximately 50 µm/s in Fig. 6.5 for
DB experiments, the threshold flux for high probability of transmission occurring in
the simulation with the chain of N = 250 can similarly be estimated to about 1.0
with a unit of rc/t. Assuming a linkage between these two values, the time unit in
the simulation can then be approximated at 4.4× 10⁻⁵ s.
7.4 Conclusions
In this chapter, the macromolecular pore blocking phenomenon has been studied
using a particle-based DPD model. The simulation system consists of a fraction of a
membrane surface containing a single pore in the middle, filled with a large number
of solvent fluid particles. The flow field is generated by imposing external body forces
on the solvent particles. The Poiseuille flow is formed in the pore channel when the
body force is higher than 0.01 kBT/rc. Further increase in the strength of the body
force leads to higher fluxes in the pore channel. The results show that a power-law
relationship exists between the average pore flux and the strength of the body force.
The macromolecule is modelled as a freely jointed chain with different sizes. The
chain is added to the pore flow system individually. When there is no flow, the model
chain naturally coils up in the simulation, faithfully representing the conformation of
a linear flexible polymer in reality. When the flow is created, the polymer chain is
dragged by the hydrodynamic force imposed by the solvent around towards the pore
convergence. At low fluxes, large chains are retained on the pore opening, forming
159

surface blockage. However, when the flux becomes higher than a certain value, the
chain starts to be pulled into the pore channel and stretched out to pass through
the pore into the permeate side. This translocation event occurs more and more
frequently when the pore flux further increases. Correspondingly, the probability
of surface blocking is reduced . Shortly, almost all the simulation runs obtain the
polymer transmission even for the largest chain when the pore flux reaches a certain
high value. The simulation results have been compared with the sieving results from
the macromolecular experiments in Chapter 6. The transmission curves in the two
studies resemble with each other. Both show the gradual transition from low to high
macromolecular transmission when the permeate fluxes increase.
These findings demonstrate that DPD as a mesoscopic simulation method is an
effective (relatively fast) simulation technique for studying the fouling phenomenon
at the pore entrance. In future work, it may be extended to study more complex
phenomenon such as the semi-dilute case where more than one polymer molecule
exists or even internal fouling.
160

Chapter 8
Concluding Remarks and Future
Work
8.1 Concluding Remarks
The objective of this research was to gain a better understanding of the macromolecu-
lar fouling in ultrafiltration. Firstly, the work started with a comprehensive literature
review in order to identify the type of the macromolecules for UF fouling of inter-
est. This involved the study of an existing knowledge on membrane fouling related
to macromolecular ultrafiltration and the study of membrane cleaning, particularly
with regard to the cleaning of UF membranes subject to macromolecular fouling.
Secondly, a comprehensive theoretical approach to the modelling of fouling resulted
in combined models for two complex fouling scenarios. The experimental studies of
macromolecular fouling in UF were carried out to observe the influence of the feed
types, the feed bulk concentration, and the effect of TMP. The combined models were
then used as appropriate to examine the mechanisms involved in the fouling process
of these macromolecules at various TMPs and bulk concentrations. The overall foul-
ing behaviour, the initial fouling behaviour, and the predominant fouling mechanism
were identified. The switch point between one fouling mechanism and another, as
well as the parameters used in the model were also determined. Thirdly, the effect
of deformability of a macromolecule on membrane fouling was examined. Firstly,
the sieving and reversibility results from the experiments were investigated. And
furthermore, a mesoscopic model using Dissipative Particle Dynamics (DPD) was de-
161

veloped to simulate the pore blocking event at the pore entrance in the presence of
a deformable linear macromolecule. The hydrodynamic force which may be linked to
the threshold flux at which there is an onset of severe fouling was determined. This
corresponds to whether a chain is sufficiently stretched or not to enable it to engage
in pore plugging.
Fouling in UF is very complicated and far from being fully understood. The un-
derlying physics are difficult to identify, whereas the widely accepted analysis method
is to consider the four extreme cases of fouling, i.e., the four classical blocking mod-
els. The main advantage of using the classical blocking laws to determine the fouling
mechanisms is their simplicity. They only need the time-volume-TMP data, which can
be easily measured in experiments, to predict the flux decline behaviour. However, in
many macromolecular fouling cases, studies have shown the flux decline in membrane
filtration consists of multiple steps. These simple laws cannot satisfactorily fit to the
data in these cases. However, the use of a combination of various fouling laws to
construct more comprehensive models to predict the flux decline has been attempted
in some recent studies [83, 88]. These models should account for the complex nature
of fouling where multiple processes may develop either simultaneously or sequentially
during filtration.
A multi-scale framework for developing complex fouling models was developed in
Chapter 4. This approach assumes that the membrane consists of independent pores
and the overall behaviour can be statistically summarised or averaged over all its
pores. Thence, the average fouling behaviour can be analysed first at the pore scale.
Based on the knowledge of the four classical blocking laws, two likely scenarios were
considered. In the first case where particles have larger sizes than the pores, pore
blocking takes place first, followed by the cake growth. In the second case where the
feed contains a mixture of small and large particles, the consecutive pore blocking
and cake filtration is still held valid and, in addition, smaller particles can engage in
internal fouling until the pores are sealed. The mathematical model for the fouling
dynamics in a single pore was deduced from the classical blocking laws as appropriate.
In these two scenarios, the blocking time is an important parameter, which determines
the time for the flux behaviour changing from one mode to the other. By analysis,
the blocking time has a statistical distribution over all the pores constituting the
whole membrane area. Therefore, by averaging the fluxes over all the pores with the
distribution function, the mean permeate flux was determined for each time steps in
the membrane filtration. The flux represents the predicted macroscopic permeation
that one can compare with that measured in a filtration experiment.
162

The developed macroscopic models were then tested to study the flux decline be-
haviour in a lab-scale UF experiment as reported in Chapter 5. Three macromolecular
feeds of different sizes and characteristics were chosen to generate primary data for
the models. Model A (pore blocking and cake filtration) was found to be appropriate
for UF (MWCO = 100 kDa) of dextran blue (DB, 2000 kDa) and UF of polyethylene
oxide (PEO, 100 kDa), respectively, since these two polymers had large sizes com-
pared to the membrane used. The third model macromolecule, HA, was chosen for
its practical importance. HA is a mixture of natural occurring humic substances hav-
ing a broad range of size and containing different functional groups, which has been
identified as the major foulant in water and wastewater industries. Since HA samples
were determined having large fractions smaller than the pore dimensions, Model B
(pore constriction, blocking and cake filtration) was found to fit to its flux-decline
data. Comparing with the experimental results on the profile of flux decline under
different filtration conditions (varying bulk concentration or TMPs), the model ac-
curately described the fouling behaviour over the whole filtration course with model
parameters determined from the best-fit results. The values of the resultant param-
eters were consistent over different conditions and this gave further validation of the
models.
The use of integral and differential methods to explicitly determine the temporal
evolution of fouling mechanisms has confirmed confirmed that cake filtration was the
dominant fouling mechanism at the long term of the filtration for all conditions. On
the contrary, these methods were found to be too simplistic for the early stage of
fouling. Due to the interplay of different mechanisms at the same time, the overall
fouling can not be predicted by a single classical fouling law.
In Chapter 6, the sieving results from the experiments were revealed, along with
the fouling irreversibility results. There were strong evidences of flow-induced defor-
mation of macromolecules in the DB case of high TMPs. This phenomenon is also
likely to cause a more severe and irreversible fouling.
A mesoscopic model using DPD method was developed to model such flow-induced
deformation of a polymer chain at the pore entrance in Chapter 7. By varying the
strength of the hydrodynamic forces in the model, the threshold flux at which a
polymer can be stretched and has higher probabilities to enter the pore was obtained.
163

8.2 Future Work
There exist many exciting possibilities for future work stemming from this thesis.
• Experiments of cleaning methods on macromolecular fouling. Based on the crit-
ical review on membrane cleaning, physical cleaning of macromolecular fouling
is often of limited effect, while chemical cleaning is often time consuming and
not economical. Therefore, either improvement on chemical cleaning or finding
novel methods to clean the macromolecular foulants, such as HA, is of practical
interest.
• Development of physical model for fouling parameters. In the present work,
these fouling parameters including pore blocking rate, additional pore blockage
resistance, specific cake resistance and pore constriction rate were determined
statistically best-fitting to the experimental data. However, these parameters
have their own physical meanings, and therefore, may be determined indepen-
dently prior to fouling results. Studies on them should be of great interest.
• Further theoretical work on pore-scale models. The present pore-scale model
in the combined fouling model has simply adopted the foundation of the clas-
sical fouling laws. However, when other effects other than pure steric, such as
electrostatic interaction or other specific forces, existing between the solute and
the pores, more realistic and of course more complex models need to be devel-
oped. Under the multi-scale analytical framework developed in this document,
a more extensive macroscopic fouling model is possible to be constructed for
more complex situations.
• Enlarged range of foulants and membrane choices. In the sieving tests, only one
type of membrane is used here. In a more comprehensive study, membranes with
several different sizes and dextrans with different dimensions may be used in a
scaled-up experiments.
• Extension of DPD model. DPD method is relatively new method to simulate
the hydrodynamics at the mesoscale and itself is still an ongoing research topic.
There are many potentials to employ this method in fouling study especially to
obtain the nature of the complex fluids in the membrane matrix, which can not
easily be observed by the usual techniques. For the particular work, the model
can be extended to investigate both the effect of the size of the molecules and
the rigidity in its shape on the macromolecular capture by the pore structure.
164

Nomenclature
Symbols
A membrane area, [m2]
aij pairwise conservative force coefficient in DPD, [kg m2 s−2]
Cb bulk concentration of the feed solutes, [kg m−3]
De well depth in Morse potential, [-]
dp equivalent diameter of the pore cross-section. [m]
ds equivalent diameter of the solute, [m]
e unit vector, [-]
J permeate flux, [ms−1]
Jn normalised permeate flux, [-]
J∗ steady state flux, [ms−1]
k(n) filtration constant in eqn 2.2, its form depending on the constant n
kB Boltzmann constant, [J K−1]
165

M consistency index for power-law model, [Pa sN ]
N exponent of the shear rate in power-law model, [-]
Nb number of beads in a polymer chain in DPD, [-]
Np number of pores, [-]
n filtration constant in eqn 2.2, [-]
p permeability of a membrane, which is reciprocal to membrane resistance, [m]
pn the normalised permeability of a membrane, [-]
Q flow rate of permeation, [m3 s−1]
R resistance of a porous medium, [m−1]
Rc fouling cake resistance, [m−1]
Rm clean membrane resistance, [m−1]
Rt total membrane resistance, [m−1]
r0 equilibrium distance of a bond in DPD, [m]
rc cutoff distance of DPD model, [m]
re equilibrium distance in Morse potential used in DPD, [-]
rp pore radius, [m]
166

T absolute temperature, [K]
t unit time in DPD, [s]
v flow velocity, [ms−1]
Greek Symbols
α specific cake resistance, [mkg−1]
β pore constriction constant, [kg−1]
∆P pressure difference across a porous medium, also transmembrane pressure, [Pa]
δm membrane thickness, [m]
γij pairwise dissipative force coefficient in DPD, [kg s−1]
γ shear rate, [s−1]
η non-Newtonian viscosity, [Pa s]
µ Newtonian viscosity, [Pa s]
ν well width in Morse potential, [-]
σ blocked area per unit mass of particles being filtered, [m2 kg−1]
σij stochastic coefficient in the pairwise random force of DPD, [kg ms−3/2]
φ volume of particles deposited onto the pore surface per unit weight of solutes
being filtered, [m3 kg−1]
167

Abbreviations
CEB chemically enhanced backwashing
CFV crossflow velocity
CIP cleaning in place
CMC critical micelle concentration
COP cleaning off place
DPD dissipative particle dynamics
EDL electrical double layer
EPS extracellular polymer substances
LHS left hand side
MBR membrane bioreactor
MF mircrofiltration
MPM multiple photon microscopy
MW molecular weight
MWCO molecular weight cutoff
NF nanofiltration
NOM natural organic matter
RO reverse osmosis
168

TMP trans-membrane pressure
UF ultrafiltration
169

Bibliography
[1] G. Geise, H.-S. Lee, D. Miller, B. Freeman, J. McGrath, D. Paul, Water purifi-
cation by membranes: The role of polymer science, Journal of Polymer Science,
Part B: Polymer Physics 48 (2010) 1685–1718.
[2] R. L. Wershaw, J. A. Leenheer, L. Cox, Characterization of dissolved and par-
ticulate natural organic matter (NOM) in Nevenrsink Reservoir, New York,
Technical Report, U.S. Department of the Interior and U.S. Geological Survery,
2005.
[3] R. W. Baker, Membrane technology and applications, Chichester : Wiley, 2nd
edition, 2004.
[4] E. Gaudichet-Maurin, F. Thominette, Ageing of polysulfone ultrafiltration
membranes in contact with bleach solutions, Journal of Membrane Science
282 (2006) 198 – 204.
[5] F. Thominette, O. Farnault, E. Gaudichet-Maurin, C. Machinal, J.-C. Schrot-
ter, Ageing of polyethersulfone ultrafiltration membranes in hypochlorite treat-
ment, Desalination 200 (2006) 7 – 8.
[6] E. Arkhangelsky, D. Kuzmenko, V. Gitis, Impact of chemical cleaning on prop-
erties and functioning of polyethersulfone membranes, Journal of Membrane
Science 305 (2007) 176 – 184.
[7] K. Yadav, K. Morison, M. P. Staiger, Effects of hypochlorite treatment on the
surface morphology and mechanical properties of polyethersulfone ultrafiltra-
tion membranes, Polymer Degradation and Stability 94 (2009) 1955 – 1961.
[8] M. Rubinstein, R. H. Colby, Polymer Physics, Oxford University Press, 2003.
170

[9] R. W. Field, Fundamentals of fouling, in: K.-V. Peinemann, S. P. Nunes (Eds.),
Membranes for Water Treatment: Volume 4, WILEY-VCH Verlag, 2010, pp.
1–22.
[10] M. Pilutti, J. E. Nemeth, Technical and cost review of commercially available
MF/UF membrane products, Technical Report, Harn R/O, 2003.
[11] I. E. McAliley, P. D’Adamo, Advances in membrane treatment lead to more
cost-effective options for drinking water providers, in: 2009 Annual Conference
Technical Papers, North Carolina American Water Works Association and the
North Carolina Water Environment Association.
[12] Millipore, Ultrafiltration Membranes Opetrating Instructions, Millipore Corpo-
ration, 2011.
[13] M. Cheryan, Ultrafiltration handbook, Technomic Publishing Company, Inc.,
1986.
[14] B. Van Der Bruggen, C. Vandecasteele, T. Van Gestel, W. Doyen, R. Leysen,
A review of pressure-driven membrane processes in wastewater treatment and
drinking water production, Environmental Progress 22 (2003) 46–56.
[15] D. Hughes, T. Taha, Z. Cui, Mass Transfer: Membrane Processes, in: S. S.
Sablani (Ed.), Handbook of food and bioprocess modeling techniques, CRC, Boca
Raton, Fla., 2007, pp. 145–177.
[16] G. Foley, Membrane Filtration: A Problem Solving Approach with MATLAB,
Cambridge University Press, 2013.
[17] J. M. M. Peeters, Characterization of Nanofiltration Membranes, Ph.D. thesis,
University of Twente, 1997.
[18] A. I. Schafer, A. G. Fane, T. D. Waite, Nanofiltration: Principles and Applica-
tions, Elsevier, 2005.
[19] G. Belfort, R. Davis, A. Zydney, The behavior of suspensions and macromolec-
ular solutions in crossflow microfiltration, Journal of Membrane Science 96
(1994) 1–58.
171

[20] S. Kommineni, J. Bryck, C. Stringer, C. Stevens, N. Meyers, B. Karnik, R. Hoff-
man, L. Sullivan, Evaluation of an emerging water treatment technology: Ce-
ramic membranes, Water Science and Technology: Water Supply 10 (2010)
765–770.
[21] P. Bacchin, P. Aimar, R. Field, Critical and sustainable fluxes: Theory, exper-
iments and applications, Journal of Membrane Science 281 (2006) 42 – 69.
[22] A. L. Zydney, Stagnant film model for concentration polarization in membrane
systems, Journal of Membrane Science 130 (1997) 275 – 281.
[23] S. S. Vasan, Analysis of mass transfer in ultrafiltration, Ph.D. thesis, University
of Oxford, 2005.
[24] N. M. D’Souza, A. J. Mawson, Membrane Cleaning in the Dairy Industry: A
Review, Critical Reviews in Food Science and Nutrition 45 (2005) 125–134.
[25] K. Kimura, Y. Hane, Y. Watanabe, G. Amy, N. Ohkuma, Irreversible membrane
fouling during ultrafiltration of surface water, Water Research 38 (2004) 3431–
3441.
[26] S. C. Tu, V. Ravindran, M. Pirbazari, A pore diffusion transport model for fore-
casting the performance of membrane processes, Journal of Membrane Science
265 (2005) 29–50.
[27] K. L. Jones, C. R. O’Melia, Protein and humic acid adsorption onto hydrophilic
membrane surfaces: Effects of pH and ionic strength, Journal of Membrane
Science 165 (2000) 31–46.
[28] A. E. Childress, M. Elimelech, Effect of solution chemistry on the surface
charge of polymeric reverse osmosis and nanofiltration membranes, Journal of
Membrane Science 119 (1996) 253 – 268.
[29] L. J. Zeman, A. L. Zydney, Microfiltration and ultrafiltration : principles and
applications, New York : Dekker, 1996.
[30] J. Hermia, Constant pressure blocking filtration laws - application to power-law
non-newtonian fluids., Transactions of The Institution of Chemical Engineers
60 (1982) 183–187.
172

[31] R. W. Field, J. J. Wu, Modelling of permeability loss in membrane filtration:
Re-examination of fundamental fouling equations and their link to critical flux,
Desalination 283 (2011) 68 – 74.
[32] C. Guell, P. Czekaj, R. H. Davis, Microfiltration of protein mixtures and the
effects of yeast on membrane fouling, Journal of Membrane Science 155 (1999)
113–122.
[33] D. Hughes, R. Field, Crossflow filtration of washed and unwashed yeast sus-
pensions at constant shear under nominally sub-critical conditions, Journal of
Membrane Science 280 (2006) 89 – 98.
[34] D. Jermann, W. Pronk, R. Kgi, M. Halbeisen, M. Boller, Influence of interac-
tions between NOM and particles on UF fouling mechanisms, Water Research
42 (2008) 3870–3878.
[35] D. Jermann, W. Pronk, M. Boller, Mutual influences between natural organic
matter and inorganic particles and their combined effect on ultrafiltration mem-
brane fouling, Environmental Science and Technology 42 (2008) 9129–9136.
[36] Q. Li, M. Elimelech, Synergistic effects in combined fouling of a loose nanofil-
tration membrane by colloidal materials and natural organic matter, Journal
of Membrane Science 278 (2006) 72–82.
[37] M. C. Porter, Concentration Polarization with Membrane Ultrafiltration, Prod-
uct R&D 11 (1972) 234–248.
[38] A.-S. Jonsson, B. Jonsson, Colloidal Fouling during Ultrafiltration, Separation
Science and Technology 31 (1996) 2611–2620.
[39] D. Jermann, W. Pronk, S. Meylan, M. Boller, Interplay of different NOM
fouling mechanisms during ultrafiltration for drinking water production, Water
Research 41 (2007) 1713 – 1722.
[40] G. Amy, Fundamental understanding of organic matter fouling of membranes,
Desalination 231 (2008) 44 – 51.
[41] W.-Y. Ahn, A. Kalinichev, M. Clark, Effects of background cations on the
fouling of polyethersulfone membranes by natural organic matter: Experimental
and molecular modeling study, Journal of Membrane Science 309 (2008) 128–
140.
173

[42] R. W. Field, G. K. Pearce, Critical, sustainable and threshold fluxes for mem-
brane filtration with water industry applications, Advances in Colloid and
Interface Science 164 (2011) 38 – 44.
[43] X. Shi, R. Field, N. Hankins, Review of fouling by mixed feeds in membrane
filtration applied to water purification, Desalination and Water Treatment 35
(2011) 68–81.
[44] Z. Cui, Protein separation using ultrafiltration – an example of multi-scale
complex systems, China Particuology 3 (2005) 343–348.
[45] S. T. Kelly, A. L. Zydney, Protein fouling during microfiltration: Compara-
tive behavior of different model proteins, Biotechnology and Bioengineering 55
(1997) 91–100.
[46] C. Jucker, M. M. Clark, Adsorption of aquatic humic substances on hydrophobic
ultrafiltration membranes, Journal of Membrane Science 97 (1994) 37 – 52.
[47] M. Kulovaara, S. Metsamuuronen, M. Nystrom, Effects of aquatic humic sub-
stances on a hydrophobic ultrafiltration membrane, Chemosphere 38 (1999)
3485 – 3496.
[48] W. Yuan, A. Zydney, Humic acid fouling during microfiltration, Journal of
Membrane Science 157 (1999) 1–12.
[49] A. I. Schafer, Natural organics removal using membranes: principles, perfor-
mance and cost, Technomic Publishing Company, Inc., 2001.
[50] I. Sutzkover-Gutman, D. Hasson, R. Semiat, Humic substances fouling in ul-
trafiltration processes, Desalination 261 (2010) 218 – 231.
[51] E. Aoustin, A. I. Schafer, A. G. Fane, T. D. Waite, Ultrafiltration of natural
organic matter, Separation and Purification Technology 22-23 (2001) 63–78.
[52] S. D. Richardson, The role of GC-MS and LC-MS in the discovery of drinking
water disinfection by-products, Journal of Environmental Monitoring 4 (2002)
1–9.
[53] A. Zularisam, A. Ismail, R. Salim, Behaviours of natural organic matter in
membrane filtration for surface water treatment – a review, Desalination 194
(2006) 211 – 231.
174

[54] L. Fan, J. L. Harris, F. A. Roddick, N. A. Booker, Influence of the characteristics
of natural organic matter on the fouling of microfiltration membranes, Water
Research 35 (2001) 4455 – 4463.
[55] A. I. Schafer, A. G. Fane, T. D. Waite, Nanofiltration of natural organic matter:
Removal, fouling and the influence of multivalent ions, Desalination 118 (1998)
109–122.
[56] J. Hanemaaijer, T. Robbertsen, T. van den Boomgaard, J. Gunnink, Fouling of
ultrafiltration membranes: the role of protein adsorption and salt precipitation,
Journal of Membrane Science 40 (1989) 199 – 217.
[57] K. Scott, Handbook of Industrial Membranes, Elsevier, New York, 1995.
[58] S. Li, S. Heijman, J. Verberk, P. L. Clech, J. Lu, A. Kemperman, G. Amy, J. van
Dijk, Fouling control mechanisms of demineralized water backwash: Reduction
of charge screening and calcium bridging effects, Water Research 45 (2011)
6289 – 6300.
[59] P. Le-Clech, V. Chen, T. Fane, Fouling in membrane bioreactors used in wastew-
ater treatment, Journal of Membrane Science 284 (2006) 17–53.
[60] V. Chen, J. Mansouri, T. Charlton, Biofouling in Membrane Systems, in: K.-V.
Peinemann, S. P. Nunes (Eds.), Membranes for Water Treatment, WILEY-VCH
Verlag, 2010, p. 25.
[61] E. Tombacz, Z. Libor, E. Ills, A. Majzik, E. Klumpp, The role of reactive
surface sites and complexation by humic acids in the interaction of clay mineral
and iron oxide particles, Organic Geochemistry 35 (2004) 257 – 267.
[62] E. Tombacz, M. Szekeres, Surface charge heterogeneity of kaolinite in aqueous
suspension in comparison with montmorillonite, Applied Clay Science 34 (2006)
105 – 124.
[63] K. L. Chen, S. E. Mylon, M. Elimelech, Aggregation Kinetics of Alginate-
Coated Hematite Nanoparticles in Monovalent and Divalent Electrolytes, En-
vironmental Science & Technology 40 (2006) 1516–1523.
[64] K. L. Chen, M. Elimelech, Influence of humic acid on the aggregation kinetics of
fullerene (C60) nanoparticles in monovalent and divalent electrolyte solutions,
Journal of Colloid and Interface Science 309 (2007) 126–134.
175

[65] A. E. Contreras, A. Kim, Q. Li, Combined fouling of nanofiltration membranes:
Mechanisms and effect of organic matter, Journal of Membrane Science 327
(2009) 87 – 95.
[66] R. S. Faibish, M. Elimelech, Y. Cohen, Effect of Interparticle Electrostatic
Double Layer Interactions on Permeate Flux Decline in Crossflow Membrane
Filtration of Colloidal Suspensions: An Experimental Investigation, Journal of
Colloid and Interface Science 204 (1998) 77 – 86.
[67] M. Wiesner, Morphology of Particle Deposits, Journal of Environmental Engi-
neering 125 (1999) 1124–1132.
[68] W. Yuan, A. L. Zydney, Humic Acid Fouling during Ultrafiltration, Environ-
mental Science & Technology 34 (2000) 5043–5050.
[69] K. Howe, M. Clark, Fouling of microfiltration and ultrafiltration membranes by
natural waters, Environmental Science and Technology 36 (2002) 3571–3576.
[70] A. I. Schafer, U. Schwicker, M. M. Fischer, A. G. Fane, T. D. Waite, Micro-
filtration of colloids and natural organic matter, Journal of Membrane Science
171 (2000) 151–172.
[71] Q. Li, M. Elimelech, Organic fouling and chemical cleaning of nanofiltration
membranes: Measurements and mechanisms, Environmental Science and Tech-
nology 38 (2004) 4683–4693.
[72] K. Katsoufidou, S. Yiantsios, A. Karabelas, An experimental study of UF
membrane fouling by humic acid and sodium alginate solutions: the effect of
backwashing on flux recovery, Desalination 220 (2008) 214 – 227.
[73] S. Allgeier, B. Alspach, J. Vickers, Membrane filtration guidance manual,
USEPA, 2005.
[74] P. H. Hermans, H. L. Bredee, Principles of the mathematical treatment of
constant-pressure filtration, J. Soc. Chem. Ind. 55 (1936) 1–4.
[75] H. P. Grace, Structure and performance of filter media II. Performance of filter
media in liquid service, AIChE Journal 2 (1956) 316–336.
[76] R. W. Field, D. Wu, J. A. Howell, B. B. Gupta, Critical flux concept for
microfiltration fouling, Journal of Membrane Science 100 (1995) 259 – 272.
176

[77] E. Iritani, A Review on Modeling of Pore-Blocking Behaviors of Membranes
During Pressurized Membrane Filtration, Drying Technology 31 (2013) 146–
162.
[78] M. Hlavacek, F. Bouchet, Constant flowrate blocking laws and an example of
their application to dead-end microfiltration of protein solutions, Journal of
Membrane Science 82 (1993) 285 – 295.
[79] S. Chellam, W. Xu, Blocking laws analysis of dead-end constant flux micro-
filtration of compressible cakes, Journal of Colloid and Interface Science 301
(2006) 248 – 257.
[80] C. Tien, B. V. Ramarao, Revisiting the laws of filtration: An assessment of
their use in identifying particle retention mechanisms in filtration, Journal of
Membrane Science 383 (2011) 17 – 25.
[81] W. Bowen, J. Calvo, A. Hernndez, Steps of membrane blocking in flux decline
during protein microfiltration, Journal of Membrane Science 101 (1995) 153 –
165.
[82] K.-J. Hwang, C.-Y. Liao, K.-L. Tung, Analysis of particle fouling during micro-
filtration by use of blocking models, Journal of Membrane Science 287 (2007)
287 – 293.
[83] C. C. Ho, A. L. Zydney, A combined pore blockage and cake filtration model for
protein fouling during microfiltration, Journal of Colloid and Interface Science
232 (2000) 389–399.
[84] M. Taniguchi, J. Kilduff, G. Belfort, Modes of natural organic matter fouling
during ultrafiltration, Environmental Science and Technology 37 (2003) 1676–
1683.
[85] G. Bolton, D. LaCasse, R. Kuriyel, Combined models of membrane fouling:
Development and application to microfiltration and ultrafiltration of biological
fluids, Journal of Membrane Science 277 (2006) 75 – 84.
[86] Y.-L. Cheng, D.-J. Lee, J.-Y. Lai, Filtration blocking laws: Revisited, Journal
of the Taiwan Institute of Chemical Engineers 42 (2011) 506 – 508.
177

[87] J. de Bruijn, F. Salazar, R. Brquez, Membrane Blocking In Ultrafiltration: A
New Approach to Fouling, Food and Bioproducts Processing 83 (2005) 211 –
219.
[88] C. Duclos-Orsello, W. Li, C. C. Ho, A three mechanism model to describe
fouling of microfiltration membranes, Journal of Membrane Science 280 (2006)
856–866.
[89] N. Porcelli, S. Judd, Chemical cleaning of potable water membranes: A review,
Separation and Purification Technology 71 (2010) 137 – 143.
[90] X. Shi, G. Tal, N. P. Hankins, V. Gitis, Fouling and cleaning of ultrafiltration
membranes: A review, Journal of Water Process Engineering 1 (2014) 121 –
138.
[91] G. Tragardh, Membrane cleaning, Desalination 71 (1989) 325 – 335.
[92] P. Blanpain-Avet, J. Migdal, T. Benezech, Chemical cleaning of a tubular
ceramic microfiltration membrane fouled with a whey protein concentrate sus-
pension - Characterization of hydraulic and chemical cleanliness, Journal of
Membrane Science 337 (2009) 153 – 174.
[93] C. Shorrock, M. Bird, Membrane cleaning: chemically enhanced removal of
deposits formed during yeast cell harvesting, Food and Bioproducts Processing
76 (1998) 30 – 38.
[94] S. Hong, T. Bae, T. Tak, S. Hong, A. Randall, Fouling control in activated
sludge submerged hollow fiber membrane bioreactors, Desalination 143 (2002)
219 – 228.
[95] S. Hong, R. S. Faibish, M. Elimelech, Kinetics of permeate flux decline in
crossflow membrane filtration of colloidal suspensions, Journal of Colloid and
Interface Science 196 (1997) 267 – 277.
[96] H. Chua, T. Arnot, J. Howell, Controlling fouling in membrane bioreactors
operated with a variable throughput, Desalination 149 (2002) 225 – 229.
[97] J. Verberk, H. van Dijk, Reserach on AirFlush : distribution of water and air
in tubular and capillary membrane modules, Water Science and Technology:
Water Supply 03 (2003) 409 – 414.
178

[98] H. Liang, W. Gong, J. Chen, G. Li, Cleaning of fouled ultrafiltration (UF)
membrane by algae during reservoir water treatment, Desalination 220 (2008)
267 – 272.
[99] W. Gao, H. Liang, J. Ma, M. Han, Z. lin Chen, Z. shuang Han, G. bai Li, Mem-
brane fouling control in ultrafiltration technology for drinking water production:
A review, Desalination 272 (2011) 1 – 8.
[100] J. Chen, S. Kim, Y. Ting, Optimization of membrane physical and chemical
cleaning by a statistically designed approach, Journal of Membrane Science
219 (2003) 27 – 45.
[101] J. G. Jacangelo, R. K. Noack, System Concepts, in: AWWA Manual 53:
Microfiltration and Ultrafiltration Membranes for Drinking Water, American
Water Works Association, 2005, pp. 51–64.
[102] S. Li, S. Heijman, J. Verberk, A. Verliefde, A. Kemperman, J. van Dijk, G. Amy,
Impact of backwash water composition on ultrafiltration fouling control, Jour-
nal of Membrane Science 344 (2009) 17 – 25.
[103] A. Abrahamse, C. Lipreau, S. Li, S. Heijman, Removal of divalent cations
reduces fouling of ultrafiltration membranes, Journal of Membrane Science 323
(2008) 153 – 158.
[104] S. Li, S. Heijman, J. Verberk, J. van Dijk, Influence of Ca and Na ions in
backwash water on ultrafiltration fouling control, Desalination 250 (2010) 861
– 864.
[105] R. Villarroel, S. Delgado, E. Gonzlez, M. Morales, Physical cleaning initia-
tion controlled by transmembrane pressure set-point in a submerged membrane
bioreactor, Separation and Purification Technology 104 (2013) 55 – 63.
[106] P. Lipp, State of the art in drinking water treatment by MF/UF in Germany -
A survey among MF/UF plants, Water Science and Technology: Water Supply
8 (2008) 377–381.
[107] A. Maartens, E. Jacobs, P. Swart, UF of pulp and paper effluent: membrane
fouling-prevention and cleaning, Journal of Membrane Science 209 (2002) 81 –
92.
179

[108] C. Psoch, S. Schiewer, Direct filtration of natural and simulated river water
with air sparging and sponge ball application for fouling control, Desalination
197 (2006) 190 – 204.
[109] H. Nagaoka, A. Tanaka, Y. Toriizuka, Measurement of effective shear stress
working on flat-sheet membrane by air-scrabbling, Water Science & Technology:
Water Supply 3 (2003) 423 – 428.
[110] C. Guigui, M. Mougenot, C. Cabassud, Air sparging backwash in ultrafiltra-
tion hollow fibres for drinking water production, Water Science & Technology:
Water Supply 3 (2003) 415 – 422.
[111] C. Psoch, S. Schiewer, Critical flux aspect of air sparging and backflushing on
membrane bioreactors, Desalination 175 (2005) 61 – 71.
[112] Z. Cui, T. Taha, Enhancement of ultrafiltration using gas sparging: a com-
parison of different membrane modules, Journal of Chemical Technology &
Biotechnology 78 (2003) 249–253.
[113] S. Laborie, C. Cabassud, L. Durand-Bourlier, J. Lain, Flux enhancement by a
continuous tangential gas flow in ultrafiltration hollow fibres for drinking water
production: Effects of slug flow on cake structure, Filtration & Separation 34
(1997) 887 – 891.
[114] C. Cabassud, S. Laborie, J. Laine, How slug flow can improve ultrafiltration
flux in organic hollow fibres, Journal of Membrane Science 128 (1997) 93 – 101.
[115] T. Y. Wu, N. Guo, C. Y. Teh, J. X. W. Hay, Advances in Ultrasound Technology
for Environmental Remediation, Springer, 2013.
[116] M. Kallioinen, M. Manttari, Influence of Ultrasonic Treatment on Various
Membrane Materials: A Review, Separation Science and Technology 46 (2011)
1388–1395.
[117] H. Kyllonen, P. Pirkonen, M. Nystrom, Membrane filtration enhanced by ul-
trasound: a review, Desalination 181 (2005) 319 – 335.
[118] A. L. Ahmad, N. F. Che Lah, S. Ismail, B. S. Ooi, Membrane Antifouling
Methods and Alternatives: Ultrasound Approach, Separation and Purification
Reviews 41 (2012) 318–346.
180

[119] M. O. Lamminen, H. W. Walker, L. K. Weavers, Mechanisms and factors influ-
encing the ultrasonic cleaning of particle-fouled ceramic membranes, Journal
of Membrane Science 237 (2004) 213 – 223.
[120] S. Muthukumaran, K. Yang, A. Seuren, S. Kentish, M. Ashokkumar,
G. Stevens, F. Grieser, The use of ultrasonic cleaning for ultrafiltration mem-
branes in the dairy industry, Separation and Purification Technology 39 (2004)
99 – 107.
[121] A. Mirzaie, T. Mohammadi, Effect of ultrasonic waves on flux enhancement in
microfiltration of milk, Journal of Food Engineering 108 (2012) 77 – 86.
[122] X. Chai, T. Kobayashi, N. Fujii, Ultrasound-associated cleaning of polymeric
membranes for water treatment, Separation and Purification Technology 15
(1999) 139 – 146.
[123] T. Kobayashi, X. Chai, N. Fujii, Ultrasound enhanced cross-flow membrane
filtration, Separation and Purification Technology 17 (1999) 31 – 40.
[124] T. Kobayashi, T. Kobayashi, Y. Hosaka, N. Fujii, Ultrasound-enhanced
membrane-cleaning processes applied water treatments: influence of sonic fre-
quency on filtration treatments, Ultrasonics 41 (2003) 185 – 190.
[125] J. H. Gibson, H. Hon, R. Farnood, I. G. Droppo, P. Seto, Effects of ultrasound
on suspended particles in municipal wastewater, Water Research 43 (2009)
2251 – 2259.
[126] S. Muthukumaran, S. Kentish, S. Lalchandani, M. Ashokkumar, R. Mawson,
G. W. Stevens, F. Grieser, The optimisation of ultrasonic cleaning procedures
for dairy fouled ultrafiltration membranes, Ultrasonics Sonochemistry 12 (2005)
29 – 35.
[127] X. Li, J. Yu, A. A. Nnanna, Fouling mitigation for hollow-fiber UF membrane
by sonication, Desalination 281 (2011) 23 – 29.
[128] I. Masselin, X. Chasseray, L. Durand-Bourlier, J.-M. Lain, P.-Y. Syzaret,
D. Lemordant, Effect of sonication on polymeric membranes, Journal of Mem-
brane Science 181 (2001) 213 – 220.
181

[129] M. O. Lamminen, H. W. Walker, L. K. Weavers, Cleaning of particle-fouled
membranes during cross-flow filtration using an embedded ultrasonic transducer
system, Journal of Membrane Science 283 (2006) 225 – 232.
[130] X. Chai, T. Kobayashi, N. Fujii, Ultrasound effect on cross-flow filtration of
polyacrylonitrile ultrafiltration membranes, Journal of Membrane Science 148
(1998) 129 – 135.
[131] A. Simon, N. Gondrexon, S. Taha, J. Cabon, G. Dorange, Low-Frequency Ul-
trasound to Improve Dead-End Ultrafiltration Performance, Separation Science
and Technology 35 (2000) 2619–2637.
[132] G. Rios, H. Rakotoarisoa, B. T. de la Fuente, Basic transport mechanisms of
ultrafiltration in the presence of an electric field, Journal of Membrane Science
38 (1988) 147 – 159.
[133] H. Huotari, G. Trgrdh, I. Huisman, Crossflow Membrane Filtration Enhanced
by an External {DC} Electric Field: A Review, Chemical Engineering Research
and Design 77 (1999) 461 – 468.
[134] A. Saxena, B. P. Tripathi, M. Kumar, V. K. Shahi, Membrane-based tech-
niques for the separation and purification of proteins: An overview, Advances
in Colloid and Interface Science 145 (2009) 1 – 22.
[135] W. Bowen, R. S. Kingdon, H. A. Sabuni, Electrically enhanced separation pro-
cesses: the basis of in situ intermittent electrolytic membrane cleaning (IIEMC)
and in situ electrolytic membrane restoration (IEMR), Journal of Membrane
Science 40 (1989) 219 – 229.
[136] L. Liu, J. Liu, B. Gao, F. Yang, Minute electric field reduced membrane fouling
and improved performance of membrane bioreactor, Separation and Purification
Technology 86 (2012) 106 – 112.
[137] P. von Zumbusch, W. Kulcke, G. Brunner, Use of alternating electrical fields
as anti-fouling strategy in ultrafiltration of biological suspensions Introduction
of a new experimental procedure for crossflow filtration, Journal of Membrane
Science 142 (1998) 75 – 86.
[138] A. Ahmad, N. Ibrahim, Automated electrophoretic membrane cleaning for
dead-end microfiltration and ultrafiltration, Separation and Purification Tech-
nology 29 (2002) 105 – 112.
182

[139] J.-P. Chen, C.-Z. Yang, J.-H. Zhou, X.-Y. Wang, Study of the influence of the
electric field on membrane flux of a new type of membrane bioreactor, Chemical
Engineering Journal 128 (2007) 177 – 180.
[140] N. Mameri, S. Oussedik, R. Yeddou, D. Piron, D. Belhocine, H. Lounici,
H. Grib, Enhancement of ultrafiltration flux by coupling static turbulence pro-
moter and electric field, Separation and Purification Technology 17 (1999) 203
– 211.
[141] N. Mameri, S. Oussedik, A. Khelifa, D. Belhocine, H. Ghrib, H. Lounici, Electric
fields applied in the ultrafiltration process, Desalination 138 (2001) 291.
[142] C. C. Tarazaga, M. E. Campderrs, A. P. Padilla, Physical cleaning by means of
electric field in the ultrafiltration of a biological solution, Journal of Membrane
Science 278 (2006) 219 – 224.
[143] K. Akamatsu, W. Lu, T. Sugawara, S. Nakao, Development of a novel fouling
suppression system in membrane bioreactors using an intermittent electric field,
Water Research 44 (2010) 825 – 830.
[144] B. Sarkar, S. DasGupta, S. De, Application of external electric field to en-
hance the permeate flux during micellar enhanced ultrafiltration, Separation
and Purification Technology 66 (2009) 263 – 272.
[145] J. M. Arnal, B. Garcia-Fayos, M. Sancho, Membrane cleaning, in: R. Y. Ning
(Ed.), Expanding issues in desalination, InTech, 2011.
[146] S. Strugholtz, K. Sundaramoorthy, S. Panglisch, A. Lerch, A. Brgger, R. Gim-
bel, Evaluation of the performance of different chemicals for cleaning capillary
membranes, Desalination 179 (2005) 191 – 202.
[147] J. C.-T. Lin, D.-J. Lee, C. Huang, Membrane Fouling Mitigation: Membrane
Cleaning, Separation Science and Technology 45 (2010) 858–872.
[148] T. Mohammadi, S. Madaeni, M. Moghadam, Investigation of membrane fouling,
Desalination 153 (2002) 155 – 160.
[149] L. Paugam, D. Delaunay, N. W. Diagne, M. Rabiller-Baudry, Cleaning of
skim milk PES ultrafiltration membrane: On the real effect of nitric acid step,
Journal of Membrane Science 428 (2013) 275 – 280.
183

[150] X. Li, J. Li, X. Fu, R. Wickramasinghe, J. Chen, Chemical cleaning of PS
ultrafilters fouled by the fermentation broth of glutamic acid, Separation and
Purification Technology 42 (2005) 181 – 187.
[151] R. Naim, I. Levitsky, V. Gitis, Surfactant cleaning of UF membranes fouled by
proteins, Separation and Purification Technology 94 (2012) 39 – 43.
[152] I. Levitsky, A. Duek, E. Arkhangelsky, D. Pinchev, T. Kadoshian, H. Shetrit,
R. Naim, V. Gitis, Understanding the oxidative cleaning of UF membranes,
Journal of Membrane Science 377 (2011) 206 – 213.
[153] H. Petrus, H. Li, V. Chen, N. Norazman, Enzymatic cleaning of ultrafiltration
membranes fouled by protein mixture solutions, Journal of Membrane Science
325 (2008) 783 – 792.
[154] I. Levitsky, A. Duek, R. Naim, E. Arkhangelsky, V. Gitis, Cleaning UF mem-
branes with simple and formulated solutions, Chemical Engineering Science 69
(2012) 679 – 683.
[155] I. Levitsky, R. Naim, A. Duek, V. Gitis, Effect of Time in Chemical Cleaning
of Ultrafiltration Membranes, Chemical Engineering & Technology 35 (2012)
941–946.
[156] D. Wu, M. R. Bird, The fouling and cleaning of ultrafiltration membranes
during the filtration of model tea component solutions, Journal of Food Process
Engineering 30 (2007) 293–323.
[157] H. Lee, G. Amy, J. Cho, Y. Yoon, S.-H. Moon, I. S. Kim, Cleaning strategies for
flux recovery of an ultrafiltration membrane fouled by natural organic matter,
Water Research 35 (2001) 3301 – 3308.
[158] X. Guo, H. Shao, W. Hu, H. Shen, Fouling potential and cleaning characteristics
of PVC ultrafiltration membrane during ultrafiltration of hydrophilic dissolved
organic matter, Desalination and Water Treatment 33 (2011) 231–239.
[159] X. Guo, Q. Li, W. Hu, W. Gao, D. Liu, Ultrafiltration of dissolved organic
matter in surface water by a polyvinylchloride hollow fiber membrane, Journal
of Membrane Science 327 (2009) 254 – 263.
184

[160] S. Pavlova, Study on the cleaning of new ultrafiltration spiral-woundmodules
to prevent membrane fouling (including biological fouling), Desalination 172
(2005) 267 – 270.
[161] Y. Zhang, J. Tian, H. Liang, J. Nan, Z. Chen, G. Li, Chemical cleaning of
fouled PVC membrane during ultrafiltration of algal-rich water, Journal of
Environmental Sciences 23 (2011) 529 – 536.
[162] S. T. Nguyen, F. A. Roddick, Chemical cleaning of ultrafiltration membrane
fouled by an activated sludge effluent, Desalination and Water Treatment 34
(2011) 94–99.
[163] A. Weis, M. R. Bird, M. Nystrom, The chemical cleaning of polymeric UF
membranes fouled with spent sulphite liquor over multiple operational cycles,
Journal of Membrane Science 216 (2003) 67 – 79.
[164] E. Plett, Cleaning of fouled surfaces, in: D. Lund, E. Plett, C. Sandu (Eds.),
Fouling and Cleaning in Food Processing, University of Wisconsin-Madison Ext
Dup, Wisconsin, 1985, p. 286.
[165] American Water Works Association (Ed.), Microfiltration and Ultrafiltration
Membranes for Drinking Waters, AWWA Manual 53, first edition, 2005.
[166] A. Al-Amoudi, R. W. Lovitt, Fouling strategies and the cleaning system of
NF membranes and factors affecting cleaning efficiency, Journal of Membrane
Science 303 (2007) 4 – 28.
[167] S. S. Razavi, J. Harris, F. Sherkat, Fouling and cleaning of membranes in the
ultrafiltration of the aqueous extract of soy flour, Journal of Membrane Science
114 (1996) 93 – 104.
[168] C. Brepols, K.Drensla, A. Janot, M. Trimborn, N. Engelhardt, Strategies for
chemical cleaning in large scale membrane bioreactors, Water Science and
Technology 57 (2008) 457–463.
[169] R. Krack, Fouling and cleaning in pressure driven membrane processes, Inter-
national Dairy Federation,, pp. 151–174.
[170] M. F. Cox, Detergents and cleaners: a handbook for formulators, 1994.
185

[171] N. G. Marriott, R. B. Gravani, Principles of Food Sanitation, Springer, New
York, 2006.
[172] K. H. Kroner, W. Hummel, J. Volkel, M.-R. Kula, Membranes and Membrane
Processes, Plenum, New York, p. 223.
[173] M. Munoz-Aguado, D. Wiley, A. Fane, Enzymatic and detergent cleaning of
a polysulfone ultrafiltration membrane fouled with BSA and whey, Journal of
Membrane Science 117 (1996) 175 – 187.
[174] M. A. Arguello, S. Alvarez, F. A. Riera, R. Alvarez, Enzymatic Cleaning of
Inorganic Ultrafiltration Membranes Fouled by Whey Proteins, Journal of Agri-
cultural and Food Chemistry 50 (2002) 1951–1958.
[175] S. Li, A New Concept of Ultrafiltration Fouling Control: Backwashing with Low
Ionic Strength Water, Ph.D. thesis, Technische Universiteit Delft, 2011.
[176] S. K. Lateef, B. Z. Soh, K. Kimura, Direct membrane filtration of municipal
wastewater with chemically enhanced backwash for recovery of organic matter,
Bioresource Technology 150 (2013) 149 – 155.
[177] C. Astudillo, J. Parra, S. Gonzlez, B. Cancino, A new parameter for membrane
cleaning evaluation, Separation and Purification Technology 73 (2010) 286 –
293.
[178] K. G. Tay, L. Song, A more effective method for fouling characterization in a
full-scale reverse osmosis process, Desalination 177 (2005) 95 – 107.
[179] D. J. Hughes, Novel tools for the analysis of fouling in microfiltration, Ph.D.
thesis, University of Oxford, 2006.
[180] V. Chen, H. Li, A. Fane, Non-invasive observation of synthetic membrane
processes a review of methods, Journal of Membrane Science 241 (2004) 23 –
44.
[181] P. Wang, Z. Wang, Z. Wu, Q. Zhou, D. Yang, Effect of hypochlorite cleaning on
the physiochemical characteristics of polyvinylidene fluoride membranes, Chem-
ical Engineering Journal 162 (2010) 1050 – 1056.
[182] E. Arkhangelsky, D. Kuzmenko, N. Gitis, M. Vinogradov, S. Kuiry, V. Gitis,
Hypochlorite Cleaning Causes Degradation of Polymer Membranes, Tribology
Letters 28 (2007) 109–116.
186

[183] M. Rabiller-Baudry, L. Begoin, D. Delaunay, L. Paugam, B. Chaufer, A dual
approach of membrane cleaning based on physico-chemistry and hydrodynam-
ics: Application to PES membrane of dairy industry, Chemical Engineering
and Processing: Process Intensification 47 (2008) 267 – 275.
[184] M. Rabiller-Baudry, M. L. Maux, B. Chaufer, L. Begoin, Characterisation of
cleaned and fouled membrane by ATRFTIR and EDX analysis coupled with
SEM: application to UF of skimmed milk with a PES membrane, Desalination
146 (2002) 123 – 128.
[185] P. Vaisanen, M. Bird, M. Nystrom, Treatment of UF Membranes with Simple
and Formulated Cleaning Agents, Food and Bioproducts Processing 80 (2002)
98 – 108.
[186] L. Begoin, M. Rabiller-Baudry, B. Chaufer, M.-C. Hautbois, T. Doneva, Ageing
of PES industrial spiral-wound membranes in acid whey ultrafiltration, Desali-
nation 192 (2006) 25 – 39.
[187] Y. Hao, A. Moriya, T. Maruyama, Y. Ohmukai, H. Matsuyama, Effect of metal
ions on humic acid fouling of hollow fiber ultrafiltration membrane, Journal of
Membrane Science 376 (2011) 247 – 253.
[188] R. Chan, V. Chen, Characterization of protein fouling on membranes: oppor-
tunities and challenges, Journal of Membrane Science 242 (2004) 169 – 188.
[189] D. J. Hughes, Z. Cui, R. W. Field, U. K. Tirlapur, In Situ Three-Dimensional
Characterization of Membrane Fouling by Protein Suspensions Using Multipho-
ton Microscopy, Langmuir 22 (2006) 6266–6272.
[190] R. W. Field, D. Hughes, Z. Cui, U. Tirlapur, Some observations on the chemical
cleaning of fouled membranes, Desalination 227 (2008) 132 – 138.
[191] Z. Reich, R. Kapon, R. Nevo, Y. Pilpel, S. Zmora, Y. Scolnik, Scanning force
microscopy in the applied biological sciences, Biotechnology Advances 19 (2001)
451 – 485.
[192] X. Melamane, B. Pletschke, W. Leukes, C. Whiteley, Cleaning fouled mem-
branes using sludge enzymes, Water SA 28 (2002) 100–104.
187

[193] A. Maartens, P. Swart, E. Jacobs, Characterisation techniques for organic
foulants adsorbed onto flat-sheet UF membranes used in abattoir effluent, Jour-
nal of Membrane Science 119 (1996) 1 – 8.
[194] S. Platt, M. Nystrom, Amido black staining of ultrafiltration membranes fouled
with BSA, Desalination 214 (2007) 177 – 192.
[195] C.-H. Wei, X. Huang, R. B. Aim, K. Yamamoto, G. Amy, Critical flux and
chemical cleaning-in-place during the long-term operation of a pilot-scale sub-
merged membrane bioreactor for municipal wastewater treatment, Water Re-
search 45 (2011) 863 – 871.
[196] M. R. Bird, M. Bartlett, CIP optimisation for the food industry: relationships
between detergent concentration, temperature, and cleaning time, Food and
Bioproducts Processing, Transactions of the Institution of Chemical Engineers,
Part C 73 (1995) 63 – 70.
[197] A. Makardij, X. Chen, M. Farid, Microfiltration and Ultrafiltration of Milk:
Some Aspects of Fouling and Cleaning, Food and Bioproducts Processing 77
(1999) 107 – 113.
[198] V. Puspitasari, A. Granville, P. Le-Clech, V. Chen, Cleaning and ageing effect of
sodium hypochlorite on polyvinylidene fluoride (PVDF) membrane, Separation
and Purification Technology 72 (2010) 301 – 308.
[199] M. Kazemimoghadam, T. Mohammadi, Chemical cleaning of ultrafiltration
membranes in the milk industry, Desalination 204 (2007) 213 – 218. Conference
on Desalination Strategies in South Mediterranean Countries, 2006.
[200] C. Liu, S. Caothien, J. Hayes, T. Caothuy, T. Otoyo, T. Ogawa, Membrane
chemical cleaning: from art to science, in: Proc. AWWA 2000 Water Quality
Technology Conference, Denver Co., pp. 1 – 25.
[201] M. Bartlett, M. Bird, J. Howell, An experimental study for the development
of a qualitative membrane cleaning model, Journal of Membrane Science 105
(1995) 147 – 157.
[202] M. Bird, M. Bartlett, Measuring and modelling flux recovery during the chemi-
cal cleaning of {MF}membranes for the processing of whey protein concentrate,
Journal of Food Engineering 53 (2002) 143 – 152.
188

[203] M. O. Nigam, B. Bansal, X. D. Chen, Fouling and cleaning of whey protein
concentrate fouled ultrafiltration membranes, Desalination 218 (2008) 313 –
322.
[204] A.-S. Jonsson, G. Tragardh, Ultrafiltration applications, Desalination 77 (1990)
135 – 179. Proceedings of the Symposium on Membrane Technology.
[205] N. Porcelli, P. Hillis, S. Judd, Microfiltration membrane plant start up: A
case study with autopsy and permeability recovery analysis, Environmental
Technology 30 (2009) 629–639.
[206] N. Porcelli, S. Judd, Chemical cleaning of potable water membranes: The cost
benefit of optimisation, Water Research 44 (2010) 1389 – 1398.
[207] M. Cheryan, Ultrafiltration and microfiltration handbook, Lancaster, Pa. : Tech-
nomic Pub. Co., 1998.
[208] H. Kyllonen, P. Pirkonen, M. Nystrom, J. Nuortila-Jokinen, A. Gronroos, Ex-
perimental aspects of ultrasonically enhanced cross-flow membrane filtration of
industrial wastewater, Ultrasonics Sonochemistry 13 (2006) 295 – 302.
[209] D. Chen, L. K. Weavers, H. W. Walker, Ultrasonic control of ceramic membrane
fouling: Effect of particle characteristics, Water Research 40 (2006) 840 – 850.
[210] A. Gijsbertsen-Abrahamse, E. Cornelissen, J. Hofman, Fiber failure frequency
and causes of hollow fiber integrity loss, Desalination 194 (2006) 251 – 258.
[211] S. Rouaix, C. Causserand, P. Aimar, Experimental study of the effects of
hypochlorite on polysulfone membrane properties, Journal of Membrane Sci-
ence 277 (2006) 137 – 147.
[212] C. Causserand, S. Rouaix, J.-P. Lafaille, P. Aimar, Ageing of polysulfone mem-
branes in contact with bleach solution: Role of radical oxidation and of some
dissolved metal ions, Chemical Engineering and Processing: Process Intensifi-
cation 47 (2008) 48 – 56.
[213] J.-J. Qin, Y.-M. Cao, Y.-Q. Li, Y. Li, M.-H. Oo, H. Lee, Hollow fiber ul-
trafiltration membranes made from blends of PAN and PVP, Separation and
Purification Technology 36 (2004) 149 – 155.
189

[214] K. Yadav, K. R. Morison, Effects of hypochlorite exposure on flux through
polyethersulphone ultrafiltration membranes, Food and Bioproducts Processing
88 (2010) 419 – 424.
[215] V. Gitis, R. C. Haught, R. M. Clark, J. Gun, O. Lev, Application of nanoscale
probes for the evaluation of the integrity of ultrafiltration membranes, Journal
of Membrane Science 276 (2006) 185 – 192.
[216] J. C. Morris, The acid ionization constant of HOCl from 5 to 35 celcius, The
Journal of Physical Chemistry 70 (1966) 3798–3805.
[217] B. Pellegrin, R. Prulho, A. Rivaton, S. Thrias, J.-L. Gardette, E. Gaudichet-
Maurin, C. Causserand, Multi-scale analysis of hypochlorite induced PES/PVP
ultrafiltration membranes degradation, Journal of Membrane Science 447
(2013) 287 – 296.
[218] I. M. Wienk, E. E. B. Meuleman, Z. Borneman, T. van den Boomgaard, C. A.
Smolders, Chemical treatment of membranes of a polymer blend: Mechanism of
the reaction of hypochlorite with poly(vinyl pyrrolidone), Journal of Polymer
Science Part A: Polymer Chemistry 33 (1995) 49–54.
[219] J.-J. Qin, F.-S. Wong, Hypochlorite treatment of hydrophilic hollow fiber ul-
trafiltration membranes for high fluxes, Desalination 146 (2002) 307 – 309.
[220] J.-J. Qin, Y.-M. Cao, Y. Li, Effect of hypochlorite concentration on prop-
erties of posttreated outer-skin ultrafiltration membranes spun from cellulose
acetate/poly(vinyl pyrrolidone) blends, Journal of Applied Polymer Science 97
(2005) 227–231.
[221] R. Prulho, S. Therias, A. Rivaton, J.-L. Gardette, Ageing of polyethersul-
fone/polyvinylpyrrolidone blends in contact with bleach water, Polymer Degra-
dation and Stability 98 (2013) 1164 – 1172.
[222] F. Wang, V. V. Tarabara, Pore blocking mechanisms during early stages of
membrane fouling by colloids, Journal of Colloid and Interface Science 328
(2008) 464 – 469.
[223] B. Sarkar, A combined complete pore blocking and cake filtration model during
ultrafiltration of polysaccharide in a batch cell, Journal of Food Engineering
116 (2013) 333 – 343.
190

[224] K. Katsoufidou, S. Yiantsios, A. Karabelas, A study of ultrafiltration membrane
fouling by humic acids and flux recovery by backwashing: Experiments and
modeling, Journal of Membrane Science 266 (2005) 40 – 50.
[225] E. Iritani, Y. Mukai, M. Furuta, T. Kawakami, N. Katagiri, Blocking resistance
of membrane during cake filtration of dilute suspensions, AIChE Journal 51
(2005) 2609–2614.
[226] M. G. Davidson, W. M. Deen, Hydrodynamic theory for the hindered transport
of flexible macromolecules in porous membranes, Journal of Membrane Science
35 (1988) 167 – 192.
[227] G. Belfort, J. M. Pimbley, A. Greiner, K. Y. Chung, Diagnosis of membrane
fouling using a rotating annular filter. 1. Cell culture media, Journal of Mem-
brane Science 77 (1993) 1 – 22.
[228] K.-L. Tung, C.-J. Chuang, Effect of pore morphology on fluid flow and particle
deposition on a track-etched polycarbonate membrane, Desalination 146 (2002)
129 – 134.
[229] D. Gassara, P. Schmitz, A. Ayadi, M. Prat, Modelling the Effect of Particle Size
in Microfiltration, Separation Science and Technology 43 (2008) 1754–1770.
[230] K.-J. Kim, P. Sun, V. Chen, D. E. Wiley, A. G. Fane, The cleaning of ultrafil-
tration membranes fouled by protein, Journal of Membrane Science 80 (1993)
241 – 249.
[231] G. R. Aiken, Evaluation of ultrafiltration for determining molecular weight of
fulvic acid, Environmental Science & Technology 18 (1984) 978–981.
[232] J. Cho, G. Amy, J. Pellegrino, Membrane filtration of natural organic matter:
initial comparison of rejection and flux decline characteristics with ultrafiltra-
tion and nanofiltration membranes, Water Research 33 (1999) 2517 – 2526.
[233] K. M. Yunos, R. Field, Rejection amplification in the ultrafiltration of bi-
nary protein mixtures using sandwich configurations, Chemical Engineering
and Processing: Process Intensification 47 (2008) 1053 – 1060.
[234] A. Savitzky, M. J. E. Golay, Smoothing and Differentiation of Data by Simpli-
fied Least Squares Procedures., Analytical Chemistry 36 (1964) 1627–1639.
191

[235] T. Perkins, D. Smith, S. Chu, Single polymer dynamics in an elongational flow,
Science 276 (1997) 2016–2021.
[236] F. Jin, C. Wu, Observation of the First-Order Transition in Ultrafiltration of
Flexible Linear Polymer Chains, Phys. Rev. Lett. 96 (2006) 237801.
[237] D. R. Latulippe, K. Ager, A. L. Zydney, Flux-dependent transmission of super-
coiled plasmid DNA through ultrafiltration membranes, Journal of Membrane
Science 294 (2007) 169 – 177.
[238] A. Morao, J. C. Nunes, F. Sousa, M. T. P. de Amorim, I. C. Escobar, J. A.
Queiroz, Development of a model for membrane filtration of long and flexible
macromolecules: Application to predict dextran and linear DNA rejections in
ultrafiltration, Journal of Membrane Science 336 (2009) 61 – 70.
[239] L. Beguin, B. Grassl, F. Brochard-Wyart, M. Rakib, H. Duval, Suction of
hydrosoluble polymers into nanopores, Soft Matter 7 (2011) 96–103.
[240] D. R. Latulippe, J. R. Molek, A. L. Zydney, Importance of Biopolymer Molecu-
lar Flexibility in Ultrafiltration Processes, Industrial & Engineering Chemistry
Research 48 (2009) 2395–2403.
[241] W. M. Deen, Hindered transport of large molecules in liquid-filled pores, AIChE
Journal 33 (1987) 1409–1425.
[242] W. Opong, A. L. Zydney, Diffusive and convective protein transport through
asymmetric membranes, AIChE Journal 37 (1991) 1497–1510.
[243] P. Dechadilok, W. M. Deen, Hindrance Factors for Diffusion and Convection
in Pores, Industrial & Engineering Chemistry Research 45 (2006) 6953–6959.
[244] J. C. Giddings, E. Kucera, C. P. Russell, M. N. Myers, Statistical theory for the
equilibrium distribution of rigid molecules in inert porous networks. Exclusion
chromatography, The Journal of Physical Chemistry 72 (1968) 4397–4408.
[245] I. Teraoka, Polymer solutions in confining geometries, Progress in Polymer
Science 21 (1996) 89 – 149.
[246] W. Sparreboom, A. Van Den Berg, J. Eijkel, Principles and applications of
nanofluidic transport, Nature Nanotechnology 4 (2009) 713–720.
192

[247] Q. T. Nguyen, J. Neel, Characterization of ultrafiltration membranes. : Part
IV. Influence of the deformation of macromolecular solutes on the transport
through ultrafiltration membranes., Journal of Membrane Science 14 (1983)
111 – 127.
[248] S. Daoudi, F. Brochard, Flows of flexible polymer solutions in pores, Macro-
molecules 11 (1978) 751–758.
[249] P. G. de Gennes, Coil-stretch transition of dilute flexible polymers under ultra-
high velocity gradients, The Journal of Chemical Physics 60 (1974) 5030–5042.
[250] D. Smith, H. Babcock, S. Chu, Single-polymer dynamics in steady shear flow,
Science 283 (1999) 1724–1727.
[251] T. Hirasaki, T. Sato, T. Tsuboi, H. Nakano, T. Noda, A. Kono, K. Yamaguchi,
K. Imada, N. Yamamoto, H. Murakami, S. ichi Manabe, Permeation mechanism
of DNA molecules in solution through cuprammonium regenerated cellulose
hollow fiber (BMMtm), Journal of Membrane Science 106 (1995) 123 – 129.
[252] D. Latulippe, A. Zydney, Elongational flow model for transmission of super-
coiled plasmid DNA during membrane ultrafiltration, Journal of Membrane
Science 329 (2009) 201 – 208.
[253] S. Rao, A. L. Zydney, Controlling protein transport in ultrafiltration using
small charged ligands, Biotechnology and Bioengineering 91 (2005) 733–742.
[254] A. L. Zydney, A. Xenopoulos, Improving dextran tests for ultrafiltration mem-
branes: Effect of device format, Journal of Membrane Science 291 (2007) 180
– 190.
[255] A. N. de Belder, Dextran Handbook, Amersham Biosciences, 2003.
[256] K. Devanand, J. C. Selser, Asymptotic behavior and long-range interactions
in aqueous solutions of poly(ethylene oxide), Macromolecules 24 (1991) 5943–
5947.
[257] X. Fan, N. Phan-Thien, N. T. Yong, X. Wu, D. Xu, Microchannel flow of a
macromolecular suspension, Physics of Fluids 15 (2003) 11–21.
[258] M. Allen, D. Tildesley, Computer simulation of liquids, Oxford : Clarendon
Press, 1987.
193

[259] D. Frenkel, B. Smit, Understanding Molecular Simulation From Algorithms to
Applications, Academic Press, 2nd edition edition, 2002.
[260] J. C. Phillips, R. Braun, W. Wang, J. Gumbart, E. Tajkhorshid, E. Villa,
C. Chipot, R. D. Skeel, L. Kal, K. Schulten, Scalable molecular dynamics with
NAMD, Journal of Computational Chemistry 26 (2005) 1781–1802.
[261] H. Bruus, Theoretical Microfluidics, Oxford University Press, 2008.
[262] C. Marsh, Theoretical Aspects of Dissipative Particle Dynamics, Ph.D. thesis,
University of Oxford, 1998.
[263] R. D. Groot, P. B. Warren, Dissipative particle dynamics: Bridging the gap
between atomistic and mesoscopic simulation, The Journal of Chemical Physics
107 (1997) 4423–4435.
[264] U. Frisch, B. Hasslacher, Y. Pomeau, Lattice-Gas Automata for the Navier-
Stokes Equation, Phys. Rev. Lett. 56 (1986) 1505–1508.
[265] D. D’humires, P. Lallemand, Lattice gas automata for fluid mechanics, Physica
A: Statistical Mechanics and its Applications 140 (1986) 326 – 335.
[266] P. J. Hoogerbrugge, J. M. V. A. Koelman, Simulating Microscopic Hydro-
dynamic Phenomena with Dissipative Particle Dynamics, EPL (Europhysics
Letters) 19 (1992) 155.
[267] J. Backer, Bridging time and length scales in Dissipative Particle Dynamics,
Ph.D. thesis, University of Amsterdam, 2006.
[268] P. Espanol, P. Warren, Statistical mechanics of Disspative Particle Dynamics,
Europhysics Letters 30 (1995) 191–196.
[269] S. Willemsen, H. Hoefsloot, P. Iedema, Mesoscopic Simulation of Polymers in
Fluid Dynamics Problems, Journal of Statistical Physics 107 (2002) 53–65.
[270] T. F. Clarke, Rheological Characterisation of Polymers via Dissipative Particle
Dynamics, Ph.D. thesis, Massachusetts Institute of Technology, 2008.
[271] J. Guo, X. Li, Y. Liu, H. Liang, Flow-induced translocation of polymers through
a fluidic channel: A dissipative particle dynamics simulation study, The Journal
of Chemical Physics 134 (2011).
194

[272] M. A. Seaton, R. L. Anderson, S. Metz, W. Smith, DL MESO: highly scalable
mesoscale simulations, Molecular Simulation 39 (2013) 796–821.
[273] R. D. Groot, T. J. Madden, Dynamic simulation of diblock copolymer mi-
crophase separation, The Journal of Chemical Physics 108 (1998) 8713–8724.
[274] I. Pagonabarraga, M. H. J. Hagen, D. Frenkel, Self-consistent dissipative par-
ticle dynamics algorithm, EPL (Europhysics Letters) 42 (1998) 377.
[275] C. A. Marsh, J. M. Yeomans, Dissipative particle dynamics: The equilibrium
for finite time steps, EPL (Europhysics Letters) 37 (1997) 511.
[276] A. K. Das, P.-D. Hong, Forced translocation of polymer chains through a
nanotube: A case of ultrafiltration, Polymer 51 (2010) 2244 – 2254.
[277] P. Espanol, Hydrodynamics from dissipative particle dynamics, Phys. Rev. E
52 (1995) 1734–1742.
[278] R. Cracknell, D. Nicholson, N. Quirke, Direct Molecular Dynamics Simulation
of Flow Down a Chemical Potential Gradient in a Slit-Shaped Micropore, Phys.
Rev. Lett. 74 (1995) 2463–2466.
[279] T. Steiner, C. Cupelli, R. Zengerle, M. Santer, Simulation of advanced microflu-
idic systems with dissipative particle dynamics, Microfluidics and Nanofluidics
7 (2009) 307–323.
[280] J. Li, D. Liao, S. Yip, Coupling continuum to molecular-dynamics simulation:
Reflecting particle method and the field estimator, Phys. Rev. E 57 (1998)
7259–7267.
[281] R. Feng, M. Xenos, G. Girdhar, W. Kang, J. Davenport, Y. Deng, D. Bluestein,
Viscous flow simulation in a stenosis model using discrete particle dynamics: a
comparison between DPD and CFD, Biomechanics and Modeling in Mechanobi-
ology 11 (2012) 119–129.
[282] P. Nikunen, I. Vattulainen, M. Karttunen, Reptational dynamics in dissipative
particle dynamics simulations of polymer melts, Phys. Rev. E 75 (2007) 036713.
[283] G. Pan, C. W. Manke, Developments toward simulation of entangled polymer
melts by dissipative particle dynamics (DPD), International Journal of Modern
Physics B 17 (2003) 231–235.
195

[284] H. Liu, Y.-H. Xue, H.-J. Qian, Z.-Y. Lu, C.-C. Sun, A practical method to avoid
bond crossing in two-dimensional dissipative particle dynamics simulations, The
Journal of Chemical Physics 129 (2008) 024902.
[285] W. Pan, I. V. Pivkin, G. E. Karniadakis, Single-particle hydrodynamics in
DPD: A new formulation, EPL (Europhysics Letters) 84 (2008) 10012.
[286] M. M. Nardai, G. Zifferer, Simulation of dilute solutions of linear and star-
branched polymers by dissipative particle dynamics, The Journal of Chemical
Physics 131 (2009) 124903.
[287] G. F. Hermsen, B. A. de Geeter, N. F. A. van der Vegt, M. Wessling, Monte
Carlo Simulation of Partially Confined Flexible Polymers, Macromolecules 35
(2002) 5267–5272.
[288] L. I. Klushin, A. M. Skvortsov, H.-P. Hsu, K. Binder, Dragging a Polymer
Chain into a Nanotube and Subsequent Release, Macromolecules 41 (2008)
5890–5898.
[289] N. Ileri, S. E. Letant, A. Palazoglu, P. Stroeve, J. W. Tringe, R. Faller,
Mesoscale simulations of biomolecular transport through nanofilters with ta-
pered and cylindrical geometries, Phys. Chem. Chem. Phys. 14 (2012) 15066–
15077.
196
Related Documents