Mechanisms of Inequality: Unequal Access to Organizational Power and the Gender Wage Gap by Mia Hultin and Ryszard Szulkin * __________________________________________________________________ _________ *The authors are equally responsible for this work. Please, direct correspondence to [email protected].

Welcome message from author
This document is posted to help you gain knowledge. Please leave a comment to let me know what you think about it! Share it to your friends and learn new things together.
Transcript

Mechanisms of Inequality:
Unequal Access to Organizational Power and the Gender Wage Gap
by Mia Hultin and Ryszard Szulkin*
__________________________________________________________________
_________
*The authors are equally responsible for this work. Please, direct correspondence to [email protected].
Mechanisms of inequality
1
We gratefully acknowledge valuable comments from our colleagues, mainly sociologists and economists at the Swedish Institute for social research (SOFI). Especially, we wish to thank Anders Björklund, Richard Breen, Magnus Bygren, Ann-Zofie Duvander, Robert Erikson, Johan Fritzell, Carl le Grand, Åsa Rosén, Lotta Stern, and Michael Tåhlin. This work was partly financed by grants from RALF and HSFR.
Mechanisms of inequality
2
ABSTRACT
In this paper, it is argued that women’s limited access to organizational power structures
is a constituent part of the explanation of gender wage inequality. Multi-level analyses
conducted on a comprehensive Swedish data set combining information on a large
number of private sector employers and all their employees confirm that
establishments’ gender wage gaps are wider the stronger the male representation among
organizational decision-makers, net of individuals’ human capital and various
organizational features relevant for wage setting. Theoretical explanations focus on
gender unequal outcomes of i) general rules and policies decided at higher
organizational levels, and ii) everyday decision-making and daily interaction between
superiors and their subordinates. On basis of the empirical results, we conclude that
gender wage inequality is to a substantial degree driven by everyday decision-making in
organizations. It seems as if close supervisors’ decisions and suggestions about wage
rates, promotions, internal training et cetera are to some extent based on personal
preferences, l oyalties, and contacts that are not gender neutral.

Mechanisms of inequality
3
INTRODUCTION
The sociological literature on labor markets has increasingly directed its attention
towards the significance of organizations and employers in creation of gender inequality
in job rewards (see Reskin, McBrier, and Kmec 1999 for a review). Some researchers
have pointed out that studies of labor market inequality ought to take into consideration
the role played by those actors who have direct influence over organizational procedures
and policies, that is, managers and supervisors (Marini 1989, Baron 1991). However,
empirical research has not yet put much effort into scrutinizing in what ways gender
inequalities in access to organizational power influence gender wage differentials. In
this paper, we argue that women’s limited access to organizational power structures is a
constituent part of the explanation of gender wage inequality. 1 Using a comprehensive
Swedish data set combining information on a large number of private sector employers
and their whole body of employees in 1995, we investigate whether establishments’
gender wage gaps are wider the stronger the male representation among organizational
decision-makers.
Presumably, the scarcity of data combining detailed information on
multiple workers in a large set of organizations is one of the reasons behind the
conspicuous lack of studies addressing the question if and how gender differences in
access to organizational power influence gender wage inequality. Recently, a U.S.
employer-employee matched data set was used to analyze effects on wage differentials

Mechanisms of inequality
4
of sex segregation and racial segregation at the establishment level (Carrington and
Troske 1998, Bayard et al. 1999). However, to the best of our knowledge, multi-worker
and multi-establishment data sets have not yet been used for exploring the role of
organizational decision-makers in processes creating and sustaining gender wage
inequality. Shenhav and Haberfeld (1992) and Hultin and Szulkin (1999) have
investigated a similar research problem, however not on the kind of data used in the
current article. Shenhav and Haberfeld’s study, based on data from 1972-1973 pertaining
to establishments i n the Detroit area, lacked direct measures of individuals’ wages and
of other individual-level characteristics like education and seniority. Instead, authors
used aggregate information on occupational earnings and sex composition to calculate
weighted sex earnings ratios at the establishment level. Their results indicated that
gender differences in occupational earnings are more narrow the higher the proportion
of female managers within the establishment. Hultin and Szulkin used a Swedish
nationally representative data set including only one employee per establishment in
1991. The authors found that women who work in establishments in which relatively
many of the managers and supervisors are men have lower wages than have women with
similar qualifications and job requirements, but who work in establishments with larger
proportions of women among decision-makers.
Given the extensive character of the employer-employee information that
we have at our disposal, we can both overcome some of the problems built into the
studies mentioned above and extend earlier research in several ways. First, we can
Mechanisms of inequality
5
estimate the effect on the gender wage gap of gender differentiated access to
organizational power hierarchies net of individuals’ human capital and certain relevant
organizational features. Second, we can, at least to some extent, deal with the potential
objection that an empirical outcome confirming our main assumption is contaminated by
sorting processes implying that some organizations for some reasons attract and retain
female – or male – employees with especially high productive capacities. Third, we are
able to analyze at which specific organizational authority level the studied
discriminatory process is mainly generated.
BRING THE BOSSES AND THEIR UNDERLINGS IN!2
Around two decades ago, Baron and Bielby urged social scientists studying labor market
stratification to ”bring the firm back in” (Baron and Bielby 1980: 738). Yet, much
theoretical and empirical work still needs to be done in order to reveal in what ways
circumstances within establishments influence workers’ chances and rewards (c.f.
Reskin, McBrier, and Kmec 1999), and how ascriptive characteristics like gender
become important lines of cleavages in distributive conflicts over scarce rewards within
organizations.
Analysts within the field of organizational demography have stressed that
processes generating inequality should be investigated in terms of the numerical
strength of various demographic categories within organizations (Pfeffer and Davis-
Blake 1987, Pfeffer 1989). Various social and demographic groups within work

Mechanisms of inequality
6
organizations take an interest either in initiating and sustaining or in undermining and
abolishing ascriptive considerations in reward distribution processes (Baron 1991,
Tomaskovic-Devey 1993). According to the minority power argument, a subordinate or
minority group’s power grows with its proportion of the total stock of labor within an
organization (c.f. Pfeffer 1989, see also Kanter 1977). However, this strong version of
the minority power argument is contradicted by results from a number of empirical
studies on gender inequality, showing that both women and men’s rewards are relatively
low in organizational milieus in which many women work (e.g. Groshen 1991a,
Carrington and Troske 1998).3
As proposed by, for example, Shenhav and Haberfeld (1992), one should
distinguish between a group’s size in general and its representation in positions of power
in particular. In order for a certain group, however large, to be able to state its claims and
prosper in reward distribution processes, it needs to have at its disposal the strength
emanating from representation in strata endowed with decision-making power (see also
Cohen, Broschak, and Haveman 1998). This argument is also of central importance for
feminist perspectives in which it is claimed that unwarranted gender differences in
rewards arise primarily due to men’s desire and ability to preserve their advantages in
distributional processes (e.g. Reskin 1988, Acker 1992). One important prerequisite for
this ability ought reasonably be organizational power in terms of command over rules
and procedures that may serve the purpose of distributing valued resources in favor of
the favored.

Mechanisms of inequality
7
Below, we elaborate two potential explanations to why the gender wage gap
is wider the stronger the male representation among organizational decision-makers.
The first explanation is primarily based on the idea that the gender wage gap within
organizations is in part a result of general rules and policies decided at higher
hierarchical levels. The second explanation above all involves everyday decision-making
and daily interactions between superiors and their underlings.
Mechanisms of inequality
8
Organizational decision-makers and gender wage inequality
The way in which general organizational rules and policies are designed may render
inequality in opportunity between different groups of workers. It has been claimed that
ascriptive gender stereotypes embedded in organizational structures contribute to
unequal reward distribution in the labor market (e.g. Baron 1991). Hence, organizational
policies and procedures may entail negative consequences for women as a group,
irrespective of individual women’s capabilities and preferences. For instance, allocation
processes within firms are to some extent influenced by stereotyped beliefs on what
constitutes ”women’s jobs” and ”men’s jobs” (Milkman 1987, Reskin and Padavic
1988). Bielby and Baron’s prominent empirical research on sex segregation in the labor
market has indicated that employers tend to reserve some jobs for men and some jobs
for women (e.g. Bielby and Baron 1986).
Examples from the literature witness that positions mainly filled by women
tend to be excluded from lucrative internal labor market arrangements, even in
establishments with an otherwise high potential for career advancement. le Grand,
Szulkin, and Tåhlin (1994) showed that male employees in internal labor markets face a
relatively steep seniority wage profile, while this effect is absent for female employees.
DiPrete and Soule (1988) found that women’s internal job ladders compared to men’s in
general are shorter and more seldom reach over higher-level barriers. Such gendered
promotion structures quite evidently conve y gender wage inequality, since wage growth
is often brought about by upward shifts of positions.
Mechanisms of inequality
9
The fact that men and women rarely share job positions implies a scope for
employers’ devaluation of work that is predominantly performed by women, although the
value of this work resembles that of predominantly male tasks. This kind of
discrimination is often referred to as comparable worth discrimination (Treiman and
Hartmann 1981). Once gender differentiated mobility schemas or pay rates are set, the
normal functioning of the organization – or ”business as usual” – tends to maintain the
status quo and continues to ensure further inequality in reward systems (c.f. Blau, Ferber,
and Winkler 1998). Research shows that the gender structure of existing ordinal ranking
of jobs in organizations’ pay systems tends to be very resistant to change and is seldom
subject to transposition (c.f. Acker 1989; 1990, Kim 1989). Hence, both sex labeling of
jobs and relative pay rates within organizations show a good portion of inertia once
established (Bielby and Baron 1986).
Power over general organizational policies is an important tool for
creating, sustaining, and modifying allocation routines and reward structures within
establishments. There are reasons to believe that female and male managers tend to use
their decision-making power differently, in ways that in turn may render substantial
consequences for women’s relative wages within work organizations. Reasonably,
female managers are less prone than their male counterparts to allocate in a routine
manner women to typically female jobs. Also, female decision-makers should be more
apt to extend promotion opportunities for positions predominantly filled by women, for
instance by creating “bridge” positions through which employees can switch ladders
Mechanisms of inequality
10
more easily (Reskin and Padavic 1994). Furthermore, female decision-makers are
presumably more attentive than their male counterparts in terms of observing and valuing
typically female work, thereby minimizing comparable worth discrimination.

Mechanisms of inequality
11
Empirical research supports the notion that female managers in general are
less inclined than their male counterparts to initiate and sustain institutionalized gender
discriminatory practices. For example, establishments with relatively many female
managers are less sex segregated than otherwise comparable establishments (Baron
1991, Baron, Mittman, and Newman 1991, Cohen, Broschak, and Haveman 1998).
Furthermore, female decision-makers have been found to be more prone than their male
confrères to take an active part in measures aimed at establishing employment equity at
the workplace (Baron 1991). Female leaders are presumably also more willing than their
male counterparts to adjust work arrangements so that they become more compatible
with women’s in general extensive family responsibilities, for example by allowing
flexible working hours and by keeping overtime work and inconvenient working hours to
a minimum.
We argue that organizational decision-makers have influence over how
general systems of opportunity are designed within establishments and that the sex
composition among these actors in turn influences the advancement and reward chances
for women as a group. In work organizations in which there are no or only a few women
in power positions, gender may go on being a prominent category that implies negative
consequences for women placed in lower organizational strata (c.f. Ely 1995, Cohen,
Broschak, and Haveman 1998).
It takes two to tango: an interaction perspective on gender wage inequality
Mechanisms of inequality
12
Decision-making in organizations does not revolve around general rules and procedures
only, however. Also accounted for existing systems of opportunity within
establishments, people in authority positions directly influence who will get ahead in the
reward distribution by making decisions and giving suggestions about individual
subordinates’ wages. In the previous section, we argued that gender bias may influence
the design and perpetuation of within-firm systems of allocation and wage setting
decided at high organizational levels. But individual employees’ success in these
opportunity structures is also, at least in part, governed by daily decisions made by
people in charge. Managers’ and supervisors’ power over reward allocation can also be
manifested outside the actual wage -setting process. Employees’ chances for internal
career mobility and selection of individuals to more qualified positions, to training
programs et cetera are, at least in part, governed by daily decisions made by
organizational superiors. To the extent that minor everyday decisions concerning
individual employees’ opportunities are systematically gender biased, they generate
gender inequality in outcome in the long run.
The hitherto attention devoted to the deeds of organizational decision-
makers gives us only at most half of the picture of organizational actors’ impact on
reward distribution processes. It has been argued that systems of advantage and
disadvantage are embedded in everyday interactions between superordinate and
subordinate groups (Bielby 1987). Bridges (1989) claims that wage setting processes in
work organizations are characterized by continuous interactions and negotiations

Mechanisms of inequality
13
between organizational actors who represent different interests (see also Acker 1991).
Hence, it seems called for to pay attention also to female and male supervisees’
opportunities to mobilize power resources in work organizations. Some arguments and
results originating from the social network approach are relevant in this context. There
is strong evidence that essential resources are embedded in social networks and that
access to networks promotes favorable outcomes in reward allocation processes (see
Lin 1999 for a review). Empirical studies show that social relations affect income
attainment (Bridges and Villemez 1986, Boxman, De Graaf, and Flap 1991, Simon and
Warner 1992) and chances for upward mobility (Burt 1995). Social networks in work
organizations also offer informal support systems (Blau, Ferber, and Winkler 1998) that
in turn may enhance employees’ reward opportunities.
The social network literature has furthermore demonstrated the impact of
demographic and social criteria like sex and ethnicity on the occurrence of social
contacts and on individuals’ centrality in networks. According to the similarity attraction
paradigm (Byrne 1971, see also Tajfel 1982), closer social ties primarily emerge among
people with similar basic characteristics. Social similarity tends to evoke attraction and
acts as a mechanism for resolving uncertainty (c.f. Pfeffer 1989, Reskin and McBrier
2000). Social proximity to those actors who occupy central network positions enhances
individuals’ or groups’ exchange opportunities and thus strengthen their bargaining
power in reward distribution processes (c.f. Granovetter 1988, Hedström, forthcoming).
For instance, when there is ambiguity as regards who is the most suitable candidate for a

Mechanisms of inequality
14
certain vacant position, decision-makers tend to minimize risk by choosing the person
who is most socially similar to them (Pfeffer and Salancik 1978).
In concordance with the similarity attraction paradigm, it has been found
that both men and women tend to interact within sex-segregated networks in
organizations (McPherson and Smith-Lovin 1987). There are good reasons to believe
that superiors’ minor everyday decisions on who will benefit in reward distribution
processes and who will obtain access to career opportunities are i nfluenced by
interaction in social networks. Given the sex segregated nature of professional
networks, it seems reasonable to assume that individual female supervisees face greater
reward opportunities and receive more support for their claims in workplaces where the
female representation in central positions, i.e., among decision-makers, is relatively
high.
WAGE SETTING PROCESSES IN SWEDEN
There are reasons to believe that the impact of organizational characteristics on earnings
is smaller in Sweden than in many other Western countries. When analyzing the specific
features of the Swedish labor market, observers have emphasized the high degree of
institutionalization and regulation (Edin and Holmlund 1995, Edin and Topel 1997). The
most prominent feature mentioned in this context is that wages from the mid 1950s to
the early 1980s were determined to a large extent through centralized collective
bargaining at the national level. A solidaristic wage policy aiming at equal pay for equal

Mechanisms of inequality
15
work, regardless of the profitability and productivity of the firm or industry, has been
widely pursued. This policy had the explicit purpose of minimizing wage variation
between equal jobs across firms and sectors. The very high union coverage rate in
Sweden in combination with a well organized and, until recently, highly centralized
confederation of employers facilitated implementation of a solidarity wage policy. This
policy resulted in a decrease of the overall wage dispersion in the Swedish labor market
(Hibbs 1991).
Recent studies have demonstrated that centralized wage bargaining
produces relatively small wage inequalities in general (Barth and Zweimüller 1995, Blau
and Kahn 1996, Elliott and Bender 1997) and small gender wage differentials in
particular (Hammond and Harbridge 1995). The centralized wage bargaining process in
Sweden, with the aim of raising the relative wages of low-wage workers, may indirectly
have resulted in a relatively small wage gap between women and men. Empirical findings
from international comparisons show that a society’s overall wage inequality is
positively related to the gender wage gap. The Swedish labor market is characterized by
relatively low wage dispersion and, hence, comparatively small wage differentials
between women and men (Rosenfeld and Kalleberg 1990, Blau and Kahn 1992).
However, even during the regime of centralized bargaining, a far from negligible
adjustment of wages occurred at the firm level in the form of wage drift.
Thus, the scope for wage dispersion across and within firms for similar
kinds of jobs was relatively limited in Sweden until the beginning of the 1980s. Since
Mechanisms of inequality
16
then, consensus around the solidarity wage policy has been undermined. The national
confederation of employers has adopted new policies aimed at determining wages at the
firm level, while the trade unions’ attitudes towards such decentralization have been
mixed. This new situation has resulted in a decentralization of wage negotiations, which
has given more latitude for local agreements. Nevertheless, the egalitarian character of
wage formation in Sweden is still relatively strong by international standards. In sum, the
assumption here is that the scope for wage discrimination against women in the Swedish
labor market is comparatively small, but still remains. The impact of discriminatory
practices applied at the level of the firm as revealed by our analysis of Swedish data may
accordingly be viewed as a conservative estimate of their importance in other Western
labor markets.

Mechanisms of inequality
17
SAMPLE
In the empirical analyses in this paper, we combine information on employers and
employees in a large number of Swedish private sector organizations. The data set has its
origin in the 1991 Swedish Establishment Survey, a national probability sample of 2 135
private and public sector employers.4 Information pertaining to all employees in these
organizations in 1995 has been collected from a variety of registers. The crucial
independent variable is the sex composition of establishments’ managerial and
supervisory staff. Since data on individuals’ position in the organizations’ hierarchical
structures are only available for the private sector, public sector organizations have been
excluded from the sample. There are 593 private organizations in the Swedish
Establishment Survey sample for which there is accessible information on employees’
position in the organizational hierarchical structure and in which both men and women
work. For reasons discussed below, we perform separate analyses for white-collar and
blue-collar employees. The number of organizations studied is 317 for blue-collar
employees. These organizations together employ 82 190 blue-collar workers.
Correspondingly, we include 546 organizations that employ 74 960 white-collar
workers. 290 of all studied organizations employ both blue-collar and white-collar
workers.
Mechanisms of inequality
18
VARIABLES AND ANALYTICAL STRATEGY
The variables in the analyses are both on an individual and on an organizational level.
Individuals’ earnings are measured as the logarithm of monthly full-time equivalent pre-
tax earnings. The data sources for individual earnings are registers from the Swedish
Employers Confederation, the Swedish Trade Union Organization, and Statistics Sweden.
Individuals’ education refers to the total number of years of formal schooling. For
employees who finished their secondary education after 1972, we have information on
the grade point average from this education. Seniority measures the number of years that
the employee has worked in the establishment. This variable is left-censored, since data
are only available from 1986 onwards. The source of data on education and seniority is
Statistics Sweden. Labor market experience is an indirect measure of the number of years
that the individual has been in employment, estimated through records of old-age
pensions credits from the Swedish National Insurance Board. The experience variable
represents the number of years from 1960 onwards during which the employee has had
an income qualifying for old-age pension. 6 To take curvilinear effects into account, we
include a square term of experience in the analyses.
The information on whether employees hold a white -collar or a blue-collar
occupation has been derived from the wage registers mentioned above. Data on skill level
of jobs are available for white-collar occupations only. A trisect variable indicating the
normal skill required for a given job was derived from the International Standard
Classification of Occupations (ISCO-88). For the first category of jobs, a first-level

Mechanisms of inequality
19
secondary education is required. The second skill category includes jobs that require
post-secondary education. Finally, we distinguish jobs that demand a university degree.
Information on jobs’ skill levels was obtained from the Swedish Employers
Confederation.
The natural logarithm of the number of employees in the establishment, the
proportion of women among blue -collar and white-collar employees, respectively, and
organizations’ industry are all variables on the organizational level.6 The data source for
these variables is Statistics Sweden. The crucial variable at the organizational level is the
proportion of male managers and supervisors of all managers and supervisors in the
establishment. Employees who have as their full-time responsibility to guide others’
work are classified as managers or supervisors. On the basis of ISCO-88 occupational
codes together with additional data from the Swedish Employers Confederation, we are
able to distinguish between managers and supervisors, that is, between decision-makers
at higher and at lower hierarchical levels. Accordingly, we can calculate the total
proportion of male decision-makers in the establishment as well as the proportion of
male managers and male supervisors, respectively.
It is important to note that the variable measuring the proportion of male
managers and supervisors is highly skewed. Table A1 in Appendix gives descriptive
statistics for blue-collar workers and the establishments that employ them. The average
proportion of male managers and supervisors in the blue-collar sample is 0.89. In 148
establishments of 317, there are no female managers or supervisors at all. In 4

Mechanisms of inequality
20
establishments, there are no male decision-makers. Descriptive statistics for white-
collar workers and their establishments are given in Table A2 in Appendix. The average
proportion of male managers and supervisors in the white -collar sample is 0.87. In 285
establishments of 546, there are no female decision-makers at all. The number of white-
collar establishments with no male decision-makers is 12. Male decision-makers are
concentrated to relatively large organizations, to organizations with low proportions of
female employees, and to industries such as manufacturing and construction. Thus, high
proportions of male managers and supervisors tend to be found in labor market locations
characterized by relatively high wages. Consequently, we expect to find a positive main
effect on organizations’ mean wage levels of the proportion of male managers and
supervisors. However, our assumption is that this association is not of a causal nature,
but rather brought about by certain organizational characteristics that we are in part able
to control for. Hence, we take it that the proportion of male managers and supervisors
does not per se increase organizational wage levels. The causal question at hand is
instead whether the gender wage gap is wider in organizations with many male decision-
makers than in other organizations, given organizational mean wage levels.
The data set is made up by information both on individual employees and on
the organizations in which they work. The appropriate statistical method for dealing with
information of such a hierarchical kind, with individual employees nested in work
organizations, is multilevel modeling (Bryk and Raudenbush 1992). Multilevel models
estimate within-organizational and between-organizational equations simultaneously,

Mechanisms of inequality
21
accounting for potential dependence between observations within organizations. The
formal representation of the estimated models is given below.
Level-1, within-organizational model:
lnwageij = B0j + B1j*WOM ij + B2*EXPij + B3* EXPSQij +B4*SEN ij + B5*EDUCij + Rij (Equation
1)
The level-1 model, or within-organizational model, estimates individual wages within
each organization. B0j is the intercept for organization j and B 1j represents the gender
wage gap for organization j. Thus, both the intercept and the estimate for the gender
wage gap are allowed to vary between organizations. B2 through B 5 are fixed parameters
for employees’ human capital and are not allowed to vary between establishments. All
fixed parameters are centered around their grand means. Rij is the level-1 random
variance, or each individual’s unique contribution to the outcome. The random variance
is assumed to be normally distributed.
Mechanisms of inequality
22
Level-2, between-organizational model:
B0j = G00 + G01* PROPMALEBOSSj + U0j (Equation
2)
B1j = G10 + G11* PROPMALEBOSSj + U1j (Equation
3)
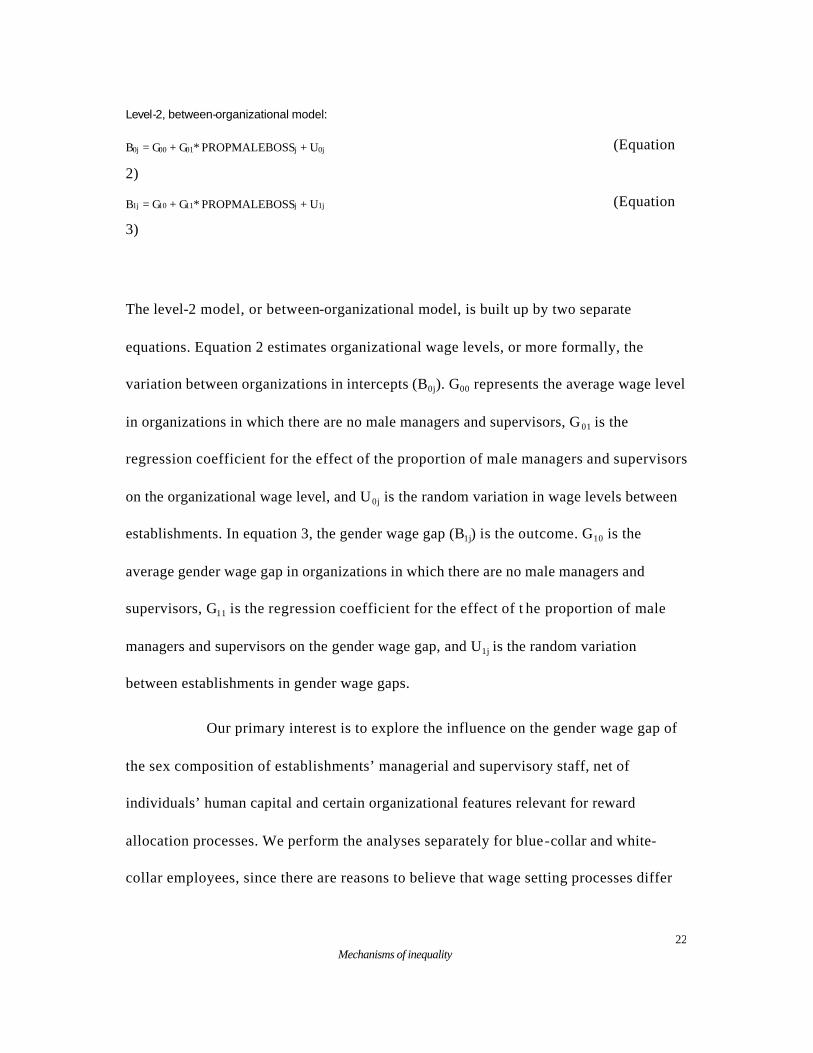
The level-2 model, or between-organizational model, is built up by two separate
equations. Equation 2 estimates organizational wage levels, or more formally, the
variation between organizations in intercepts (B0j). G00 represents the average wage level
in organizations in which there are no male managers and supervisors, G01 is the
regression coefficient for the effect of the proportion of male managers and supervisors
on the organizational wage level, and U0j is the random variation in wage levels between
establishments. In equation 3, the gender wage gap (B1j) is the outcome. G10 is the
average gender wage gap in organizations in which there are no male managers and
supervisors, G11 is the regression coefficient for the effect of t he proportion of male
managers and supervisors on the gender wage gap, and U1j is the random variation
between establishments in gender wage gaps.
Our primary interest is to explore the influence on the gender wage gap of
the sex composition of establishments’ managerial and supervisory staff, net of
individuals’ human capital and certain organizational features relevant for reward
allocation processes. We perform the analyses separately for blue-collar and white-
collar employees, since there are reasons to believe that wage setting processes differ

Mechanisms of inequality
23
between these two categories of employees. Moreover, the earnings data for blue-collar
and white-collar employees have been collected from different sources. The empirical
analyses are conducted only for those male and female employees who lack managerial
or supervisory responsibilities themselves.
In the first stage of the analysis, we estimate the effect on the gender wage
gap of the proportion of male managers and supervisors, net of human capital (that is,
G11 in the level-2 model defined in equation 3 above) for blue-collar and white-collar
employees, respectively. In additional models, we let organizational size, the proportion
of female employees in the establishment, and industry have an impact on organizational
wage levels.7 The rationale for this alternative model specification is that wages tend to
be relatively low in smaller establishments and in establishments with relatively high
proportions of female employees, and that wage-levels vary by industry.
In the next analytical stage, we deal with the possible objection that an
observed relationship between the proportion of male decision-makers and the gender
wage gap is generated by unmeasured selection processes, meaning that particularly
talented workers are allocated to certain establishments. Ability-sorting processes have
been extensively discussed by labor economists as one explanation of wage differences
(e.g. Groshen 1991b). In our case, ability sorting processes would imply that some
organizations for some reasons attract and retain female – or male – workers with
especially high productive capacity. Thus, these organizations would eventually be
imprinted both by relatively high proportions of women in decision-making positions

Mechanisms of inequality
24
and by relatively high wages for female supervisees. The data set makes it possible to
consider the influence on the outcome of potential selection processes of this kind. For
employees who finished their secondary education after 1972, we have information on
the grade point average from this education. To the extent that ability-sorting processes
influence the effect of the sex composition among decision-makers on the gender wage
gap in organizations, the relationship should be substantially reduced when secondary
school results are included in the equations.8
In a final analytical stage, we examine more thoroughly the role played by
managers and supervisors in wage setting processes in organizations. Our main
assumption is that the gender wage gap is wider in organizations in which there are
relatively many male managers and supervisors. This assumption is in turn based on the
straightforward premise that people in authority positions influence employees’ wages
either in a direct way by making decisions and giving suggestions about subordinates’
wage rates, or indirectly by influencing selection of employees to potentially lucrative
career slots et cetera. However, all decision-makers do not decide about all employees’
rewards. The Swedish Employers Confederation’s definition of a supervisor is a person
carrying out full-time responsibility for work conducted by blue-collar employees. By
this definition, supervisors do not exert influence over white-collar employees’ wages.
Accordingly, an observed significant relationship between the sex composition among
supervisors and the gender wage gap for white-collar workers would seriously question
the validity of our measures of hierarchical authority. For blue-collar workers, however,

Mechanisms of inequality
25
both managers and supervisors potentially play a substantial role in the wage
determination process. In this case, an assessment of at which hierarchical level the
analyzed discrimination process mainly takes place enables us to empirically evaluate
the two main theoretical arguments distinguishing between consequences for reward
allocation of general policy making and of daily decisions, respectively.

Mechanisms of inequality
26
RESULTS
General models of the effect on the gender gap
of the proportion of male managers and supervisors
Table 1 gives results from six hierarchical linear models (HLM), estimating the effect
of the sex composition in organizational power structures on gender wage gaps in
organizations. Models 1 to 3 are estimated for blue-collar employees and Models 4 to 6
are estimated for white -collar employees. Models 1 and 4 are baseline models that give
the variance between establishments in gender wage gaps, given employees’ human
capital. In Models 2 and 5, the proportion of male managers and supervisors is included
as predictor. In Models 3 and 6, establishment size, the proportion of female blue -collar
and white-collar employees in the establishment, and industry are added to the second-
level equation for organizational wage levels. This means that these variables are allowed
to influence organizational wage levels (i.e., the intercept in the equation).
[Table 1 around here]
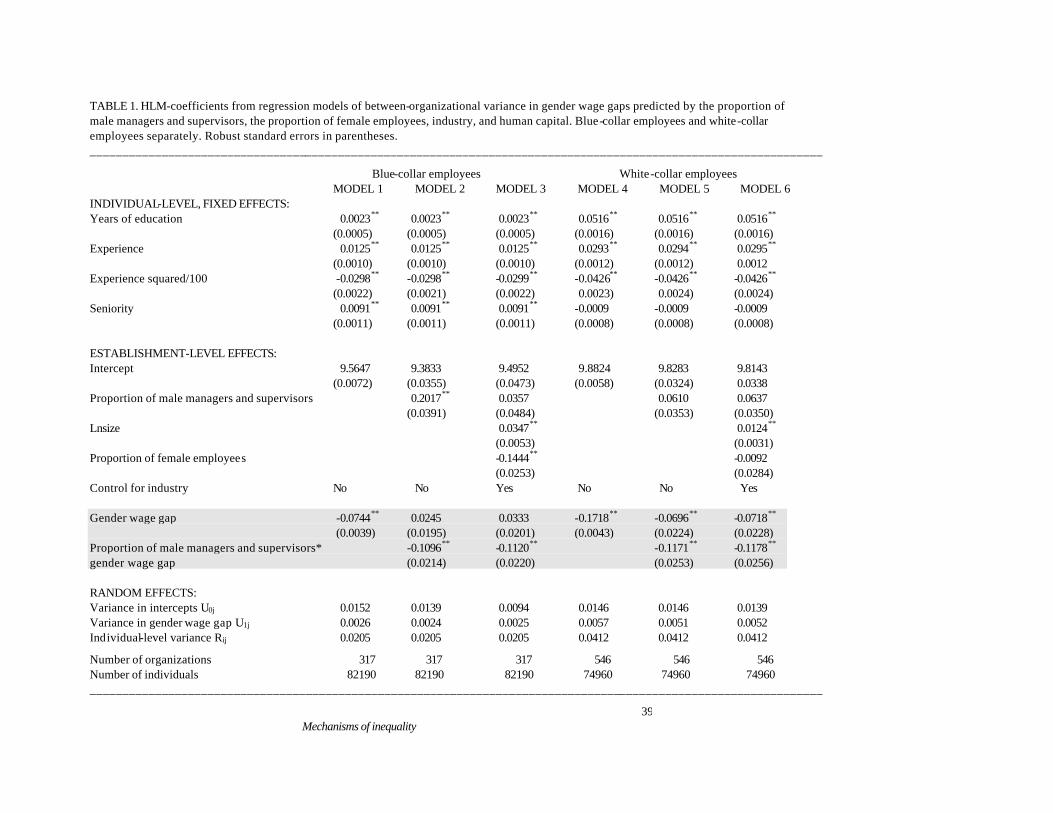
Models 1 and 4 in Table 1 show that the average gender wage gap, as well as the variance
in gender wage gaps between organizations, is more than twice as large for white-collar
as for blue-collar employees, given employees’ human capital.9 In Models 2 and 5, it is
shown that the effect of the proportion of male managers and supervisors on the gender
wage gap is negative and significant, which means that the gender wage gap is wider in

Mechanisms of inequality
27
establishments with higher proportions of male decision-makers. The connection
between the proportion of male decision-makers and the gender wage gap seems to be of
about the same magnitude for blue-collar and white-collar employees. For blue -collar
employees, the average gender wage gap in establishments with no male managers and
supervisors (G10) is approximately zero. The corresponding figure for white-collar
employees is about -0.07. The estimated effect on the gender gap of the proportion of
male decision-makers (G 11) is about -0.11 for both blue-collar and white-collar workers.
The inclusion of the proportion of male decision-makers reduces the between-
establishment variance in gender wage gaps with about 8 percent for blue-collar
employees and 10 percent for white-collar employees. We obtained these values
through subtracting from 1 U1j in Model 2 divided by U1j in Model 1, and U1j in Model 5
divided by U1j in Model 4, respectively. 10
One should notice that there is a strong positive main effect of the
proportion of male managers and supervisors on organizational mean wage levels for
blue-collar employees (Model 2 in Table 1). For white-collar workers, this effect is of
considerably lower magnitude and does not meet conventional requirements for
statistical significance. Thus, t he analyses have so far supported the assumption that
women’s relative wages are pressed down in establishments with relatively many male
decision-makers, but the effect is partly moderated by the condition that wage levels are
relatively high in establishments in which there is a strong representation of men in the
power structures. This is especially true for blue-collar employees.

Mechanisms of inequality
28
As mentioned above, our expectation is that the positive main effect of the
proportion of male managers and supervisors on mean wage levels should disappear, or
at least diminish, when other organizational characteristics relevant for average wage
levels are controlled for. This expectation holds as far as blue-collar employees are
concerned. A comparison between Models 2 and 3 in Table 1 shows that the relatively
strong positive main effect of the proportion of male managers and supervisors on mean
wages becomes substantially reduced and statistically insignificant when organizational
size, proportion of female employees, and industry are controlled for (Model 3).
Controlling for these organizational characteristics does not influence the positive main
effect of the proportion of male decision-makers on mean wage levels for white -collar
workers. The main effect is practically of the same magnitude in Model 5 and Model 6
and remains just below the significance requirements. Furthermore, the association
between the proportion of male decision-makers and organizational gender wage gaps
remains almost unchanged for both blue-collar and white-collar workers after
organizational characteristics are accounted for (Models 3 and 6). Thus, the detrimental
influence of men’s representation among managers and supervisors on women’s relative
wages exists net of organizational s ize, proportion of female employees, and industry.11
In order to validate further the results, we performed a number of additional
analyses. First, we allowed the fixed parameters for employees’ human capital in the
level-1 model to vary across establishments.12 The results from this analysis (not shown)
indicated that the effects of human capital on earnings exhibit significant variation

Mechanisms of inequality
29
between establishments. More interesting given the focal question in this study,
however, is that the relationship between the proportion of male decision-makers and
the wage gap remained unaltered with this model specification (i.e., compared to the
results given in Model 3 and Model 6 in Table 1). Second, we estimated the potential
influence on the crucial relationship of the level of skill by adding jobs’ skill
requirements to the level-1 equation for white-collar employees (results shown in Table
A3 in Appendix). Controlling for skill level reduced the effect of the proportion of male
managers and supervisors both on the gender wage gap and on organizational mean wage
levels. However, the effect on the gender gap remained strong, indicating that the
proportion of male decision-makers in establishments influences the gender wage gap
also accounted for the process by which equally educated and experienced male and
female white-collar employees are sorted to job positions with different skill
requirements.
Furthermore, we examined the possibility of nonlinear effects of the
proportion of male decision-makers on the gender wage gap. In order to allow for a
curvilinear relationship, we categorized the original interval measure of the proportion
of male managers and supervisors into three dummy variables. The first category
included establishments with 0 to 67 percent male decision-makers, the second category
included establishments with 68 to 99 percent male decision-makers, and the third
category consisted of establishments with an all-male management. An analysis
including this trisect classification (results not shown) rendered results that were in

Mechanisms of inequality
30
essence the same as those given by the analyses in which the interval sex composition
variable was used. In a final extension of the analysis, we examined whether the crucial
relationship could be driven by relatively small establishments with very few employees
of each sex. An analysis performed on a sample of organizations with at least ten white-
collar or blue-collar workers of each sex confirmed the findings given in Table 1.
The results presented in this section strongly indicate that the sex
composition in power structures within organizations has a substantial influence on the
gender wage gap. The relationship seems straightforward for both blue-collar and white-
collar employees. We have seen that some of the models reveal positive main effects of
the proportion of male managers and supervisors on organizational wage levels.
However, these effects are – at least after controls for organizational characteristics
related to mean wage levels – relatively weak and insignificant, indicating that female
employees in general benefit from working in establishments with a relatively strong
female representation among managers and supervisors. In the next section, we elaborate
the analyses further in order to deal with the possibility t hat the findings are
contaminated with bias due to ability sorting processes.
Accounting for potential ability selection bias
Table 2 provides results from analyses in which we examined potential influence of
ability sorting bias by accounting for employees’ grade point average from secondary
school. However, the strategy with including average grades in the models reduces one

Mechanisms of inequality
31
kind of selection bias, simultaneously introducing another. Data on grade point average
are available only for employees who finished their secondary education after 1972.
Hence, the organizations for which we are able to test the influence of ability sorting
processes are characterized by a relatively low average age among employees. The
exclusion of older employees means that the analyses including average grades are
conducted for a subsample of about 50 fewer organizations and 50 000 fewer employees
compared to the full blue-collar sample, and 100 fewer organizations and 45 000 fewer
employees compared to the full white-collar sample.13
The fact that the subsamples analyzed in Table 2 are substantially reduced
compared to the full samples analyzed in Table 1 calls for a thorough investigation of the
effect of the proportion of male decision-makers on the gender wage gap. Model 1
(blue-collar workers) and Model 3 (white -collar workers) in Table 2 include the same
predictors as the full sample models (Models 3 and 6 in Table 1). Average grades are
added in Model 2 (blue-collar workers) and Model 4 (white -collar workers) in Table 2.
For blue-collar workers, the impact of the proportion of male managers and supervisors
on the gender wage gap is somewhat weaker in the subsample compared to in the full
sample (compare the estimates in Model 1 in Table 2 with those in Model 3 in Table 1).
The essential relationship remains practically unaltered when average grades are
included in the individual equation for blue-collar employees (Model 2 in Table 2).
Thus, as far as blue-collar workers are concerned, the effect of ability sorting processes

Mechanisms of inequality
32
does not dismantle the support for the main assumption that restricted female access to
organizational power structures has a detrimental effect on women’s relative wages.
[Table 2 around here]
For white-collar employees, the impact of the proportion of male decision-makers on
the gender wage gap is reduced by more than a half in the subsample as compared to in
the full sample (compare the estimates in Model 3 in Table 2 with those in Model 6 in
Table 1). When average grades are included in the individual equation for white-collar
employees (Model 4 in Table 2), it turns out that the influence of the proportion of male
managers and supervisors on the gender wage gap is only marginally reduced. The
remaining effect on the wage gap is statistically significant also with this model
specification. Thus, the influence on the crucial relationship of ability sorting processes
seems to be relatively limited also for white-collar workers.
In sum, it seems as if ability sorting processes are not a hidden mechanism
behind the observed finding showing that women’s relative wages are depressed the
more men are represented in organizational power structures. At the same time, the
results presented in Table 2 indicate that the examined discrimination process is of a
lower magnitude in the subsample than in the full sample. We can of course not
completely rule out the objection that selection processes are involved in producing the
observed relationship between the proportion of male decision-makers and the gender

Mechanisms of inequality
33
wage gap. However, the conducted test has provided good reasons to believe that the
studied mechanism of discrimination is of substantial importance for processes
generating gender wage differentials in the labor market.
The role of decision-makers at different hierarchical levels
In this section, we try to specify levels of authority at which gender inequality in
financial rewards are generated and sustained. We do this by distinguishing between the
role played by higher-level decision-makers (managers) and lower-level decision-
makers (supervisors) , respectively, in the wage discrimination process. The analyses
below include only those establishments for which there is information on the sex
composition among both managers and supervisors. Again, the number of establishments
analyzed becomes substantially reduced compared to the full sample. The main reason
behind the sample reduction is that there by definition are no supervisors in
organizations that employ white-collar employees only. In addition, the number of
organizations becomes reduced due to the fact that some (mostly small) organizations
with both white-collar and blue-collar employees have failed to report to the Swedish
Employers Confederation the necessary information on individuals holding supervisory
positions.
The results presented in Table 3 indicate that decision-makers at
hierarchical levels relatively close to their subordinates are important actors in the
processes generating gender wage differentials among supervisees. As can be seen from

Mechanisms of inequality
34
Model 1, the gender wage gap among blue-collar employees widens with the proportion
of male supervisors, while the effect on the gap of the proportion of male managers is
non-existing for this category of employees. Correspondingly, Model 2 shows that the
gender wage gap is relatively wide for white-collar employees in organizations with a
relatively strong male dominance among managers, while there is no effect on the gender
gap of the proportion of male supervisors. One should also note that the main effects on
average wage levels of the proportion of male managers and supervisors, respectively,
are not significant in the analyses presented in Table 3. This indicates that the
discrimination process apparently dominates over the main effect of the proportion of
male decision-makers on wages.
[Table 3 around here]
Our results have given support to the idea that organizational processes generating
gender wage differentials can be traced mainly to those hierarchical levels at which daily
interaction between subordinates and decision-makers takes place. However, we cannot
rule out the possibility that also general decision-making contributes to gender
inequality in reward distribution processes. In order to reach a more clear-cut
conclusion for white-collar workers in this respect, we ought to be able to distinguish
between managerial positions involving responsibility for general policies on the one
hand, and responsibility for white-collar workers’ daily work on the other hand. This kind

Mechanisms of inequality
35
of data is however not available. Thus, without rejecting the idea that general decision-
making at high organizational levels may have an impact on gender wage inequality, we
conclude that inequality is to a substantial degree driven by everyday decision-making in
organizations. Close supervisors’ decisions and suggestions about wage rates,
promotions, internal training et cetera may, at least to some extent, be based on personal
preferences, loyalties, and contacts that are not gender neutral. Such an interpretation
seems reasonable in light of the results indicating that the sex composition among
supervisors matters for the gender wage gap among blue -collar workers, whereas the sex
composition among managers matters for the gender wage gap among white-collar
workers.
SUMMARY AND CONCLUSIONS
The point of departure in the analyses presented in this paper was the idea that power
relations in work organizations are of crucial importance for understanding how gender
inequalities in financial rewards are generated and sustained in the labor market. If
gender wage differentials are to be explained in terms of discrimination, employers and
other decision-makers in work organizations ought reasonably to be important actors in
the process leading to women obtaining inferior rewards for their performance in the
labor market. Although a number of scholars have emphasized the potential role played
by employers and other organizational decision-makers in processes generating gender
inequality in the labor market, very few empirical studies have scrutinized in what ways

Mechanisms of inequality
36
gender-differentiated access to organizational power influences gender wage
differentials.
Our analyses conducted on a comprehensive Swedish employer-employee
matched data set covering a large number of private sector organizations and their
employees clearly demonstrated that organizational gender wage gaps are wider the
larger the representation of men among managers and supervisors, accounted for
supervisees’ human capital and for organizational size, industry, and overall sex
composition. Analyses including average grades from secondary education pointed in
the direction that the observed relationship between sex composition among decision-
makers and the gender wage gap cannot be explained in terms of ability selection
processes. Clearly, women have particularly low relative wages in establishments in
which there are no women or only a few women in positions of power. We believe that
this finding supports the idea that the reward structure in the labor market to some extent
reflects men and women’s relative power within work organizations.
We have provided arguments from structural discrimination theories and
the social network approach to why the sex composition among organizational decision-
makers matters for the size of the gender wage gap. According to the first argument,
organizational decision-makers exert power over general policies and thus have the
capacity to either initiate and sustain or to undermine institutionalized gender bias in
reward distribution processes within organizations. It was argued that male
organizational decision-makers are more inclined than their female counterparts to
Mechanisms of inequality
37
sustain gender bias in reward distribution processes, for example by allocating typically
male jobs to internal labor markets and by leaving typically female jobs outside such
potentially lucrative career arrangements. On the contrary, female managers are due to
self-interest, solidarity or loyalty with other women reasonably more willing to set aside
discriminatory policies . The second theoretical argument focuses on consequences for
gender wage inequality of daily decisions influenced by interaction between decision-
makers and their underlings. We argued that female supervisees have better
opportunities to benefit from network contacts and to establish their claims in
negotiations and conflicts over scarce resources in organizations in which relatively
many of the decision-makers are women. Female subordinates should be advantaged
when other women are an integral part of the organization’s power structure, because
interaction is facilitated by gender similarity between actors.
These two perspectives can be analytically translated into the question what
hierarchical proximity vs. distance between decision-makers and subordinates means for
organizational processes generating gender wage inequality. The data material enabled us
to empirically distinguish between the sex composition among managers (i.e., high-level
decision-makers) and among supervisors (i.e., lower-level decision-makers). We found
that the gender wage gap for blue -collar workers seems to be more affected by the sex
composition among close supervisors than by the sex compositio n among more
hierarchically distant managers. On basis of this single result, however, we are reluctant
to dismiss the hypothesis derived from well-founded structural theories stating that
Mechanisms of inequality
38
general policies adopted at higher organizational levels are important mechanisms
behind gender inequality in the labor market. But the idea that a substantial fraction of
the gender wage gap has its explanation in gendered daily interactions and decision-
making at lower hierarchical levels within establishments has no doubt survived an initial
empirical inquiry. Important tasks for future research lies in trying to shed more light on
this issue and in corroborating our main results in an international context. Although
confined to a single country, the findings are no doubt suggestive. The contention that
female employees in general benefit from working in establishments with a relatively
strong female representation in power structures received strong support. This is, we
believe, an important contribution to the analysis of mechanisms generating gender
inequality in the labor market.
Mechanisms of inequality
39
TABLE 1. HLM-coefficients from regression models of between-organizational variance in gender wage gaps predicted by the proportion of male managers and supervisors, the proportion of female employees, industry, and human capital. Blue-collar employees and white-collar employees separately. Robust standard errors in parentheses. ________________________________________________________________________________________________________________
Blue-collar employees White-collar employees MODEL 1 MODEL 2 MODEL 3 MODEL 4 MODEL 5 MODEL 6 INDIVIDUAL-LEVEL, FIXED EFFECTS: Years of education 0.0023** 0.0023** 0.0023** 0.0516** 0.0516** 0.0516**
(0.0005) (0.0005) (0.0005) (0.0016) (0.0016) (0.0016) Experience 0.0125** 0.0125** 0.0125** 0.0293** 0.0294** 0.0295**
(0.0010) (0.0010) (0.0010) (0.0012) (0.0012) 0.0012 Experience squared/100 -0.0298** -0.0298** -0.0299** -0.0426** -0.0426** -0.0426**
(0.0022) (0.0021) (0.0022) 0.0023) 0.0024) (0.0024) Seniority 0.0091** 0.0091** 0.0091** -0.0009 -0.0009 -0.0009
(0.0011) (0.0011) (0.0011) (0.0008) (0.0008) (0.0008) ESTABLISHMENT-LEVEL EFFECTS: Intercept 9.5647 9.3833 9.4952 9.8824 9.8283 9.8143
(0.0072) (0.0355) (0.0473) (0.0058) (0.0324) 0.0338 Proportion of male managers and supervisors 0.2017** 0.0357 0.0610 0.0637 (0.0391) (0.0484) (0.0353) (0.0350) Lnsize 0.0347** 0.0124** (0.0053) (0.0031) Proportion of female employees -0.1444** -0.0092 (0.0253) (0.0284) Control for industry No No Yes No No Yes Gender wage gap -0.0744** 0.0245 0.0333 -0.1718** -0.0696** -0.0718** (0.0039) (0.0195) (0.0201) (0.0043) (0.0224) (0.0228) Proportion of male managers and supervisors* -0.1096** -0.1120** -0.1171** -0.1178** gender wage gap (0.0214) (0.0220) (0.0253) (0.0256) RANDOM EFFECTS: Variance in intercepts U0j 0.0152 0.0139 0.0094 0.0146 0.0146 0.0139 Variance in gender wage gap U1j 0.0026 0.0024 0.0025 0.0057 0.0051 0.0052 Individual-level variance Rij 0.0205 0.0205 0.0205 0.0412 0.0412 0.0412
Number of organizations 317 317 317 546 546 546 Number of individuals 82190 82190 82190 74960 74960 74960 ________________________________________________________________________________________________________________

Mechanisms of inequality
40
*p ≤ 0.05 **p ≤ 0.01 TABLE 2. HLM-coefficients from regression models of between-organizational variance in gender wage gaps predicted by the proportion of male managers and supervisors, the proportion of female employees, industry, human capital, and average grades. Blue-collar employees and white-collar employees separately. Robust standard errors in parentheses. ________________________________________________________________________________________________________________________________________
Blue-collar employees Blue-collar employees White-collar employees White collar employees MODEL 1 MODEL 2 MODEL 3 MODEL 4
INDIVIDUAL-LEVEL, FIXED EFFECTS: Years of education 0.0004 0.0003 0.0555** 0.0497** (0.0014) (0.0013) (0.0017) (0.0016) Experience 0.0190** 0.0191** 0.0415** 0.0448** (0.0020) (0.0020) (0.0018) (0.0018) Experience squared/100 -0.0612** -0.0615** -0.0821** -0.0909** (0.0060) (0.0067) (0.0053) (0.0050) Seniority 0.0113** 0.0113** -0.0001 0.00005 (0.0012) (0.0012) (0.0011) (0.0010) Average grades 0.0025 0.0584** (0.0021) (0.0030) ESTABLISHMENT-LEVEL EFFECTS: Intercept 9.3771 9.3776 9.8157 9.8224 (0.0648) (0.0647) (0.0314) (0.0307) Proportion of male managers and supervisors 0.0278 0.0282 -0.0051 -0.0058 (0.0488) (0.0488) (0.0330) (0.0323) Lnsize 0.0316** 0.0315** 0.0117** 0.0121 (0.0056) (0.0056) (0.0033) (0.0032) Proportion of female employees -0.1416** -0.1415** -0.0444 -0.0462 (0.0280) (0.0280) (0.0305) (0.0301) Control for industry Yes Yes Yes Yes
Gender wage gap 0.0209 0.0206 -0.0814** -0.0971** (0.0252) (0.0251) (0.0219) (0.0219) Proportion of male managers and supervisors* -0.0873** -0.0872** -0.0552* -0.0512* gender wage gap (0.0273) (0.0272) (0.0243) (0.0243)
RANDOM EFFECTS: Variance in intercepts U0j 0.0087 0.0087 0.0098 0.0099 Variance in gender wage gap U1j 0.0020 0.0020 0.0030 0.0032 Individual-level variance Rij 0.0211 0.0211 0.0323 0.0313
Number of organizations 268 268 443 443
Mechanisms of inequality
41
Number of individuals 31662 31662 29507 29507 ___________________________________________________________________________________________________________________________________________ *p ≤ 0.05 **p ≤ 0.01

Mechanisms of inequality
42
TABLE 3. HLM-coefficients from regression mo dels of between-organizational variance in gender wage gaps predicted by the proportion of male managers and male supervisors, the proportion of female employees, industry, and human capital. Blue-collar employees and white-collar employees separately. Robust standard errors in parentheses. ___________________________________________________________________________________
Blue-collar employees White-collar employees MODEL 1 MODEL 2 INDIVIDUAL-LEVEL, FIXED EFFECTS: Years of education 0.0023** 0.0535** (0.0006) (0.0022) Experience 0.0111** 0.0295** (0.0012) (0.0014) Experience squared/100 -0.0277** -0.0423** (0.0026) (0.0025) Seniority 0.0096** -0.0003 (0.0010) 0.0009 ESTABLISHMENT-LEVEL EFFECTS: Intercept 9.5351 9.8553 (0.0679) (0.0480) Proportion of male managers 0.0207 0.0417 (0.0583) (0.0444) Proportion of male supervisors -0.0367 0.0014 (0.0565) (0.0356) Lnsize 0.0348** 0.0112** (0.0061) (0.0040) Proportion of female employees -0.2144** -0.0356 0.0347) (0.0437) Control for industry Yes Yes Gender wage gap -0.0148 -0.0687 (0.0357) (0.0381) Male managers* -0.0089 -0.1057 gender wage gap (0.0328) (0.0389) Male supervisors* -0.0675** -0.0085 gender wage gap (0.0287) (0.0294) RANDOM EFFECTS: Variance in intercepts U0j 0.00760 0.0094 Variance in gender wage gap U1j 0.00232 0.0037 Individual-level variance Rij 0.02092 0.0402
Number of organizations 215 289 Number of individuals 75975 52456 ___________________________________________________________________________________ *p ≤ 0.05 **p ≤ 0.01

Mechanisms of inequality
43
REFERENCES
Acker, J. 1989 Doing comparable worth: gender, class and pay equity. Philadelphia: Temple
University Press. Acker, J. 1990 “Hierarchies, Jobs, Bodies: A Theory of Gendered Organizations”, Gender and
Society, 4: 139-158. Acker, J. 1991 “Thinking about Wages: The Gendered Wage Gap in Swedish Banks.” Gender
and Society, 5: 390-407. Acker, J. 1992 ”Gendered Institutions: From Sex Roles to Gendered Institutions.” Contemporary Sociology, 21: 565-568. Baron, J. N. 1991 ”Organizational Evidence of Ascription in Labor Markets.” In R. R.Cornwall and
P. V. Wunnava (eds.), New Approaches to Economic and Social Analyses of Discrimination. New York: Prager Publishers.
Baron, J. N. and W. T. Bielby 1980 “Bringing the Firm Back in: Stratification, Segmentation, and the Organization
of Work.” American Sociological Review, 45: 737-765. Baron, J. N., B. S. Mittman, and A. E. Newman 1991 ”Targets of Opportunity: Organizational and Environmental Determinants of Gender Integration within the California Civil Se rvice, 1979 - 1985.” American Journal of Sociology, 96: 1362-1401. Barth, E. and J. Zweimuller 1995 ”Relative Wages under Decentralized and Corporatist Bargaining Systems.” Scandinavian Journal of Economics, 97: 368-384. Bayard, K., J. Hellerstein, D. Neumark, and K. Troske 1999 “New Evidence on Sex Segregation and Sex Differences in Wages from
Matched Employee-Employer Data.” NBER Working Paper Series. Cambridge, Mass.: National Bureau of Economic Research.
Bielby, W. T. 1987 “Modern Prejudice and Ins titutional Barriers to Equal Employment Opportunity
for Minorities.” Journal of Social Issues, 43: 79-84. Bielby, W. T. and J. N. Baron

Mechanisms of inequality
44
1986 “Men and Women at Work: Sex Segregation and Statistical Discrimination.” American Journal of Sociology, 91: 759-797.

Mechanisms of inequality
45
Blalock, H. M. 1967 Toward a Theory of Minority Group Relations. New York: John Wiley. Blau, F. D., M. A. Ferber, and A. E. Winkler 1998 The Economics of Women, Men, and Work. Englewood Cliffs, New Jersey:
Prentice Hall. Blau, F. D. and L. M. Kahn 1992 ”The Gender Earnings Gap: Learning from International Comparisons.” American Economic Review Papers and Proceedings, 82: 533-538. Blau, F. D. and L. M. Kahn 1996 ”International Differences in Male Wage Inequality.” Journal of Political
Economy, 104: 791-836. Borjas, G. J. 1996 Labor Economics. New York: McGraw-Hill International Editions. Boxman, A. W., P. M. De Graaf, and H. D. Flap 1991 ”The Impact of Social and Human Capital on the Income Attainment of Dutch Managers.” Social Networks, 13: 51-73. Bridges, W. P. 1989 ”Markets in Hierarchies: Organizational and Market Influences on Gender
Inequality in a State Pay System.” American Journal of Sociology, 95: 616-658. Bridges, W. P. and W. J. Villemez 1986 ”Informal Hiring and Income in the Labor Market.” American Sociological
Review, 51: 574-582. Bryk, A. S. and S. W. Raudenbush 1992 Hierarchical Linear Models. Applications and Data Analysis Methods. Newbury
Park: Sage. Burt, R. S. 1995 Structural Holes: The Social Structure of Competition. Cambr idge: Harvard University Press. Byrne, D. 1971 The Attraction Paradigm. New York: Academic Press. Carrington, W. J. and K. R. Troske 1998 “Sex Segregation in U.S. Manufacturing.” Industrial and Labor Relations, 51:
445-464.
Mechanisms of inequality
46
Cohen, L. E., J. P. Broschak, and H. A. Haveman 1998 “And then there were more? The Effect of Organizational Sex Composition on
the Hiring and Promotion of Managers.” American Sociological Review, 63: 711-727.
DiPrete, T. A. and W. T. Soule 1988 “Gender and Promotion in Segmented Job Ladder Systems”, American
Sociological Review, 53: 26-40. Edin, P. A. and B. Holmlund 1995 ”The Swedish Wage Structure: The Rise and Fall of Solidarity Wage-Policy.” In
R. B. Freeman and L. F. Katz (eds.), Differences and Changes in Wage Structures. Chicago: University of Chicago Press and National Bureau of Economic Research.
Edin, P. A. and R. Topel 1997 ”Wage Policy and Restructuring: The Swedish labor market since 1960.” In R.
B. Freeman, R. Topel, and B. Swedenborg (eds.), The Welfare State in Transition. Reforming the Swedish Model. Chicago: University of Chicago Press and National Bureau of Economic Research.
Elliott, R. F. and K. A. Bender 1997 ”Decentralization and Pay Reform in Central Government: A Study of Three Countries.” British Journal of Industrial Relations, 35: 447-475. Ely, R. 1995 ”The Power in Demography: Women’s Social Constructions of Gender Identity
at Work.” Academy of Management Journal, 38: 589-634. le Grand, C., and M. Tåhlin 1998 “Job Mobility and Earnings Growth”, Working Paper 9/1998, Stockholm:
Swedish Institute for Social Research. le Grand, C., R. Szulkin, and M. Tåhlin 1994 ”Organizational Structures and Job Rewards in Sweden.” Acta Sociologica, 37:
231-252. le Grand, C., R., Szulkin, and M. Tåhlin 1995 “Why Do Some Employers Pay More than Others? Earnings Variation Across
Establishments in Sweden”, Research in Social Stratification and Mobility, 14: 265-296.
Granovetter, M. 1988 “The Sociological and Economic Approaches to Labor Market Analysis: A
Social Structural View.” In G. Farkas and P. England (eds.), Industries, Firms, and Jobs. New York: Plenum Press.
Mechanisms of inequality
47
Groshen, E. L. 1991a ”The Structure of the Female/Male Wage Differential: Is It Who You Are, What
You Do, or Where You Work?” Journal of Human Resources, 26: 457-472. Groshen, E. L. 1991b ”Five Reasons Why Wages Vary Among Employers.” Industrial Relations, 30:
350-381. Hammond, S. and R. Harbridge 1995 ”Women and Enterprise Bargaining: The New Zealand Experience of Labour Market Deregulation.” Journal of Industrial Relations, 37: 359-376. Hedström, P. forthc. ”Rational Choice and Social Structure: On Rational-Choice Theorizing in
Sociology.” In B. Wittrock (ed.), Social Theory and Human Agency. London: Sage.
Hibbs, D. A. 1991 ”Market Forces, Trade Union Ideology and Trends in Swedish Wage
Dispersion.” Acta Sociologica, 34: 89-102. Hultin, M. and R. Szulkin 1999 “Wages and Unequal Access to Organizational Power: An Empirical Test of
Gender Discrimination.” Administrative Science Quarterly, 44: 453-472. Kanter, R. M. 1977 Men and Women of the Corporation. New York: Basic Books. Kim, M. 1989 “Gender Bias in Compensation Structures: A Case Study of Its Historical Basis
and Persistence.” Journal of Social Issues, 45: 39-50. Lin, N. 1999 “Social Networks and Status Attainment.” Annual Review of Sociology, 25:
467-487. McPherson, J. M. and L. Smith-Lovin 1987 ”Homophily in Voluntary Organizations: Status Distance and the Composition
of Face-to-Face Groups.” American Sociological Review, 52: 370-379. Marini, M. 1989 ”Sex Differences in Earnings in the United States.” Annual Review of
Sociology, 15: 343-380. Milkman, R.

Mechanisms of inequality
48
1987 Gender at Work. Urbana: University of Illinois Press. Pfeffer, J. 1989 ”A Political Perspective on Careers: Interests, Networks, and Environments.” In
M. B. Arthur, D. T. Hall and B. S. Lawrence (eds.), Handbook of Career Theory. Cambridge: Cambridge University Press.
Pfeffer, J. and A. Davis-Blake 1987 ”The Effect of the Proportion of Women on Salaries: The Case of College Administrators.” Administrative Science Quarterly, 32: 1-24.

Mechanisms of inequality
49
Pfeffer, J. and G. R. Salancik 1978 The external control of organizations: a resource dependence perspective. New
York: Harper and Row. Reskin, B. F. 1988 ”Bringing the Men Back in: Sex Differentiation and the D evaluation of
Women’s Work.” Gender and Society, 2: 58-81. Reskin, B. F., D. M. McBrier, and J. A. Kmec 1999 “The Determinants and Consequences of Workplace Sex and Race
Composition.” Annual Review of Sociology, 25: 335-361. Reskin, B.F. and D. B. McBrier 2000 “Why Not Ascription? Organizations’ Employment of Male and Female
Managers”, American Sociological Review, 65: 210-233. Reskin, B. and I. Padavic 1988 “Supervisors as Gatekeepers: Male Supervisors’ Response to Women’s
Integration in Plant Jobs.” So cial Problems 35: 536-550. Reskin, B. F. and I. Padavic 1994 Women and Men at Work. Thousand Oaks, California: Pine Forge Press. Rosenfeld, R. A. and A. L. Kalleberg 1990 ”A Cross-National Comparison of the Gender Gap in Income.” American Journal of Sociology, 96: 69-106. Shenhav, Y. and Y. Haberfeld 1992 “Organizational Demography and Inequality.” Social Forces, 71: 123-143. Simon, C. J. and J. T. Warner 1992 ”Matchmaker, Matchmaker: The Effect of Old-Boy Networks on Job Match Quality, Earnings, and Tenure.” Journal of Labor Economics, 10: 306-329. Statistics Sweden 1992 “Swedish Standard Industrial Classification 1992”, Reports on Statistical Co -
ordination 1992:6. Stockholm: Statistics Sweden. Stolzenberg, R. M. 1978 “Bringing the Boss Back In: Employer Size, Employee Schooling, and
Socioeconomic Achievement”, American Sociological Review, 43: 813-828. Tajfel, H. 1982 “Social Psychology of Intergroup Relations.” Annual Review of Sociology, 33:
1-39.

Mechanisms of inequality
50
Tomaskovic-Devey, D. 1993 Gender and Racial Inequality at Work: The Sources and Consequences of Job
Segregation. Ithaca, N.Y.: ILR Press. Topel, R. 1991 “Specific Capital, Mobility, and Wages: Wages Rise with Job Seniority”,
Journal of Political Economy, 99: 145-176. Treiman, D. J. and H. I. Hartmann 1981 Women, Work, and Wages. Washington D.C.: National Academy Press.

Mechanisms of inequality
51
APPENDIX TABLE A1: Descriptives for individual-level and organizational-level variables. Blue-collar employees only.
Variable Mean Std. deviation Min. value Max. value N.
Monthly wages, SEK 15 208.67 3 110.40 3 671.00 41 009 82 190 Experience 17.89 10.52 0.00 36.00 82 190 Seniority 6.56 3.25 0.50 9.50 82 190 Educational years 10.23 1.87 7.4 20.0 82 190 Proportion of male managers and supervisors
0.89 0.19 0.00 1.00 317
Proportion of female blue-collar employees
0.33 0.25 0.01 0.94 317
Organizational size 468 792.71 8 7 005 317 TABLE A2: Descriptives for individual-level and organizational-level variables. White-collar employees only.
Variable Mean Std. deviation Min. value Max. value N.
Monthly wages, SEK 19 767.16 7 223.16 5 450.00 343 986.80 74 960 Experience 21.56 9.77 0.00 36.00 74 960 Seniority 5.27 3.50 0.50 9.50 74 960 Educational years 12.96 2.87 7.40 20.00 74 960 Proportion of male managers and supervisors
0.87 0.22 0.00 1.00 546
Proportion of female white-collar employees
0.44 0.19 0.01 0.98 546
Organizational size 307 638.63 3 7 005 546

Mechanisms of inequality
52
TABLE A3. HLM-coefficients from regression models of between-organizational variance in gender wage gaps predicted by the proportion of male managers and supervisors, the proportion of female employees, industry, human capital, and skill- level. White-collar employees only. Robust standard errors in parentheses. ________________________________________________________________
White collar employees MODEL 1 INDIVIDUAL-LEVEL, FIXED EFFECTS: Years of education 0.0368** (0.0014) Experience 0.0269** (0.0008) Experience squared -0.0398** (0.0017) Seniority -0.0013 (0.0008) Skill level 2 0.0854** (0.0066 Skill level 3 0.2514 (0.0102) ESTABLISHMENT-LEVEL EFFECTS: Intercept 9.7444 (0.0282) Proportion of male managers and supervisors 0.0238 (0.0285) Lnsize 0.0062** (0.0029) Proportion of female employees -0.0209 (0.0277) Control for industry Yes Gender wage gap -0.0831** (0.0199) Proportion of male managers -0.0735** and supervisors*gender wage gap (0.0226) RANDOM EFFECTS: Variance in intercepts U0j 0.0110 Variance in gender wage gap U 1j 0.0041 Individual-level variance Rij 0.0357
Number of organizations 546 Number of individuals 73057 ________________________________________________________________ *p ≤ 0.05 **p ≤ 0.01

Mechanisms of inequality
53
1 Borjas (1996) has traced the oldest documented and quantified gender wage differential to the Old Testament:
The Lord spoke to Moses and said, Speak to the Israelites in these words. When a man makes a special vow to the Lord
which requires your valuation of living persons, a male between twenty and fifty years old shall be valued at fifty silver
shekels, that is shekels by the sacred standard. If it is a female, she shall be valued at thirty shekels (Leviticus 27: 1–4).
Hence, the female-male wage ratio (with a rough control for age) prescribed by the Lord is 0.6. Our interpretation
of the Biblical quotation is that it gives the first known illustration of the negative influence on women’s wages
of the overrepresentation of men among organizational decision-makers.
2 The heading paraphrases Stolzenberg’s article “Bringing the Boss Back In” (1978).
3 The opposite majority power argument (Blalock 1967) suggests that minority groups that grow numerically pose
a threat to majority groups, who in turn react by triggering off discriminatory practices against minority group
members.
4 The probability of selection in this survey was proportionate to the number of employees in the establishment.
An establishment is defined as a workplace that has one single address and one single employer. For a
presentation of the Swedish Establishment Survey, see le Grand, Szulkin and Tåhlin (1995).
5 This measure does not allow us to distinguish between income from wages and income from other sources,
such as various public welfare programs. However, our measure is probably more reliable than the often used
indirect measure that estimates experience by subtracting from age the number of years of schooling together
with the age at which one enters compulsory school. Such a measure tends to overestimate labor market
experience for women who have interrupted their labor market careers for child-care.
6 The classification of industries is “Standard för svensk näringsgrensindelning (SNI) 1992” (see Statistics
Sweden 1992:6). This classification follows the EU “Nomenclature Générale des Activités dans les Communautés
Européennes”. We have collapsed industries into eleven broad categories, namely engineering; other
manufacturing; construction; trade, hotel, and restaurant; transportation, post, and telecommunication; financial
business and related services; other business services; other private services; health care; research and
development; and culture, sport, recreation, and voluntary organizations.
7 The first equation in the level-2 model is then expanded in the following way:
B0j = G00 + G01* PROPMALEBOSSj + G02* PROPWOMEN j + G03* lnSIZEj + Goi∑ INDi + U0j.

Mechanisms of inequality
54
8 Another possible selection bias is accounted for in the first category of models, in which we allow the
intercepts for organizational mean wage levels to vary. If highly productive female (or male) employees were
systematically allocated to certain organizations, these organizations should be characterized by high wage
levels compared to organizations with a more normal distribution of talent among employees.
9 Overall, the effects of the human capital variables on earnings are the expected. However, one should notice
that the effect of seniority on earnings is weak and negative for white-collar employees. The potential positive
effect of seniority on wages may be counteracted by the positive effect of external job shifts for this category of
employees. Without access to data on effects of external shifts on earnings, we cannot estimate seniority effects
in a correct way (Topel 1991, le Grand and Tåhlin 1998).
10 The estimated effects of the proportion of male decision-makers on the gender wage gap can be calculated by
substituting values from Model 2 and Model 5 into equation 3 for the level-2 Model.
11 It should be mentioned that we have performed a formal statistical test to prove that the negative effect on
female employees’ relative wages is stronger in absolute terms than is the positive effect on overall mean wages
of the proportion of male managers and supervisors in establishments. It turned out that the sums of the former
effect and the latter effect for blue-collar workers (-0.112 + 0.036) and for white-collar workers (-0.118 + 0.064) are
significantly different from zero. Furthermore, in order to scrutinize if the main results generated by Models 3 and
6 in Table 1 could be driven by a few influential cases, we let HLM create a residual file enabling detection of
outlying units. We detected 4 suspicious cases for blue-collar employees and 14 for white-collar employees. The
main results were largely unaltered when we reran the models without these cases.
12 The formal notation for this expanded model is the following:
Level-1: lnwageij = B0j + B1j*WOM ij + B2j*EXPij + B3j* EXPSQij +B4j*SEN ij + B5j*EDUCij + Rij
Level-2: B0j = G00 + G01* PROPMALEBOSSj + G02* PROPWOMENj + G03* lnSIZEj + Goi∑ INDi + U0j
B1j = G10 + G11* PROPMALEBOSSj + U1j
B2 = G20 + U2j
B3 = G30 + U3j
B4 = G40 + U4j
B5 = G50 + U5j 13 This rather substantial reduction of the number of organizations has to do with the fact that a certain fraction
of mainly smaller establishments employs only or almost only relatively old individuals for whom we have no
data on average grades. Organizations are excluded from the analyses also in cases when they employ people for
which there are data on average grades, but when the gender composition among these employees is totally

Mechanisms of inequality
55
skewed (i.e., when 100 percent of them are men or women, respectively). Quite evidently, the probability for
exclusion on these grounds is greater the smaller the number of employees within an establishment.
Related Documents