Clim. Past, 8, 1487–1495, 2012 www.clim-past.net/8/1487/2012/ doi:10.5194/cp-8-1487-2012 © Author(s) 2012. CC Attribution 3.0 License. Climate of the Past Mechanisms for European summer temperature response to solar forcing over the last millennium D. Swingedouw 1 , L. Terray 2 , J. Servonnat 1 , and J. Guiot 3 1 Laboratoire des Sciences du Climat et de l’Environnement, IPSL-CEA-CNRS-UVSQ – UMR8212, Centre d’Etudes de Saclay, Orme des Merisiers bat. 701, 91191 Gif Sur Yvette, France 2 CERFACS, 42 Av. G. Coriolis, 31057 Toulouse, France 3 CEREGE, Europˆ ole M´ editerran´ een de l’Arbois – Avenue Louis Philibert, BP 80, 13545 Aix en Provence, France Correspondence to: D. Swingedouw ([email protected]) Received: 28 March 2012 – Published in Clim. Past Discuss.: 18 April 2012 Revised: 28 August 2012 – Accepted: 29 August 2012 – Published: 5 October 2012 Abstract. A simulation of the last millennium is compared to a recent spatio-temporal reconstruction of summer tem- perature over Europe. The focus is on the response to solar forcing over the pre-industrial era. Although the correlation between solar forcing and the reconstruction remains small, the spatial regression over solar forcing shows statistically significant regions. The meridional pattern of this regression is found to be similar in the model and in the reconstruc- tion. This pattern exhibits a large warming over Northern and Mediterranean Europe and a lesser amplitude response over Central and Eastern Europe. The mechanisms explain- ing this pattern in the simulation are mainly related to evap- otranspiration fluxes. It is shown that the evapotranspiration is larger in summer over Central and Eastern Europe when solar forcing increases, while it decreases over the Mediter- ranean area. The explanation for the evapotranspiration in- crease over Central and Eastern Europe is found in the in- crease of winter precipitation there, leading to a soil moisture increase in spring. As a consequence, the evapotranspiration is larger in summer, which leads to an increase in cloud cover over this region, reducing the surface shortwave flux there and leading to less warming. Over the Mediterranean area, the surface shortwave flux increases with solar forcing, the soil becomes dryer and the evapotranspiration is reduced in summer leading to a larger increase in temperature. This ef- fect appears to be overestimated in the model as compared to the reconstruction. Finally, the warming of Northern Europe is related to the albedo feedback due to sea-ice cover retreat with increasing solar forcing. 1 Introduction The projections of the coming century under increasing an- thropogenic forcing show that one of the largest warming in summer is likely to occur in the Mediterranean area (Chris- tensen et al., 2007). This is mainly related to a local feedback (Seneviratne et al., 2006) and to a change in the large-scale circulation with a northward shift in the jet stream and the subsidence regions (Yin, 2005), which may be larger with the increase in the vertical resolution of the atmosphere mod- els and their representation of the stratosphere (Scaife et al. 2012). This leads to an anisotropic response of summer tem- perature over Europe to a change in radiative forcing even for an isotropic forcing. The local positive feedback implies a land-atmosphere in- teraction: in relatively dry regions, an increase in surface temperature decreases the soil moisture reservoir so that the evapotranspiration is partly replaced by sensible heat flux that warms the soil in place of the cooling associated with the latent heat flux from evapotranspiration (Seneviratne et al., 2006; D’Andr´ ea et al., 2006). Under global warming, this mechanism leads to the existence of a transitional zone over Europe, located between 40 and 60 ◦ N, where the moisture availability allows to avoid the inception of the positive feed- back (Bo´ e and Terray, 2008). Nevertheless, there is a very large spread among the models concerning the location of this zone, illustrating the sensitivity of this mechanism to climate models parameterisation and the necessity to con- strain them through observations. Evapotranspiration is ac- tually the key variable that controls this transition zone. This Published by Copernicus Publications on behalf of the European Geosciences Union.

Welcome message from author
This document is posted to help you gain knowledge. Please leave a comment to let me know what you think about it! Share it to your friends and learn new things together.
Transcript
Clim. Past, 8, 1487–1495, 2012www.clim-past.net/8/1487/2012/doi:10.5194/cp-8-1487-2012© Author(s) 2012. CC Attribution 3.0 License.
Climateof the Past
Mechanisms for European summer temperature response to solarforcing over the last millennium
D. Swingedouw1, L. Terray 2, J. Servonnat1, and J. Guiot3
1Laboratoire des Sciences du Climat et de l’Environnement, IPSL-CEA-CNRS-UVSQ – UMR8212,Centre d’Etudes de Saclay, Orme des Merisiers bat. 701, 91191 Gif Sur Yvette, France2CERFACS, 42 Av. G. Coriolis, 31057 Toulouse, France3CEREGE, Europole Mediterraneen de l’Arbois – Avenue Louis Philibert, BP 80, 13545 Aix en Provence, France
Correspondence to:D. Swingedouw ([email protected])
Received: 28 March 2012 – Published in Clim. Past Discuss.: 18 April 2012Revised: 28 August 2012 – Accepted: 29 August 2012 – Published: 5 October 2012
Abstract. A simulation of the last millennium is comparedto a recent spatio-temporal reconstruction of summer tem-perature over Europe. The focus is on the response to solarforcing over the pre-industrial era. Although the correlationbetween solar forcing and the reconstruction remains small,the spatial regression over solar forcing shows statisticallysignificant regions. The meridional pattern of this regressionis found to be similar in the model and in the reconstruc-tion. This pattern exhibits a large warming over Northernand Mediterranean Europe and a lesser amplitude responseover Central and Eastern Europe. The mechanisms explain-ing this pattern in the simulation are mainly related to evap-otranspiration fluxes. It is shown that the evapotranspirationis larger in summer over Central and Eastern Europe whensolar forcing increases, while it decreases over the Mediter-ranean area. The explanation for the evapotranspiration in-crease over Central and Eastern Europe is found in the in-crease of winter precipitation there, leading to a soil moistureincrease in spring. As a consequence, the evapotranspirationis larger in summer, which leads to an increase in cloud coverover this region, reducing the surface shortwave flux thereand leading to less warming. Over the Mediterranean area,the surface shortwave flux increases with solar forcing, thesoil becomes dryer and the evapotranspiration is reduced insummer leading to a larger increase in temperature. This ef-fect appears to be overestimated in the model as compared tothe reconstruction. Finally, the warming of Northern Europeis related to the albedo feedback due to sea-ice cover retreatwith increasing solar forcing.
1 Introduction
The projections of the coming century under increasing an-thropogenic forcing show that one of the largest warming insummer is likely to occur in the Mediterranean area (Chris-tensen et al., 2007). This is mainly related to a local feedback(Seneviratne et al., 2006) and to a change in the large-scalecirculation with a northward shift in the jet stream and thesubsidence regions (Yin, 2005), which may be larger withthe increase in the vertical resolution of the atmosphere mod-els and their representation of the stratosphere (Scaife et al.2012). This leads to an anisotropic response of summer tem-perature over Europe to a change in radiative forcing even foran isotropic forcing.
The local positive feedback implies a land-atmosphere in-teraction: in relatively dry regions, an increase in surfacetemperature decreases the soil moisture reservoir so that theevapotranspiration is partly replaced by sensible heat fluxthat warms the soil in place of the cooling associated withthe latent heat flux from evapotranspiration (Seneviratne etal., 2006; D’Andrea et al., 2006). Under global warming, thismechanism leads to the existence of a transitional zone overEurope, located between 40 and 60◦ N, where the moistureavailability allows to avoid the inception of the positive feed-back (Boe and Terray, 2008). Nevertheless, there is a verylarge spread among the models concerning the location ofthis zone, illustrating the sensitivity of this mechanism toclimate models parameterisation and the necessity to con-strain them through observations. Evapotranspiration is ac-tually the key variable that controls this transition zone. This
Published by Copernicus Publications on behalf of the European Geosciences Union.

1488 D. Swingedouw et al.: Mechanisms for European summer temperature response to solar forcing
is a complex flux that couples both the energy and water bud-get of the soil.
The uncertainty for the summer evapotranspiration re-sponse of models participating in IPCC-AR4 necessitatesevaluating their sensitivity to change in radiative forcing forpast periods over sufficiently long time scale. Using recon-struction of the last few decades is a possibility, but analysinglonger time scale will certainly help to filter out the signa-ture of internal climate variability. The last millennium, withwell-documented variations in solar forcing (although uncer-tainties remain concerning its amplitude) appears to be an in-teresting candidate. Hunt (2006) actually shows that climatevariability over this period could not be explained only bythe internal variability of a climate model, but needs exter-nal forcing. Hegerl et al. (2011) confirm the importance ofexternal forcing for the temperature variability over Europefor the last 500 yr. They also show that these forcings aremainly detectable in winter and less in summer, notably be-cause dynamics are involved in winter and not only pure localradiative forcing. Moreover, they question the detectability ofsolar forcing in summer over this 500-yr time frame.
In this study we propose to evaluate the summer tempera-ture response of a particular climate model to low frequencysolar variations during the last millennium and compare it toa new reconstruction of summer temperature over Europe forthis millennium time frame.
2 Experimental design
We analyse a simulation of the last millennium using theCNRM-CM3 coupled model (Salas-Melia et al., 2005). Thismodel is based on the coupled core formed by ARPEGEClimat version 4.6 AGCM (Gibelin and Deque, 2003) andOPA 8.1 OGCM (Madec et al., 1998), including a sea-icemodel, GELATO2 (Salas-Melia, 2002). The horizontal reso-lution is around 2.8◦ in the atmosphere and 2◦ in the ocean(with higher resolution around the equator). There are 31 lev-els both in the ocean and the atmosphere. The millenniumsimulation using this model is described in detail in Swinge-douw et al. (2011). It uses most of the known external forc-ing (solar, volcanoes, CO2). The Total Solar Irradiance (TSI)variations are deduced from the Bard et al. (2000) reconstruc-tion and we use the scaling from Crowley (2000). The ampli-tude of the solar forcing variations for the TSI reconstruc-tion that we use represents a 0.24 % decrease of the meanTSI between present day and the Maunder Minimum. Whilechanges in solar forcing may concern the whole spectrum ofsolar irradiance (Gray et al., 2010), we do not account for thiseffect here. Other impacts, like the response of stratosphericozone is also not accounted for and we only consider in theradiative forcing from the TSI. Moreover, there is a lot of de-bate concerning the magnitude of TSI changes in the past,with reconstructions considering smaller (Vieira et al., 2011)or larger (Shapiro et al., 2011) magnitude than the one used
14
1
Figure 1. Time series of the summer (April to September) European mean temperature (in °C) 2
filtered with a 13 yr cutoff value. In black is the reconstruction from Guiot et al. (2010), in 3
green is the reconstruction from Luterbacher et al. (2004) and in red is the simulation from the 4
model CNRM-CM3. In blue is represented the mean radiative forcing from solar variations 5
(in W.m-2) from Crowley (2000) with its own axis in blue on the left. The spatial average is 6
computed over the region 10°W-60°E, 25°N-75°N in the Guiot et al. (2010) reconstruction 7
and in the model and over a smaller region (10°W-40°E, 35°N-70°N) for the Luterbacher et 8
al. (2004) reconstruction. 9
10
11
Fig. 1. Time series of the summer (April to September) Europeanmean temperature (in◦C) filtered with a 13 yr cutoff value. In blackis the reconstruction from Guiot et al. (2010), in green is the re-construction from Luterbacher et al. (2004) and in red is the sim-ulation from the model CNRM-CM3. In blue the mean radiativeforcing from solar variations (in W m−2) is represented from Crow-ley (2000) with its own axis in blue on the left. The spatial average iscomputed over the region 10◦ W–60◦ E, 25◦ N–75◦ N in the Guiotet al. (2010) reconstruction and in the model and over a smaller re-gion (10◦ W–40◦ E, 35◦ N–70◦ N) for the Luterbacher et al. (2004)reconstruction.
here. The scaling used in this simulation can be consideredas a large one.
This simulation correctly simulates the large-scale varia-tions of the annual mean Northern Hemisphere temperaturesince it falls within the range of reconstructions at the hemi-spheric level (Swingedouw et al., 2011). This simulation alsoexhibits multidecadal variations for the North Atlantic Oscil-lation in winter and for the AMOC that are modulated by theforcings. While Swingedouw et al. (2011) focused on winter-delayed response to solar forcing, here we will concentrateon the response to solar forcing over Europe in summer andin phase with solar variations (lagged responses indeed pro-duce lower statistical significance in summer over Europe inthe simulation, not shown). For this purpose, we comparethis simulation with the spatio-temporal reconstruction overEurope (10◦ W–60◦ E, 25◦ N–75◦ N) for summer (April toSeptember) temperature from Guiot et al. (2010), based ondifferent proxies (mainly tree rings and pollen reconstruc-tions) covering a large part of Europe.
To compare the fingerprint from solar forcing in the sim-ulation with this reconstruction, we interpolate the summerdata from the model onto the grid from Guiot et al. (2010)reconstruction. Then, we use regression analysis of the tem-perature for each point on the TSI variability (represented inFig. 1). To minimise the climatic signature of the volcanoesand of the interannual variability, we apply a low pass Lanc-zos time-filter (Duchon, 1979) to all the fields analysed here-after, with cut-off values of 13 yr. This technique does not
Clim. Past, 8, 1487–1495, 2012 www.clim-past.net/8/1487/2012/

D. Swingedouw et al.: Mechanisms for European summer temperature response to solar forcing 1489
allow filtering out the low frequency effect coming from thevolcanoes (illustrated in Ottera et al., 2010) and detected forinstance by Hegerl et al. (2007). Indeed, solar minima some-times occur concomitantly with volcanic eruptions (Ammannet al., 2007) as for instance in the Dalton minimum and theTambora eruption. Nevertheless, solar and volcanic forcingsare not well correlated because they contain very differentspectral features. Thus, we make the assumption that the pro-posed regression mainly captures the response of the lowfrequency coming from the solar forcing. This assumptionremains a weakness of the present paper, but due to com-putation cost, we could not provide a simulation with onlysolar forcing using CNRM-CM3. In order to further evalu-ate this assumption, we have performed similar regressionsto what is shown later but we have excluded the 11 yr fol-lowing eruptions larger than Pinatubo; we found very similarpatterns (not shown). The statistical significance of the corre-lations and regressions computed in this study are estimatedby using a “random-phase” test that accounts for the serialcorrelation effect due to the low-pass filtering of the recon-struction (Ebisuzaki, 1997).
3 Results
The evolution of summer temperature averaged over thewhole Europe is represented in Fig. 1. For the period 1001–1860, the standard deviation is 0.22◦C in the reconstructionand 0.18◦C in the model. The correlation between the twotime series is only of 0.25 (statistically significant at the 95 %level). Indeed the simulation misses high amplitude varia-tions especially for the period between 1500–1700, but themain trend related to solar forcing (correlation of 0.24 be-tween solar forcing and the temperature reconstruction andof 0.53 in the simulation) is simulated by the model. Thecorrelation with solar forcing is higher when limited to theperiod 1100–1500 (a period not considered in the Hegerl etal., 2011 analysis) and reaches the same value of 0.56 bothin the model and the reconstruction. As an additional test,we use the Luterbacher et al. (2004) reconstruction for Eu-rope over the period 1500–1860. We find a better correlationof 0.45 (significant at the 95 % level) with solar forcing overthis time period. In particular we notice that the large dis-agreement between model and Guiot et al. (2010) reconstruc-tion over the period 1500–1700 is lower in the Luterbacheret al. (2004) reconstruction. The two reconstructions are notconsistent over this time period, which questions the verystrong variations occurring on this time frame in the Guiotet al. (2010) reconstruction, which are not reproduced in themodel. Moreover, it should be stressed that the correlationwith solar forcing is better in the simulation than in both re-constructions. This could be related to the fact that the solarforcing used in the model is perfectly known while the realone still remains under debate (Gray et al., 2010).
15
1
Figure 2. a Spatial regression of the summer temperature from Guiot et al. (2010) on the solar 2
variations (in °C/W.m-2) for the period 1001-1860. The large black crosses indicate the point 3
not significant at the 90%, the smaller one, the region not significant at the 95% and the 4
horizontal line at the 99% level. b Same as a but for the simulation (note that the ocean point 5
have been excluded since the data used by Guiot et al. (2010) are from land). 6
Fig. 2. (a)Spatial regression of the summer temperature from Guiotet al. (2010) on the solar variations (in◦C/W m−2) for the period1001–1860. The large black crosses indicate the point not signifi-cant at 90 %, the smaller one, the region not significant at 95 % andthe horizontal line at the 99 % level.(b) same as(a) but for the sim-ulation (note that the ocean point have been excluded since the dataused by Guiot et al., 2010 are from land).
Figure 2 shows the spatial temperature regression over thesolar forcing in the reconstruction and the model for zerotime lags. We notice that for most of the grid points the re-gression is positive and statistically significant at the 90 %level. This means that the surface temperature increases withan increase in solar forcing, in agreement with the associ-ated changes in radiative forcing at the top of the atmosphere(Fig. 3a). The solar forcing is related with short wave vari-ation at the top of the atmosphere. This forcing is almostisotropic over Europe as shown in Fig. 3a only with slightdecrease of the forcing in latitude related with the rotundityof the Earth (26 % lower at 75◦ N than at 25◦ N, cf. Fig. 3a).Nevertheless, the response to this radiative forcing changesexhibit a complex spatial response, with a large warming inthe north and south of Europe and a lesser warming in thecentre, both in the reconstruction and in the model. The lati-tudinal agreement is actually quantitatively correct as shown
www.clim-past.net/8/1487/2012/ Clim. Past, 8, 1487–1495, 2012

1490 D. Swingedouw et al.: Mechanisms for European summer temperature response to solar forcing
16
1
Figure 3. Regression of different variables from the model simulation on the solar variations 2
for the period 1001-1860. a Downward shortwave (SW) radiation at the top of the atmosphere 3
(TOA) in W.m-2/ W.m-2. b Cloud concentration in %/W.m-2. c Precipitation in mm.day-1/ 4
W.m-2. d Evapotranspiration in mm.day-1/W.m-2. The sign is positive for cloud, precipitation, 5
evapotranspiration and downward SW when the variables increase with solar forcing. The 6
shaded regions represent regions with statistically significant regression value at the 95% 7
level. 8
Fig. 3. Regression of different variables from the model simulation on the solar variations for the period 1001–1860.(a) Downward short-wave (SW) radiation at the top of the atmosphere (TOA) in W m−2/W m−2. (b) Cloud concentration in %/W m−2. (c) Precipitation inmm day−1/W m−2. (d) Evapotranspiration in mm day−1/W m−2. The sign is positive for cloud, precipitation, evapotranspiration and down-ward SW when the variables increase with solar forcing. The shaded regions represent regions with statistically significant regression valueat the 95 % level.
in Fig. 4: there is a similar minimum of warming around55◦ N with an increased warming north of it, sharing a simi-lar increase, although largely overestimated after 65◦ N in themodel as compared to the reconstruction. South of the 55◦ Nminimum, the regressed temperature also increases but southof 40◦ N, the increase in the model becomes more than twotimes larger than in the reconstruction. The signature of so-lar forcing over Central and Eastern Europe is not significantin a lot of grid-points from the model and the reconstruction(Fig. 2). Given that the solar forcing is almost isotropic overEurope, the latitudinal temperature response found in Fig. 4remains remarkable and is certainly the results of local feed-back or change in large-scale circulation, which needs to beexplained. For that purpose we analyse the response of themodel to solar forcing variations.
We notice in the model (Fig. 3) an increase in cloud cover,precipitation and evapotranspiration over Central and East-ern Europe related to the increase in solar forcing. For thesevariables, Central and Eastern Europe are the regions thatexhibit the largest changes, which is surprising given thesmall temperature response. We argue that this response of
17
1
Figure 4. Regression of the zonal mean summer temperature over the solar forcing, in black 2
for the reconstruction and in red for the simulation. The dashed lines correspond to a two 3
standard deviation error bar computed from the residual of the regression. 4
Fig. 4. Regression of the zonal mean summer temperature over thesolar forcing, in black for the reconstruction and in red for the sim-ulation. The dashed lines correspond to a two standard deviationerror bar computed from the residual of the regression.
Clim. Past, 8, 1487–1495, 2012 www.clim-past.net/8/1487/2012/
D. Swingedouw et al.: Mechanisms for European summer temperature response to solar forcing 1491
18
1
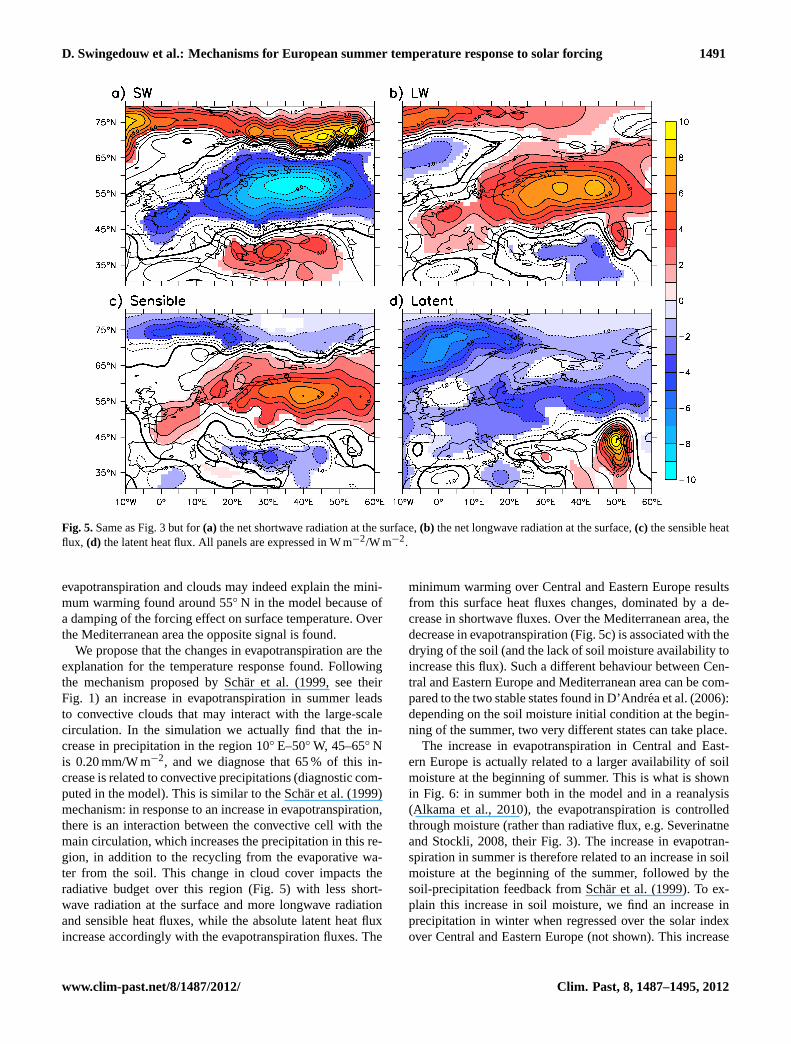
Figure 5. Same as Figure 3 but for a the net shortwave radiation at the surface, b the net 2
longwave radiation at the surface, c the sensible heat flux, d the latent heat flux. All panels 3
are expressed in W.m-2/W.m-2. 4
Fig. 5.Same as Fig. 3 but for(a) the net shortwave radiation at the surface,(b) the net longwave radiation at the surface,(c) the sensible heatflux, (d) the latent heat flux. All panels are expressed in W m−2/W m−2.
evapotranspiration and clouds may indeed explain the mini-mum warming found around 55◦ N in the model because ofa damping of the forcing effect on surface temperature. Overthe Mediterranean area the opposite signal is found.
We propose that the changes in evapotranspiration are theexplanation for the temperature response found. Followingthe mechanism proposed by Schar et al. (1999, see theirFig. 1) an increase in evapotranspiration in summer leadsto convective clouds that may interact with the large-scalecirculation. In the simulation we actually find that the in-crease in precipitation in the region 10◦ E–50◦ W, 45–65◦ Nis 0.20 mm/W m−2, and we diagnose that 65 % of this in-crease is related to convective precipitations (diagnostic com-puted in the model). This is similar to the Schar et al. (1999)mechanism: in response to an increase in evapotranspiration,there is an interaction between the convective cell with themain circulation, which increases the precipitation in this re-gion, in addition to the recycling from the evaporative wa-ter from the soil. This change in cloud cover impacts theradiative budget over this region (Fig. 5) with less short-wave radiation at the surface and more longwave radiationand sensible heat fluxes, while the absolute latent heat fluxincrease accordingly with the evapotranspiration fluxes. The
minimum warming over Central and Eastern Europe resultsfrom this surface heat fluxes changes, dominated by a de-crease in shortwave fluxes. Over the Mediterranean area, thedecrease in evapotranspiration (Fig. 5c) is associated with thedrying of the soil (and the lack of soil moisture availability toincrease this flux). Such a different behaviour between Cen-tral and Eastern Europe and Mediterranean area can be com-pared to the two stable states found in D’Andrea et al. (2006):depending on the soil moisture initial condition at the begin-ning of the summer, two very different states can take place.
The increase in evapotranspiration in Central and East-ern Europe is actually related to a larger availability of soilmoisture at the beginning of summer. This is what is shownin Fig. 6: in summer both in the model and in a reanalysis(Alkama et al., 2010), the evapotranspiration is controlledthrough moisture (rather than radiative flux, e.g. Severinatneand Stockli, 2008, their Fig. 3). The increase in evapotran-spiration in summer is therefore related to an increase in soilmoisture at the beginning of the summer, followed by thesoil-precipitation feedback from Schar et al. (1999). To ex-plain this increase in soil moisture, we find an increase inprecipitation in winter when regressed over the solar indexover Central and Eastern Europe (not shown). This increase
www.clim-past.net/8/1487/2012/ Clim. Past, 8, 1487–1495, 2012

1492 D. Swingedouw et al.: Mechanisms for European summer temperature response to solar forcing
19
1
Figure 6. Correlation between the net radiative forcing and evapotranspiration (in black) and 2
soil water content and evapotranspiration (in red) for a region of Central and Eastern Europe 3
(10-50°E, 50-60°N) for different months (on the x-axis) a in a reanalysis from Alkama et al. 4
(2010) over the period 1950-2000 and b in the model simulation the period 1001-1800. The 5
different lines in panel b correspond to a computation every 50 years starting from 1001-1050 6
(until 1800-1850). This has been done in order to evaluate the stationarity of the relationship 7
in the model. 8
Fig. 6.Correlation between the net radiative forcing and evapotran-spiration (in black) and soil water content and evapotranspiration(in red) for a region of Central and Eastern Europe (10–50◦ E, 50–60◦ N) for different months (on the x-axis)(a) in a reanalysis fromAlkama et al. (2010) over the period 1950–2000 and(b) in themodel simulation, the period 1001–1800. The different lines in(b)correspond to a computation every 50 yr starting from 1001–1050(until 1800–1850). This has been done in order to evaluate the sta-tionarity of the relationship in the model.
may allow increasing the loading of soil moisture in winterand spring and leads to the mechanism proposed. This in-crease in precipitation in winter is not related to a change inlarge-scale circulation (no significant correlation found withweather regimes frequency or empirical orthogonal functionof the sea-level pressure over the North Atlantic region, notshown) but could be explained by the Clausius–Clapeyronrelationship, since the temperature is enhanced in winter inresponse to the increase in solar forcing (Swingedouw et al.,2011, their Fig. 3a). The whole mechanism for Central andEastern Europe is summarized in Fig. 7.
For the Mediterranean area, this effect is not sufficient, sothat the soil becomes dry leading to the large warming ob-served in the model, which seems overestimated as comparedto the reconstruction. Changes in large-scale circulation and
20
1
Figure 7. Scheme of the proposed mechanism operating in Central and Eastern Europe. The 2
sign between the two variables at each side of any arrow explains the relationship between 3
them (“+” for increase and “-“ for decrease). The Schär et al. (1999) positive feedback loop 4
has been highlighted in light pink. 5
Fig. 7.Scheme of the proposed mechanism operating in Central andEastern Europe. The sign between the two variables at each side ofany arrow explains the relationship between them (“+” for increaseand “−” for decrease). The Schar et al. (1999) positive feedbackloop has been highlighted in light pink.
the subsidence zone have been argued to play a crucial rolein future climatic projections for the drying of the Mediter-ranean area (Yin, 2005). Here we do not find any clear sig-nature of a change in the main circulation patterns (Fig. 8b)so that we believe that it is mainly local feedbacks that areplaying a role in our simulation. This may be related to therelatively weak forcing of the solar variations as compared towhat happens in most projections.
In the North, the evapotranspiration is not controlled bysoil moisture but rather by the (low) radiative flux availabil-ity so that the former mechanism does not apply (Seneviratneand Stockli, 2008). The large warming found in this regioncan be explained by the sea-ice retreat as shown in Fig. 8a. In-deed in summer we find a decrease of 1.52× 10¹¹ m2/W m−2
of sea-ice cover in the Nordic and Barents Seas when thesolar forcing increases. This sea-ice retreat leads throughalbedo feedback to a larger net short wave at the surface(Fig. 5a) amplifying the warming there. Its effect on thelarge-scale circulation is not significant (Fig. 8b), so that weargue that it is mainly a local feedback process that explainsthe warming in the North. A reconstruction of sea-ice varia-tions north of Iceland over the last millennium (Masse et al.,2008) indeed show large variations of the sea-ice cover inthis location, notably with a maximum over the last millen-nium around 1690, which corresponds to the Maunder solarminimum without any large volcanic eruption at that time.
Clim. Past, 8, 1487–1495, 2012 www.clim-past.net/8/1487/2012/

D. Swingedouw et al.: Mechanisms for European summer temperature response to solar forcing 1493
21
1
Figure 8: Similar to Figure 3 but for a sea-ice cover (in W.m-2/W.m-2) and b sea-level 2
pressure (in hPa/W.m-2). The significant regions at the 95% level are shaded in color. 3
4
Fig. 8.Similar to Fig. 3 but for(a) sea-ice cover (in %/W m−2) and(b) sea-level pressure (in hPa/W m−2). The significant regions atthe 95 % level are shaded in color.
4 Conclusions
In this study, we have shown that over the preindustrial pe-riod of the last millennium, a regression of surface tempera-ture in summer over solar forcing in the CNRM-CM3 modeland the Guiot et al. (2010) reconstruction shares a similar lat-itudinal pattern in Europe with a minimum response around55◦ N. To explain the qualitatively correct representation ofthe temperature latitudinal response to solar forcing at lowfrequency in the model as compared to the reconstruction, weargue that the evapotranspiration changes as well as their in-teractions with atmosphere (convection, radiative adjustmentwith cloud) are the leading processes.
This study therefore shows that spatio-temporal tempera-ture reconstruction can be useful to evaluate simulated lowfrequency variability. A time scale long enough such as thelast millennium allows increasing the signal-to-noise ratio ofthe radiative forcing on the climate. The latitudinal agree-ment between model and observed reconstruction is correctexcept for latitude larger than 65◦ N and around the Mediter-ranean area, where warming is overestimated in the model.
This difference can be due to an incorrect representation ofthe soil processes in the model. There are also large uncer-tainties for the scaling used for solar forcing, which can ex-plain the difference. Indeed a lower solar forcing may in-duce lower response in the model, more in agreement withthe reconstruction. Moreover, there are fewer data over theMediterranean area in the Guiot et al. (2010) reconstruc-tion, which may increase the uncertainty over this area. Re-construction and model show a similar minimum around55◦ N, but the model misses another local minimum in the re-construction located around 45◦ N. This disagreement couldindicate that the transition zone defined by Boe and Ter-ray (2008) is too far to the north in the model as compared tothe one we found in the reconstruction. This result may sug-gest a deficiency in the response that implies that caution hasto be exercised when considering projections over this regionwith this model.
We would like to make some caveats concerning thisstudy. First of all, the correlation between the reconstructionand solar forcing remains small when averaged over Europe,in agreement with Hegerl et al. (2011). Nevertheless we ar-gue here, that this is notably because the signal over Cen-tral and Eastern Europe is considerably damped, implyingvery small correlation with solar forcing. The extension ofour time frame to the period before 1500 (as compared toHegerl et al., 2011) also improves the correlation we findwith solar forcing. Moreover, it will be very useful to ex-tend the present analysis to other climate models in order toevaluate if they found a similar large evapotranspiration re-sponse to solar forcing in summer as in the CNRM-CM3 anda similar latitudinal response and minimum. Finally, we havecompared the correlation of a few others summer reconstruc-tions with solar forcing and found no significant correlationwith data from Central Europe (Buntgen et al., 2011) or inthe Pyrenees (Buntgen et al., 2008) for the last millennium.A recent Fennoscandia reconstruction also does not exhibitlarge coherence with solar forcing (D. McCarroll, personalcommunication, 2012) as well as a former one (Lindholm etal., 2011), so that the slight correlation found in this study isnot consistent with a few local reconstructions. The resultsfrom the data side therefore need to be taken with cautious.Nevertheless, we propose that the inclusion of pollen datain the Guiot et al. (2010) reconstruction may improve thelow frequency representation of the variability and thereforethe correlation with the solar forcing as compared to recon-structions only based on tree ring. The correlation with solarand associated mechanism found in the model appears moreclearly. This could indicate that the solar forcing chosen inthis model is stronger than what it may have been in reality,agreeing with Foukal et al. (2006). Indeed, the amplitude ofthe solar reconstructions we use can be considered as large ascompared to others recent reconstruction with a lower scal-ing (Gray et al., 2010).
Finally, we conclude that it is useful to continue theimprovement of spatio-temporal reconstruction of the last
www.clim-past.net/8/1487/2012/ Clim. Past, 8, 1487–1495, 2012
1494 D. Swingedouw et al.: Mechanisms for European summer temperature response to solar forcing
millennium, and to simulate this long period with climatemodels in order to evaluate the processes explaining the re-sponse to change in radiative forcing such as the solar one.
Acknowledgements.We thank Ramdane Alkama for providing thedata of the soil moisture and evapotranspiration over Europe. Thispaper is a contribution to the project ESCARSEL funded by theFrench Agency for National Research (ANR VMC 2006). The useof the software packages statpack, safo and ferret is acknowledged.
Edited by: V. Rath
The publication of this article is financed by CNRS-INSU.
References
Alkama, R., Decharme, B., Douville, H., Becker, M., Cazenave, A.,Sheffield, J., Voldoire, A., Tyteca, S., and Le Moigne, P.: Globalevaluation of the ISBA-TRIP continental hydrological system,Part I: Comparison to GRACE terrestrial water storage estimatesand in situ river discharges, J. Hydrometeorol., 11, 583–600,2010.
Ammann, C. M., Joos, F., Schimel, D., Otto-Bliesner, B. L., andTomas, R.: Solar influence on climate during the past millen-nium: results from transient simulations with the NCAR ClimateSystem Model, P. Natl. Acad. Sci., 104, 3713–3718, 2007.
Bard, E., Raisbeck, G., Yiou, F., and Jouzel, J.: Solar irradiance dur-ing the last 1200 years based on cosmogenic nuclides, Tellus B,50, 985–992, 2000.
Boe, J. and Terray, L.: Uncertainties in summer evapotran-spiration changes over Europe and implications for re-gional climate change, Geophys. Res. Lett., 35, L05702,doi:10.1029/2007GL032417, 2008.
Buntgen, U., Frank, D. C., Grudd, H., and Esper, J.: Long-term sum-mer temperature variations in the Pyrenees, Clim. Dynam., 31,615–631, 2008.
Buntgen, U., Tegel, W., Nicolussi, K., McCormick, M., Frank,D., Trouet, V., Kaplan, J., Herzig, F., Heussner, U., Wanner,H., Luterbacher, J., and Esper, J.: 2500 years of European cli-mate variability and human susceptibility, Science, 331, 578–582, 2011.
Christensen, J. H., Hewitson, B., Busuioc, A., Chen, A., Gao, X.,Held, I., Jones, R., Kolli, R. K., Kwon, W.-T., Laprise, R., Ma-gana Rueda, V., Mearns, L., Mennendez, C. G., Raisanen, J.,Rinke, A., Sarr, A., and Whetton, P.: Regional climate projec-tions, in: Climate Change 2007: The Physical Science Basis.Contribution of Working Group I to the Fourth Assessment Re-port of the Intergovernmental Panel on Climate Change, editedby: Solomon, S., Qin, D., Manning, M., Chen, Z., Marquis, M.,
Averyt, K. B., Tignor, M., and Miller, H. L., Cambridge Univer-sity Press, Cambridge, New York, 2007.
Crowley, T. J.: Causes of climate change over the past 1000 years,Science, 289, 270–277, 2000.
D’Andrea, F., Provenzale, A., Vautard, R., and DeNoblet-Ducoudre, N.: Hot and cool summers: multiple equilibria ofthe continental water cycle, Geophys. Res. Lett., 33, L24807,doi:10.1029/2006GL027972, 2006.
Duchon, C. E.: Lanczos filtering in one and two dimensions, J.Appl. Meteorol., 18, 1016–1022, 1979.
Ebisuzaki, W.: A method to estimate the statistical significance of acorrelation when the data are serially correlated, J. Climate, 10,2147–2153, 1997.
Foukal, P., Frohlich, C., Spruit, H., and Wigley, T. M. L.: Variationsin solar luminosity and their effect on the Earth’s climate, Nature,443, 161–166,doi:10.1038/nature05072, 2006.
Gibelin, A. L. and Deque, M.: Anthropogenic climate change overthe Mediterranean region simulated by a global variable resolu-tion model, Clim. Dynam., 20, 327–339, 2003
Gray, L. J., Beer, J., Geller, M., Haigh, J. D., Lockwood, M.,Matthes, K., Cubasch, U., Fleitmann, D., Harrison, G., Hood,L., Luterbacher, J., Meehl, G. A., Shindell, D., van Geel, B.,and White, W.: Solar influence on climate, Rev. Geophys., 48,RG4001,doi:10.1029/2009RG000282, 2010.
Guiot, J., Corona, C., and ESCARSEL members: Grow-ing season temperatures in Europe and climate forc-ings over the past 1400 years, PLoS ONE, 5, e9972,doi:10.1371/journal.pone.0009972, 2010.
Hegerl, G. C., Crowley, T., Allen, M., Hyde, W. T., Pollack, H.,Smerdon, J., and Zorita, E.: Detection of human influence ona new 1500 yr climate reconstruction, J. Climate, 20, 650–666,2007.
Hegerl, G., Luterbacher, J., Gonzalez-Rouco, F., Tett, S. F. B.,Crowley, T., and Xoplaki, E.: Influence of human and natu-ral forcing on European seasonal temperatures, Nat. Geosci., 3,688–694, 2011.
Hunt, B. G.: The Medieval Warm Period, the Little Ice Age andsimulated climatic variability, Clim. Dynam., 27, 677–694, 2006.
Lindholm, M., Jalkanen, R., Salminen, H., Aalto, T., and Ogurtsov,M.: The height-increment record of summer temperature ex-tended over the last Millennium in Fennoscandia, Holocene, 21,319–326,doi:10.1177/0959683610378875, 2011.
Luterbacher, J., Dietrich, D., Xoplaki, E., Grosjean, M., and Wan-ner, H.: European seasonal and annual temperature variability,trends, and extremes since 1500, Science, 303, 1499–1503, 2004.
Madec, G., Delecluse, P., Imbard, M., and Levy, C.: OPA version 8,Ocean general circulation model reference manual, Rapp. Int.,LODYC, France, p. 200, 1998.
Masse, G., Rowland, S. J., Sicre, M.-A., Jacob, J., Jansen, E.,and Belt, S. T.: Abrupt climate changes for Iceland dur-ing the last millennium: Evidence from high resolution seaice reconstructions, Earth Planet. Sc. Lett., 269, 564–568,doi:10.1016/j.epsl.2008.03.017, 2008.
Ottera, O. H., Bentsen, M., Drange, H., and Suo, L.: External forc-ing as a metronome for Atlantic multidecadal variability, Nat.Geosci., 4, 99–103, 2010.
Salas-Melia, D.: A global coupled sea ice-ocean model, OceanModel., 4, 137–172, 2002.
Clim. Past, 8, 1487–1495, 2012 www.clim-past.net/8/1487/2012/

D. Swingedouw et al.: Mechanisms for European summer temperature response to solar forcing 1495
Salas-Melia, D., Chauvin, F., Deque, M., Douville, H., Gueremy,J. F., Marquet, P., Planton, S., Royer, J. F., and Tyteca, S.:Description and validation of the CNRM-CM3 global coupledmodel, CNRM technical report 103,http://www.cnrm.meteo.fr/scenario2004/papercm3.pdf, available from CNRM/GMGEC,Toulouse, France, 2005.
Scaife, A. A., Spangehl, T., Fereday, D. R., Cubasch, U., Lange-matz, U., Akiyoshi, H., Bekki, S., Braesicke, P., Butchart, N.,Chipperfield, M. P., Gettelman, A., Hardiman, S. C., Michou,M., Rozanov, E., and Shepherd, T. G.: Climate change projec-tions and stratosphere–troposphere Interaction, Clim. Dynam.,38, 2089–2097,doi:10.1007/s00382-011-1080-7, 2012.
Schar, C., Luthi, D., Beyerle, U., and Heise, E.: The soil-precipitation feedback: a process study with a regional climatemodel, J. Climate, 12, 722–741, 1999.
Seneviratne, S. I. and Stockli, R.: The role of land-atmosphere inter-actions for climate variability in Europe, in: Climate Variabilityand Extremes during the Past 100 years, in: Adv. Global ChangeRes., edited by: Bronnimann, S., Luterbacher, J., Ewen, T., Diaz,H. F., Stolarski, R. S., and Neu, U., 33, Springer Verlag, 2008.
Seneviratne, S. I., Luthi, D., Litschi, M., and Schar, C.: Land-atmosphere coupling and climate change in Europe, Nature, 443,205–209, 2006.
Shapiro, A. I., Schmutz, W., Rozanov, E., Schoell, M., Haberre-iter, M., Shapiro, A. V., and Nyeki, S.: A new approach tothe long-term reconstruction of the solar irradiance leads tolarge historical solar forcing, Astron. Astrophys., 529, A67,doi:10.1051/0004-6361/201016173, 2011.
Swingedouw, D., Terray, L., Cassou, C., Voldoire, A., Salas-Melia,D., and Servonnat, J.: Natural forcing of climate during the lastmillennium: fingerprint of solar variability, Clim. Dynam., 36,1349–1364, 2011.
Vieira, L. E. A., Solanki, S. K., Krivova, N. A., and Usoskin, I.:Evolution of the solar irradiance during the Holocene, Astron.Astroph., 531, A6,doi:10.1051/0004-6361/201015843, 2011.
Yin, J. H.: A consistent poleward shift of the storm tracks in simu-lations of 21st century climate, Geophys. Res. Lett., 32, L18701,doi:10.1029/2005GL023684, 2005.
www.clim-past.net/8/1487/2012/ Clim. Past, 8, 1487–1495, 2012
Related Documents