MECHANISM OF ARSENIC SORPTION ONTO LATERITE CONCRETIONS Frederick Kenneh Partey New Mexico Tech Department of Earth and Environmental Science

Welcome message from author
This document is posted to help you gain knowledge. Please leave a comment to let me know what you think about it! Share it to your friends and learn new things together.
Transcript
MECHANISM OF ARSENIC SORPTION
ONTO LATERITE CONCRETIONS
Frederick Kenneh Partey
New Mexico Tech
Department of Earth and Environmental Science

MECHANISM OF ARSENIC SORPTION ONTO LATERITE IRON
CONCRETIONS
By
Frederick Kenneh Partey
Submitted to the faculty of New Mexico Tech in partial fulfillment of the requirements for the degree of
Doctor of Philosophy in Earth and Environmental Science with Dissertation in Geochemistry
New Mexico Institute of Mining and Technology Department of Earth and Environmental Science
Socorro, New Mexico January 2008

Advisory Committee
Advisor______________________________ Dr. Dave Norman
Member 1________________________________ Dr. Robert Bowman
Member 2________________________________
Dr. Jan Hendrickx
Member 3________________________________ Dr. Malcolm Siegel
Member 4________________________________ Dr. Virgil Lueth

Dedication
This Thesis is dedicated in loving memory of Mr. and Mrs. Henry Teye
Partey and to my beloved wife Cynthia Partey not forgetting Deborah,
Daisy, Dave and Diandra. Your support and encouragement has brought
me this far.
Such is life Men’s evil deeds are written on brass the good ones on water when I am right no one remembers when I am wrong no one forgets.
ABSTRACT
The objective of this study is to understand the sorption mechanisms and to
quantify sorption of arsenic on laterite concretions (LC). Laterite concretions are
known to sorb arsenic. I investigated As (III) and As (V) sorption onto Prestea and
Awaso laterite concretions (LC) to test its suitability for use in low-tech treatment of
arsenic-bearing drinking water. The two Fe-Al oxide-hydroxide concretions were
selected for the study because they represent compositional end members, Al-rich
(Awaso) and Fe-rich (Prestea), of lateritic soil concretions. The ultimate goal of this
project is to demonstrate how and why LC can be used as an effective and
inexpensive means of water purification system for communities that cost less and is
easy to maintain, and produced drinking water of high quality.
Attenuated Total Reflection Fourier transform infrared (ATR-FTIR)
spectroscopic methods were combined with sorption experiments, electrophoretic
mobility measurements, and surface complexation modeling to study the interaction
of As (III) and As (V) with laterite concretion surfaces. Arsenic sorption on Prestea
and Awaso laterite concretions was also investigated as a function of solution pH.
The sorption capacity was determined for both concretions through batch experiments
on crushed samples. Prestea LC was studied at different temperatures to evaluate the
effect of temperature on the media. Competitive sorption experiments were also
conducted in the presence of phosphate and sulfate, as this represents the case of
greatest threat to arsenic remediation in most ground waters and sulfide mining waste
waters from stock piles.

Experiments of Prestea LC show that sorption capacity for both arsenite and
arsenate increases with temperature. The equilibrium sorption capacity for As (III) is
larger than that for As (V) over temperatures ranging from 25° to 60°C. A Langmuir
model satisfactorily fits the arsenite and arsenate sorption isotherm data for both
Prestea and Awaso LC. Both As (III) and As (V) sorbed well for the pH range of
natural waters with little change.
Arsenic (III) sorption on both Prestea and Awaso LC exhibits decreasing
sorption with increasing ionic strength, indicating an outer-sphere sorption
mechanism. Arsenic (V) sorption on both Prestea and Awaso LC shows slight ionic
strength dependence with increasing solution pH, and an increase in sorption with
increasing solution ionic strength. These behaviors are indicative of an inner-sphere
sorption mechanism for As (V) on both studied types of LC.
The results of the electrophoretic measurements (EM) indicate that both As
(III) and As (V) form inner-sphere complexes on Prestea LC. Arsenic (III) forms
outer-sphere sorption mechanisms on Awaso LC because there is no shift in pHzpc
even with an increase in As (III) concentration. Arsenic (V) however, forms inner
sphere complexes on Awaso LC due to shifts in pHpzc and reversals of EM with
increasing ion concentration.
The ATR-FTIR analysis shows an increase in peak intensities and band shift
to lower wavelengths for both As (III) and As (V) on Prestea and Awaso LC. The
presences of the peaks in the treated LC spectra that are not present in the untreated
sample are an indication of chemical bonding between the arsenic species and the

surface of the Prestea LC. The peak shift and the change in peak intensity may be
indicative of an inner-sphere sorption mechanism. The peak positions of the arsenic
treated samples (sorbed samples for both Prestea and Awaso LC) are significantly
different from those of the dissolved arsenic species and can be attributed to sorption
of the arsenic species. In general, the spectra of both As (III) and As (V) sorbed onto
the Prestea and Awaso LC are very different from those of arsenic aqueous solutions.
This difference and the lack of pH dependence on the positions of the vibrational
modes indicate that these modes are “protected” from changes in pH and indicate that
these groups are involved in direct complexation to the surface. Another line of
evidence for the mechanism of sorption that is converse to the ATR-FTIR spectra for
dissolved arsenic species is that a shift in band position was not observed in As (V)
and As (III) adsorbed spectra with changing pH. The lack of change in band position
at various pH values suggests that arsenic formed the same inner-sphere surface
complexes on both Prestea and Awaso LC.
Surface complexation models successfully constrained both macroscopic
and microscopic measurements. The effect of changes in ionic strength on
sorption of As (III) and As (V) on Prestea and Awaso was modeled using both diffuse
and triple layer models. Arsenic (V) sorption, which is slightly affected by ionic
strength, was modeled with both the diffuse layer and the triple layer model, although
the triple layer model shows a better fit at higher pH’s than the diffuse layer model.
Arsenic (III) sorption, which is markedly reduced by increasing ionic strength, is best
modeled using the triple layer model.

The presence of phosphate and sulfate reduces the amount (mg) of As (III)
sorbed per gram of Prestea and Awaso LC. However, an aqueous solution of As (V)
spiked with sulfate did not reduce As (V) sorption rather it increased the sorption.
The increase was more prominent on Awaso than Prestea LC.
The negative “Gibbs free energy (∆Go)” values for arsenite and arsenate
sorption on Prestea LC agree with spontaneous reaction between the species and the
medium. Positive “entropy (∆So)” values suggest the affinity of LC for the arsenic
species in solution.
The sorption capacity value indicates that significant sorption sites are
available for specific sorption of both arsenic species. The development of low-cost
arsenic filters using LC is therefore practical. The Prestea and Awaso LC both
treated approximately 5000 bed volumes of 42 µL As (V) Socorro water to the
maximum contamination limit of 10 ppb. Analysis of the arsenic sorption data
suggests that LC can be used for a low-tech natural-materials arsenic water treatment
and has a number of advantages over commercial materials for this use including the
ability to remove arsenic from waters with a wide range in pH, to sorb both common
arsenic aqueous species equally well, and cost less. The positive sorption temperature
dependence of LC will enhance sorption in tropical climates, and more especially in
areas where groundwater sources are related to geothermal springs.
The media has potential in remediating other toxic trace elements to very low
concentrations. A TCLP leaching test also reveals that the used adsorbent is not toxic
and can be disposed of without the need for confinement. Investigations of arsenic
sorption onto these two end members show that, all other laterites whose

mineralogical compositions fall within these two end members should filter arsenic
from drinking water.

This dissertation is accepted on behalf of the faculty of the institute by the following committee.
Advisor
Date
I release this document to the New Mexico Institute of Mining and Technology. ____________________________________________________________________ Student’s signature Date
ACKNOWLEDGEMENTS
I wish to express my deepest gratitude first to the almighty God who gave me
the strength to undertake this project. I am very grateful to my committee members
Dr. Dave Norman, Dr. Robert Bowman, Dr Jan Hendrickx, and Dr. Malcolm Siegel
whose useful suggestions and encouragement led to the successful completion of this
work. Further more I would like to thank Dr. Christa Hochensmith who helped me
with all the ATR-FTIR work.
I am also grateful to Dr. Samuel Ndur and Matt Earthman for helping me with
laboratory work. To all members of the faculty, staff, graduate students, and
undergraduate students here in New Mexico Tech, I say thank you for your love and
care. Lastly to all and sundry, I say thank you and God bless you.
This project was funded by the Sandia National Laboratories, the Geological
Society of America, the Office of Advancement and Research at New Mexico Tech,
and the Graduate Student Association at New Mexico Tech. I appreciate scholarships
from these organizations: the American Federation of Mineralogical Societies, the
Budding Geosciences Research Award, the Women's Auxiliary to the American
Institute of Mining, and the Metallurgical and Petroleum Engineers for feeding
myself and my family during the course of this work.

TABLE OF CONTENTSPage
TABLE OF CONTENTS iiiLIST OF FIGURES vLIST OF TABLES viiiLIST OF SYMBOLS AND ABBREVIATIONS xi
CHAPTER 1 INTRODUCTION 11.1 Arsenic Health Effects 31.2 Arsenic Geochemistry 51.3 Arsenic Removal Technologies 71.4 Laterites and Lateritic Soils 81.5 Prestea and Awaso Laterite Concretions 91.6 Related Research on Mechanism of Arsenic Sorption 131.7 Sorption Chemistry and Approaches to Soprtion Mechanisms with Composite Material 14
CHAPTER 2 MATERIALS AND METHODS2.1 Characterization of LC 182.2 Sorption Isotherm 192.3 Sorption Envelopes 202.4 Competitive Sorption 212.5 Surface Titration 212.6 Electrophoretic Mobility 222.7 ATR-FTIR Spectroscopy 232.8 Surface Complexation Models 23
CHAPTER 3 RESULTS3.1 XRD, XRF and BET 293.2 Degree of Lateritization 323.3 Sorption Isotherms 323.4 Effect of Temperature and Thermodynamic Parameters 363.5 Effect of pH 383.6 Effect of Ionic Strength 383.7 Competitive Sorption 413.8 Electrophoretic Mobility 473.9 ATR-FTIR Spectroscopy 503.10 Surface Complexation Models 56

CHAPTER 4 DISCUSSION4.1 Sorption isothermS for Prestea and Awaso LC 694.2 Effect of Temperature on thermodynamic parameters 704.3 ATR-FTIR Spectroscopy 724.4 Electrophoretic Mobility 754.5 Effect of pH on Prestea and Awaso LC 774.6 Effect of ionic strength on Prestea and Awaso LC 784.7 Competitive sorption 794.8 Surface Complexation Models 814.9 Sorption mechanisms 844.10 comparing Prestea and Awaso LC 884.11 Low cost arsenic filter 904.12 Ramifications 91
CHAPTER 5 APPLICATIONS AND RECOMMENDATIONS FOR THE FUTURE 5.1 Extension of Prestea and Awaso Laterite to other laterite concretions 925.2 Recommendations for future work 96
CHAPTER 6 CONCLUSIONS 98Reference Cited
APPENDIX1.0 Testing of Prestea and Awaso LC at Socorro Pilot project 1112.0 Spectroscopic Theory and Applications 1133.0 Surface Complexation Theory 1164.0 Toxicity Characterization Leaching Procedure (TCLP) 1205.0 CD-ROM of Data Output

List of figuresFigures PagesFig. 1. Eh-pH diagram for aqueous arsenic species in the system As–O2–H2O
at 25 C and 1bar total pressure 5
Fig. 2. Map of Ghana showing Geologic units 11
Fig. 3. XRD pattern for Prestea LIC 30
Fig. 4. XRD pattern for Awaso LIC 31
Fig. 5. Arsenic (III) and As (V) sorption onto Prestea LC at 25oC 33
Fig. 6. Arsenic (III) and As (V) sorption onto Awaso LIC at 25o C 34
Fig. 7. Arsenic (III) at 25o C, 35o C, 45o C and 60o C 37
Fig. 8. Arsenic (V) at 25o C, 35o C, 45o C and 60o C 37
Fig. 9. Arsenic (III) sorption on Prestea LC as a function of pH and ionic strength 39
Fig. 10. Arsenic (V) sorption on Prestea LC as a function of pH and ionic strength 39
Fig. 11. Arsenic (III) sorption on Awaso LC as a function of pH and ionic strength 40
Fig. 12. Arsenic (V) sorption on Awaso LC as a function of pH and ionic strength 40
Fig. 13 Comparing sorption of As (III) on Prestea LIC in phosphate-free and phosphate-bearing solutions as a function of pH and ionic strength 41
Fig. 14 Comparing sorption of As (V) on Prestea LIC in phosphate-free and phosphate-bearing solutions as a function of pH and ionic strength 42
Fig. 15 Comparing sorption of As (III) on Prestea LIC in sulfate-free and phosphate-bearing solutions as a function of pH and ionic strength 43
Fig. 16 Comparing sorption of As (V) on Prestea LIC in sulfate-free and phosphate-bearing solutions as a function of pH and ionic strength 43
Fig. 17 Comparing sorption of As (III) on Awaso LIC in phosphate-free and phosphate-bearing solutions as a function of pH and ionic strength 44
Fig. 18 Comparing sorption of As (V) on Awaso LIC in phosphate-free and phosphate-bearing solutions as a function of pH and ionic strength 45
Fig. 19 Comparing sorption of As (III) on Awaso LIC in sulfate-free and phosphate-bearing solutions as a function of pH and ionic strength 46
Fig. 20 Comparing sorption of As (V) on Awaso LIC in sulfate-free and phosphate-bearing solutions as a function of pH and ionic strength 46
Fig. 21 Electrophoretic mobility of Prestea laterite iron concretion as a function of pH and total As (III) concentration in 0.01 M NaCl solution 48
Fig. 22 Electrophoretic mobility of Prestea laterite iron concretion as a function of pHpH and total As (V) concentration in 0.01 M NaCl solution 48
Fig. 23 Electrophoretic mobility of Awaso laterite iron concretion as a function of pH and total As (III) concentration in 0.01 M NaCl solution 49
Fig. 24 Electrophoretic mobility of Awaso laterite iron concretion as a function of pHpH and total As (V) concentration in 0.01 M NaCl solution 49
Fig. 25 ATR-FTIR spectra of 0.1 M As (III) and As (V) solution 51
Fig. 26 ATR-FTIR spectra of aqueous suspension of Prestea LC, 0.1M As (III)-treatedLC and 0.1 M As (III) solution for the region 1400-600 cm−1 52
Fig. 27 ATR-FTIR spectra of aqueous suspension of Prestea LC, 0.1M As (V)-treated LC and 0.1 M As (V) solution for the region 1400-600 cm−1 53
Fig. 28 ATR-FTIR spectra of aqueous suspension of Awaso LC, 0.1M As (III)-treatedLC and 0.1 M As (III) solution for the region 1400-600 cm−1 54
Fig. 29 ATR-FTIR spectra of aqueous suspension of Awaso LC, 0.1M As (V)-treated LC and 0.1 M As (V) solution for the region 1400-600 cm−1 55
Fig. 30 Diffuse layer modeled calculations for As (III) sorption on Prestea LC 61
Fig. 31. Diffuse layer modeled calculations for As (V) sorption on Prestea 62
Fig. 32. Diffuse layer modeled calculations for As (V) sorption on Awaso LC 63
Fig. 33. Diffuse layer modeled calculations for As (V) sorption on Awaso LC 64
Fig. 34. Triple layer modeled calculations for As (III) sorption on Prestea LC 65
Fig. 35. Triple layer modeled calculations for As (V) sorption on Prestea LC 66
Fig. 36. Triple layer modeled calculations for As (V) sorption on Awaso LC 67

Fig. 37. Triple layer modeled calculations for As (V) sorption on Awaso LC 68
Fig. A-1. Socorro Pilot Equipment 121
Fig A-2. Arsenic sorption on Prestea LC from Socorro Pilot project, temperature 32o C 123
Fig A-3. Arsenic sorption on Awaso LC from Socorro Pilot project,temperature 32o C 124
Fig A-4. Socorro water chemistry for major anions before going through Prestea LCand effluent water chemistry after filtering arsenic 125
Fig A-5. Socorro water chemistry for major cations before going through Prestea LCand effluent water chemistry after filtering arsenic 126
Fig A-6. Socorro water chemistry for trace elements before going through PresteaLC and effluent water chemistry after filtering arsenic 127
Fig A-7. Socorro water chemistry for major anions before going through Awaso LCand effluent water chemistry after filtering arsenic 128
Fig A-8. Socorro water chemistry for major cations before going through Awaso LCand effluent water chemistry after filtering arsenic 129
Fig A-9. Socorro water chemistry for trace elements before going through Awaso LCand effluent water chemistry after filtering arsenic 130
Fig A-10 Alternate diffuse layer modeled calculations for As (III)sorption on Prestea LC 131
Fig A-11 Alternate diffuse layer modeled calculations for As (V)sorption on Prestea LC 132
Fig A-12 Alternate diffuse layer modeled calculations for As (III)sorption on Awaso LC 133
Fig A-13 Alternate diffuse layer modeled calculations for As (V)sorption on Awaso LC 134
Fig. A-14. Triangular diagram showing various lateritic soils found elsewhere in the world. 156
LIST OF TABLESTable PageTable 1 Acidity constants for As (V) and As (III) 6
Table 2. Reactions used in the Diffuse Double Layer Modeling and EquilibriumConstants 25
Table 3.Reactions used in the Diffuse Double Layer Modeling and EquilibriumConstants 26
Table 4. Chemical composition of Prestea and Awaso laterite concretions 32
Table 5. Estimated Parameters for arsenic sorption (Prestea). 35
Table 6 Estimated Parameters for arsenic sorption (Awaso). 35
Table 7. Calculated Langmuir constants and thermodynamic parameters at pH 7.0 38
Table 8. Reactions used in the Diffuse Double Layer Modeling and EquilibriumConstants for Prestea 56
Table 9.Reactions used in the Diffuse Double Layer Modeling and EquilibriumConstants for Awaso 57
Table 10 Reactions used in the Triple Layer Modeling and Equilibrium Constantsfor Prestea LC 58
Table 11 Reactions used in the Triple Layer Modeling and Equilibrium Constantsfor Awaso LC 59
Table A-1 Prestea Field Test. Values shown are average measuredfor the period tested 122
Table A-2. Awaso Field Test. Values shown are average measuredfor the period tested 122
Table A-3. The TCLP test results for the used Prestea LC 135
Table A-4. The TCLP test results for the used Awaso LC 135
Table A-5. Summary of description of media tested and Pilot Demonstration Results 136
Table A-6 (As (III)) sorption onto Prestea laterite iron concretion as a functionof equilibrium concentration at various temperatures 137
Table A-7 (As (V)) sorption onto Prestea laterite iron concretion as a functionof equilibrium concentration at various temperatures 138

Table A-8 (As (III)) sorption onto Awaso laterite iron concretion as a functionof equilibrium concentration at 25o C 139
Table A-9 (As (V)) sorption onto Awaso laterite iron concretion as a functionof equilibrium concentration at 25o C 139
Table A-10 As (III) sorption onto Prestea laterite iron concretion as a functionof solution pH and ionic strength. 140
Table A-11 As (V) sorption onto Prestea laterite iron concretion as a functionof solution pH and ionic strength. 141
Table A-12 As (III) sorption onto Awaso laterite iron concretion as a functionof solution pH and ionic strength. 142
Table A-13 As (V) sorption onto Awaso laterite iron concretion as a functionof solution pH and ionic strength. 143
Table A-14 Modeled As (III) sorption onto Prestea laterite iron concretion as afunction of solution pH and ionic strength. 144
Table A-15 Modeled As (V) sorption onto Prestea laterite iron concretion as afunction of solution pH and ionic strength. 145
Table A-16 Modeled As (III) sorption onto Awaso laterite iron concretion as afunction of solution pH and ionic strength 146
Table A-17 Modeled As (V) sorption onto Awaso laterite iron concretion as afunction of solution pH and ionic strength 147
Table A-18 Competitive sorption of As (III) and phosphate on Prestea LC 148
Table A-19 Competitive sorption of As (III) and sulfate on Prestea LC 148
Table A-20 Competitive sorption of As (V) and phosphate on Prestea LC 149
Table A-21 Competitive sorption of As (V) and sulfate on Prestea LC 149
Table A-22 Competitive sorption of As (III) and phosphate on Awaso LIC 150
Table A-23 Competitive sorption of As (III) and sulfate on Awaso LIC 150
Table A-24 Competitive sorption of As (V) and phosphate on Awaso LIC 151
Table A-25 Competitive sorption of As (V) and sulfate on Awaso LIC 151
Table A-26 Electrophoretic mobility of Prestea laterite iron concretionas a function of pH 152
Table A-27 Electrophoretic mobility of Prestea laterite iron concretionas a function of pH 152
Table A-28 Electrophoretic mobility of Prestea laterite iron concretionas a function of pH 152
Table A-29 Electrophoretic mobility of Prestea laterite iron concretionas a function of pH 152
Table A-30 Electrophoretic mobility of Prestea laterite iron concretionas a function of pH 153
Table A-31 Electrophoretic mobility of Awaso laterite iron concretionas a function of pH 153
Table A-32 Electrophoretic mobility of Awaso laterite iron concretionas a function of pH 153
Table A-33 Electrophoretic mobility of Awaso laterite iron concretionas a function of pH 153
Table A-34 Electrophoretic mobility of Awaso laterite iron concretionas a function of pH 154
Table A-35 Electrophoretic mobility of Awaso laterite iron concretionas a function of pH 154
Table A-36. Summary of the various methods indicating mechanism(s)of arsenic sorption 154
Table A-37. Chemical composition of laterite concretions foundelsewhere in the world 155

LIST OF SYMBOLS AND ABBREVIATIONSAs (III) arsenous acid, H3AsO3
As (V) arsenic acid, H3AsO4
ATR-FTIR Attenuated Transform Reflectance- Fourier Transform InfraredBE Background ElectrolyteBET Brunauer-Emmett-Teller Surface AreaCA Component Additivity SC Method∆G° Gibbs Free Energy∆H° Standard EnthalpyDLM Diffuse-Layer Model∆S ° Standard Entropy ChangesEM Electrophoretic MobilityEXAFS X-ray Absorption Fine StructureF m-2 Faraday Per Square MeterGC Generalized Composite SC MethodKint Constant for Chemical-Specific Complexation with an Oxide SurfaceLC Laterite Concretionµg/g Micrograms per Gramµg/L Micrograms per LiterLC Laterite Concretionnm Nano MeterNMBGMR New Mexico Bureau of Geology and Mineral ResourcespH Negative Log of Hydrogen Iron ConcentrationpKa Log Acid Disassociation Constantppb Part Per Billionppm Part Per MillionPZC Point of Zero ChargeSC Surface ComplexationT Temperature, KelvinTLM Triple-Layer ModelUSEPA United States Environmental Protection AgencyWHO World Health OrganizationXANES X-ray Absorption Near Edge StructureXRD X-ray DiffractionXRF X-ray Fluorescence

CHAPTER 1
INTRODUCTION
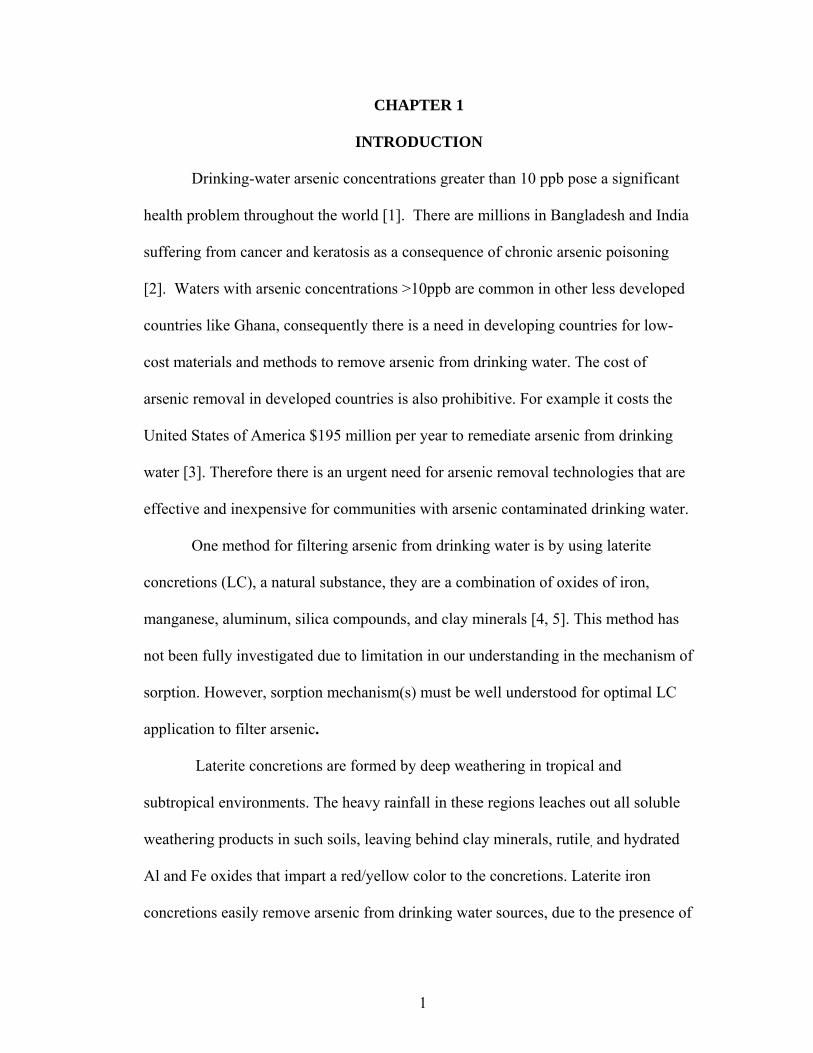
Drinking-water arsenic concentrations greater than 10 ppb pose a significant
health problem throughout the world [1]. There are millions in Bangladesh and India
suffering from cancer and keratosis as a consequence of chronic arsenic poisoning
[2]. Waters with arsenic concentrations >10ppb are common in other less developed
countries like Ghana, consequently there is a need in developing countries for low-
cost materials and methods to remove arsenic from drinking water. The cost of
arsenic removal in developed countries is also prohibitive. For example it costs the
United States of America $195 million per year to remediate arsenic from drinking
water [3]. Therefore there is an urgent need for arsenic removal technologies that are
effective and inexpensive for communities with arsenic contaminated drinking water.
One method for filtering arsenic from drinking water is by using laterite
concretions (LC), a natural substance, they are a combination of oxides of iron,
manganese, aluminum, silica compounds, and clay minerals [4, 5]. This method has
not been fully investigated due to limitation in our understanding in the mechanism of
sorption. However, sorption mechanism(s) must be well understood for optimal LC
application to filter arsenic.
Laterite concretions are formed by deep weathering in tropical and
subtropical environments. The heavy rainfall in these regions leaches out all soluble
weathering products in such soils, leaving behind clay minerals, rutile, and hydrated
Al and Fe oxides that impart a red/yellow color to the concretions. Laterite iron
concretions easily remove arsenic from drinking water sources, due to the presence of
1

metal oxy-hydroxides such as rutile and the hydrated Al and Fe oxides they contain.
These metal oxides are known to remove arsenic from drinking water, but are usually
synthesized in laboratories and are expensive. Hence the need for a natural substance
such as LC that is readily available and costs little. Laterite iron concretions can be
used to develop an effective and inexpensive means of water purification for a
community that costs less and is easy to maintain, and the drinking water produced is
of high quality.
The objective of this study is to delineate arsenic sorption mechanisms and to
demonstrate laterite concretions as media that are low-cost and effective in removing
arsenic from drinking water. This is done by:
(1) evaluating the effects of pH and ionic strength on arsenic sorption onto LC
(2) determining the LC point of zero charge (PZC)/electrophoritic mobility (EM)
with and without bound arsenic
(3) using Fourier Transformed Infra-Red spectroscopy to investigate the form
and structure of adsorbed ions on LC
(4) Using surface complexation models to describe arsenic sorption onto LC
A combination of these results will elucidate the mechanism(s) of arsenic sorption
onto LC. The parameters obtained will be used to optimize LC applications and
design appropriate and effective arsenic filtering devices.
Laterite concretions are a composite material whose sorption properties are
unique and different from most natural media available. A specific example is that at
a temperature of 25°C or higher LC removes As (III) better than As (V). Our data
suggests that LC removes arsenic effectively over a wide pH range (4-9) and works
2
better for low-tech applications than other natural materials and has distinct
advantages over engineered materials. The treatment process cost is estimated to be
only US $0.003/1000L, hence the filter will be cost effective and user friendly since
no pretreatment is required for its use. The study of arsenic sorption mechanisms
using a complex composite material such as LC is new and most researchers shun
away from it due to the difficulty in the detailed characterization of natural materials.
This research hopes to investigate the arsenic sorption techniques of Prestea
and Awaso LC and show that they effectively filter arsenic from arsenic-bearing
drinking water. The ultimate goal is to use laterite concretions from both Prestea and
Awaso to develop an effective and inexpensive means of water purification system
for communities that cost less and is easy to maintain, and produced drinking water of
high quality. The parameters obtained will be used to optimize other applications and
to design appropriate and effective arsenic filtering devices.
1.1 ARSENIC HEALTH EFFECTS
Arsenic is a unique human carcinogen in that it causes lung cancer by exposure
through ingestion as well as through inhalation [6]. Over the past decade, there is
accumulating evidence that arsenic at low levels in drinking water can seriously affect
health [7]. Cancerous lesions are associated with waters containing 100’s of ppb
arsenic [8]. Increased rates of skin cancer, heart disease, infant mortality, and birth
defects are related to arsenic levels less than 100 ppb [9]. These detrimental health
effects of arsenic prompted the World Health Organization (WHO) and the United
3
States Environmental Protection Agency (EPA) to reduce the drinking water arsenic
standard from 0.05 mg/L to 0.01 mg/L [10].
In Bangladesh there is an environmental disaster, with an estimated 1,000,000
people dying of arsenic-related cancer, and about 1,500,000 persons with some level
of arsenic poisoning from ingestion of arsenic contaminated groundwater [11]. Data
used to characterize the associations between ingested arsenic and cancer come from
epidemiological studies in which exposure is assessed from individual drinking water
sources used by the human subjects [12]. There may be other health affects not yet
known. Recently, Duker et al. [13] show a spatial pattern of Buruli ulcer and arsenic
concentration in drinking water in the Amansie West District of Ghana. Buruli ulcer
or Bairnsdale ulcer occurs in 30 tropical and subtropical countries [14].
There is widespread concern about elevated concentrations of arsenic in the
aquifers of Bangladesh. Of the 125 million people living in Bangladesh, the number
adversely affected by arsenic-contaminated drinking water has been estimated to be
between 40 and 70 million [11, 15]. Arsenic levels are lower in the USA; only a
handful of municipalities report concentrations greater than 50 µg/L. However,
individual US wells can contain extreme concentrations of arsenic of up to 12 mg/L
in rare cases [16] and levels of 10-50 µg/L are not uncommon [17, 18]. Some
researchers attribute elevated concentrations of arsenic to pyritic sedimentary rocks in
contact with the aquifer [15], though there is no general consensus about what
mechanisms are responsible for the increased concentration of arsenic in the
groundwater. In addition, elevated concentrations of arsenic are found in agricultural
drainage waters from some soils in arid regions [15].
4
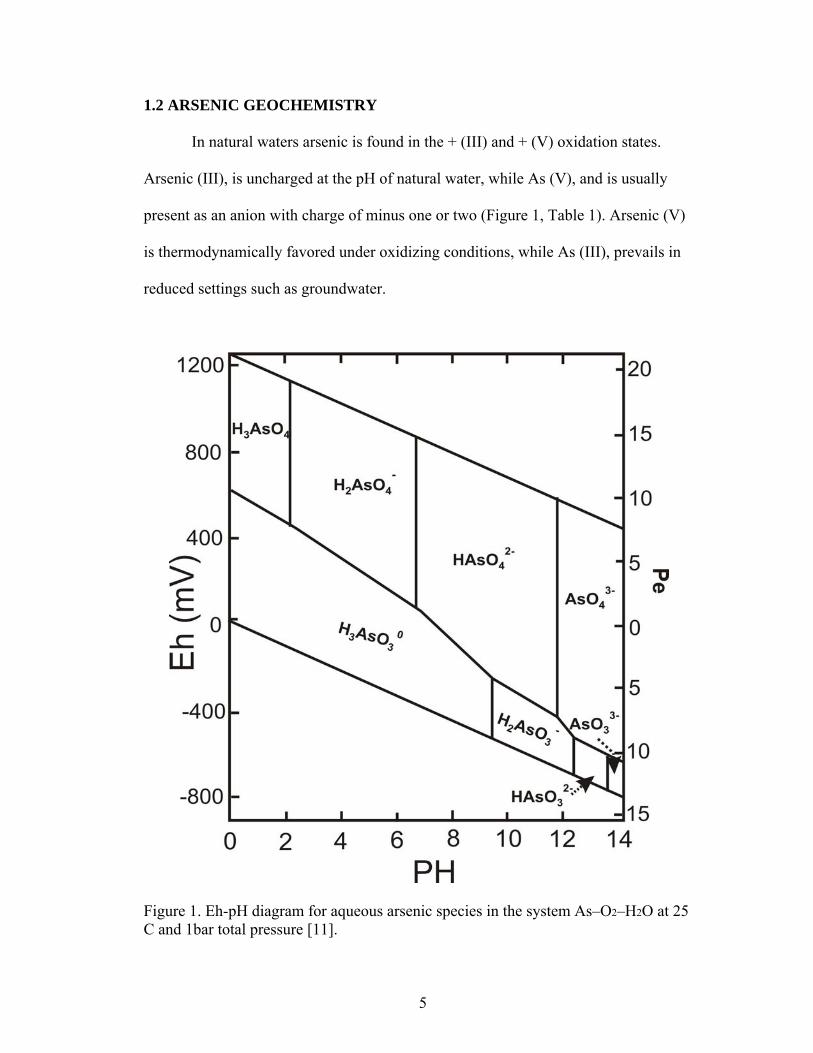
1.2 ARSENIC GEOCHEMISTRY
In natural waters arsenic is found in the + (III) and + (V) oxidation states.
Arsenic (III), is uncharged at the pH of natural water, while As (V), and is usually
present as an anion with charge of minus one or two (Figure 1, Table 1). Arsenic (V)
is thermodynamically favored under oxidizing conditions, while As (III), prevails in
reduced settings such as groundwater.
Figure 1. Eh-pH diagram for aqueous arsenic species in the system As–O2–H2O at 25
C and 1bar total pressure [11].
5
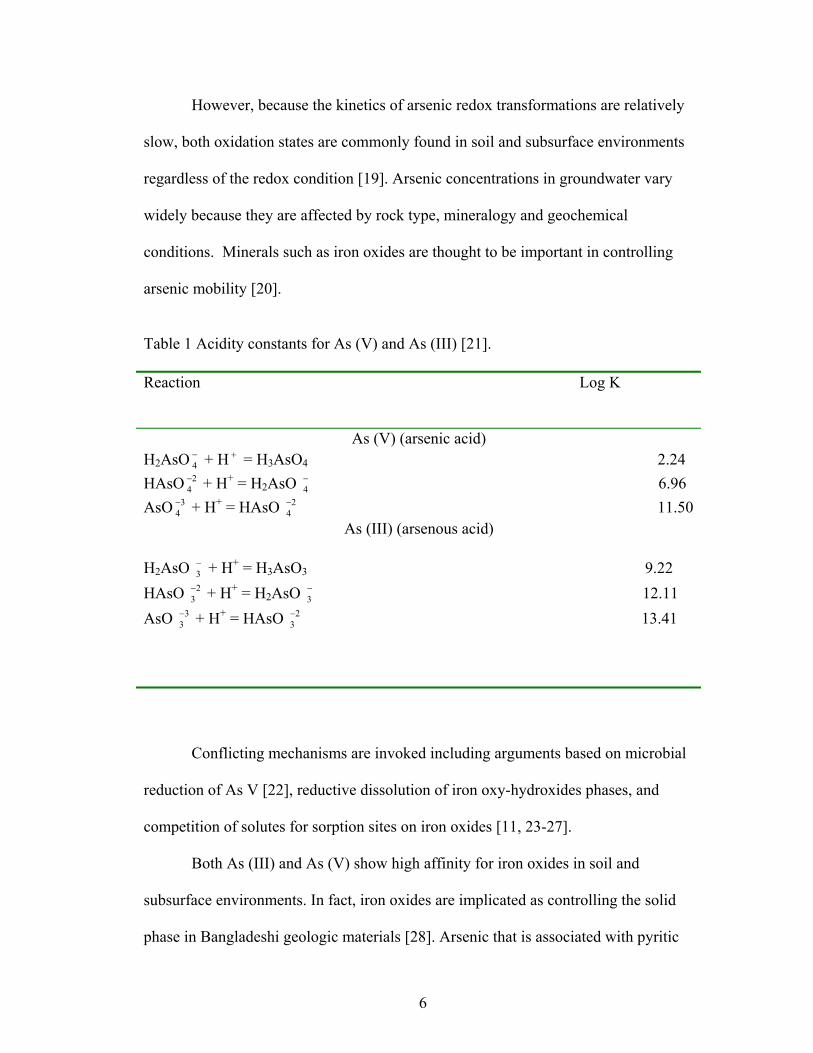
However, because the kinetics of arsenic redox transformations are relatively
slow, both oxidation states are commonly found in soil and subsurface environments
regardless of the redox condition [19]. Arsenic concentrations in groundwater vary
widely because they are affected by rock type, mineralogy and geochemical
conditions. Minerals such as iron oxides are thought to be important in controlling
arsenic mobility [20].
Table 1 Acidity constants for As (V) and As (III) [21]. Reaction Log K
As (V) (arsenic acid) H2AsO + H = H−
4+
3AsO4 2.24 HAsO + H2
4− + = H2AsO 6.96 −
4
AsO + H34− + = HAsO 11.50 2
4−
As (III) (arsenous acid)
H2AsO + H−3
+ = H3AsO3 9.22 HAsO + H2
3− + = H2AsO 12.11 −
3
AsO + H33− + = HAsO 13.41 2
3−
Conflicting mechanisms are invoked including arguments based on microbial
reduction of As V [22], reductive dissolution of iron oxy-hydroxides phases, and
competition of solutes for sorption sites on iron oxides [11, 23-27].
Both As (III) and As (V) show high affinity for iron oxides in soil and
subsurface environments. In fact, iron oxides are implicated as controlling the solid
phase in Bangladeshi geologic materials [28]. Arsenic that is associated with pyritic
6
sandstones is thought to be associated with Fe oxides. Under reducing conditions the
solubility of these arsenic-bearing solid phases is increased and is responsible, in part,
for the elevated concentrations or arsenic in the water supply [28].
1.3.Arsenic Removal Technologies
Methods for arsenic removal are well studied. The principal arsenic-removal
water treatment technologies currently in use include: metal-oxide sorption using
packed beds of activated aluminum [29, 30] and ferric hydroxide [31-33]; coagulation
using FeCl3/filtration [34, 35]; and iron oxide coated sands [36-39]. Ion exchange
methods include packed beds of chloride-forming anion exchange resins. Reverse
osmosis, nano-filtration, and enhanced coagulation have also been used previously
[40-43]. Interfering ions, such as F-, PO43-, and silicate are known to affect all these
processes [1, 44, 45]. These methods are pH sensitive and are better in removing As
(V) compared to As (III). Application of these technologies in removing arsenic
require that As (III), if present in the water, is oxidized to As (V) prior to arsenic
removal using free chlorine, hypochlorite, permanganate, hydrogen peroxide, oxygen
or an alternative oxidant. Oxidation of reduced arsenic is reported through use of UV
[46].
All oxidants have their advantages and disadvantages that should be taken into
account when applying a particular method. For example, chlorine has the possibility
of producing elevated concentrations of unwanted disinfection by-products with
organic matter in addition to the release of taste and odor compounds from algal cells
[47]. It should be noted that oxidation alone cannot serve as a sufficient technology
7

for arsenic removal, though it may well be employed as a pre-treatment step to
increase the removal method efficiency. Other technologies are membrane units
including coagulation/micro-filtration, reverse osmosis (e.g. nano-filtration and
hyper-filtration), and electro-dialysis, which all use special filter media that
physically retain the impurities present in water. Filtration methods require a power
source that may be unavailable or unreliable (e.g. in the rural Ghana and Bangladesh
delta areas). Other processes in addition to the widely used methods discussed above
include microbial processes, in-situ immobilization, and point-of-use units. All the
afore mentioned technologies are either expensive or not readily available to rural
communities, commanding the need for cost-effective and widely available, naturally
occurring mechanisms, namely adsorbant iron and aluminum oxy-hydroxides.
1.4. LATERITES AND LATERITIC SOILS
Laterites and lateritic soils composed of a wide variety of red, brown, and yellow
fine-grained residual soils of light texture, as well as nodular gravels and cemented
soils [4, 5, 48, 49]. They may vary from a loose material to a massive rock. They are
characterized by the presence of iron and aluminum oxides or hydroxides, particularly
those of iron, which give color to the soils [50]. For the purpose of this work, the term
“laterite concretion” (LC) is confined to the coarse-grained vermicular concrete
material, including massive laterite. The term “lateritic soils” refers to materials with
lower concentrations of oxides. Lateritic soils behave more like fine-grained sands,
gravels, and soft rocks. The laterite typically has a porous or vesicular appearance.
8
Some particles of laterite tend to crush easily under impact, disintegrating into a soil
material that may behave plastically [50].
Lateritization is the removal of silicon through hydrolysis and oxidation that
results in the formation of laterites and lateritic soils. The degree of lateritization is
estimated by the silica-sesquioxide (S-S) ratio (SiO2/(Fe2O3 + Al2O3)) calculated as
the weight percent of the minerals. Soils are classified by the S-S ratios into the
following categories:
• An S-S ratio of 1.33 or less = laterite.
• An S-S ratio of 1.33 to 2.00 = lateritic soil.
• An S-S ratio of 2.00 or greater = non-lateritic, tropical soil [51]
1.5. PRESTEA AND AWASO LATERITE CONCRETIONS
Laterite concretions, a natural substance, contain intergrowths of iron, manganese,
titanium and aluminum, as oxides and hydroxides, with admixed quartz grains and
clay minerals [4, 5, 48, 49]. They are a product of intensive chemical weathering in
tropical and subtropical environments under strong oxidizing conditions. Heavy
rainfall leaches out soluble weathering products in lateritic soils, leaving behind clay
minerals (koalinite), rutile (TiO2), gibbsite (Al2O3.3H2O), goethite (HFeO2),
lepidocrosite (FeOOH), and hematite (Fe2O3) [4, 5, 48, 49]. Iron is mobile in the
weathering zone (C-horizon), most likely as Fe2+, and migrates to the B-Horizon.
Well-developed lateritic soils have a lower iron-free, buff-colored horizon, called the
paled zone or B2 horizon and an upper brick red, iron-rich B1 horizon. Commonly
iron mineral concretions form that incorporate other soil constituents [50, 52]. In
9

extreme cases fericrete (called canga in South America) forms that may be up to 5m
thick. Most commonly, lateritic soils have iron concretions that vary from pebble-size
to cobble-size [53].
Lateritic soils are abundantly available in Ghana and other tropical regions.
Notable areas in Ghana where these lateritic soils abound are Prestea and Awaso (Fig.
2). These two areas were selected because they represent the end members of most
lateritic soils. Prestea is located in southwest Ghana approximately 200 kilometers
west of the capital, Accra, and is accessible by sealed road. Prestea lies within the
Eburnean Tectonic Province (1,800-2,166 Ma) in the West African Precambrian
Shield. The bed rock there –consists of Proterozoic Birimian greenstones that contain
metamorphosed basaltic and andesitic lavas (hornblende-actinolite-schist, calcareous-
chlorite-schist and amphibolites/greenstones) of the West African craton [54, 55]. The
original soil mantle of Prestea contained feldspathic materials, other silicates, and
minor amounts of stable materials. Intense chemical weathering subsequently
transformed the feldspathic material into clay, then leaching and re-deposition
occurred in which iron and aluminum oxides remained after the removal of bases and
combined silica [52]. Next in the forming process is a dramatic change in
environment: physical, such as evaporation of the remaining water: chemical, such as
the reduction of groundwater temperature; ion exchange; or pH change [52]. This
results in the deposition of iron compounds and concretions. These concretions
usually form as nodules with a hard outer shell of ferrous material surrounding an
inner core of softer or un-cemented materials [52]. A crust thus develops which, in
French-speaking Africa, is known as fericrete (iron breast plate) [52].
10

Figure 2. Map of Ghana showing geologic units.
Awaso is located in the north-eastern part of the Western Region of Ghana
approximately 220 kilometers north of Prestea. The bed rock of Awaso contains
11

aluminum rich facies that have given rise to the secondary residual accumulation of
bauxite [54, 55]. The formation of Awaso Laterite concretion is different from that of
the Prestea laterite concretions. Intense chemical weathering of the impermeable
feldspathic materials (clays and silts) from weathered igneous rocks present a horizon
that further weathers to kaolinite. The process of lateritization proceeds, which is
essentially a de-silication process, laterite being formed by the decomposition of
hydrated silicates of alumina, accompanied by the freeing of the silica into solution.
The residual alumina takes up water from groundwater percolating downward and
leaches the soluble minerals leading to the accumulation of tri-hydrate of aluminum
(gibbsite Al2O.3H2O) and iron compounds. In areas where the process continues to
completion, oxides of titanium are formed together with gibbsite. This process forms
canga or hardpan, which is developed over the bauxite [52].
Laterite can be used to develop an effective and inexpensive water
purification system for communities that costs little, is easy to maintain, and produces
high quality drinking water [56-59]. Bhattacharyya et al. 2002 [56] establish the role
of laterite (ferralite) enriched with natural HFO as an arsenic scavenger through batch
studies and demonstrated the better competency of the material over the
natural/commonly used chemical coagulants generally used for water treatment. They
conclude that materials with a wide pH range sorb both As (III) and As (V) from
well-buffered groundwater and the presence of Fe (II) in the system enhances the
arsenic removal process.
Ndur and Norman, 2003 [58] developed an arsenic filter that uses laterite
concretions to remove arsenic. Their goal was to make an arsenic-iron removal
12

system for less developed countries that costs little to operate and could be fabricated
with locally obtained supplies. They showed that the sorption capacity for 2 mm
grains is about 300 bed volumes of 1 ppm arsenic water. Contact times of 10 to 15
minutes reduce arsenic concentrations by about a factor of 100 to 1000, which allow
the fabrication of fast-flow filters [58].
1.6. RELATED RESEARCH ON MECHANISM OF ARSENIC SORPTION
Studies regarding mechanisms responsible for arsenic sorption onto metal
oxides have greatly enhanced the understanding of sorption processes, and an
extension of this approach to natural systems is now beginning. There is little
reported on mechanisms of arsenic sorption onto natural materials due to problems
with detailed characterization of the solid phases and their surface composition [60].
Various researchers [15, 61-70] have combined microscopic and macroscopic
techniques to delineate sorption mechanisms of arsenic onto single hydrous metal-
oxides but not onto natural materials that are combinations of many oxides and of
unknown crystalinity. One tool widely used to delineate sorption mechanisms is ionic
strength. Hayes et al. [70], Goldberg and Johnson, [15], and Pena et al. [71]
postulated anion sorption, which is either markedly reduced or increased by
increasing ionic strength, can be used to describe sorption mechanisms. Others [15,
71, 72] use electrophoretic mobility (EM) measurements, including point of zero
charge (PZC), and potentiometric titration data to distinguish between inner- and
outer-sphere complexes.
13
X-ray Absorption Spectroscopic evidence indicates that arsenic forms either
inner-sphere or outer-sphere complexes on iron and aluminum oxide surfaces [61, 63,
65, 66, 73]. Extended X-ray absorption fine structure (EXAFS) spectroscopy shows
evidence of an inner-sphere bidentate binuclear surface complex [61, 63, 65, 66, 73,
74], wide angle X-ray scattering (WAXS) [75], and Fourier transform infrared (FTIR)
spectroscopy [63]. Several different surface species can form a mono-dentate
complex at low surface coverage and bidentate complexes at moderate to high surface
loadings [68]. O'Reilly et al. [66] found further EXAFS evidence of a bidentate
binuclear structure at the As (V)-goethite surface and showed that sorption was rapid
with 93% of sorption occurring within the first 24 hours. Arsenic (V) desorption in a
phosphate solution was initially rapid, but reached a plateau after ~35% of the arsenic
was desorbed. Extended X-ray absorption fine structure [64] and FTIR [63, 76]
studies of As (III) at the goethite surface suggest an inner-sphere bidentate binuclear
bridging complex similar to that of As (V). Fourier transform infrared studies [15] of
As (III) sorption at the amorphous aluminum oxide surface suggest an outer-sphere
complex unlike the inner-sphere complex for As (V). Information on the structure of
arsenic surface complexes gleaned from spectroscopic studies may also be used to
determine the mechanism of arsenic sorption onto metal oxides.
1.7 SORPTION CHEMISTRY AND APPROACHES TO SORPTION MECHANISMS WITH COMPOSITE MATERIAL
Understanding sorption mechanism is crucial to optimal use of composite
materials in remediating arsenic from drinking water. Several approaches has been
used, here I present four of these approaches. The first approach to sorption using
14
composite/natural materials in detailed solid phases characterization is to know the
surface composition of the material. Physical and chemical properties of the
composite materials mineral assemblage are needed to design sorption experiments.
X-ray diffraction and X-ray fluorescence can be used to determine the predominant
mineral phases. These analyses help identify dominant adsorptive phases to design
sorption experiments and for surface complexation modeling purposes. In surface
complexation theory, surface functional groups are the reactants with ions that
determine surface speciation. A thorough understanding of the concentration (surface
density) and types of functional groups are needed to calculate the effects of sorption
equilibra on aqueous composition [60].
The second approach is to determine the material’s specific surface area by a
surface area analyzer.
The third approach is quantification of proton-binding sites of the composite
material. This can be carried out by a conventional potentiometric titration method.
Quantities of the composite material suspension should be well equilibrated for 24
hours at the desired ionic strength. Prior to the equilibration and throughout the
titration the sample can be purged with pure N2 (99.996%) to minimize CO2
contamination. Three titration experiments should be performed on the basis of
different electrolyte concentrations (0.1, 0.01, and 0.001 M NaCl). The surface charge
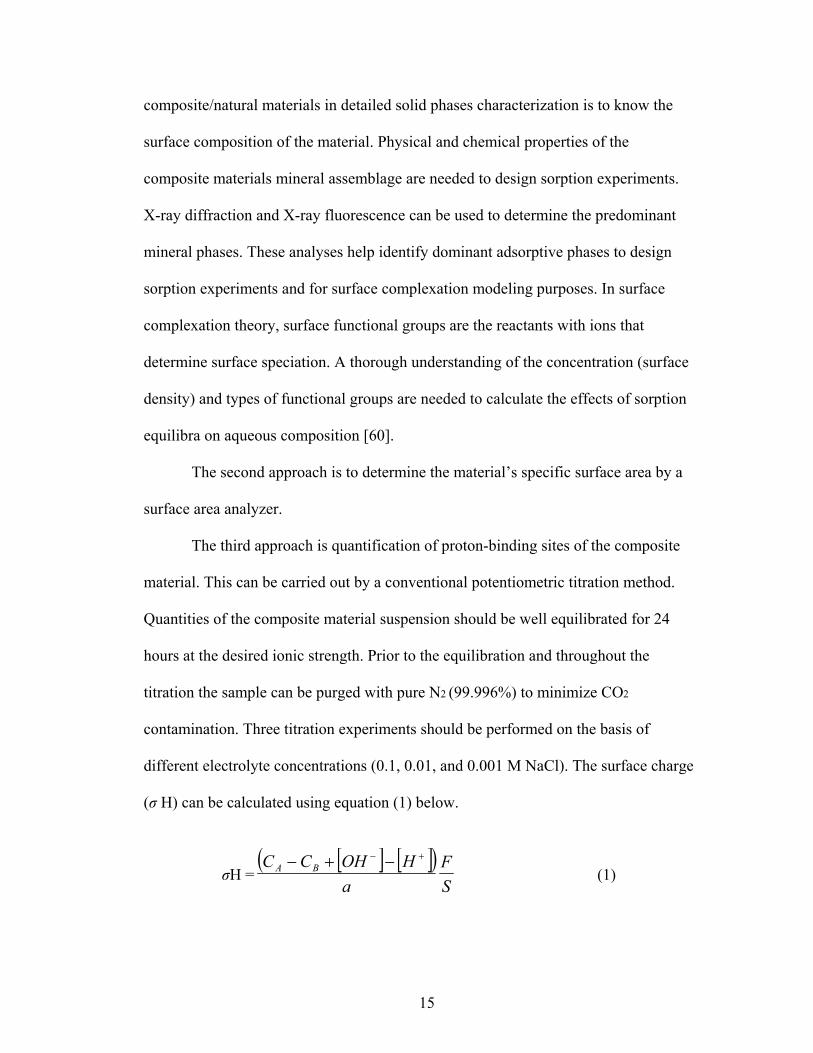
(σ H) can be calculated using equation (1) below.
σH =[ ] [ ]( )
SF
aHOHCC BA
+− −+− (1)
15

Where σ H is the surface charge (C/m2), CA is added acid concentration, CB is added
base concentration, [OH−] is the hydroxyl ion concentration, [H+] is the proton
concentration, a is solid used (g/L), F is the Faraday constant (96,500 C), and S
represents the specific surface area (m2/g). Variation of surface charge as a function
of pH in background electrolyte (0.1, 0.01, and 0.001 M NaCl) can be estimated
experimentally for proton-binding sites of the material.
The fourth is a surface complexation modeling approach. Two approaches
exist in literature: (1) Component additivity approach and (2) the generalized
composite modeling approach. Both of these approaches have their pros and cons.
The component additivity approach assumes that (A) the relative abundance of
surface functional groups is proportional to the bulk mineralogical composition as
determined by X-ray analysis, or (B) the adsorptive reactivity of the mineral
assemblage is dominated by one or two specific mineral phases, such as iron and
aluminum oxides [77]. This approach requires mass action equations and associated
stability constants for every mineral phase, which makes the approach complex.
However, the advantage of this approach is that the stability constants can be valid for
other mineral assemblages. The generalized composite modeling approach requires
less information and can be viewed as more practical for application within solute
transport models. However, the generalized composite approach’s mass action
equations and associated stability constants are valid only for the specific mineral
assemblage studied and are not transferable to other mineral assemblages. In addition
this approach does not utilize conclusions about actual surface speciation that may be
determined from spectroscopic methods [60, 77].
16
The fifth approach is to delineate mechanisms of ion attachment on composite
material surfaces using spectroscopic techniques. For applicability to natural systems,
spectroscopic methods must be capable of evaluating surface-adsorbed ions in the
presence of water. Fourier transform infrared (FTIR) and extended X-ray absorption
fine structure (EXAFS) are both capable of investigating the position of As-O
stretching bands for arsenic in aqueous conditions.
17
CHAPTER 2
MATERIALS AND EXPERIMENTAL PROCEDURE
2.1. Characterization of Prestea and Awaso LC
The LC used for this study was obtained from Prestea, Ghana (5o 28’ 15.06” N
and 2o 11 27.17” W) and Awaso, Ghana (6o 27’ 31.68” N and 2o 19 39.72” W). X-ray
diffraction (XRD) and X-ray fluorescence (XRF) were used to determine the
predominant mineral phases. The X-ray diffraction pattern for the Prestea laterite
concretions was determined on a Rigaku DMAX/2 in the Chemistry Department at
New Mexico Tech using a purpose-designed in-process powder X-ray diffraction
system recently enhanced through the incorporation of a Bede Micro source high-
brightness X-ray generator. Samples were crushed to fine powder (< 63 µm), then 4-5
g of powder was compressed into an in situ X-ray cell. Profiles were measured from
2–70o in step sizes of 0.02o/s requiring 56 min. Major and minor minerals in
concentrations > than about 5% were identified using the MDI Jade7 software [78].
X-ray fluorescence experiments were done by Thermo-ARL automated X-ray
fluorescence spectrometer (XRF) at Washington State University. Samples were
crushed into fine powder, weighed with dilithium tetraborate flux (2:1 flux: rock),
fused at 1000°C in a muffle furnace, and then cooled; the bead was then reground,
refused and polished on diamond laps to provide a smooth flat surface. Advantages of
the low-dilution fusion method include reduction of matrix effects, robustness,
economy of sample preparation time, and cleanliness of the instrument. The same
suite of elements was analyzed for all samples, which includes the 10 major rock-
forming elements, plus 18 trace elements.
18
Specific surface areas of ground Prestea and Awaso LC used for sorption
experiments were determined with a single-point BET N2 sorption isotherm using a
Quantasorb Jr. Surface area analyzer. Samples of LC were degassed at 70°C before
determining the surface area.
2.2 Sorption Isotherm
Arsenic (III) and As (V) stock solutions were prepared by dissolving sodium
arsenite, AsNaO2 (J.T. Baker, reagent grade) and sodium biarsenate
(Na2HAsO4.7H2O (BDH, reagent grade)) in water purified by reverse osmosis (RO).
Prestea and Awaso laterite concretions were crushed to <63 µm and the fines removed
by washing. To determine the sorption isotherms, 50cc aliquots of 20°C As (III) and
As (V) solutions with concentrations ranging from 0.1 to 2.0 mg/L arsenic were
reacted with 0.25 g or 0.75 g of either Prestea or Awaso ground laterite concretions.
Samples and solutions were placed in 100 mL polypropylene centrifuge tubes with
covers.
The As (III) mixtures were shaken with a tumbler revolving at 20 revolutions
per minute for 2 hours and the As (V) mixtures for 1 hour at 20oC. Previous work
showed that these times were sufficient to reach near equilibrium [79]. Equilibrium
pH was measured using a Mettler Toledo MP 125 (THOMAS SCIENTIFIC). The
samples were centrifuged at a relative centrifugal force of 7800 g for 20 min. The
supernatants were analyzed for pH and filtered through a 0.2µm Whatman filter. The
supernatant liquid was analyzed for arsenic concentration using a Varian 600 Atomic
Adsorption Spectrometer with Graphite Furnace.
19
Isotherm experiments were conducted following batch experiment procedures
described above at 25°C, 35°C, 45°C and 60°C in a temperature controlled bath to
investigate the effect of temperature on arsenic sorption. Fifty cc aliquots of As (III)
and As (V) solutions with concentrations ranging from 0.1 to 2.0mg/L arsenic were
reacted with 0.25g of ground Prestea laterite concretion. Blank tests with no laterite
demonstrated no arsenic was adsorbed on the wall of the flask during the reaction
period. Duplicate experiments demonstrated that results obtained from this sorption
procedure are repeatable and with a maximum experimental error of 3%.
2.3. Sorption Envelopes
Arsenic (III) and As (V) stock solutions were prepared with reverse osmosis
(RO) water using sodium arsenite, (AsNaO2, J.T. Baker, reagent grade) and sodium
biarsenate (Na2HAsO4.7H2O, BDH, reagent grade), respectively. Sorption envelopes
were determined for an arsenic concentration of 1.0 mg/L by varing the pH from 4 to
10 and at ionic strengths of 0.001, 0.01, and 0.1 M NaCl. Then these solutions were
placed into 50 cc polypropylene centrifuge tubes containing either 0.25 g or 0.75 g of
ground laterite concretions. The tubes were put in a tumbler rotating at 20 revolutions
per minute for 2 hours and 1 hour for As (III) and As (V), respectively, at 20oC.
Kinetic results [80] show that 2 hour and 1 hour contact times were sufficient to reach
sorption equilibrium for As (III) and As (V), respectively. Ionic strengths were
adjusted to 0.001, 0.01, and 0.1 M NaCl. To obtain the required pH the suspension
was adjusted with 1.0 M HCl or NaOH, which caused a less than 0.00001 M change
in the final concentration of the ionic strengths tested. The equilibrium pH was
20

measured using a Mettler Toledo MP 125 (THOMAS SCIENTIFIC). The samples
were centrifuged at a relative centrifugal force of 7800g for 20 min. The decantates
were analyzed for pH and filtered through a 0.2µm Whatman filter. The supernatant
was analyzed for arsenic concentration using a 600 Varian Graphite Atomic
Absorption Spectrometer. The quantity of adsorbed arsenic was calculated by the
difference between the initial and residual amounts of arsenic in the solution divided
by the weight of the adsorbent. Blank tests under the same conditions demonstrated
no arsenic adsorbed on the wall of the flask during the reaction period. Duplicate
experiments demonstrated that results obtained from this sorption procedure were
repeatable with a precision of 97%.
2.4 Competitive sorption
The interference of phosphate and sulfate on arsenic sorption was investigated
in batch experiments. The methods used are similar to the batch experiments
described above. The difference is arsenic concentration of 1.0 mg/L was added to
the 10.0 mg/L of phosphate solution, and in a separate experiment 1.0 mg/L of
arsenic solution was added to a 500.0 mg/L sulfate solution.
2.5 Surface titration
The quantification of proton-binding sites was carried out by a conventional
potentiometric titration method. A quantity of 20 g/L of the <63µm fraction of the
NRE suspension was equilibrated well at the desired ionic strength for 24 hours. Prior
to the equilibration and throughout the titration the sample was purged with pure N2
21
(99.996%) to minimize CO2 contamination. Three titration experiments were
performed on the basis of different electrolytic concentrations (0.1, 0.01, and 0.001 M
NaCl). The initial pH of the LC suspension was ≈6.0 and it was raised to ≈10 with 0.1
M NaOH before commencement of titrations. In order to minimize the solid
dissolution the solution pH was kept above 4.0. The surface charge (σ H) was
calculated using equation (1) above. The surface charge is needed as an input
parameter in the computer program FITEQL [81] to determine surface acidity and
arsenic binding constants. The variation of the surface charge of LC suspensions as a
function of pH in 0.1, 0.01, and 0.001 M NaCl shows that the σ H is mainly
controlled by the H+ and OH− ions.
2. 6. Electrophoritic Mobility
The electrophoretic mobility (EM) for the LC was determined by micro-
electrophoresis using a Zeta-Meter 3.0 system. The EMs of < 5µm LC suspensions
containing 0.2g of solid L-1 in 0.01M NaCl were determined at various pH values.
Electrophoretic mobility measurements were also determined in the presence and
absence of 0.035mM and 3.5mM of arsenic and with a final volume of 50mL after
adjusting to the desired pH (4-10) with 0.1M HCl or NaOH. The suspension was
shaken for 2 hours and 1 hour respectively for As (III) and As (V) at 22°C. In
general, an average EM value was obtained after 20 particles were counted. The point
of zero charge was obtained by interpolating the data to zero EM.
22

2.7. ATR-FTIR Spectroscopy
Samples for spectroscopic analysis were prepared by reacting 2.0g of LC with
20ml of a 0.1M NaCl solution containing 0.1M of either As (III) at pH 5 and 10.5 or
As (V) at pH 5 and 9. Samples were used wet or rinsed with 20ml of doubly de-
ionized water and air-dried. Reference samples were reacted with a solution
containing only 0.1M NaCl. Fourier Transformed Infra Red spectra were obtained
with an Avatar 370 Model spectrometer and a horizontal attenuated total reflectance
(ATR) attachment (see appendix 1.0 for detailed theory). Spectra were obtained at a
resolution of 4cm-1 with each spectrum corresponding to the co-addition of 64 scans
using a medium-band liquid N2 cooled DTGS detector. Infrared spectra of As (V) and
As (III) sorbed on LC were obtained as dry samples in KBr pellets prepared by
adding 3mg of ground LC in approximately 250mg of spectral grade KBr. Attenuated
total reflectance of 1ml of 0.1M NaCl and 0.1M arsenic, a reference solution, was
recorded.
2.8. Surface Complexation Models
I modeled the surface complexation of laterite concretions using the
generalized composite approach (GC). This approach assumes that all mineral phases
contribute to sorption and the sorption sites are represented by one type of surface
group. Several caveats exist with the GC approach. Derived constants for surface
complexation are valid only for the system under study and cannot be transferred to
other systems; in addition, it has fewer equations hence the degrees of freedom are
likely to be very small. The computer program FITEQL [81] was used to determine
23
the surface acidity and arsenic binding constants. The stoichiometries of the surface
complexes used to fit sorption data are listed in Tables 2 and 3. The specific surface
area of the LC was determined with a single-point BET N2 adsorption isotherm using
a Quantasorb, Jr. Surface area analyzer. The surface site densities were set at a value
of 2.31 sites/nm-2 as set by Davis and Kent [60] for natural materials. Surface
complexation constants were optimized, model predictions with fixed site densities
and complexation constants were performed using MINTEQA2 [82]. The activity
coefficients of aqueous species were calculated using the Davies equation for both
model fitting and predictions. The concepts behind several models and an excellent
review of the current state of SC modeling theory are presented by Goldberg et al.
[15] (Also see Appendix 2.0).
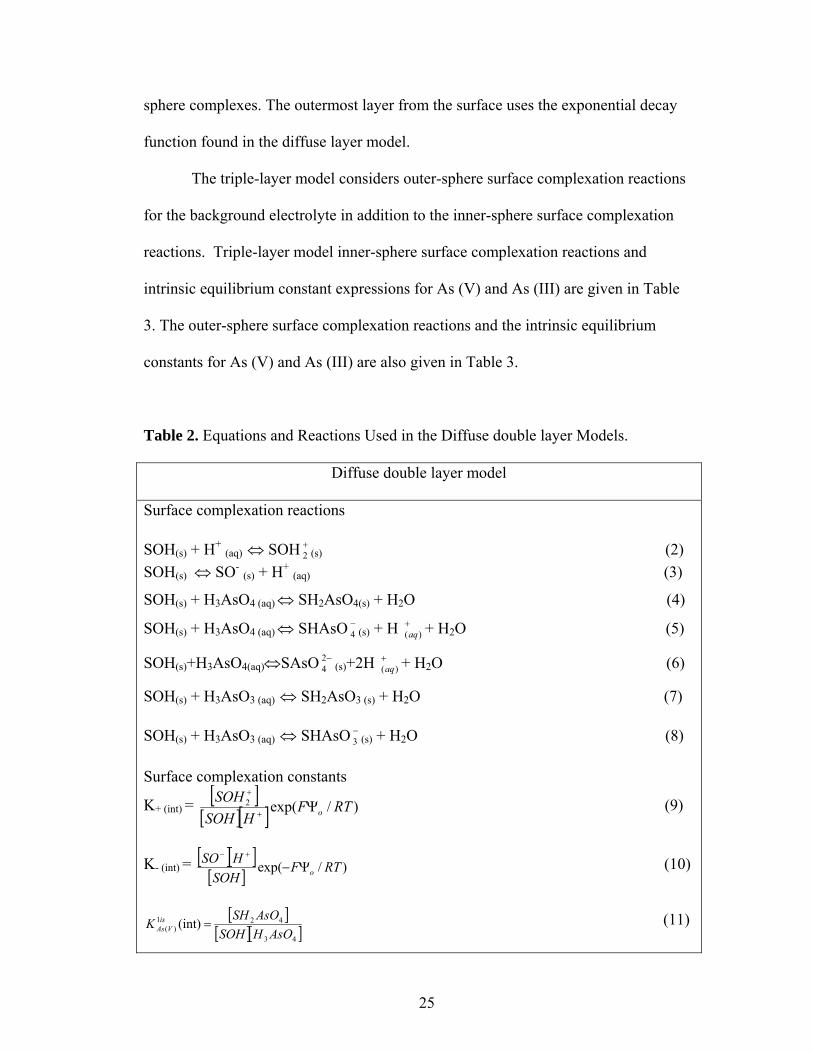
In the diffuse double layer model, surface complexation reactions for the
surface functional group SOH (where SOH represents a reactive surface hydroxyl
bound to a metal ion in the oxide mineral) are defined in Tables 2 and 3. The diffuse
double layer model assumes that the surface complexes are all inner-sphere. The
intrinsic equilibrium constants for the inner-sphere surface complexation reactions of
the surface functional group are given in Table 2.
The triple-layer model (TLM) is more intricate than the DLM which allow ion
sorption as either inner-sphere or outer-sphere complexes. As the name indicates,
three electrostatic boundaries are used. In the TLM, the electrostatic layer closest to
the solid surface uses a linear decay function for charge. The innermost layer is used
for inner-sphere surface complexation. The second layer, which uses a linear decay
function of smaller magnitude than the inner layer, is used for sorption of outer-
24
sphere complexes. The outermost layer from the surface uses the exponential decay
function found in the diffuse layer model.
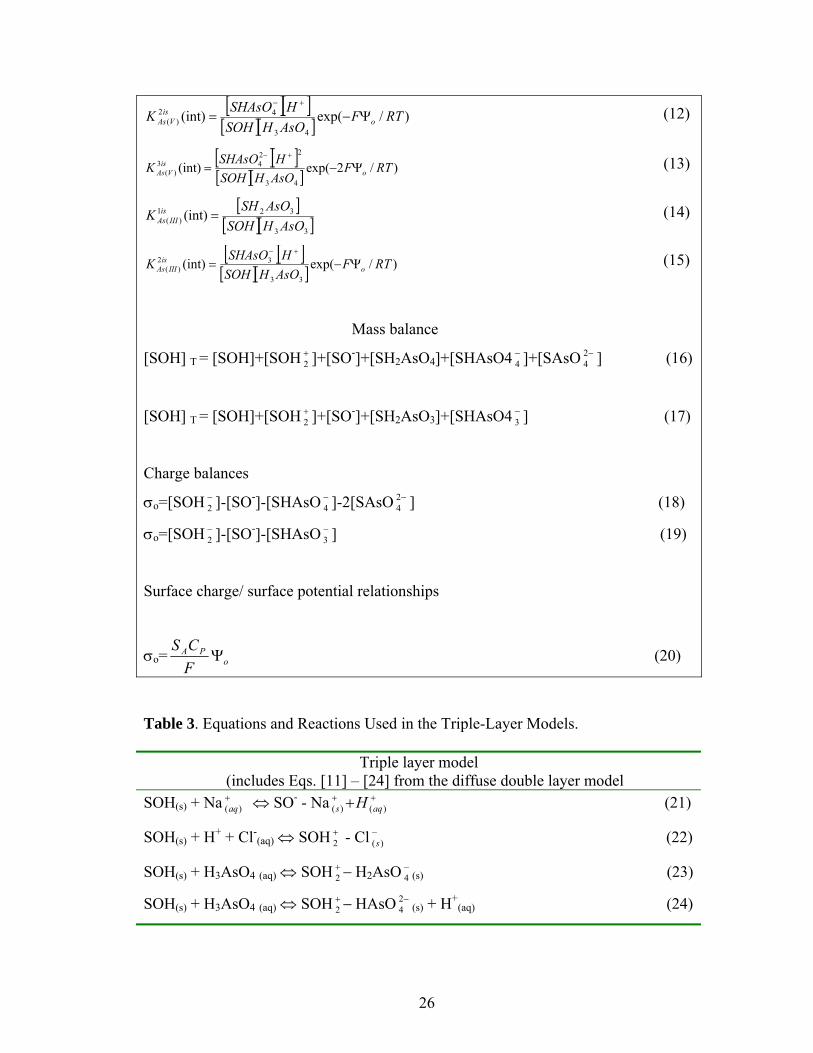
The triple-layer model considers outer-sphere surface complexation reactions
for the background electrolyte in addition to the inner-sphere surface complexation
reactions. Triple-layer model inner-sphere surface complexation reactions and
intrinsic equilibrium constant expressions for As (V) and As (III) are given in Table
3. The outer-sphere surface complexation reactions and the intrinsic equilibrium
constants for As (V) and As (III) are also given in Table 3.
Table 2. Equations and Reactions Used in the Diffuse double layer Models.
Diffuse double layer model
Surface complexation reactions
SOH(s) + H+ (aq) ⇔ SOH +2 (s) (2)
SOH(s) ⇔ SO- (s) + H+ (aq) (3)
SOH(s) + H3AsO4 (aq) ⇔ SH2AsO4(s) + H2O (4)
SOH(s) + H3AsO4 (aq) ⇔ SHAsO −4 (s) + H + H+
)(aq 2O (5)
SOH(s)+H3AsO4(aq)⇔SAsO −24 (s)+2H + H+
)(aq 2O (6)
SOH(s) + H3AsO3 (aq) ⇔ SH2AsO3 (s) + H2O (7) SOH(s) + H3AsO3 (aq) ⇔ SHAsO −
3 (s) + H2O (8) Surface complexation constants
K+ (int) = [ ][ ][ ] )/exp(2 RTF
HSOHSOH
oΨ+
+
(9)
K- (int) = [ ][ ][ ] )/exp( RTFSOH
HSOoΨ−
+−
(10)
[[ ][
]]43
421)( (int)
AsOHSOHAsOSHK is
VAs = (11)
25
[ ][ ][ ][ ] )/exp((int)
43
42)( RTF
AsOHSOHHSHAsO
K ois
VAs Ψ−=+−
(12)
[ ][ ][ ][ ] )/2exp((int)
43
2243
)( RTFAsOHSOHHSHAsO
K ois
VAs Ψ−=+−
(13)
[[ ][
]]33
321)( (int)
AsOHSOHAsOSH
K isIIIAs = (14)
[ ][ ][ ][ ] )/exp((int)
33
32)( RTF
AsOHSOHHSHAsO
K ois
IIIAs Ψ−=+−
(15)
Mass balance
[SOH] T = [SOH]+[SOH ]+[SO+2
-]+[SH2AsO4]+[SHAsO4 ]+[SAsO ] (16) −4
−24
[SOH] T = [SOH]+[SOH ]+[SO+2
-]+[SH2AsO3]+[SHAsO4 ] (17) −3
Charge balances
σo=[SOH ]-[SO−2
-]-[SHAsO ]-2[SAsO ] (18) −4
−24
σo=[SOH ]-[SO−2
-]-[SHAsO ] (19) −3
Surface charge/ surface potential relationships
σo= oPA
FCS
Ψ (20)
Table 3. Equations and Reactions Used in the Triple-Layer Models.
Triple layer model (includes Eqs. [11] – [24] from the diffuse double layer model
SOH(s) + Na ⇔ SO+)(aq
- - Na (21) ++ + )()( aqs H
SOH(s) + H+ + Cl-(aq) ⇔ SOH - Cl (22) +
2−
)(s
SOH(s) + H3AsO4 (aq) ⇔ SOH H−+2 2AsO −
4 (s) (23)
SOH(s) + H3AsO4 (aq) ⇔ SOH HAsO−+2
−24 (s) + H+
(aq) (24)
26

SOH(s) + H3AsO4 (aq) ⇔ SOH AsO−+2
−34 (s) + 2H+
(aq) (25)
SOH(s) + H3AsO3 (aq) ⇔ SOH H−+2 2AsO −
3 (s) (26)
SOH(s) + H3AsO3 (aq) ⇔ SOH HAsO−+2
−23 (s) + H+
(aq) (27)
SOH(s) + H3AsO3 (aq) ⇔ (SOH HAsO−+22 ) −2
3 (s) (28)
SOH(s) + H3AsO3 (aq) ⇔ (SOH sO−+22 ) A −3
3 (s) + H (29) +)(aq
Surface complexation constants
[ ][ ][ ][ ] ]/)(exp[(int) RTF
NaSOHHNaSOK oNa Ψ−Ψ
−=
+
++−
+ β (30)
[ ][ ][ ][ ] ]/)(exp[(int) 2 RTF
ClHSOHClSOH
K oCl βΨ−Ψ−
=−+
−+
− (31)
[ ][ ][ ] ]/)(exp[(int)
43
4221)( RTF
AsOHSOHAsOHSOH
K oos
VAs βΨ−Ψ−
=−+
(32)
[ ][ ][ ][ ] ]/)2(exp[(int)
42
2422
)( RTFAsOHSOH
HHAsOSOHK o
osVAs βΨ−Ψ
−=
+−+
(33)
[ ][ ][ ][ ] ]/)3(exp[(int)
42
23423
)( RTFAsOHSOH
HAsOSOHK o
osVAs βΨ−Ψ
−=
+−+ (34)
[ ][ ][ ] ]/)(exp[(int)
33
3221)( RTF
AsOHSOHAsOHSOH
K oos
IIIAs βΨ−Ψ−
=−+
(35)
[ ][ ][ ][ ] ]/)2(exp[(int)
33
2322
)( RTFAsOHSOH
HHAsOSOHK o
osIIIAs βΨ−Ψ
−=
+−+ (36)
[ ][ ] [ ]
]/)22(exp[(int)33
2
2321
)( RTFAsOHSOH
HAsOSOHK o
osIIIAs βΨ−Ψ
−=
−+ (37)
[ ][ ][ ] [ ] ]/)32(exp[(int)
332
3322
)( RTFAsOHSOH
HAsOSOHK oos
IIIAs βΨ−Ψ−
=+−+
(38)
Mass Balance
[SOH] T = [SOH]+[SOH ]+[SO+2
-]+[SH2AsO4]+[SHAsO ]+ [SAsO ] +[SOH -H2AsO +[SOH HAsO ]+[SOH -AsO ]+[SO
−4
−24
+2
]4− −+
2−2
4+2
−34
—Na+]+[SOH -Cl+2
-] (39)
[SOH] T = [SOH]+[SOH ]+[SO+2
-]+[SH2AsO3]+ [SAsO ] +[SOH -H
−3
+2
2AsO +[SOH HAsO ]+[SO]3− −+
2−2
3—Na+]+[SOH -Cl+
2-] (40)
Charge balances
σo + σβ + σd = 0 (41)
27
σo = [SOH +2 ]+[SOH - H2AsO ]+[SOH - HAsO ]+[ SOH - AsO +
2−4
+2
−24
+2
−34
+ [SOH - Cl+2
- ]-[SO- ]- [SHAsO - 2[SAsO ] -[SO]4− −2
4- - Na+] (42)
σβ = [SO- - Na+] -[SOH - H2AsO ] - [SOH - HAsO ] – 3[ SOH - AsO ] +2
−4
+2
−24
+2
−34
- [SOH - Cl+2
- ] (43)
σo = [SOH +2 ]+[SOH - H2AsO ]+[SOH - HAsO ]+[ SOH - Cl+
2−3
+2
−23
+2
-]+ [SO- ] –
[SHAsO - [SO]3− - - Na+] (44)
σβ = [SO- - Na+] -[SOH - H2AsO ] - 2[SOH - HAsO ] - [SOH - Cl+2
−3
+2
−23
+2
- ] (45)
Surface charge/ surface potential relationships
σo= )(1βΨ−Ψo
PA
FCSC (46)
σd = )(2βΨ−Ψd
PA
FCSC (47)
σd = ( ) ( RTFDRTIFCS
doPA 2/sinh8 2
1Ψε ) (48)
Note. F is the Faraday constant (C molc-1 ); Ψo is the surface potential (V); o refers to the surface plane
of sorption; R is the molar gas constant (J mol-1 K-1);T is the absolute temperature (K); square brackets represent concentrations (mol L-1); is refers to inner-sphere surface complexation; [SOH]T is related to the surface site density; Ns, by [SOH]T = (SACp1018)/NA * Ns, where SA is the surface area (m2 g-1); Cp is the solid suspension density (g L-1); NA is Avogadro’s number; Ns has units of sites nm-2; σo represents the surface charge (molc L-1); C is the capacitance (F m-2); β refers to the plane of outer-sphere sorption; os refers to outer-sphere surface complexation; C1 and C2 are capacitances; d refers to the plane of the diffuse ion swarm; εo is the permittivity of vacuum; D is the dielectric constant of water; and I is the ionic strength
28
CHAPTER 3
RESULTS
3.1 XRD, XRF and BET
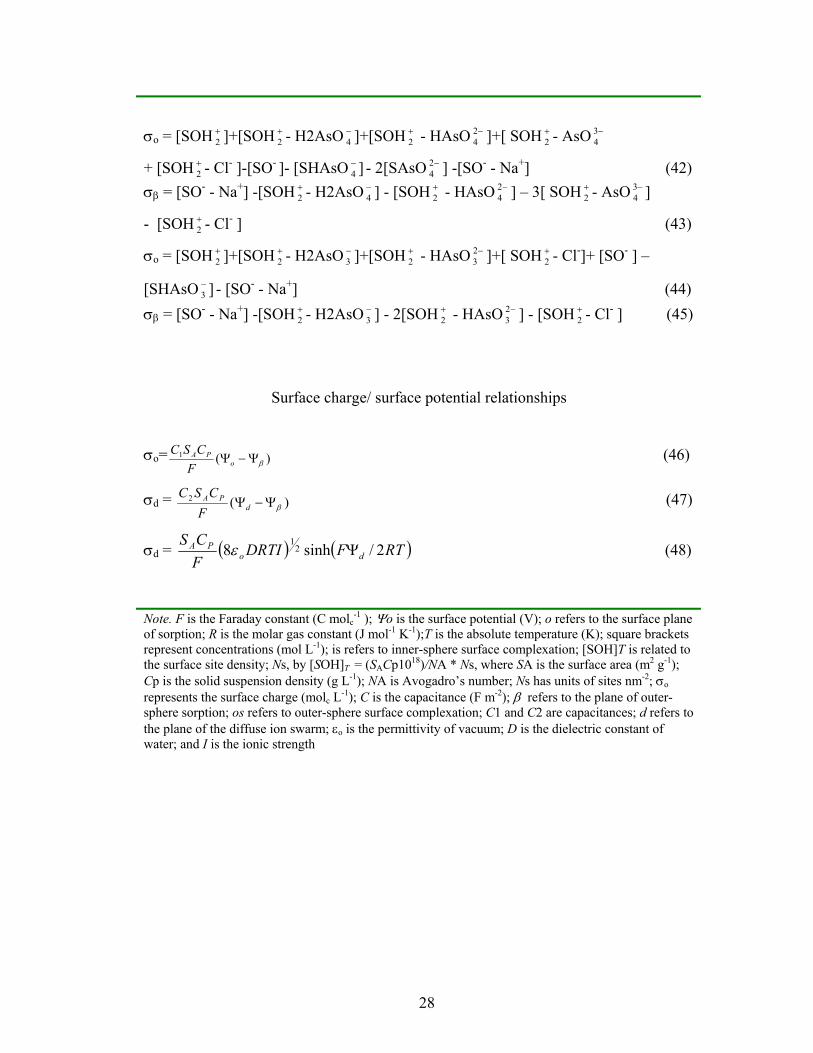
Figure 3 and 4 show x-ray powder diffraction patterns for major and minor
minerals greater than 5% in laterite concretions from Prestea and Awaso. The main
minerals in Prestea laterite concretion are hematite/goethite, gibbsite, and silica. The
predominant mineral phases in the Awaso laterite concretions are gibbsite, hematite
and silica. Other minerals such as rutile and pyrolusite were less than 3% hence were
not included in the figure. X-ray fluorescence analyses for Prestea and Awaso laterite
concretions are shown in Table 4. The major oxides for both types of laterite
concretion are Fe2O3, Al2O3 and SiO2 while the minor oxides are TiO2, Mn2O3, P2O5,
CaO, and K2O.
The specific surface area of ground Prestea and Awaso LC was performed on
three samples each and the average value reported. The single-point BET N2 sorption
isotherms indicate surface areas respectively of 32m2/g and 18m2/g.
29

Figure 3. XRD diffractogram studies of Prestea LC with minerals greater than 5% in laterite concretions. Wavelength to compute d-spacing = 1.54Ao (Cu/K-alpha 1). Predominant mineral phases are Q = Quartz, G = Goethite, IOH = Iron Oxide Hydroxide, ISS = Iron Silicon Sulfide, H = Hematite, Gb = Gibbsite. The poor diffraction pattern (bump shape) shows Prestea LC is amorphous.
30
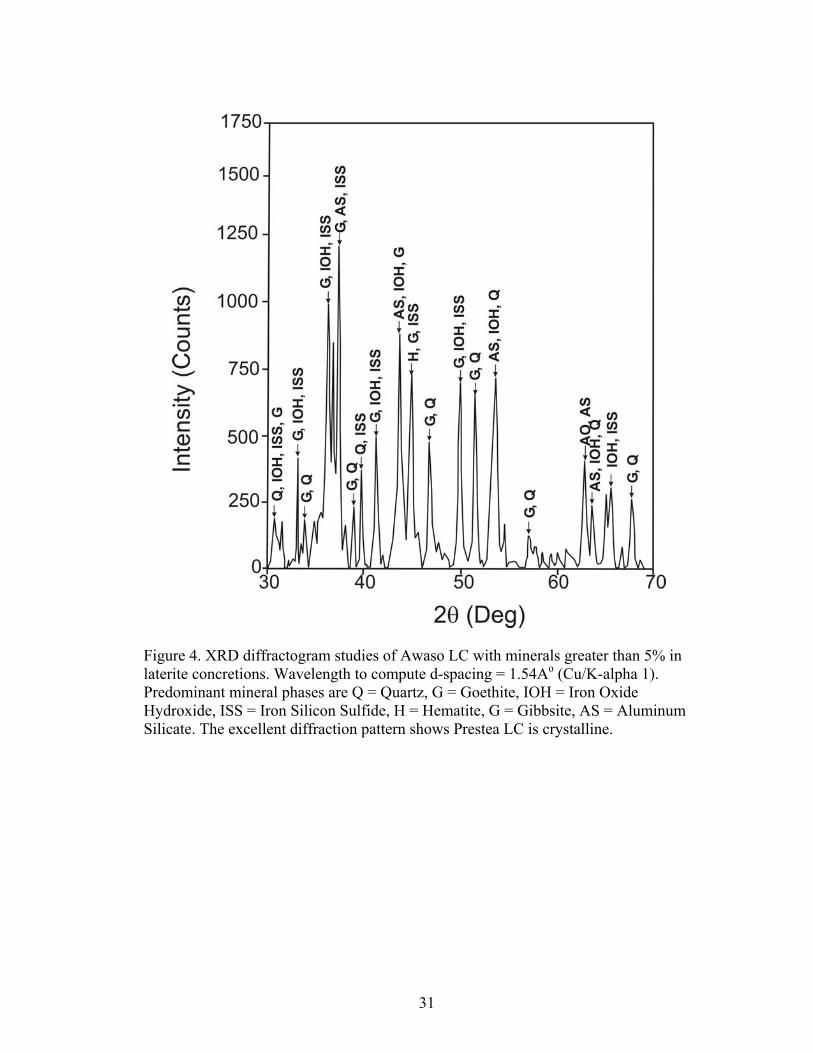
Figure 4. XRD diffractogram studies of Awaso LC with minerals greater than 5% in laterite concretions. Wavelength to compute d-spacing = 1.54Ao (Cu/K-alpha 1). Predominant mineral phases are Q = Quartz, G = Goethite, IOH = Iron Oxide Hydroxide, ISS = Iron Silicon Sulfide, H = Hematite, G = Gibbsite, AS = Aluminum Silicate. The excellent diffraction pattern shows Prestea LC is crystalline.
31

Table 4. Chemical composition of Prestea and Awaso laterite concretions
Prestea AwasoConstituents (W) % (W) %
SiO2 12.47 4.80 TiO2 0.94 3.450 Al2O3 13.72 78.95 Fe2O3 64.65 8.19 Mn2O3 0.02 0.003 MgO 0.00 0.00 CaO 0.06 0.04 Na2O 0.03 0.06 K2O 0.03 0.06 P2O5 0.37 4.453LOI* 8.96 11.36
*loss on ignition 3.2 Degree of Lateritization
The calculated degree of lateritization for Prestea and Awaso laterite
concretions estimated from the silica-sesquioxide (S-S) ratio (SiO2/(Fe2O3 + Al2O3))
is 0.147 and 0.055 respectively.
3.3 Sorption Isotherms Results
Figures 5 and 6 show arsenic sorbed as a function of equilibrium
concentration at 25°C. At all the concentrations, As (III) sorbs better than As (V) on
Prestea LC (Fig. 5). However, the opposite was observed for the Awaso LC (Fig.6).
32
0 200 400 600 800 10000
40
80
120
160
As (III)As (V)
Ars
enic
ads
orbe
d (µ
g/g)
Equil. concentration (µg\L) Figure 5. As (III) and As (V) sorption onto Prestea LC at 25°C. Solid suspension density = 15g/L. The pH is 7.0 ± 0.1. The 2 σ error on arsenic analysis is 3% based on the variance of measurements of 50 replicate samples. (*50 replicates are based on analysis done through out the entire arsenic analysis)
33

0 400 800 1200 1600Equil. concentration (µg/L)
0
100
200
300
400
500
Ars
enic
sor
bed
(µg/
g)
As (III)As (V)
Figure 6. As (III) and As (V) sorption onto Awaso LC at 20°C. Solid suspension density = 5g/L. The pH is 7.0 ± 0.1. The 2σ error on arsenic analysis is 3% based on the variance of measurements of 50 replicate samples.
The Langmuir (equation 49) and Freundlich (equation 50) isotherms are used
to fit the experimental data:
Langmuir equation: Q = bqmC/(1 + bC) [49]
Freundlich equation: Q = KC1/n [50]
Where Q is the amount of sorbed arsenic at equilibrium in µg/g, C is the arsenic
equilibrium concentration in solution in µg/L and qm is the maximum sorption
capacity. The parameters b, K, and n are isotherm constants determined by
linearization of equations 49 and 50 to:
1/Q = 1/qmbC + 1/b [51]
34
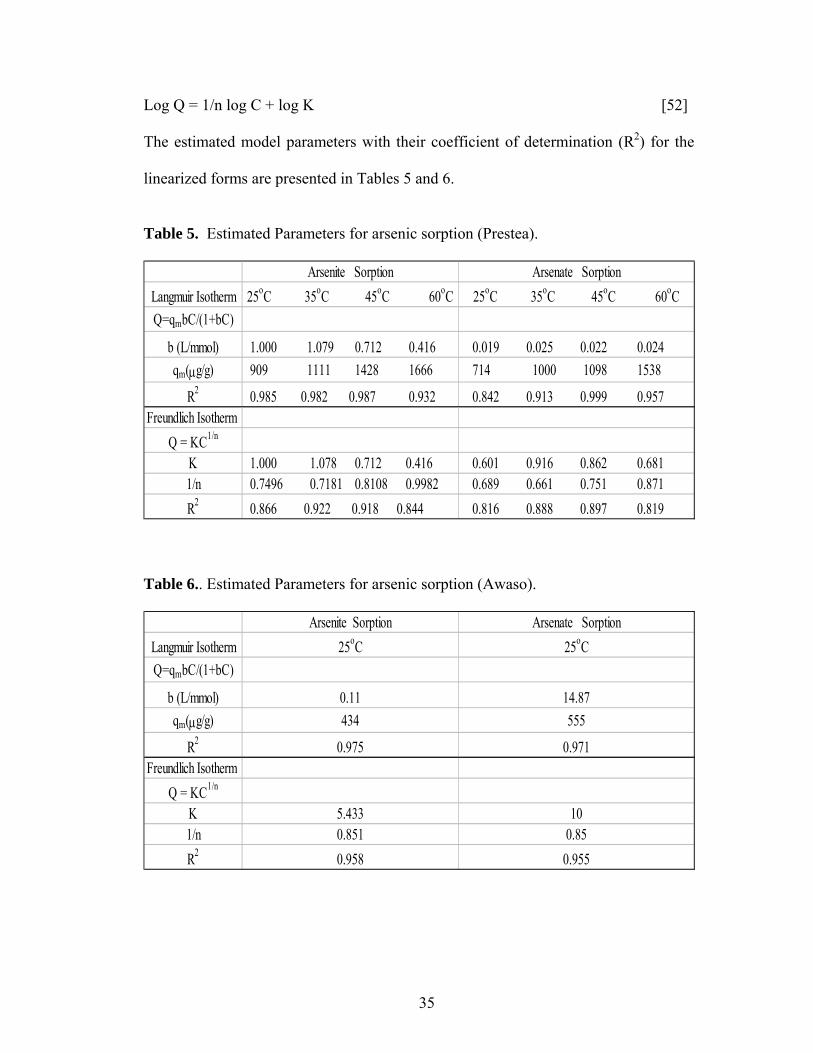
Log Q = 1/n log C + log K [52]
The estimated model parameters with their coefficient of determination (R2) for the
linearized forms are presented in Tables 5 and 6.
Table 5. Estimated Parameters for arsenic sorption (Prestea).
Arsenite Sorption Arsenate SorptionLangmuir Isotherm 25oC 35oC 45oC 60oC 25oC 35oC 45oC 60oCQ=qmbC/(1+bC)
b (L/mmol) 1.000 1.079 0.712 0.416 0.019 0.025 0.022 0.024qm(µg/g) 909 1111 1428 1666 714 1000 1098 1538
R2 0.985 0.982 0.987 0.932 0.842 0.913 0.999 0.957Freundlich Isotherm
Q = KC1/n
K 1.000 1.078 0.712 0.416 0.601 0.916 0.862 0.6811/n 0.7496 0.7181 0.8108 0.9982 0.689 0.661 0.751 0.871R2 0.866 0.922 0.918 0.844 0.816 0.888 0.897 0.819
Table 6.. Estimated Parameters for arsenic sorption (Awaso).
Arsenite Sorption Arsenate SorptionLangmuir Isotherm 25oC 25oC Q=qmbC/(1+bC)
b (L/mmol) 0.11 14.87qm(µg/g) 434 555
R2 0.975 0.971Freundlich Isotherm
Q = KC1/n
K 5.433 101/n 0.851 0.85R2 0.958 0.955
35

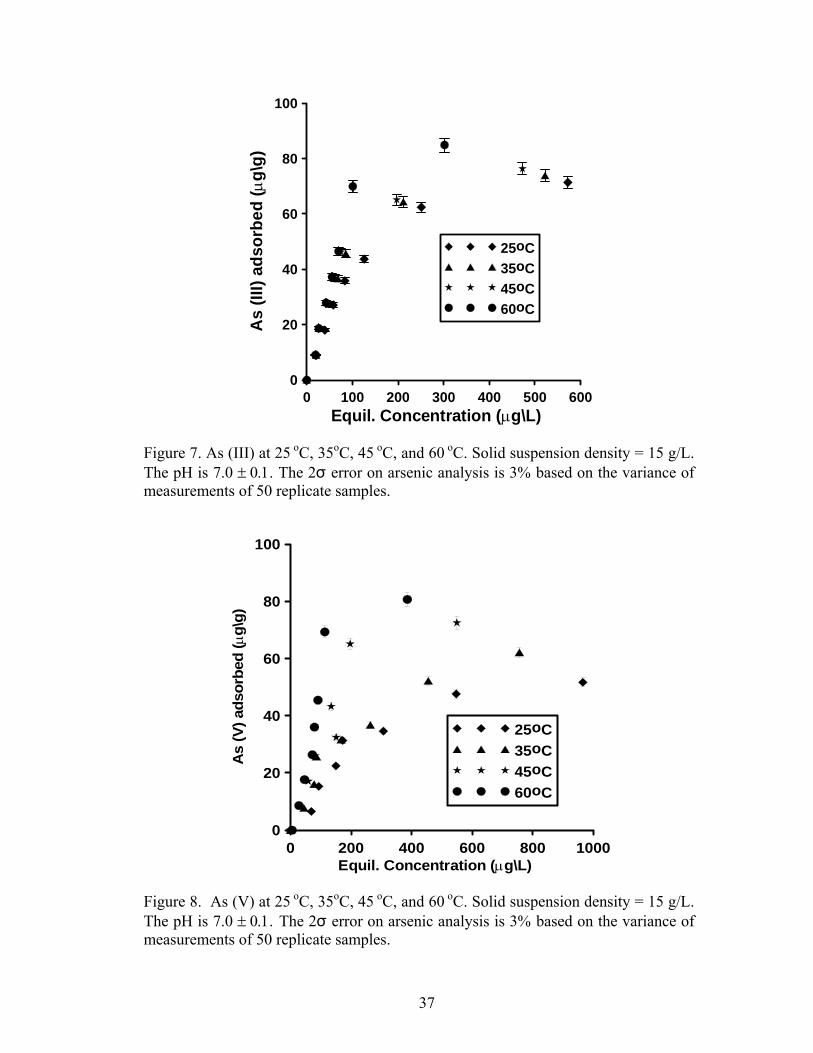
3.4 Effect of Temperature and Thermodynamic Parameters
The effect of temperature on arsenic sorption was considered only for Prestea
LC. Results of As (III) and As (V) equilibrium sorption at 25°C, 35°C, 45°C, and
60°C are shown in Fig. 7 and 8 respectively. The sorption capacity for both As (III)
and As (V) increases with increasing temperature (Table 5); however, the increase for
As (V) is significantly greater than for As (III). The “Gibbs free energy (∆G°)”,
“standard enthalpy (∆H°)”, and “standard entropy changes (∆S°)” are calculated in J
mol-1K-1 for the sorption process using Eqs 53, 54, and 55 following the method of
Altundogan et al. [83] and Gupta [84]:
bRTG o ln−=∆ ------------------------------------------------------------[53]
⎥⎦
⎤⎢⎣
⎡−
∆−=⎟⎟
⎠
⎞⎜⎜⎝
⎛
212
1 11lnTTR
Hbb
---------------------------------------------------------[54]
ooo STHG ∆−∆=∆ -------------------------------------------------------- [55]
Where b is a Langmuir isotherm constant (L/mol) at temperature T (K) and R is an
ideal gas constant (8.314 J/mol.K). The data and calculated thermodynamic
parameters are given in Table 7. The Langmuir isotherm constant was used in place
of the “real” thermodynamic constant in order to calculate the thermodynamic
parameters. Also the Langmuir constant is equivalent to equilibrium constant in
adsorption solutions and, arbitrarily, it is used in place of equilibrium constant [84].
36
0 100 200 300 400 500 600Equil. Concentration (µg\L)
0
20
40
60
80
100
As
(III)
adso
rbed
(µg\
g)25oC35oC45oC60oC
Figure 7. As (III) at 25 oC, 35oC, 45 oC, and 60 oC. Solid suspension density = 15 g/L. The pH is 7.0 ± 0.1. The 2σ error on arsenic analysis is 3% based on the variance of measurements of 50 replicate samples.
0 200 400 600 800 1000Equil. Concentration (µg\L)
0
20
40
60
80
100
As
(V) a
dsor
bed
(µg\
g)
25oC35oC45oC60oC
Figure 8. As (V) at 25 oC, 35oC, 45 oC, and 60 oC. Solid suspension density = 15 g/L. The pH is 7.0 ± 0.1. The 2σ error on arsenic analysis is 3% based on the variance of measurements of 50 replicate samples.
37

Table 7. Calculated Langmuir constants and thermodynamic parameters at pH 7.0 As species ToC b qm ∆Go ∆Go [99] ∆Ho ∆Ho[99] ∆S o [99]∆So
(L/mmol)(µg/g) (kJ/mol) (kJ/mol)rsenite 7.42 6.53rsenite 8.03 8.69rsenite 8.36rsenite 9.25
rsenate 4.51 5.47 1.57rsenate 5.93 5.67rsenate 6.47rsenate 7.96
(kJ/mol) a 25 0.0639 909 -2 -2 9.33 15.54 0.123 0.1435 a 35 0.0565 1111 -2 -2 a 45 0.0455 1428 -2 a 60 0.0386 1667 -2
a 25 0.0198 714 -2 -3 17.83 -3 0.032 0.0133 a 35 0.0249 1000 -2 -3 a 45 0.0223 1098 -2 a 60 0.0243 1538 -2
3.5 Effect of pH
The effect of pH on As (III) sorption is shown in Figures 9 and 11 for Prestea
and Awaso, respectively. Arsenic (III) sorption for both media has little effect at pH
6-8. However effects exist at pH 4-5 and 9-10 for 1.0 mg/L arsenic concentrations
(Fig. 9 and 11). Arsenic (V) sorption for both Prestea and Awaso LC, on the other
hand, shows little change by varying from pH 4 to 8, however above pH 8 sorption
decreases (Fig. 10 and 12).
3.6 Effect of ionic strength
Arsenic (III) sorption decreases with increasing ionic strength for both Prestea
and Awaso LC (Fig. 9 and 11), whereas As (V) shows no dependence or slightly
increases (Fig. 10 and 12) with increasing solution ionic strength. The effects are
opposite for the two arsenic compounds, though the ionic strength effect is more
significant in As (III) as compared to that of As (V).
38

3 4 5 6 7 8 9 10 1pH
140
80
120
160
200
Ars
enite
Sor
bed
(µg/
g)
0.1 M NaCl Exp. Data0.01 M NaCl Exp. Data0.001 M NaCl Exp. Data
Figure 9. Arsenic (III) sorption on Prestea LC as a function of pH and ionic strength. Solid suspension density = 5g/L, solution arsenic concentration = 1.0mg/L, T=20oC. The 2σ error on arsenic analysis is 3%, based on the variance of measurements of 50 replicate samples.
3 4 5 6 7 8 9 10 1pH
1100
120
140
160
180
200
220
As
(V) s
orbe
d (µ
g/g)
0.1 M NaCl Exp. Data0.01 M NaCl Exp. Data0.001 M NaCl Exp. Data
Figure 10. Arsenic (V) sorption on Prestea LC as a function of pH and ionic strength. Solid suspension density = 5g/L, solution arsenic concentrations = 1.0mg/L, T=20oC. The 2σ error on arsenic analysis is 3%, based on the variance of measurements of 50 replicate samples.
39
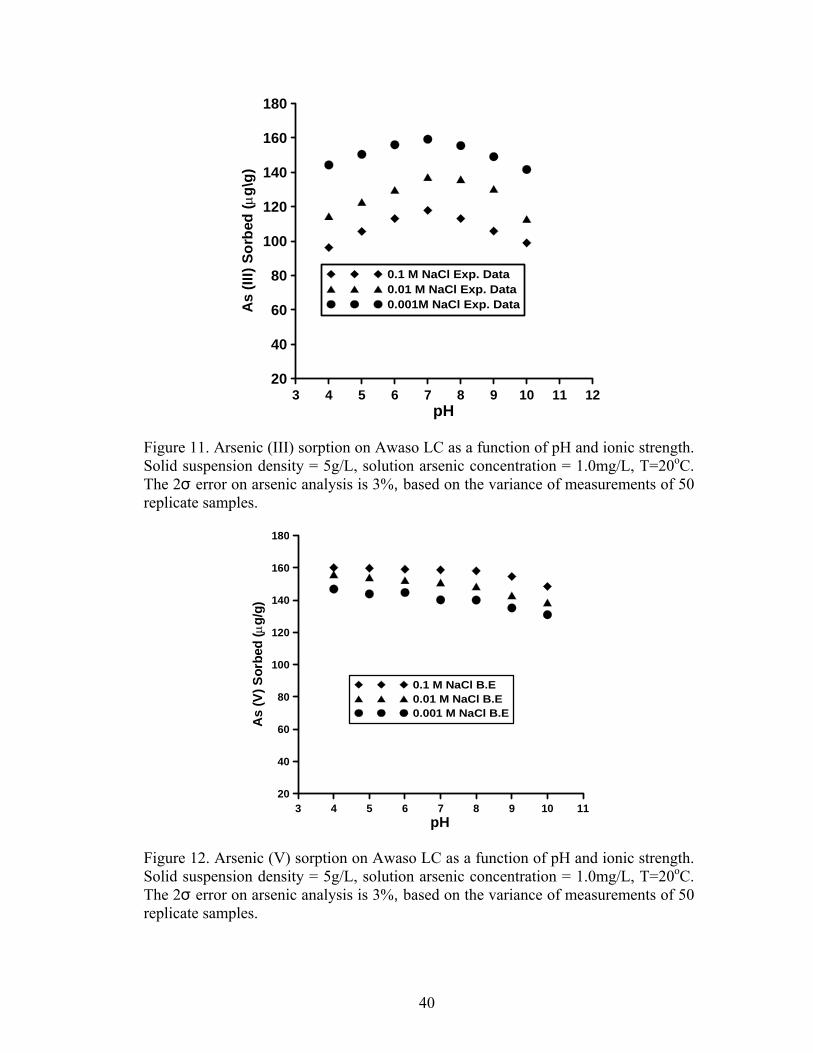
3 4 5 6 7 8 9 10 11 1pH
220
40
60
80
100
120
140
160
180
As
(III)
Sorb
ed (µ
g\g)
0.1 M NaCl Exp. Data0.01 M NaCl Exp. Data0.001M NaCl Exp. Data
Figure 11. Arsenic (III) sorption on Awaso LC as a function of pH and ionic strength. Solid suspension density = 5g/L, solution arsenic concentration = 1.0mg/L, T=20oC. The 2σ error on arsenic analysis is 3%, based on the variance of measurements of 50 replicate samples.
3 4 5 6 7 8 9 10pH
1120
40
60
80
100
120
140
160
180
As
(V) S
orbe
d (µ
g/g)
0.1 M NaCl B.E0.01 M NaCl B.E0.001 M NaCl B.E
Figure 12. Arsenic (V) sorption on Awaso LC as a function of pH and ionic strength. Solid suspension density = 5g/L, solution arsenic concentration = 1.0mg/L, T=20oC. The 2σ error on arsenic analysis is 3%, based on the variance of measurements of 50 replicate samples.
40

3.7 Competitive sorption on Prestea and Awaso LC
Arsenic (III) and As (V) sorption on Prestea LC in a phosphate-bearing
solution is shown in Figures 13 and 14, respectively. Comparing As (III) sorption in
phosphate-free water and a solution with 10mg/L phosphate indicates sorption is
reduced by 5-16%, depending on solution pH (Fig. 13). Arsenic (V) sorption is
reduced by 5-14% depending on pH (Fig. 14). At near neutral pH, sorption of As
(III) is affected by phosphate to greater degree than As (V) sorption.
3 4 5 6 7 8 9 10 1pH
140
48
56
64
72
As
(III)
sorb
ed (µ
g/g)
As (III) + PhosphateAs (III)
Figure13. Comparing sorption of As (III) on Prestea LC in phosphate-free and phosphate-bearing solutions as a function of pH and ionic strength. As (III) = 1.0mg/L, phosphate = 10mg/L, and suspension concentration, is15g/L.
41
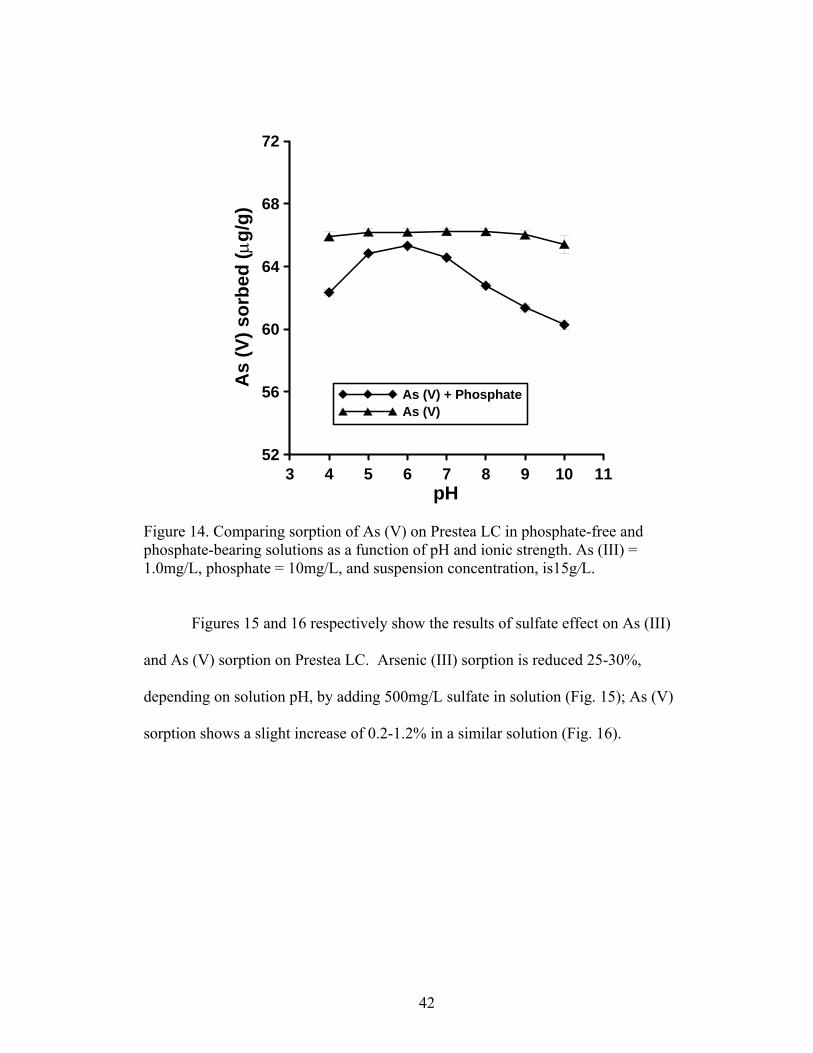
3 4 5 6 7 8 9 10 1
pH1
52
56
60
64
68
72
As
(V) s
orbe
d (µ
g/g)
As (V) + PhosphateAs (V)
Figure 14. Comparing sorption of As (V) on Prestea LC in phosphate-free and phosphate-bearing solutions as a function of pH and ionic strength. As (III) = 1.0mg/L, phosphate = 10mg/L, and suspension concentration, is15g/L.
Figures 15 and 16 respectively show the results of sulfate effect on As (III)
and As (V) sorption on Prestea LC. Arsenic (III) sorption is reduced 25-30%,
depending on solution pH, by adding 500mg/L sulfate in solution (Fig. 15); As (V)
sorption shows a slight increase of 0.2-1.2% in a similar solution (Fig. 16).
42
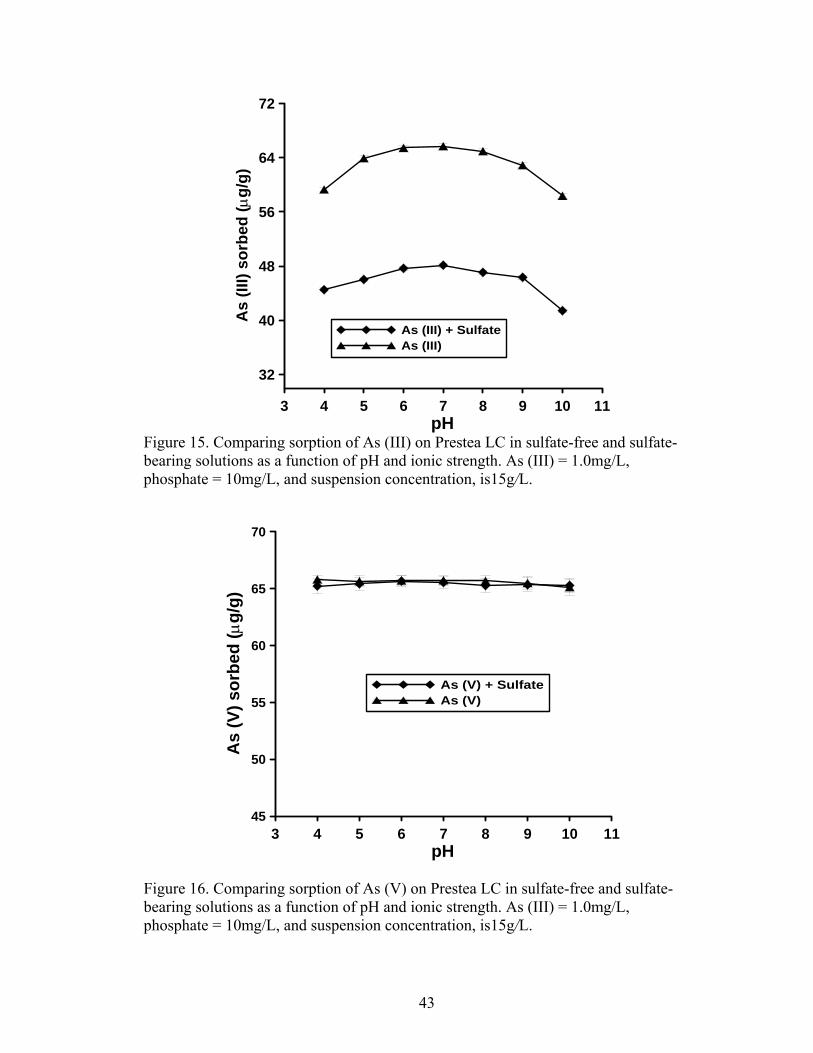
3 4 5 6 7 8 9 10 1
pH1
32
40
48
56
64
72
As
(III)
sorb
ed (µ
g/g)
As (III) + SulfateAs (III)
Figure 15. Comparing sorption of As (III) on Prestea LC in sulfate-free and sulfate-bearing solutions as a function of pH and ionic strength. As (III) = 1.0mg/L, phosphate = 10mg/L, and suspension concentration, is15g/L.
3 4 5 6 7 8 9 10
pH11
45
50
55
60
65
70
As
(V) s
orbe
d (µ
g/g)
As (V) + SulfateAs (V)
Figure 16. Comparing sorption of As (V) on Prestea LC in sulfate-free and sulfate-bearing solutions as a function of pH and ionic strength. As (III) = 1.0mg/L, phosphate = 10mg/L, and suspension concentration, is15g/L.
43
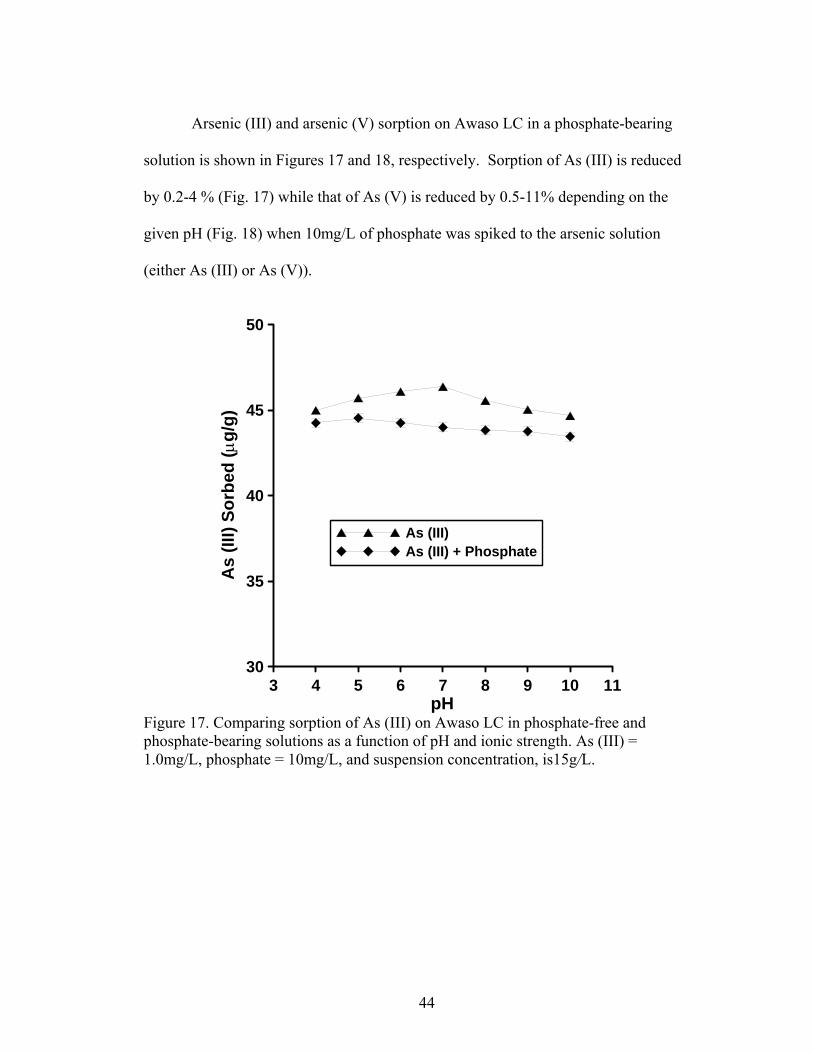
Arsenic (III) and arsenic (V) sorption on Awaso LC in a phosphate-bearing
solution is shown in Figures 17 and 18, respectively. Sorption of As (III) is reduced
by 0.2-4 % (Fig. 17) while that of As (V) is reduced by 0.5-11% depending on the
given pH (Fig. 18) when 10mg/L of phosphate was spiked to the arsenic solution
(either As (III) or As (V)).
3 4 5 6 7 8 9 10 1pH
130
35
40
45
50
As
(III)
Sorb
ed (µ
g/g)
As (III)As (III) + Phosphate
Figure 17. Comparing sorption of As (III) on Awaso LC in phosphate-free and phosphate-bearing solutions as a function of pH and ionic strength. As (III) = 1.0mg/L, phosphate = 10mg/L, and suspension concentration, is15g/L.
44
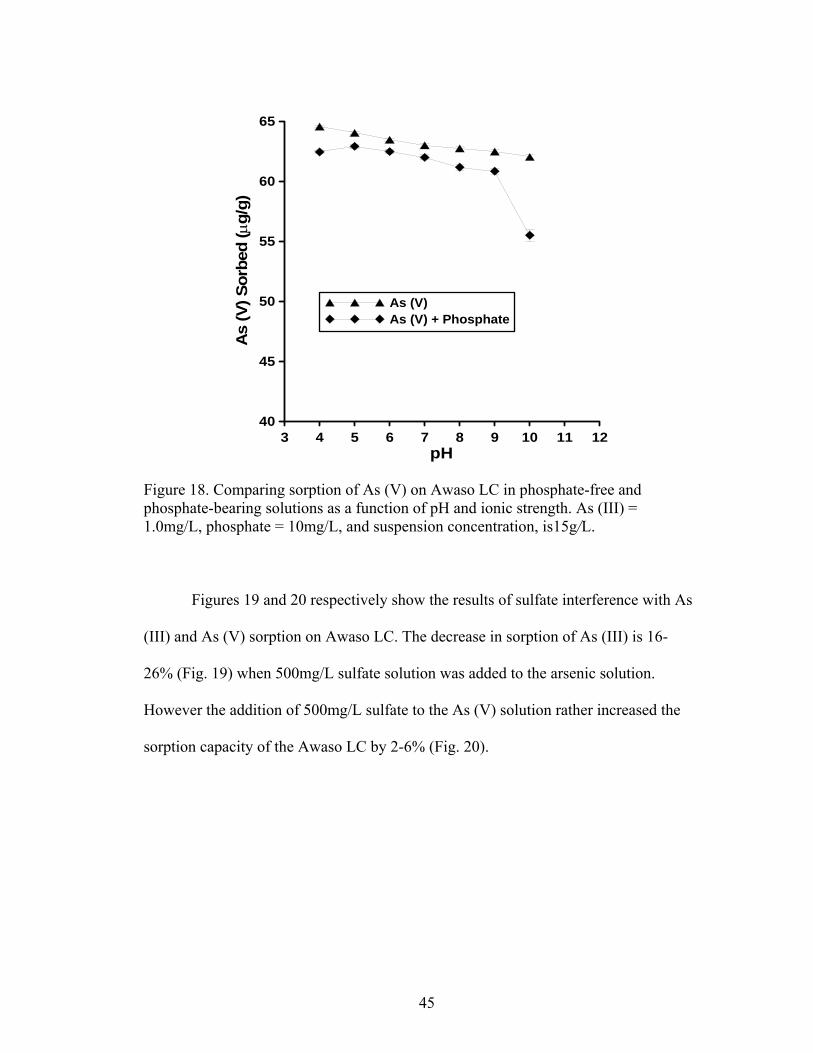
3 4 5 6 7 8 9 10 11 1pH
240
45
50
55
60
65
As
(V) S
orbe
d (µ
g/g)
As (V)As (V) + Phosphate
Figure 18. Comparing sorption of As (V) on Awaso LC in phosphate-free and phosphate-bearing solutions as a function of pH and ionic strength. As (III) = 1.0mg/L, phosphate = 10mg/L, and suspension concentration, is15g/L.
Figures 19 and 20 respectively show the results of sulfate interference with As
(III) and As (V) sorption on Awaso LC. The decrease in sorption of As (III) is 16-
26% (Fig. 19) when 500mg/L sulfate solution was added to the arsenic solution.
However the addition of 500mg/L sulfate to the As (V) solution rather increased the
sorption capacity of the Awaso LC by 2-6% (Fig. 20).
45
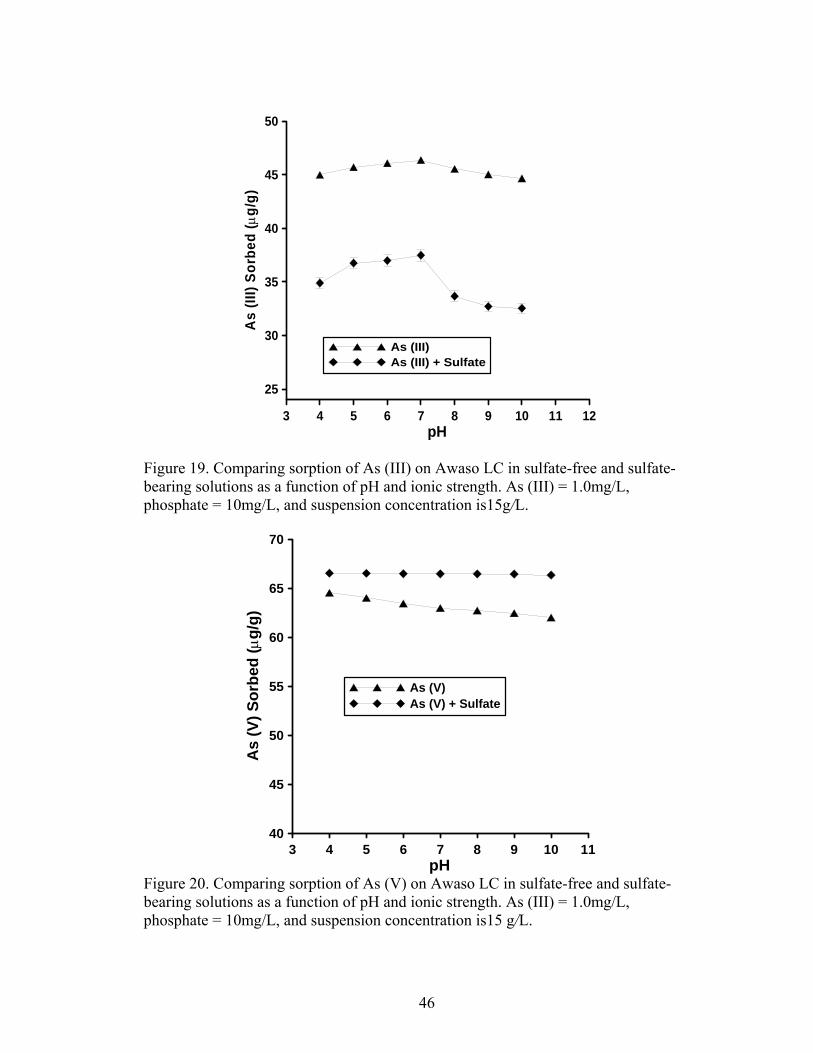
3 4 5 6 7 8 9 10 11 1pH
2
25
30
35
40
45
50
As
(III)
Sorb
ed (µ
g/g)
As (III)As (III) + Sulfate
Figure 19. Comparing sorption of As (III) on Awaso LC in sulfate-free and sulfate-bearing solutions as a function of pH and ionic strength. As (III) = 1.0mg/L, phosphate = 10mg/L, and suspension concentration is15g/L.
3 4 5 6 7 8 9 10 1pH
140
45
50
55
60
65
70
As
(V) S
orbe
d (µ
g/g)
As (V)As (V) + Sulfate
Figure 20. Comparing sorption of As (V) on Awaso LC in sulfate-free and sulfate-bearing solutions as a function of pH and ionic strength. As (III) = 1.0mg/L, phosphate = 10mg/L, and suspension concentration is15 g/L.
46
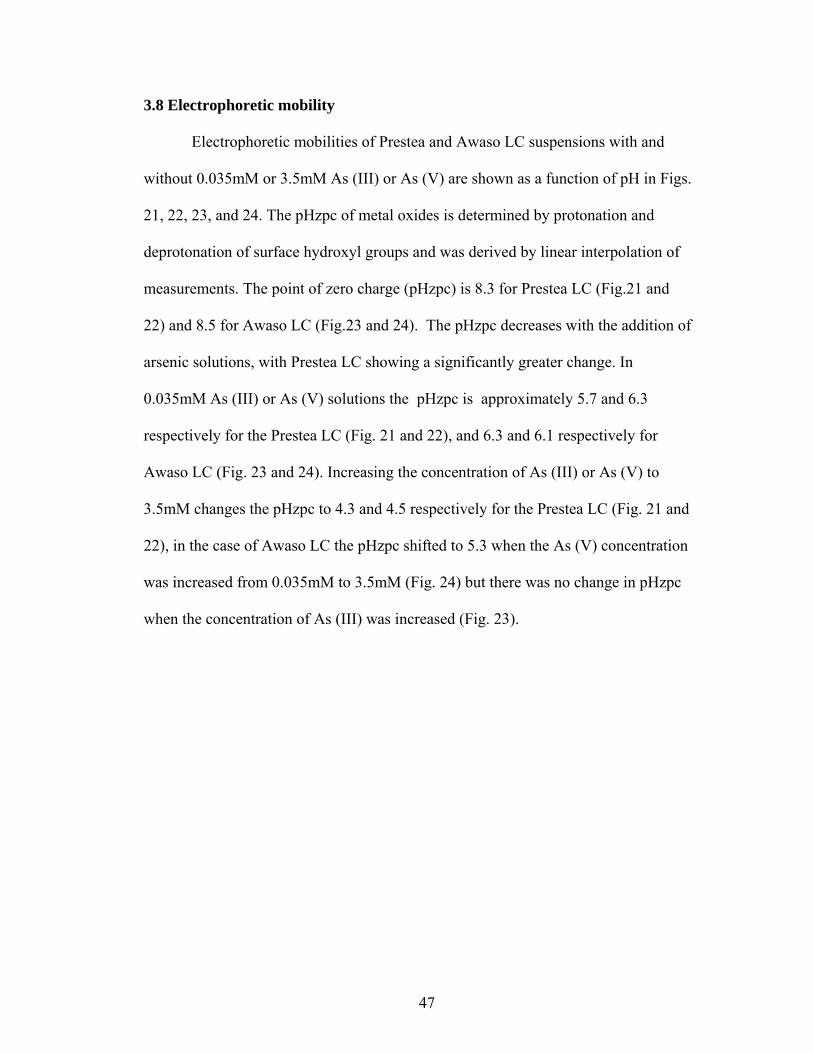
3.8 Electrophoretic mobility
Electrophoretic mobilities of Prestea and Awaso LC suspensions with and
without 0.035mM or 3.5mM As (III) or As (V) are shown as a function of pH in Figs.
21, 22, 23, and 24. The pHzpc of metal oxides is determined by protonation and
deprotonation of surface hydroxyl groups and was derived by linear interpolation of
measurements. The point of zero charge (pHzpc) is 8.3 for Prestea LC (Fig.21 and
22) and 8.5 for Awaso LC (Fig.23 and 24). The pHzpc decreases with the addition of
arsenic solutions, with Prestea LC showing a significantly greater change. In
0.035mM As (III) or As (V) solutions the pHzpc is approximately 5.7 and 6.3
respectively for the Prestea LC (Fig. 21 and 22), and 6.3 and 6.1 respectively for
Awaso LC (Fig. 23 and 24). Increasing the concentration of As (III) or As (V) to
3.5mM changes the pHzpc to 4.3 and 4.5 respectively for the Prestea LC (Fig. 21 and
22), in the case of Awaso LC the pHzpc shifted to 5.3 when the As (V) concentration
was increased from 0.035mM to 3.5mM (Fig. 24) but there was no change in pHzpc
when the concentration of As (III) was increased (Fig. 23).
47

2 4 6 8 10 12pH
-6
-4
-2
0
2
4
6
Elec
trop
horit
ic M
obili
ty
No arsenic added0.035 mM As (III)3.5 mM As (III)
Figure 21. Electrophoretic mobility of Prestea laterite concretion as a function of pH and total As (III) concentration in 0.01M NaCl solution. Zero point of charge for the three solutions inferred by extrapolating the data points to an electrophoretic mobility of zero are: 8.3 (untreated LC), 5.7 (0.035mM As (III) treated LC), and 4.3 (3.5mM As (III) treated LC).
2 4 6 8 10 12pH
-6
-4
-2
0
2
4
6
Elec
trop
horit
ic M
obili
ty
No Arsenic added0.035 mM As (V)3.5 mM As (V)
Figure 22. Electrophoretic mobility of Prestea laterite concretion as a function of pH and total As (V) concentration in 0.01M NaCl solution. Zero point of charge for the three solutions inferred by extrapolating the data points to an electrophoretic mobility of zero are: 8.1 (untreated LC), 6.3 (0.035mM As (III) treated LC), and 4.4 (3.5mM As (III) treated LC)
48
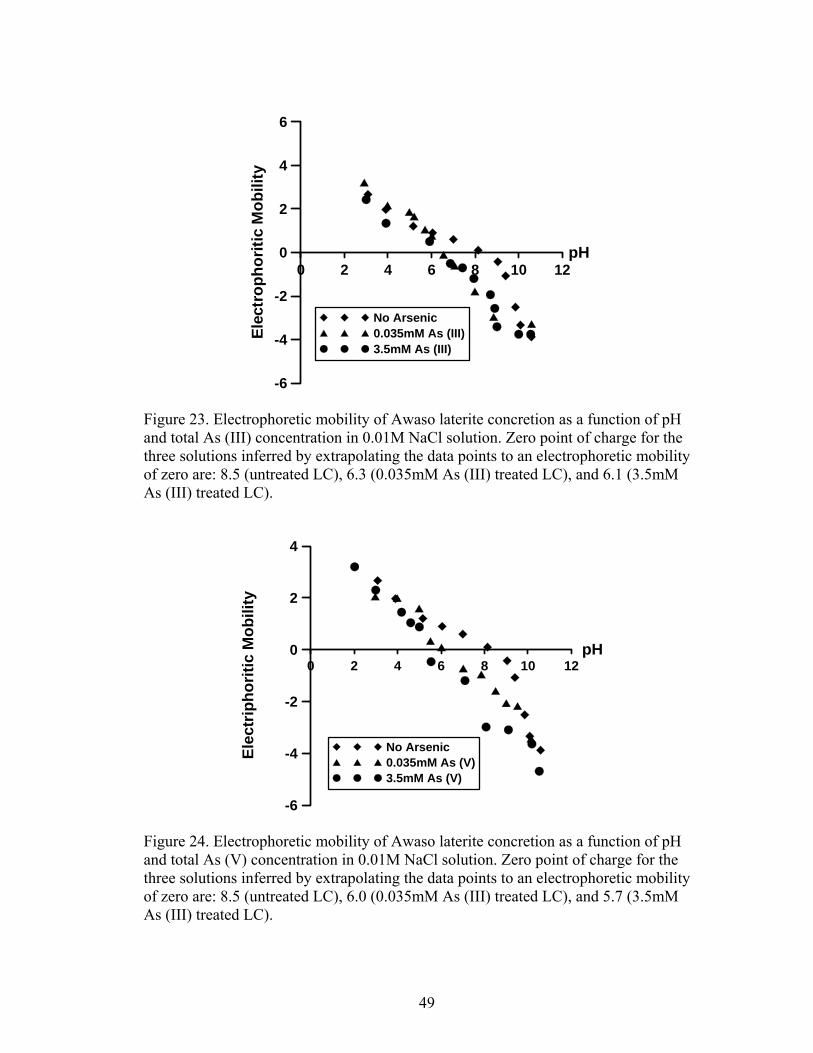
0 2 4 6 8 10 12pH
-6
-4
-2
0
2
4
6
Elec
trop
horit
ic M
obili
ty
No Arsenic 0.035mM As (III)3.5mM As (III)
Figure 23. Electrophoretic mobility of Awaso laterite concretion as a function of pH and total As (III) concentration in 0.01M NaCl solution. Zero point of charge for the three solutions inferred by extrapolating the data points to an electrophoretic mobility of zero are: 8.5 (untreated LC), 6.3 (0.035mM As (III) treated LC), and 6.1 (3.5mM As (III) treated LC).
0 2 4 6 8 10 12pH
-6
-4
-2
0
2
4
Elec
trip
horit
ic M
obili
ty
No Arsenic0.035mM As (V)3.5mM As (V)
Figure 24. Electrophoretic mobility of Awaso laterite concretion as a function of pH and total As (V) concentration in 0.01M NaCl solution. Zero point of charge for the three solutions inferred by extrapolating the data points to an electrophoretic mobility of zero are: 8.5 (untreated LC), 6.0 (0.035mM As (III) treated LC), and 5.7 (3.5mM As (III) treated LC).
49
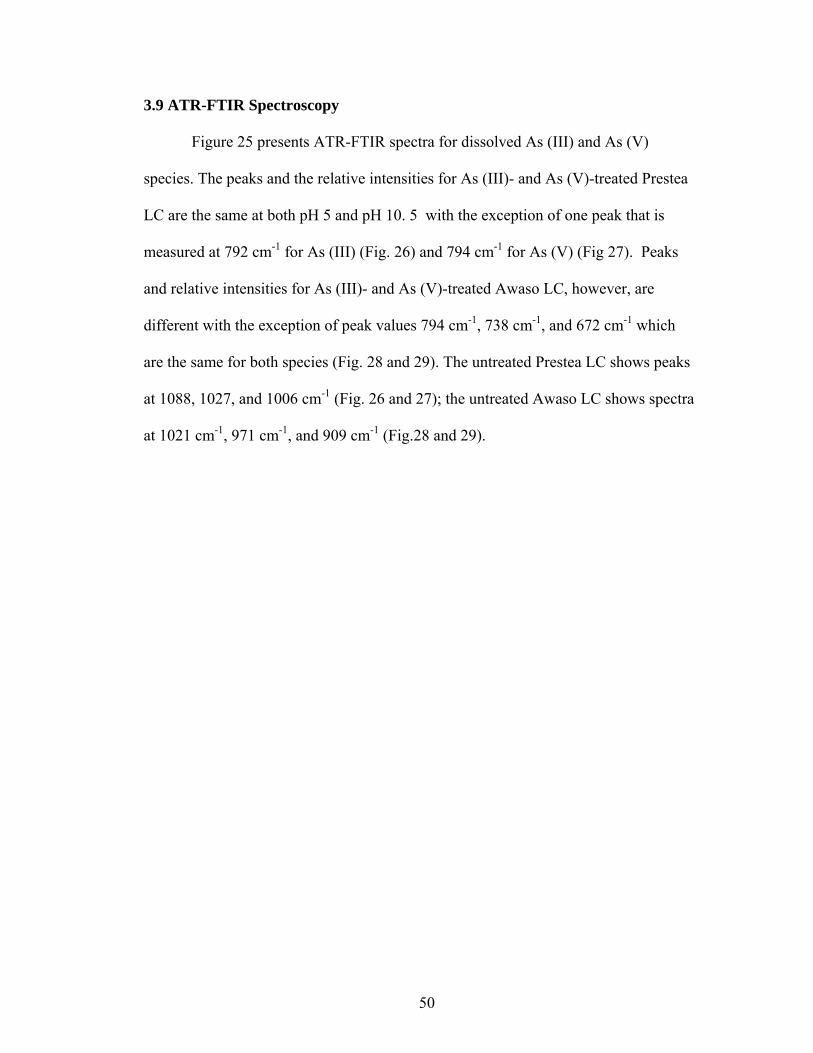
3.9 ATR-FTIR Spectroscopy
Figure 25 presents ATR-FTIR spectra for dissolved As (III) and As (V)
species. The peaks and the relative intensities for As (III)- and As (V)-treated Prestea
LC are the same at both pH 5 and pH 10. 5 with the exception of one peak that is
measured at 792 cm-1 for As (III) (Fig. 26) and 794 cm-1 for As (V) (Fig 27). Peaks
and relative intensities for As (III)- and As (V)-treated Awaso LC, however, are
different with the exception of peak values 794 cm-1, 738 cm-1, and 672 cm-1 which
are the same for both species (Fig. 28 and 29). The untreated Prestea LC shows peaks
at 1088, 1027, and 1006 cm-1 (Fig. 26 and 27); the untreated Awaso LC shows spectra
at 1021 cm-1, 971 cm-1, and 909 cm-1 (Fig.28 and 29).
50
Figure 25. ATR-FTIR spectra of 0.1M As (III) and As (V) solutions: (A) spectra for As (III) solution, pH = 5; (B) spectra for As (III) solution, pH = 10.5; (C) spectra for As (V) solution, pH = 5; and (D) spectra for As (V) solution, pH = 9.
51
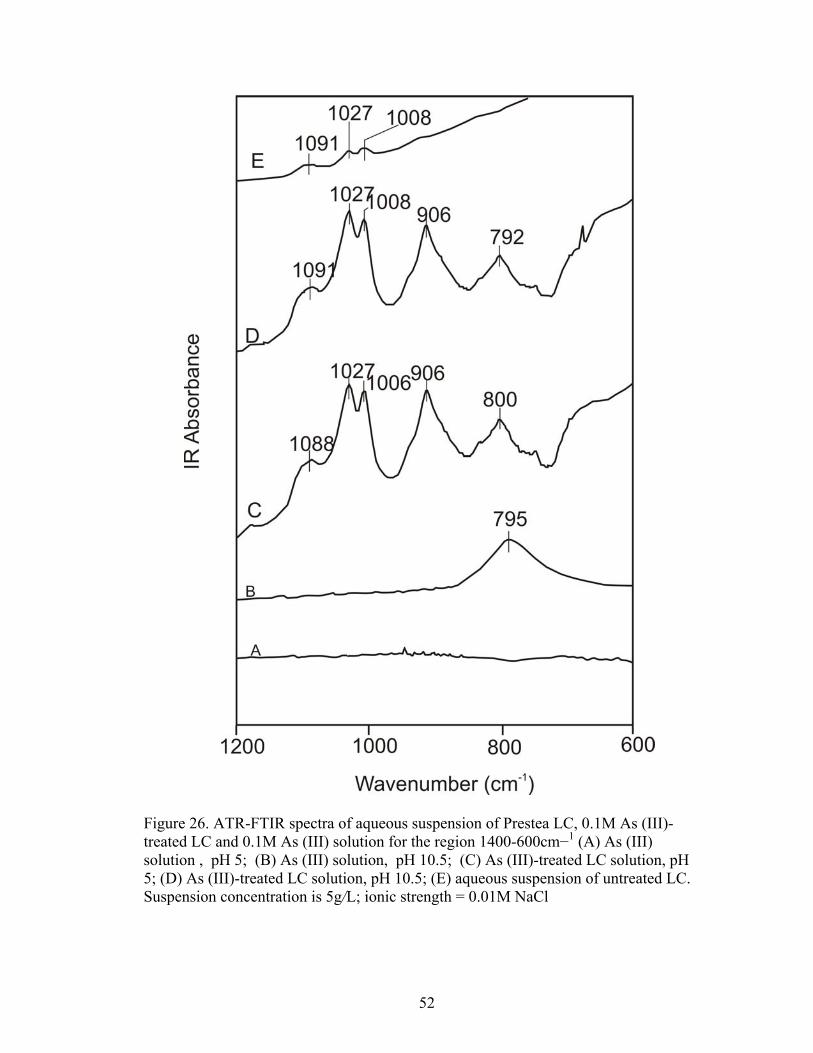
Figure 26. ATR-FTIR spectra of aqueous suspension of Prestea LC, 0.1M As (III)-treated LC and 0.1M As (III) solution for the region 1400-600cm−1 (A) As (III) solution , pH 5; (B) As (III) solution, pH 10.5; (C) As (III)-treated LC solution, pH 5; (D) As (III)-treated LC solution, pH 10.5; (E) aqueous suspension of untreated LC. Suspension concentration is 5g/L; ionic strength = 0.01M NaCl
52
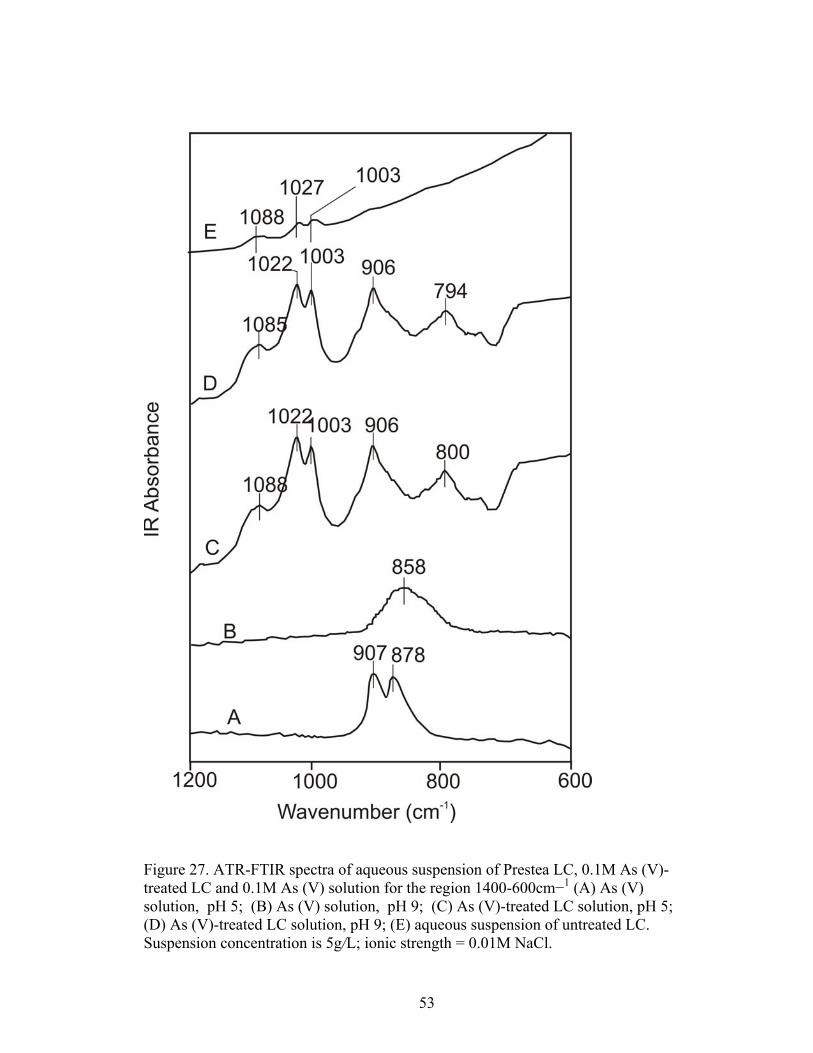
Figure 27. ATR-FTIR spectra of aqueous suspension of Prestea LC, 0.1M As (V)-treated LC and 0.1M As (V) solution for the region 1400-600cm−1 (A) As (V) solution, pH 5; (B) As (V) solution, pH 9; (C) As (V)-treated LC solution, pH 5; (D) As (V)-treated LC solution, pH 9; (E) aqueous suspension of untreated LC. Suspension concentration is 5g/L; ionic strength = 0.01M NaCl.
53
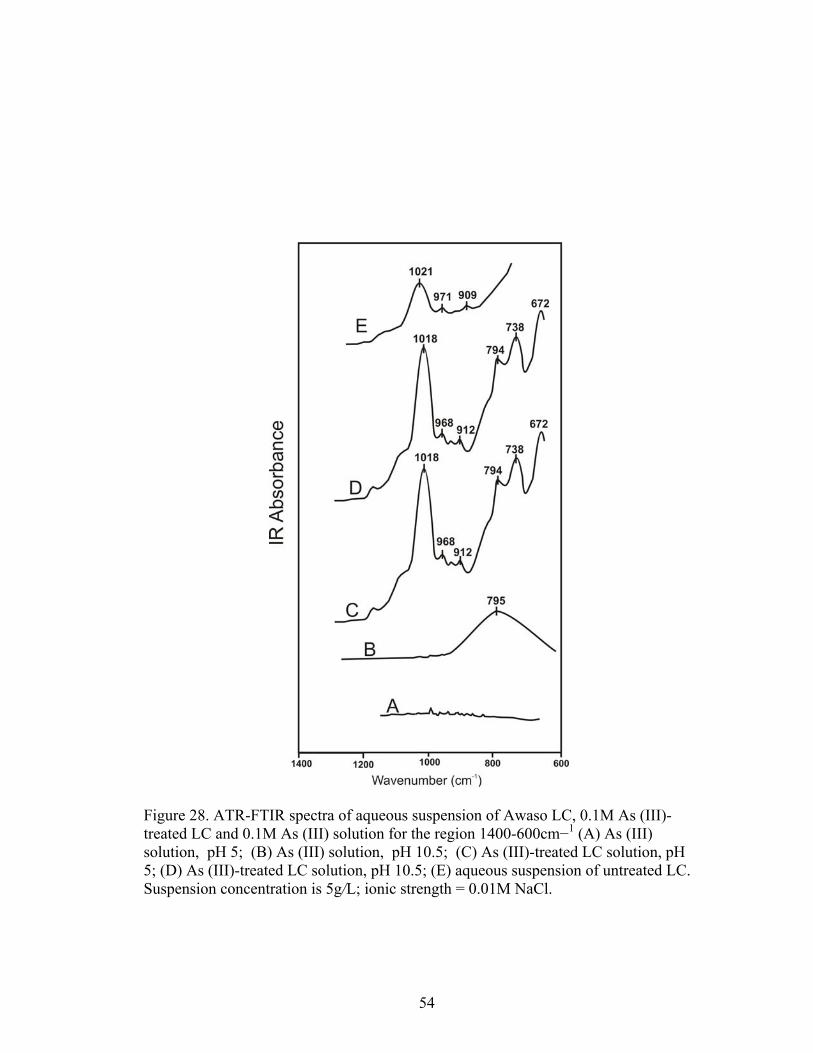
Figure 28. ATR-FTIR spectra of aqueous suspension of Awaso LC, 0.1M As (III)-treated LC and 0.1M As (III) solution for the region 1400-600cm−1 (A) As (III) solution, pH 5; (B) As (III) solution, pH 10.5; (C) As (III)-treated LC solution, pH 5; (D) As (III)-treated LC solution, pH 10.5; (E) aqueous suspension of untreated LC. Suspension concentration is 5g/L; ionic strength = 0.01M NaCl.
54

Figure 29. ATR-FTIR spectra of aqueous suspension of Awaso LC, 0.1M As (V)-treated LC and 0.1M As (V) solution for the region 1400-600cm−1 (A) As (V) solution, pH 5; (B) As (V) solution, pH 9; (C) As (V)-treated LC solution, pH 5;
55
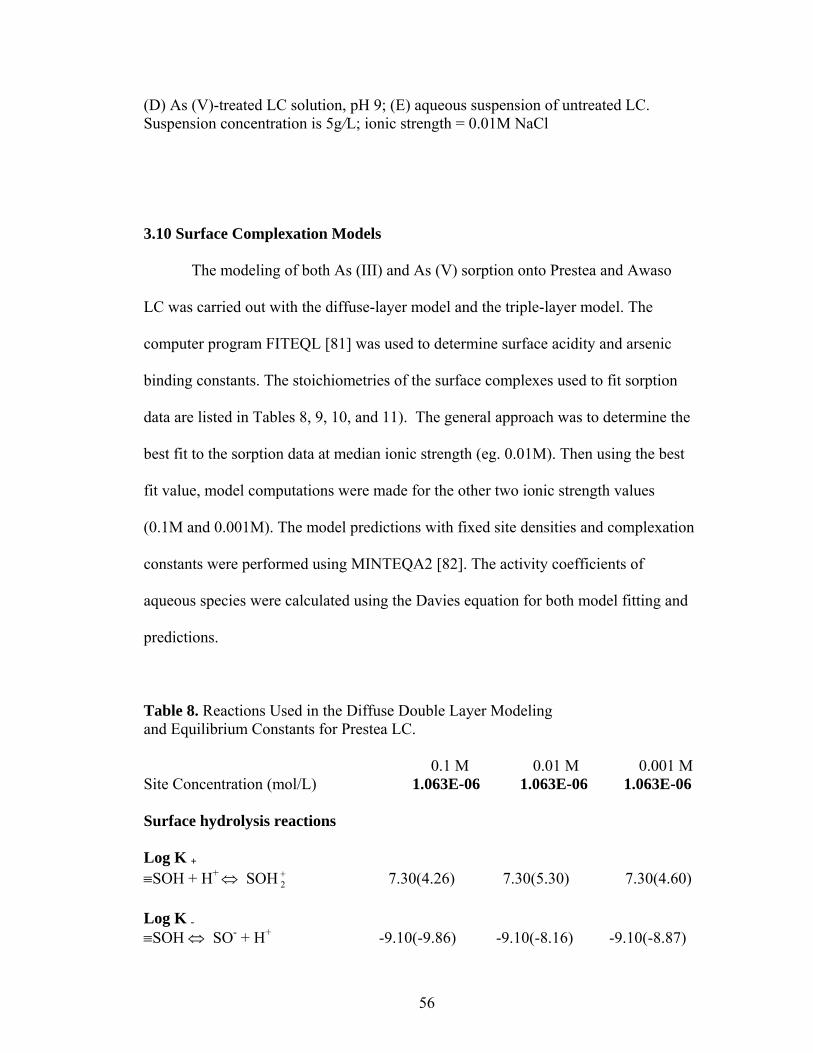
(D) As (V)-treated LC solution, pH 9; (E) aqueous suspension of untreated LC. Suspension concentration is 5g/L; ionic strength = 0.01M NaCl 3.10 Surface Complexation Models
The modeling of both As (III) and As (V) sorption onto Prestea and Awaso
LC was carried out with the diffuse-layer model and the triple-layer model. The
computer program FITEQL [81] was used to determine surface acidity and arsenic
binding constants. The stoichiometries of the surface complexes used to fit sorption
data are listed in Tables 8, 9, 10, and 11). The general approach was to determine the
best fit to the sorption data at median ionic strength (eg. 0.01M). Then using the best
fit value, model computations were made for the other two ionic strength values
(0.1M and 0.001M). The model predictions with fixed site densities and complexation
constants were performed using MINTEQA2 [82]. The activity coefficients of
aqueous species were calculated using the Davies equation for both model fitting and
predictions.
Table 8. Reactions Used in the Diffuse Double Layer Modeling and Equilibrium Constants for Prestea LC.
0.1 M 0.01 M 0.001 M Site Concentration (mol/L) 1.063E-06 1.063E-06 1.063E-06 Surface hydrolysis reactions Log K + ≡SOH + H+ ⇔ SOH +
2 7.30(4.26) 7.30(5.30) 7.30(4.60) Log K - ≡SOH ⇔ SO- + H+ -9.10(-9.86) -9.10(-8.16) -9.10(-8.87)
56

As (III) sorption reactions Log Kint ≡SOH + H3AsO3 ⇔ SH2AsO3 + H2O 3.65 3.65 3.65
≡SOH + H3AsO3 ⇔ SHAsO −3 + H+ + H2O -4.80 -4.80 -4.80
As (V) sorption reactions Log Kint ≡SOH + H3AsO4⇔ SH2AsO4 + H2O 12.35 12.35 12.35
≡SOH + H3AsO4 ⇔ SHAsO −4 + H+ + H2O 5.62 5.62 5.62
≡SOH + H3AsO4 ⇔ SAsO −24 + 2H+ + H2O -1.40 -1.40 -1.40
TABLE 9. Reactions Used in the Diffuse Double Layer Modeling and Equilibrium Constants for Awaso LC
0.1 M 0.01 M 0.001 M Site Concentration (mol/L) 5.652E-05 5.652E-05 5.652E-05 Surface hydrolysis reactions Log K + ≡SOH + H+ ⇔ SOH +
2 7.01(7.23) 7.01(6.97) 7.01(7.58) Log K - ≡SOH ⇔ SO- + H+ -8.79(-10.1) -8.79(-8.61) -8.79(-9.56) As (III) sorption reactions Log Kint ≡SOH + H3AsO3 ⇔ SH2AsO3 + H2O 3.62 3.62 3.62 ≡SOH + H3AsO3 ⇔ SHAsO −
3 + H+ + H2O -4.15 -4.15 -4.15
57
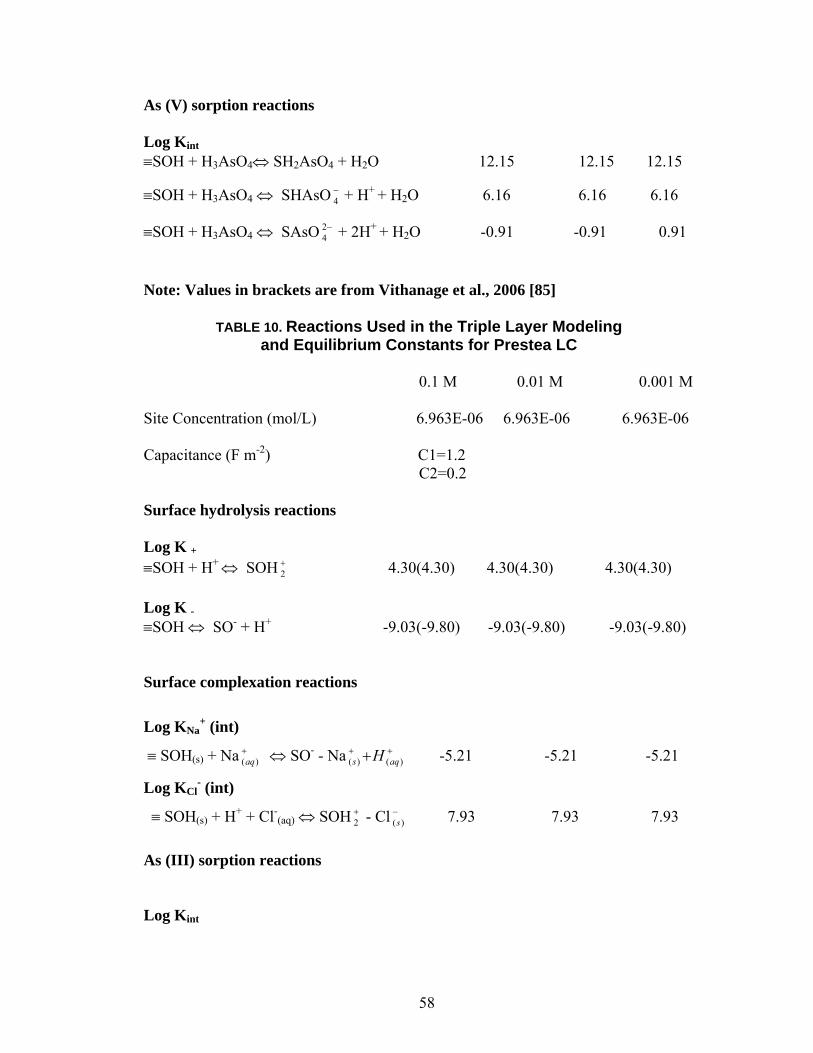
As (V) sorption reactions Log Kint ≡SOH + H3AsO4⇔ SH2AsO4 + H2O 12.15 12.15 12.15
≡SOH + H3AsO4 ⇔ SHAsO −4 + H+ + H2O 6.16 6.16 6.16
≡SOH + H3AsO4 ⇔ SAsO −24 + 2H+ + H2O -0.91 -0.91 0.91
Note: Values in brackets are from Vithanage et al., 2006 [85]
TABLE 10. Reactions Used in the Triple Layer Modeling and Equilibrium Constants for Prestea LC
0.1 M 0.01 M 0.001 M Site Concentration (mol/L) 6.963E-06 6.963E-06 6.963E-06 Capacitance (F m-2) C1=1.2 C2=0.2 Surface hydrolysis reactions Log K + ≡SOH + H+ ⇔ SOH +
2 4.30(4.30) 4.30(4.30) 4.30(4.30) Log K - ≡SOH ⇔ SO- + H+ -9.03(-9.80) -9.03(-9.80) -9.03(-9.80)
Surface complexation reactions
Log KNa
+ (int)
≡ SOH(s) + Na ⇔ SO+)(aq
- - Na -5.21 -5.21 -5.21 ++ + )()( aqs H
Log KCl- (int)
≡ SOH(s) + H+ + Cl-(aq) ⇔ SOH +
2 - Cl 7.93 7.93 7.93 −)(s
As (III) sorption reactions
Log Kint
58
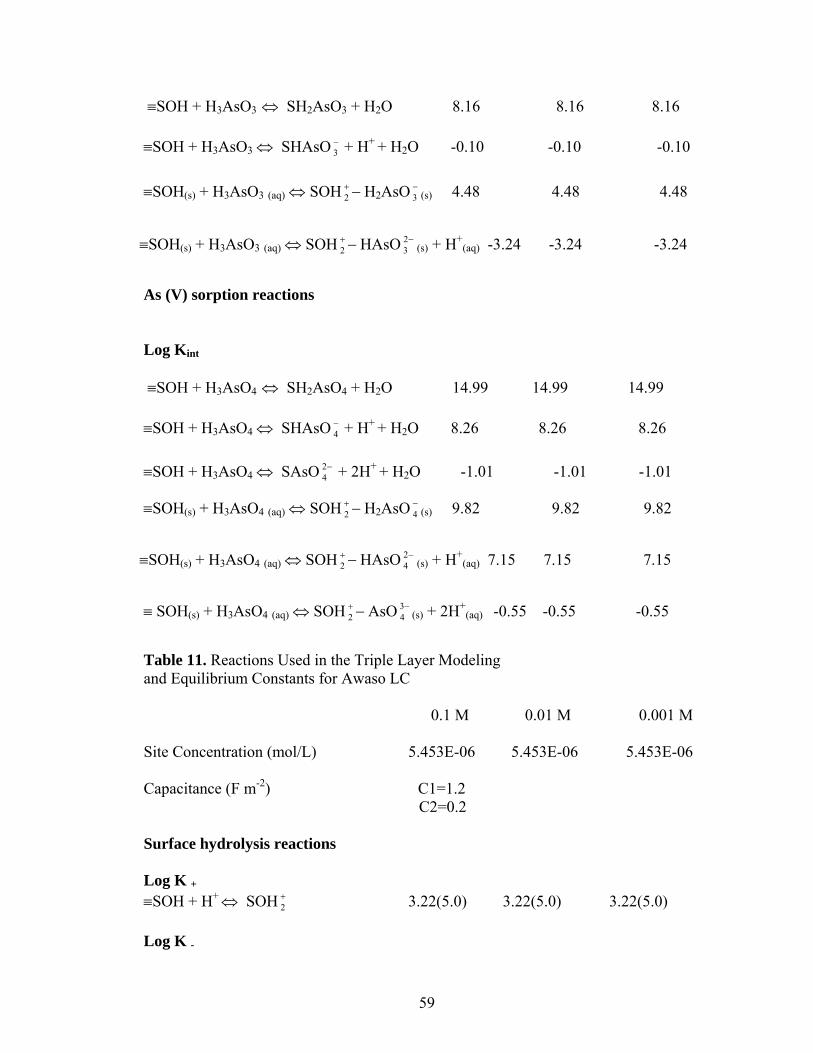
≡SOH + H3AsO3 ⇔ SH2AsO3 + H2O 8.16 8.16 8.16
≡SOH + H3AsO3 ⇔ SHAsO −3 + H+ + H2O -0.10 -0.10 -0.10
≡SOH(s) + H3AsO3 (aq) ⇔ SOH H−+2 2AsO −
3 (s) 4.48 4.48 4.48
≡SOH(s) + H3AsO3 (aq) ⇔ SOH HAsO−+2
−23 (s) + H+
(aq) -3.24 -3.24 -3.24
As (V) sorption reactions
Log Kint
≡SOH + H3AsO4 ⇔ SH2AsO4 + H2O 14.99 14.99 14.99
≡SOH + H3AsO4 ⇔ SHAsO −4 + H+ + H2O 8.26 8.26 8.26
≡SOH + H3AsO4 ⇔ SAsO −24 + 2H+ + H2O -1.01 -1.01 -1.01
≡SOH(s) + H3AsO4 (aq) ⇔ SOH H−+2 2AsO −
4 (s) 9.82 9.82 9.82
≡SOH(s) + H3AsO4 (aq) ⇔ SOH HAsO−+2
−24 (s) + H+
(aq) 7.15 7.15 7.15
≡ SOH(s) + H3AsO4 (aq) ⇔ SOH AsO−+2
−34 (s) + 2H+
(aq) -0.55 -0.55 -0.55
Table 11. Reactions Used in the Triple Layer Modeling and Equilibrium Constants for Awaso LC 0.1 M 0.01 M 0.001 M Site Concentration (mol/L) 5.453E-06 5.453E-06 5.453E-06 Capacitance (F m-2) C1=1.2 C2=0.2 Surface hydrolysis reactions Log K + ≡SOH + H+ ⇔ SOH +
2 3.22(5.0) 3.22(5.0) 3.22(5.0) Log K -
59
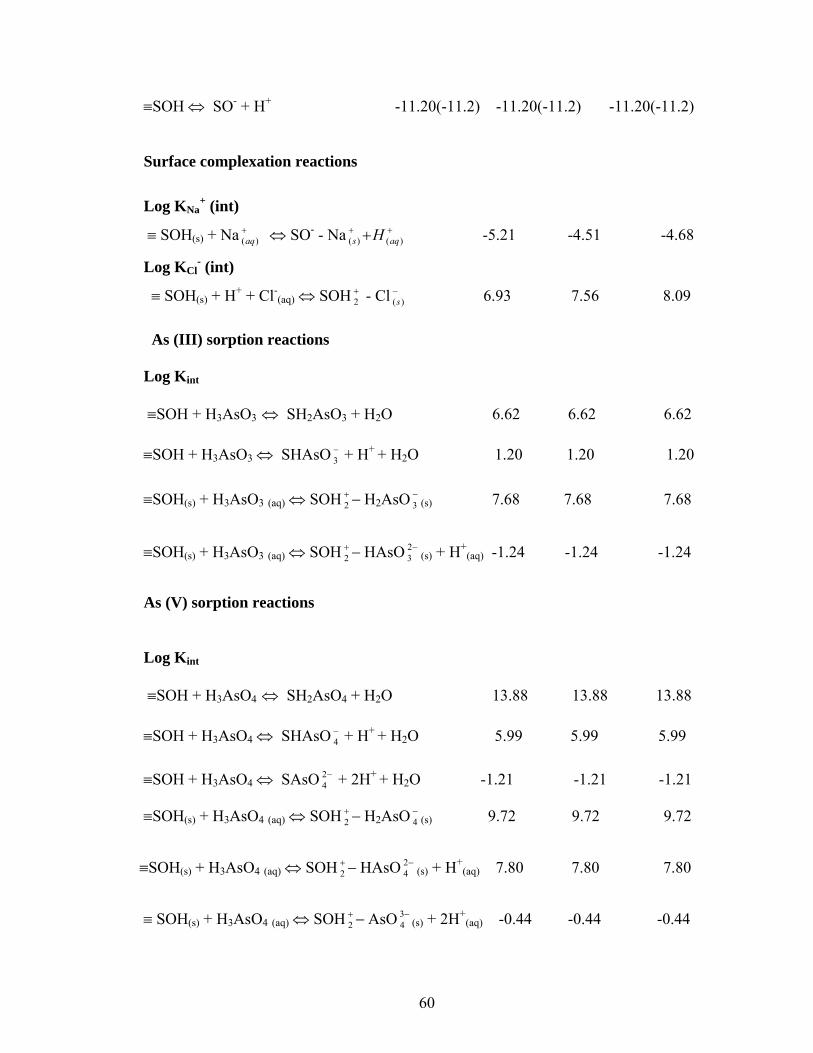
≡SOH ⇔ SO- + H+ -11.20(-11.2) -11.20(-11.2) -11.20(-11.2)
Surface complexation reactions
Log KNa
+ (int)
≡ SOH(s) + Na ⇔ SO+)(aq
- - Na -5.21 -4.51 -4.68 ++ + )()( aqs H
Log KCl- (int)
≡ SOH(s) + H+ + Cl-(aq) ⇔ SOH +
2 - Cl 6.93 7.56 8.09 −)(s
As (III) sorption reactions Log Kint
≡SOH + H3AsO3 ⇔ SH2AsO3 + H2O 6.62 6.62 6.62
≡SOH + H3AsO3 ⇔ SHAsO −3 + H+ + H2O 1.20 1.20 1.20
≡SOH(s) + H3AsO3 (aq) ⇔ SOH H−+2 2AsO −
3 (s) 7.68 7.68 7.68
≡SOH(s) + H3AsO3 (aq) ⇔ SOH HAsO−+2
−23 (s) + H+
(aq) -1.24 -1.24 -1.24
As (V) sorption reactions
Log Kint
≡SOH + H3AsO4 ⇔ SH2AsO4 + H2O 13.88 13.88 13.88
≡SOH + H3AsO4 ⇔ SHAsO −4 + H+ + H2O 5.99 5.99 5.99
≡SOH + H3AsO4 ⇔ SAsO −24 + 2H+ + H2O -1.21 -1.21 -1.21
≡SOH(s) + H3AsO4 (aq) ⇔ SOH H−+2 2AsO −
4 (s) 9.72 9.72 9.72
≡SOH(s) + H3AsO4 (aq) ⇔ SOH HAsO−+2
−24 (s) + H+
(aq) 7.80 7.80 7.80
≡ SOH(s) + H3AsO4 (aq) ⇔ SOH AsO−+2
−34 (s) + 2H+
(aq) -0.44 -0.44 -0.44
60

Note: Values in parentheses are from Goldberg et al. [15]
The ability of the diffuse layer model to describe As (III) and As (V) sorption
on Prestea LC is shown in Figures 30 and 31. Arsenic (III) sorption shows both ionic
strength and pH dependence as compared to As (V) (Figs. 30 and 31). The diffuse-
layer model shows a poor fit to As (III) experimental data over the pH measured
(Figs. 30). The model is able to describe As (V) experimental data quite well between
pH 4-7; however after pH 7 the model shows a poor description of the experimental
data (Fig. 31).
Figures 32 and 33 also show diffuse-layer model fit to As (III) and As (V)
respectively for Awaso LC. The model predictions of both As (III) and As (V)
experimental data for Awaso LC are similar to the Prestea LC (Fig. 32and 33). The
model shows a poor fit to As (III) experimental data over the pH and ionic strength
measured (Figs. 32). Arsenic (V) however, shows a good model fit between pH 4-7,
after which the model is unable to describe the experimental data (Fig. 33).
3 4 5 6 7 8 9 10pH
11
40
80
120
160
200
As
(III)
sorb
ed (µ
g/g)
0.1 M NaCl Exp. Data0.01 M NaCl Exp. Data0.001 M NaCl Exp. Data0.1 M NaCl Modeled Data0.01 M NaCl Modeled Data0.001 M NaCl Modeled Data
61
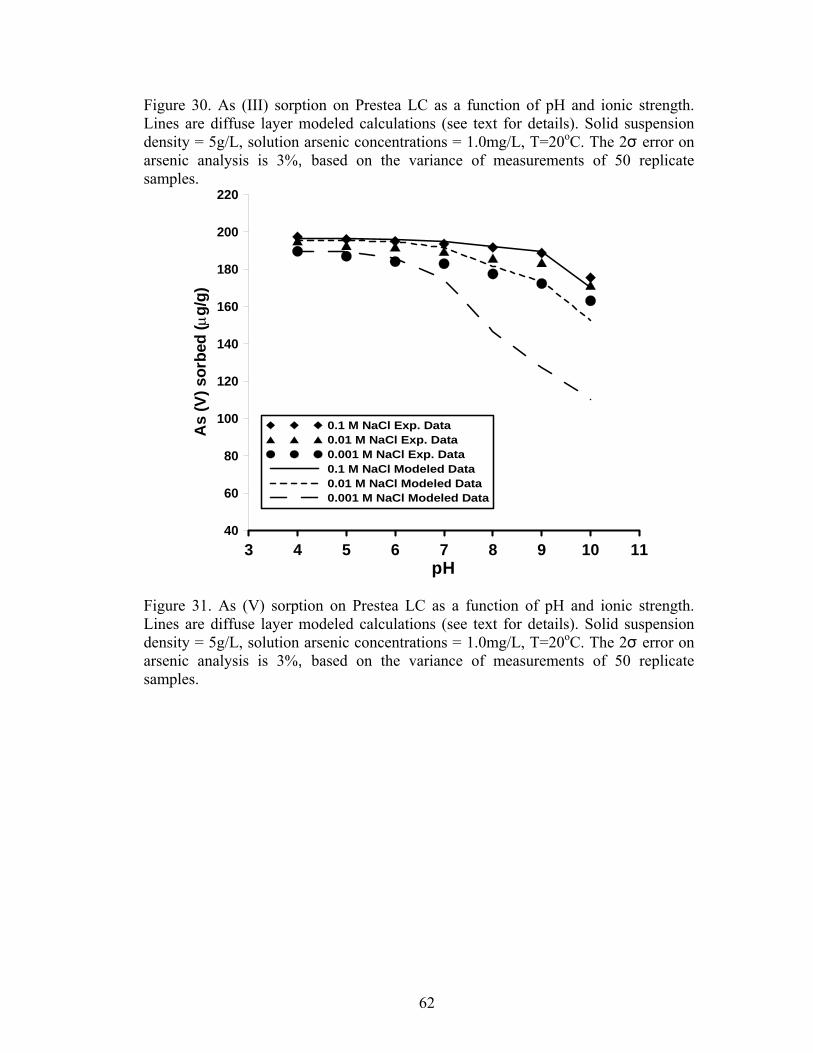
Figure 30. As (III) sorption on Prestea LC as a function of pH and ionic strength. Lines are diffuse layer modeled calculations (see text for details). Solid suspension density = 5g/L, solution arsenic concentrations = 1.0mg/L, T=20oC. The 2σ error on arsenic analysis is 3%, based on the variance of measurements of 50 replicate samples.
3 4 5 6 7 8 9 10pH
1140
60
80
100
120
140
160
180
200
220A
s (V
) sor
bed
(µg/
g)
0.1 M NaCl Exp. Data0.01 M NaCl Exp. Data0.001 M NaCl Exp. Data0.1 M NaCl Modeled Data0.01 M NaCl Modeled Data0.001 M NaCl Modeled Data
Figure 31. As (V) sorption on Prestea LC as a function of pH and ionic strength. Lines are diffuse layer modeled calculations (see text for details). Solid suspension density = 5g/L, solution arsenic concentrations = 1.0mg/L, T=20oC. The 2σ error on arsenic analysis is 3%, based on the variance of measurements of 50 replicate samples.
62

3 4 5 6 7 8 9 10pH
1120
40
60
80
100
120
140
160
180
As
(III)
sorb
ed (µ
g/g)
0.1 M NaCl Exp. Data0.01 M NaCl Exp. Data0.001 M NaCl Exp. Data0.1 M NaCl Modeled Data0.01 M NaCl Modeled Data0.001 M NaCl Modeled Data
Figure 32. As (III) sorption on Awaso LC as a function of pH and ionic strength. Lines are diffuse layer modeled calculations (see text for details). Solid suspension density = 5g/L, solution arsenic concentrations = 1.0mg/L, T=20oC. The 2σ error on arsenic analysis is 3%, based on the variance of measurements of 50 replicate samples.
63
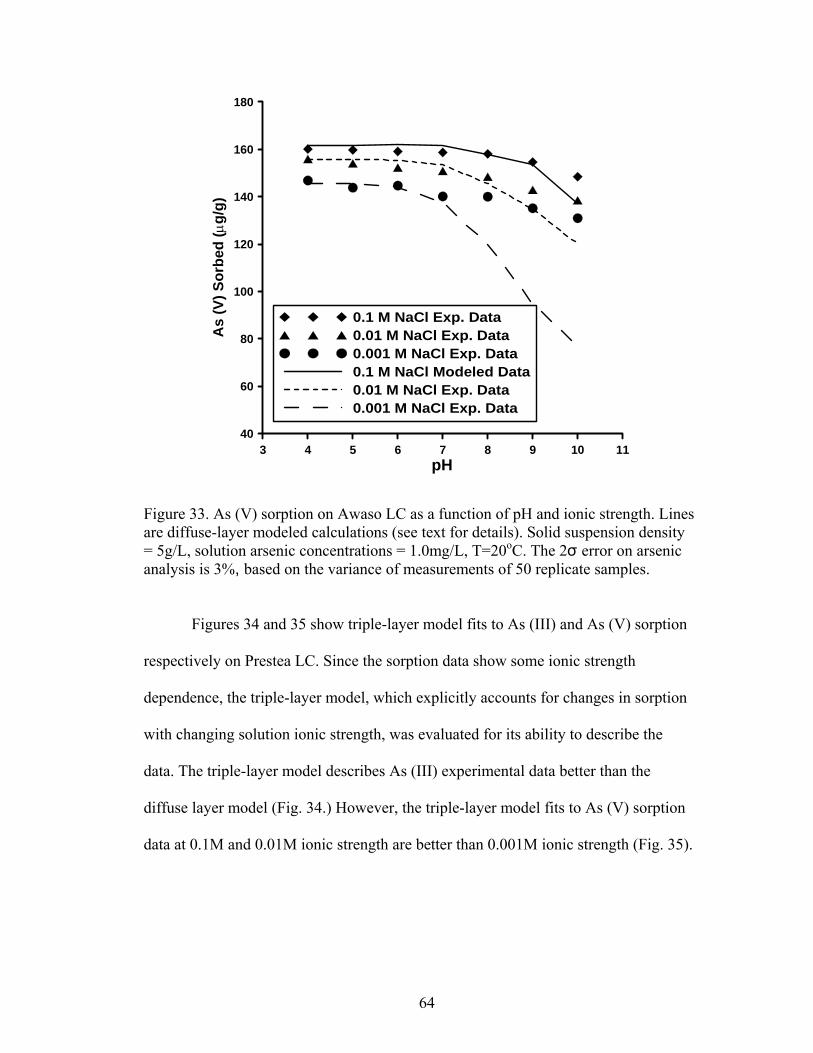
3 4 5 6 7 8 9 10pH
1140
60
80
100
120
140
160
180
As
(V) S
orbe
d (µ
g/g)
0.1 M NaCl Exp. Data0.01 M NaCl Exp. Data0.001 M NaCl Exp. Data0.1 M NaCl Modeled Data0.01 M NaCl Exp. Data0.001 M NaCl Exp. Data
Figure 33. As (V) sorption on Awaso LC as a function of pH and ionic strength. Lines are diffuse-layer modeled calculations (see text for details). Solid suspension density = 5g/L, solution arsenic concentrations = 1.0mg/L, T=20oC. The 2σ error on arsenic analysis is 3%, based on the variance of measurements of 50 replicate samples.
Figures 34 and 35 show triple-layer model fits to As (III) and As (V) sorption
respectively on Prestea LC. Since the sorption data show some ionic strength
dependence, the triple-layer model, which explicitly accounts for changes in sorption
with changing solution ionic strength, was evaluated for its ability to describe the
data. The triple-layer model describes As (III) experimental data better than the
diffuse layer model (Fig. 34.) However, the triple-layer model fits to As (V) sorption
data at 0.1M and 0.01M ionic strength are better than 0.001M ionic strength (Fig. 35).
64

3 4 5 6 7 8 9 10pH
11
40
80
120
160
200
As
(III)
sorb
ed (µ
g/g)
0.1 M NaCl Exp. Data0.01 M NaCl Exp. Data0.001 M NaCl Exp. Data0.1 M NaCl Modeled Data0.01 M NaCl Modeled Data0.001 M NaCl Modeled Data
Figure 34. As (III) sorption on Prestea LC as a function of pH and ionic strength. Lines are triple-layer modeled calculations (see text for details). Solid suspension density = 5g/L, solution arsenic concentration = 1.0mg/L, T=20oC. The 2σ error on arsenic analysis is 3%, based on the variance of measurements of 50 replicate samples.
65
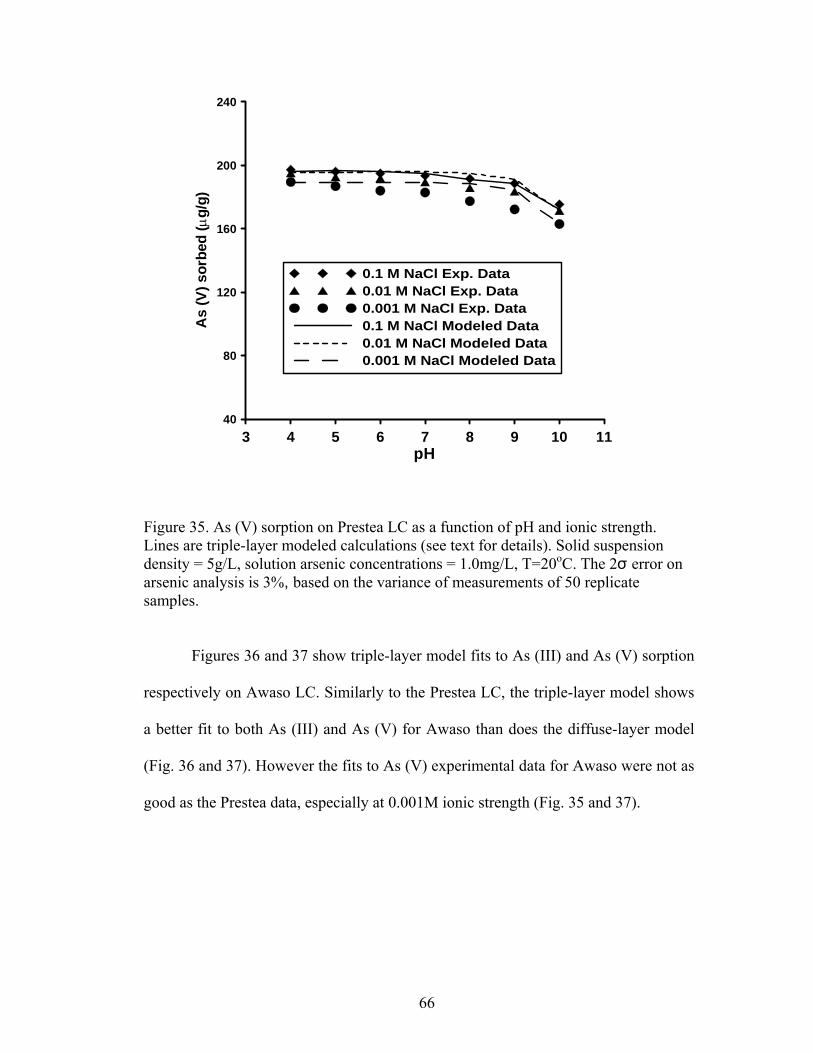
3 4 5 6 7 8 9 10pH
1140
80
120
160
200
240
As
(V) s
orbe
d (µ
g/g)
0.1 M NaCl Exp. Data0.01 M NaCl Exp. Data0.001 M NaCl Exp. Data0.1 M NaCl Modeled Data0.01 M NaCl Modeled Data0.001 M NaCl Modeled Data
Figure 35. As (V) sorption on Prestea LC as a function of pH and ionic strength. Lines are triple-layer modeled calculations (see text for details). Solid suspension density = 5g/L, solution arsenic concentrations = 1.0mg/L, T=20oC. The 2σ error on arsenic analysis is 3%, based on the variance of measurements of 50 replicate samples.
Figures 36 and 37 show triple-layer model fits to As (III) and As (V) sorption
respectively on Awaso LC. Similarly to the Prestea LC, the triple-layer model shows
a better fit to both As (III) and As (V) for Awaso than does the diffuse-layer model
(Fig. 36 and 37). However the fits to As (V) experimental data for Awaso were not as
good as the Prestea data, especially at 0.001M ionic strength (Fig. 35 and 37).
66
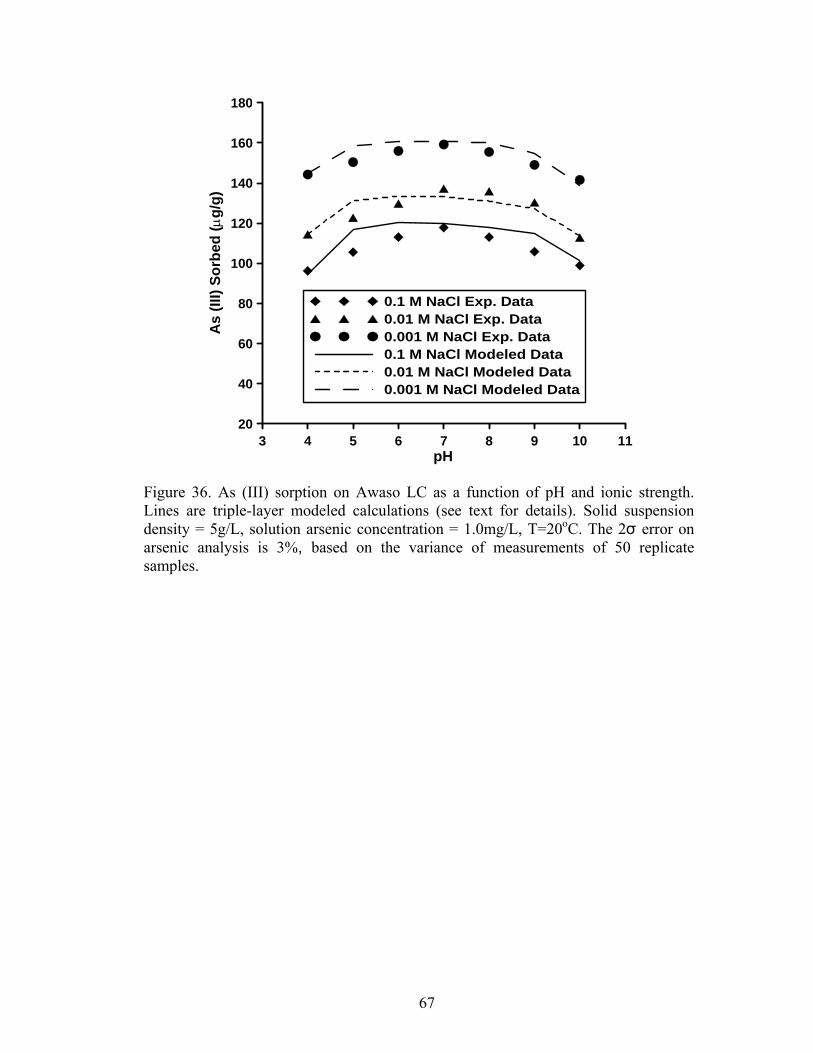
3 4 5 6 7 8 9 10pH
1120
40
60
80
100
120
140
160
180
As
(III)
Sorb
ed (µ
g/g)
0.1 M NaCl Exp. Data0.01 M NaCl Exp. Data0.001 M NaCl Exp. Data0.1 M NaCl Modeled Data0.01 M NaCl Modeled Data0.001 M NaCl Modeled Data
Figure 36. As (III) sorption on Awaso LC as a function of pH and ionic strength. Lines are triple-layer modeled calculations (see text for details). Solid suspension density = 5g/L, solution arsenic concentration = 1.0mg/L, T=20oC. The 2σ error on arsenic analysis is 3%, based on the variance of measurements of 50 replicate samples.
67
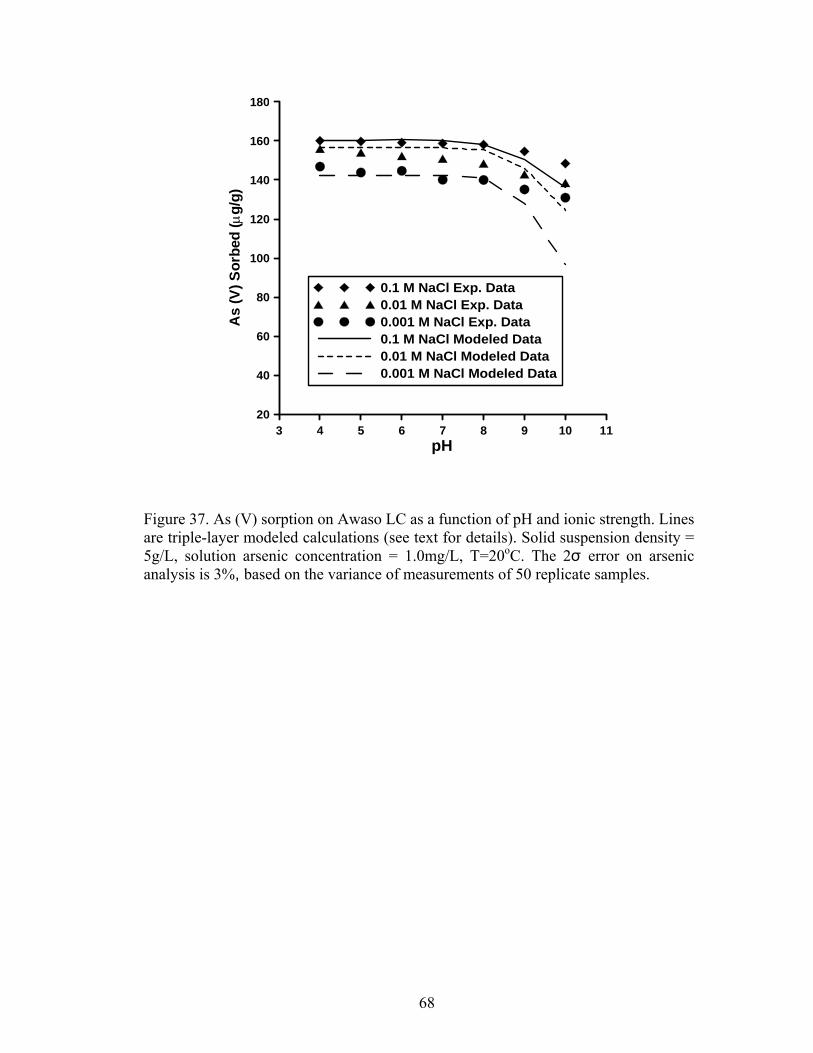
3 4 5 6 7 8 9 10pH
1120
40
60
80
100
120
140
160
180
As
(V) S
orbe
d (µ
g/g)
0.1 M NaCl Exp. Data0.01 M NaCl Exp. Data0.001 M NaCl Exp. Data0.1 M NaCl Modeled Data0.01 M NaCl Modeled Data0.001 M NaCl Modeled Data
Figure 37. As (V) sorption on Awaso LC as a function of pH and ionic strength. Lines are triple-layer modeled calculations (see text for details). Solid suspension density = 5g/L, solution arsenic concentration = 1.0mg/L, T=20oC. The 2σ error on arsenic analysis is 3%, based on the variance of measurements of 50 replicate samples.
68
CHAPTER 4
DISCUSSION
4.1 Sorption isotherm for Prestea and Awaso LC
The sorption isotherm data obtained from the Prestea and Awaso LC obeys
the Langmuir isotherm with a high coefficient of determination for the model (Tables
5 and 6). The Langmuir isotherm, as a result, is used to study the sorption capacity of
Prestea and Awaso LC. Linearization of the Langmuir equation allows calculation of
the sorption capacity for both Prestea and Awaso LC.
The As (III) sorption capacity for Awaso LC is lower than As (V) at pH of 7.0
(Fig. 6). This is expected and agrees with ideas of sorption being related to
electrostatic forces between surfaces and aqueous species [71, 86]. At pH 7.0 the
surface of the Awaso LC is positively charged because the pHzpc is 8.3 and the
predominant arsenic species in aqueous solution are H3AsO and HAsO03
−24
. The As
(III) species has a neutral charge and the As (V) has a negative charge, thus HAsO
should be attracted more strongly to the Awaso LC surface. This observed trend is
consistent with other studies [15, 20, 87, 88] of As (III) and As (V) sorption onto
aluminum and iron oxides (Awaso LC is predominantly aluminum and iron oxide).
These studies also indicate that As (III) uptake from aqueous solution is much less
than that for As (V).
−24
Arsenic (III) sorption capacity for Prestea LC is, however, higher than that of
As (V) at pH of 7.0 (Fig. 5). This is unusual, given the fact that the As (III) species
(H3AsO ) has no charge in the pH range 4 to 8 and therefore is not expected to sorb
better than As (V) (HAsO ), which exists as a charged aqueous species at pH 7.0. It
03
−24
69

appears the sorbent mineralogy affects sorption. The mineralogical composition of
Prestea LC is complex. Other oxides found in Prestea LC, such as manganese and
titanium oxides, may oxidize As (III) to As (V) making it easier to remove, hence the
observed increase in sorption. Maiti et al. [89] did speciation studies on lateritic soils
where about 20% conversion of As (III) to As (V) was observed, with an initial As
(III) concentration of 1000µg/l and at a 20g/l adsorbent dose. Their explanation for
the conversion to the As (V) state is due to the presence of manganese oxide in the
laterite. Manganese and titanium oxides are known as oxidants of As (III) to As (V)
[90-92]. Other studies [89, 93-96] of arsenic uptake by natural lateritic soils similar to
the Prestea LC show higher As (III) sorption than As (V) at pH 7.0. Arsenic sorption
studies [15, 20] that used pure laboratory synthesized materials such as iron oxide or
aluminum oxide observed the opposite, where As (V) sorption is higher than As (III)
at pH 7.0. This behavior of LC gives it an advantage over other laboratory
synthesized arsenic filtering media.
4.2 Effect of Temperature and thermodynamic parameters for Prestea LC
Table 5 shows higher sorption capacity (qm) for As (III) than As (V) at all
temperatures. It appears arsenic sorption on Prestea LC is not simply controlled by
electrostatic interaction between aqueous ions and mineral surfaces (Fig. 7 and 8). As
(III) species (HAsO ) does not dissociate in the pH range 4 to 8 and therefore is not
expected to sorb better than As (V) (H
03
2AsO ), which exists as a charged aqueous
species for pH 7.0. Arsenic studies on metal oxides indicate that As (V) sorbs best in
the pH range of 4-5 and that sorption decreases as pH increases [97-100]. Other
−4
70

studies [89, 101, 102] on the temperature effects on arsenic uptake by natural
materials show higher As (III) sorption than As (V). They attributed this observed
behavior to an increase in repulsion due to the more negatively charged As (V)
species and negatively charged surface sites of the metal oxides [101]. Another
reason for this trend is the increase in competition with OH- for sorption sites with
increasing pH [103].
Altundogan et al. [83] observed the opposite trend where As (III) sorption on
red mud decreases with increasing temperature, but As (V) sorption increases with
increasing temperature. They concluded that this observed trend is due to the nature
of As (III) sorption being physical, while that of As (V) is chemical. They, however,
show no spectroscopic evidence to delineate the mechanism of arsenic sorption onto
the red mud.
Several factors may account for the increase in sorption with increase in
temperature: chemisorption or inner-sphere sorption mechanisms (discussed later in
the chapter) may be taking place on the Prestea LC and possibly causing some
tunneling of adsorbed ions into Prestea LC mineral phases [104]. Moreover, an
increased diffusion rate of adsorbate molecules into the Prestea LC pores due to
increased temperature may account for the observed behavior [102]. Changes in the
adsorbent pore sizes and an increase in the number of sorption sites due to the
breaking of some internal bonds near the edge of the particle are expected at higher
temperatures [105-108]. An increase in temperature may also effect an increase in
proportion and activity of arsenic ions in solution, the affinity of the ions for the
surface, or the charge and therefore the potential of the surface [109].
71

The negative ∆Go values (Table 5) for As (III) and As (V) sorption agree with
the spontaneous nature of the arsenic sorption process. The decrease in ∆G° with
increasing temperature implies stronger sorption at a higher temperature. The
relationship between sorption and temperature agrees with the observed increase in
sorption capacity qm with temperature for both As (III) and As (V). The ∆Ho value is
positive for both As (III) and As (V), indicating the endothermic nature of arsenic
sorption. Altundogan et al. [83] and Zeng [101], however, observed an opposite effect
of temperature on As (III) and As (V) sorption on mixed oxides, explaining why As
(V) sorption is more affected by temperature. The positive ∆So values reflect the
affinity of LC for As (V) and As (III) and suggest some structural changes in the
arsenic species and the adsorbent [83, 84]; moreover, the positive value of ∆So show
the increasing randomness at the solid/liquid interface during arsenic sorption [101].
4.3 ATR-FTIR Spectroscopy
A comparism of the peaks at 1088cm-1, 1027cm-1, and 1006cm-1 for the
untreated Prestea LC with those for the arsenic-treated Prestea LC shows a lowering
of the peaks to1085cm-1, 1022cm-1, and 1003cm-1 when arsenic was adsorbed onto
Prestea LC (Fig. 26 and 27). The shift in peaks from 1088cm-1 to 1085cm-1, from
1027cm-1 to 1022cm-1, and from 1006cm-1 to 1003cm-1 may be a consequence of
arsenic sorption because arsenic was the only sorbed ion added to the treatment water
[63, 110]. The arsenic treated LC shows peaks at 906cm-1 and 792/794cm-1
respectively for As (III) and As (V) that are not observed on the untreated LC spectra.
The presence of these peaks on the treated LC spectra that are not present in the
72
untreated sample are an indication of chemical bonding between the arsenic species
and the surface of the Prestea LC [63, 110]. The peak shift and the change in peak
intensity may be an indication of an inner-sphere sorption mechanism as this is in
agreement with previously published data [15, 62, 63].
Sun and Doner investigated As (III) and As (V) bonding structures on
goethite by ATR-FTIR. They realized that the addition of either As (III) or As (V)
caused a reduction in peak wavelength; they also showed a new peak appearing at
2686cm-1 as a result of splitting of the initial peak. They concluded such a reaction
may be attributed to chemical bonding or an inner-sphere bonding mechanism.
Awaso LC spectra are similar; treatment with As (III) shifts the 1021cm-1
peak to 1018cm-1 and the 971cm-1 peak to 968cm-1. Also the peak intensities are
stronger for the As (III) treated sample than the untreated sample (Fig. 28). Again, the
794 cm-1, 738 cm-1, and 672 cm-1 peaks that are not present in the untreated Awaso
LC are showing up on the As (III) treated samples (Fig. 28). These may be a split of
the 909cm-1 peak from the untreated Awaso LC. Sun and Doner observed splitting of
peaks from untreated goethite samples when treated with As (III) and concluded that
such a reaction may be attributed to chemical bonding or an inner-sphere bonding
mechanism. Goldberg et al. however, in the case of As (III) sorption to amorphous
aluminum oxide, observed no discernible features on FTIR spectrum that could be
attributed to As (III) surface complexation. They concluded that As (III) sorption on
amorphous aluminum oxide is by an outer-sphere sorption mechanism.
Arsenic (V) treated Awaso LC shows the same wave numbers as the
untreated Awaso LC, with the addition of a 935cm-1 peak (Fig. 29). The peak
73
intensities on As (V) treated samples are also stronger than the untreated samples and
also show a split of the 909cm-1 peak to the 794cm-1 , 744cm-1, and 672cm-1 peaks as
in the case of As (III) (Fig. 29). These changes suggest specific ion sorption between
As (V) and Awaso LC and are indications of inner-sphere formation complexes [62,
63].
The peak positions of the arsenic treated samples (sorbed samples for both
Prestea and Awaso LC) (Figures 26, 27, 28, and 29) were significantly different from
those of the dissolved arsenic species (Fig. 25), which can be attributed to sorption of
the arsenic species. In general, the spectra of both As (III) and As (V) sorbed to the
Prestea and Awaso LC are very different from those of arsenic aqueous solutions.
This difference and the lack of pH dependence on the positions of the vibrational
modes indicate that these modes are “protected” from changes in pH and indicate that
these groups are involved in direct complexation to the surface [15, 62].
If the shift were caused by protonation, as would it be in the case of outer-
sphere sorption, the bands would exhibit similar positions with regard to the
corresponding dissolved arsenic species in that pH range [15, 71, 111]. The different
peak intensities, band shifts, and splits may all indicate the formation of inner-sphere
complexes.
Where as the ATR-FTIR spectra for dissolved arsenic species do change as
pH is varied. A shift in band position with changing pH was not observed in As (V)
and As (III) adsorbed spectra (Figures 26, 27, 28, and 29). The lack of change in band
position at various pH values suggests that arsenic formed the same inner-sphere
surface complexes on both Prestea and Awaso LC [71]. Other researcher studies on
74
single metal oxides [15, 63, 112] observe different peak intensities for As (III) and As
(V) sorption on metal oxides, though that was not observed in this work. Prestea and
Awaso LC consist of mixed oxides, therefore it is not surprising that different peak
intensities were observed in the FTIR spectrum that were not observed in published
data on single metal oxides. The ATR-FTIR data and the above discussions suggest
an inner-sphere sorption mechanism for both As (III) and As (V) on Prestea and
Awaso LC.
Although the XRD spectra of the Prestea and Awaso LC (Figs. 3 and 4)
suggest the Awaso is more crystalline than the Prestea, they didn’t show much
difference in the ATR-FTIR data. In contrast published ATR- FTIR data by Goldberg
et al. [15] on As (III) sorption onto amorphous aluminum oxide show sorption is by
an outer-sphere sorption mechanism. This confirms the previous discussions on As
(III) sorption data that suggest manganese and titanium oxide may be oxidizing As
(III) to As (V), which could explain why this work observes a different sorption
mechanism than is reported in the previously published data on single metal oxides.
4.4 Electrophoretic Mobility
The shift of Prestea LC pHzpc to a lower pH range with increasing As (V) and
As (III) concentrations is evidence of inner-sphere surface complex (specific ion
sorption) formation (Figs. 20 and 21). This is where H3AsO and H03 2AsO for As
(III) and As (V) respective species form complexes directly with the coordination
environment of the LC surfaces [113]. Shifts in pHzpc and reversals of EM with
increasing ion concentration are both characteristics of inner-sphere sorption.
−4
75

Arsenic (V) also forms an inner-sphere surface complex with Awaso LC
indicated by shifts in pHzpc to lower pH values with increasing arsenic concentration
(Fig. 24). Arsenic (III) however, does show a shift in pHzpc when Awaso LC is
initially treated with 0.035mM As (III), but no shift is observed in pHzpc as As (III)
concentrations increase (Fig 23). This behavior suggests either inner-sphere or outer-
sphere surface complexation. Although shifts in pHzpc and reversal of EM with
increasing ionic concentration are considered characteristics of specific ion sorption;
lack of shift in PZC cannot be used to infer an outer-sphere adsorption mechanism
since inner-sphere surface complex formation is not necessarily accompanied by a
change in the mineral surface charge [15].
The results of the EM measurements indicate that both As (III) and As (V)
form inner-sphere complexes on Prestea LC. Arsenic (III) forms either inner-sphere
or outer-sphere sorption mechanisms on Awaso LC because the lack of shift in pHzpc
does not necessarily indicate outer-sphere surface complexation. Arsenic (V) sorption
on Awaso LC forms inner-sphere complexes due to shifts in pHzpc and reversals of
EM with increasing ion concentration. Goldberg et al. [15] also report a similar
results where there was no shift in pHzpc to increasingly lower pH values with
increasing arsenic concentration when As (III) sorbed on amorphous aluminum oxide.
They suggested either inner-sphere or outer-sphere surface complexation occurred
between As (III) and amorphous aluminum oxide.
4.5 Effect of pH on Prestea and Awaso LC
76
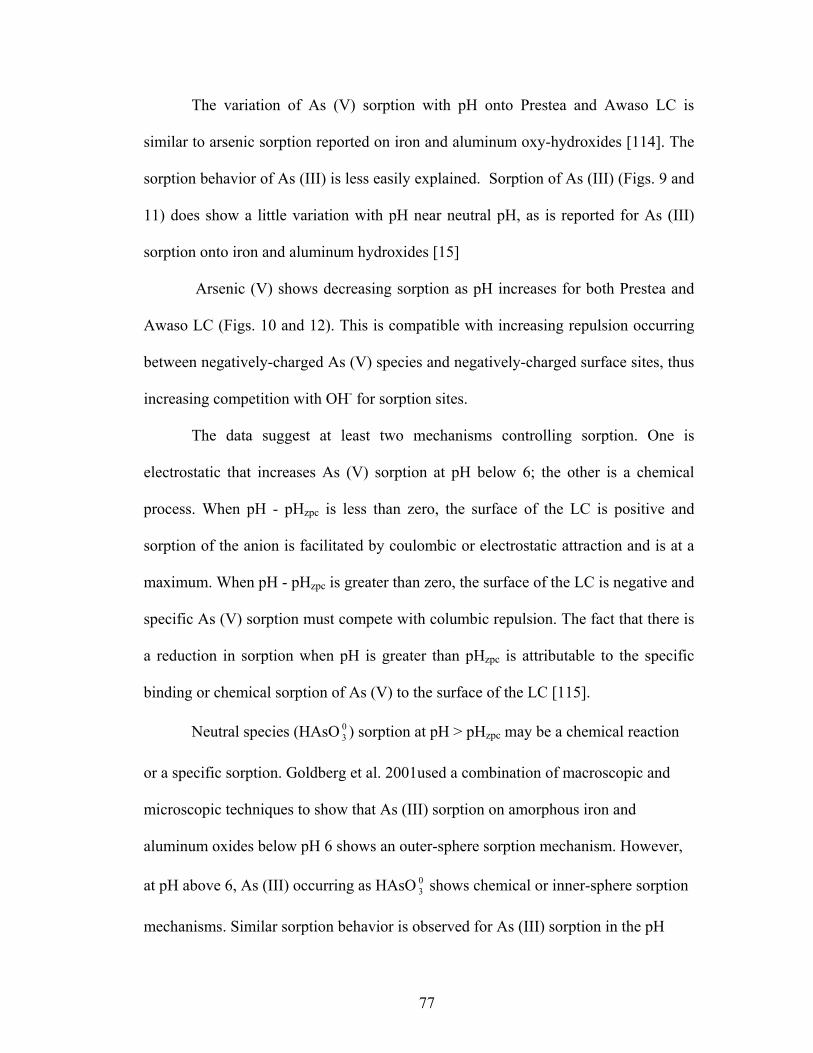
The variation of As (V) sorption with pH onto Prestea and Awaso LC is
similar to arsenic sorption reported on iron and aluminum oxy-hydroxides [114]. The
sorption behavior of As (III) is less easily explained. Sorption of As (III) (Figs. 9 and
11) does show a little variation with pH near neutral pH, as is reported for As (III)
sorption onto iron and aluminum hydroxides [15]
Arsenic (V) shows decreasing sorption as pH increases for both Prestea and
Awaso LC (Figs. 10 and 12). This is compatible with increasing repulsion occurring
between negatively-charged As (V) species and negatively-charged surface sites, thus
increasing competition with OH- for sorption sites.
The data suggest at least two mechanisms controlling sorption. One is
electrostatic that increases As (V) sorption at pH below 6; the other is a chemical
process. When pH - pHzpc is less than zero, the surface of the LC is positive and
sorption of the anion is facilitated by coulombic or electrostatic attraction and is at a
maximum. When pH - pHzpc is greater than zero, the surface of the LC is negative and
specific As (V) sorption must compete with columbic repulsion. The fact that there is
a reduction in sorption when pH is greater than pHzpc is attributable to the specific
binding or chemical sorption of As (V) to the surface of the LC [115].
Neutral species (HAsO ) sorption at pH > pH03 zpc may be a chemical reaction
or a specific sorption. Goldberg et al. 2001used a combination of macroscopic and
microscopic techniques to show that As (III) sorption on amorphous iron and
aluminum oxides below pH 6 shows an outer-sphere sorption mechanism. However,
at pH above 6, As (III) occurring as HAsO shows chemical or inner-sphere sorption
mechanisms. Similar sorption behavior is observed for As (III) sorption in the pH
03
77

range 7–7.6 onto activated alumina [116, 117] and onto iron-oxide coated sand [39].
Both iron and aluminum oxide present in the Prestea and Awaso laterite contribute to
As (III) sorption. In general LV sorption of As (III) is greater than iron or aluminum
oxides; it is not clear if the behavior observed is the result of several oxides acting
together or is an inherent property of oxides with several constituents.
The characteristic of LC removing As (III) better than As (V) at a high pH is
uncommon with commercially available media, which are mostly mixtures of iron
and aluminum oxides. These media show a drastic reduction in As (III) sorption at
solution pH > 9 [15, 85]. Goldberg and Johnson [15] show little change in As (III)
and As (V) sorption onto iron and aluminum oxide over the pH range of 4 to 6, but
sorption density of As (III) and As (V) shows a drastic reduction in pH > 8 solutions.
The fact that the Prestea and Awaso LC show no drastic change in sorption at pH > 8
shows that they are superior over the laboratory synthesized materials.
4.6 Effect of ionic strength on Prestea and Awaso LC
Arsenic (III) and As (V) sorption onto Prestea and Awaso LC at solution ionic
strength values of 0.001, 0.01, and 0.1 M NaCl is depicted in Figs. 9, 10, 11, and 12.
Arsenic (III) sorption on both Prestea and Awaso LC exhibits decreasing sorption
with increasing ionic strength (Figs. 9 and 11). This result indicates an outer-sphere
sorption mechanism [70, 118]. Hayes et al. [70] postulates that anion sorption, which
is markedly reduced by increasing ionic strength, is best modeled assuming that the
anion forms an outer-sphere (ion-pair) surface complex. Outer spherically bonded
surface complexes exhibit a marked effect on ionic strength, yielding distinctly
78
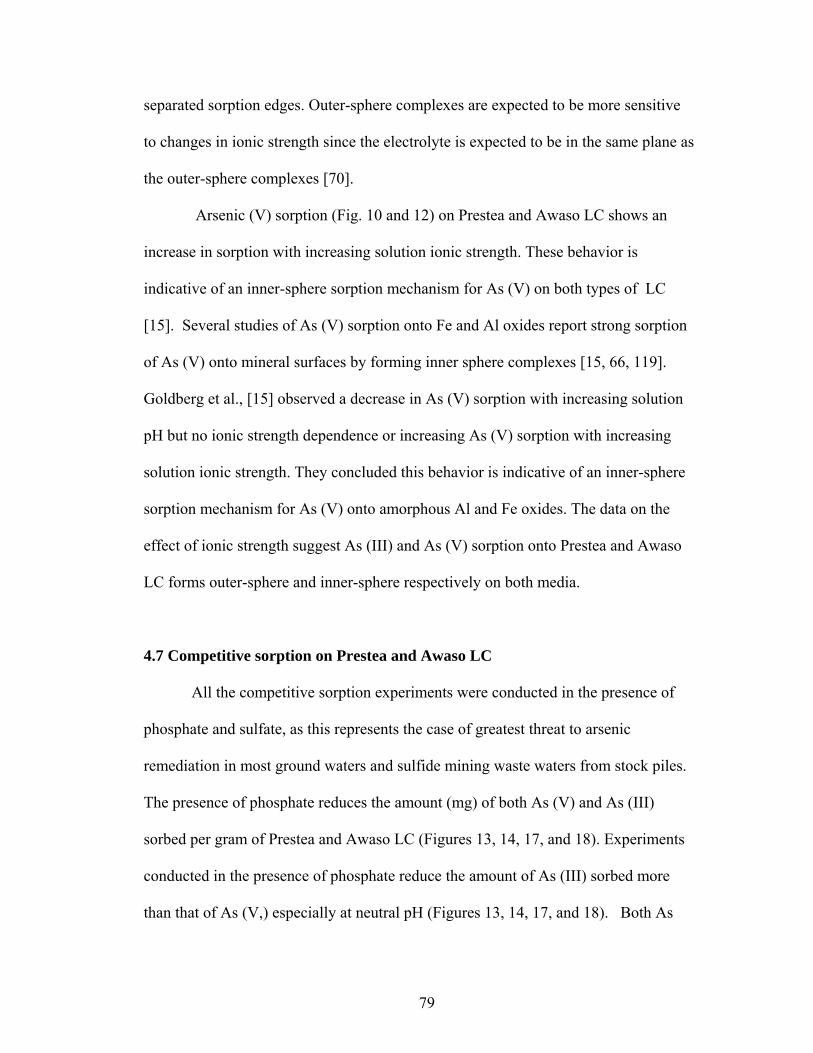
separated sorption edges. Outer-sphere complexes are expected to be more sensitive
to changes in ionic strength since the electrolyte is expected to be in the same plane as
the outer-sphere complexes [70].
Arsenic (V) sorption (Fig. 10 and 12) on Prestea and Awaso LC shows an
increase in sorption with increasing solution ionic strength. These behavior is
indicative of an inner-sphere sorption mechanism for As (V) on both types of LC
[15]. Several studies of As (V) sorption onto Fe and Al oxides report strong sorption
of As (V) onto mineral surfaces by forming inner sphere complexes [15, 66, 119].
Goldberg et al., [15] observed a decrease in As (V) sorption with increasing solution
pH but no ionic strength dependence or increasing As (V) sorption with increasing
solution ionic strength. They concluded this behavior is indicative of an inner-sphere
sorption mechanism for As (V) onto amorphous Al and Fe oxides. The data on the
effect of ionic strength suggest As (III) and As (V) sorption onto Prestea and Awaso
LC forms outer-sphere and inner-sphere respectively on both media.
4.7 Competitive sorption on Prestea and Awaso LC
All the competitive sorption experiments were conducted in the presence of
phosphate and sulfate, as this represents the case of greatest threat to arsenic
remediation in most ground waters and sulfide mining waste waters from stock piles.
The presence of phosphate reduces the amount (mg) of both As (V) and As (III)
sorbed per gram of Prestea and Awaso LC (Figures 13, 14, 17, and 18). Experiments
conducted in the presence of phosphate reduce the amount of As (III) sorbed more
than that of As (V,) especially at neutral pH (Figures 13, 14, 17, and 18). Both As
79
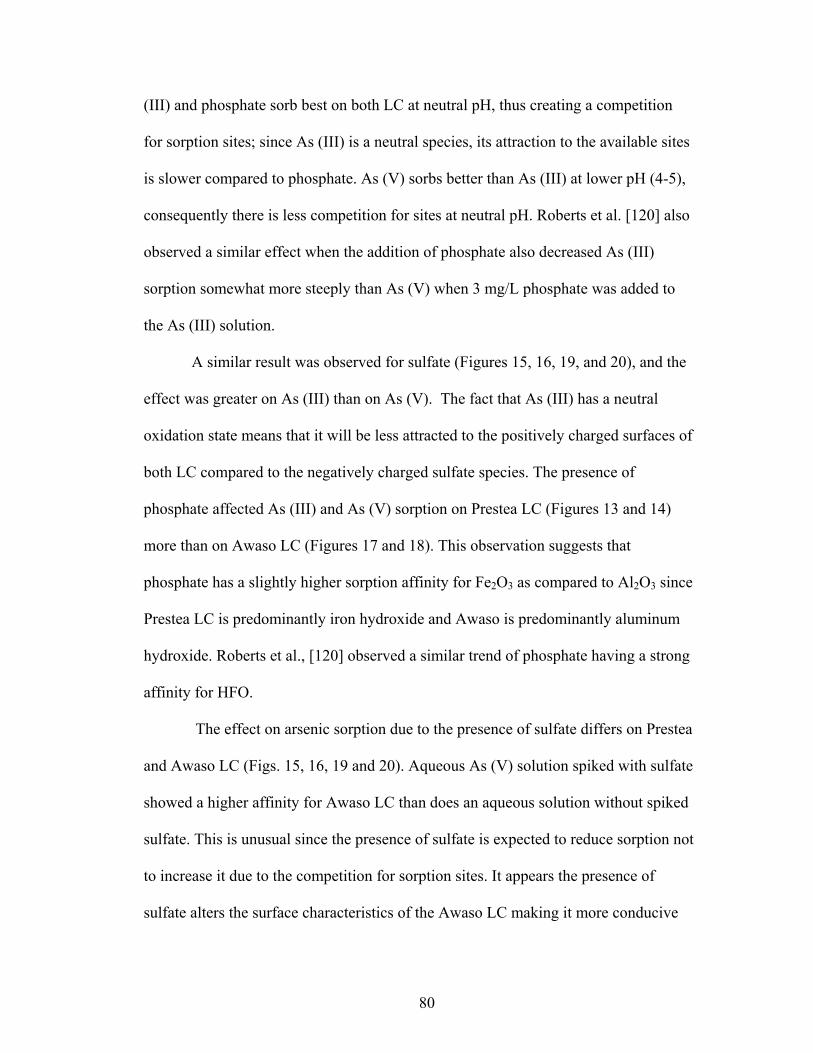
(III) and phosphate sorb best on both LC at neutral pH, thus creating a competition
for sorption sites; since As (III) is a neutral species, its attraction to the available sites
is slower compared to phosphate. As (V) sorbs better than As (III) at lower pH (4-5),
consequently there is less competition for sites at neutral pH. Roberts et al. [120] also
observed a similar effect when the addition of phosphate also decreased As (III)
sorption somewhat more steeply than As (V) when 3 mg/L phosphate was added to
the As (III) solution.
A similar result was observed for sulfate (Figures 15, 16, 19, and 20), and the
effect was greater on As (III) than on As (V). The fact that As (III) has a neutral
oxidation state means that it will be less attracted to the positively charged surfaces of
both LC compared to the negatively charged sulfate species. The presence of
phosphate affected As (III) and As (V) sorption on Prestea LC (Figures 13 and 14)
more than on Awaso LC (Figures 17 and 18). This observation suggests that
phosphate has a slightly higher sorption affinity for Fe2O3 as compared to Al2O3 since
Prestea LC is predominantly iron hydroxide and Awaso is predominantly aluminum
hydroxide. Roberts et al., [120] observed a similar trend of phosphate having a strong
affinity for HFO.
The effect on arsenic sorption due to the presence of sulfate differs on Prestea
and Awaso LC (Figs. 15, 16, 19 and 20). Aqueous As (V) solution spiked with sulfate
showed a higher affinity for Awaso LC than does an aqueous solution without spiked
sulfate. This is unusual since the presence of sulfate is expected to reduce sorption not
to increase it due to the competition for sorption sites. It appears the presence of
sulfate alters the surface characteristics of the Awaso LC making it more conducive
80

to As (V) sorption. Another possible explanation for this behavior is that when
sulfate-reducing bacteria are active, the sulfide produced reacts to precipitate As (V),
or co-precipitate it with iron or aluminum, leaving little As (V) in solution [121]. The
X-ray absorption near edge structures is needed to prove this hypothesis.
Zhang et al. [122] studied the effect of sulfate on As (V) removal from water
and realized that the presence of sulfate is found to be favorable for As (V) sorption.
However no explanation was given for that behavior.
The significant decrease in the arsenic removal (only As (III)) at high
phosphate and sulfate concentrations can be attributed to the ion shielding of the
effective charge of the LC and the consumption of the available binding sites of the
LC. The cumulative effect is an increase in the electric repulsion, the effective charge
of the LC, and the available binding sites of the LC surface [123]. As a result, greater
amounts of arsenic ions passed through the LC pores without sorbing, yielding lower
arsenic removal at high ion (phosphate and sulfate) concentrations. The high
phosphate concentration tested in this study, however, is very unlikely to occur in
drinking water and therefore may not cause problems.
4.8 Surface Complexation Models
The ATR- FTIR results indicate that both As (III) and As (V) form inner-
sphere surface complexes on Prestea and Awaso LC. I therefore modeled the surface
complexation of both types of laterite concretions applying the diffuse-layer model
since this model assumes sorption is by inner-sphere complex. The triple-layer model
was also used to test its suitability to model the sorption data since it inherently
81
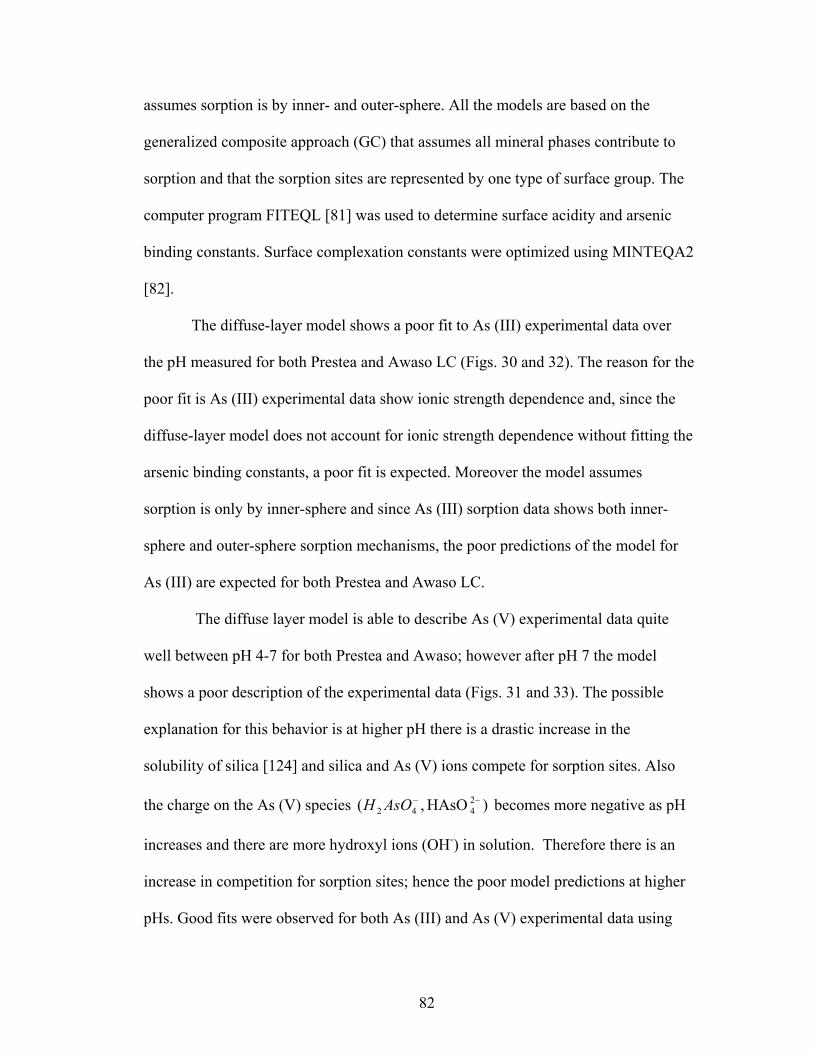
assumes sorption is by inner- and outer-sphere. All the models are based on the
generalized composite approach (GC) that assumes all mineral phases contribute to
sorption and that the sorption sites are represented by one type of surface group. The
computer program FITEQL [81] was used to determine surface acidity and arsenic
binding constants. Surface complexation constants were optimized using MINTEQA2
[82].
The diffuse-layer model shows a poor fit to As (III) experimental data over
the pH measured for both Prestea and Awaso LC (Figs. 30 and 32). The reason for the
poor fit is As (III) experimental data show ionic strength dependence and, since the
diffuse-layer model does not account for ionic strength dependence without fitting the
arsenic binding constants, a poor fit is expected. Moreover the model assumes
sorption is only by inner-sphere and since As (III) sorption data shows both inner-
sphere and outer-sphere sorption mechanisms, the poor predictions of the model for
As (III) are expected for both Prestea and Awaso LC.
The diffuse layer model is able to describe As (V) experimental data quite
well between pH 4-7 for both Prestea and Awaso; however after pH 7 the model
shows a poor description of the experimental data (Figs. 31 and 33). The possible
explanation for this behavior is at higher pH there is a drastic increase in the
solubility of silica [124] and silica and As (V) ions compete for sorption sites. Also
the charge on the As (V) species HAsO becomes more negative as pH
increases and there are more hydroxyl ions (OH
,( 42−AsOH )2
4−
-) in solution. Therefore there is an
increase in competition for sorption sites; hence the poor model predictions at higher
pHs. Good fits were observed for both As (III) and As (V) experimental data using
82
the diffuse-layer model only when the arsenic binding constants were optimized at
different measured ionic strengths (Figs. A 10-A 13). The reason for this behavior is
that the model inherently assumes sorption is only by inner-sphere complex and that
sorption is not affected by changes in ionic strength. The triple-layer model provided
a better fit in its description of As (III) sorption onto both Prestea and Awaso LC
without fitting the arsenic binding constants since the model inherently assumes
sorption is by both inner- and outer-sphere (Figs. 34 and 36). The general approach
was to determine the best fit to the sorption data at median ionic strength (eg. 0.01
M). Then using the best fit value, model computations were made for the other two
ionic strength values (0.1 M and 0.001 M).
The triple-layer model that unequivocally accounts for ionic strength
dependence is used to assess its ability to describe the data for As (III) and As (V) for
both Prestea and Awaso LC since they show ionic strength dependence from the
sorption experimental data (Figs. 34, 35, 36, and 37). The triple-layer model is
capable of providing some ionic strength dependence in its description of As (III) and
As (V) sorption data as the data indicates some ionic strength dependence. Also, As
(III) sorption data indicate both inner-sphere and outer-sphere sorption mechanisms
on both Prestea and Awaso LC and since the triple-layer model assumes both sorption
mechanisms, good model fits were obtained using the triple-layer model (Figs. 34, 35,
36, and 37). The intrinsic surface complexation constants for the sorption of Na+ and
Cl- from the background electrolyte were optimized to obtain ionic strength-
dependent model fits.
83

The inner- and outer-sphere sorption mechanisms used in the triple-layer
model for As (III) conforms to the pHzpc shifts, electrophoretic mobility
measurements, and sorption data since they all predicted both an inner-sphere or out-
sphere sorption mechanism for As (III) on both Prestea and Awaso LC.
The effect of changes in ionic strength on sorption of As (III) and As (V) on
Prestea and Awaso was modeled using both the diffuse- and the triple-layer model.
Arsenic (V) sorption, which is slightly affected by ionic strength, can be modeled
with both the diffuse-layer (Figs. 31 and 32) and the triple-layer models (Figs 35 and
37), although the triple-layer model gave a better fit at higher pHs than the diffuse-
layer model. However, As (III) sorption, which is markedly reduced by increasing
ionic strength, is best modeled using the triple-layer model.
4.9 Sorption mechanisms
Mechanisms dictating the observed increase in sorption with temperature may
include both an increase in pore size due to the breaking of some internal bonds near
the edge of the particles at higher temperatures [106-108, 125], as well as an increase
in the rate of diffusion of the adsorbate into the sorption sites [102]. Other possible
mechanisms include an increase in the activity of arsenic ions in solution and the
affinity of the ions for the surface or the charge and, therefore, the potential of the
surface [109]. I speculate that the above reasons may account for the increase in
sorption with a corresponding increase in temperature.
Macroscopic evidence shows that the sorption capacity is almost the same
irrespective of the size of the LC used in the sorption experiments, indicating that
84

chemisorption may be taking place on the laterite concretion surfaces and possibly
that there is ligand exchange between the adsorbed ions and the hydroxyl group on
LC mineral phases. The ionic size of the hydroxyl group on the surface of the LC
when in contact with water allows ligand exchange between the arsenic molecule and
the hydroxyl group, forming specific adsorbed complexes (inner-sphere
complexation).
Arsenic (III) sorption on both LCs exhibited decreasing sorption with
increasing ionic strength (Figs. 9 and 11). This result is indicative of an outer-sphere
sorption mechanism [70, 118]. Outer-sphere-bonded surface complexes exhibit a
marked effect on ionic strength, yielding distinctly separated sorption edges. Outer-
sphere complexes are expected to be more sensitive to changes in ionic strength since
the electrolyte is expected to be in the same plane as the outer-sphere complexes [70].
Arsenic (V) sorption on both Prestea and Awaso LCs, as represented in
Figures 10 and 12, decreases with increasing solution pH and exhibits either no ionic
strength dependence or increasing sorption with increasing solution ionic strength.
Both of these behaviors are indicative of an inner-sphere sorption mechanism [15].
The results of the EM measurements indicate that both As (III) and As (V)
form inner-sphere complexes on Prestea LC. The shift of pHzpc to a lower pH range
with increases in both As (V) and As (III) concentrations for Prestea LC is evidence
of inner-sphere complex (specific ion sorption) formation, where H3AsO and
H
03
2AsO for As (III) and As (V) species respectively form complexes directly with
the coordination environment of the LC surfaces [113]. Shifts in pHzpc and reversals
of EM with increasing ion concentration are characteristics of inner-sphere sorption.
−4
85
Arsenic (III) sorbs by both inner- and outer-sphere sorption mechanisms on Awaso
LC because there is an initial shift in pHzpc when the media is treated with 0.035mM
As (III). However, no shift in pHzpc is observed even with an increase in
concentration of As (III) from 0.035mM to 3.5mM on Awaso LC. This behavior
suggests either inner- or outer-sphere surface complexation since a lack of shift in
pHzpc does not necessarily mean the formation of outer-sphere surface complexes
[62, 126].
The ATR-FTIR analysis shows an increase in peak intensities and band shift
to lower wavelengths for both As (III) and As (V) on Prestea and Awaso LCs. The
presence of the peaks in the treated LC spectra that are not present in the untreated
sample is an indication of chemical bonding between the arsenic species and the
surface of the Prestea LC [63, 110]. The peak shift and the change in peak intensity
may be an indication of an inner-sphere sorption mechanism [15, 62, 63]. The peak
positions of the arsenic-treated samples (sorbed samples for both Prestea and Awaso
LC) (Figs. 26, 27, 28, and 29), are significantly different from those of the dissolved
arsenic species (Fig. 25), which can be attributed to sorption of the arsenic species. In
general, the spectra of both As (III) and As (V) sorbed onto the Prestea and Awaso
LCs are very different from those of arsenic aqueous solutions. This difference and
the lack of pH dependence on the positions of the vibrational modes indicate that
these modes are “protected” from changes in pH and indicate that these groups are
involved in direct complexation to the surfaces [15, 62]. Another line of evidence for
the mechanism of sorption that is converse to the ATR-FTIR spectra for dissolved
arsenic species is that a shift in band position was not observed in As (V) and As (III)
86

adsorbed spectra with changing pH (Figures 26, 27, 28, and 29). The lack of change
in band position at various pH values suggests that arsenic formed the same inner-
sphere surface complexes on both Prestea and Awaso LCs [71].
The model predictions from the triple-layer surface complexation illustrate a
good fit at all pHs measured for As (III) sorption onto both Prestea and Awaso LCs
(Figs. 34 and 36). Since As (III) sorption is markedly reduced by increasing ionic
strength, and the model accounts for ionic strength dependence. However, As (V)
sorption for both Prestea and Awaso LC can be modeled with both the diffuse-layer
(Figs 31 and 32) and the triple-layer model (Figs. 35 and 37), although the triple-layer
model gives a better fit at higher pHs than the diffuse layer model (Figs. 31, 33, 35,
and 37). The model results confirm the sorption data, which suggest As (III) sorption
is by inner-sphere and outer-sphere, but As (V) is by inner-sphere for both
concretions tested.
The sorption data, the pHzpc shifts, and the EM measurements indicate an
inner-sphere sorption mechanism for As (V) on both Prestea and Awaso LC. The
sorption data suggests that the As (III) sorption mechanism is outer-sphere for both
Prestea and Awaso LC; however, the pHzpc shifts and the EM measurements for As
(III) indicate an inner-sphere sorption mechanism on Prestea LC and both inner- and
outer-sphere sorption mechanisms for Awaso LC.
The ATR-FTIR data suggest an inner-sphere sorption mechanism for both As
(III) and As (V) on Prestea and Awaso LC. Apart from the sorption data indicating an
outer-sphere sorption mechanism for As (III) on both Prestea and Awaso LC, the EM
data and the ATR-FTIR data all indicate an inner-sphere sorption mechanism for both
87

As (III) and As (V) for the Prestea and Awaso concretions. The reason why there
exist differences in As (III) sorption mechanisms for the three methods is unknown. I
speculate that both sorption mechanisms (inner- and/or outer-sphere) might be at
work and both mechanisms are eminent depending on the arsenic concentration in the
aqueous solution. This also confirms that the two arsenic species not only behave
differently but that their affinity for metal oxide surfaces can also be different. A
summary of the sorption mechanisms is shown in Table A-36 in the appendix.
4.10 Comparing Prestea and Awaso LC
The sorption data from the Socorro pilot test site (Fig. A-2 and A-3) agrees
with laboratory studies (Tables 5 and 6) showing that Prestea LC has higher sorption
capacity than Awaso LC. There are several explanations for this difference. Studies
on pure element oxides [15, 127, 128] indicate arsenic has a higher affinity for iron
oxides than for aluminum oxides. Degree of crystalinity also affects arsenic sorption.
Dixit and Hering [20] show that the transformation of amorphous iron oxides to more
crystalline phases decreased the specific surface area and hence the site density of the
oxide. This transformation decreased the sorption capacity of the oxide.
The X-ray powder diffraction pattern for Prestea laterite concretions differs
from that of the Awaso laterite concretions. Prestea LC peaks are broader than Awaso
peaks. Peak broadening is attributed to small grain size or poor crystalinity [20].
Awaso LC sharper XRD peaks suggest a higher degree of crystalinity. Hence,
difference in degree of crystalinity may explain the differences in arsenic sorption.
The height of iron oxide mineral peaks in comparison to aluminum oxide peaks differ
88
as expected because of the composition differences. However, both concretions
exhibit the same mineral phases. The difference in sorption capacity between the two
LC maybe related to the difference in crystalinity. The single-point BET N2 sorption
isotherms indicate surface areas of 32m2/g and 18m2/g for Prestea and Awaso,
respectively. The higher specific surface area of the Prestea LC is compatible with it
having a smaller grain size compared to the Awaso LC.
The degree of lateritization estimated from the silica-sesquioxide (S-S) ratio
(SiO2/(Fe2O3 + Al2O3) indicates that both concretions can be described as laterites by
definition, since they both have S-S ratios far less than 1.33. It is not clear if the
higher silica in Prestea LC affects sorption. Study of several Prestea samples with
differing concentrations of silica would have to be done to quantify the effects of
silica on sorption. Since silica has a weak sorption capacity for metals, it is expected
that silica simply dilutes the arsenic-sorbing aluminum and iron oxides and
hydroxides. Thus, iron/aluminum ratio of a laterite and its maturity is more
important than the silica content so far as sorption is concerned.
Prestea LC, and by inference other high Fe/Al concretions, is more practical to
use for filtering especially in areas where the predominant arsenic species in aqueous
solution is As (III). Analysis of sorption mechanisms (Table A-36) indicates that As
(III) sorption on Awaso LC is controlled both by weak electrostatic forces and strong
covalent bonding. However, As (III) sorption on Prestea LC is predominantly
controlled by strong covalent bonding (specific ion adsorption). Thus, longer and
better sorption of arsenic is expected by use of high Fe/Al LC. In the practical
application of LC to rural Africa well water remediation it may not be possible to
89
determine As(III)/As(V) and local LC Fe/Al ratios. The good news from the studies
on the two end member composition LC is that all LC are expected to sorb both forms
of arsenic, but that Fe rich-LC will work somewhat better.
4.11 Low cost arsenic filter
The data above suggests that both Prestea and Awaso laterite concretions will
work for low-tech applications because both arsenic species sorb over a broad pH
range. No pretreatment is required for LC use, compared to high priced laboratory
synthesized materials [102, 129]. Arsenic (V) sorption on LC showed almost no ionic
strength dependence, indicating that it could be used to treat arsenic contaminated
drinking water with high amounts of dissolved salts without affecting the sorption
capacity. The sorption capacity of LC is at least 1.11 mg/g, which is a factor of one or
two below engineered materials consisting of iron, aluminum, and titanium oxides
[130] (see appendix Table A-3). This sorption capacity value of LC indicates that
significant sorption sites are available for specific sorption of both arsenic species.
The development of low-cost arsenic filters using LC is practical. The Prestea and
Awaso LC can both treat approximately 5000 bed volumes of 42µL As (V) Socorro
water to the maximum contamination limit of 10ppb (Figs. A-2 and A-3). The
treatment process cost, including materials for construction and maintenance, is
estimated to be US$0.003/100L contaminated water. It cost approximately $60.00 to
make a village filter for a village the size of 200-300 people. Water quality
assessment after treatment with both Prestea and Awaso LC indicates that none of the
trace elements tested are released from the adsorbent (Fig. A-4 toA-7). A Toxicity
90

Characterization Leaching Procedure (TCLP) [131] test also reveals that the used
adsorbent is not toxic (Table A-3 and A-4; Appendix 4.0).
The positive sorption temperature dependence will enhance sorption in
tropical climates, and more especially in areas where groundwater sources are related
to geothermal springs. The occurrence of high arsenic water is a problem in rural
communities with low capital income; hence the low-cost filter will be cost effective
and user friendly for them.
4.12 Ramifications
The positive temperature dependence on arsenic sorption shown by our
experiments helps explain the widespread occurrence of elevated arsenic
concentration in groundwater fluxing Tertiary volcanic rocks. Volcanic rocks are
commonly oxidized, which is best observed in pink to red felsic volcanics that were
white or gray when erupted [132, 133]. Geothermal waters active after intrusion and
eruption events are typically charged with mg/L concentrations of arsenic [11, 132,
134]. Arsenic is likely sorbed onto volcanic rock iron oxide minerals. If at a later
time, cooler groundwater fluxes through the same rocks, this arsenic will be leached
because of the decreased sorption at lower temperatures. Our data does not cover
temperatures >60°C, but suggests that the increase in sorption with temperature can
be extrapolated to 80°C or possibly 100°C. Hot springs 10’s of km’s from geothermal
centers indicate that larger volumes of rock in a geothermal system [132, 134] are
subjected to 100°C fluids.
91

CHAPTER 5
APPLICATIONS AND RECOMMENDATIONS FOR FUTURE WORK 5.1. Extension of Prestea and Awaso laterite concretion results to other laterite concretions.
Prestea and Awaso laterite concretions represent the end members of most
laterite concretions (Table A-37; Fig. A-14). Investigations of arsenic sorption onto
these two end members show that they filter arsenic from arsenic-bearing drinking
water. All other laterites whose mineralogical compositions fall within these two end
members, should filter arsenic from drinking water. Laterites from India [89] and Sri
Lanka [85] whose mineralogical composition (Table A-37) represents a mixture of
the two end members show that the natural medium (laterite) is capable of
remediating arsenic from drinking water. The results from this study and other studies
[85, 89, 93-96] indicate that laterite concretions work in filtering arsenic from
drinking water.
There are factors that increase or decrease arsenic sorption. For example
minerals such as titanium and manganese oxides are known to oxidize As (III) if
present to As (V) [89], which increases total arsenic sorption. Although there are
traces of manganese and titanium oxides in the laterites tested, they worked equally
well in sorbing both arsenic species. Soluble silica is known to inhibit arsenic
sorption, since it competes for sorption sites with the arsenic species [122]. Table A-
39 shows variable silica content in the laterites found in the world. Although the
effect of silica could not be quantified in this work, the results from this work show
92

that its effect was minimal. It turns out that silica has a stronger effect on laboratory
synthesized material than it does on the two laterite end members tested.
The crystalinity or amorphous nature of any laterite controls its specific
surface area and hence its sorption capacity. Dixit and Hering [20] show that the
transformation of amorphous iron oxides to more crystalline phases decreased the
specific surface area and hence site density of the iron oxide. This transformation
decreased the sorption capacity of the iron oxide. Although Prestea laterite is
amorphous (Fig. 2) while Awaso is crystalline (Fig. 3), they both sorbed arsenic well.
To decide whether or not any laterite found elsewhere in the world could be
used for arsenic remediation, the degree of lateritization should be estimated from the
silica-sesquioxide (S-S) ratio (SiO2/(Fe2O3 + Al2O3)). In this work silica
sesquioxide ratios indicated that both concretions can be described as laterites by
definition, since they both have S-S ratio less than 1.33. The implication to other
lateritic material is that if the S-S ratio is less than 1.33, then the material should be
able to remediate arsenic from arsenic-bearing drinking water.
A summary of the sorption mechanisms (Table A-36) indicates that As (III)
sorption on laterites whose predominant mineral phase is aluminum oxide is
controlled by both weak electrostatic forces and strong covalent bonding. Other
researchers [15, 61] who looked at the mechanism of arsenic sorption on pure (single
mineral phase) aluminum oxide also concluded that As (III) sorption is controlled by
both weak electrostatic forces and strong covalent bonding. However, Prestea LC
which is predominantly iron oxide shows that As (III) sorption is controlled by strong
covalent bonding (specific ion sorption). Goldberg and Johnson [15], Suarez [62], and
93
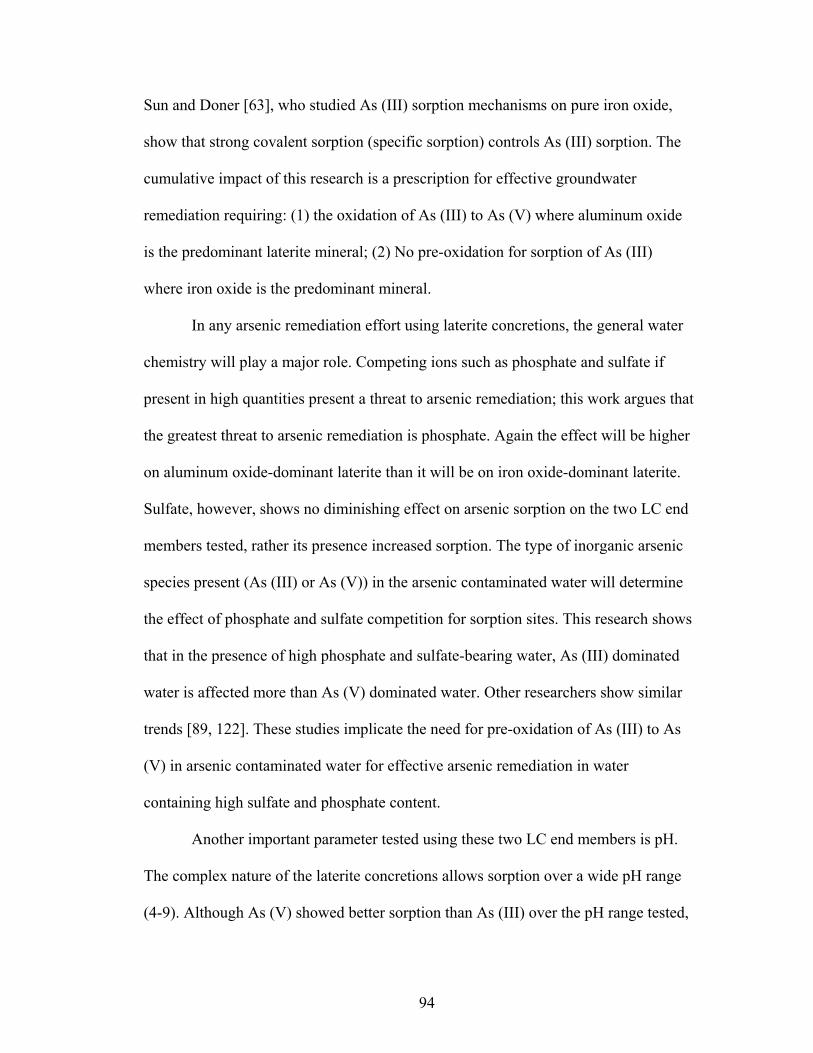
Sun and Doner [63], who studied As (III) sorption mechanisms on pure iron oxide,
show that strong covalent sorption (specific sorption) controls As (III) sorption. The
cumulative impact of this research is a prescription for effective groundwater
remediation requiring: (1) the oxidation of As (III) to As (V) where aluminum oxide
is the predominant laterite mineral; (2) No pre-oxidation for sorption of As (III)
where iron oxide is the predominant mineral.
In any arsenic remediation effort using laterite concretions, the general water
chemistry will play a major role. Competing ions such as phosphate and sulfate if
present in high quantities present a threat to arsenic remediation; this work argues that
the greatest threat to arsenic remediation is phosphate. Again the effect will be higher
on aluminum oxide-dominant laterite than it will be on iron oxide-dominant laterite.
Sulfate, however, shows no diminishing effect on arsenic sorption on the two LC end
members tested, rather its presence increased sorption. The type of inorganic arsenic
species present (As (III) or As (V)) in the arsenic contaminated water will determine
the effect of phosphate and sulfate competition for sorption sites. This research shows
that in the presence of high phosphate and sulfate-bearing water, As (III) dominated
water is affected more than As (V) dominated water. Other researchers show similar
trends [89, 122]. These studies implicate the need for pre-oxidation of As (III) to As
(V) in arsenic contaminated water for effective arsenic remediation in water
containing high sulfate and phosphate content.
Another important parameter tested using these two LC end members is pH.
The complex nature of the laterite concretions allows sorption over a wide pH range
(4-9). Although As (V) showed better sorption than As (III) over the pH range tested,
94
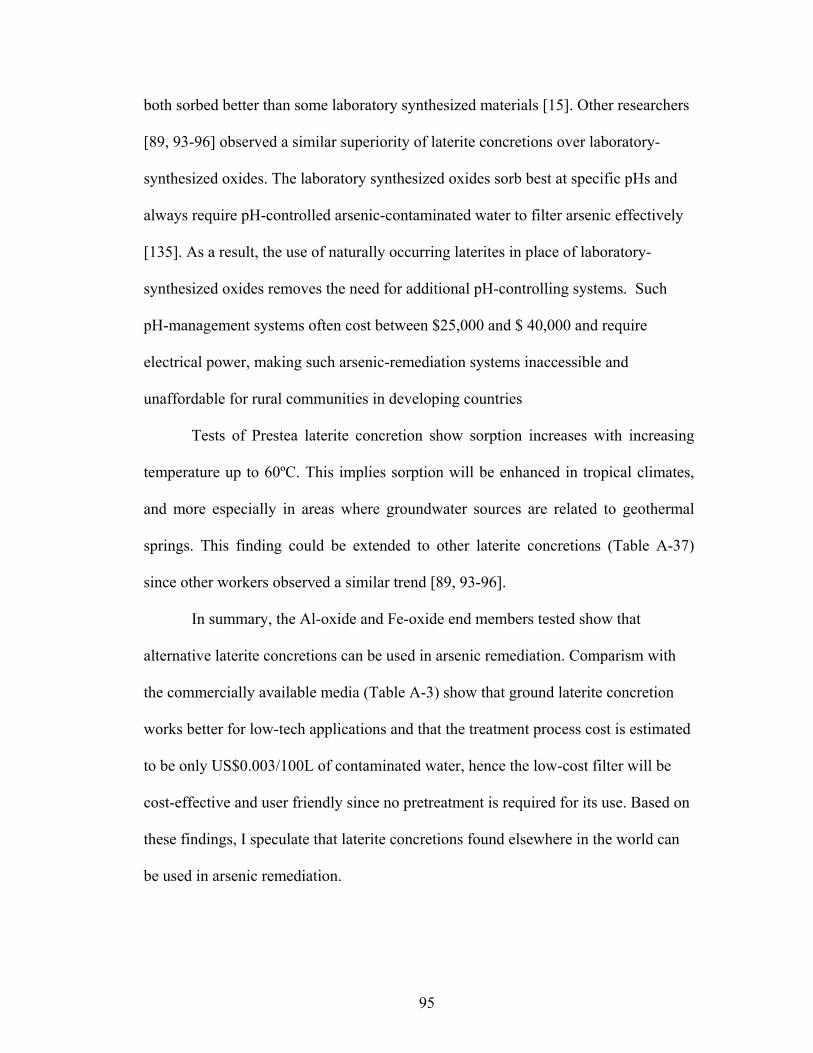
both sorbed better than some laboratory synthesized materials [15]. Other researchers
[89, 93-96] observed a similar superiority of laterite concretions over laboratory-
synthesized oxides. The laboratory synthesized oxides sorb best at specific pHs and
always require pH-controlled arsenic-contaminated water to filter arsenic effectively
[135]. As a result, the use of naturally occurring laterites in place of laboratory-
synthesized oxides removes the need for additional pH-controlling systems. Such
pH-management systems often cost between $25,000 and $ 40,000 and require
electrical power, making such arsenic-remediation systems inaccessible and
unaffordable for rural communities in developing countries
Tests of Prestea laterite concretion show sorption increases with increasing
temperature up to 60ºC. This implies sorption will be enhanced in tropical climates,
and more especially in areas where groundwater sources are related to geothermal
springs. This finding could be extended to other laterite concretions (Table A-37)
since other workers observed a similar trend [89, 93-96].
In summary, the Al-oxide and Fe-oxide end members tested show that
alternative laterite concretions can be used in arsenic remediation. Comparism with
the commercially available media (Table A-3) show that ground laterite concretion
works better for low-tech applications and that the treatment process cost is estimated
to be only US$0.003/100L of contaminated water, hence the low-cost filter will be
cost-effective and user friendly since no pretreatment is required for its use. Based on
these findings, I speculate that laterite concretions found elsewhere in the world can
be used in arsenic remediation.
95

5.2 Recommendations for future work
Experiments could be done to determine how laterite concretions can be
improved by simple treatments. Prestea and Awaso LC can treat up to 5000 bed
volumes of water contaminated with 42 ppb arsenic: this is comparable to some of the
commercial material available (Table A-3) [135]. Much can be done to improve the
sorption capacity of ground LC. Acid treatment and heat treatment of laterite
concretions can improve the sorption capacity of LC [102, 136]. Acid treatment with
HCl can remove salts that adversely affect the arsenic sorption [102, 136]. Sorption
capacity of Prestea and Awaso LC can also be increased by the addition of ferric
chloride or aluminum chloride as these could act as coatings on the silica found in
both laterite concretions [102].
Prestea and Awaso LC tested using Socorro and Sedillo springs water indicate
that trace element (chromium, copper, iron, lead, lithium, manganese, strontium,
silica, uranium and zinc) concentrations were reduced by 50-80 % (Figs. A-4-9),
illustrating the potential of arsenic sorbing media like Prestea and Awaso LC to
remove other toxic trace elements. Laboratory, pilot, and full-scale studies can be
carried out to determine which trace elements are sorbed by Prestea and Awaso LC.
Although the sorption data, EM measurements, and ATR-FTIR spectroscopy
data aided in determining the mechanisms of arsenic sorption onto LC, Extended X-
ray Absorption Fine Structure Studies (EXAFS) will further confirm the arsenic
sorption mechanisms. X-ray Absorption Near Edge Structure (XANES) work is also
needed to define the type and valence state of the arsenic species on the laterite
96
concretions after sorption (the detailed theory and application of ATR-FTIR, EXAFS
and XANES are presented in appendix 2.0).
This study has shown that arsenic sorption onto natural materials can be
described by surface complexation modeling. The next step is to incorporate these
sorption models into reactive transport models to predict the fate and transport of
contaminants in the subsurface. This has not been previously examined extensively
due to problems associated with the detailed characterization of natural materials.
97

CHAPTER 6 6.0 Conclusions. 1. The As (III) and As (V) sorption isotherm data best fit the Langmuir isotherm
model. The values of the “Gibbs free energy (∆G°)”, “standard enthalpy (∆H°)”,
and “standard entropy changes (∆S°)” calculated establish favorable sorption of
arsenic onto laterite concretion over a wide range of temperatures.
2. The sorption capacity for As (III) and As (V) increases with temperature, with As
(III) showing a greater increase than As (V) at all temperatures. As (V) sorption
shows little change with increasing solution pH, while As (III) sorption increases
with increasing solution pH to a sorption maximum around pH 8 and decreases
with any further increase in solution pH.
3. Ionic strength experiments show that an inner-sphere sorption mechanism is
responsible for As (V) sorption on both Prestea and Awaso LC, while As (III)
sorption is by an outer-sphere mechanism on both concretions.
4. Electrophoretic mobility measurement results indicate that both As (III) and As
(V) form inner-sphere complexes on Prestea LC, while As (III) sorption on
Awaso is by both inner- and outer-sphere and As (V) is by inner-sphere.
5. The ATR-FTIR data indicate an inner-sphere surface complex sorption
mechanism for As (III) and As (V) for Prestea. However, As (III) sorption on
Awaso shows both inner-sphere and outer-sphere sorption mechanisms, while As
(V) shows an inner-sphere sorption mechanism.
6. Arsenic (III) sorption onto both Prestea and Awaso, which is markedly reduced
by increasing ionic strength, is best modeled using the triple-layer model. While
98
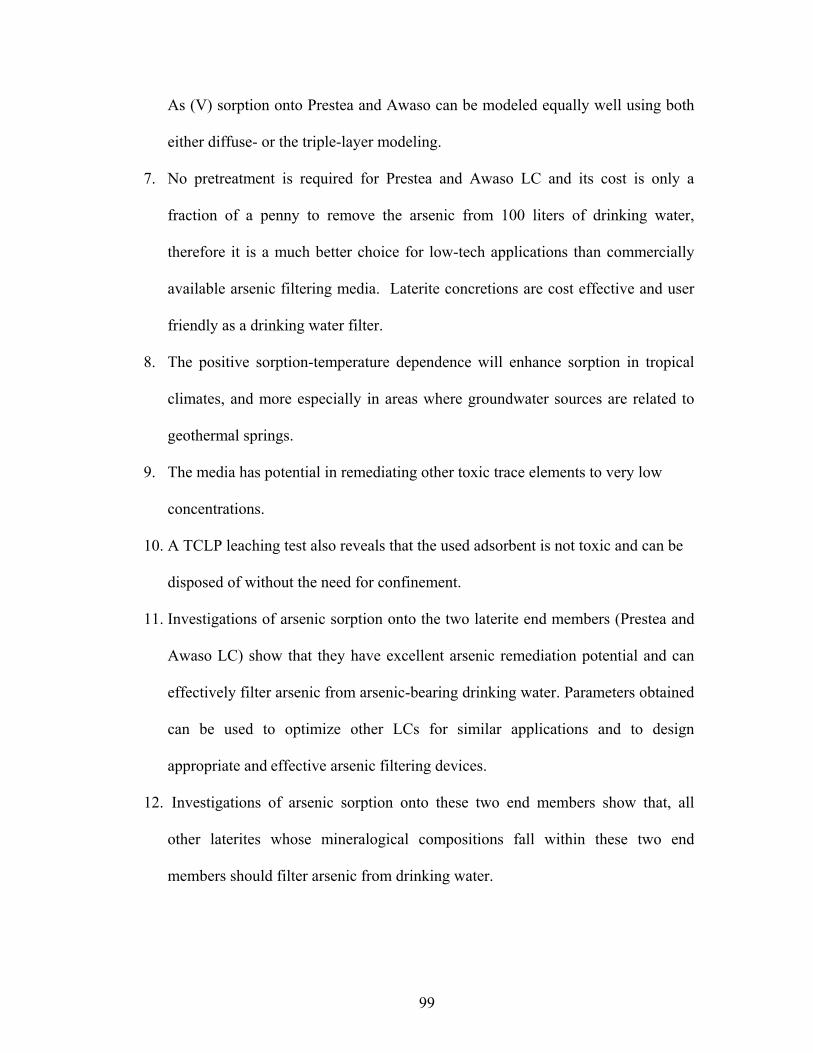
As (V) sorption onto Prestea and Awaso can be modeled equally well using both
either diffuse- or the triple-layer modeling.
7. No pretreatment is required for Prestea and Awaso LC and its cost is only a
fraction of a penny to remove the arsenic from 100 liters of drinking water,
therefore it is a much better choice for low-tech applications than commercially
available arsenic filtering media. Laterite concretions are cost effective and user
friendly as a drinking water filter.
8. The positive sorption-temperature dependence will enhance sorption in tropical
climates, and more especially in areas where groundwater sources are related to
geothermal springs.
9. The media has potential in remediating other toxic trace elements to very low
concentrations.
10. A TCLP leaching test also reveals that the used adsorbent is not toxic and can be
disposed of without the need for confinement.
11. Investigations of arsenic sorption onto the two laterite end members (Prestea and
Awaso LC) show that they have excellent arsenic remediation potential and can
effectively filter arsenic from arsenic-bearing drinking water. Parameters obtained
can be used to optimize other LCs for similar applications and to design
appropriate and effective arsenic filtering devices.
12. Investigations of arsenic sorption onto these two end members show that, all
other laterites whose mineralogical compositions fall within these two end
members should filter arsenic from drinking water.
99
References Cited 1. Frankenberger, W.T., ed. Environmental chemistry of arsenic. Books in soils,
plants, and the environment. 2002, Marcel Dekker: New York. xiii, 391. 2. Pinon-Miramontes, M., R.G. Bautista-Margulis, and A. Perez-Hernandez,
Removal of arsenic and fluoride from drinking water with cake alum and a polymeric anionic flocculent. Fluoride, 2003. 36(2): p. 122-128.
3. USEPA, Capital Costs of Arsenic Removal Technologies: U.S. EPA Arsenic Removal Technology Demonstration Program Round 1 (EPA, 2004b). EPA, Editor. 2004.
4. Schellmann, W., GEOCHEMICAL DIFFERENTIATION IN LATERITE AND BAUXITE FORMATION. Catena, 1994. 21(2-3): p. 131-143.
5. Bourman, R.P. and C.D. Ollier, A critique of the Schellmann definition and classification of 'laterite'. Catena, 2002. 47(2): p. 117-131.
6. Mazumder, D.N.G., et al., Bronchiectasis in persons with skin lesions resulting from arsenic in drinking water. Epidemiology, 2005. 16(6): p. 760-765.
7. Science, N.A.o. Arsenic in Drinking Water. 1999. Washington, D.C.: National Academy Press.
8. Hsieh, L.L., et al., ARSENIC-RELATED BOWENS-DISEASE AND PARAQUAT-RELATED SKIN CANCEROUS LESIONS SHOW NO DETECTABLE RAS AND P53 GENE ALTERATIONS. Cancer Letters, 1994. 86(1): p. 59-65.
9. Miller, G.P., Surface Complexation Modeling of Arsenic in Natural and Sediment Systems, in Earth and Environmantal Science. 2001, New Mexico Tech: Socorro. p. 118.
10. WHO, Guidelines for drinking water quality, 2nd ed.; Geneva, Switzerland, . 1993. 11. Smedley, P.L. and D.G. Kinniburgh, A review of the source, behaviour and
distribution of arsenic in natural waters. Applied Geochemistry, 2001. 17(5): p. 517-568.
12. National Research Council (U.S.). Subcommittee on Arsenic in Drinking Water. and National Research Council (U.S.). Division on Earth and Life Studies., Arsenic in drinking water : 2001 update. 2001, Washington, D.C.: National Academy Press. xiv, 225.
13. Duker, A.A., A. Stein, and M. Hale, A statistical model for spatial patterns of Buruli ulcer in the Amansie West district, Ghana. International Journal of Applied Earth Observation and Geoinformation, 2006. 8(2): p. 126-136.
14. WHO, Arsenic, Geneva. Environmental Health Criteria, 2001. 224. 15. Goldberg, S. and C.T. Johnston, Mechanisms of arsenic adsorption on
amorphous oxides evaluated using macroscopic measurements, vibrational spectroscopy, and surface complexation modeling. Journal of Colloid and Interface Science, 2001. 234(1): p. 204-216.
16. Schreiber, M.E., J.A. Simo, and P.G. Freiberg, Stratigraphic and geochemical controls on naturally occurring arsenic in groundwater, eastern Wisconsin, USA. Hydrogeology Journal, 2000. 8(2): p. 161-176.
100
17. Chen, H.W., et al., Arsenic treatment considerations. Journal American Water Works Association, 1999. 91(3): p. 74-85.
18. Welch, A.H., et al., Arsenic in ground water of the United States: Occurrence and geochemistry. Ground Water, 2000. 38(4): p. 589-604.
19. Masscheleyn, P.H., R.D. Delaune, and W.H. Patrick, EFFECT OF REDOX POTENTIAL AND PH ON ARSENIC SPECIATION AND SOLUBILITY IN A CONTAMINATED SOIL. Environmental Science & Technology, 1991. 25(8): p. 1414-1419.
20. Dixit, S. and J.G. Hering, Comparison of arsenic(V) and arsenic(III) sorption onto iron oxide minerals: Implications for arsenic mobility. Environmental Science & Technology, 2003. 37(18): p. 4182-4189.
21. Martell, A.E.e., al.,, NIST critically selected stability constants of metals complexes, U.d.o.C.N.I.o.S.a.T.S.r.d. program, Editor. 2001, NIST.
22. Cummings, D.E., et al., Arsenic mobilization by the dissimilatory Fe(III)-reducing bacterium Shewanella alga BrY. Environmental Science & Technology, 1999. 33(5): p. 723-729.
23. Ahmann, D., et al., Microbial mobilization of arsenic from sediments of the Aberjona Watershed. Environmental Science & Technology, 1997. 31(10): p. 2923-2930.
24. Cummings, D.E., et al., Arsenic mobilization by the dissimilatory Fe(III)-reducing bacterium Shewanella alga BrY. Environmental Science & Technology, ES & T, 1999. 33(5): p. 723-729.
25. Macur, R.E., et al., Microbial populations associated with the reduction and enhanced mobilization of arsenic in mine tailings. Environmental Science and Technology, 2001. 35(18): p. 3676-3682.
26. Masscheleyn, P.H., R.D. Delaune, and W.H. Patrick, ARSENIC AND SELENIUM CHEMISTRY AS AFFECTED BY SEDIMENT REDOX POTENTIAL AND PH. Journal of Environmental Quality, 1991. 20(3): p. 522-527.
27. Nickson, R.T., et al., Mechanism of arsenic release to groundwater, Bangladesh and West Bengal. Applied Geochemistry, 2000. 15(4): p. 403-413.
28. Nickson, R., et al., Arsenic poisoning of Bangladesh groundwater. Nature, 1998. 395(6700): p. 338-338.
29. Violante, A., et al., Coprecipitation of arsenate with metal oxides: Nature, mineralogy, and reactivity of aluminum precipitates. Environmental Science & Technology, 2006. 40(16): p. 4961-4967.
30. Tokunaga, S., S. Yokoyama, and S.A. Wasay, Removal of arsenic(III) and arsenic(V) ions from aqueous solutions with lanthanum(III) salt and comparison with aluminum(III), calcium(II), and iron(III) salts. Water Environment Research, 1999. 71(3): p. 299-306.
31. Liu, R.P., et al., Silicate hindering in situ formed ferric hydroxide precipitation: Inhibiting arsenic removal from water. Environmental Engineering Science, 2007. 24(5): p. 707-715.
101
32. Thirunavukkarasu, O.S., T. Viraraghavan, and K.S. Subramanian, Arsenic removal from drinking water using granular ferric hydroxide. Water Sa, 2003. 29(2): p. 161-170.
33. Herbel, M. and S. Fendorf, Transformation and transport of arsenic within ferric hydroxide coated sands upon dissimilatory reducing bacterial activity, in Advances in Arsenic Research. 2005, AMER CHEMICAL SOC: 1155 SIXTEENTH ST NW, WASHINGTON, DC 20036 USA. p. 77-90.
34. Hering, J.G., et al., Arsenic removal by ferric chloride. Journal American Water Works Association, 1996. 88(4): p. 155-167.
35. Wickramasinghe, S.R., et al., Arsenic removal by coagulation and filtration: comparison of groundwaters from the United States and Bangladesh. Desalination, 2004. 169(3): p. 231-244.
36. Thirunavkukkarasu, O.S., T. Viraraghavan, and K.S. Subramanian, Removal of arsenic in drinking water by iron oxide-coated sand and ferrihydrite - Batch studies. Water Quality Research Journal of Canada, 2001. 36(1): p. 55-70.
37. Vaishya, R.C. and S.K. Gupta, Modeling arsenic(V) removal from water by sulfate modified iron-oxide coated sand (SMIOCS). Separation Science and Technology, 2004. 39(3): p. 645-666.
38. Thirunavukkarasu, O.S., T. Viraraghavan, and K.S. Subramanian, Arsenic removal from drinking water using iron oxide-coated sand. Water Air and Soil Pollution, 2003. 142(1-4): p. 95-111.
39. Gupta, V.K., V.K. Saini, and N. Jain, Adsorption of As(III) from aqueous solutions by iron oxide-coated sand. Journal of Colloid and Interface Science, 2005. 288(1): p. 55-60.
40. Ning, R.Y., Arsenic removal by reverse osmosis. Desalination, 2002. 143(3): p. 237-241.
41. Pawlak, Z., S. Zak, and L. Zablocki, Removal of hazardous metals from groundwater by reverse osmosis. Polish Journal of Environmental Studies, 2006. 15(4): p. 579-583.
42. Lin, T.F., et al., Removal of arsenic from groundwater using point-of-use reverse osmosis and distilling devices. Environmental Technology, 2002. 23(7): p. 781-790.
43. George, C.M., et al., Reverse osmosis filter use and high arsenic levels in private well water. Archives of Environmental & Occupational Health, 2006. 61(4): p. 171-175.
44. Frank, P., D.A. Clifford, and Water Engineering Research Laboratory., Arsenic (III) oxidation and removal from drinking water. 1986, Cincinnati, OH: U.S. Environmental Protection Agency Water Engineering Research Laboratory. 9.
45. Manna, B.R., et al., eds. Removal of arsenic from groundwater using crystalline hydrous ferric oxide (CHFO). 2003, Canadian Association on Water Quality, Toronto, ON, Canada. 193-210.
46. Zaw, M. and M.T. Emett, Arsenic removal from water using advanced oxidation processes. Toxicology Letters, 2002. 133(1): p. 113-118.
102
47. Gregor, J., Arsenic removal during conventional aluminium-based drinking-water treatment. Water Research, 2001. 35(7): p. 1659-1664.
48. Bourman, R.P., MODES OF FERRICRETE GENESIS - EVIDENCE FROM SOUTHEASTERN AUSTRALIA. Zeitschrift fur Geomorphologie, 1993. 37(1): p. 77-101.
49. Schellmann, W., A new definition of laterite. Natural Resources and Development
1983. 18 p. 7-21. 50. EYLES. V. A, B., F. A, Brindley, G. W, ed. The composition and origin of
Antrim Laterites and Bauxites. 1952, Government of Northern Ireland: Leeds. 51. De Medina, J., Laterites and their application to higth way construction,
based on the text of a course at the Brazilian highway Research institute. Brazilian highway Research institute
1972. 52. Persons, B.S., Laterites, Genesis, Location, Use. Plenum press, New York
London, 1970. 53. Mountain, M.J. The location of pedogenetic materials using aerial
photographs, with some examples from south Africa. in Proceedings of 4th regional conference for Africa on soil mechanics and foundation engineering. 1967. Cape Town South Africa.
54. Wright, J.B., ed. Geology and mineral resources of West Africa / J.B. Wright, editor and principal author ; with contributions from D.A. Hastings, W.B. Jones, and H.R. Williams. 1985, Allen & Unwin, : London [England] ; Boston :.
55. Kesse, G.O., The Mineral and Rock Resources of Ghana. 1985: A A Balkema, Rotterdam, The Netherlands. 610 pp.
56. Bhattacharyya, R., et al., eds. Technique for arsenic removal from groundwater utilizing geological options; an innovative low cost remediation. 2002, International Association of Hydrological Sciences, International. 391-396.
57. Jana, J., et al., eds. A renovative low cost technique for removal of arsenic from groundwater; integrated field study. 2000, A. A. Balkema, Rotterdam, Netherlands. 255-256.
58. Ndur, S.A. and D.I. Norman, Sorption of arsenic onto laterite; a new technology for filtering rural water. Geological Society of America, 2003 annual meeting Abstracts with Programs - Geological Society of America, 2003. 35(6): p. 413.
59. Sahu, S.J., et al., Use of low cost natural material for removal of arsenic in ground water. Proceedings of the Eighty sixth annual session of the Indian Science Congress Association Proceedings of the Indian Science Congress, 1999. 86(4): p. 211.
60. Davis, J.A. and D.B. Kent, Surface Complexation Modeling in Aqueous Geochemistry. . Reviews
in Mineralogy: Mineral-Water Interface Geochemistry,, ed. M.F. Hochella, Jr., White, A. F., Ribbe, P. H. (Eds). . Vol. 23. 1990: Mineralogical
Society of America, Washington D.C. pp. 177-248 (Chapter 5).
103
61. Arai, Y., E.J. Elzinga, and D.L. Sparks, X-ray absorption spectroscopic investigation of arsenite and arsenate adsorption at the aluminum oxide-water interface. Journal of Colloid and Interface Science, 2001. 235(1): p. 80-88.
62. Suarez, D.L., S. Goldberg, and C.M. Su, evaluation of oxyanion adsorption mechanisms on oxides using FTIR spectroscopy and electrophoritic mobility. In Mineral-water interfacial reactions-Kinetics and Mechanisms. ACS Symposium series 219, ed. D.L. Sparks and G. T.J. 1998, Washinton D.C: American chemical society.
63. Sun, X.H. and H.E. Doner, An investigation of arsenate and arsenite bonding structures on goethite by FTIR. Soil Science, 1996. 161(12): p. 865-872.
64. Manning, B.A., S.E. Fendorf, and S. Goldberg, Surface structures and stability of arsenic(III) on goethite: Spectroscopic evidence for inner-sphere complexes. Environmental Science & Technology, 1998. 32(16): p. 2383-2388.
65. Ladeira, A.C.Q., et al., Mechanism of anion retention from EXAFS and density functional calculations: Arsenic (V) adsorbed on gibbsite. Geochimica et Cosmochimica Acta, 2001. 65(8): p. 1211-1217.
66. O'Reilly, S.E., D.G. Strawn, and D.L. Sparks, Residence time effects on arsenate adsorption/desorption mechanisms on goethite. Soil Science Society of America Journal, 2001. 65(1): p. 67-77.
67. Waychunas, G.A., et al., EXAFS STUDY OF THE GEOMETRY OF ZN(II) SURFACE COMPLEXES SORBED ON FERRIHYDRITE. Abstracts of Papers of the American Chemical Society, 1993. 205: p. 83-GEOC.
68. Fendorf, S., et al., Arsenate and chromate retention mechanisms on goethite .1. Surface structure. Environmental Science & Technology, 1997. 31(2): p. 315-320.
69. Arai, Y., D.L. Sparks, and J.A. Davis, Arsenate adsorption mechanisms at the allophane - water interface. Environmental Science & Technology, 2005. 39(8): p. 2537-2544.
70. Hayes, K.F., C. Papelis, and J.O. Leckie, MODELING IONIC-STRENGTH EFFECTS ON ANION ADSORPTION AT HYDROUS OXIDE SOLUTION INTERFACES. Journal of Colloid and Interface Science, 1988. 125(2): p. 717-726.
71. Pena, M., et al., Adsorption mechanism of arsenic on nanocrystalline titanium dioxide. Environmental Science & Technology, 2006. 40(4): p. 1257-1262.
72. Hunter, R.J., Zeta potential in colloid science. 1981, N.Y: Academic press New York.
73. WAYCHUNAS, G.A., et al., SURFACE-CHEMISTRY OF FERRIHYDRITE .1. EXAFS STUDIES OF THE GEOMETRY OF COPRECIPITATED AND ADSORBED ARSENATE. Geochimica et Cosmochimica Acta, 1993. 57(10): p. 2251-2269.
74. Waychunas, G.A., J.A. Davis, and C.C. Fuller, GEOMETRY OF SORBED ARSENATE ON FERRIHYDRITE AND CRYSTALLINE FEOOH - REEVALUATION OF EXAFS RESULTS AND TOPOLOGICAL FACTORS IN PREDICTING SORBATE GEOMETRY, AND EVIDENCE FOR
104

MONODENTATE COMPLEXES. Geochimica et Cosmochimica Acta, 1995. 59(17): p. 3655-3661.
75. Waychunas, G.A., et al., Wide angle X-ray scattering (WAXS) study of ''two-line'' ferrihydrite structure: Effect of arsenate sorption and counterion variation and comparison with EXAFS results. Geochimica et Cosmochimica Acta, 1996. 60(10): p. 1765-1781.
76. Sun, X.H. and H.E. Doner, Adsorption and oxidation of arsenite on goethite. Soil Science, 1998. 163(4): p. 278-287.
77. Davis, J.A., et al., Application of the surface complexation concept to complex mineral assemblages. Environmental Science & Technology, 1998. 32(19): p. 2820-2828.
78. Services, J.S.T., Materials data, Jade version 3.1, XRD pattern processing and identification software. 1998, J S Technical Services: Aubrey, TX.
79. Partey, F.P., et al., Arsenic sorption onto laterite iron concretions from Prestea, Ghana. . Geological Society of America Abstracts with Programs, 2005. 37(7).
80. Ndur, containment of Arsenic in sansu Tailings Dam, Obuasi Ghana. PhD Dissertation, 2007.
81. Herbelin, A.L. and J.C. Westall, FITEQL 4.0 - A Computer Program for Determination of Chemical Equilibrium Constants From Experimental Data. Report
99-01,, 1999(Department of Chemistry, Oregon State University, Corvallis.). 82. Allison, J.D., D.S. Brown, and K.J. Novo-Gradac., MINTEQA2/ PRODEFA2, A geochemical assessment model for environmental systems: Ver. 3.0 Users manual. Environ. Res. Lab.,. 1991, USEPA: Athens, GE. 83. Altundogan, H.S., et al., Arsenic removal from aqueous solutions by
adsorption on red mud. Waste Management, 2000. 20(8): p. 761-767. 84. Gupta, V.K., Equilibrium uptake, sorption dynamics, process development,
and column operations for the removal of copper and nickel from aqueous solution and wastewater using activated slag, a low-cost adsorbent. Industrial & Engineering Chemistry Research, 1998. 37(1): p. 192-202.
85. Vithanage, M., et al., Mechanistic modeling of arsenic retention on natural red earth in simulated environmental systems. Journal of Colloid and Interface Science, 2006. 294(2): p. 265-272.
86. Manning, B.A. and S. Goldberg, Adsorption and stability of arsenic(III) at the clay mineral-water interface. Environmental Science & Technology, 1997. 31(7): p. 2005-2011.
87. Lin, T.F. and J.K. Wu, Adsorption of arsenite and arsenate within activated alumina grains: Equilibrium and kinetics. Water Research, 2001. 35(8): p. 2049-2057.
88. Clifford, D.A., C.-C. Lin, and Risk Reduction Engineering Laboratory (U.S.), Arsenic (III) and arsenic (V) removal from drinking water in San Ysidro, New Mexico
project summary. 1991, Cincinnati, OH: U.S. Environmental Protection Agency Risk Reduction Engineering Laboratory. 1 v.
89. Maiti, A., et al., Adsorption of arsenite using natural laterite as adsorbent. Separation and Purification Technology, 2007. 55(3): p. 350-359.
105
90. Feng, X.H., et al., Arsenite oxidation by three types of manganese oxides. Journal of Environmental Sciences-China, 2006. 18(2): p. 292-298.
91. Power, L.E., Y. Arai, and D.L. Sparks, Zinc adsorption effects on arsenite oxidation kinetics at the birnessite-water interface. Environmental Science & Technology, 2005. 39(1): p. 181-187.
92. Pena, M.E., et al., Adsorption of As(V) and As(III) by nanocrystalline titanium dioxide. Water Research, 2005. 39(11): p. 2327-2337.
93. Maji, S.K., A. Pal, and T. Pal, Arsenic removal from aqueous solutions by adsorption on laterite soil. Journal of Environmental Science and Health Part A-Toxic/Hazardous Substances & Environmental Engineering, 2007. 42(4): p. 453-462.
94. Maji, S.K., et al., Sorption kinetics of arsenic on laterite soil in aqueous medium. Journal of Environmental Science and Health Part A-Toxic/Hazardous Substances & Environmental Engineering, 2007. 42(7): p. 989-996.
95. Maji, S.K., et al., Modeling and fixed bed column adsorption of As(V) on laterite soil. Journal of Environmental Science and Health Part A-Toxic/Hazardous Substances & Environmental Engineering, 2007. 42(11): p. 1585-1593.
96. Maji, S.K., et al., Modeling and fixed bed column adsorption of As(III) on laterite soil. Separation and Purification Technology, 2007. 56(3): p. 284-290.
97. Raven, K.P., A. Jain, and R.H. Loeppert, Arsenite and arsenate adsorption on ferrihydrite: Kinetics, equilibrium, and adsorption envelopes. Environmental Science & Technology, 1998. 32(3): p. 344-349.
98. Jain, A. and R.H. Loeppert, Effect of competing anions on the adsorption of arsenate and arsenite by ferrihydrite. Journal of Environmental Quality, 2000. 29(5): p. 1422-1430.
99. Pierce, M.L. and C.B. Moore, ADSORPTION OF ARSENITE AND ARSENATE ON AMORPHOUS IRON HYDROXIDE. Water Research, 1982. 16(7): p. 1247-1253.
100. Wilkie, J.A. and J.G. Hering, Adsorption of arsenic onto hydrous ferric oxide: Effects of adsorbate/adsorbent ratios and co-occurring solutes. Colloids and Surfaces A-Physicochemical and Engineering Aspects, 1996. 107: p. 97-110.
101. Zeng, L., Arsenic adsorption from aqueous solutions on an Fe(III)-Si binary oxide adsorbent. Water Quality Research Journal of Canada, 2004. 39(3): p. 267-275.
102. Genc-Fuhrman, H., J.C. Tjell, and D. McConchie, Adsorption of arsenic from water using activated neutralized red mud. Environmental Science & Technology, 2004. 38(8): p. 2428-2434.
103. Manna, B.R., et al., Removal of arsenic from groundwater using crystalline hydrous ferric oxide (CHFO). Water Quality Research Journal of Canada, 2003. 38(1): p. 193-210.
104. Axe, L. and P.R. Anderson, Experimental and theoretical diffusivities of Cd and Sr in hydrous ferric oxide. Journal of Colloid and Interface Science, 1997. 185(2): p. 436-448.
106

105. Pandey, P.K., et al., Arsenic contamination of the environment; a new perspective from central-east India. Environment International, 2003. 28(4): p. 235-245.
106. Bye, G.C., M. McEvoy, and M.A. Malati, ADSORPTION OF COPPER(II) IONS FROM AQUEOUS-SOLUTION BY 5 SILICA SAMPLES. Journal of Chemical Technology and Biotechnology, 1982. 32(8): p. 781-789.
107. Yadava, K.P., B.S. Tyagi, and V.N. Singh, REMOVAL OF ARSENIC(III) FROM AQUEOUS-SOLUTION BY CHINA-CLAY. Environmental Technology Letters, 1988. 9(11): p. 1233-1244.
108. Low, K.S., C.K. Lee, and S.G. Tan, Sorption of trivalent chromium from tannery waste by moss. Environmental Technology, 1997. 18(4): p. 449-454.
109. Barrow, N.J., A BRIEF DISCUSSION ON THE EFFECT OF TEMPERATURE ON THE REACTION OF INORGANIC-IONS WITH SOIL. Journal of Soil Science, 1992. 43(1): p. 37-45.
110. Lumsdon, D.G., et al., NEW INFRARED BAND ASSIGNMENTS FOR THE ARSENATE ION ADSORBED ON SYNTHETIC GOETHITE (ALPHA-FEOOH). Journal of Soil Science, 1984. 35(3): p. 381-386.
111. Wijnja, H. and C.P. Schulthess, Vibrational spectroscopy study of selenate and sulfate adsorption mechanisms on Fe and Al (hydr)oxide surfaces. Journal of Colloid and Interface Science, 2000. 229(1): p. 286-297.
112. Myneni, S.C.B., et al., Vibrational spectroscopy of functional group chemistry and arsenate coordination in ettringite. Geochimica et Cosmochimica Acta, 1998. 62(21-22): p. 3499-3514.
113. Hunter, R.J., ed. Colloid science. A series of monographs., ed. R.J. Hunter. 1981, Academic Press: San Diego.
114. Aggett, J., C. Camp, and G. Ridall, eds. Mobility of arsenic in the sediments of the Waikato hydro lakes. 1981, University of Waikato, Hamilton, New Zealand. 301-311.
115. Anderson, M.A., J.F. Ferguson, and J. Gavis, ARSENATE ADSORPTION ON AMORPHOUS ALUMINUM HYDROXIDE. Journal of Colloid and Interface Science, 1976. 54(3): p. 391-399.
116. Kuriakose, S., T.S. Singh, and K.K. Pant, Adsorption of As(III) from aqueous solution onto iron oxide impregnated activated alumina. Water Quality Research Journal of Canada, 2004. 39(3): p. 258-266.
117. Singh, T.S. and K.K. Pant, Equilibrium, kinetics and thermodynamic studies for adsorption of As(III) on activated alumina. Separation and Purification Technology, 2004. 36(2): p. 139-147.
118. He, L.M., et al., Ionic strength effects on sulfate and phosphate adsorption on gamma-alumina and kaolinite: Triple-layer model. Soil Science Society of America Journal, 1997. 61(3): p. 784-793.
119. Fuller, C.C., J.A. DAVIS, and G.A. WAYCHUNAS, SURFACE-CHEMISTRY OF FERRIHYDRITE .2. KINETICS OF ARSENATE ADSORPTION AND COPRECIPITATION. Geochimica et Cosmochimica Acta, 1993. 57(10): p. 2271-2282.
107
120. Roberts, L.C., et al., Arsenic removal with iron(II) and iron(III) waters with high silicate and phosphate concentrations. Environmental Science & Technology, 2004. 38(1): p. 307-315.
121. Kirk, M.F., et al., Bacterial sulfate reduction limits natural arsenic contamination in groundwater. Geology, 2004. 32(11): p. 953-956.
122. Zhang, W., et al., Arsenic removal from contaminated water by natural iron ores. Minerals Engineering, 2004. 17(4): p. 517-524.
123. Ergican, E., H. Gecol, and A. Fuchs, The effect of co-occurring inorganic solutes on the removal of arsenic (V) from water using cationic surfactant micelles and an ultrafiltration membrane. Desalination, 2005. 181(1-3): p. 9-26.
124. Drever, ed. The Geochemistry of Natural Waters. 2002, Prentice Hall: New Jersey. 199.
125. Panday, K.K., G. Prasad, and V.N. Singh, COPPER(II) REMOVAL FROM AQUEOUS-SOLUTIONS BY FLY-ASH. Water Research, 1985. 19(7): p. 869-873.
126. Stumm, W., chemistry of the solid-water interface. 1992, New york: John Wiley and sons.
127. Jeong, Y., et al., Evaluation of iron oxide and aluminum oxide as potential arsenic(V) adsorbents. Chemical Engineering and Processing, 2007. 46(10): p. 1030-1039.
128. Jeong, Y.R., et al., Effect of competing solutes on arsenic(V) adsorption using iron and aluminum oxides. Journal of Environmental Sciences-China, 2007. 19(8): p. 910-919.
129. Genc-Fuhrman, H., H. Bregnhoj, and D. McConchie, Arsenate removal from water using sand-red mud columns. Water Research, 2005. 39(13): p. 2944-2954.
130. Malynda Aragon, M.D.S., Randy Everett, Alicia Aragon, William Holub, Jr, and J.W.a.B. Dwyer, Pilot Tests of Adsorptive Media Arsenic Treatment Technologies in the Arsenic Water
Technology Partnership. 2006, Sandia National Labs: socorro. 131. U.S. Environmental Protection Agency (USEPA), Federal Register, 40 CFR, Part 261, USEPA, Washington DC, USEPA, Editor. 1996, USEPA. 132. Criaud, A. and C. Fouillac, THE DISTRIBUTION OF ARSENIC(III) AND
ARSENIC(V) IN GEOTHERMAL WATERS - EXAMPLES FROM THE MASSIF CENTRAL OF FRANCE, THE ISLAND OF DOMINICA IN THE LEEWARD ISLANDS OF THE CARIBBEAN, THE VALLES CALDERA OF NEW-MEXICO, UNITED-STATES, AND SOUTHWEST BULGARIA. Chemical Geology, 1989. 76(3-4): p. 259-269.
133. Webster-Brown, J.G. and V. Lane, Modeling seasonal arsenic behavior in the Waikato River, New Zealand, in Advances in Arsenic Research. 2005, AMER CHEMICAL SOC: 1155 SIXTEENTH ST NW, WASHINGTON, DC 20036 USA. p. 253-266.
134. Webster, J.G., Nordstrom, D.K.,, ed. Geothermal arsenic. In: Arsenic in Ground Water, Geochemistry and Occurrence. 2003, Kluwer Academic Publishers: Dordrecht,. pp. 101–125.
108
135. Aragon, M.M.D.S., Everett R, Aragon A, Holub W, Wright J and Dwyer B, Pilot Tests of Adsorptive Media Arsenic Treatment Technologies in the Arsenic Water Technology Partnership. 2006, Sandia National Laboratory: socorro. p. p1-14.
136. Altundogan, H.S., et al., Arsenic adsorption from aqueous solutions by activated red mud. Waste Management, 2002. 22(3): p. 357-363.
137. Sparks, D.L., ed. Environmental soil chemistry. 2 ed. Vol. 2. 2003, Academic press. 352.
138. Brown, G.E., Parks, G.A., AND O'Day, P.A, ed. sorption at the mineral-water interface: macroscopic and microscopic perspective. mineral surfaces, ed. D.V.a.R.A.D. Pattricks. 1995, Chapman and Hall: London.
139. Hair, M.L., Infra red spectroscopy in surface chemistry. 1967, New York: Marcel Dekker.
140. Brown, E.G., Spectroscopic studies of chemisorption reaction mechanisms at oxide-water interfaces. In reviews in Mineralogy. Review in mineralogy, ed. M.F. Hochella, Jr., White, A. F., Ribbe, P. H. (Eds). Vol. 23. 1990, Washinton DC: Mineralogical society fo America. 335pp.
141. Beebe, T.P., J.E. Crowell, and J.T. Yates, INFRARED SPECTROSCOPIC STUDY OF THE ROTATION OF CHEMISORBED METHOXY SPECIES ON AN ALUMINA SURFACE. Journal of Chemical Physics, 1990. 92(8): p. 5119-5126.
142. Echterhoff, R. and E. Knozinger, FTIR SPECTROSCOPIC CHARACTERIZATION OF THE ADSORPTION AND DESORPTION OF AMMONIA ON MGO SURFACES. Surface Science, 1990. 230(1-3): p. 237-244.
143. Matsumoto, A. and K. Kaneko, GRADUAL CHANGE IN THE CHEMISORBED NO SPECIES ON ALPHA-FEOOH. Langmuir, 1990. 6(6): p. 1202-1204.
144. Tejedortejedor, M.I. and M.A. Anderson, INSITU ATTENUATED TOTAL REFLECTION FOURIER-TRANSFORM INFRARED STUDIES OF THE GOETHITE (ALPHA-FEOOH)-AQUEOUS SOLUTION INTERFACE. Langmuir, 1986. 2(2): p. 203-210.
145. Chang, S.C. and M.J. Weaver, INSITU INFRARED-SPECTROSCOPY OF CO ADSORBED AT ORDERED PT(110)-AQUEOUS INTERFACES. Surface Science, 1990. 230(1-3): p. 222-236.
146. Hochella, M.F., Jr., and A.F. White, Mineral-Water Interface Geochemistry: An Overview. Reviews in Mineralogy: Mineral-Water Interface Geochemistry,. Vol. 23. 1990: Mineralogical Society of America, Washington D.C.,. pp. 1-15 (Chapter 1).
147. Davis, J.A., R.O. James, and J.O. Leckie, SURFACE IONIZATION AND COMPLEXATION AT OXIDE-WATER INTERFACE .1. COMPUTATION OF ELECTRICAL DOUBLE-LAYER PROPERTIES IN SIMPLE ELECTROLYTES. Journal of Colloid and Interface Science, 1978. 63(3): p. 480-499.
148. Davis, J.A. and J.O. Leckie, SURFACE IONIZATION AND COMPLEXATION AT OXIDE-WATER INTERFACE .2. SURFACE
109

PROPERTIES OF AMORPHOUS IRON OXYHYDROXIDE AND ADSORPTION OF METAL-IONS. Journal of Colloid and Interface Science, 1978. 67(1): p. 90-107.
149. Dzomback, D.A. and Morel, Surface complexation modeling: Hydrous ferric Oxide. 1990: John Wiley and Sons New york
150. Goldberg, S., Ion Adsorbtion At the Soil Particle-Solution Interface: Modeling and Mechanisms. Structure and Surface Reactions of Soil Particles,, ed. P.M. and
Huang. 1998, New York: Wiley and Sons, New York. 151. Davis, J.A. and J.O. Leckie, SURFACE IONIZATION AND
COMPLEXATION AT OXIDE-WATER INTERFACE. Abstracts of Papers of the American Chemical Society, 1978. 176(SEP): p. 49-49.
152. Meng, X.G. and R.D. Letterman, MODELING ION ADSORPTION ON ALUMINUM HYDROXIDE MODIFIED SILICA. Environmental Science & Technology, 1993. 27(9): p. 1924-1929.
153. Hiemstra, T. and W.H. Van Riemsdijk, Surface structural ion adsorption modeling of competitive binding of oxyanions by metal (hydr)oxides. Journal of Colloid and Interface Science, 1999. 210(1): p. 182-193.
154. Hiemstra, T. and W.H. VanRiemsdijk, A surface structural approach to ion adsorption: The charge distribution (CD) model. Journal of Colloid and Interface Science, 1996. 179(2): p. 488-508.
155. Sposito, G., ON THE SURFACE COMPLEXATION MODEL OF THE OXIDE-AQUEOUS SOLUTION INTERFACE. Journal of Colloid and Interface Science, 1983. 91(2): p. 329-340.
156. Westall, J. and H. Hohl, COMPARISON OF ELECTROSTATIC MODELS FOR THE OXIDE-SOLUTION INTERFACE. Advances in Colloid and Interface Science, 1980. 12(4): p. 265-294.
157. Pauling, L., The principles determining the structure of complex ionic crystal. J. Am. Chem. Soc, 1929. 51: p. 1010-1026.
158. Genc-Fuhrman, H., J.C. Tjell, and D. McConchie, Increasing the arsenate adsorption capacity of neutralized red mud (Bauxsol). Journal of Colloid and Interface Science, 2004. 271(2): p. 313-320.
110

Appendix. 1.0 Application of Prestea and Awaso LC at the Socorro Pilot project
The ultimate goal of this project is to use laterite concretions from both
Prestea and Awaso to develop an effective and inexpensive means of water
purification system for communities that cost less and is easy to maintain, and
produced drinking water of high quality. A pilot scale study was conducted in
collaboration with Sandia National Laboratories with both Prestea and Awaso LC, to
assess its promise in a point-of-use treatment unit. The study was performed at the
Socorro drinking water treatment site (Socorro springs).
Socorro springs is located off Evergreen Road in Socorro, NM. Socorro and
Sedillo springs supply continuous water to the Springs Site. These sources are spring
boxes located in the foothills west of the City of Socorro, approximately three-
quarters of a mile to the southwest at an elevation approximately fifty feet above the
Springs Site. Water from both springs is mixed slightly down gradient of the spring
boxes, followed by a shut-off valve. Below the shut-off valve, an eight-inch,
subsurface, carbon steel line delivers via gravity the approximately 540 gpm, average
35°C water to the chlorination building where the water is disinfected and oxidized
using chlorine gas injection just prior to storage in the Springs Site Storage Tank
[135]. A photograph of the design is shown in Figure A-1. Crushed laterite
concretions sized to 1.18 mm were loaded into columns provided by Sandia
National Labs at the Socorro pilot test site.
Grab water samples from were collected from the feed at this site for
laboratory analyses and treated (effluent through laterite). Field parameters measured
111
are shown in Table A-1 and Table A-2. The equipment characterization, field test
design, and field operational procedures are documented in a bulletin produced by the
Sandia Arsenic Water Treatment Program [135]. The feed and effluent water were
analyzed for arsenic in the New Mexico Bureau of Geology and Mineral Resources
(NMBGMR) Chemistry Laboratory at New Mexico Tech in Socorro. Separate
samples were collected for major and trace element analysis. The testing period was
for one month starting April 4 and ending on April 30, 2007. The results of arsenic
removed per bed volume for Prestea and Awaso LC are presented in Figures A-2 and
A-3, respectively. Both the Prestea and the Awaso LC could treat approximately
5000 bed volumes of 42µg/L As (V) Socorro water to the maximum contamination
limit of 10 ppb. Laboratory sorption experiment shows that Prestea LC can sorb As
(V) better than Awaso LC (Table 5 and 6), however the pilot test shows they sorb As
(V) (Socorro springs is As (V) dominated) about the same. Reasons for the observed
pattern are unknown. Table A-3 shows the results from the pilot scale test in bed
volumes of water that can be treated with the various media tested to 10 ppb MCL.
The results are comparable to other laboratory synthesized materials tested at the site.
Although most of the media (description of other media tested is shown in Table A-5)
could treat 2-3 times more arsenic contaminated water to 10 ppb MCL than the LCs
tested, they cost 100 times more than the cost of LC. In fact the LC did even better
than one of the laboratory synthesized materials (La-DE). These results confirm that
the sorption capacity experiments I conducted show that Prestea and Awaso laterite
concretions have excellent arsenic remediation potential for drinking water.
112
2.0. SPECTROSCOPIC THEORY AND APPLICATIONS
Recent developments in spectroscopic studies offer the opportunity to increase
understanding of oxy-anion surface speciation and binding. This understanding is
essential to the proper use of mechanistic sorption models, such as the diffuse -layer
and triple-layer models. Among current spectroscopic methods X-ray Absorption
Spectroscopy (XAS) (extended x-ray absorption fine structure spectroscopy (EXAFS)
and x-ray absorption near edge structure (XANES)) have received the most attention,
however other methods such as Infra Red (IR) spectroscopy have been used
extensively in recent years to understand oxy-anion surface speciation and binding
mechanisms [15, 62, 63, 112].
Synchrotron-based XAS can be used to study most elements in solid, liquid or
gaseous states at concentrations ranging from parts per millions to pure elements. The
high intensity of synchrotron radiation allows the study of very small (µg) or dilute
(milli-molar, mM) samples and experimental conditions of high or low temperature or
pressure and controlled atmospheres, including the presence of fluids such as water.
X-ray Absorption Spectroscopy is an element specific, bulk method giving
information about the average local structure and composition environment about the
absorbing atom. It can be used to study compositionally complex materials such as
natural materials [60].
X-ray absorption experiments that result in spectrums consist of exposing a
sample to an incident monochromatic beam of synchrotron x-rays scanned over a
range of energies below and above the absorption edge (K, L, M) of the element of
interest [137]. In the x-ray range of 0.5 to 100 keV, photoelectron production
113

dominates and causes x-ray attenuation by matter. When the energy of the incident x-
ray beam (hv) is less than the binding energy (Eb) of a core electron on the element of
interest, absorption is minimal. However, when hv = Eb, electron transitions to
unoccupied bound energy levels arise, contributing to the main absorption edge and
causing features below the main edge, referred to as the pre-edge portion of the
spectrum. As hv increases beyond Eb, electrons can be ejected to unbound levels and
stay in the vicinity of the absorber for a short time with excess kinetic energy. In the
energy region extending from just above to about 50eV above Eb (the absorption
edge), electrons are multiplied and scattered among neighboring atoms, which
produces the XANES portion of the spectrum [138]. Fingerprint information such as
oxidation states can be gleaned from this portion of the x-ray absorption spectrum.
When hv is about 50 to 1000 eV above Eb and the absorption edge, electrons are
ejected from the absorber, singly- or multiply-scattered from first- or second-
neighbor atoms back to the absorber, and they leave the vicinity of the absorber
creating the EXAFS portion of the spectrum. Analyses of the EXAFS spectrum
provide information on bond distance, coordination number, and next nearest
neighbor [138]
The application of IR spectroscopy to the study of soil chemical processes and
reaction has made a significant contribution to the development of new investigation
techniques. Infra Red spectroscopy now far exceeds classical chemical analysis and is
applied successfully to study sorption processes of inorganic and organic soil
components [139]. It is one of the oldest and most sensitive methods used to study
hydroxide groups and water molecules on oxide surfaces [140]. Fourier Infra Red
114
Spectroscopy (FTIR) can provide information on vibrational states of molecules
sorbed to surfaces which allow different molecules to be “fingerprinted”. In addition,
Fourier Transform Infra-Red spectroscopy provides improved signal-to-noise ratios
relative to conventional dispersive Infra Red methods. The reason being all the
radiation passes through the sample and the entire spectrum of wavelength is detected
at once, resulting in a greatly reduced time for spectrum collection, thus allowing
dynamic (time resolved) studies [140]. Although the application of FTIR
spectroscopy to surfaces are mostly concerned with characterization of gas phase
molecules [141-143], it is also used to characterize the solid-liquid interface [144]
and sorbed molecules at the solid-liquid interface [145].
Fourier Transform Infra-Red spectroscopic studies reveal a clear
understanding of arsenic sorption mechanisms on single mineral phases [15, 62, 63,
112]. Goldberg and Johnson [2001] show that the mechanisms of arsenic sorption to
aluminum and iron oxide surfaces based on the FTIR spectroscopy, sorption, and
electrophoretic mobility measurements are as follows: As (V) forms inner-sphere
surface complexes on both amorphous Al and Fe oxide, while As (III) forms both
inner- and outer-sphere surface complexes on amorphous Fe oxide and outer-sphere
surface complexes on amorphous Al oxide.
In this study, FTIR spectroscopic was combined with surface complexation
modeling to investigate the position of As-O stretching bands for both As (V) and As
(III) and their variation with pH instead of extended x-ray absorption fine structure
spectroscopy (EXAFS) for two reasons: (1) Although EXAFS is considered to
provide definitive information on inner-sphere bonding and is suitable for
115

determining the mode of attachment to the surface (mono-dentate, bidentate,
binuclear), it does not resolve questions of surface speciation since it is not sensitive
to H atoms. In addition, examination of the same system by different researchers in
some instances resulted in different conclusions [62]; (2) The use of extended x-ray
absorption fine structure spectroscopy in this work required a synchrotron radiation
source; since there are only two such facilities in United States of America, waiting
time and the complexity surrounding the use of such a facility did not allow the use of
EXAFS. Moreover FTIR is available on the New Mexico Tech campus, so that is
what I used.
3.0. Surface complexation theory
Numerous chemical reactions control the composition of water in contact with
soils, sediments, and rocks. Elements and compounds are leached from the rocks
while changing conditions can cause the precipitation of new solids. Included in these
reactions are ion exchange and surface complexation processes. In natural systems,
hydrous metal oxides are the most common minerals participating in surface
complexation reactions. In surface complexation, ions are drawn near and held at the
mineral surface by electrostatic forces. When there is no water molecule present
between the ion and the ligand on the mineral surface they form what is known as
inner-sphere complexes. On the other, hand when a water molecule is positioned
between the ion and the ligand an outer-sphere complex is formed [146].
Numerous mathematical approaches [147, 148] are used to describe sorption
equilibrium behavior. Sorption isotherms are used to calculate metal water-solid
116
partitioning distribution coefficients. However, field studies revealed problems in the
application of sorption isotherms to calculate partition coefficients (the Kd approach).
The SC (surface complexation) approach is superior to the Kd approach in modeling
oxy-anion sorption because it extends the ion association of aqueous solutions to
include chemical surface species [60, 146, 149].
The concepts behind several models and an excellent review of the current
state of SC modeling theory are presented by Goldberg [1998]. Several mathematical
formulations of SC models are currently available. The four most commonly cited
[150] are the:
• Schindler and Stumm Constant Capacitance Model (CC) [60];
• Diffuse Double Layer Model (DDLM) [149];
• Triple Layer Model (TLM) of Davis and Leckie [148, 151]; and,
• Hiemstra and vanRiemsdijk Charge Distribution-Multi-Site Complexation
Model (CD-MUSIC) [73, 152-154].
Even though a number of variations exist in these modeling approaches the
following four tenets are common to all SC models [77]:
(a) The mineral surface is composed of specific functional groups that react
with dissolved solutes to form surface species (coordinative complexes or ion pairs)
in a manner analogous to complexation reactions in a homogeneous solution.
(b) The equilibria of SC and surface acidity reactions can be described by
mass action equations. If desired, correction factors to these equations may be applied
to account for variable electrostatic energy, using electrical double-layer theory.
117
(c) The apparent binding constants determined for the mass action equations
are empirical parameters related to thermodynamic constants by the rational activity
coefficients of the surface species [155].
(d) The electrical charge at the surface is determined by the chemical reactions
of the mineral functional groups, including acid-base reactions and the formation of
ion pairs and coordinative complexes.
The models are distinguished by differences in their respective molecular
hypotheses. Each model assumes a particular interfacial structure resulting in the
consideration of various kinds of surface reactions and electrostatic correction factors
to mass law equations [60].
These models are used to fit laboratory-derived pure mineral SC data
with equal success [149, 150, 153, 156]. In application, each of the four models has
its own limitations.
The first three models are ranked in order of complexity and the number of
fitting parameters used. The greater the number of fitting parameters, the more likely
the model will fit experimental data. However, with a greater number of fitting
parameters, it is less likely that a unique solution will be realized. Better fits are not
completely indicative of a better model. The chemical significance of the modeling
approach to the problem under consideration should be considered, in addition to the
fit produced by modeling. Hiemstra and VanRiemsdijk’s CD-MUSIC model [153,
154] is a newer approach to SC modeling. In this approach, CD-MUSIC surface
charge is not assigned to the bonding sites as a point charge but as a spatial
distribution of charge in the interfacial region. Because the charge distribution can be
118
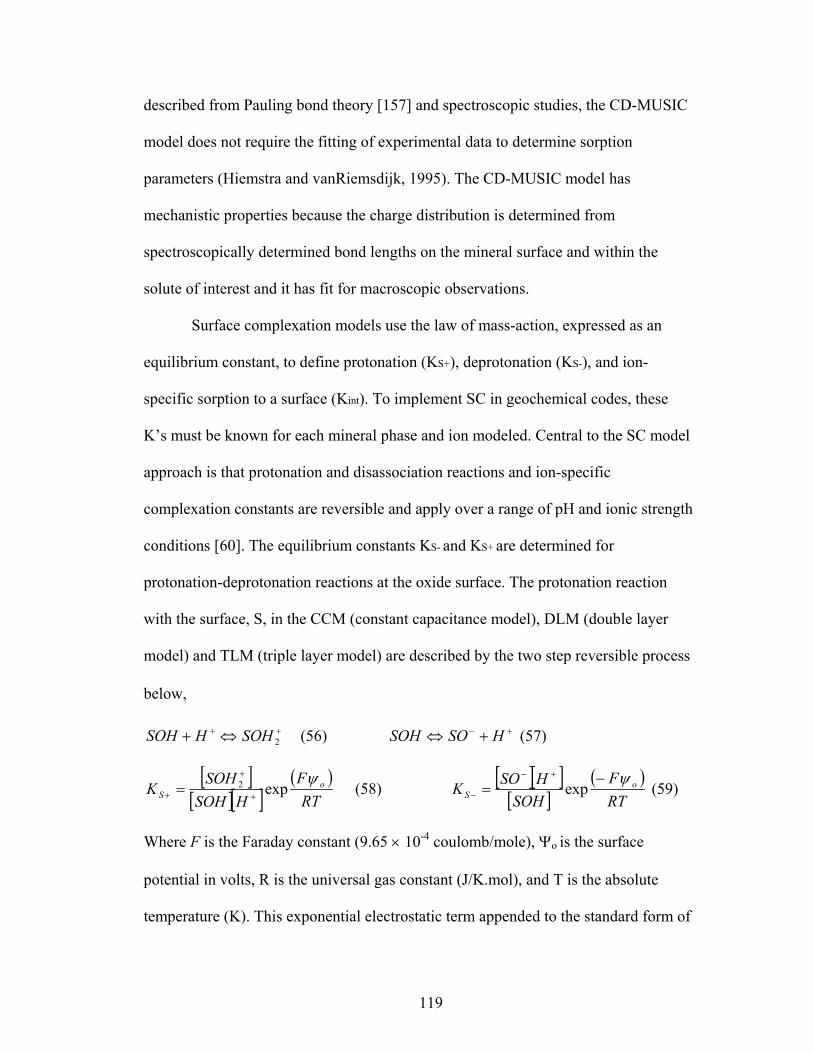
described from Pauling bond theory [157] and spectroscopic studies, the CD-MUSIC
model does not require the fitting of experimental data to determine sorption
parameters (Hiemstra and vanRiemsdijk, 1995). The CD-MUSIC model has
mechanistic properties because the charge distribution is determined from
spectroscopically determined bond lengths on the mineral surface and within the
solute of interest and it has fit for macroscopic observations.
Surface complexation models use the law of mass-action, expressed as an
equilibrium constant, to define protonation (KS+), deprotonation (KS-), and ion-
specific sorption to a surface (Kint). To implement SC in geochemical codes, these
K’s must be known for each mineral phase and ion modeled. Central to the SC model
approach is that protonation and disassociation reactions and ion-specific
complexation constants are reversible and apply over a range of pH and ionic strength
conditions [60]. The equilibrium constants KS- and KS+ are determined for
protonation-deprotonation reactions at the oxide surface. The protonation reaction
with the surface, S, in the CCM (constant capacitance model), DLM (double layer
model) and TLM (triple layer model) are described by the two step reversible process
below,
++ HSOH +⇔ 2SOH (56) (57) +− +⇔ HSOSOH
[ ][ ][ ]
( )RT
FHSOH
SOHK oS
ψexp2
+
+
+ = (58) [ ][ ][ ]
( )RTF
SOHHSOK o
Sψ−
=+−
− exp (59)
Where F is the Faraday constant (9.65 × 10⁻⁴ coulomb/mole), Ψo is the surface
potential in volts, R is the universal gas constant (J/K.mol), and T is the absolute
temperature (K). This exponential electrostatic term appended to the standard form of
119

the equilibrium mass-action equation is used to account for the change in surface
potential because of the sorption of the modeled ion.
The KS- and KS+ constants allow the surface-sorbing properties to change with
changing pH. Constants for specific sorbing ions that meet these constraints are
referred to as “intrinsic constants” or Kint. In order to apply these models to SC, Kint
for surface reactions must be known for each surface to be used, each sorbing ion,
and each site defined on the surface. To some degree KS-, KS+, and Kint values
determined for a single mineral may be used interchangeably among the CCM, DLM
and TLM (single site, 2-pK) models. This requires refitting and corrections for model
geometry. Refitting of experimental data to different SC models can be accomplished
using FITEQL computer algorithm [81].
4.0 The toxicity characteristic leaching procedure (TCLP)
The TCLP, developed by the U.S. EPA [131], provides a means of
determining the potential for solid materials to release chemical contaminants into a
landfill environment. The TCLP is applied to both Prestea and Awaso LC after
completion of the pilot test. Herein, the TCLP involved agitating the used LC (<1.18
mm) in acetic acid using a leachant/waste ratio of 20 at pH 2.88 ± 0.05. The
extraction (at 23± 1◦C) was achieved by tumbling the specimens (end-over-end) for
18 hours, after which the liquid phase was separated off using a 0.22µm filter and
analyzed for heavy metals by the ICP-MS. The TCLP results given in Tables A-3 and
A-4 show only a very small amount of the arsenic bound to either Prestea or Awaso is
released by acetic acid leaching at pH 2.88 ± 0.05. This suggests that either the
120
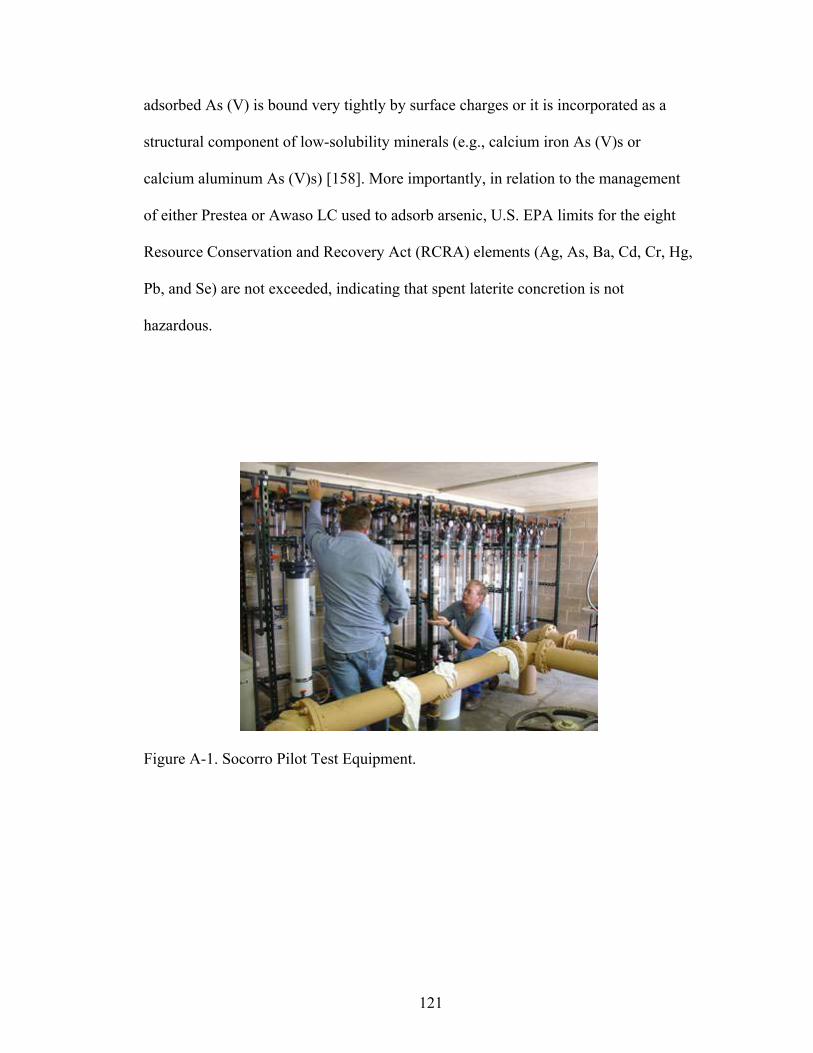
adsorbed As (V) is bound very tightly by surface charges or it is incorporated as a
structural component of low-solubility minerals (e.g., calcium iron As (V)s or
calcium aluminum As (V)s) [158]. More importantly, in relation to the management
of either Prestea or Awaso LC used to adsorb arsenic, U.S. EPA limits for the eight
Resource Conservation and Recovery Act (RCRA) elements (Ag, As, Ba, Cd, Cr, Hg,
Pb, and Se) are not exceeded, indicating that spent laterite concretion is not
hazardous.
Figure A-1. Socorro Pilot Test Equipment.
121

Table A-1. Prestea Field Test. Values shown are average measured for the period tested
Feed water
Effluent water
Conductivity
350 340
Temperature
32 31
pH
6.8 6.5
Free chlorine
0.37 0.44
Turbidity
0.78 0.39
Alkalinity
162 153
Table A-2. Awaso Field Test. Values shown are average measured for the period tested
Feed water
Effluent water
Conductivity
350 342
Temperature
32 30
pH
6.8 6.7
Free chlorine
0.37 0.46
Turbidity
0.78 0.41
Alkalinity
162 140
122

0 1000 2000 3000 4000 5000Bed Volumes
0
2
4
6
8
10
12
Ars
enic
Con
cent
ratio
n (p
pb)
Figure A-2. Arsenic sorption on Prestea LIC from Socorro Pilot project, temperature 32oC. Solid length in column = 38 inches. The pH is 8.2, The 2σ error on arsenic analysis is 3% based on the variance of measurements of 50 replicate samples. Influent arsenic = 42ppb, Kg of LC used = 7.3kg, size of LC = 1.18mm, Residence time = 0.3gpm.
123

0 1000 2000 3000 4000 5000Bed Volumes
0
2
4
6
8
10
12
Ars
enic
Con
cent
ratio
n (p
pb)
Figure A-3. Arsenic sorption on Awaso LIC from Socorro Pilot project, temperature 32oC. Solid length in column = 38 inches. The pH is 8.2, The 2σ error on arsenic analysis is 3% based on the variance of measurements of 50 replicate samples. Influent arsenic = 42ppb, Kg of LC used = 7.3kg, size of LC = 1.18mm, Residence time = 0.3gpm.
124
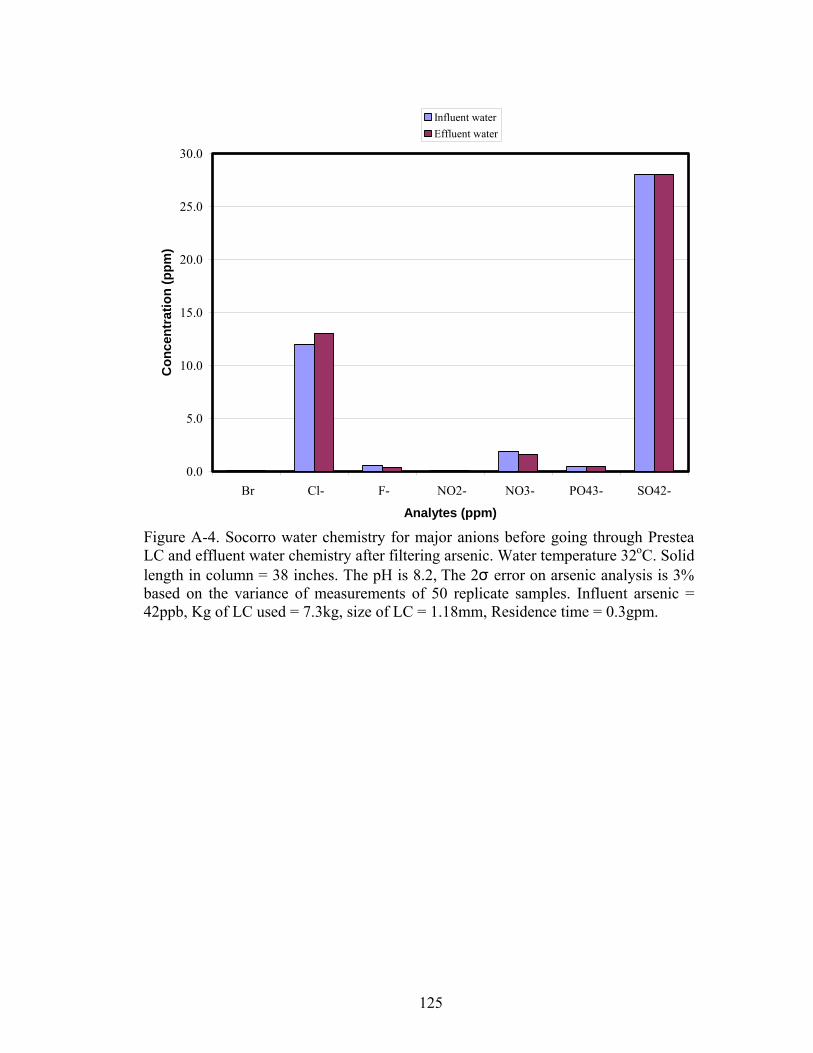
0.0
5.0
10.0
15.0
20.0
25.0
30.0
Br Cl- F- NO2- NO3- PO43- SO42-
Analytes (ppm)
Con
cent
ratio
n (p
pm)
Influent waterEffluent water
Figure A-4. Socorro water chemistry for major anions before going through Prestea LC and effluent water chemistry after filtering arsenic. Water temperature 32oC. Solid length in column = 38 inches. The pH is 8.2, The 2σ error on arsenic analysis is 3% based on the variance of measurements of 50 replicate samples. Influent arsenic = 42ppb, Kg of LC used = 7.3kg, size of LC = 1.18mm, Residence time = 0.3gpm.
125
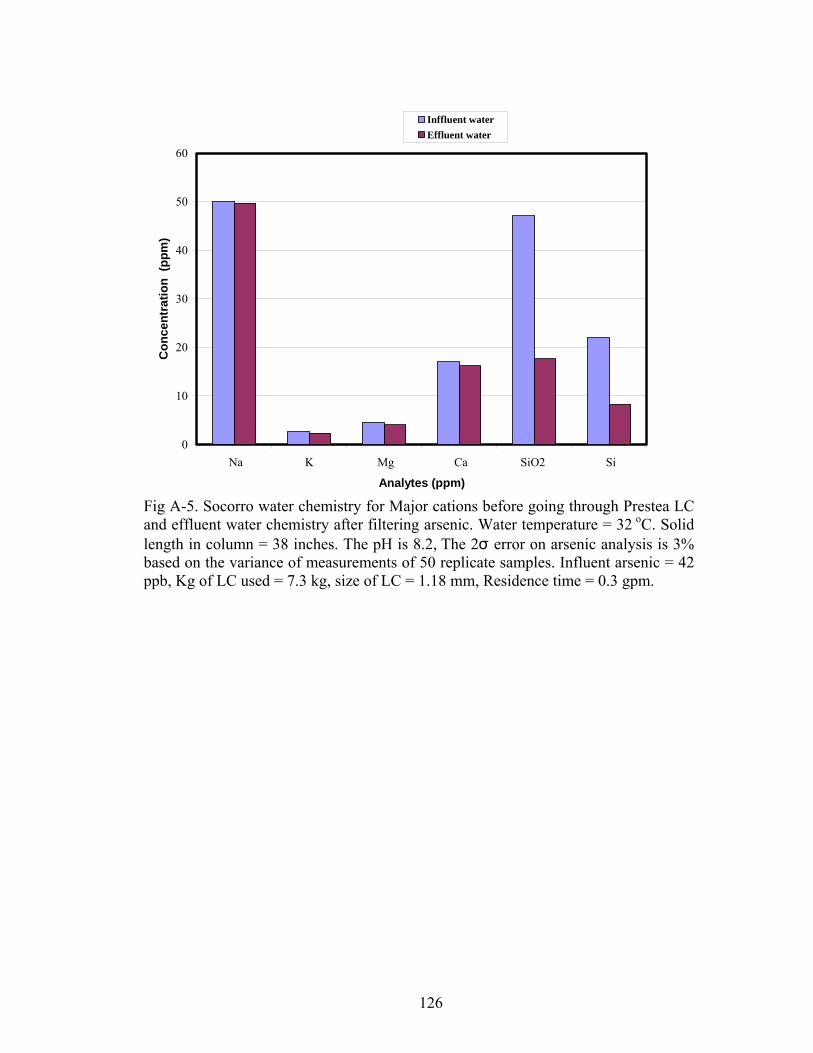
0
10
20
30
40
50
60
Na K Mg Ca SiO2 Si
Analytes (ppm)
Con
cent
ratio
n (p
pm)
Inffluent waterEffluent water
Fig A-5. Socorro water chemistry for Major cations before going through Prestea LC and effluent water chemistry after filtering arsenic. Water temperature = 32 oC. Solid length in column = 38 inches. The pH is 8.2, The 2σ error on arsenic analysis is 3% based on the variance of measurements of 50 replicate samples. Influent arsenic = 42 ppb, Kg of LC used = 7.3 kg, size of LC = 1.18 mm, Residence time = 0.3 gpm.
126
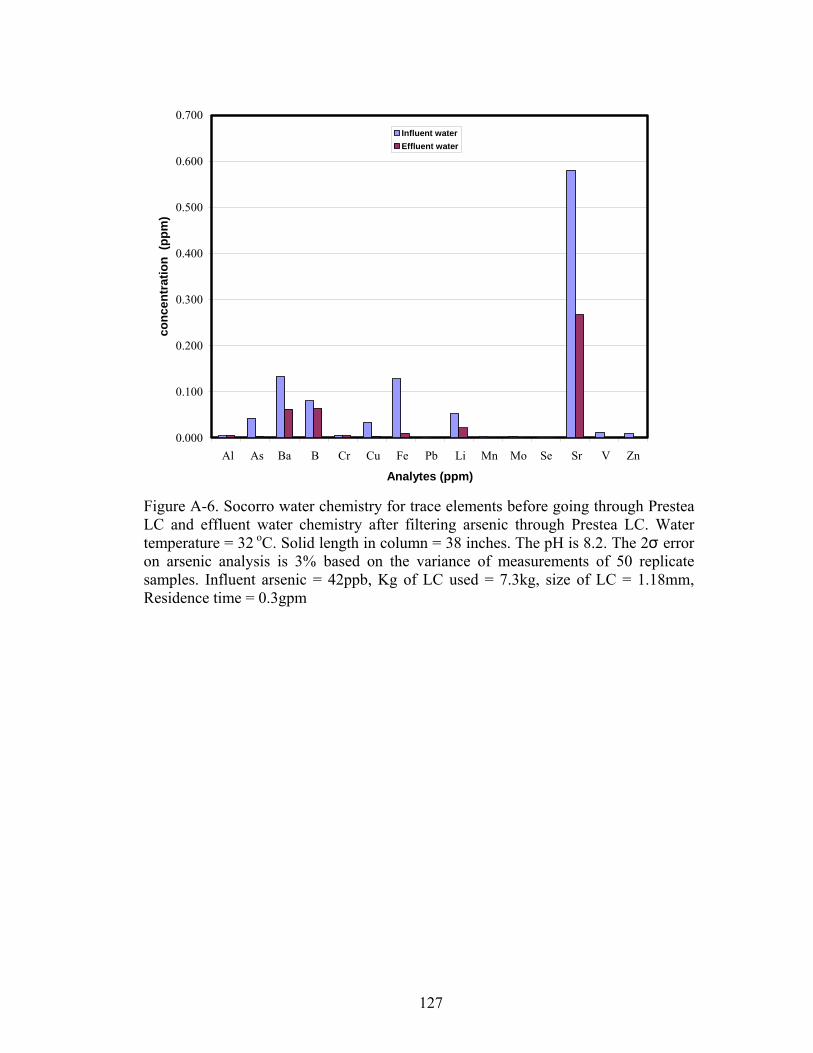
0.000
0.100
0.200
0.300
0.400
0.500
0.600
0.700
Al As Ba B Cr Cu Fe Pb Li Mn Mo Se Sr V Zn
Analytes (ppm)
conc
entr
atio
n (p
pm)
Influent waterEffluent water
Figure A-6. Socorro water chemistry for trace elements before going through Prestea LC and effluent water chemistry after filtering arsenic through Prestea LC. Water temperature = 32 oC. Solid length in column = 38 inches. The pH is 8.2. The 2σ error on arsenic analysis is 3% based on the variance of measurements of 50 replicate samples. Influent arsenic = 42ppb, Kg of LC used = 7.3kg, size of LC = 1.18mm, Residence time = 0.3gpm
127

0
5
10
15
20
25
30
35
Br Cl- F- NO2- NO3- PO43- SO42-
Analytes (ppm)
Con
cent
ratio
n (p
pm)
Influent waterEffluent Water
Figure A-7. Socorro water chemistry for major anions before going through Awaso LC and effluent water chemistry after filtering arsenic through Awaso LC. Water temperature = 32oC. Solid length in column = 38 inches. The pH is 8.2. The 2σ error on arsenic analysis is 3% based on the variance of measurements of 50 replicate samples. Influent arsenic = 42ppb, Kg of LC used = 7.3kg, size of LC = 1.18mm, Residence time = 0.3gpm.
128
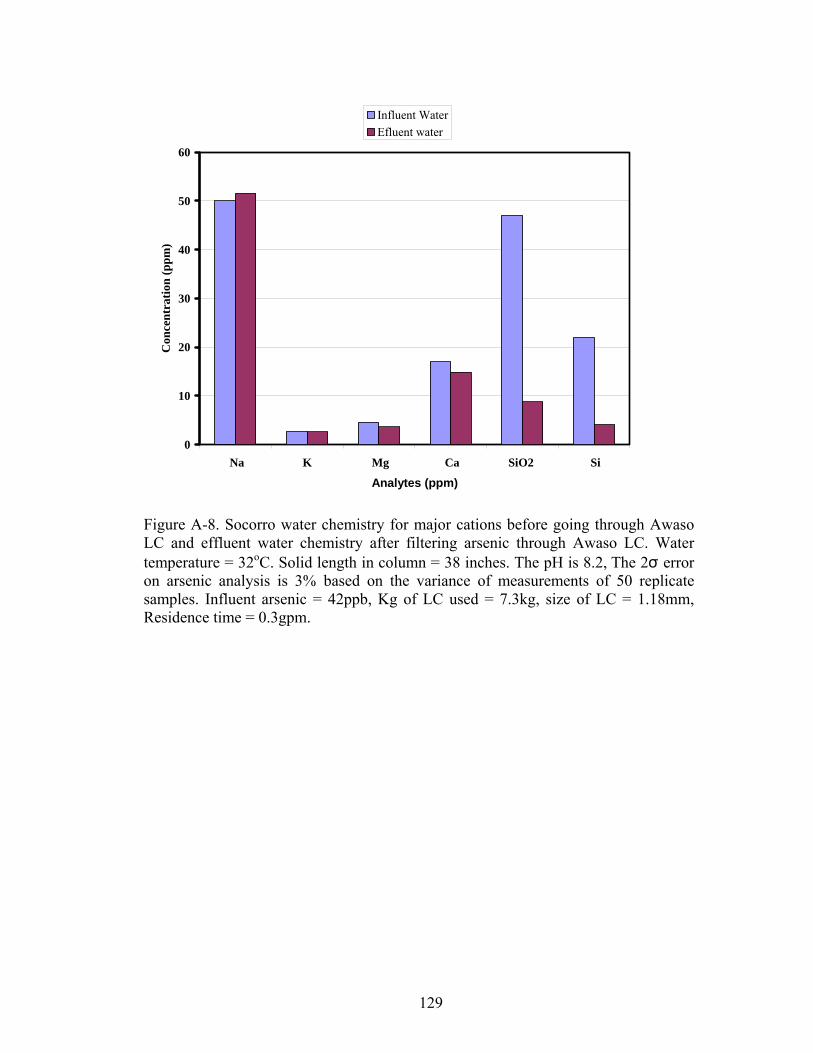
0
10
20
30
40
50
60
Na K Mg Ca SiO2 Si
Analytes (ppm)
Con
cent
ratio
n (p
pm)
Influent WaterEfluent water
Figure A-8. Socorro water chemistry for major cations before going through Awaso LC and effluent water chemistry after filtering arsenic through Awaso LC. Water temperature = 32oC. Solid length in column = 38 inches. The pH is 8.2, The 2σ error on arsenic analysis is 3% based on the variance of measurements of 50 replicate samples. Influent arsenic = 42ppb, Kg of LC used = 7.3kg, size of LC = 1.18mm, Residence time = 0.3gpm.
129
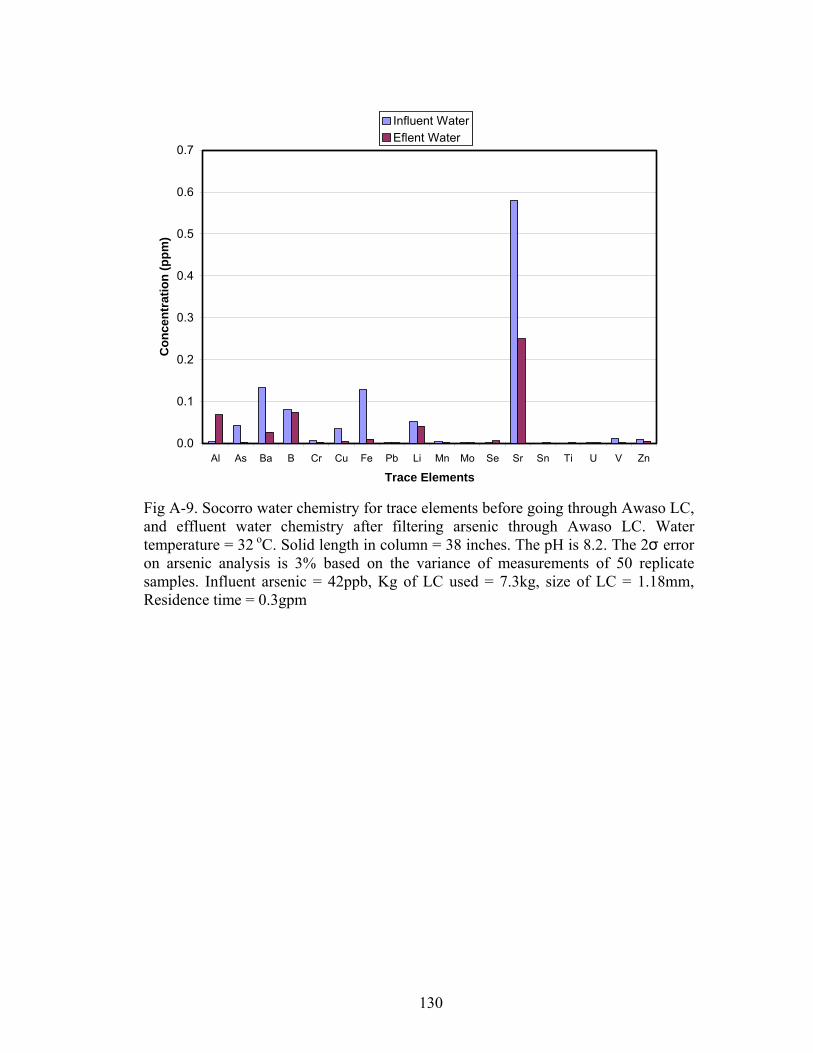
0.0
0.1
0.2
0.3
0.4
0.5
0.6
0.7
Al As Ba B Cr Cu Fe Pb Li Mn Mo Se Sr Sn Ti U V Zn
Trace Elements
Con
cent
ratio
n (p
pm)
Influent WaterEflent Water
Fig A-9. Socorro water chemistry for trace elements before going through Awaso LC, and effluent water chemistry after filtering arsenic through Awaso LC. Water temperature = 32 oC. Solid length in column = 38 inches. The pH is 8.2. The 2σ error on arsenic analysis is 3% based on the variance of measurements of 50 replicate samples. Influent arsenic = 42ppb, Kg of LC used = 7.3kg, size of LC = 1.18mm, Residence time = 0.3gpm
130

3 4 5 6 7 8 9 10 1pH
140
60
80
100
120
140
160
180
200
As
(III)
sorb
ed (µ
g/g)
0.1 M Exp. Data0.01 M Exp. Data0.001 M Exp. Data0.1 M NaCl Modeled0.01 M NaCl Modeled0.001 M NaCl Modeled
Figure A-10. As (III) sorption on Prestea LC as a function of pH and ionic strength. Lines are alternate diffuse-layer (see text for details) modeled calculations. Arsenic binding constants are optimized for individual ionic strengths. Solid suspension density = 5 g/L, solution arsenic concentration = 1.0mg/L, T=20o C. The 2σ error on arsenic analysis is 3%, based on the variance of measurements of 50 replicate samples.
131

3 4 5 6 7 8 9 10 1pH
1100
120
140
160
180
200
220
As
(V) s
orbe
d (µ
g/g)
0.1 M NaCl Exp. Data0.01 M NaCl Exp. Data0.001 M NaCl Exp. Data0.1 M NaCl Modeled Data0.01 M NaCl Modeled Data0.001 M NaCl Modeled Data
Figure A-11. As (V) sorption on Prestea LC as a function of pH and ionic strength. Lines are alternate diffuse-layer (see text for details) modeled calculations. Arsenic binding constants are optimized for individual ionic strengths. Solid suspension density = 5g/L, solution arsenic concentrations = 1.0mg/L, T=20o C. The 2σ error on arsenic analysis is 3%, based on the variance of measurements of 50 replicate samples.
132

3 4 5 6 7 8 9 10 11 12pH
20
40
60
80
100
120
140
160
180
As
(III)
Sorb
ed (µ
g\g)
0.1 M NaCl Exp. Data0.01 M NaCl Exp. Data0.001M NaCl Exp. Data0.1 M NaCl Modeled Data0.01 M NaCl Modeled Data0.001 M NaCl Modeled Data
Figure A-12. As (III) sorption on Awaso LC as a function of pH and ionic strength. Lines are alternate diffuse-layer (see text for details) modeled calculations. Arsenic binding constants are optimized for individual ionic strengths. Solid suspension density = 5g/L, solution arsenic concentration = 1.0mg/L, T=20oC. The 2σ error on arsenic analysis is 3%, based on the variance of measurements of 50 replicate samples.
133
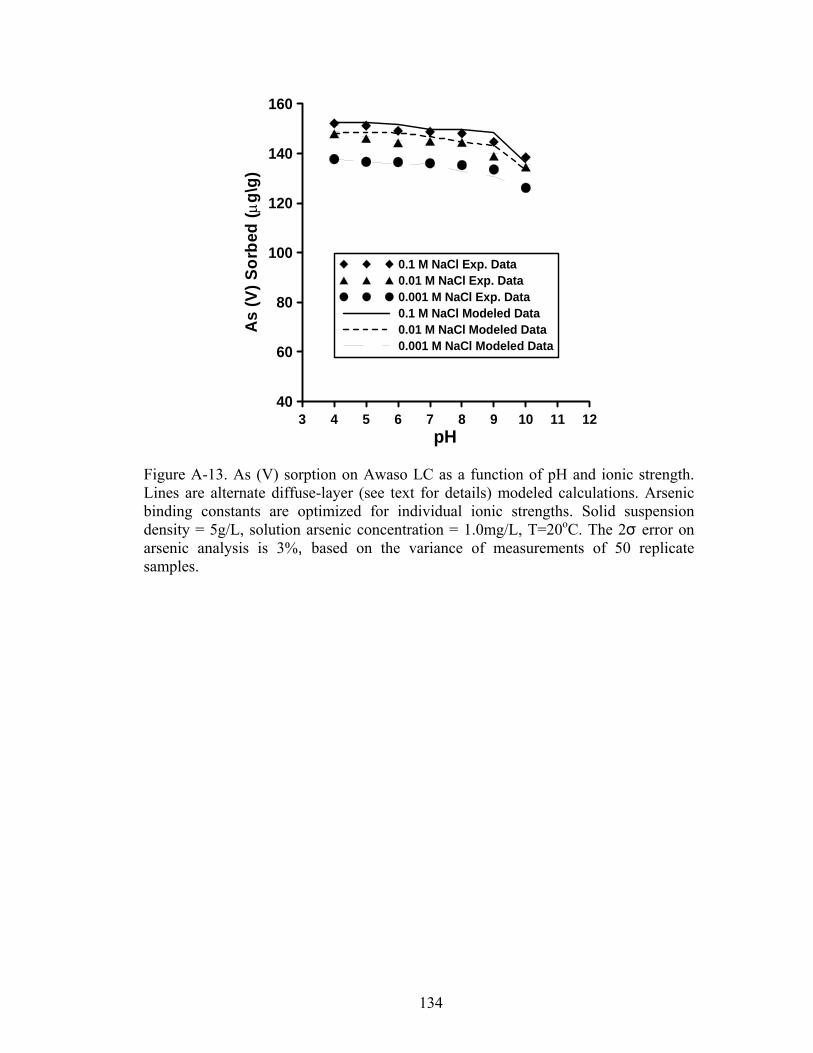
3 4 5 6 7 8 9 10 11 1pH
240
60
80
100
120
140
160
As
(V) S
orbe
d (µ
g\g)
0.1 M NaCl Exp. Data0.01 M NaCl Exp. Data0.001 M NaCl Exp. Data0.1 M NaCl Modeled Data0.01 M NaCl Modeled Data0.001 M NaCl Modeled Data
Figure A-13. As (V) sorption on Awaso LC as a function of pH and ionic strength. Lines are alternate diffuse-layer (see text for details) modeled calculations. Arsenic binding constants are optimized for individual ionic strengths. Solid suspension density = 5g/L, solution arsenic concentration = 1.0mg/L, T=20oC. The 2σ error on arsenic analysis is 3%, based on the variance of measurements of 50 replicate samples.
134

Table A-3. The TCLP test results for the used Prestea LC and comparison with U.S. EPA Standards for classification as an inert solid
Parameter Method Results Standards (mg l−1)Antimony (mg l−1) ICPMS <0.001 1.0
Arsenic (mg l−1) ICPMS 0.010 5.0
Barium (mg l−1) ICPMS <0.001 100.0
Beryllium (mg l−1) ICPMS 0.003 0.1
Cadmium (mg l−1) ICPMS <0.001 1.0
Chromium (mg l−1) ICPMS <0.001 5.0
Copper (mg l−1) ICPMS 0.688 -
Manganese (mg l−1) ICPMS 0.037 -
Mercury (mg l−1) ICPMS <0.001 0.2
Nickel (mg l−1) ICPMS 0.008 7.0
Lead (mg l−1) ICPMS 0.026 5.0
Selenium (mg l−1) ICPMS <0.001 1.0
Silver (mg l−1) ICPMS <0.001 5.0
Zinc (mg l−1) ICPMS 0.296 -
Table A-4. The TCLP test results for the used Awaso LC and comparison with U.S. EPA Standards for classification as an inert solid.
Parameter Method Results Standards (mg l−1)
Antimony (mg l−1) ICPMS <0.001 1.0
Arsenic (mg l−1) ICPMS 0.018 5.0
Barium (mg l−1) ICPMS <0.001 100.0
Beryllium (mg l−1) ICPMS 0.003 0.1
Cadmium (mg l−1) ICPMS <0.001 1.0
Chromium (mg l−1) ICPMS <0.001 5.0
Copper (mg l−1) ICPMS 0.688 -
Manganese (mg l−1) ICPMS 0.037 -
Mercury (mg l−1) ICPMS <0.001 0.2
Nickel (mg l−1) ICPMS 0.018 7.0
Lead (mg l−1) ICPMS 0.048 5.0
Selenium (mg l−1) ICPMS <0.001 1.0
Silver (mg l−1) ICPMS <0.001 5.0
Zinc (mg l−1) ICPMS 0.222 -
135
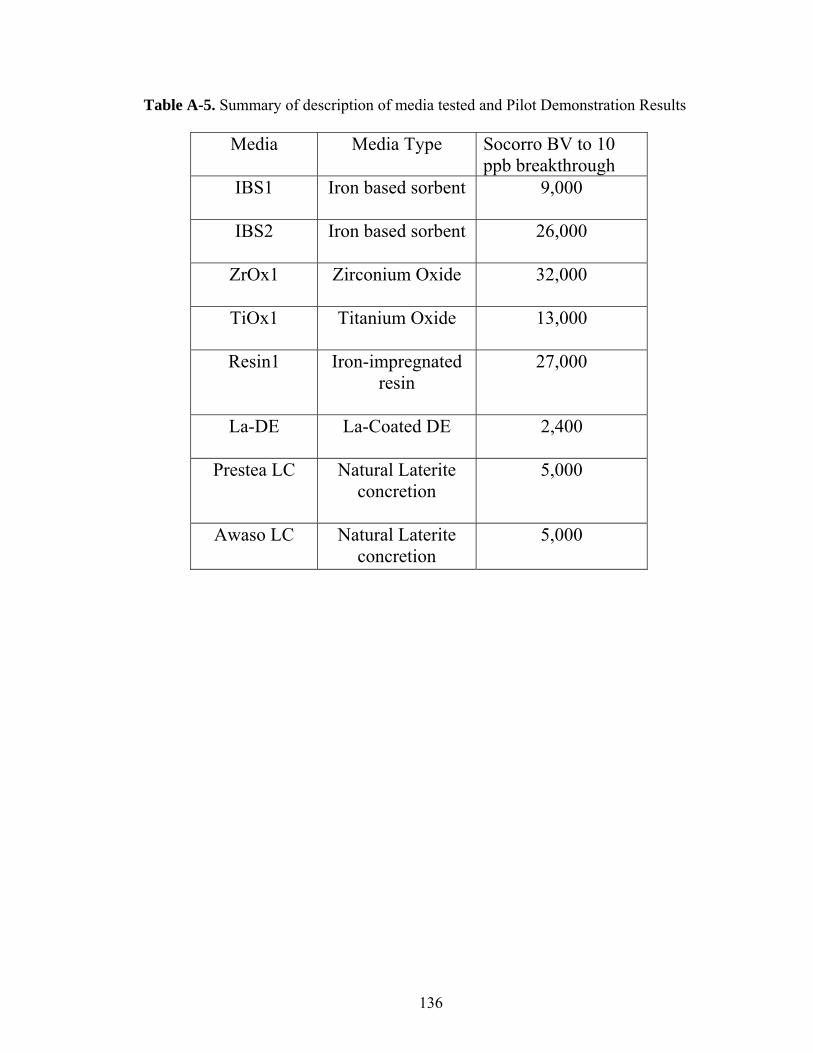
Table A-5. Summary of description of media tested and Pilot Demonstration Results
Media Media Type Socorro BV to 10 ppb breakthrough
IBS1
Iron based sorbent 9,000
IBS2
Iron based sorbent 26,000
ZrOx1
Zirconium Oxide 32,000
TiOx1
Titanium Oxide 13,000
Resin1 Iron-impregnated resin
27,000
La-DE
La-Coated DE 2,400
Prestea LC Natural Laterite concretion
5,000
Awaso LC Natural Laterite concretion
5,000
136
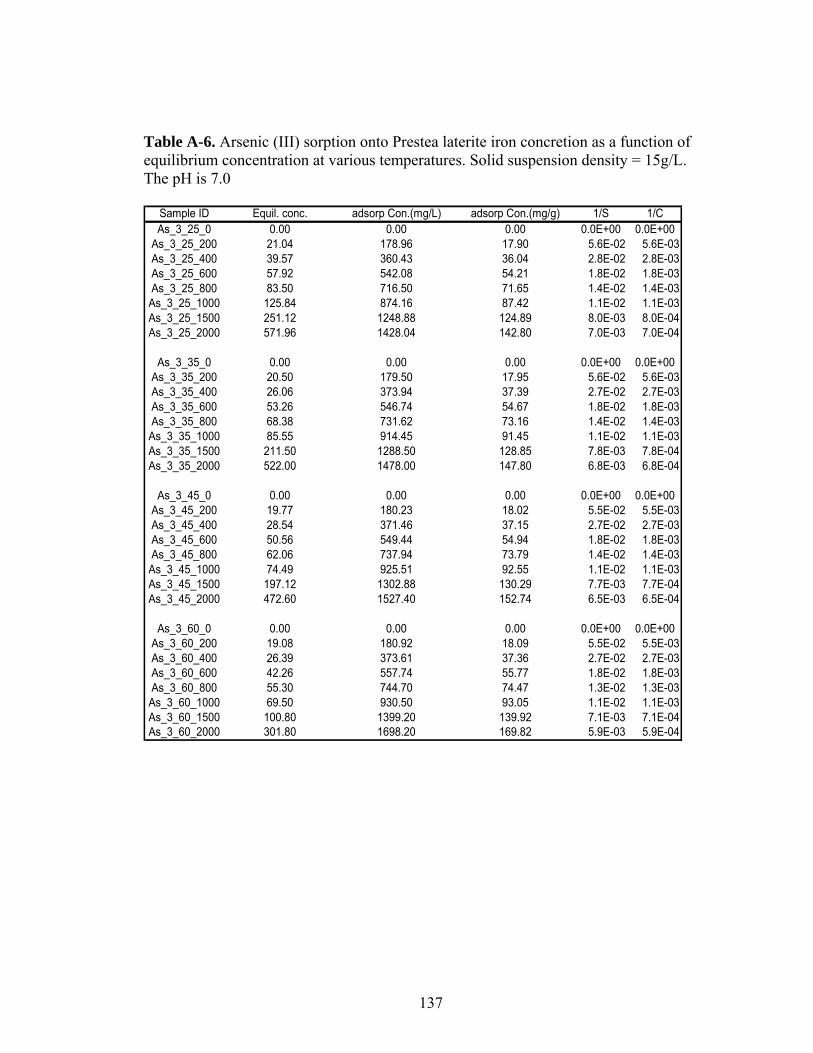
Table A-6. Arsenic (III) sorption onto Prestea laterite iron concretion as a function of equilibrium concentration at various temperatures. Solid suspension density = 15g/L. The pH is 7.0
Sample ID Equil. conc. adsorp Con.(mg/L) adsorp Con.(mg/g) 1/S 1/CAs_3_25_0 0.00 0.00 0.00 0.0E+00 0.0E+00
As_3_25_200 21.04 178.96 17.90 5.6E-02 5.6E-03As_3_25_400 39.57 360.43 36.04 2.8E-02 2.8E-03As_3_25_600 57.92 542.08 54.21 1.8E-02 1.8E-03As_3_25_800 83.50 716.50 71.65 1.4E-02 1.4E-03As_3_25_1000 125.84 874.16 87.42 1.1E-02 1.1E-03As_3_25_1500 251.12 1248.88 124.89 8.0E-03 8.0E-04As_3_25_2000 571.96 1428.04 142.80 7.0E-03 7.0E-04
As_3_35_0 0.00 0.00 0.00 0.0E+00 0.0E+00As_3_35_200 20.50 179.50 17.95 5.6E-02 5.6E-03As_3_35_400 26.06 373.94 37.39 2.7E-02 2.7E-03As_3_35_600 53.26 546.74 54.67 1.8E-02 1.8E-03As_3_35_800 68.38 731.62 73.16 1.4E-02 1.4E-03As_3_35_1000 85.55 914.45 91.45 1.1E-02 1.1E-03As_3_35_1500 211.50 1288.50 128.85 7.8E-03 7.8E-04As_3_35_2000 522.00 1478.00 147.80 6.8E-03 6.8E-04
As_3_45_0 0.00 0.00 0.00 0.0E+00 0.0E+00As_3_45_200 19.77 180.23 18.02 5.5E-02 5.5E-03As_3_45_400 28.54 371.46 37.15 2.7E-02 2.7E-03As_3_45_600 50.56 549.44 54.94 1.8E-02 1.8E-03As_3_45_800 62.06 737.94 73.79 1.4E-02 1.4E-03As_3_45_1000 74.49 925.51 92.55 1.1E-02 1.1E-03As_3_45_1500 197.12 1302.88 130.29 7.7E-03 7.7E-04As_3_45_2000 472.60 1527.40 152.74 6.5E-03 6.5E-04
As_3_60_0 0.00 0.00 0.00 0.0E+00 0.0E+00As_3_60_200 19.08 180.92 18.09 5.5E-02 5.5E-03As_3_60_400 26.39 373.61 37.36 2.7E-02 2.7E-03As_3_60_600 42.26 557.74 55.77 1.8E-02 1.8E-03As_3_60_800 55.30 744.70 74.47 1.3E-02 1.3E-03As_3_60_1000 69.50 930.50 93.05 1.1E-02 1.1E-03As_3_60_1500 100.80 1399.20 139.92 7.1E-03 7.1E-04As_3_60_2000 301.80 1698.20 169.82 5.9E-03 5.9E-04
137
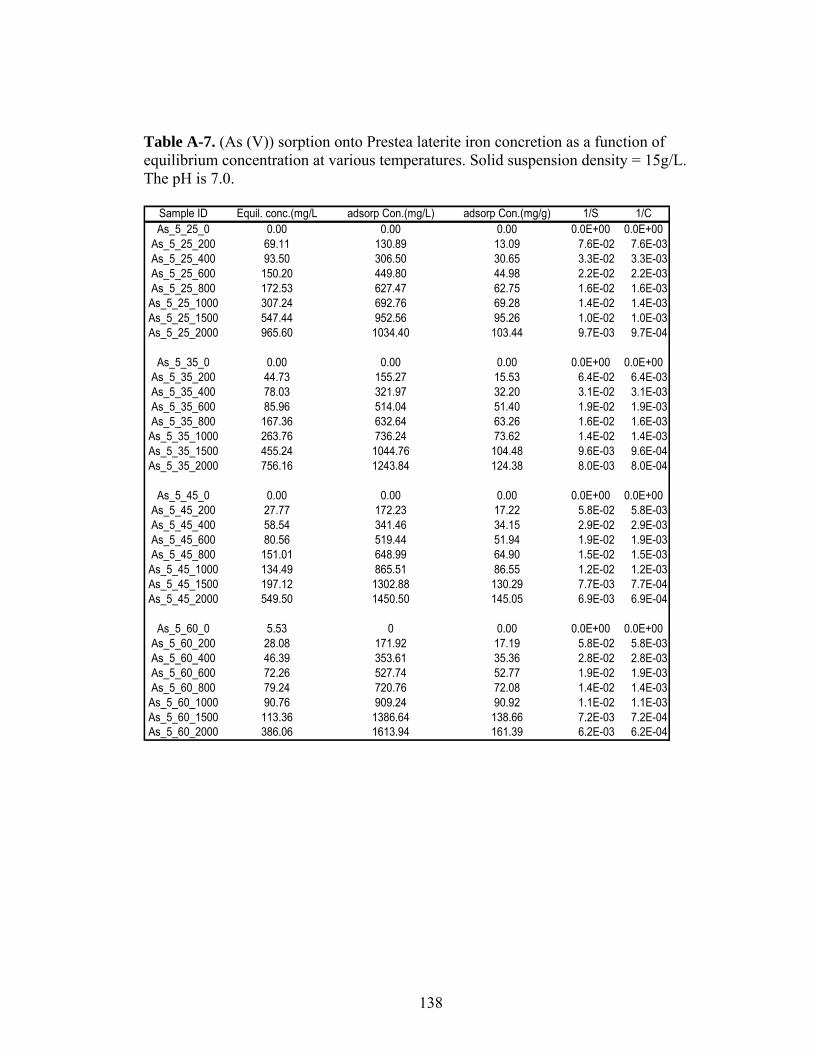
Table A-7. (As (V)) sorption onto Prestea laterite iron concretion as a function of equilibrium concentration at various temperatures. Solid suspension density = 15g/L. The pH is 7.0.
Sample ID Equil. conc.(mg/L adsorp Con.(mg/L) adsorp Con.(mg/g) 1/S 1/CAs_5_25_0 0.00 0.00 0.00 0.0E+00 0.0E+00
As_5_25_200 69.11 130.89 13.09 7.6E-02 7.6E-03As_5_25_400 93.50 306.50 30.65 3.3E-02 3.3E-03As_5_25_600 150.20 449.80 44.98 2.2E-02 2.2E-03As_5_25_800 172.53 627.47 62.75 1.6E-02 1.6E-03As_5_25_1000 307.24 692.76 69.28 1.4E-02 1.4E-03As_5_25_1500 547.44 952.56 95.26 1.0E-02 1.0E-03As_5_25_2000 965.60 1034.40 103.44 9.7E-03 9.7E-04
As_5_35_0 0.00 0.00 0.00 0.0E+00 0.0E+00As_5_35_200 44.73 155.27 15.53 6.4E-02 6.4E-03As_5_35_400 78.03 321.97 32.20 3.1E-02 3.1E-03As_5_35_600 85.96 514.04 51.40 1.9E-02 1.9E-03As_5_35_800 167.36 632.64 63.26 1.6E-02 1.6E-03As_5_35_1000 263.76 736.24 73.62 1.4E-02 1.4E-03As_5_35_1500 455.24 1044.76 104.48 9.6E-03 9.6E-04As_5_35_2000 756.16 1243.84 124.38 8.0E-03 8.0E-04
As_5_45_0 0.00 0.00 0.00 0.0E+00 0.0E+00As_5_45_200 27.77 172.23 17.22 5.8E-02 5.8E-03As_5_45_400 58.54 341.46 34.15 2.9E-02 2.9E-03As_5_45_600 80.56 519.44 51.94 1.9E-02 1.9E-03As_5_45_800 151.01 648.99 64.90 1.5E-02 1.5E-03As_5_45_1000 134.49 865.51 86.55 1.2E-02 1.2E-03As_5_45_1500 197.12 1302.88 130.29 7.7E-03 7.7E-04As_5_45_2000 549.50 1450.50 145.05 6.9E-03 6.9E-04
As_5_60_0 5.53 0 0.00 0.0E+00 0.0E+00As_5_60_200 28.08 171.92 17.19 5.8E-02 5.8E-03As_5_60_400 46.39 353.61 35.36 2.8E-02 2.8E-03As_5_60_600 72.26 527.74 52.77 1.9E-02 1.9E-03As_5_60_800 79.24 720.76 72.08 1.4E-02 1.4E-03As_5_60_1000 90.76 909.24 90.92 1.1E-02 1.1E-03As_5_60_1500 113.36 1386.64 138.66 7.2E-03 7.2E-04As_5_60_2000 386.06 1613.94 161.39 6.2E-03 6.2E-04
138
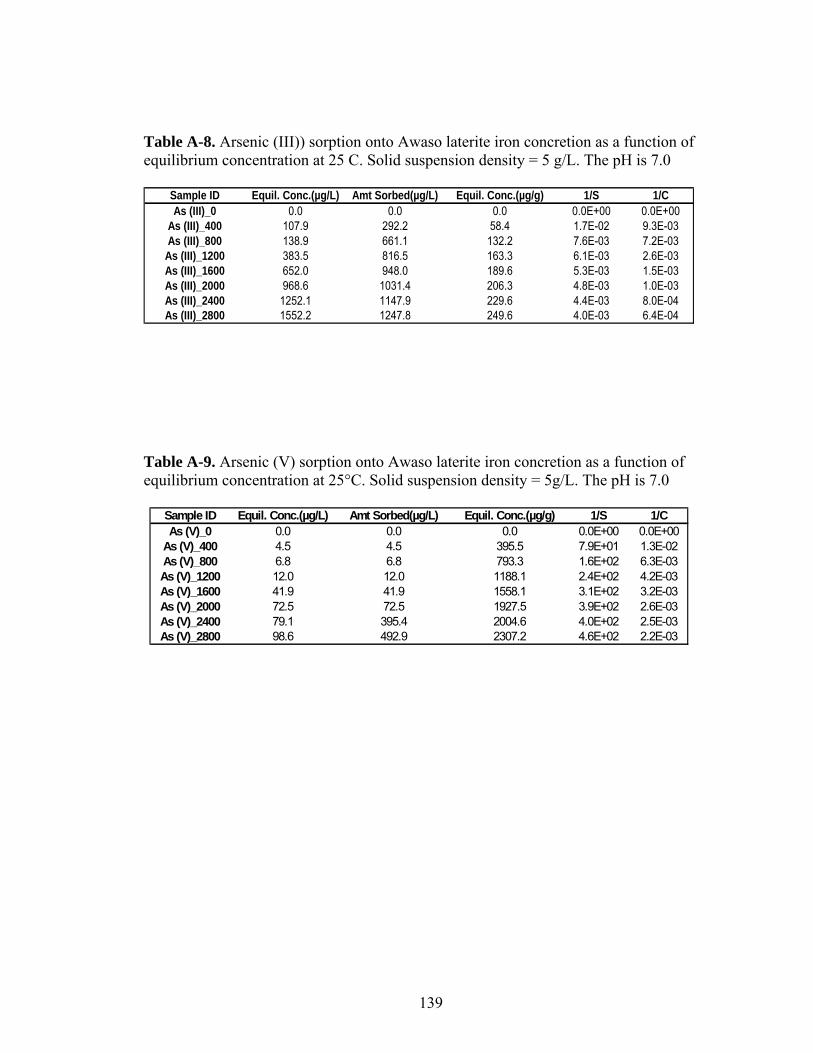
Table A-8. Arsenic (III)) sorption onto Awaso laterite iron concretion as a function of equilibrium concentration at 25 C. Solid suspension density = 5 g/L. The pH is 7.0
Sample ID Equil. Conc.(µg/L) Amt Sorbed(µg/L) Equil. Conc.(µg/g) 1/S 1/CAs (III)_0 0.0 0.0 0.0 0.0E+00 0.0E+00
As (III)_400 107.9 292.2 58.4 1.7E-02 9.3E-03As (III)_800 138.9 661.1 132.2 7.6E-03 7.2E-03
As (III)_1200 383.5 816.5 163.3 6.1E-03 2.6E-03As (III)_1600 652.0 948.0 189.6 5.3E-03 1.5E-03As (III)_2000 968.6 1031.4 206.3 4.8E-03 1.0E-03As (III)_2400 1252.1 1147.9 229.6 4.4E-03 8.0E-04As (III)_2800 1552.2 1247.8 249.6 4.0E-03 6.4E-04
Table A-9. Arsenic (V) sorption onto Awaso laterite iron concretion as a function of equilibrium concentration at 25°C. Solid suspension density = 5g/L. The pH is 7.0
Sample ID Equil. Conc.(µg/L) Amt Sorbed(µg/L) Equil. Conc.(µg/g) 1/S 1/CAs (V)_0 0.0 0.0 0.0 0.0E+00 0.0E+00
As (V)_400 4.5 4.5 395.5 7.9E+01 1.3E-02As (V)_800 6.8 6.8 793.3 1.6E+02 6.3E-03As (V)_1200 12.0 12.0 1188.1 2.4E+02 4.2E-03As (V)_1600 41.9 41.9 1558.1 3.1E+02 3.2E-03As (V)_2000 72.5 72.5 1927.5 3.9E+02 2.6E-03As (V)_2400 79.1 395.4 2004.6 4.0E+02 2.5E-03As (V)_2800 98.6 492.9 2307.2 4.6E+02 2.2E-03
139

Table A-10. Arsenic (III) sorption onto Prestea laterite iron concretion as a function of solution pH and ionic strength. Solid suspension density = 5g/L, T=20o C.
As (III) R O + 0.1MpH Equil. Conc.(µg/L) Amount sorbed (µg/L) Amount sorbed (µg/g) % sorbed4 364.0 636.0 127.2 63.65 218.0 782.0 156.4 78.26 174.0 826.0 165.2 82.67 179.0 821.0 164.2 82.18 195.0 805.0 161.0 80.59 229.0 771.0 154.2 77.110 384.0 616.0 123.2 61.6
As (III) R O + 0.01M pH Equil. Conc.(µg/L) Amount sorbed (µg/L) Amount sorbed (µg/g) % sorbed4 284.0 716.0 143.2 82.55 167.0 833.0 166.6 90.46 137.0 863.0 172.6 91.27 130.0 870.0 174.0 93.08 137.0 863.0 172.6 90.89 185.0 815.0 163.0 88.610 300.0 700.0 140.0 74.1
As (III) R O + 0.001MpH Equil. Conc.(µg/L) Amount sorbed (µg/L) Amount sorbed (µg/g) % sorbed4 175.0 825.0 165.0 71.65 96.0 904.0 180.8 83.36 88.0 912.0 182.4 86.37 70.0 930.0 186.0 87.08 92.0 908.0 181.6 86.39 114.0 886.0 177.2 81.510 259.0 741.0 148.2 70.0
140
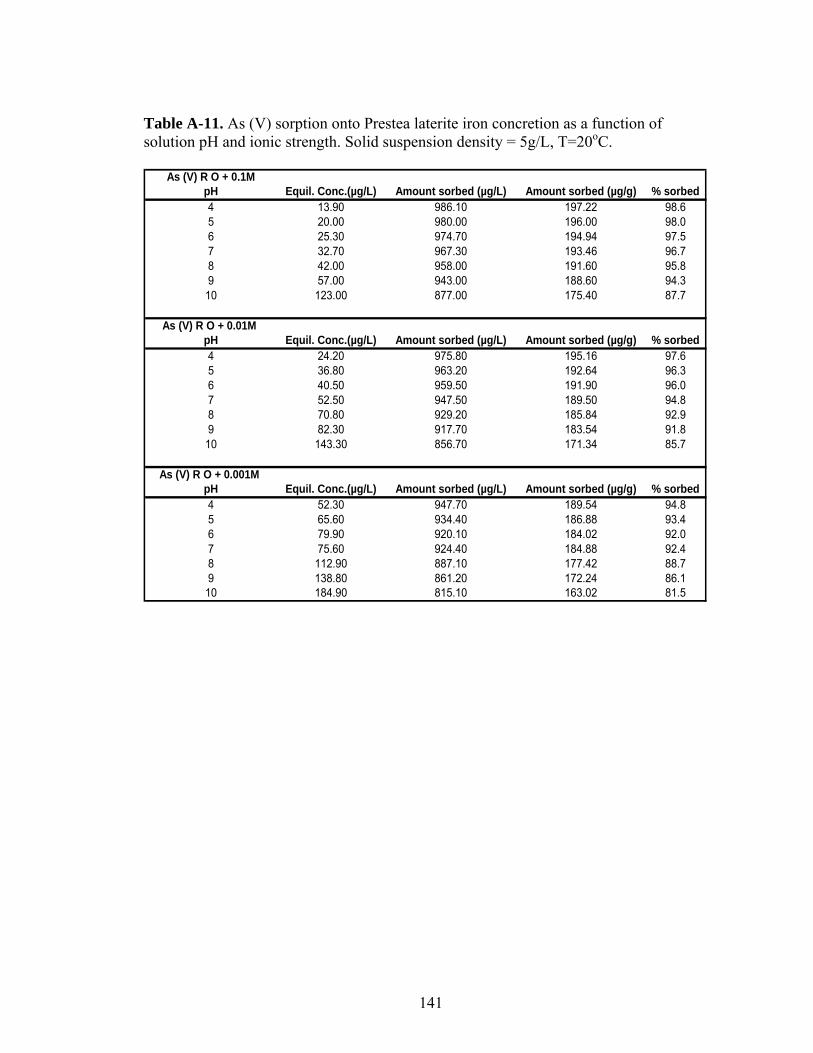
Table A-11. As (V) sorption onto Prestea laterite iron concretion as a function of solution pH and ionic strength. Solid suspension density = 5g/L, T=20oC.
As (V) R O + 0.1MpH Equil. Conc.(µg/L) Amount sorbed (µg/L) Amount sorbed (µg/g) % sorbed4 13.90 986.10 197.22 98.65 20.00 980.00 196.00 98.06 25.30 974.70 194.94 97.57 32.70 967.30 193.46 96.78 42.00 958.00 191.60 95.89 57.00 943.00 188.60 94.310 123.00 877.00 175.40 87.7
As (V) R O + 0.01M pH Equil. Conc.(µg/L) Amount sorbed (µg/L) Amount sorbed (µg/g) % sorbed4 24.20 975.80 195.16 97.65 36.80 963.20 192.64 96.36 40.50 959.50 191.90 96.07 52.50 947.50 189.50 94.88 70.80 929.20 185.84 92.99 82.30 917.70 183.54 91.810 143.30 856.70 171.34 85.7
As (V) R O + 0.001M pH Equil. Conc.(µg/L) Amount sorbed (µg/L) Amount sorbed (µg/g) % sorbed4 52.30 947.70 189.54 94.85 65.60 934.40 186.88 93.46 79.90 920.10 184.02 92.07 75.60 924.40 184.88 92.48 112.90 887.10 177.42 88.79 138.80 861.20 172.24 86.110 184.90 815.10 163.02 81.5
141

Table A-12. As (III) sorption onto Awaso laterite iron concretion as a function of solution pH and ionic strength. Solid suspension density = 5g/L, T=20oC.
As (III) R O + 0.1MpH Equil. Conc.(µg/L) Amount sorbed (µg/L) Amount sorbed (µg/g) % sorbed4 518.9 481.1 96.2 57.25 472.1 527.9 105.6 61.36 434.6 565.4 113.1 64.97 410.8 589.2 117.8 68.68 434.6 565.4 113.1 68.09 470.9 529.1 105.8 65.210 505.3 494.7 98.9 56.4
As (III) R O + 0.01MpH Equil. Conc.(µg/L) Amount sorbed (µg/L) Amount sorbed (µg/g) % sorbed4 427.8 572.2 114.4 72.15 386.5 613.5 122.7 75.26 351.2 648.8 129.8 78.07 314.0 686.0 137.2 79.68 320.4 679.6 135.9 77.79 348.4 651.6 130.3 74.510 436.0 564.0 112.8 70.8
As (III) R O + 0.001MpH Equil. Conc.(µg/L) Amount sorbed (µg/L) Amount sorbed (µg/g) % sorbed4 278.8 721.2 144.2 48.15 247.9 752.1 150.4 52.86 220.1 779.9 156.0 56.57 204.0 796.0 159.2 58.98 222.6 777.4 155.5 56.59 254.8 745.2 149.0 52.910 292.1 707.9 141.6 49.5
142

Table A-13. As (V) sorption onto Awaso laterite iron concretion as a function of solution pH and ionic strength. Solid suspension density = 5g/L, T=20oC.
As (V)R O + 0.1M NaClpH Equil. Conc.(µg/L) Amount sorbed (µg/L) Amount sorbed (µg/g) % sorbed4 239.5 760.5 152.1 76.15 244.1 755.9 151.2 75.66 254.5 745.5 149.1 74.67 256.5 743.5 148.7 74.48 259.6 740.4 148.1 74.09 276.9 723.1 144.6 72.3
10 307.8 692.2 138.4 69.2
As (V) R O + 0.01MpH Equil. Conc.(µg/L) Amount sorbed (µg/L) Amount sorbed (µg/g) % sorbed4 260.4 739.6 147.9 74.05 269.8 730.2 146.0 73.06 278.6 721.4 144.3 72.17 275.6 724.4 144.9 72.48 277.9 722.1 144.4 72.29 305.6 694.4 138.9 69.4
10 327.6 672.4 134.5 67.2
As (V) R O + 0.001MpH Equil. Conc.(µg/L) Amount sorbed (µg/L) Amount sorbed (µg/g) % sorbed4 311.4 688.6 137.7 68.95 316.9 683.1 136.6 68.36 317.4 682.6 136.5 68.37 319.8 680.2 136.0 68.08 323.5 676.5 135.3 67.69 332.3 667.7 133.5 66.8
10 369.4 630.6 126.1 63.1
143

Table A-14. Modeled As (III) sorption onto Prestea laterite iron concretion as a function of solution pH and ionic strength using the diffuse-layer model. Solid suspension density = 5 g/L, T = 25o C.
As (III) R O + 0.1M DLM DLM TLM TLMpH Model % sorbed Model Amt sorbed (µg/g) Model % sorbed Model Amt sorbed (µg/g)4.0 62.9 125.8 63.0 126.05.0 78.2 156.4 78.9 157.86.0 82.0 164.0 82.7 165.47.0 81.7 163.4 82.9 165.88.0 79.1 158.2 80.8 161.69.0 77.0 154.0 75.7 151.4
10.0 60.9 121.8 61.6 123.2
As (III) R O + 0.01MpH Model % sorbed Model Amt sorbed (µg/g) Model % sorbed Model Amt sorbed (µg/g)4.0 66.9 133.8 70.9 141.85.0 81.0 162.0 83.7 167.46.0 87.7 175.4 86.6 173.27.0 88.0 176.0 86.8 173.68.0 85.0 170.0 85.3 170.69.0 82.0 164.0 81.2 162.4
10.0 70.8 141.6 69.8 139.6
As (III) R O + 0.001MpH Model % sorbed Model Amt sorbed (µg/g) Model % sorbed Model Amt sorbed (µg/g)4.0 83.5 167.0 82.0 164.05.0 90.4 180.8 90.3 180.66.0 92.8 185.6 91.9 183.87.0 93.6 187.2 92.0 184.08.0 90.6 181.2 91.3 182.69.0 88.3 176.6 87.5 175.0
10.0 73.2 146.4 74.9 149.8
144

Table A-15 Modeled As (V) sorption onto Prestea laterite iron concretion as a function of solution pH and ionic strength using the diffuse-layer model. Solid suspension density = 5g/L, T = 25oC.
As (V) R O + 0.1M DLM DLMpH Model % sorbed Model Amt sorbed (µg/g)4.0 98.1 196.25.0 98.1 196.26.0 98.0 196.07.0 97.3 194.68.0 96.1 192.29.0 94.7 189.410.0 87.1 174.2
As (V) R O + 0.01M pH Model % sorbed Model Amt sorbed (µg/g)4.0 96.6 193.25.0 96.6 193.26.0 96.5 193.07.0 95.5 191.08.0 93.7 187.49.0 92.0 184.010.0 84.2 168.4
As (V) R O + 0.001M pH Model % sorbed Model Amt sorbed (µg/g)4.0 94.7 189.45.0 93.6 187.26.0 92.9 185.87.0 92.2 184.48.0 89.6 179.29.0 86.8 173.610.0 82.5 165.0
145
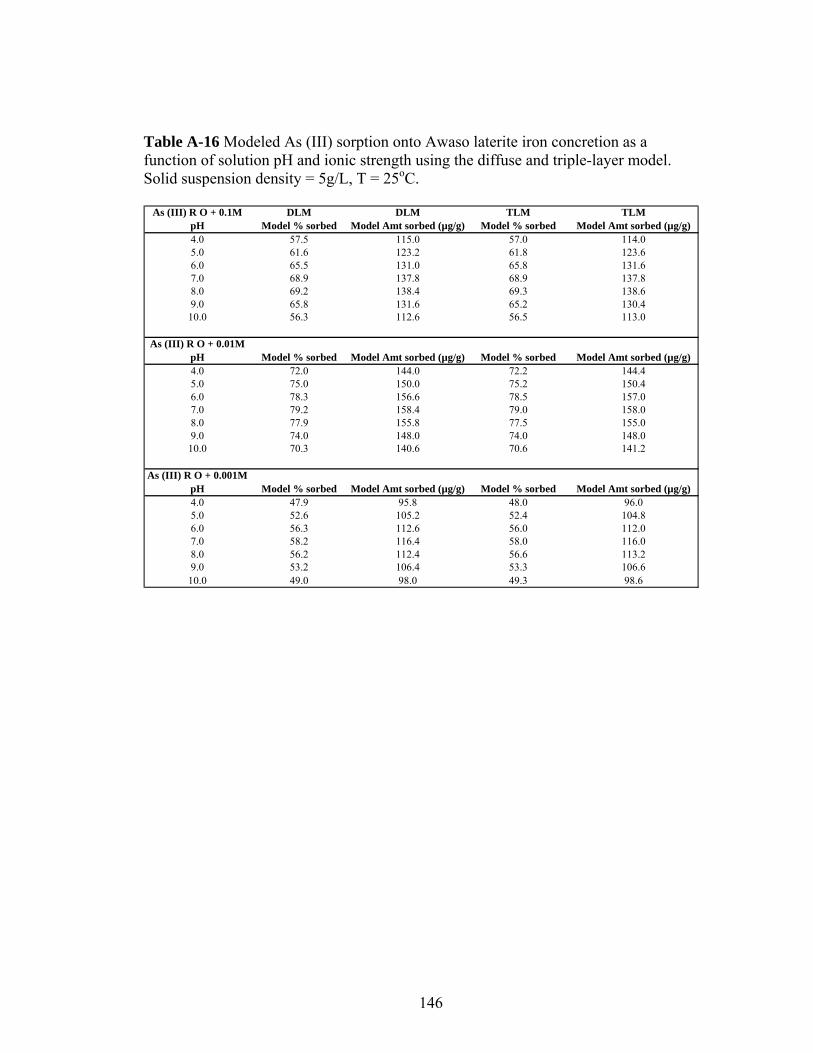
Table A-16 Modeled As (III) sorption onto Awaso laterite iron concretion as a function of solution pH and ionic strength using the diffuse and triple-layer model. Solid suspension density = 5g/L, T = 25oC.
As (III) R O + 0.1M DLM DLM TLM TLMpH Model % sorbed Model Amt sorbed (µg/g) Model % sorbed Model Amt sorbed (µg/g)4.0 57.5 115.0 57.0 114.05.0 61.6 123.2 61.8 123.66.0 65.5 131.0 65.8 131.67.0 68.9 137.8 68.9 137.88.0 69.2 138.4 69.3 138.69.0 65.8 131.6 65.2 130.410.0 56.3 112.6 56.5 113.0
As (III) R O + 0.01MpH Model % sorbed Model Amt sorbed (µg/g) Model % sorbed Model Amt sorbed (µg/g)4.0 72.0 144.0 72.2 144.45.0 75.0 150.0 75.2 150.46.0 78.3 156.6 78.5 157.07.0 79.2 158.4 79.0 158.08.0 77.9 155.8 77.5 155.09.0 74.0 148.0 74.0 148.010.0 70.3 140.6 70.6 141.2
As (III) R O + 0.001MpH Model % sorbed Model Amt sorbed (µg/g) Model % sorbed Model Amt sorbed (µg/g)4.0 47.9 95.8 48.0 96.05.0 52.6 105.2 52.4 104.86.0 56.3 112.6 56.0 112.07.0 58.2 116.4 58.0 116.08.0 56.2 112.4 56.6 113.29.0 53.2 106.4 53.3 106.610.0 49.0 98.0 49.3 98.6
146

Table A-17. Modeled As (V) sorption onto Awaso laterite iron concretion as a function of solution pH and ionic strength using the diffuse-layer model. Solid suspension density = 5g/L, T = 25oC.
As (V)R O + 0.1M DLM DLMpH Model % sorbed Model Amt sorbed (µg/g)4.0 76.2 152.45.0 76.2 152.46.0 75.9 151.87.0 74.8 149.68.0 74.8 149.69.0 74.3 148.6
10.0 68.2 136.4
As (V)R O + 0.01M pH Model % sorbed Model Amt sorbed (µg/g)4.0 74.1 148.25.0 74.2 148.46.0 74.1 148.27.0 73.4 146.88.0 72.3 144.69.0 71.6 143.2
10.0 66.7 133.4
As (V)R O + 0.001M pH Model % sorbed Model Amt sorbed (µg/g)4.0 68.8 137.65.0 68.3 136.66.0 67.8 135.67.0 67.9 135.88.0 66.3 132.69.0 65.3 130.6
10.0 63.0 126.0
147

Table A-18. Competitive sorption of As (III) and phosphate on Prestea LC. As (III) = 1.0mg/L, phosphate = 10mg/L. Suspension concentration, 15g/L.
As(III) + (10 mg/L PO4) pH Equil. Conc.(µg/L) Amount sorbed (µg/L) Amount sorbed (µg/g) % sorbed4 201.0 799.0 53.3 79.95 165.1 834.9 55.7 83.56 169.8 830.2 55.3 83.07 155.7 844.3 56.3 84.48 146.5 853.5 56.9 85.49 137.6 862.4 57.5 86.2
10 168.7 831.3 55.4 83.1As (III)
pH Equil. Conc.(µg/L) Amount sorbed (µg/L) Amount sorbed (µg/g) % sorbed4 110.3 889.7 59.3 89.05 41.1 958.9 63.9 95.96 18.4 981.6 65.4 98.27 14.4 985.6 65.7 98.68 25.4 974.6 65.0 97.59 56.6 943.4 62.9 94.3
10 124.3 875.7 58.4 87.6 Table A-19. Competitive sorption of As (III) and sulfate on Prestea LC. As (III) = 1.0mg/L, sulfate = 50mg/L. Suspension concentration, 15g/L.
As(III) + (50 mg/L SO4)pH Equil. Conc.(µg/L) Amount sorbed (µg/L) Amount sorbed (µg/g) % sorbed4 332.1 667.9 44.5 66.85 309.4 690.6 46.0 69.16 284.8 715.2 47.7 71.57 277.8 722.2 48.1 72.28 293.7 706.3 47.1 70.69 304.6 695.4 46.4 69.510 378.5 621.5 41.4 62.2
As (III)pH Equil. Conc.(µg/L) Amount sorbed (µg/L) Amount sorbed (µg/g) % sorbed4 110.3 889.7 59.3 89.05 41.1 958.9 63.9 95.96 18.4 981.6 65.4 98.27 14.4 985.6 65.7 98.68 25.4 974.6 65.0 97.59 56.6 943.4 62.9 94.310 124.3 875.7 58.4 87.6
148

Table A-20. Competitive sorption of As (V) and phosphate on Prestea LC. As (V) = 1.0mg/L, phosphate = 10mg/L. Suspension concentration, 15g/L.
As(V) + (10 mg/L PO4) pH Equil. Conc.(µg/L) Amount sorbed (µg/L) Amount sorbed (µg/g) % sorbed4 132.1 867.9 57.9 86.85 75.4 924.6 61.6 92.56 62.3 937.7 62.5 93.87 59.5 940.5 62.7 94.18 83.5 916.5 61.1 91.79 93.5 906.5 60.4 90.7
10 157.4 842.6 56.2 84.3
As (V) pH Equil. Conc.(µg/L) Amount sorbed (µg/L) Amount sorbed (µg/g) % sorbed4 12.9 987.1 65.8 98.75 15.2 984.8 65.7 98.56 14.4 985.6 65.7 98.67 14.0 986.0 65.7 98.68 14.8 985.2 65.7 98.59 17.7 982.3 65.5 98.2
10 23.2 976.8 65.1 97.7 Table A-21. Competitive sorption of As (V) and sulfate on Prestea LC. As (V) = 1.0mg/L, sulfate = 50mg/L. Suspension concentration, 15g/L.
As(V) + (500 mg/L SO4) pH Equil. Conc.(µg/L) Amount sorbed (µg/L) Amount sorbed (µg/g) % sorbed4 9.4 990.6 66.0 99.15 9.1 990.9 66.1 99.16 5.5 994.5 66.3 99.57 10.5 989.5 66.0 99.08 5.9 994.1 66.3 99.49 6.6 993.4 66.2 99.3
10 7.3 992.7 66.2 99.3As (V)
pH Equil. Conc.(µg/L) Amount sorbed (µg/L) Amount sorbed (µg/g) % sorbed4 12.9 987.1 65.8 98.75 15.2 984.8 65.7 98.56 14.4 985.6 65.7 98.67 14.0 986.0 65.7 98.68 14.8 985.2 65.7 98.59 17.7 982.3 65.5 98.2
10 23.2 976.8 65.1 97.7
149
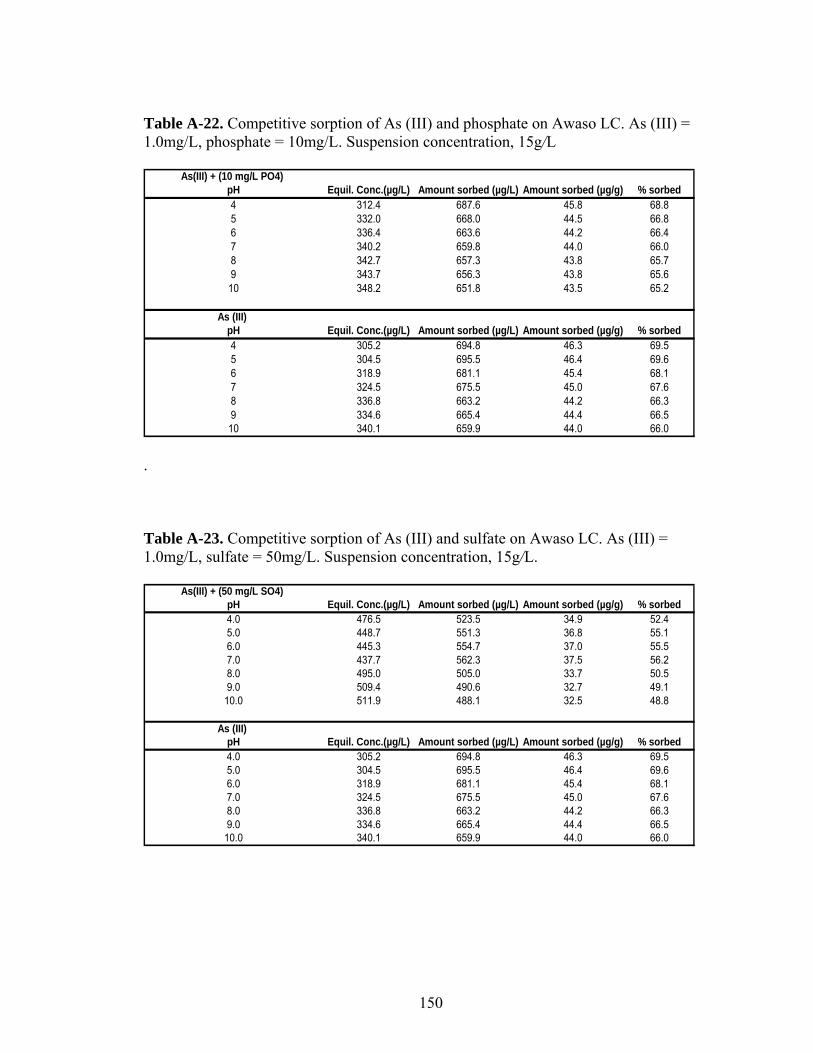
Table A-22. Competitive sorption of As (III) and phosphate on Awaso LC. As (III) = 1.0mg/L, phosphate = 10mg/L. Suspension concentration, 15g/L
As(III) + (10 mg/L PO4) pH Equil. Conc.(µg/L) Amount sorbed (µg/L) Amount sorbed (µg/g) % sorbed4 312.4 687.6 45.8 68.85 332.0 668.0 44.5 66.86 336.4 663.6 44.2 66.47 340.2 659.8 44.0 66.08 342.7 657.3 43.8 65.79 343.7 656.3 43.8 65.610 348.2 651.8 43.5 65.2
As (III) pH Equil. Conc.(µg/L) Amount sorbed (µg/L) Amount sorbed (µg/g) % sorbed4 305.2 694.8 46.3 69.55 304.5 695.5 46.4 69.66 318.9 681.1 45.4 68.17 324.5 675.5 45.0 67.68 336.8 663.2 44.2 66.39 334.6 665.4 44.4 66.510 340.1 659.9 44.0 66.0
.
Table A-23. Competitive sorption of As (III) and sulfate on Awaso LC. As (III) = 1.0mg/L, sulfate = 50mg/L. Suspension concentration, 15g/L.
As(III) + (50 mg/L SO4)
pH Equil. Conc.(µg/L) Amount sorbed (µg/L) Amount sorbed (µg/g) % sorbed4.0 476.5 523.5 34.9 52.45.0 448.7 551.3 36.8 55.16.0 445.3 554.7 37.0 55.57.0 437.7 562.3 37.5 56.28.0 495.0 505.0 33.7 50.59.0 509.4 490.6 32.7 49.1
10.0 511.9 488.1 32.5 48.8
As (III) pH Equil. Conc.(µg/L) Amount sorbed (µg/L) Amount sorbed (µg/g) % sorbed4.0 305.2 694.8 46.3 69.55.0 304.5 695.5 46.4 69.66.0 318.9 681.1 45.4 68.17.0 324.5 675.5 45.0 67.68.0 336.8 663.2 44.2 66.39.0 334.6 665.4 44.4 66.5
10.0 340.1 659.9 44.0 66.0
150
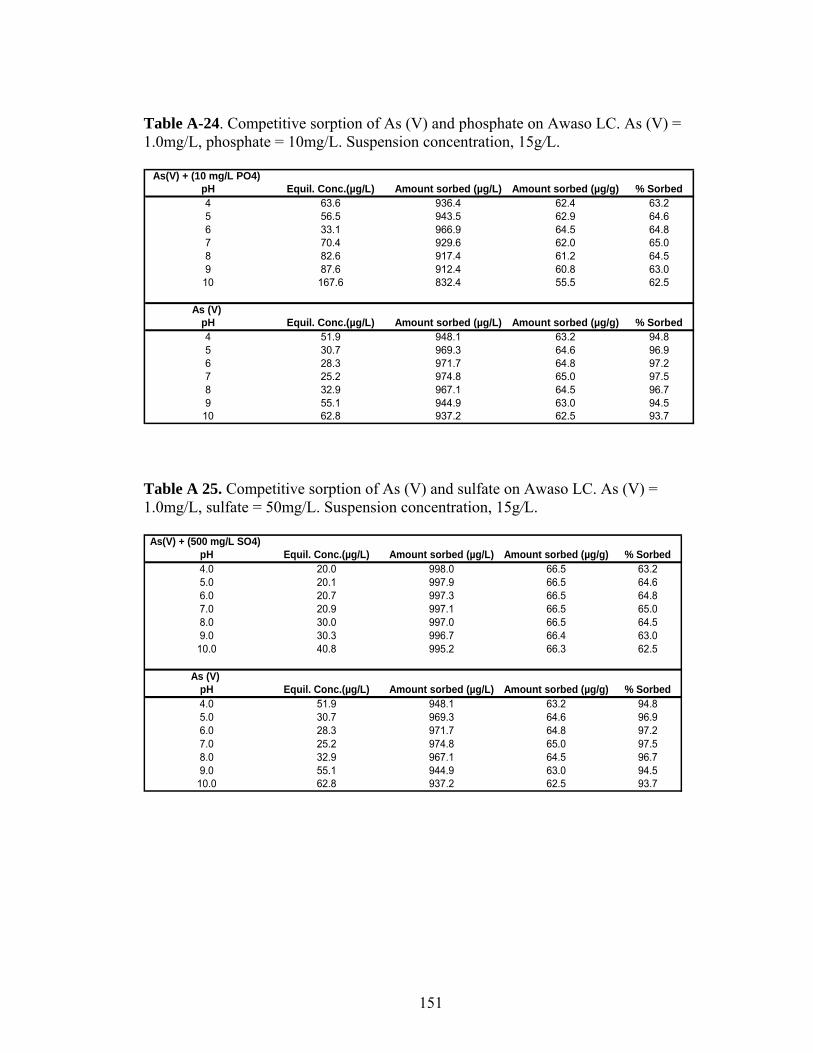
Table A-24. Competitive sorption of As (V) and phosphate on Awaso LC. As (V) = 1.0mg/L, phosphate = 10mg/L. Suspension concentration, 15g/L.
As(V) + (10 mg/L PO4) pH Equil. Conc.(µg/L) Amount sorbed (µg/L) Amount sorbed (µg/g) % Sorbed4 63.6 936.4 62.4 63.25 56.5 943.5 62.9 64.66 33.1 966.9 64.5 64.87 70.4 929.6 62.0 65.08 82.6 917.4 61.2 64.59 87.6 912.4 60.8 63.0
10 167.6 832.4 55.5 62.5
As (V) pH Equil. Conc.(µg/L) Amount sorbed (µg/L) Amount sorbed (µg/g) % Sorbed4 51.9 948.1 63.2 94.85 30.7 969.3 64.6 96.96 28.3 971.7 64.8 97.27 25.2 974.8 65.0 97.58 32.9 967.1 64.5 96.79 55.1 944.9 63.0 94.5
10 62.8 937.2 62.5 93.7 Table A 25. Competitive sorption of As (V) and sulfate on Awaso LC. As (V) = 1.0mg/L, sulfate = 50mg/L. Suspension concentration, 15g/L.
As(V) + (500 mg/L SO4) pH Equil. Conc.(µg/L) Amount sorbed (µg/L) Amount sorbed (µg/g) % Sorbed4.0 20.0 998.0 66.5 63.25.0 20.1 997.9 66.5 64.66.0 20.7 997.3 66.5 64.87.0 20.9 997.1 66.5 65.08.0 30.0 997.0 66.5 64.59.0 30.3 996.7 66.4 63.010.0 40.8 995.2 66.3 62.5
As (V) pH Equil. Conc.(µg/L) Amount sorbed (µg/L) Amount sorbed (µg/g) % Sorbed4.0 51.9 948.1 63.2 94.85.0 30.7 969.3 64.6 96.96.0 28.3 971.7 64.8 97.27.0 25.2 974.8 65.0 97.58.0 32.9 967.1 64.5 96.79.0 55.1 944.9 63.0 94.510.0 62.8 937.2 62.5 93.7
151

Table A-26. Electrophoretic mobility of Prestea laterite iron concretion as a function of pH in 0.01M NaCl solution. No Arsenic added.
pH 3 pH 4 pH 5 pH 6 pH 7 pH 8 pH 9 pH 9 pH 10 pH 10Measured pH 3.06 4.05 5.03 6.04 7.04 8.07 9.07 9.60 10.06 10.50
EM1 3.05 3.29 2.75 2.20 1.26 0.28 -1.16 -2.26 -3.30 -4.59EM2 3.07 3.30 2.78 2.18 1.26 0.26 -1.14 -2.24 -3.33 -4.62EM3 3.06 3.31 2.73 2.22 1.26 0.24 -1.12 -2.28 -3.33 -4.60
Average EM 3.06 3.30 2.75 2.20 1.26 0.26 -1.14 -2.26 -3.32 -4.60 Table A-27. Electrophoretic mobility of Prestea laterite iron concretion as a function of pH in 0.01M NaCl solution. 0.035mM As (III) concentration added.
pH 3 pH3 pH 3 pH 4 pH 5 pH 6 pH 7 pH 8 pH 9 pH 9 pH 10Measured pH 3.02 3.15 3.50 4.00 5.00 6.00 7.05 8.06 9.02 9.60 10.00
EM1 2.79 2.70 1.70 1.36 0.98 -1.21 -1.52 -2.10 -2.35 -2.90 -3.32EM2 2.78 2.68 1.68 1.32 0.96 -1.23 -1.56 -2.14 -2.39 -2.96 -3.01EM3 2.80 2.72 1.72 1.40 0.94 -1.25 -1.43 -2.10 -2.42 -2.86 -2.89
Average EM 2.79 2.70 1.70 1.36 0.96 -1.23 -1.50 -2.11 -2.39 -2.91 -3.07 Table A-28. Electrophoretic mobility of Prestea laterite iron concretion as a function of pH in 0.01M NaCl solution. 3.5mM As (III) concentration added.
pH 3 pH3 pH 3 pH 4 pH 5 pH 6 pH 7 pH 8 pH 9 pH 9 pH 10Measured pH 3.04 3.13 3.45 4.02 5.03 6.04 7.05 8.05 9.05 9.46 10.02
EM1 1.03 0.72 0.59 0.40 -0.74 -1.21 -2.41 -2.88 -3.02 -3.40 -3.75EM2 1.02 0.75 0.53 0.45 -0.77 -1.13 -2.44 -2.79 -3.05 -3.55 -3.70EM3 1.05 0.70 0.60 0.44 -0.66 -1.05 -2.39 -2.90 -3.06 -3.20 -3.66
Average EM 1.03 0.72 0.57 0.43 -0.72 -1.13 -2.41 -2.86 -3.04 -3.38 -3.70
Table A-29. Electrophoretic mobility of Prestea laterite iron concretion as a function of pH in 0.01M NaCl solution. 0.035mM As (V) concentration added.
pH 3 pH3 pH 4 pH 5 pH 6 pH 7 pH 8 pH 9 pH 9 pH 10 pH 10
Measured pH 3.02 3.50 4.00 5.00 6.00 7.05 8.06 9.02 9.60 10.00 10.50EM1 2.60 1.33 0.90 0.50 0.60 -0.99 -1.70 -2.03 -2.35 -2.36 -3.59EM2 2.65 1.40 0.96 0.55 0.62 -0.96 -1.78 -2.05 -2.25 -2.38 -3.60EM3 2.55 1.30 0.85 0.45 0.58 -0.95 -1.60 -2.00 -2.29 -2.20 -3.80
Average EM 2.60 1.34 0.90 0.50 0.60 -0.97 -1.69 -2.03 -2.30 -2.31 -3.66
152
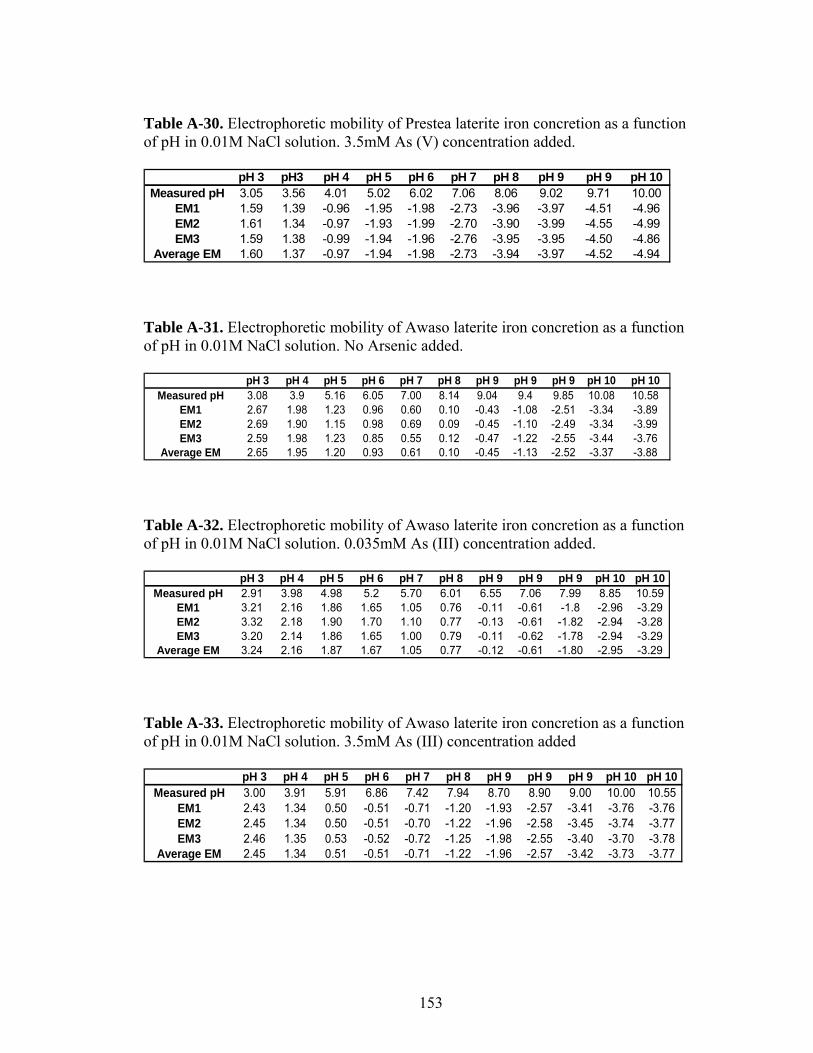
Table A-30. Electrophoretic mobility of Prestea laterite iron concretion as a function of pH in 0.01M NaCl solution. 3.5mM As (V) concentration added.
pH 3 pH3 pH 4 pH 5 pH 6 pH 7 pH 8 pH 9 pH 9 pH 10Measured pH 3.05 3.56 4.01 5.02 6.02 7.06 8.06 9.02 9.71 10.00
EM1 1.59 1.39 -0.96 -1.95 -1.98 -2.73 -3.96 -3.97 -4.51 -4.96EM2 1.61 1.34 -0.97 -1.93 -1.99 -2.70 -3.90 -3.99 -4.55 -4.99EM3 1.59 1.38 -0.99 -1.94 -1.96 -2.76 -3.95 -3.95 -4.50 -4.86
Average EM 1.60 1.37 -0.97 -1.94 -1.98 -2.73 -3.94 -3.97 -4.52 -4.94 Table A-31. Electrophoretic mobility of Awaso laterite iron concretion as a function of pH in 0.01M NaCl solution. No Arsenic added.
pH 3 pH 4 pH 5 pH 6 pH 7 pH 8 pH 9 pH 9 pH 9 pH 10 pH 10Measured pH 3.08 3.9 5.16 6.05 7.00 8.14 9.04 9.4 9.85 10.08 10.58
EM1 2.67 1.98 1.23 0.96 0.60 0.10 -0.43 -1.08 -2.51 -3.34 -3.89EM2 2.69 1.90 1.15 0.98 0.69 0.09 -0.45 -1.10 -2.49 -3.34 -3.99EM3 2.59 1.98 1.23 0.85 0.55 0.12 -0.47 -1.22 -2.55 -3.44 -3.76
Average EM 2.65 1.95 1.20 0.93 0.61 0.10 -0.45 -1.13 -2.52 -3.37 -3.88 Table A-32. Electrophoretic mobility of Awaso laterite iron concretion as a function of pH in 0.01M NaCl solution. 0.035mM As (III) concentration added.
pH 3 pH 4 pH 5 pH 6 pH 7 pH 8 pH 9 pH 9 pH 9 pH 10 pH 10Measured pH 2.91 3.98 4.98 5.2 5.70 6.01 6.55 7.06 7.99 8.85 10.59
EM1 3.21 2.16 1.86 1.65 1.05 0.76 -0.11 -0.61 -1.8 -2.96 -3.29EM2 3.32 2.18 1.90 1.70 1.10 0.77 -0.13 -0.61 -1.82 -2.94 -3.28EM3 3.20 2.14 1.86 1.65 1.00 0.79 -0.11 -0.62 -1.78 -2.94 -3.29
Average EM 3.24 2.16 1.87 1.67 1.05 0.77 -0.12 -0.61 -1.80 -2.95 -3.29 Table A-33. Electrophoretic mobility of Awaso laterite iron concretion as a function of pH in 0.01M NaCl solution. 3.5mM As (III) concentration added
pH 3 pH 4 pH 5 pH 6 pH 7 pH 8 pH 9 pH 9 pH 9 pH 10 pH 10Measured pH 3.00 3.91 5.91 6.86 7.42 7.94 8.70 8.90 9.00 10.00 10.55
EM1 2.43 1.34 0.50 -0.51 -0.71 -1.20 -1.93 -2.57 -3.41 -3.76 -3.76EM2 2.45 1.34 0.50 -0.51 -0.70 -1.22 -1.96 -2.58 -3.45 -3.74 -3.77EM3 2.46 1.35 0.53 -0.52 -0.72 -1.25 -1.98 -2.55 -3.40 -3.70 -3.78
Average EM 2.45 1.34 0.51 -0.51 -0.71 -1.22 -1.96 -2.57 -3.42 -3.73 -3.77
153
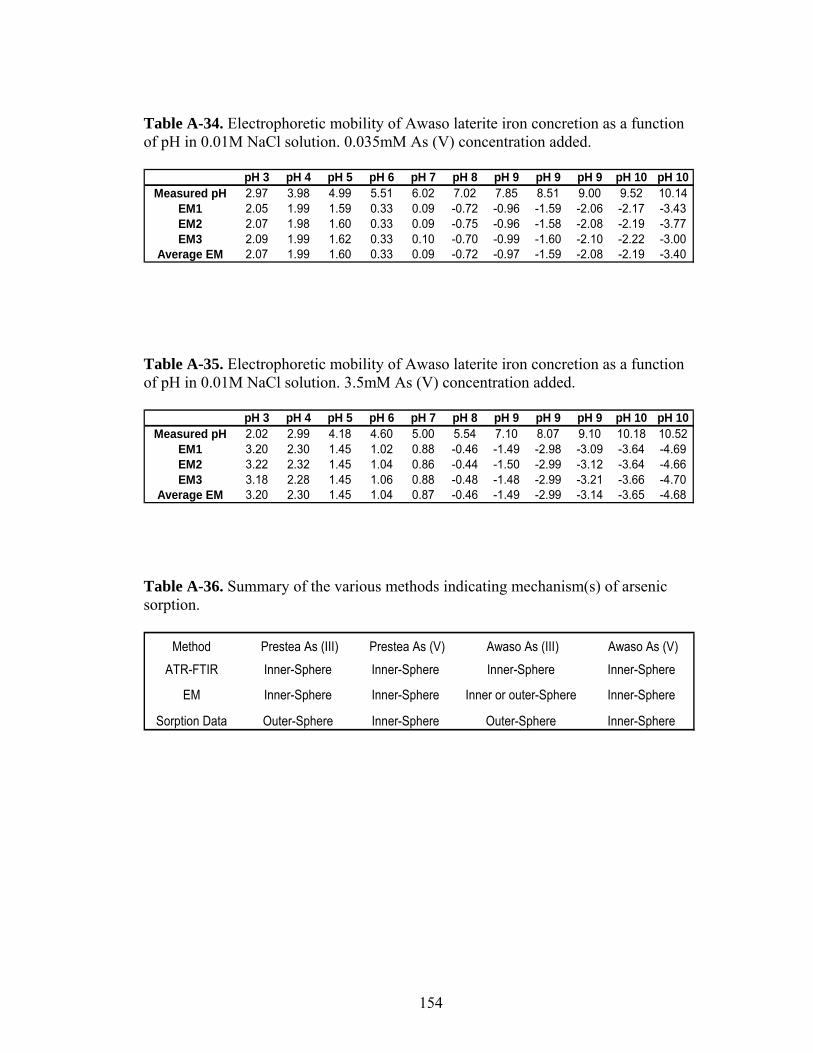
Table A-34. Electrophoretic mobility of Awaso laterite iron concretion as a function of pH in 0.01M NaCl solution. 0.035mM As (V) concentration added.
pH 3 pH 4 pH 5 pH 6 pH 7 pH 8 pH 9 pH 9 pH 9 pH 10 pH 10Measured pH 2.97 3.98 4.99 5.51 6.02 7.02 7.85 8.51 9.00 9.52 10.14
EM1 2.05 1.99 1.59 0.33 0.09 -0.72 -0.96 -1.59 -2.06 -2.17 -3.43EM2 2.07 1.98 1.60 0.33 0.09 -0.75 -0.96 -1.58 -2.08 -2.19 -3.77EM3 2.09 1.99 1.62 0.33 0.10 -0.70 -0.99 -1.60 -2.10 -2.22 -3.00
Average EM 2.07 1.99 1.60 0.33 0.09 -0.72 -0.97 -1.59 -2.08 -2.19 -3.40 Table A-35. Electrophoretic mobility of Awaso laterite iron concretion as a function of pH in 0.01M NaCl solution. 3.5mM As (V) concentration added.
pH 3 pH 4 pH 5 pH 6 pH 7 pH 8 pH 9 pH 9 pH 9 pH 10 pH 10Measured pH 2.02 2.99 4.18 4.60 5.00 5.54 7.10 8.07 9.10 10.18 10.52
EM1 3.20 2.30 1.45 1.02 0.88 -0.46 -1.49 -2.98 -3.09 -3.64 -4.69EM2 3.22 2.32 1.45 1.04 0.86 -0.44 -1.50 -2.99 -3.12 -3.64 -4.66EM3 3.18 2.28 1.45 1.06 0.88 -0.48 -1.48 -2.99 -3.21 -3.66 -4.70
Average EM 3.20 2.30 1.45 1.04 0.87 -0.46 -1.49 -2.99 -3.14 -3.65 -4.68
Table A-36. Summary of the various methods indicating mechanism(s) of arsenic sorption.
Method Prestea As (III) Prestea As (V) Awaso As (III) Awaso As (V)
ATR-FTIR Inner-Sphere Inner-Sphere Inner-Sphere Inner-Sphere
EM Inner-Sphere Inner-Sphere Inner or outer-Sphere Inner-Sphere
Sorption Data Outer-Sphere Inner-Sphere Outer-Sphere Inner-Sphere
154

Table A-37. Chemical composition of laterite concretions found elsewhere in the world.
This work This work [87] [83] [4]Ghana (Prestea) Ghana (Awaso) India Sri lanka Ivory coast
Constituents W(%) W(%) W(%) W(%) W(%) SiO2 13.51 4.80 39.25 54.15 2 TiO2 1.022 3.450 0.5 5.54 -
Al2O3 14.87 78.95 14.78 20.73 56 Fe2O3 70.05 8.19 45.64 12.39 21Mn2O3 0.027 0.003 1.52 0.23 - MgO 0.00 0.00 Trace 0.3 - CaO 0.07 0.04 Trace 0.28 - Na2O 0.03 0.06 Trace Trace - K2O 0.03 0.06 1.04 1.17 - P2O5 0.396 4.453 0.01 0.13 -LOI* 8.96 11.36 - - -
Table A-37. Continuation of Table A-37.
[4] [50] [4] [4] [4]south Africa Northern Ireland Australia Kenya Thialand
Constituents W(%) W(%) W(%) W(%) W(%) SiO2 26 34.98 3 11 47 TiO2 - 2.68 - - -
Al2O3 19 26.96 51.2 15 10 Fe2O3 35 16.41 12.8 25 30Mn2O3 - 0.38 - - - MgO - 0.94 - - - CaO - 0.4 - - - Na2O - 0.08 - - - K2O - 0.17 - - - P2O5 - 0.06 - - -LOI* - - - - -
155

Figure A-14. Triangular diagram showing various lateritic soils found around the world. Prestea and Awaso laterite concretions represent the end members of most laterite concretions.
156
Related Documents