Mechanical Energy Harvesting for Powering Distributed Sensors and Recharging Storage Systems Anthony Marin Dissertation submitted to the faculty of the Virginia Polytechnic Institute and State University in partial fulfillment of the requirements for the degree of Doctor of Philosophy in Mechanical Engineering Shashank Priya, Chair Srinath Ekkad Dong S. Ha Daniel J. Inman Walter F. O’Brien April 4 th , 2013 Blacksburg, VA Keywords: Electromagnetism, piezoelectricity, magnetostriction, vibration energy harvesting, wind energy harvesting, electromechanical modeling, sensor node Copyright © 2013 Anthony Marin

Welcome message from author
This document is posted to help you gain knowledge. Please leave a comment to let me know what you think about it! Share it to your friends and learn new things together.
Transcript

Mechanical Energy Harvesting for Powering Distributed Sensors and
Recharging Storage Systems
Anthony Marin
Dissertation submitted to the faculty of the
Virginia Polytechnic Institute and State University
in partial fulfillment of the requirements for the degree of
Doctor of Philosophy
in
Mechanical Engineering
Shashank Priya, Chair
Srinath Ekkad
Dong S. Ha
Daniel J. Inman
Walter F. O’Brien
April 4th
, 2013
Blacksburg, VA
Keywords: Electromagnetism, piezoelectricity, magnetostriction, vibration energy harvesting,
wind energy harvesting, electromechanical modeling, sensor node
Copyright © 2013 Anthony Marin

Mechanical Energy Harvesting for Powering Distributed Sensors and
Recharging Storage Systems
Anthony Marin
Abstract
Vibration energy harvesting has been widely investigated by academia and industry in the past
decade with focus on developing distributed power sources. One of the prime goals of energy
harvesters is to provide power to wireless sensors allowing for the placement of these sensors in
the remote and inaccessible areas where battery is not an option. Electromechanical modeling
approaches have been developed for enhancing the mechanical to electrical conversion
efficiencies utilizing electromagnetic, piezoelectric, and magnetostrictive mechanisms. Models
based upon the constitutive equations for these three conversion mechanisms, supported by
extensive experimental results available in literature, suggest that power requirement through
energy harvesters can be met only when the total volume is in the range of 1-100 cm3. There
exists a critical volume of 0.5 cm3 at which above which the electromagnetic mechanism exhibits
higher power density as compared to the other mechanisms. Therefore, in this thesis
electromagnetic energy conversion was adopted to develop high power energy harvesters. We
also present a novel vibration energy harvesting method which rivals the power density and
bandwidth of the traditional methods. The overarching theme throughout the design process was
selecting the structure and fabrication methodology that facilitates the transition of the
technology. The experimental models were characterized at accelerations and frequencies
typically found in the environmental vibration sources.
The thesis provides in-depth the design, modeling, and characterization of a vibration
energy harvester which creates relative motion differently than the conventional harvesters.

iii
Conventional designs rely on amplifying the original source displacement operating at the
resonance condition. In the harvester design proposed in this thesis, the relative motion is created
by cancelling the vibration at one location and transferring the source vibration directly to
another location by combining a vibration isolator with a vibration absorber. In this novel
configuration, termed as Direct Vibration Harvester (DVH), the energy is harvested directly from
the vibrating source mass rather than a vibrating seismic mass attached to the source increasing
the harvesting bandwidth and power density.
Four bar magnet and magnetic levitation architectures were modified and modeled to
reach closer to the theoretical maximum power densities. Extensive FEM was utilized to
understand the performance limitations of the existing structures and the results from this
analysis paved the pathway towards the development of the DVH. A comparative analysis of the
performance of the DVH with the traditional harvesting methods in terms of normalized power
output and bandwidth was conducted. Performance improvements of DVH required development
of the high efficiency rotational generators as linear to rotational conversion occurs in the DVH.
The optimized rotational generator was modeled and all the predicted performance metrics were
validated through experiments. The generator was applied towards the fabrication of DVH and
also in a micro windmill. The power density of the micro windmill was found to be better than
all the other results reported in literature. Extensive fluid and structural modeling was conducted
to tailor the performance of the micro windmill in the desired wind speed range.
Combined, this thesis provides significant advancement on many fronts. It pushes the
magnetic levitation and four-bar mechanism harvester systems to their theoretical limits. It
demonstrates a novel direct vibration harvester that has the possibility of surpassing the power
density and bandwidth of all the known vibration harvester with large magnitude of output

iv
power. It provides a design process for an efficient small scale electromagnetic generator that
can form for the backbone of many rotational and linear harvesters. This generator was used to
develop the world’s highest power density micro windmill in the small wind speed range.

v
Acknowledgements
I first and foremost thank Dr. Shashank Priya for giving me the opportunity to earn my
PhD in mechanical engineering at Virginia Tech. Throughout my time as a graduate student, Dr.
Priya has provided me much guidance and motivation which allowed me to face and solve the
technical challenges presented to me in my research. My research within the Center for Energy
Harvesting Materials and Systems has focused on transitioning laboratory science to real world
applications. I am thankful for the experience I have gained working at CEHMS as it will allow
me to adapt quickly to the rapid pace of research and development in my future career in
industry.
I also thank Ai Fukushima, Beth Howell and Erin Singleton for all of their assistance in
handling the paperwork for patents, contracts, travel reimbursement, and especially the numerous
order forms I have placed throughout my three years in the CEHMS lab.
I also thank Justin Farmer for his assistance in the lab and guidance in using vibration
characterization equipment early in my graduate career. I also thank Carlos Guevara for his
assistance and guidance in understanding digital signal processing of vibration data early in my
graduate career. I also thank Darian A. Schaab for assistance in simulations for double cell array
and micro wind turbine prototypes.
I also thank Dr. Srinath Ekkad, Dr. Dong S. Ha, Daniel J. Inman and Walter F. O’Brien
for serving on my PhD committee.
I also thank all of my colleagues in the CEHMS lab with whom I have had research
collaborations and/or shared experiences with outside the lab. I have made many friends during
my three years working in the lab and hope to maintain these friendships in the future.
I also thank my parents, Bob and Monica, my brother, Michael, and my sister, Courtney
for all of their support and motivation during my graduate student career. I also thank all my
friends from back home and undergrad for their support and motivation, especially Andrew who
I have shared many helpful and motivational conversations with throughout the three years.
I also gratefully acknowledge the financial support from Pratt & Whitney, NSF INAMM
program, NSF I/UCRC: Center for Energy Harvesting Materials and Systems (CEHMS).
vi
TABLE OF CONTENTS
Abstract.………………………………………………………………………………..………..ii
Acknowledgements……………………………………………………………………...…........v
Table of Contents……………………………………………………………………..………..vi
List of Figures……………………………………………………………………………..….…x
List of Tables…………………………………………………………………………….……..xx
1 CHAPTER 1: INTRODUCTION……………………………………………………..1
1.1 Background on energy harvesting………………………………………………………..1
1.2 Electromagnetic vibration energy harvester design and application……………………..5
1.3 Magnetism basics and mathematical formulations….…………………………………...10
1.4 Purpose of this thesis…………………………………………………………………….11
1.5 Layout of the Dissertation……………………………………………………………….12
2 CHAPTER 2: HIGH FREQUENCY (50 HZ to 200 HZ) VIBRATION ENERGY
HARVESTING…………………………………………………………………………15
2.1 Development of multiple cell configuration electromagnetic vibration energy
harvester………………………………………………………………………………….15
2.1.1 Introduction……………………………………………………………………...16
2.1.2 Electromagnetic harvester design………………………………………………..17
2.1.3 Experimental setup……………………………………………………………….20
2.1.4 Computational analysis of magnetic field distribution within air………………..21
2.1.5 Theoretical analysis of electromagnetic harvester…………………………….....24
2.1.6 Results and discussion…………………………………………………………...32
2.1.7 Summary…………………………………………………………………………37
2.2 Application: Powering wireless sensor nodes with multiple cell configuration energy
harvester………………………………………………………………………………….38
2.2.1 Introduction………………………………………………………………………39
2.2.2 Vibration energy harvester design……………………………………………….44
2.2.3 Impedance matching circuit design……………………………………………...52
2.2.4 Experimental results and discussion……………………………………………..56
2.2.5 Summary…………………………………………………………………………64
vii
3 CHAPTER 3: LOW FREQUENCY (< 50 Hz) VIBRATION ENERGY
HARVESTING………………………………………………………………………….65
3.1 Multi-mechanism non-linear vibration harvester combining inductive and
magnetostrictive mechanisms……………………………………………………………65
3.1.1 Introduction………………………………………………………………….......66
3.1.2 Multi-mechanism energy harvester design………………………………………70
3.1.3 Analytical model for energy harvester…………………………………………...73
3.1.4 Experimental setup…………………………………………………………....….81
3.1.5 Results and discussion…………………………………………………………...84
3.1.6 Summary………………………………………………………………………..101
3.2 Multi-mechanism non-linear vibration harvester combining inductive and piezoelectric
mechanisms……………………………………………………………………………..103
3.2.1 Introduction…………………………………………………………………….104
3.2.2 Multi-mechanism energy harvester (MMEH) design ………………………….107
3.2.3 Theoretical modeling…………………………………………………………...108
3.2.4 Results and discussion………………………………………………………….115
3.2.5 Summary………………………………………………………………………..119
4 CHAPTER 4: DESIGN FOR HIGH EFFICIENCY VIBRATION ENERGY
HARVESTING………………………………………………………………………...121
4.1 Combined isolator and absorber to create relative motion for high efficiency vibration
energy harvesting……………………………………………………………………….121
4.1.1 Introduction…………………………………………………………………….122
4.1.2 Direct Vibration Harvester design……………………………………………...127
4.1.3 Analytical Modeling and Theoretical Analysis………………………………...132
4.1.4 Experimental results…………………………………………………………….143
4.1.5 Summary………………………………………………………………………..151
4.2 Constant displacement and low frequency harvester utilizing a crank shaft to convert
linear motion to rotational motion……………………………………………………...152
4.2.1 Introduction…………………………………………………………………….153
4.2.2 Crankshaft harvester design…………………………………………………….154
4.2.3 Experimental results…………………………………………………………….155
viii
4.2.4 Summary………………………………………………………………………..156
5 CHAPTER 5: MICRO WIND TURBINE GENERATOR DEVELOPMENT …..157
5.1 Electrodynamic modeling of rotational generator for micro wind turbine energy
harvester………………………………………………………………………………...157
5.1.1 Introduction…………………………………………………………………….158
5.1.2 Micro wind turbine design……………………………………………………...164
5.1.3 Computational methods………………………………………………………...165
5.1.4 Analytical model for micro wind turbine harvester…………………………….167
5.1.5 Experimental setup……………………………………………………………...174
5.1.6 Results and discussion………………………………………………………….176
5.1.7 Summary………………………………………………………………………..178
5.2 Design of high power density generator for micro wind turbine……………………….179
5.2.1 Introduction……………………………………………………………………..180
5.2.2 Micro wind turbine design……………………………………………………...180
5.2.3 Analytical modeling and optimization of power output………………………..184
5.2.4 Experimental results…………………………………………………………….188
5.2.5 Summary………………………………………………………………………..195
6 CHAPTER 6: DESIGNING ENERGY HARVESTERS FOR WIRELESS SENSOR
NETWORK IMPEMENTATION IN SMART BUILDINGS……………………...196
6.1 Pen harvester for integration within smart buildings…………………………………...196
6.1.1 Introduction…………………………………………………………………….197
6.1.2 Pen harvester design……………………………………………………………198
6.1.3 Theoretical analysis…………………………………………………………….200
6.1.4 Results and discussion………………………………………………………….206
6.1.5 Summary………………………………………………………………………..209
7 CONCLUSIONS………………………………………………………………………210
7.1 Summary………………………………………………………………………………..210
7.2 Future work……………………………………………………………………………..217
REFERENCES………………………………………………………………………………..223
APPENDIX A: ANSYS FEA CODES……………………………………………………….230
A.1 Single cell magnetic flux analysis……………………………………………………...230
ix
A.2 Double cell magnetic flux density analysis…………………………………………….233
A.3 Double cell array magnetic flux density analysis……………………………………...236
A.4 Magnetic levitation magnetic flux density analysis……………………………………243
A.5 Magnetic levitation magnetic force analysis…………………………………………...244
A.6 Rotational generator magnetic flux analysis for rectangular magnets…………………247
A.7 Rotational generator magnetic flux analysis for arc shaped magnets………………….248
APPENDIX B: MATLAB CODES …………………………………………………………..253
B.1 Double cell array analysis……………………………………………………………...253
B.2 Magnetic levitation analysis……………………………………………………………266
B.3 Direct vibration harvester analysis……………………………………………………..268
B.4 Micro wind turbine analysis for calculating Φ…………………………………………271
B.5 Micro wind turbine analysis for determining varying gear ratio and load resistance effect
on power………………………………………………………………………………...279
x
List of Figures
Fig. 1.1 (a) Arbitrary output power as a function of arbitrary volume for various vibration energy
harvesting mechanisms, (b) Output power as a function of volume for energy harvesters found in
literature and industry……………..................................................................................................4
Fig. 1.2 Schematic of four bar electromagnetic energy harvester………………………………...6
Fig. 1.3 Illustration of the affect wire diameter has on the output voltage and power…………....9
Fig. 2.1 (a) Front view of the single cell harvester, (b) Front view of conventional method for
arraying coils……………………………………………………………………………………..19
Fig. 2.2 (a) Cross-section of the double cell harvester, and (b) Front view of the double cell
harvester………………………………………………………………………………………….20
Fig. 2.3 (a) Double cell harvester mounted to shaker arm, (b) Full experimental setup………...21
Fig. 2.4 (a) Variation in magnetic field strength between cells for the double cell harvester, (b)
Plot of magnetic field strength within an air gap for a three cell design, and (c) Plot of magnetic
field strength within an air gap for a four cell design……………………………………………24
Fig. 2.5 (a) Magnetic field vector map to ensure proper alignment in air gap, (b) Spatial variation
in magnetic field strength within the air gap of the double cell harvester, and (c) Cross section
view of the coil…………………………………………………………………………………...27
Fig. 2.6 A visual representation of the vector generated from the cross product of the velocity
and magnetic field vector (left facing blue line) and the coil length vector (blue line that turns
through a radius). A visual outline of the elliptical shaped coil is denoted by the red line. The
green filled red circles represent the location of each discrete calculation………………………30
Fig. 2.7 (a) Spatial representation of transformation factor after accounting for magnetic field
variation and at certain points on the coil, (b) Theoretical and experimental mode shape for
xi
double cell harvester beam, (c) Theoretical and experimental transformation factor for double
cell harvester beam, (d) Theoretical and experimental voltage as a function of excitation
frequency and (e) Theoretical and experimental power as a function of excitation frequency….31
Fig. 2.8 (a) Closed circuit voltage signals from each coil in the double cell harvester, (b)
Comparison of power generated between the double cell and single cell harvesters, and (c)
Comparison of voltage generated between the double cell and single cell harvesters…………..35
Fig. 2.9 Comparison of power generated from the three different harvesters…………………...37
Fig. 2.10 Number of publications per year focusing on “Vibration Energy Harvesting”. Search
was conducted on the INSPEC database………………………………………………………...39
Fig. 2.11: (a) Schematic of four bar magnet configuration, (b) “Double Cell” configuration, (c)
and configuration discussed in this section………………………………………………………41
Fig. 2.12 (a) Power as function of coil thickness for the double cell array and single cell
harvester, (b) variation in average magnetic flux density for right half of double cell array
(dashed lines separate the individual cells), (c) comparative analysis of a four double cell array
with an equivalent single cell having same total tip mass and magnet volume………………….46
Fig. 2.13 Expected output power from the broadband energy harvesting system predicted using
equation (4) across load resistance of 8080Ω……………………………………………………48
Fig. 2.14 Mesh of cantilever beam geometry modeled in ANSYS. The mesh density within the
beam element was 1.12 x 10¹⁰
nodes/m3………………………………………………………...49
Fig. 2.15 Pictures of the fabricated Vibration Energy Harvester. (a) front view, (b) side view and
(c) back view. The total volume and mass of the energy harvesting system was 1179 cm3 and
1.48 kg……………………………………………………………………………………………51
Fig. 2.16 Schematic diagram for the buck-boost converter used in this study…………………..53
xii
Fig. 2.17 Typical waveforms for DCM operation of buck-boost converter……………………..53
Fig. 2.18 Schematic of impedance matching circuit……………………………………………..55
Fig. 2.19 Experimental setup used for characterization of harvester performance……………...57
Fig. 2.20 (a) Power vs. load resistance, and (b) Power vs. frequency at the optimum load……..58
Fig. 2.21 Simulated power output with corrected experimentally measured damping ratio…….59
Fig. 2.22 (a) DC Power as a function of frequency, (b) Harvester AC mechanical power to DC
power output as function of frequency, (c) Breakdown of electrical efficiency losses within the
energy harvesting system………………………………………………………………………...62
Fig. 3.1 Real time condition-based health monitoring system…………………………………..66
Fig. 3.2 Image of the multi-mechanism energy harvester prototype…………………………….71
Fig. 3.3 (a) Galfenol clamp top view (b) side view……………………………………………...72
Fig. 3.4 Force as a function of center magnet composite displacement predicted by ANSYS…74
Fig. 3.5 (a) Response of decay from initial displacement, (b) Ratio of decaying amplitudes…..75
Fig. 3.6 (a) Magnetic flux density in radial direction (magnetic flux density units are in Tesla) (b)
Image of center magnet with respect to coil……………………………………………………..78
Fig. 3.7 Magnetic flux density in the radial direction within the coil volume…………………..79
Fig. 3.8 Magnetostrictive energy harvester where current is induced in the surrounding pick-up
coil………………………………………………………………………………………………..81
Fig. 3.9 (a) Harvester mounted to shaker arm, (b) Full experimental setup, (c) magnetostrictive
harvester experimental setup……………………………………………………………………..83
Fig. 3.10 Peak voltage and peak power as a function of frequency for 0.4 G (a-b), 0.7 G (c-d),
and 0.9 G (e-f) base acceleration. Circles represent simulated forward sweeps and dots represent
xiii
simulated backward sweeps. X represents experimental forward sweeps and + represent
experimental backward frequency sweeps……………………………………………………….87
Fig. 3.11 Frequency response function for 1 G base excitation…………………………………89
Fig. 3.12 Magnetostriction vs. magnetic flux density for Galfenol and nickel rods…………….92
Fig. 3.13 Voltage waveform taken from secondary coil without the Galfenol present to illustrate
the effect that the center magnet has on the magnetic fields surrounding the bottom and top
stationary magnets……………………………………………………………………………….94
Fig. 3.14 Performance of Galfenol and nickel under various pre-stress and bias conditions……96
Fig. 3.15 Theoretical and experimental values of peak power obtained from the magnetostrictive
part at 2N input force (input force correction factor x= 1, and 0.45) and magnetic permeability (
= 1*106 and 4*106* ) at 14 Hz using linear model…………………………………...98
Fig. 3.16 Simulated power output at low frequency of the magnetostrictive parts at various
values of input force from a look up table and magnetic permeability ( = 106 ). The input
forces were 2.1, 1.79, 1.39, 0.99, and 0.64 N at 14, 12.5, 11, 9, and 7 Hz frequencies
respectively………………………………………………………………………………………99
Fig. 3.17 Performance of magnetostrictive harvester at higher input energy level…………….101
Fig. 3.18 Harvesting various forms of energy through the various transportation modes of the
cargo container shipment……………………………………………………………………….104
Fig. 3.19 Image of fabricated MMEH………………………………………………………….108
Fig. 3.20 Magnetic field strength distribution surrounding oscillating center magnet…………110
Fig. 3.21 Simulation results from optimization study (a) coil length, (b) magnetic field strength,
(c) RMS power induced in harvester at 0.35 G acceleration…………………………………...112
Fig. 3.22 Net force on center magnet as a function of center magnet displacement…………...113
xiv
Fig. 3.23 Simulation results as predicted by ANSYS multiphysics……………………………114
Fig. 3.24 Image of experimental setup…………………………………………………………115
Fig. 3.25 Inductive mechanism experimental results (a) frequency response for 0.25 G (b)
frequency response for 0.5 G (c) and maximum RMS power at various accelerations………...117
Fig. 3.26 Piezoelectric mechanism experimental results (a) frequency response for 0.35 G (b)
frequency response for 1 G……………………………………………………………………..118
Fig. 3.27 Image of von Mises stress distribution within cap…………………………………...119
Fig. 4.1 Schematic description of vibration absorber for energy harvesting (a) stationary base and
(b) moving base…………………………………………………………………………………124
Fig. 4.2 Direct Vibration Harvesting concept described through representative spring-mass-
damper models. (a) vibration isolator, (b) vibration absorber, (c) vibration isolator and absorber
combined to create relative motion between the vibration source and almost stationary base, and
(d) implementation of a linear to rotational motion converter to amplify the relative motion…127
Fig. 4.3 (a) Image of the experimental setup of macro scale DVH, and (b) linear to rotational
converter, gear train, and generator…………………………………………………………….129
Fig. 4.4 Image of meso-scale direct vibration harvester (a) close-up of combined isolator and
absorber system (b) close-up of linear to rotational converter, gear train, and generator……...131
Fig. 4.5 Dynamic simulation of (a) macro scale prototype in response to base excitation of 0.25
G and 13.4 Hz (b) meso scale prototype in response to base excitation of 0.25 G and 14 Hz with
larger shaker (c) meso scale prototype in response to base excitation of 0.25 G and 14 Hz with
smaller shaker…………………………………………………………………………………..134
Fig. 4.6 (a) 14 different configuration of primary and absorber masses for two isolator mass
values are compared to determine if the mass of the isolator affects the power output, (b) analysis
xv
of the effect of the absorber/primary mass ratio on normalized power output. From this analysis a
linear and direct relationship between mass ratio and power output was found to exist, (c) power
output normalized by mass seems to increase with the decrease in primary mass squared, (d)
power output normalized by mass is linearly and directly dependent on the absorber mass for
every value of the primary mass, (e) both effects are clearly shown by simultaneously comparing
the two relationships……………………………………………………………………………139
Fig. 4.7 (a) Frequency response of systems with mass ratio of 0-0.25, (b) 0.25-0.5, (c) 0.5-0.75,
(d) 0.75-1.13……………………………………………………………………………………140
Fig. 4.8 Harvester with and (a) velocity of shaker arm and
primary mass, (b) displacement of shaker arm and primary mass, (c) relative velocity of shaker
arm and primary mass, (d) relative displacement of shaker arm and primary mass, harvester with
and (e) velocity of shaker arm and primary mass, (f)
displacement of shaker arm and primary mass, (g) relative velocity of shaker arm and primary
mass, (h) relative displacement of shaker arm and primary mass……………………………...142
Fig. 4.9 (a) Transfer function analysis for system with rigid connection, (b) transfer function
analysis for system with semi rigid connection………………………………………………...144
Fig. 4.10 Images of the various connections used in the analysis (a) linear to rotational coupler
(b) rigid connection, (c) semi-rigid connection………………………………………………...145
Fig. 4.11 (a) Rotational velocity of primary shaft as a function of resistive load (b) power as a
function of base acceleration…………………………………………………………………...146
Fig. 4.12 (a) Transfer function analysis for system with rigid connection, (b) transfer function
analysis for system with semi rigid connection, (c) transfer function analysis for system with
linear to rotational converter connected………………………………………………………...148

xvi
Fig. 4.13 Images of the various connections used in the analysis (a) rigid connection, b) semi-
rigid connection, and (c) linear to rotational coupler (rack and pinion)………………………..149
Fig. 4.14 (a) Rotational velocity of primary shaft as a function of resistive load (b) power as a
function of base acceleration…………………………………………………………………...150
Fig. 4.15 (a) Load resistance vs. power as simulated by the model presented in the modeling
section, (b) Load resistance and gear ratio vs. power as simulated with correction factor of
0.62……………………………………………………………………………………………...151
Fig. 4.16 (a-b) Image of the crank shaft mechanism at two different positions. The relative
displacement must be ~2.5 mm for rotation to occur, (c) image showing crankshaft mechanism
relative to other components……………………………………………………………………154
Fig. 4.17 Power generated using the crank shaft mechanism as the linear to rotational motion
converter………………………………………………………………………………………..155
Fig. 5.1 Timeline of energy cost for residential and commercial buildings. Data taken from U.S.
Energy Information Administration……………………………………………………………158
Fig. 5.2 Air flow speeds within duct and duct size for typical academic building. Values were
taken from actual building plans of a building on Virginia Tech campus……………………...160
Fig. 5.3 Performance comparison of published micro wind turbines. Output power is normalized
by device cross-sectional area and plotted as a function of wind speed……………………….162
Fig. 5.4 (a) Side view of micro wind turbine prototype with dimensions, and (b) Front view...165
Fig. 5.5 Process for obtaining CFD results for a given wind speed. is the free stream velocity
in front of the turbine, is the angular velocity of the turbine, is the torque imparted to the
turbine by the wind, is the load on the blades from generator, is the coupling
xvii
between mechanical and electrical energy which estimated by modeling the magnetic flux
density ……………………………………………………………………………….166
Fig. 5.6 Average magnetic flux density within coil volume as a function of the number of
sections in the z section…………………………………………………………………………171
Fig. 5.7 (a) Variation in magnetic flux density strength for the middle section of the coil
volume (b) Same contour plot overlaid onto picture of actual stator with eight coils, (c)
Arrangement of magnetic field and velocity vectors within coil volume………………………172
Fig. 5.8 Spatial representation of for one coil for the middle section……………………….173
Fig. 5.9 Experimental characterization setup…………………………………………………..175
Fig. 5.10 Empty squares represent experimental data and filled circles represent theoretical
values. (a) Comparison of experimental and theoretical voltage generated at various RPM (b)
Comparison of experimental and theoretical power generated at various RPM (c) Voltage output
from the generator over the operating range of the wind turbine as predicted by the simulation
along with the experimental measurements…………………………………………………….177
Fig. 5.11 (a) 1st generation generator magnetic circuit layout, (b) 2
nd generation generator
magnetic circuit layout…………………………………………………………………………181
Fig. 5.12 Air gap optimization illustrating the tradeoff between coil volume and magnet
spacing………………………………………………………………………………………….182
Fig. 5.13 (a) Image of generator components, (b) image of generator assembly………………183
Fig. 5.14 (a) Theoretical Cp vs TSR for 3 m/s wind speed, (b) blade power and blade torque vs
angular velocity for 3 m/s wind speed…………………………………………………….……186
Fig. 5.15 Power as a function of load resistance……………………………………………….187
xviii
Fig. 5.16 (a) Performance with implementation of gear train into the model showing that
increasing a gear ratio increases the load resistance and therefore the power output (b) power at
optimum load resistance vs. gear ratio………………………………………………………….188
Fig 5.17 Experimental setup using open jet wind tunnel……………………………………….189
Fig 5.18 (a) Experimental Cp vs TSR for 3 m/s wind speed, (b) blade power and blade torque vs.
angular velocity for 3 m/s wind speed………………………………………………………….190
Fig 5.19 (a) Model comparison with experiments with 4th
generation generator (b) model
comparison with experiments with 4th
generation generator with larger air gap……………….191
Fig. 5.20 Performance with implementation of gear train into the model with experimental blade
torque-velocity relationship, showing that increasing a gear ratio increases the load resistance
and therefore the power output (b) power at optimum load resistance vs. gear ratio…………..192
Fig. 5.21 Performance comparison of published micro wind turbines with the micro wind
turbines developed in this study. Output power is normalized by device cross-sectional area and
plotted as a function of wind speed……………………………………………………………..194
Fig. 6.1 Power requirement for various implantable and body worn medical sensors…………197
Fig. 6.2 Improved prototype Images (a) Pen harvester (b) Composite magnet………………...200
Fig. 6.3 Force as a function of center magnet composite displacement predicted by ANSYS (a)
pen harvester (b) magnetic levitation harvester………………………………………………...202
Fig. 6.4 Magnetic field distribution for single center magnet (a-b) and composite center magnet
(c-d)……………………………………………………………………………………………..204
Fig. 6.5 Transformation factor as a function of magnet position within pen harvester (a) single
coil (b) three coil………………………………………………………………………………..205
Fig. 6.6 Image of experimental setup…………………………………………………………..206

xix
Fig. 6.7 Voltage waveform for (a) 0.56 grms and 3 Hz (b) 1.14 grms at 5 Hz……………………207
Fig. 6.8 Simulation results: Center magnet velocity as a function of center magnet position…208
Fig. 7.1 State of art before the work described in this dissertation was completed (a) Volume
figure of merit as function of volume, (b) bandwidth figure of merit as a function of volume, (c)
volume figure of merit as a function of frequency, and (d) bandwidth figure of merit as a
function of frequency…………………………………………………………………………...211
Fig. 7.2 Performance of double cell and double cell array compared to the previous state of the
art (a) volume figure of merit as a function of volume and (b) bandwidth figure of merit as a
function of volume……………………………………………………………………………...213
Fig. 7.3 The performance of the magnetic levitation harvester developed in this work compared
to the existing state of the art (a) volume figure of merit as a function of volume and (b)
bandwidth figure of merit as a function of volume……………………………………………..214
Fig. 7.4 Comparing the direct vibration harvester and crankshaft harvester to the previous state
of art for inductive vibration energy harvesters (a) volume figure of merit as a function of
volume and (b) bandwidth figure of merit as a function of volume……………………………216
Fig. 7.5 Picture of magnetostrictive cantilever beam prototype………………………………..218
Fig. 7.6 The relationship between volume and power are shown as well as the relationship
between acceleration (input energy) and mechanical damping are shown as these affect the
power output but are independent of size………………………………………………………220
xx
List of Tables
Table 1.1 Performance Metrics for Various Piezoelectric and Electromagnetic Harvesters……..5
Table 2.1 Material Properties used in FEA modeling…………………………………………...50
Table 2.2 Components used in circuits shown in Fig. 2.16 and Fig. 2.18………………………54
Table 2.3 Mechanical damping ratio for each beam……………………………………………59
Table 2.4 Generator efficiency………………………………………………………………….60
Table 2.5 Summary of the state of art for inductive energy harvesters…………………………64
Table 3.1 List of prototype parameters………………………………………………………….85
Table 3.2 Summary of state-of-art for inductive magnetic levitation based harvesters………....89
Table 3.3 Simulation parameters for magnetostrictive energy harvester………………………..90
Table 3.4 Summary of various magnitudes and frequencies of vibration available from the
various modes of transport……………………………………………………………………...106
Table 4.1 Macro scale DVH mechanical system parameters…………………………………..128
Table 4.2 Meso-scale DVH mechanical system parameters…………………………………...130
Table 5.1 Summary of generator performance…………………………………………………193
1
1 CHAPTER 1: INTRODUCTION
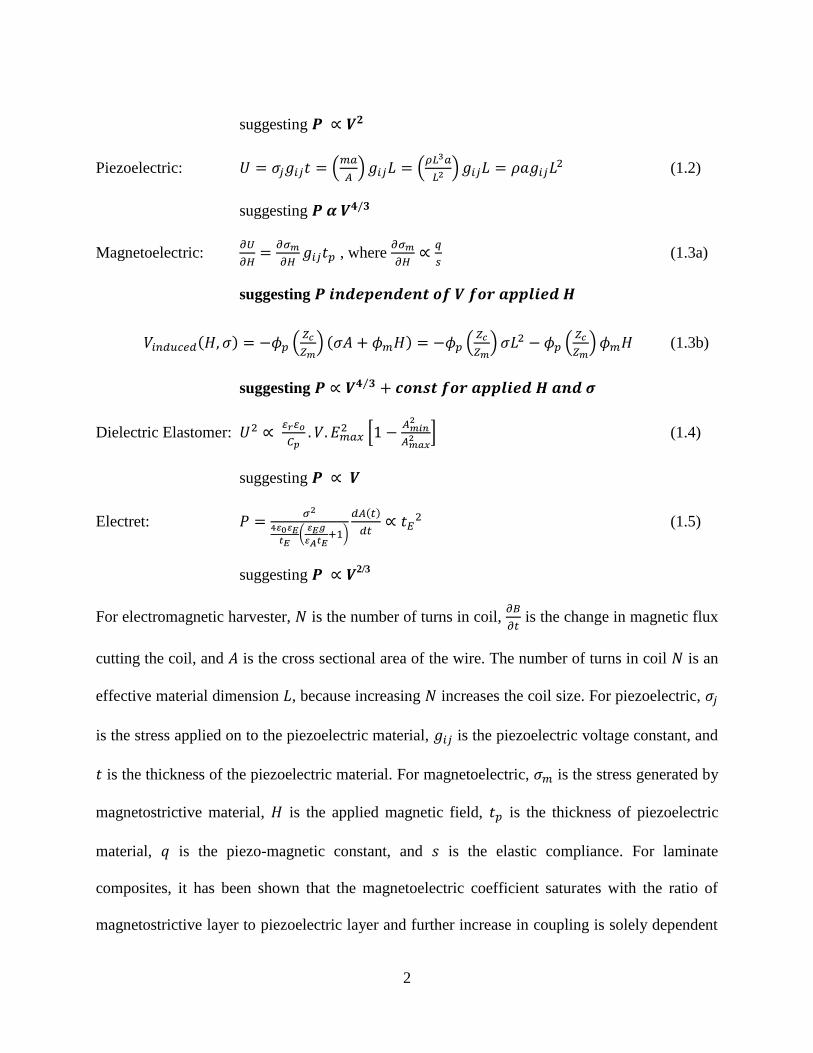
1.1 Background on energy harvesting Energy harvesting refers to the scavenging of wasted or freely available ambient energy
to generated electricity. Examples of energy sources include solar, thermal gradient, waves,
wind, and vibrations. The generated electric energy is typically stored in a capacitor or
rechargeable battery and dispersed to various sensors and devices on-demand. Energy harvesting
provides an alternative power source to batteries in implementation of wireless sensor network
(WSN), and the preferred power source in environments where replacement of a battery is
complex and/or costly. A wireless sensor network can be used for variety of purposes such as
real-time monitoring of the remote condition and structural health monitoring of various
components in real-world applications. Examples of these applications can include bridges,
bearing and wheels on rail and vehicles, ship hulls and propeller components, and turbine blades
in a jet engine.
In this thesis, the focus was on harvesting mechanical energy from vibration sources.
There are several mechanisms that can be utilized to convert vibration mechanical energy into
electrical energy including electromagnetic, piezoelectric, magnetoelectric, dielectric elastomers
and electrets. We present a simplistic calculation that shows the scaling of output power as a
function of effective material dimension for these different mechanisms. Equations (1.1) – (1.5)
show the output power (P = U2/R, where U is the output voltage and R is the load resistance) as a
function of effective material volume (V) for the different mechanisms:
Electromagnetic:
(1.1)
2
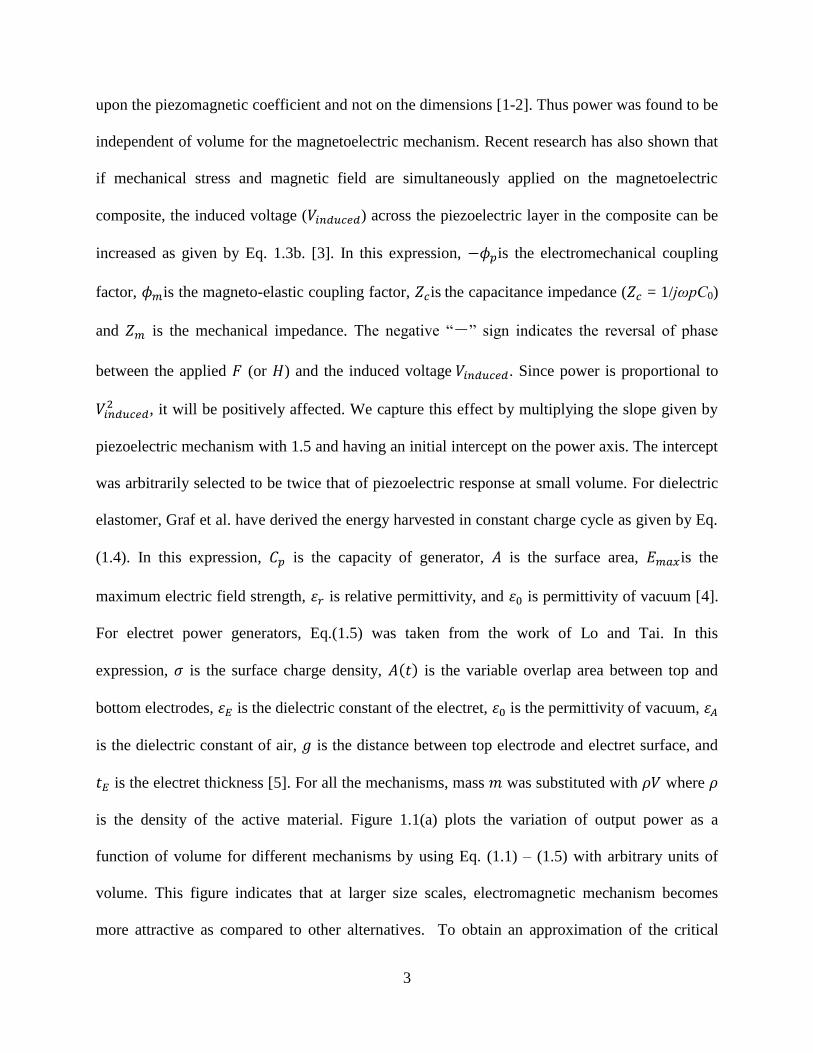
suggesting
Piezoelectric: (
) (
)
(1.2)
suggesting
Magnetoelectric:
, where
(1.3a)
suggesting
( ) (
) ( ) (
) (
) (1.3b)
suggesting ⁄
Dielectric Elastomer:
[
] (1.4)
suggesting
Electret:
(
)
( )
(1.5)
suggesting 2/3
For electromagnetic harvester, is the number of turns in coil,
is the change in magnetic flux
cutting the coil, and is the cross sectional area of the wire. The number of turns in coil is an
effective material dimension , because increasing increases the coil size. For piezoelectric,
is the stress applied on to the piezoelectric material, is the piezoelectric voltage constant, and
is the thickness of the piezoelectric material. For magnetoelectric, is the stress generated by
magnetostrictive material, is the applied magnetic field, is the thickness of piezoelectric
material, is the piezo-magnetic constant, and is the elastic compliance. For laminate
composites, it has been shown that the magnetoelectric coefficient saturates with the ratio of
magnetostrictive layer to piezoelectric layer and further increase in coupling is solely dependent
3
upon the piezomagnetic coefficient and not on the dimensions [1-2]. Thus power was found to be
independent of volume for the magnetoelectric mechanism. Recent research has also shown that
if mechanical stress and magnetic field are simultaneously applied on the magnetoelectric
composite, the induced voltage ( ) across the piezoelectric layer in the composite can be
increased as given by Eq. 1.3b. [3]. In this expression, is the electromechanical coupling
factor, is the magneto-elastic coupling factor, is the capacitance impedance ( = 1/jωpC0)
and is the mechanical impedance. The negative “-” sign indicates the reversal of phase
between the applied (or ) and the induced voltage . Since power is proportional to
, it will be positively affected. We capture this effect by multiplying the slope given by
piezoelectric mechanism with 1.5 and having an initial intercept on the power axis. The intercept
was arbitrarily selected to be twice that of piezoelectric response at small volume. For dielectric
elastomer, Graf et al. have derived the energy harvested in constant charge cycle as given by Eq.
(1.4). In this expression, is the capacity of generator, is the surface area, is the
maximum electric field strength, is relative permittivity, and is permittivity of vacuum [4].
For electret power generators, Eq.(1.5) was taken from the work of Lo and Tai. In this
expression, is the surface charge density, ( ) is the variable overlap area between top and
bottom electrodes, is the dielectric constant of the electret, is the permittivity of vacuum,
is the dielectric constant of air, is the distance between top electrode and electret surface, and
is the electret thickness [5]. For all the mechanisms, mass was substituted with where
is the density of the active material. Figure 1.1(a) plots the variation of output power as a
function of volume for different mechanisms by using Eq. (1.1) – (1.5) with arbitrary units of
volume. This figure indicates that at larger size scales, electromagnetic mechanism becomes
more attractive as compared to other alternatives. To obtain an approximation of the critical
4
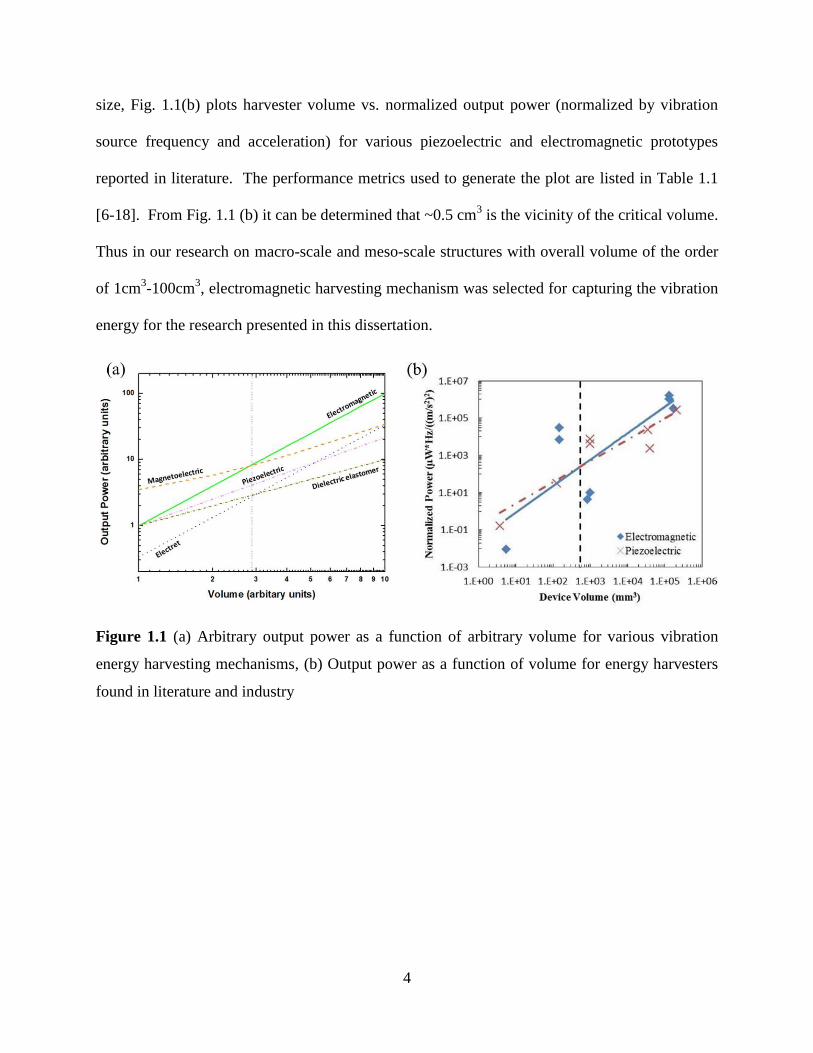
size, Fig. 1.1(b) plots harvester volume vs. normalized output power (normalized by vibration
source frequency and acceleration) for various piezoelectric and electromagnetic prototypes
reported in literature. The performance metrics used to generate the plot are listed in Table 1.1
[6-18]. From Fig. 1.1 (b) it can be determined that ~0.5 cm3 is the vicinity of the critical volume.
Thus in our research on macro-scale and meso-scale structures with overall volume of the order
of 1cm3-100cm
3, electromagnetic harvesting mechanism was selected for capturing the vibration
energy for the research presented in this dissertation.
Figure 1.1 (a) Arbitrary output power as a function of arbitrary volume for various vibration
energy harvesting mechanisms, (b) Output power as a function of volume for energy harvesters
found in literature and industry
5
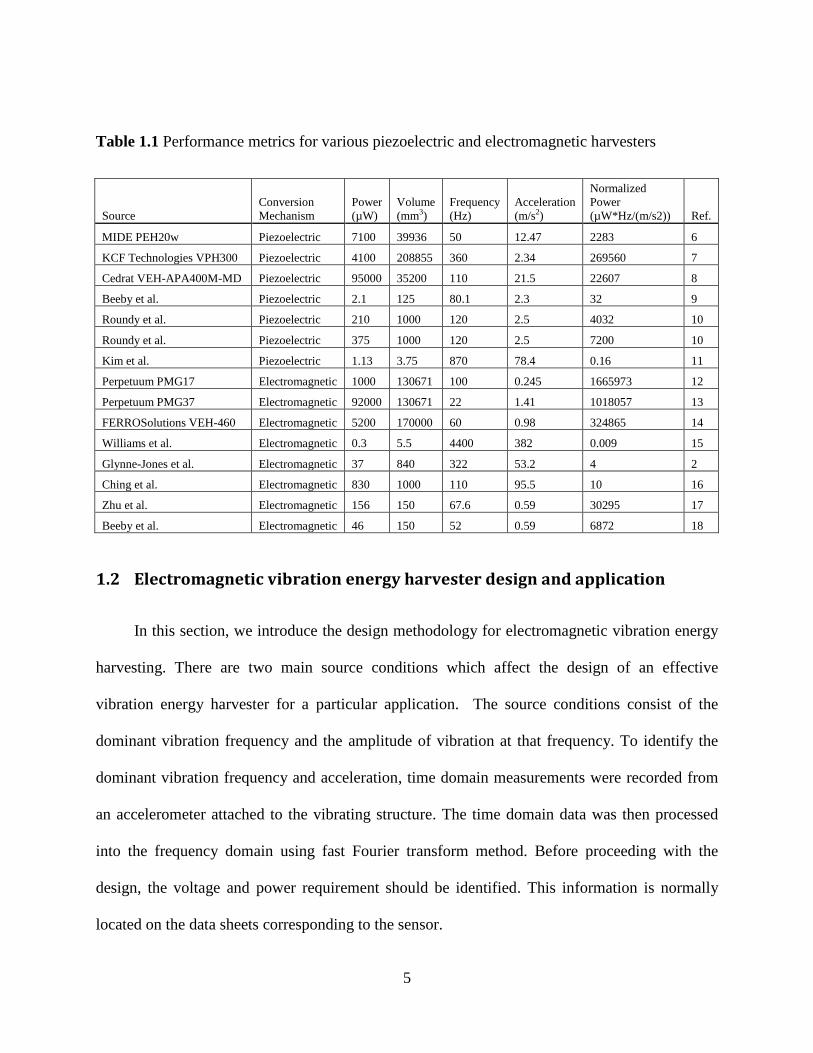
Table 1.1 Performance metrics for various piezoelectric and electromagnetic harvesters
Source
Conversion
Mechanism
Power
(µW)
Volume
(mm3)
Frequency
(Hz)
Acceleration
(m/s2)
Normalized
Power
(µW*Hz/(m/s2)) Ref.
MIDE PEH20w Piezoelectric 7100 39936 50 12.47 2283 6
KCF Technologies VPH300 Piezoelectric 4100 208855 360 2.34 269560 7
Cedrat VEH-APA400M-MD Piezoelectric 95000 35200 110 21.5 22607 8
Beeby et al. Piezoelectric 2.1 125 80.1 2.3 32 9
Roundy et al. Piezoelectric 210 1000 120 2.5 4032 10
Roundy et al. Piezoelectric 375 1000 120 2.5 7200 10
Kim et al. Piezoelectric 1.13 3.75 870 78.4 0.16 11
Perpetuum PMG17 Electromagnetic 1000 130671 100 0.245 1665973 12
Perpetuum PMG37 Electromagnetic 92000 130671 22 1.41 1018057 13
FERROSolutions VEH-460 Electromagnetic 5200 170000 60 0.98 324865 14
Williams et al. Electromagnetic 0.3 5.5 4400 382 0.009 15
Glynne-Jones et al. Electromagnetic 37 840 322 53.2 4 2
Ching et al. Electromagnetic 830 1000 110 95.5 10 16
Zhu et al. Electromagnetic 156 150 67.6 0.59 30295 17
Beeby et al. Electromagnetic 46 150 52 0.59 6872 18
1.2 Electromagnetic vibration energy harvester design and application
In this section, we introduce the design methodology for electromagnetic vibration energy
harvesting. There are two main source conditions which affect the design of an effective
vibration energy harvester for a particular application. The source conditions consist of the
dominant vibration frequency and the amplitude of vibration at that frequency. To identify the
dominant vibration frequency and acceleration, time domain measurements were recorded from
an accelerometer attached to the vibrating structure. The time domain data was then processed
into the frequency domain using fast Fourier transform method. Before proceeding with the
design, the voltage and power requirement should be identified. This information is normally
located on the data sheets corresponding to the sensor.
6
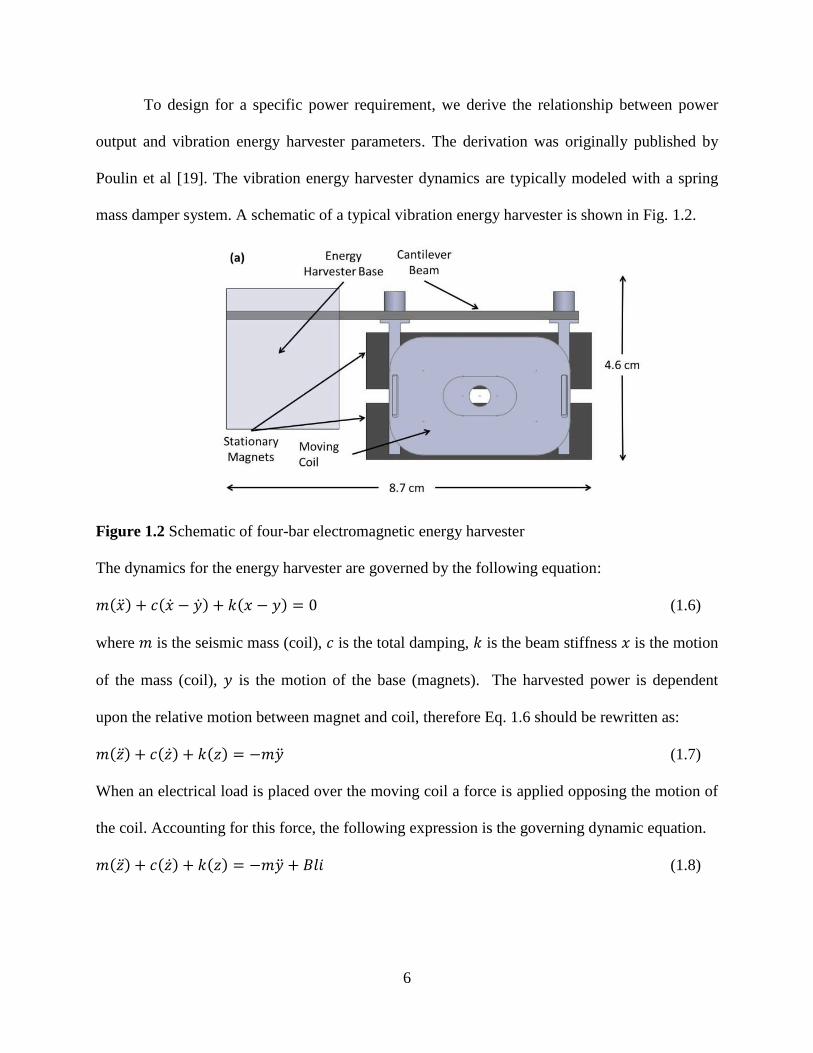
To design for a specific power requirement, we derive the relationship between power
output and vibration energy harvester parameters. The derivation was originally published by
Poulin et al [19]. The vibration energy harvester dynamics are typically modeled with a spring
mass damper system. A schematic of a typical vibration energy harvester is shown in Fig. 1.2.
Figure 1.2 Schematic of four-bar electromagnetic energy harvester
The dynamics for the energy harvester are governed by the following equation:
( ) ( ) ( ) (1.6)
where is the seismic mass (coil), is the total damping, is the beam stiffness is the motion
of the mass (coil), is the motion of the base (magnets). The harvested power is dependent
upon the relative motion between magnet and coil, therefore Eq. 1.6 should be rewritten as:
( ) ( ) ( ) (1.7)
When an electrical load is placed over the moving coil a force is applied opposing the motion of
the coil. Accounting for this force, the following expression is the governing dynamic equation.
( ) ( ) ( ) (1.8)

7
where is the magnetic field strength, is the length of wire in the moving coil, and is the
magnitude of current flow in the coil. The electrical component of the harvester can be modeled
by applying Kirchoff’s voltage law as:
(1.9)
where
are the electrical losses in the system and is the voltage generated by the
harvester. The two governing equations can then be converted into the Laplace domain, and
rearranged to develop the following transfer function between harvested voltage and applied
force .
( )
( )
( )(
) ( )
(1.10)
and average power can be calculated as:
| ( )|
(1.11)
( )
|( )(
) ( ) |
(1.12)
In order to meet the power requirement, given source acceleration and source frequency , we
select the size of the mass . Eq. 1.12 is maximum when the source frequency is equal to the
resonance frequency of the system. The resonance frequency may be approximated as
√ ⁄ . Therefore the next step in the design is to design the stiffness to meet the
resonance condition.
The mechanical components of the harvester and the electrical components need to be
designed in conjunction with each other. Thus, a new parameter, electromagnetic coupling or
transformation factor quantity, , is introduced at this stage. A trade-off exists between
magnetic field strength and coil length when determining the coil volume. As the coil volume
8
and length increases, the magnetic field strength cutting the outermost coil sections decreases.
Therefore, an optimum coil volume exists where any further increases only contribute to the
resistance to current rather than contributing to the transduction of current. The rate of the
magnetic field decrease varies depending on the permanent magnet geometry and surrounding
ferromagnetic components. The distribution is difficult to accurately model analytically and is
commonly simulated using finite element analysis. In this research, ANSYS electromagnetics is
utilized to determine the optimum coil volume. An example of this optimization can be shown in
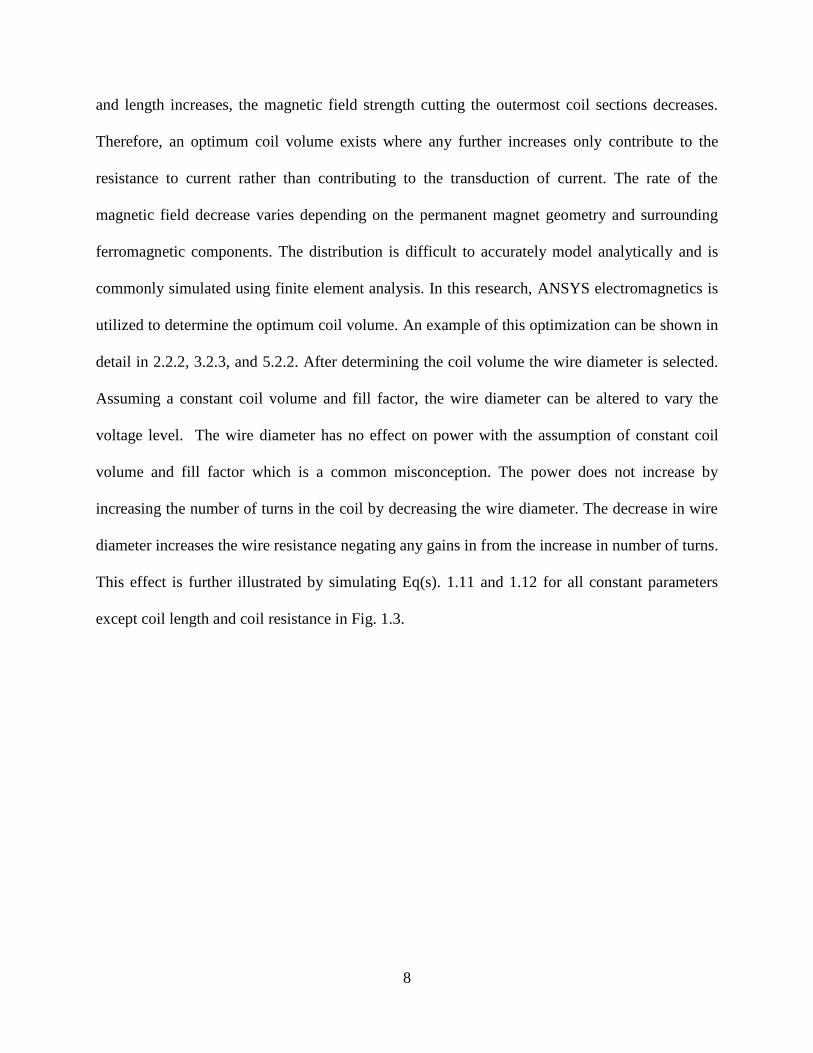
detail in 2.2.2, 3.2.3, and 5.2.2. After determining the coil volume the wire diameter is selected.
Assuming a constant coil volume and fill factor, the wire diameter can be altered to vary the
voltage level. The wire diameter has no effect on power with the assumption of constant coil
volume and fill factor which is a common misconception. The power does not increase by
increasing the number of turns in the coil by decreasing the wire diameter. The decrease in wire
diameter increases the wire resistance negating any gains in from the increase in number of turns.
This effect is further illustrated by simulating Eq(s). 1.11 and 1.12 for all constant parameters
except coil length and coil resistance in Fig. 1.3.

9
Figure 1.3 Illustration of the affect wire diameter has on the output voltage and power
Wire diameter selection is particularly important in applications where the harvester size is
small. In this application it is important to select a wire diameter small enough to produce a
large enough voltage to overcome a voltage drop across a rectifier. The current produced in
vibration energy harvesting is of the same form of the input vibration. Therefore, the alternating
current and must be converted into a direct current which is typically a sensor requirement.
Fig. 1.3 shows that an optimum load resistance exists; a resistance where the maximum
power is extracted from the mechanical system. The optimum load resistance effect is due to the
matching of electrical damping constant with mechanical damping constant. The mechanical
damping constant and electrical damping constant can be defined as:

10
√ (1.13)
( )
(1.14)
All parameters are fixed in the damping constant parameters except the load resistance.
Typically, vibration energy harvesters are characterized by placing a load resistor of the value of
optimum load resistance. In real applications, the impedance of the sensor is much different than
the optimum load resistor. In this case, placing a resistor in series with the sensor to match
resistance will cause large losses in harvestable power due to the current dissipation in the
resistor. Impedance matching circuitry can be implemented to meet the matching of source and
load impedance. The circuit consists of an oscillator which controls the rate at which a MOSFET
passes and blocks the flow of current. The details of this circuit can be found in 2.2.3. The design
methodology presented can be utilized to design an effective electromagnetic vibration energy
harvester for a particular application.
1.3 Magnetism basics and mathematical formulations Magnetic materials can be characterized at paramagnetic, diamagnetic, and
ferromagnetic. Paramagnetic materials retain magnetic field only when under an applied
magnetic field, and have a relative permeability of unity or greater than unity. Diamagnetic
materials repel an applied magnetic field, and have a relative permeability of less than unity.
Ferromagnetic materials remain magnetized in the absence of an applied magnetic field and have
relative permeability on order of 1000 to 10000. Relative permeability can defined as the
following:
(1.15)

11
where is the magnetic permeability of free space ( ) and permeability of
the material. The permeability is a measure of the magnetization in a material in response to an
external magnetic field.
A permanent magnet is commonly referred to as hard ferromagnetic material, and is
composed of naturally magnetic materials combined with ferromagnetic materials. Materials
such as iron, nickel are more commonly referred to as soft materials. The figure of merit for the
permanent magnets consists of the coercivity and BHmax. These values can be extracted from the
demagnetization curve provided by the manufacturers. The coercivity represents the magnitude
of applied magnetic field required to reduce the magnetization within a permanent magnet to
zero. The most commonly used permanent magnets are Neodymium Iron Boron (NdFeB) and
Samarium Cobalt (SmCo). NdFeB magnets are the strongest magnet with a coercivity of ~11
KOe and BHmax of ~41 MGOe [20]. SmCo magnets have a coercivity of ~9.5 KOe and BHmax of
~25.5 MGOe [21]. Though NdFeb magnets are stronger, they have a lower Curie temperature of
310ºC as compared to 800ºC for SmCo magnets. The Curie temperature represents the
temperature at which the magnet will lose its magnetization; therefore for high temperature
applications SmCo magnets are preferred. The magnets used in the following research consisted
of NdFeB Iron Boron.
1.4 Purpose of this thesis
The purpose of this research is to design, fabricate, and characterize energy harvesters for
various real-world applications. The end goal of each study involves powering a distributed
sensor or recharging system with a specific power requirement. The research focuses mainly on
harvesting vibration energy in applications such as railcars, ships, trucks, and humans. Each
study begins with clear identification of the available energy and source conditions for

12
harvesting. After introducing the motivation behind the work, derivation of governing equations
of motion, and voltage generation are presented. From analysis of the mathematical
relationships, key design variables are identified. A combination of finite element analysis,
analytical, and numerical solution techniques were utilized to enhance and optimize the design of
the various energy harvesters presented. In each study prototypes were fabricated and
experimentally characterized with for their output voltage and RMS power. The experimental
data was also used to validate the theoretical models. In depth discussions on experimental and
theoretical results are provided with the objective of fully understanding the electrodynamics
within each harvester. Lastly, suggestions for further improvement of the energy harvesters are
given with focus on meeting the power needs of the current generation of the sensors.
1.5 Layout of the Dissertation
A brief synopsis is given for each study/chapter below, and is organized in the order as it will
occur within the dissertation:
The first chapter of the dissertation describes design and characterization of a novel
double cell harvester that combines two four-bar magnet harvesters. The double cell harvester
was found to generate twice as much power as that of the traditional four-bar magnet single cell
harvester and resolves the phase difference issue experienced by two-beam / two-coil harvester.
This achievement provides a 55% increase in output power per unit volume and a 27% increase
in output power per unit volume and mass. The harvester can be utilized for harvesting in high
frequency applications (50 Hz to 200 Hz). In a separate study, the double cell harvester is
integrated with an electrical system, which improves upon the performance of the previous
studies in terms of operation bandwidth and mechanical to electrical power conversion. The
average generator conversion efficiency for the double cell array was 45.3% which approaches
13
the maximum theoretical limit of 50%. The average AC to regulated DC power conversion
efficiency across all frequencies was 78% which is one of the highest reported magnitude for
electromagnetic vibration harvesting system.
The second chapter investigates non-linear vibration harvesting utilizing magnetic
levitation based harvesters for low frequency applications (< 50 Hz). Novel approaches to multi-
mechanism harvesting combining the electromagnetic mechanism with piezoelectric and
magnetostrictive mechanisms are investigated in an effort to increase the power density and
bandwidth of the harvester. The inductive mechanism for the combined inductive/piezoelectric
prototype sets the state-of-art in volume figure of merit for magnetic levitation prototypes.
The third chapter presents a novel energy harvesting concept in an effort to improve upon
the harvesting bandwidth and power density limitations of the previously introduced vibration
energy harvesters (four-bar magnet and levitating magnet configurations). Relative motion was
created without amplification of the original source displacement by cancelling the vibration at
one location and transferring the source vibration directly to another location by combining a
vibration isolator with a vibration absorber. In this novel harvester configuration, termed as
“Direct Vibration Harvester (DVH)”, the power is harvested directly from the vibrating source
mass rather than a vibrating seismic mass attached to the source. Source displacements from real
world applications are often on the level of 0.02 mm to 2 mm. As the DVH does not amplify the
source displacement, this presents a challenge in harvesting the high force/energy content and
low displacement vibration. To this end, we convert the linear vibration to rotational motion and
amplify the rotational motion using a gear train. The fabricated prototype harvested 45 mW @
0.9 G base acceleration and weighed 462 grams. Through analytical modeling it was determined
that a prototype could generate 87 mW @ 1 G base acceleration and only weighs 243 grams.
14
Also, an optimal balance between the bandwidth and maximum power harvested exists as shown
by the parametric analysis.
The fourth chapter describes the development of a permanent magnet rotational generator
which serves as the generator for the DVH described in the third chapter. The generator is also
applied as the generator for a micro wind turbine application. The application consists of
harvesting airflow within HVAC ducts in residential and commercial buildings to power various
sensors. HVAC ducts within Durham hall at Virginia Tech were modified in order to provide an
experimental platform to evaluate the capability of the harvester. The fabricated generator sets
the state-of-art for micro turbine power density.
Lastly, the fifth chapter describes the implementation of the various energy harvesters in
a “smart building”. To this end, an additional energy harvester was developed which can be
integrated into a common pen, and used to monitor the location and condition of the human
within the building.
15
2 CHAPTER 2: HIGH FREQUENCY (50 HZ to 200 HZ) VIBRATION ENERGY HARVESTING
2.1 Development of multiple cell configuration electromagnetic vibration energy harvester
This chapter reports the design of an electromagnetic vibration energy harvester that
doubles the magnitude of output power generated by the prior four-bar magnet configuration
reported in literature. This enhancement was achieved with minor increase in volume by 23%
and mass by 30%. The new “double cell” design utilizes an additional pair of magnets to create a
secondary air gap, or cell, for a second coil to vibrate within. To further reduce the dimensions of
the device, two coils were attached to one common cantilever beam. These unique features lead
to improvements of 66% in output power per unit volume (power density) and 27% increase in
output power per unit volume and mass (specific power density), from 0.1 to 0.17 mW/cm3 and
0.41 to 0.51 mW/cm3*kg respectively. Using the ANSYS multiphysics analysis, it was
determined that for the double cell harvester, adding one additional pair of magnets created a
small magnetic gradient between air gaps of 0.001T which is insignificant in terms of
electromagnetic damping. Analytical model was developed to optimize the magnitude of
transformation factor and magnetic field gradient within the gap.

16
2.1.1 Introduction
The performance and capabilities of wireless sensor networks continue to rise. At the
same time, there has been significant progress in development of energy harvesters that can
enhance the lifetime and limitations of a conventional battery. Vibration energy harvesting has
been pursued both as an alternative and supplement to batteries by various researchers, and in
recent years there has been a surge in the number of publications in this area [1-18, 22-27]. In the
previous chapter, Fig. 1.1(a-b) showed that a critical volume exists where electromagnetic
mechanism is preferred for energy harvesting. The size of the overall harvester in this study is on
the order of 100 cm3 and therefore electromagnetic induction mechanism was chosen.
Electromagnetic vibration energy harvesting has been widely investigated in literature.
El-hami et al. developed a harvester by attaching magnets to a vibrating beam that creates a
magnetic field around a stationary coil attached to a base. As base excitation was applied, the
relative motion between the magnets and coil creates a voltage in the coil [22]. Glynne-Jones et
al. improved upon this design by adding another set of magnets which increased the area of
magnetic field [23]. O’Donnell et al. investigated scaling conditions for output power in terms of
system parameters such as magnetic field, coil parameters, electromagnetic and mechanical
damping [24]. Beeby et al. suggested that four-bar magnet energy harvesters perform optimally
when the mechanical damping ratio is equal to the electrical damping ratio [25]. The research at
CEHMS, Virginia Tech on electromagnetic energy harvesters has utilized both four-bar
configuration [26] and cylindrical configuration [27] and developed the fundamental
understanding of parameters that influence the overall performance. However, the focus of
previous research has been on optimizing and scaling the four-bar magnet geometry with a single
vibrating beam and coil. Minimal development towards modifying the four-bar magnet geometry
17
to harvest energy with multiple coils has been documented in literature. Some researchers have
used multiple coils for electromagnetic energy harvesting in an effort to harvest at broadband
frequencies [28-29]. None of these researchers however have utilized the compact four-bar
geometry in their designs or have conducted optimization of output power per unit volume and
mass. The only attempt to utilize the four-bar magnet geometry with multiple coils was made by
Oliver and Priya, however the enhancement in output power was limited due to voltage phase
mismatch between coils disallowing complete summation of voltages [26]. Therefore, the goal in
this thesis was to alter the design of the four-bar magnet energy harvester in order to increase the
output power per unit volume and mass and to allow the arraying of coils without voltage phase
mismatch. This chapter presents the design and experimentation of the “double cell” harvester
that generates twice the output power generated by the prior published four-bar magnet geometry
while only increasing the volume by 23% and mass by 30%, consequently providing a 27%
increase in output power per unit volume and mass. The double cell harvester also eliminates
voltage phase mismatch providing a method for efficiently arraying multiple coils in series
connection.
2.1.2 Electromagnetic harvester design
The four-bar magnet harvester will be referred as “single cell” in this paper. Using the
results from the optimization study conducted by Oliver and Priya, the dimensions of harvester
components for both single cell and double cell harvesters were selected [26]. Particularly the
“race track” coil design was adopted due to the advantages in terms of mechanical to electrical
energy coupling. Also the coils were positioned in the same location relative to the magnets.
The target vibration source frequency and acceleration level were chosen based on
vibration available from common household and industrial equipment [10]. The target vibration
18
source frequency and acceleration level range were 90-200 Hz and 0.5-1 g respectively. The
beams for the single cell and double cell harvesters were designed to resonate within the
vibration source frequency range at similar frequencies to compare performance. The beam’s
natural frequency ( ) is related to beam stiffness ( ) and tip mass ( ) by the formula (
√ ) [30]. The coil for the single cell and double cell harvester consisted of 2400 turns of 38
gauge copper wire. The difference between the two harvesters existed in the number of rows of
the magnets and beam design as described below.
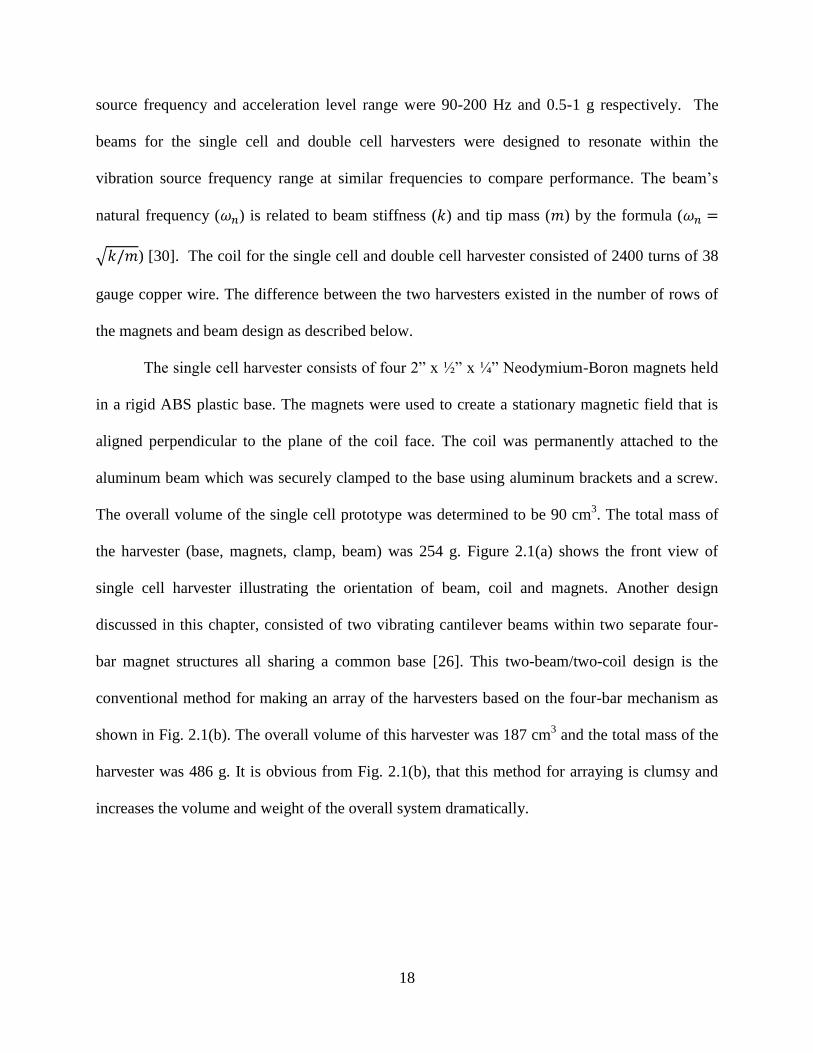
The single cell harvester consists of four 2” x ½” x ¼” Neodymium-Boron magnets held
in a rigid ABS plastic base. The magnets were used to create a stationary magnetic field that is
aligned perpendicular to the plane of the coil face. The coil was permanently attached to the
aluminum beam which was securely clamped to the base using aluminum brackets and a screw.
The overall volume of the single cell prototype was determined to be 90 cm3. The total mass of
the harvester (base, magnets, clamp, beam) was 254 g. Figure 2.1(a) shows the front view of
single cell harvester illustrating the orientation of beam, coil and magnets. Another design
discussed in this chapter, consisted of two vibrating cantilever beams within two separate four-
bar magnet structures all sharing a common base [26]. This two-beam/two-coil design is the
conventional method for making an array of the harvesters based on the four-bar mechanism as
shown in Fig. 2.1(b). The overall volume of this harvester was 187 cm3 and the total mass of the
harvester was 486 g. It is obvious from Fig. 2.1(b), that this method for arraying is clumsy and
increases the volume and weight of the overall system dramatically.
19
Figure 2.1: (a) Front view of the single cell harvester, (b) Front view of conventional method for
arraying coils
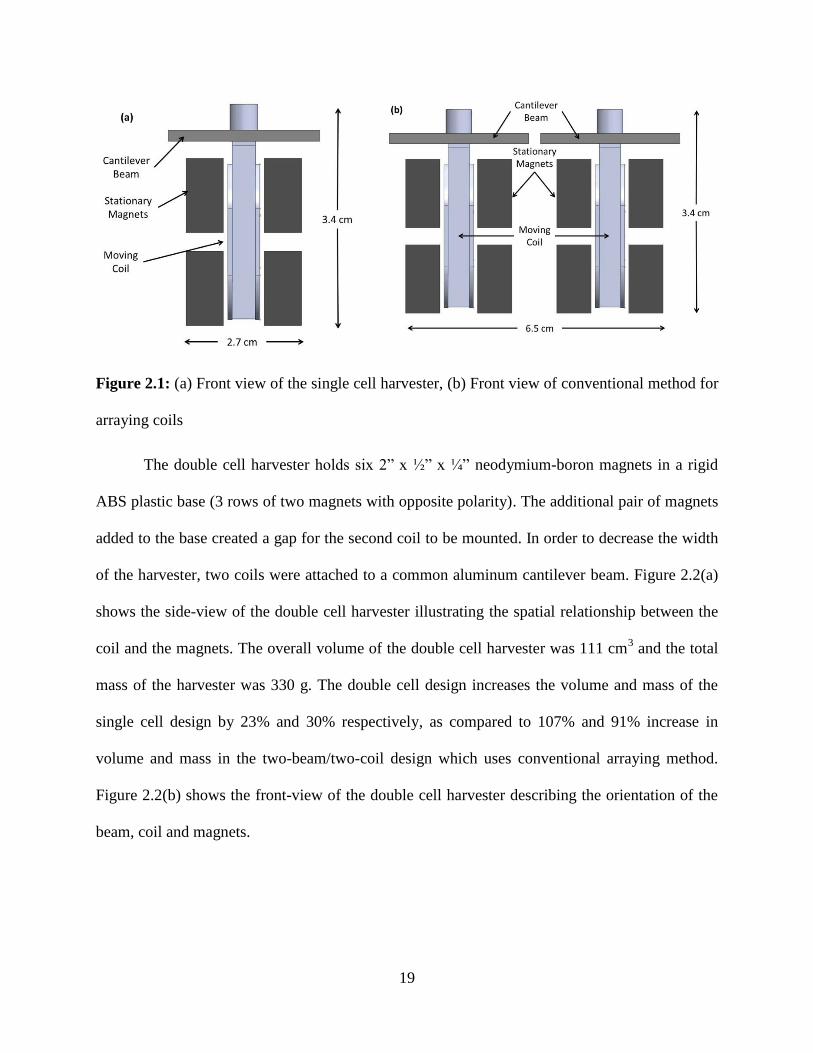
The double cell harvester holds six 2” x ½” x ¼” neodymium-boron magnets in a rigid
ABS plastic base (3 rows of two magnets with opposite polarity). The additional pair of magnets
added to the base created a gap for the second coil to be mounted. In order to decrease the width
of the harvester, two coils were attached to a common aluminum cantilever beam. Figure 2.2(a)
shows the side-view of the double cell harvester illustrating the spatial relationship between the
coil and the magnets. The overall volume of the double cell harvester was 111 cm3 and the total
mass of the harvester was 330 g. The double cell design increases the volume and mass of the
single cell design by 23% and 30% respectively, as compared to 107% and 91% increase in
volume and mass in the two-beam/two-coil design which uses conventional arraying method.
Figure 2.2(b) shows the front-view of the double cell harvester describing the orientation of the
beam, coil and magnets.
20
Figure 2.2: (a) Cross-section of the double cell harvester, and (b) Front view of the double cell
harvester
2.1.3 Experimental setup
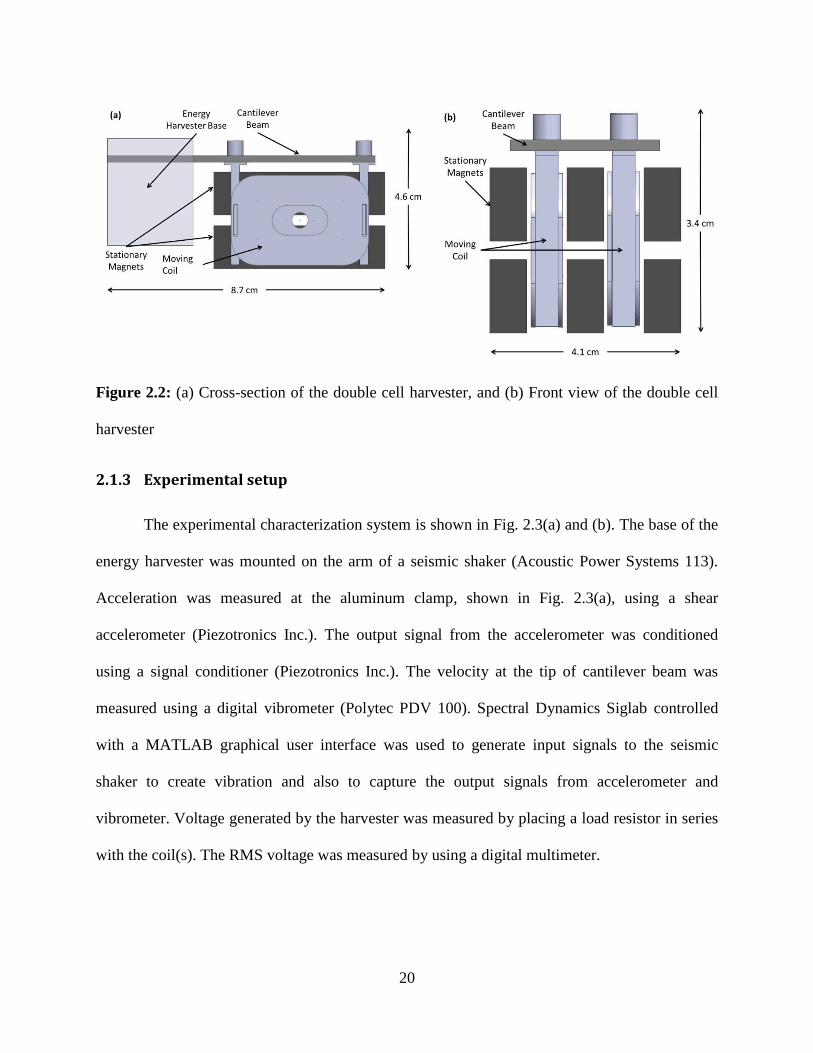
The experimental characterization system is shown in Fig. 2.3(a) and (b). The base of the
energy harvester was mounted on the arm of a seismic shaker (Acoustic Power Systems 113).
Acceleration was measured at the aluminum clamp, shown in Fig. 2.3(a), using a shear
accelerometer (Piezotronics Inc.). The output signal from the accelerometer was conditioned
using a signal conditioner (Piezotronics Inc.). The velocity at the tip of cantilever beam was
measured using a digital vibrometer (Polytec PDV 100). Spectral Dynamics Siglab controlled
with a MATLAB graphical user interface was used to generate input signals to the seismic
shaker to create vibration and also to capture the output signals from accelerometer and
vibrometer. Voltage generated by the harvester was measured by placing a load resistor in series
with the coil(s). The RMS voltage was measured by using a digital multimeter.
21
Figure 2.3: (a) Double cell harvester mounted to shaker arm, (b) Full experimental setup
2.1.4 Computational analysis of magnetic field distribution within air
The variation in magnetic field strength within the air gap was evaluated by using
ANSYS multiphysics for the single cell and double cell designs to determine the effect caused by
the additional pair of magnets. Magnetic field gradients between air gaps would cause unequal
electromagnetic damping ratios between coils. Electromagnetic damping is a physical force
exerted on the coil which opposes the vibration of the cantilever beam. This force is only present
when the coil is placed under an electrical load resistance. A magnetic force that acts on a
current carrying conductor is determined through Eq. 2.1 [31].
(2.1)
Using the right hand rule the direction of this force is in the upward direction or downward
direction depending on the direction of the moving coil. One would think that the forces from the
top and bottom portions of the coil would cancel due to loop in the coil, but due to the polarity
change between the top and bottom sets of magnets this force from the two section of coil is in

22
the same direction. The term determines the magnitude of this force which is dependent upon
velocity [31].
(2.2)
If there are significant differences in magnetic field strength between air gaps, these
uneven forces could induce torsional vibrations in the beam. These other vibration modes could
cause a phase difference in the output voltage of the individual coils and reduce the magnitude of
bending vibrations. Since the coils are connected in series for the double cell design any phase
difference in voltage generated in the coil is detrimental to the total output power of the
harvester. The magnetic circuit was modeled with a 3D mesh and analyzed with Magnetic-Nodal
analysis. Solid 96 elements were used for magnet and air elements. A coercive force of 875270
A/m was estimated from the B-H curve provided by the magnet manufacturer and assigned to the
magnets. The coercive force defines the strength of the magnetic field produced by the magnet.
Therefore the coercive force affects the ANSYS prediction of the magnetic field strength
between two attracting magnets. Through the FEM analysis, it was determined that for the
double cell harvester, adding one additional pair of magnets created a gradient between air gaps
of 0.001T which is insignificant in terms of electromagnetic damping. Figure 2.4(a) illustrates
the symmetry in magnetic field strength found between the two air gaps. The change in contour
color only signifies a change in magnetic field direction, the magnetic field strength distribution
within the top and bottom air gap remains symmetric.
In an effort to determine how many additional pairs of magnets are needed to cause a
notable gradient, further FEM analysis was performed. It was found that by increasing the
number of coils to three and by adding an additional pair of magnets to the double cell design, a
difference in magnetic field strength of 0.02 T was created between center air gap and the outer
23
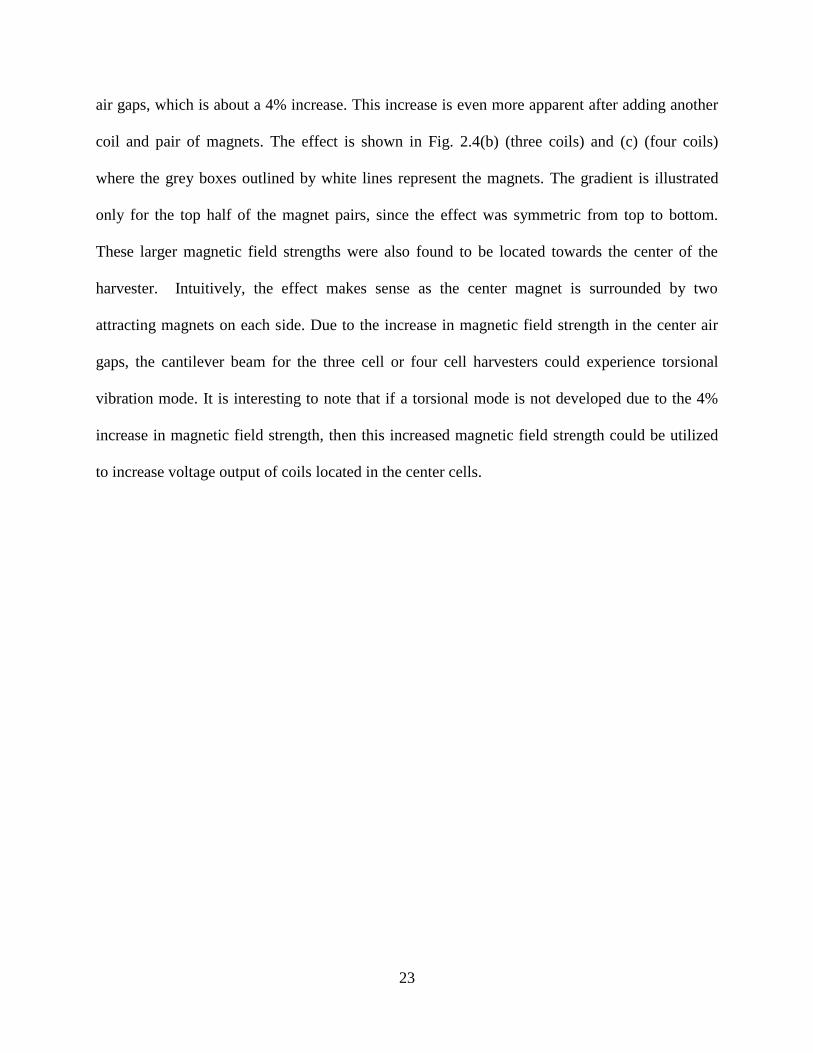
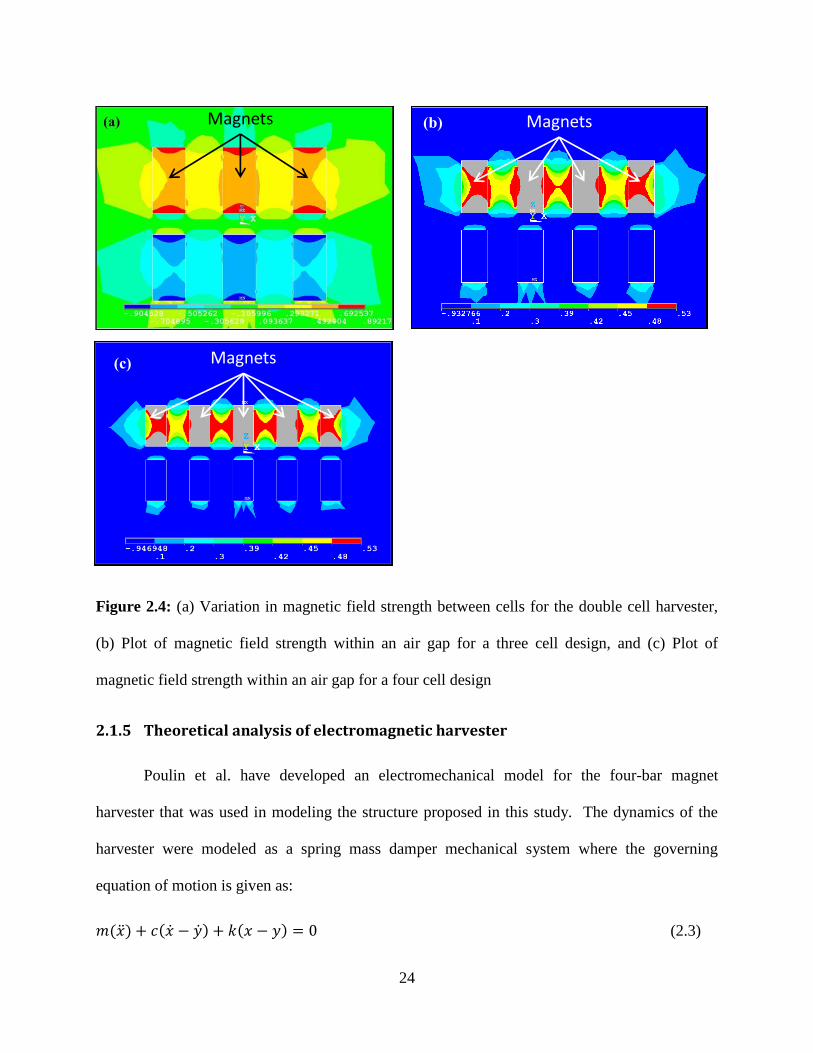
air gaps, which is about a 4% increase. This increase is even more apparent after adding another
coil and pair of magnets. The effect is shown in Fig. 2.4(b) (three coils) and (c) (four coils)
where the grey boxes outlined by white lines represent the magnets. The gradient is illustrated
only for the top half of the magnet pairs, since the effect was symmetric from top to bottom.
These larger magnetic field strengths were also found to be located towards the center of the
harvester. Intuitively, the effect makes sense as the center magnet is surrounded by two
attracting magnets on each side. Due to the increase in magnetic field strength in the center air
gaps, the cantilever beam for the three cell or four cell harvesters could experience torsional
vibration mode. It is interesting to note that if a torsional mode is not developed due to the 4%
increase in magnetic field strength, then this increased magnetic field strength could be utilized
to increase voltage output of coils located in the center cells.
24
Figure 2.4: (a) Variation in magnetic field strength between cells for the double cell harvester,
(b) Plot of magnetic field strength within an air gap for a three cell design, and (c) Plot of
magnetic field strength within an air gap for a four cell design
2.1.5 Theoretical analysis of electromagnetic harvester
Poulin et al. have developed an electromechanical model for the four-bar magnet
harvester that was used in modeling the structure proposed in this study. The dynamics of the
harvester were modeled as a spring mass damper mechanical system where the governing
equation of motion is given as:
( ) ( ) ( ) (2.3)
Magnets
(c) Magnets
(b) Magnets

25
where x is the displacement of the beam/coil and y is the displacement of the base with magnets.
The harvested power is dependent upon the relative motion between the coil and magnets so Eq.
2.3 can be rewritten as:
( ) ( ) (2.4)
As mentioned earlier that when an electrical load is placed on the mechanical system a force
opposing the motion of the beam is applied. Accounting for this force Eq. 2.4 becomes the
governing expression for the dynamics of the system as:
( ) ( ) (2.5)
In order to model the electrical system Kirchoffs voltage law was applied to the four bar magnet
circuit as:
(2.6)
where
are the electrical losses in the system and is the voltage generated by the
harvester. A detailed solution of how to solve these two governing system equations can be
found in Poulin et al. and the following transfer function can be derived[19]:
( )(
) ( )
(2.7)
The quantity will be referred as the transformation factor for the rest of the analysis. Using the
traditional transformation factor estimation method, , a transformation factor of
67.85 T-m was calculated. Oliver and Priya have shown that this traditional method has been
found to overestimate the transformation factor by ~3X for four-bar magnet geometry [26].
They presented a method for estimating the transformation factor, , that directly couples
the input mechanical energy to the output electrical energy through the following relationship:
26
∮( ) ( ) (2.8)
where is the coil velocity, is the magnitude of magnetic field cutting the coil, is the
conductor length and ( ) is the velocity at the tip of the cantilever beam. Using this
transformation factor estimation method with Poulin’s model, they were able to closely match
their theoretical results with experimental results. In order to estimate the transformation factor
accurately, two modifications were made to the traditional transformation factor estimation
method. The first modification considers the coil geometry and spatial distribution of magnetic
field strength. By assuming that the coil velocity is orthogonal to magnetic field vectors, the line
integral in Eq. (2.8) reduces to Eq. (2.9):
∫ (
) ( ) ( ( ) (2.9)
where is the angle between and the differential conductor length and are
coordinates on plane of the coil. In our previous study, the assumption that the coil velocity is
orthogonal to magnetic field vectors was made based on the close proximity of the magnets and
coil [26]. A similar air gap dimensions were used in construction of the harvesters investigated in
this study. The validity of the assumption on orthogonality was evaluated by plotting the
magnetic field vectors in ANSYS as shown in Fig. 2.5(a). It can be seen in this figure that the
magnetic field vectors in air gap are perpendicular to the plane of the coil face validating the
assumption. In order to determine ( ) in Eq. (2.9), the spatial variation in magnetic field
strength in air gap was evaluated by using ANSYS multiphysics. Another assumption in the
analysis consists of conductor moving through constant B field during oscillation. The
assumption was made due to the small deflection of the cantilever been with respect to the
magnet height. Figure 2.5(b) displays the spatial variation in magnetic field strength within one
of the cells for the double cell harvester. Figure 2.5(c) shows the picture of the coil with
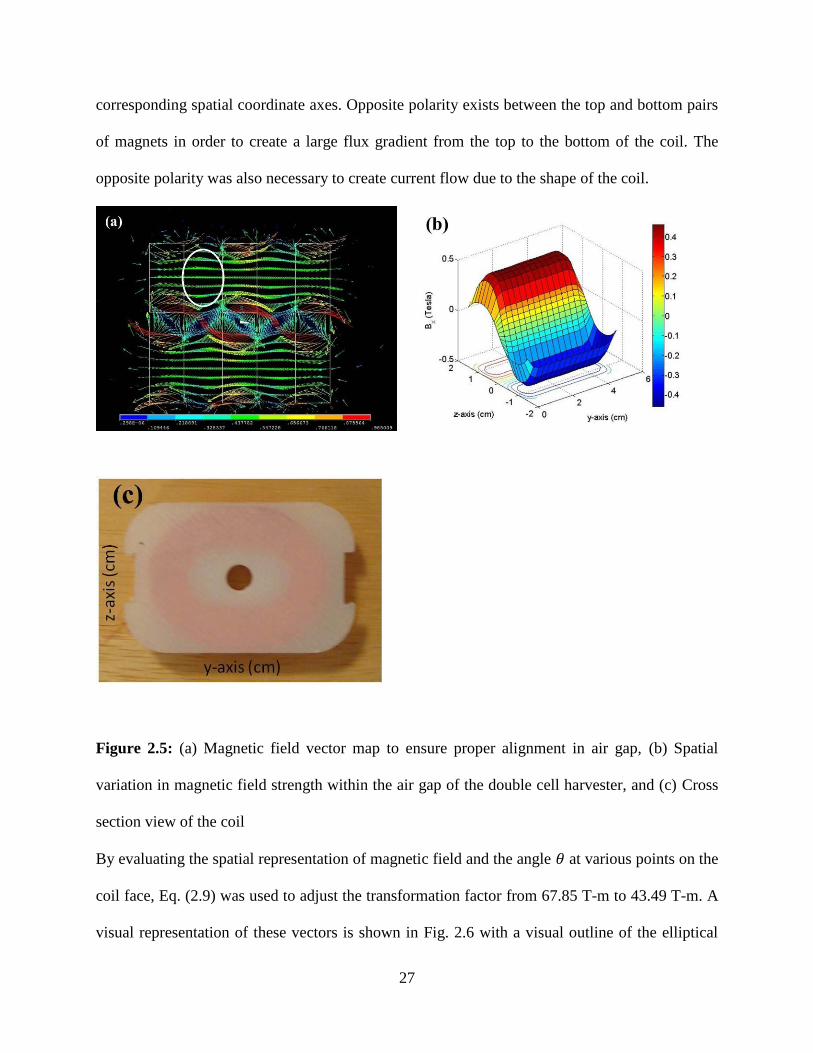
27
corresponding spatial coordinate axes. Opposite polarity exists between the top and bottom pairs
of magnets in order to create a large flux gradient from the top to the bottom of the coil. The
opposite polarity was also necessary to create current flow due to the shape of the coil.
Figure 2.5: (a) Magnetic field vector map to ensure proper alignment in air gap, (b) Spatial
variation in magnetic field strength within the air gap of the double cell harvester, and (c) Cross
section view of the coil
By evaluating the spatial representation of magnetic field and the angle at various points on the
coil face, Eq. (2.9) was used to adjust the transformation factor from 67.85 T-m to 43.49 T-m. A
visual representation of these vectors is shown in Fig. 2.6 with a visual outline of the elliptical
28
shaped coil denoted by the red line. The green filled red circles represent the location of each
discrete calculation. The left facing blue line represents the vector generated from the cross
product of the velocity and magnetic field vector. The blue line which turns through a radius
represents the conductor length vector. A plot of the adjusted transformation factor as a function
of y and z coordinates is overlaid on the face of the actual coil as shown in Fig. 2.7(a). The
discrete transformation factor at the center left and center right portions of the coil was zero due
to the parallel orientation of the conductor length vector to the cross product of the velocity and
magnetic field vectors. The elliptical coil shape minimizes this zero transduction region.
The second modification to the transformation factor accounts for the loss associated with
a non-uniform velocity profile along the length of the beam. This velocity profile can be
calculated by determining the mode shape along the beam length. Using Eq. (2.10), the mode
shape was estimated [32] and compared to an experimental measurement of the mode shape,
(
) (
)
( ) ( )
( ) ( ) (
) (
)
( ) ( )
( ) ( )
(
) (2.10)
where is the mode shape, is the distance along the beam from the clamped end, is
the total length of the beam, is the mode shape number and is an arbitrary constant. The
mode shape number is tabulated for various tip mass to beam mass ratios in Laura et. al [32].
The tip mass to beam mass ratio for the double cell harvester was 4 providing a mode shape
number of 0.9173. The experimental mode shape was determined by measuring the velocity at
central points along the length of the beam. The measured velocities were then normalized to the
velocity at the tip. Figure 2.7(b) plots the mode shape calculated by using Eq. (2.10) and the
mode shape determined experimentally. The leftmost side of the x-coordinate scale represents
the clamped end. The final term in Eq. (2.9), ( ), can now be determined. This final
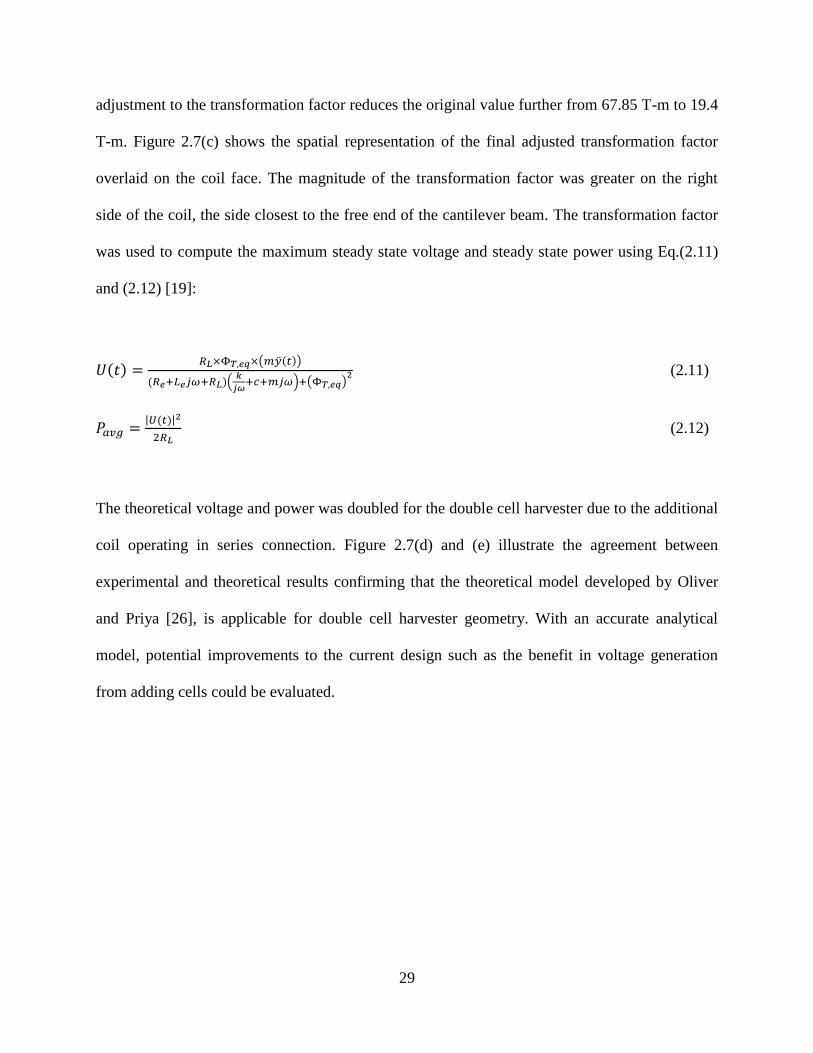
29
adjustment to the transformation factor reduces the original value further from 67.85 T-m to 19.4
T-m. Figure 2.7(c) shows the spatial representation of the final adjusted transformation factor
overlaid on the coil face. The magnitude of the transformation factor was greater on the right
side of the coil, the side closest to the free end of the cantilever beam. The transformation factor
was used to compute the maximum steady state voltage and steady state power using Eq.(2.11)
and (2.12) [19]:
( ) ( ( ))
( )(
) ( )
(2.11)
| ( )|
(2.12)
The theoretical voltage and power was doubled for the double cell harvester due to the additional
coil operating in series connection. Figure 2.7(d) and (e) illustrate the agreement between
experimental and theoretical results confirming that the theoretical model developed by Oliver
and Priya [26], is applicable for double cell harvester geometry. With an accurate analytical
model, potential improvements to the current design such as the benefit in voltage generation
from adding cells could be evaluated.
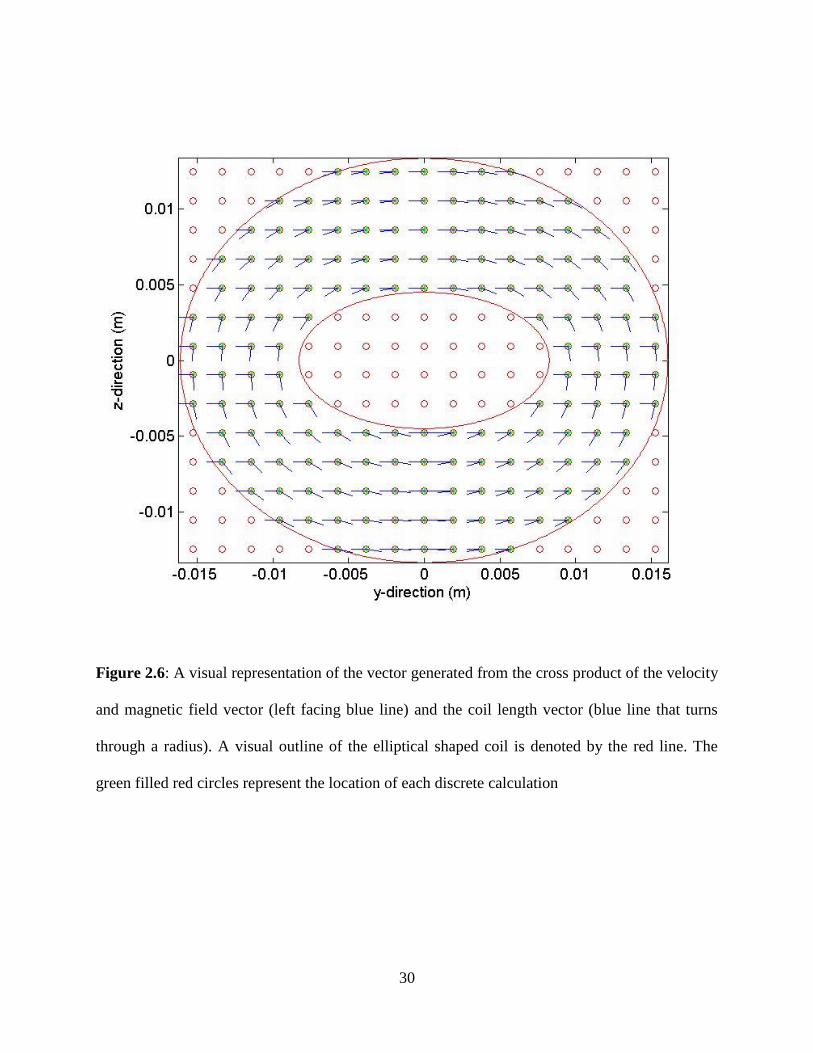
30
Figure 2.6: A visual representation of the vector generated from the cross product of the velocity
and magnetic field vector (left facing blue line) and the coil length vector (blue line that turns
through a radius). A visual outline of the elliptical shaped coil is denoted by the red line. The
green filled red circles represent the location of each discrete calculation
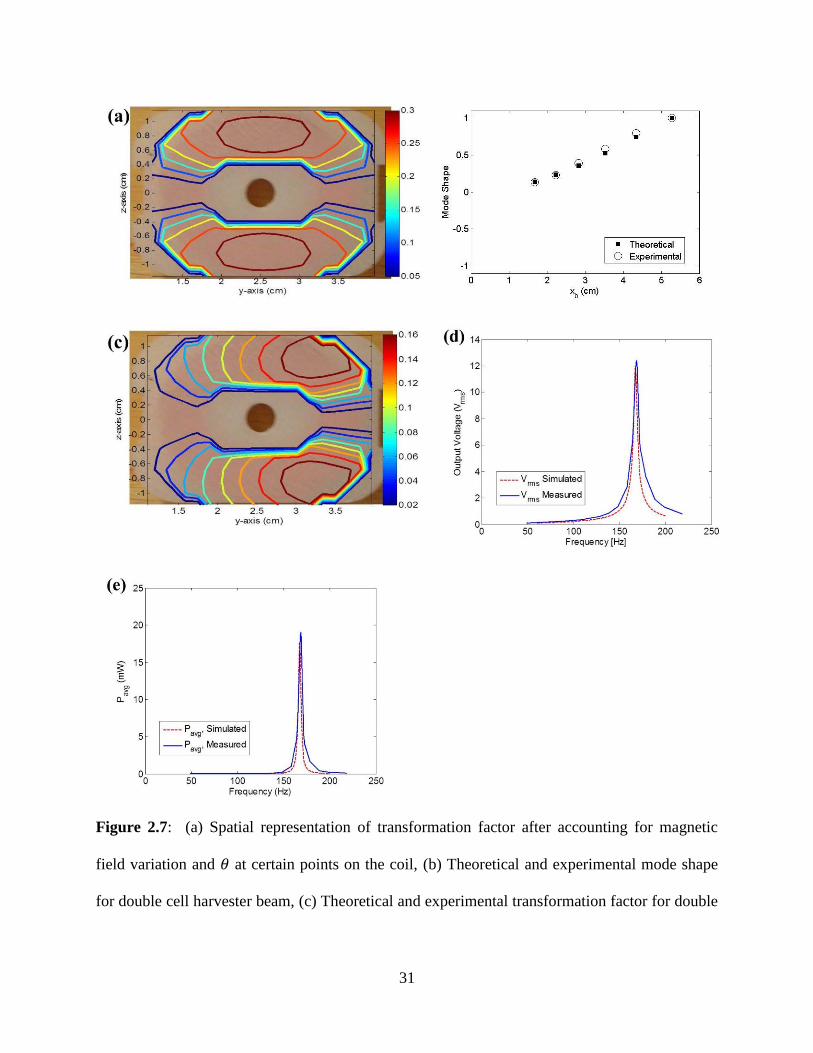
31
Figure 2.7: (a) Spatial representation of transformation factor after accounting for magnetic
field variation and at certain points on the coil, (b) Theoretical and experimental mode shape
for double cell harvester beam, (c) Theoretical and experimental transformation factor for double
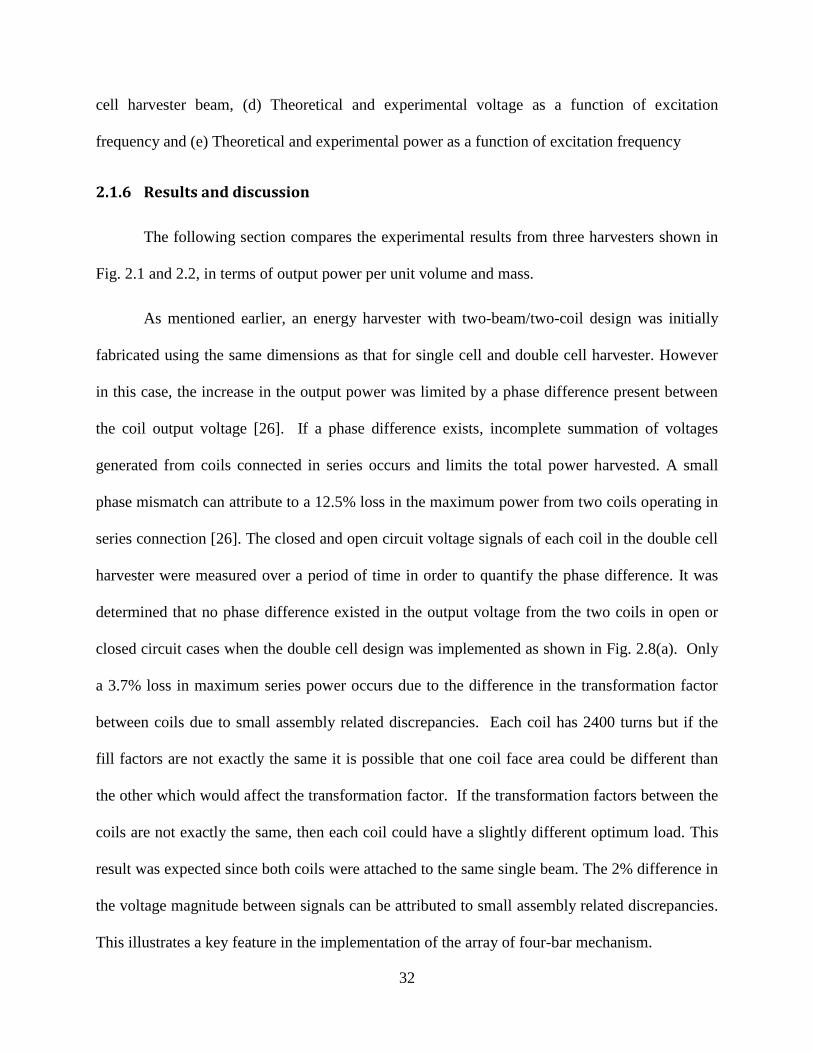
32
cell harvester beam, (d) Theoretical and experimental voltage as a function of excitation
frequency and (e) Theoretical and experimental power as a function of excitation frequency
2.1.6 Results and discussion
The following section compares the experimental results from three harvesters shown in
Fig. 2.1 and 2.2, in terms of output power per unit volume and mass.
As mentioned earlier, an energy harvester with two-beam/two-coil design was initially
fabricated using the same dimensions as that for single cell and double cell harvester. However
in this case, the increase in the output power was limited by a phase difference present between
the coil output voltage [26]. If a phase difference exists, incomplete summation of voltages
generated from coils connected in series occurs and limits the total power harvested. A small
phase mismatch can attribute to a 12.5% loss in the maximum power from two coils operating in
series connection [26]. The closed and open circuit voltage signals of each coil in the double cell
harvester were measured over a period of time in order to quantify the phase difference. It was
determined that no phase difference existed in the output voltage from the two coils in open or
closed circuit cases when the double cell design was implemented as shown in Fig. 2.8(a). Only
a 3.7% loss in maximum series power occurs due to the difference in the transformation factor
between coils due to small assembly related discrepancies. Each coil has 2400 turns but if the
fill factors are not exactly the same it is possible that one coil face area could be different than
the other which would affect the transformation factor. If the transformation factors between the
coils are not exactly the same, then each coil could have a slightly different optimum load. This
result was expected since both coils were attached to the same single beam. The 2% difference in
the voltage magnitude between signals can be attributed to small assembly related discrepancies.
This illustrates a key feature in the implementation of the array of four-bar mechanism.
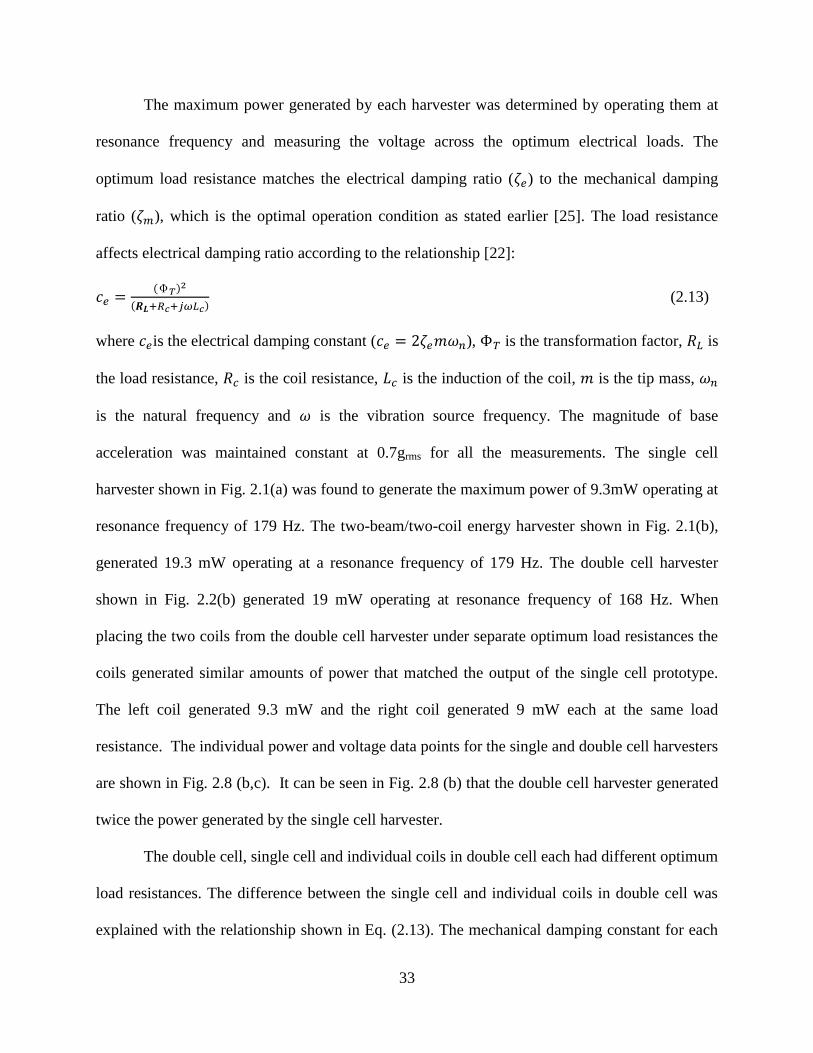
33
The maximum power generated by each harvester was determined by operating them at
resonance frequency and measuring the voltage across the optimum electrical loads. The
optimum load resistance matches the electrical damping ratio ( ) to the mechanical damping
ratio ( ), which is the optimal operation condition as stated earlier [25]. The load resistance
affects electrical damping ratio according to the relationship [22]:
( )
( ) (2.13)
where is the electrical damping constant ( ), is the transformation factor, is
the load resistance, is the coil resistance, is the induction of the coil, is the tip mass,
is the natural frequency and is the vibration source frequency. The magnitude of base
acceleration was maintained constant at 0.7grms for all the measurements. The single cell
harvester shown in Fig. 2.1(a) was found to generate the maximum power of 9.3mW operating at
resonance frequency of 179 Hz. The two-beam/two-coil energy harvester shown in Fig. 2.1(b),
generated 19.3 mW operating at a resonance frequency of 179 Hz. The double cell harvester
shown in Fig. 2.2(b) generated 19 mW operating at resonance frequency of 168 Hz. When
placing the two coils from the double cell harvester under separate optimum load resistances the
coils generated similar amounts of power that matched the output of the single cell prototype.
The left coil generated 9.3 mW and the right coil generated 9 mW each at the same load
resistance. The individual power and voltage data points for the single and double cell harvesters
are shown in Fig. 2.8 (b,c). It can be seen in Fig. 2.8 (b) that the double cell harvester generated
twice the power generated by the single cell harvester.
The double cell, single cell and individual coils in double cell each had different optimum
load resistances. The difference between the single cell and individual coils in double cell was
explained with the relationship shown in Eq. (2.13). The mechanical damping constant for each
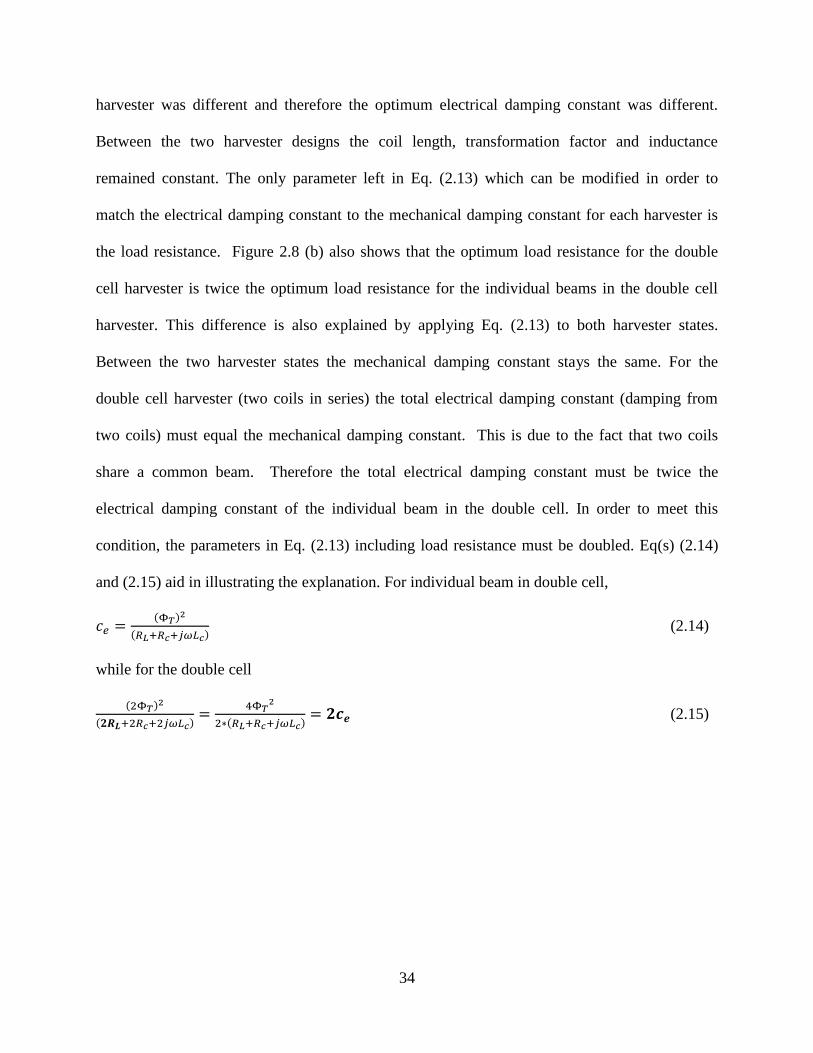
34
harvester was different and therefore the optimum electrical damping constant was different.
Between the two harvester designs the coil length, transformation factor and inductance
remained constant. The only parameter left in Eq. (2.13) which can be modified in order to
match the electrical damping constant to the mechanical damping constant for each harvester is
the load resistance. Figure 2.8 (b) also shows that the optimum load resistance for the double
cell harvester is twice the optimum load resistance for the individual beams in the double cell
harvester. This difference is also explained by applying Eq. (2.13) to both harvester states.
Between the two harvester states the mechanical damping constant stays the same. For the
double cell harvester (two coils in series) the total electrical damping constant (damping from
two coils) must equal the mechanical damping constant. This is due to the fact that two coils
share a common beam. Therefore the total electrical damping constant must be twice the
electrical damping constant of the individual beam in the double cell. In order to meet this
condition, the parameters in Eq. (2.13) including load resistance must be doubled. Eq(s) (2.14)
and (2.15) aid in illustrating the explanation. For individual beam in double cell,
( )
( ) (2.14)
while for the double cell
( )
( )
( ) (2.15)
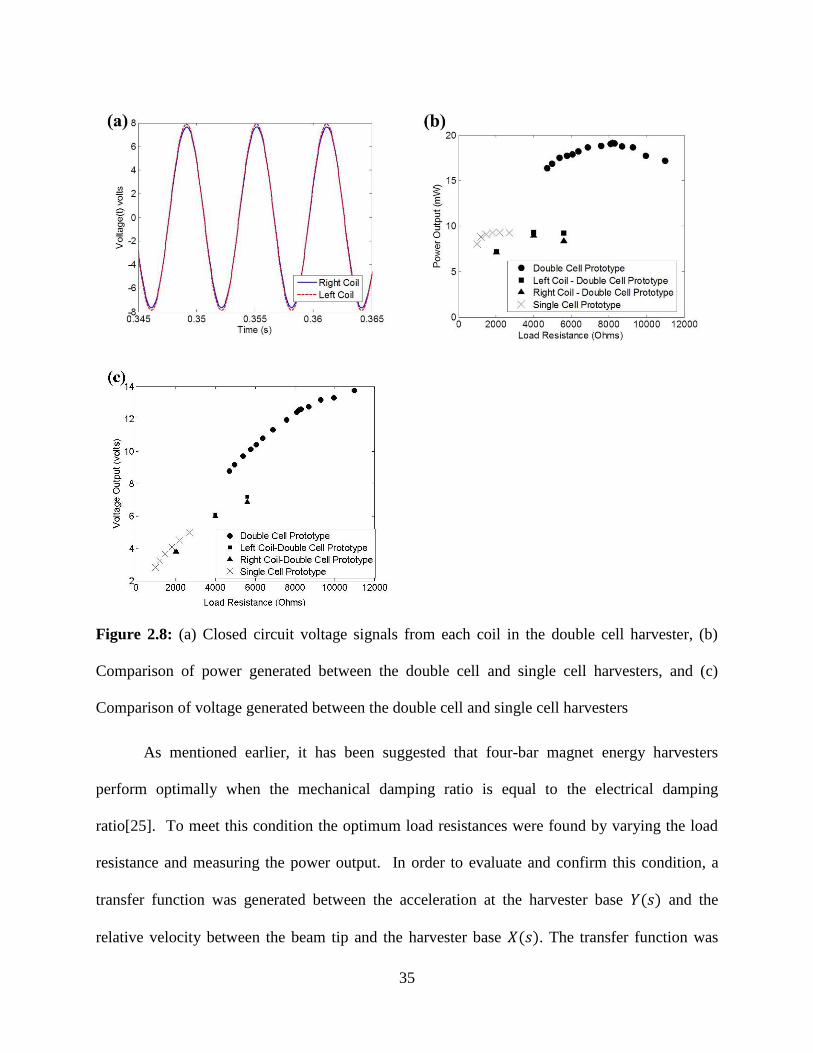
35
Figure 2.8: (a) Closed circuit voltage signals from each coil in the double cell harvester, (b)
Comparison of power generated between the double cell and single cell harvesters, and (c)
Comparison of voltage generated between the double cell and single cell harvesters
As mentioned earlier, it has been suggested that four-bar magnet energy harvesters
perform optimally when the mechanical damping ratio is equal to the electrical damping
ratio[25]. To meet this condition the optimum load resistances were found by varying the load
resistance and measuring the power output. In order to evaluate and confirm this condition, a
transfer function was generated between the acceleration at the harvester base ( ) and the
relative velocity between the beam tip and the harvester base ( ). The transfer function was

36
generated by using a 90 to 200 Hz sine sweep at 0.5 grms. In order to determine the mechanical
damping ratio of the system, the double cell harvester was operated in open circuit conditions.
The transfer function was fitted using a 2 pole 1 zero curve as given by the expression below:
( )
( )
(2.16)
From the above equation, the mechanical damping ratio ( ) for the double cell harvester was
determined to be 0.00825. In order to estimate the electrical damping ratio ( ), the two coils
from the double cell harvester were placed in series under various magnitudes of load resistance.
At the optimum load resistance, a transfer function was acquired and curve fitted as given by the
expression below:
( )
( )
(2.17)
The damping ratio extracted from the above curve fit under an electrical load correspond
to the total damping ratio for the system (mechanical and electrical). The total damping ratio for
the double cell harvester was determined to be 0.01568, providing an electrical damping ratio of
0.00743. The electrical damping ratio is close to that of the mechanical damping
ratio suggesting that the double cell harvester was performing at near optimal
conditions. The output power per unit volume and mass was used as the figure of merit in this
study with the goal of achieving small-size and light-weight energy harvester. Figure 2.9
summarizes the performance of three harvester designs in terms of this figure of merit. It is clear
from this figure that double cell structure leads to significant improvement in performance. We
believe this structure could be easily replicated in 2D to achieve multiple cell configurations
without compromising the performance.
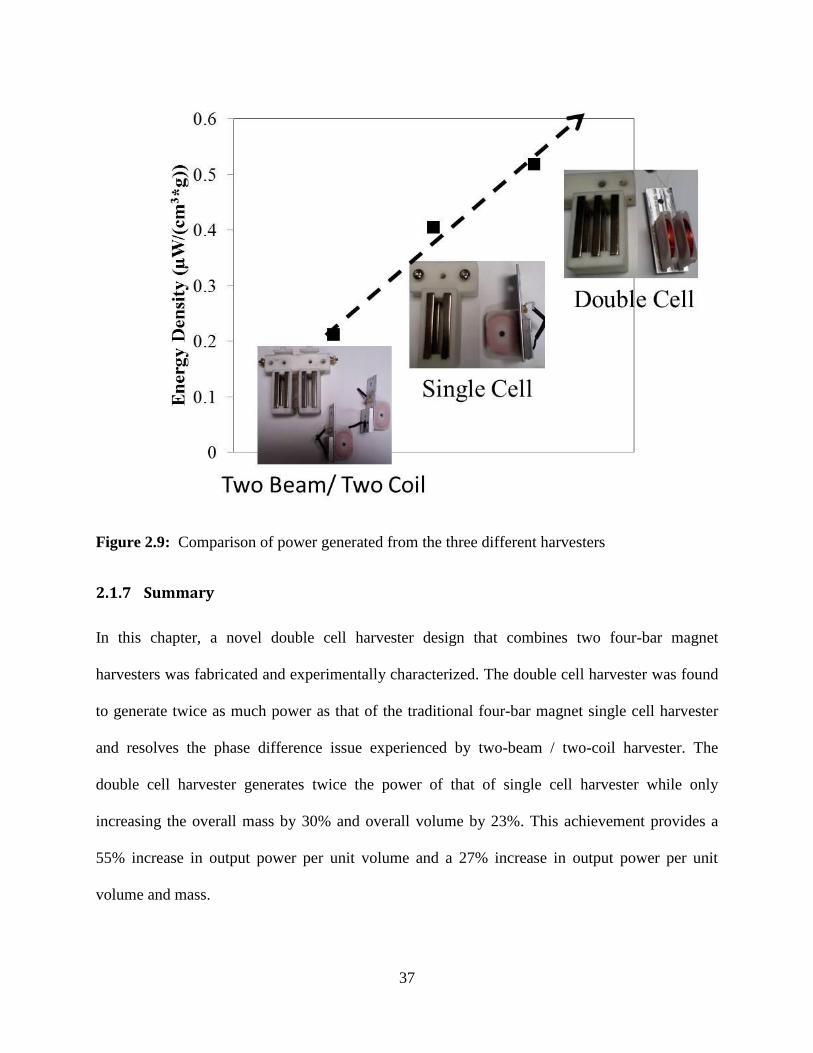
37
Figure 2.9: Comparison of power generated from the three different harvesters
2.1.7 Summary
In this chapter, a novel double cell harvester design that combines two four-bar magnet
harvesters was fabricated and experimentally characterized. The double cell harvester was found
to generate twice as much power as that of the traditional four-bar magnet single cell harvester
and resolves the phase difference issue experienced by two-beam / two-coil harvester. The
double cell harvester generates twice the power of that of single cell harvester while only
increasing the overall mass by 30% and overall volume by 23%. This achievement provides a
55% increase in output power per unit volume and a 27% increase in output power per unit
volume and mass.

38
2.2 Application: Powering wireless sensor nodes with multiple cell configuration energy harvester
This section discusses the design of an electromagnetic vibration energy harvesting
system that provides high power density and broad bandwidth. The “double cell” harvester was
chosen as the generator for this system. In order to harvest power over broad range of
frequencies, four “double cell” harvesters with varying resonance were incorporated in the
system architecture. The average AC to regulated DC power conversion efficiency across the 4
Hz bandwidth was 78%, which is one of the highest reported magnitude for electromagnetic
vibration harvesting system. The magnetic flux density variation within the double cell array was
modeled using the finite element and compared to a single cell with equivalent tip mass and
magnet volume. The double cell array was found to generate similar magnitude of power as
single cell but three times higher bandwidth. The average generator conversion efficiency for the
double cell array was 45.3% which approaches the maximum theoretical limit of 50%.
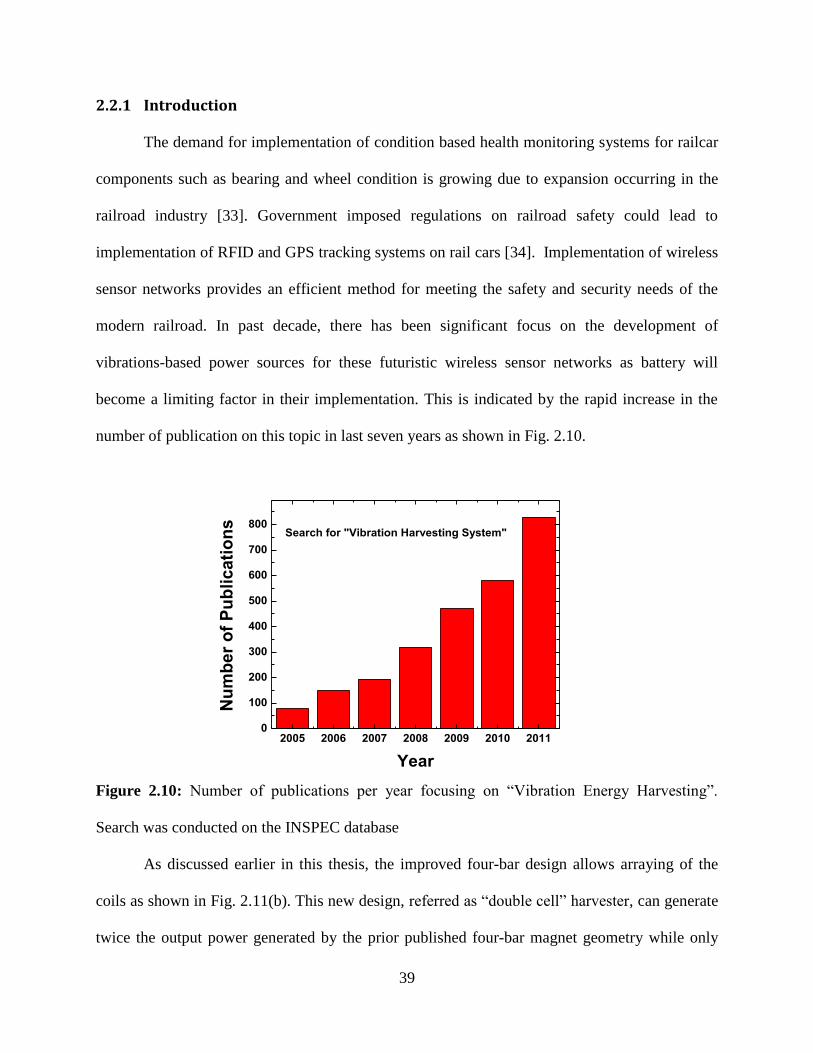
39
2.2.1 Introduction
The demand for implementation of condition based health monitoring systems for railcar
components such as bearing and wheel condition is growing due to expansion occurring in the
railroad industry [33]. Government imposed regulations on railroad safety could lead to
implementation of RFID and GPS tracking systems on rail cars [34]. Implementation of wireless
sensor networks provides an efficient method for meeting the safety and security needs of the
modern railroad. In past decade, there has been significant focus on the development of
vibrations-based power sources for these futuristic wireless sensor networks as battery will
become a limiting factor in their implementation. This is indicated by the rapid increase in the
number of publication on this topic in last seven years as shown in Fig. 2.10.
2005 2006 2007 2008 2009 2010 20110
100
200
300
400
500
600
700
800
Search for "Vibration Harvesting System"
Nu
mb
er
of
Pu
bli
cati
on
s
Year
Figure 2.10: Number of publications per year focusing on “Vibration Energy Harvesting”.
Search was conducted on the INSPEC database
As discussed earlier in this thesis, the improved four-bar design allows arraying of the
coils as shown in Fig. 2.11(b). This new design, referred as “double cell” harvester, can generate
twice the output power generated by the prior published four-bar magnet geometry while only

40
increasing the volume by 23% and mass by 30%, consequently providing a 27% increase in
output power per unit volume and mass [35]. The double cell harvester also eliminates the phase
mismatch providing a method for efficiently arraying multiple coils in series connection. Figure
2.11(c) shows the array configuration to achieve multiplicity of harvesters.
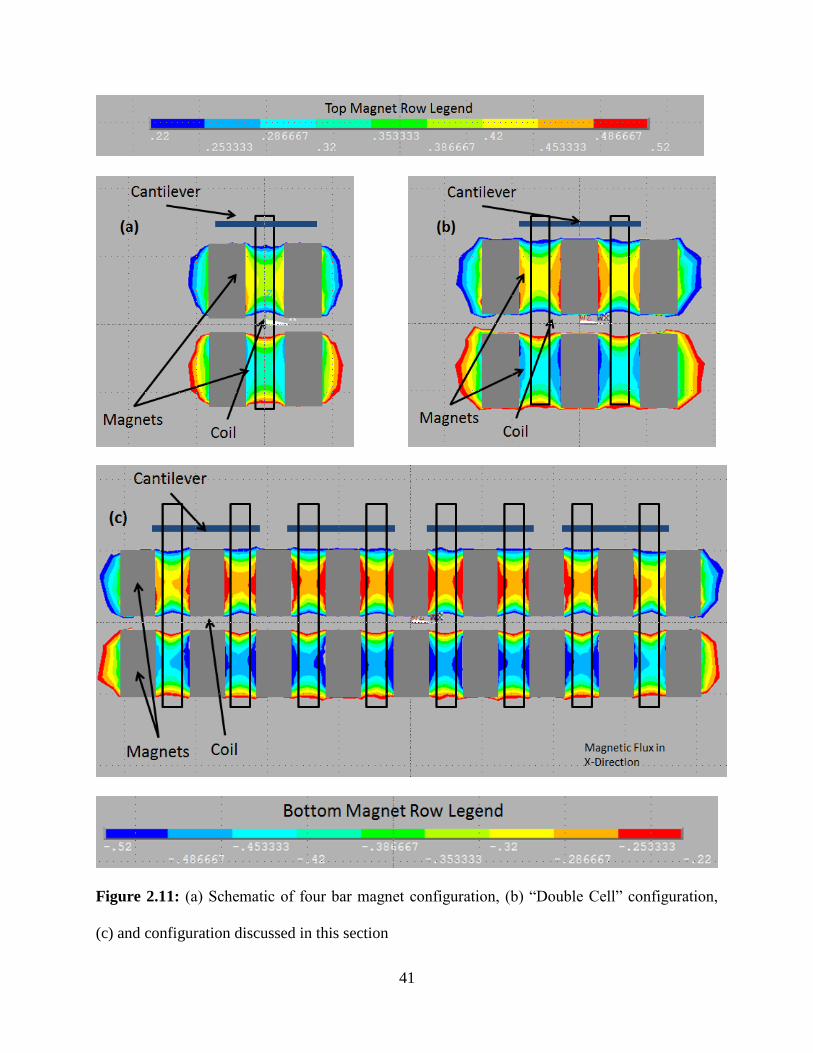
41
Figure 2.11: (a) Schematic of four bar magnet configuration, (b) “Double Cell” configuration,
(c) and configuration discussed in this section

42
In order to harvest mechanical energy over broadband of frequencies, a structure with
four cantilevers attached to a common base was developed. Connecting multiple cantilevers
together for achieving broadband performance has been reported in literature, however, limited
analysis has been conducted in understanding the role of magnetic flux distribution within the
closely packed cells utilizing four-bar mechanism [28-29]. In fact, this is the first study that
provides fundamental information required for arraying of multiple cells such that there is no
adverse effect of the stray magnetic field and there is no cross-talk. The basic questions that one
can ask is “What is the effect of magnets in the adjacent compartments on the performance of a
given cell?”, and “Is there an difference in optimum magnet-coil spacing, coil shape, and magnet
size for the cells that are at the end then that in the middle?”. The FEM simulations and
experimental results reported in this paper provide answers to these questions.
While prior research has mainly focused on developing the mechanical and
electromechanical aspects of the harvester, extremely limited numbers of studies have been
conducted in developing an energy harvesting system that provides design criterion for the
mechanical and electrical components needed to power an actual sensor. Torah et al. have
developed an energy harvesting system that combined a four bar magnet harvester having total
volume of 150 mm3 and a voltage multiplier circuit with a wireless RF linked accelerometer. A
demonstration for measuring and transmitting the vibration data on an air conditioner unit and air
compressor was conducted. The AC to regulated DC electrical power conversion efficiency was
found to be 65% [39]. Yuen et al. have developed a system combining a AA-sized vibration
harvester with a voltage tripler circuit to power a wireless temperature sensor at a resonance
frequency of 70.5 Hz. The AC to regulated DC electrical power conversion efficiency was found
to be 48% [40]. Morais et al. have demonstrated a DC-DC converter (MAX1674) and a low-
43
power battery monitor (MAX6777) to condition and store the power generated from a magnetic
levitation based inductive generator operating at off-resonance with a conversion efficiency of
52.4% [41]. Arroyo and Badel used an approach similar to that commonly used for piezoelectric
harvesters, synchronous electric charge extraction, and proposed that this method is simpler than
impedance matching but provides similar performance. The conversion efficiency for the circuit
was measured to be 43% [42]. Maurath et al. have compared an adaptive charge pump for
dynamic maximum power point tracking with a novel active full-wave rectifier design. The
active rectifier achieved rectification efficiencies of 90% but lacked the impedance matching
capability and therefore the ability to harvest the maximum power for harvester operating with
optimum loads different from the sensor impedance. The adaptive charge pump circuit was
connected to a harvester achieving 48% conversion efficiency over wide range of load
impedances due to the impedance matching capability [43]. In this section of the thesis, a
complete vibration harvesting system that improves upon the performance of all the previously
reported harvesters in terms of operation bandwidth and AC to regulated DC electrical power
conversion efficiency is presented.
In order to achieve the highest possible power conversion efficiency, impedance
matching circuitry was developed and integrated with the mechanical system. Electromagnetic
harvesters optimally operate at a specific load resistance due to the matching of mechanical and
electrical damping [9]. Directly connecting a sensor with impedance which is typically lower
than the optimum impedance can reduce the efficiency by as much as 70% and therefore it is
necessary to modify the effective load impedance. Kong et al. have presented an impedance
matching circuit for piezoelectric harvester that was modified and expanded here to meet the
criterion for electromagnetic harvesting system [45].
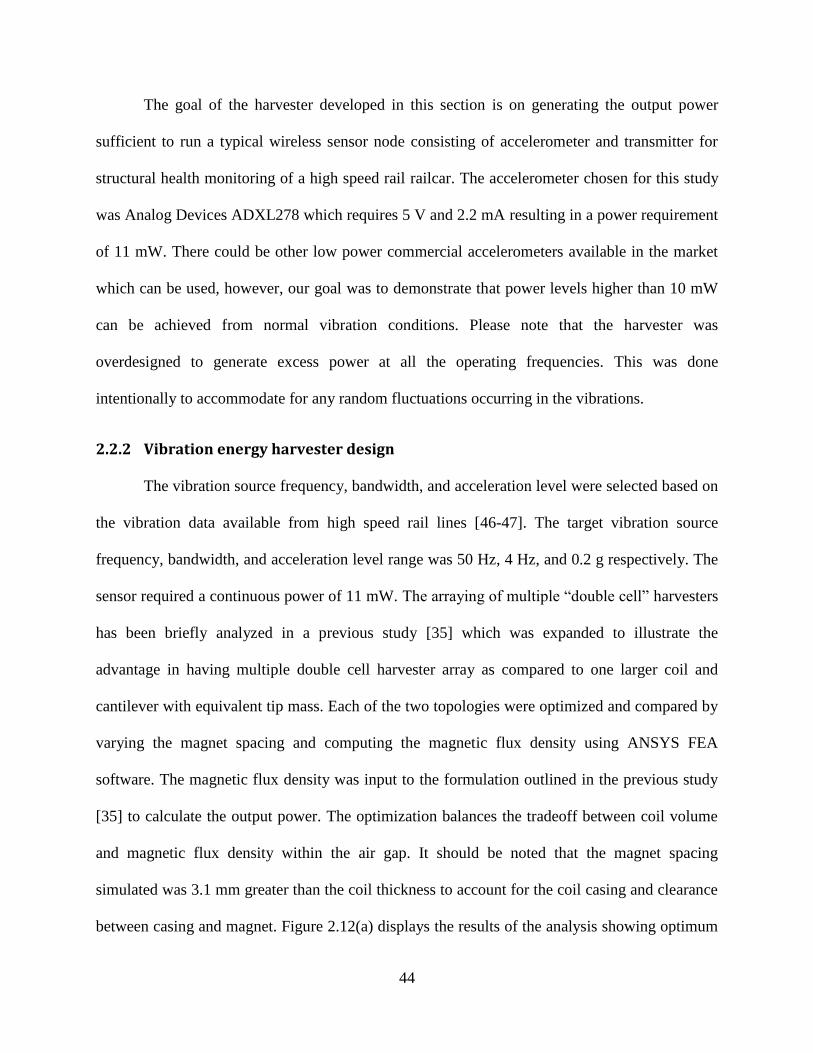
44
The goal of the harvester developed in this section is on generating the output power
sufficient to run a typical wireless sensor node consisting of accelerometer and transmitter for
structural health monitoring of a high speed rail railcar. The accelerometer chosen for this study
was Analog Devices ADXL278 which requires 5 V and 2.2 mA resulting in a power requirement
of 11 mW. There could be other low power commercial accelerometers available in the market
which can be used, however, our goal was to demonstrate that power levels higher than 10 mW
can be achieved from normal vibration conditions. Please note that the harvester was
overdesigned to generate excess power at all the operating frequencies. This was done
intentionally to accommodate for any random fluctuations occurring in the vibrations.
2.2.2 Vibration energy harvester design
The vibration source frequency, bandwidth, and acceleration level were selected based on
the vibration data available from high speed rail lines [46-47]. The target vibration source
frequency, bandwidth, and acceleration level range was 50 Hz, 4 Hz, and 0.2 g respectively. The
sensor required a continuous power of 11 mW. The arraying of multiple “double cell” harvesters
has been briefly analyzed in a previous study [35] which was expanded to illustrate the
advantage in having multiple double cell harvester array as compared to one larger coil and
cantilever with equivalent tip mass. Each of the two topologies were optimized and compared by
varying the magnet spacing and computing the magnetic flux density using ANSYS FEA
software. The magnetic flux density was input to the formulation outlined in the previous study
[35] to calculate the output power. The optimization balances the tradeoff between coil volume
and magnetic flux density within the air gap. It should be noted that the magnet spacing
simulated was 3.1 mm greater than the coil thickness to account for the coil casing and clearance
between casing and magnet. Figure 2.12(a) displays the results of the analysis showing optimum
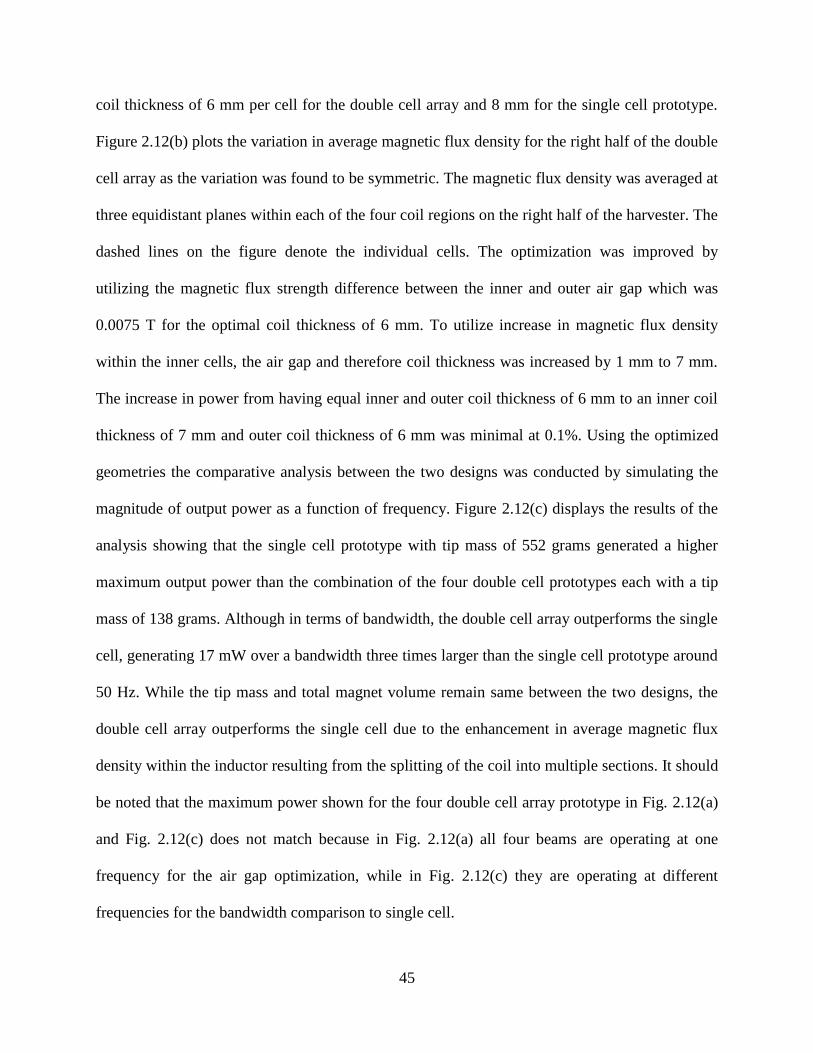
45
coil thickness of 6 mm per cell for the double cell array and 8 mm for the single cell prototype.
Figure 2.12(b) plots the variation in average magnetic flux density for the right half of the double
cell array as the variation was found to be symmetric. The magnetic flux density was averaged at
three equidistant planes within each of the four coil regions on the right half of the harvester. The
dashed lines on the figure denote the individual cells. The optimization was improved by
utilizing the magnetic flux strength difference between the inner and outer air gap which was
0.0075 T for the optimal coil thickness of 6 mm. To utilize increase in magnetic flux density
within the inner cells, the air gap and therefore coil thickness was increased by 1 mm to 7 mm.
The increase in power from having equal inner and outer coil thickness of 6 mm to an inner coil
thickness of 7 mm and outer coil thickness of 6 mm was minimal at 0.1%. Using the optimized
geometries the comparative analysis between the two designs was conducted by simulating the
magnitude of output power as a function of frequency. Figure 2.12(c) displays the results of the
analysis showing that the single cell prototype with tip mass of 552 grams generated a higher
maximum output power than the combination of the four double cell prototypes each with a tip
mass of 138 grams. Although in terms of bandwidth, the double cell array outperforms the single
cell, generating 17 mW over a bandwidth three times larger than the single cell prototype around
50 Hz. While the tip mass and total magnet volume remain same between the two designs, the
double cell array outperforms the single cell due to the enhancement in average magnetic flux
density within the inductor resulting from the splitting of the coil into multiple sections. It should
be noted that the maximum power shown for the four double cell array prototype in Fig. 2.12(a)
and Fig. 2.12(c) does not match because in Fig. 2.12(a) all four beams are operating at one
frequency for the air gap optimization, while in Fig. 2.12(c) they are operating at different
frequencies for the bandwidth comparison to single cell.
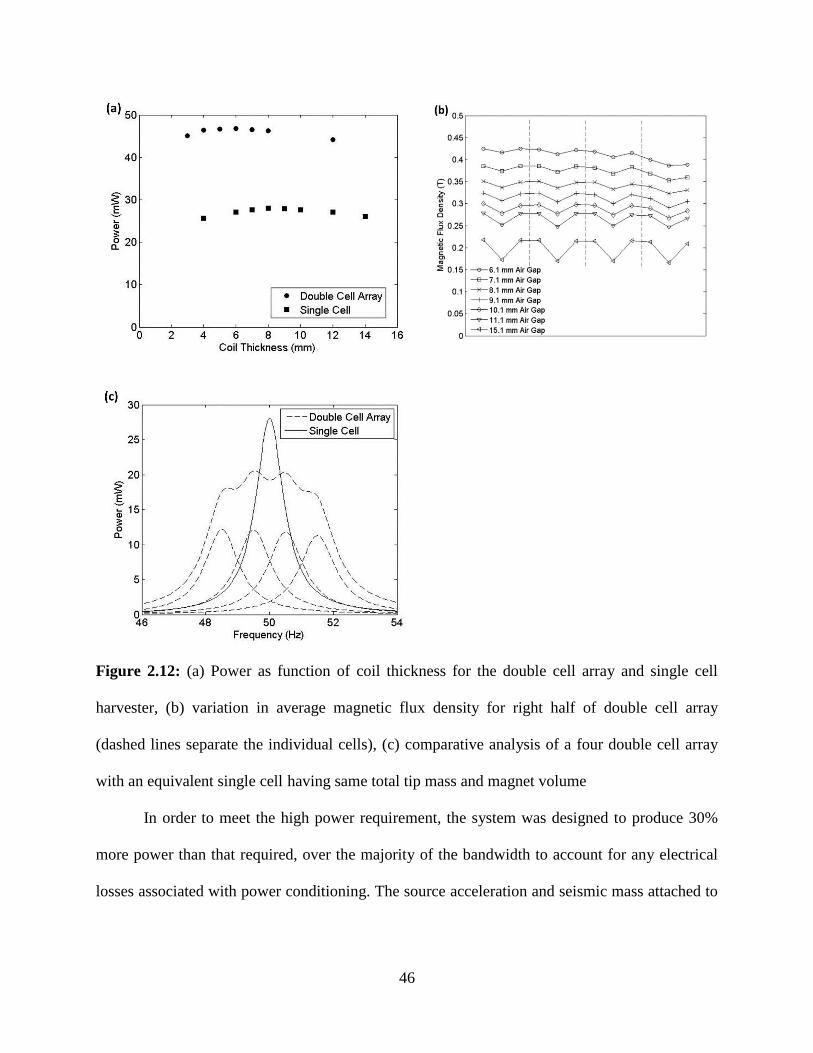
46
Figure 2.12: (a) Power as function of coil thickness for the double cell array and single cell
harvester, (b) variation in average magnetic flux density for right half of double cell array
(dashed lines separate the individual cells), (c) comparative analysis of a four double cell array
with an equivalent single cell having same total tip mass and magnet volume
In order to meet the high power requirement, the system was designed to produce 30%
more power than that required, over the majority of the bandwidth to account for any electrical
losses associated with power conditioning. The source acceleration and seismic mass attached to
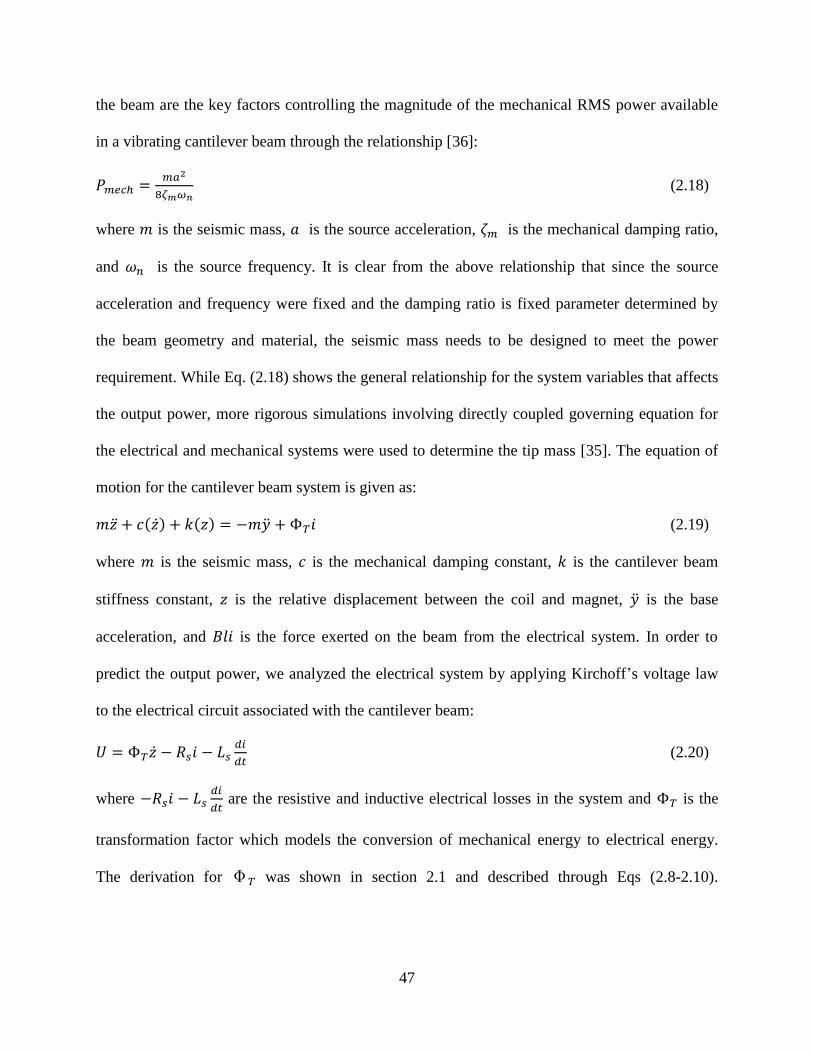
47
the beam are the key factors controlling the magnitude of the mechanical RMS power available
in a vibrating cantilever beam through the relationship [36]:
(2.18)
where is the seismic mass, is the source acceleration, is the mechanical damping ratio,
and is the source frequency. It is clear from the above relationship that since the source
acceleration and frequency were fixed and the damping ratio is fixed parameter determined by
the beam geometry and material, the seismic mass needs to be designed to meet the power
requirement. While Eq. (2.18) shows the general relationship for the system variables that affects
the output power, more rigorous simulations involving directly coupled governing equation for
the electrical and mechanical systems were used to determine the tip mass [35]. The equation of
motion for the cantilever beam system is given as:
( ) ( ) (2.19)
where is the seismic mass, is the mechanical damping constant, is the cantilever beam
stiffness constant, is the relative displacement between the coil and magnet, is the base
acceleration, and is the force exerted on the beam from the electrical system. In order to
predict the output power, we analyzed the electrical system by applying Kirchoff’s voltage law
to the electrical circuit associated with the cantilever beam:
(2.20)
where
are the resistive and inductive electrical losses in the system and is the
transformation factor which models the conversion of mechanical energy to electrical energy.
The derivation for was shown in section 2.1 and described through Eqs (2.8-2.10).
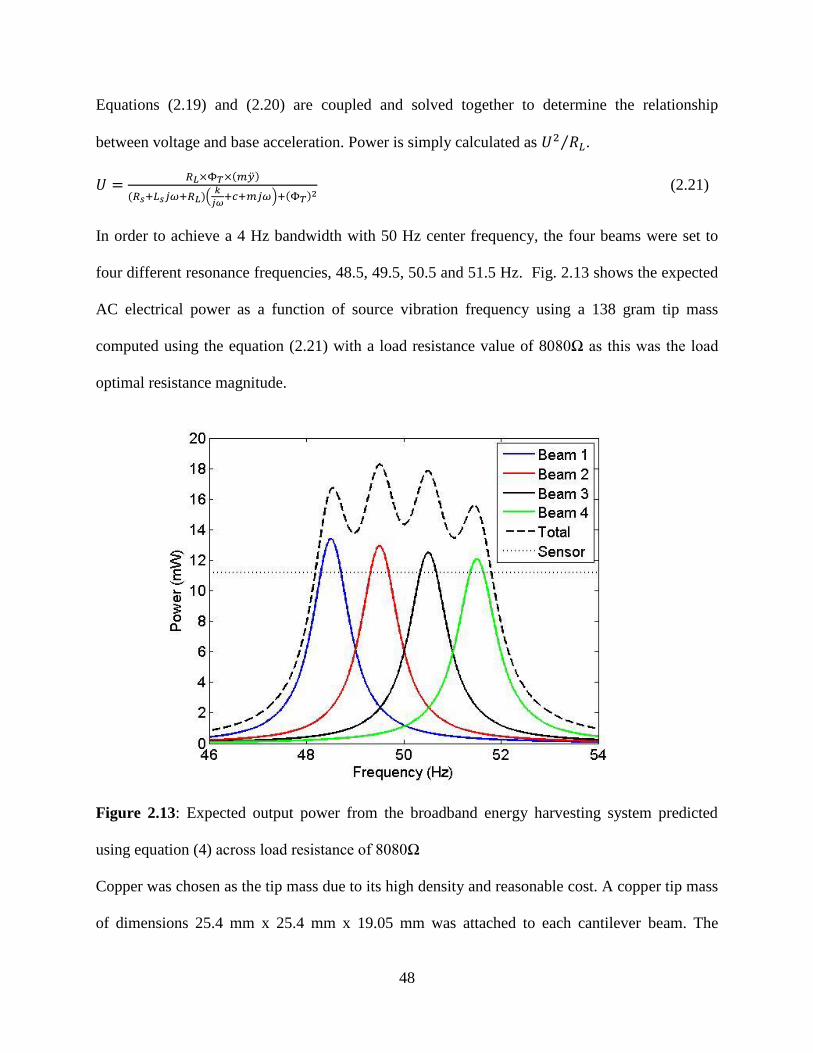
48
Equations (2.19) and (2.20) are coupled and solved together to determine the relationship
between voltage and base acceleration. Power is simply calculated as ⁄ .
( )
( )(
) ( )
(2.21)
In order to achieve a 4 Hz bandwidth with 50 Hz center frequency, the four beams were set to
four different resonance frequencies, 48.5, 49.5, 50.5 and 51.5 Hz. Fig. 2.13 shows the expected
AC electrical power as a function of source vibration frequency using a 138 gram tip mass
computed using the equation (2.21) with a load resistance value of 8080Ω as this was the load
optimal resistance magnitude.
Figure 2.13: Expected output power from the broadband energy harvesting system predicted
using equation (4) across load resistance of 8080Ω
Copper was chosen as the tip mass due to its high density and reasonable cost. A copper tip mass
of dimensions 25.4 mm x 25.4 mm x 19.05 mm was attached to each cantilever beam. The
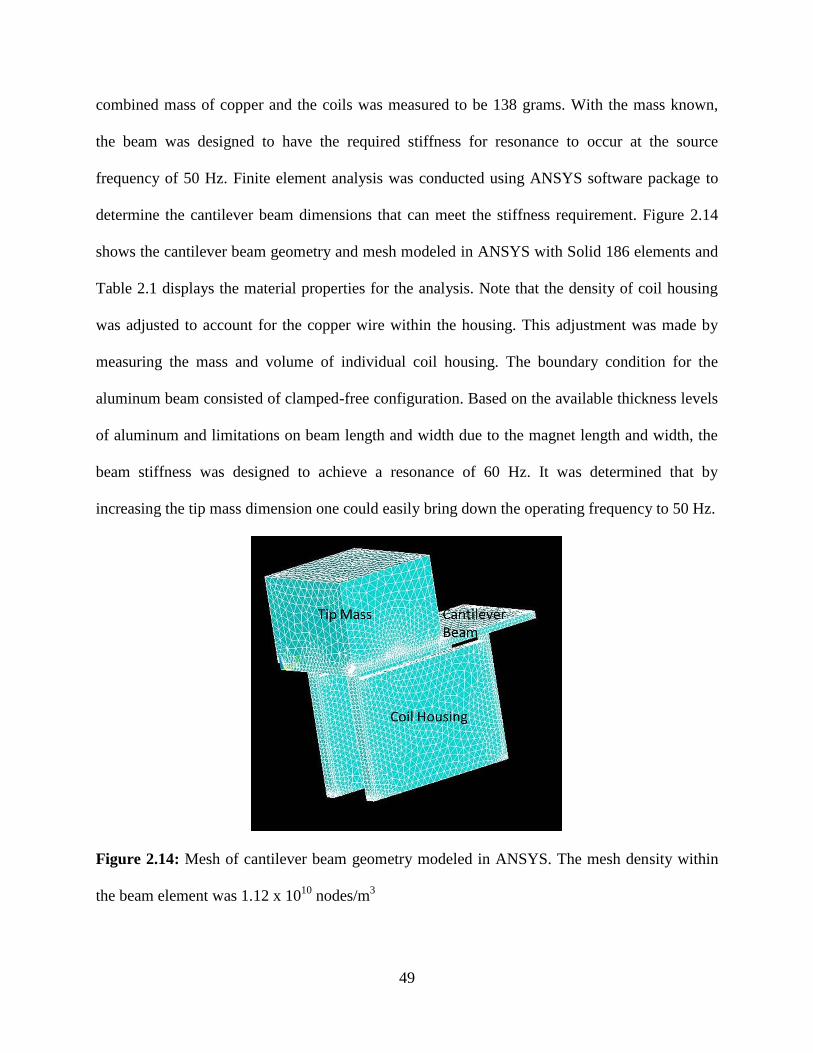
49
combined mass of copper and the coils was measured to be 138 grams. With the mass known,
the beam was designed to have the required stiffness for resonance to occur at the source
frequency of 50 Hz. Finite element analysis was conducted using ANSYS software package to
determine the cantilever beam dimensions that can meet the stiffness requirement. Figure 2.14
shows the cantilever beam geometry and mesh modeled in ANSYS with Solid 186 elements and
Table 2.1 displays the material properties for the analysis. Note that the density of coil housing
was adjusted to account for the copper wire within the housing. This adjustment was made by
measuring the mass and volume of individual coil housing. The boundary condition for the
aluminum beam consisted of clamped-free configuration. Based on the available thickness levels
of aluminum and limitations on beam length and width due to the magnet length and width, the
beam stiffness was designed to achieve a resonance of 60 Hz. It was determined that by
increasing the tip mass dimension one could easily bring down the operating frequency to 50 Hz.
Figure 2.14: Mesh of cantilever beam geometry modeled in ANSYS. The mesh density within
the beam element was 1.12 x 10¹⁰
nodes/m3
50
Table 2.1: Material Properties used in FEA modeling
Aluminum
(Beam)
Copper
(Tip
Mass)
ABS Plastic
(Coil
Housing)
Density (kg/m^3) 2700 8960 6979
Elastic Modulus
(Gpa) 69 117 232
Poisson Ratio 0.334 0.335 0.355
The final dimensions of the beam derived from the FEM modeling were found to be 24.1 mm x
53 mm x 1.524 mm. The entire harvesting system holds eighteen 2” x ½” x ¼” neodymium-
boron magnets in a rigid ABS plastic base as seen from the backside of the harvester in Fig.
2.15(a). Two copper coils consisting of 2600 turns of 38 gauge copper wire connected in series
were attached to the cantilever beam. At the tip of the cantilever beam was the copper mass
whose position can be adjusted to fine tune the resonant frequency of the beam. Figure 2.15(b)
shows the front-view of the harvesting system describing the orientation of the beam, coil, and
magnets.
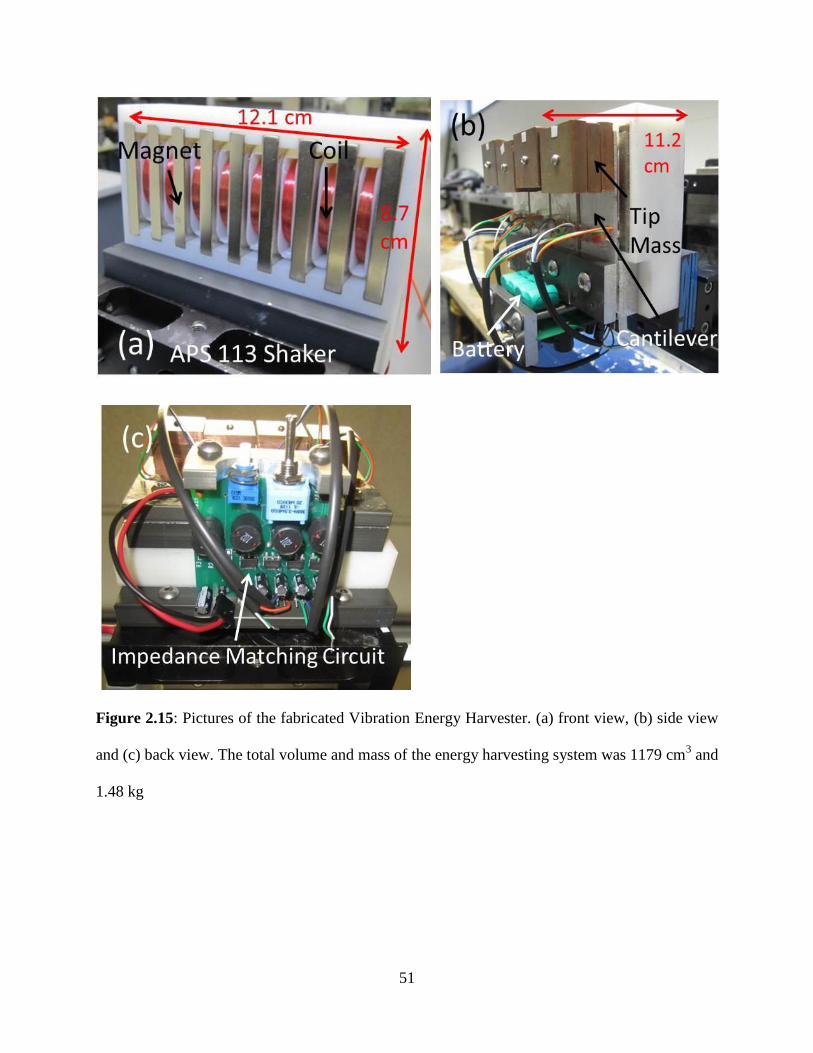
51
Figure 2.15: Pictures of the fabricated Vibration Energy Harvester. (a) front view, (b) side view
and (c) back view. The total volume and mass of the energy harvesting system was 1179 cm3 and
1.48 kg
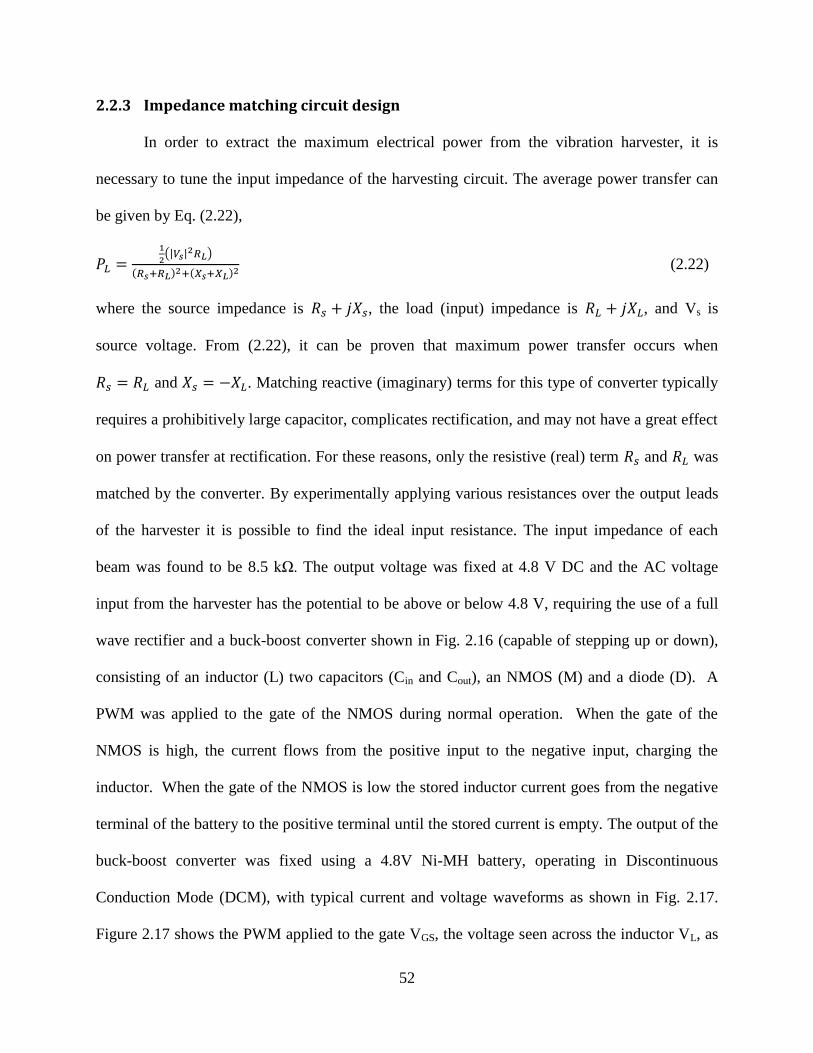
52
2.2.3 Impedance matching circuit design
In order to extract the maximum electrical power from the vibration harvester, it is
necessary to tune the input impedance of the harvesting circuit. The average power transfer can
be given by Eq. (2.22),
(| |
)
( ) ( ) (2.22)
where the source impedance is , the load (input) impedance is , and Vs is
source voltage. From (2.22), it can be proven that maximum power transfer occurs when
and . Matching reactive (imaginary) terms for this type of converter typically
requires a prohibitively large capacitor, complicates rectification, and may not have a great effect
on power transfer at rectification. For these reasons, only the resistive (real) term and was
matched by the converter. By experimentally applying various resistances over the output leads
of the harvester it is possible to find the ideal input resistance. The input impedance of each
beam was found to be 8.5 kΩ. The output voltage was fixed at 4.8 V DC and the AC voltage
input from the harvester has the potential to be above or below 4.8 V, requiring the use of a full
wave rectifier and a buck-boost converter shown in Fig. 2.16 (capable of stepping up or down),
consisting of an inductor (L) two capacitors (Cin and Cout), an NMOS (M) and a diode (D). A
PWM was applied to the gate of the NMOS during normal operation. When the gate of the
NMOS is high, the current flows from the positive input to the negative input, charging the
inductor. When the gate of the NMOS is low the stored inductor current goes from the negative
terminal of the battery to the positive terminal until the stored current is empty. The output of the
buck-boost converter was fixed using a 4.8V Ni-MH battery, operating in Discontinuous
Conduction Mode (DCM), with typical current and voltage waveforms as shown in Fig. 2.17.
Figure 2.17 shows the PWM applied to the gate VGS, the voltage seen across the inductor VL, as

53
well as the current across the inductor due to charging and discharging IL. IL is triangular in
shape because near constant voltages are applied across the inductor, and the basic equation that
describes an inductor is
. Separating IL into current flowing from the input into the
output, we can identify Iin and Iout respectively.
M
D
LCin Cout
+
- +
-
Vrect Vbatt
Rin
Figure 2.16: Schematic diagram for the buck-boost converter used in this study
DTs D’Ts
Ts
t
t
t
t
t
Vgs
VL
IL
Iin
Iout
Vrect
-VBatt
ILmax
ILmax
ILmax
Figure 2.17: Typical waveforms for DCM operation of buck-boost converter.
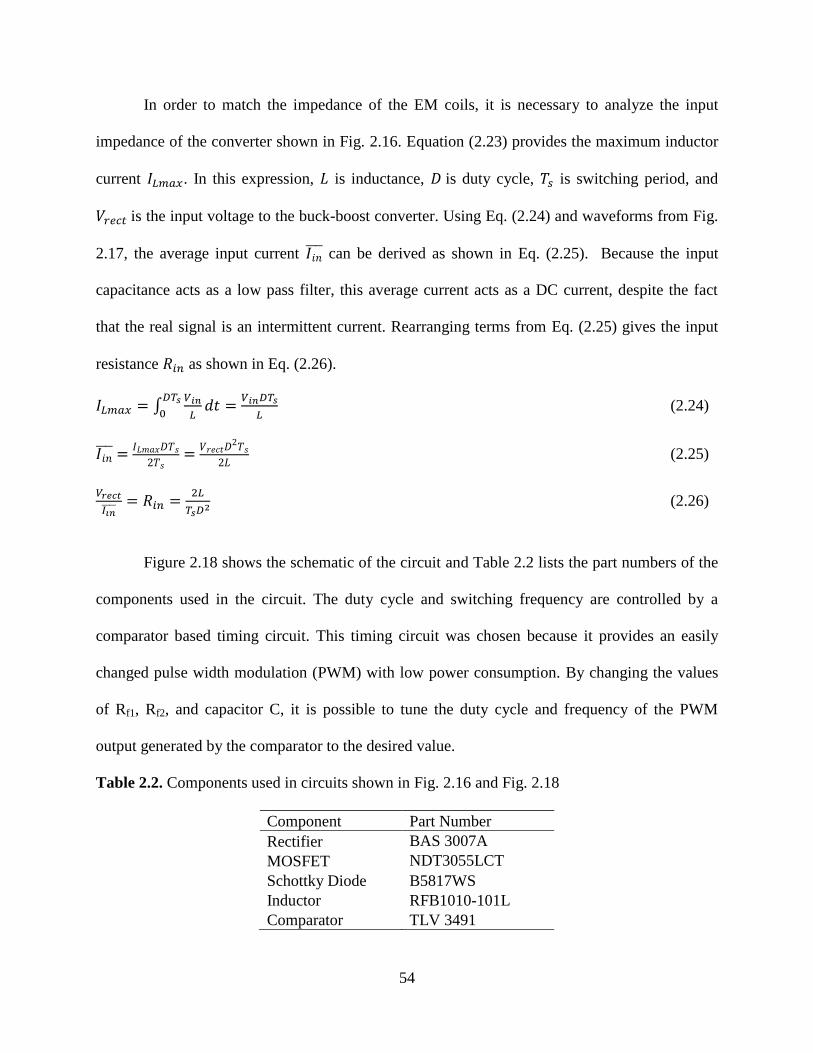
54
In order to match the impedance of the EM coils, it is necessary to analyze the input
impedance of the converter shown in Fig. 2.16. Equation (2.23) provides the maximum inductor
current . In this expression, is inductance, is duty cycle, is switching period, and
is the input voltage to the buck-boost converter. Using Eq. (2.24) and waveforms from Fig.
2.17, the average input current can be derived as shown in Eq. (2.25). Because the input
capacitance acts as a low pass filter, this average current acts as a DC current, despite the fact
that the real signal is an intermittent current. Rearranging terms from Eq. (2.25) gives the input
resistance as shown in Eq. (2.26).
∫
(2.24)
(2.25)
(2.26)
Figure 2.18 shows the schematic of the circuit and Table 2.2 lists the part numbers of the
components used in the circuit. The duty cycle and switching frequency are controlled by a
comparator based timing circuit. This timing circuit was chosen because it provides an easily
changed pulse width modulation (PWM) with low power consumption. By changing the values
of Rf1, Rf2, and capacitor C, it is possible to tune the duty cycle and frequency of the PWM
output generated by the comparator to the desired value.
Table 2.2. Components used in circuits shown in Fig. 2.16 and Fig. 2.18
Component Part Number
Rectifier BAS 3007A
MOSFET NDT3055LCT
Schottky Diode B5817WS
Inductor RFB1010-101L
Comparator TLV 3491

55
Figure 2.18: Schematic of impedance matching circuit
Eq. (2.27) provides the approximate duty cycle while Eq. (2.28) shows the approximate
expression for switching period [45]. It should be noted that the some tuning based on the
experimental observation is typically required to adjust the operating regime.
(2.27)
( )( ) (2.28)
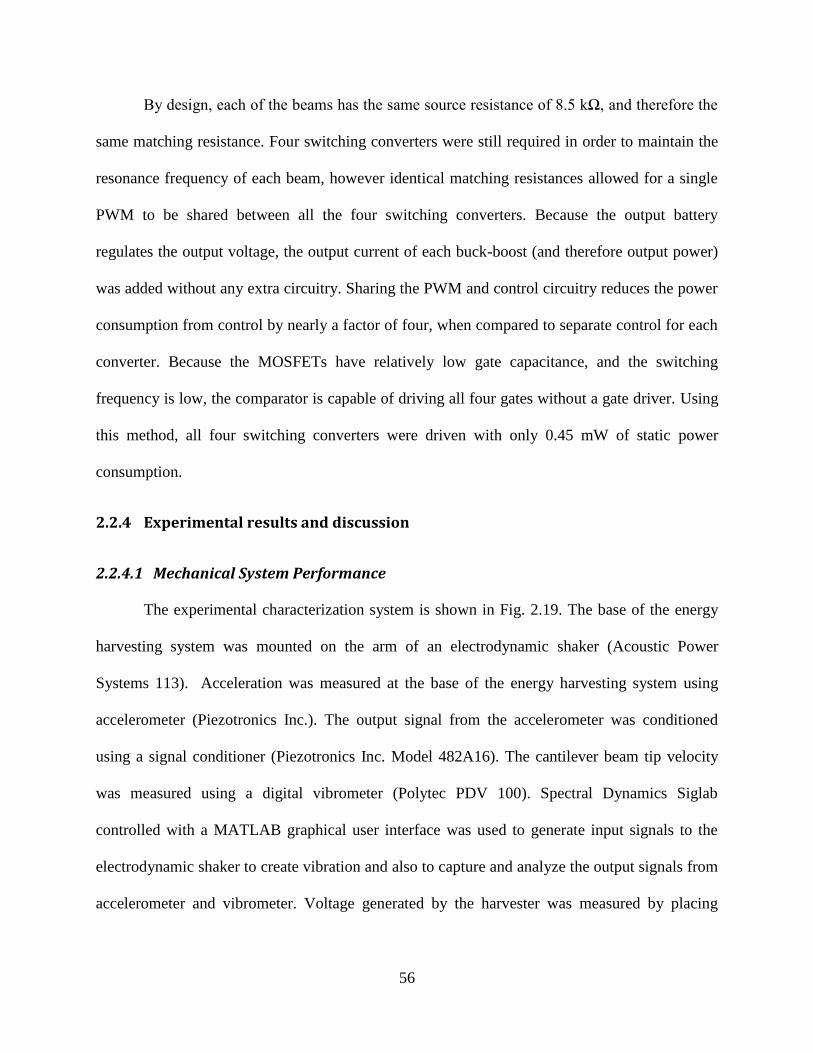
56
By design, each of the beams has the same source resistance of 8.5 kΩ, and therefore the
same matching resistance. Four switching converters were still required in order to maintain the
resonance frequency of each beam, however identical matching resistances allowed for a single
PWM to be shared between all the four switching converters. Because the output battery
regulates the output voltage, the output current of each buck-boost (and therefore output power)
was added without any extra circuitry. Sharing the PWM and control circuitry reduces the power
consumption from control by nearly a factor of four, when compared to separate control for each
converter. Because the MOSFETs have relatively low gate capacitance, and the switching
frequency is low, the comparator is capable of driving all four gates without a gate driver. Using
this method, all four switching converters were driven with only 0.45 mW of static power
consumption.
2.2.4 Experimental results and discussion
2.2.4.1 Mechanical System Performance
The experimental characterization system is shown in Fig. 2.19. The base of the energy
harvesting system was mounted on the arm of an electrodynamic shaker (Acoustic Power
Systems 113). Acceleration was measured at the base of the energy harvesting system using
accelerometer (Piezotronics Inc.). The output signal from the accelerometer was conditioned
using a signal conditioner (Piezotronics Inc. Model 482A16). The cantilever beam tip velocity
was measured using a digital vibrometer (Polytec PDV 100). Spectral Dynamics Siglab
controlled with a MATLAB graphical user interface was used to generate input signals to the
electrodynamic shaker to create vibration and also to capture and analyze the output signals from
accelerometer and vibrometer. Voltage generated by the harvester was measured by placing
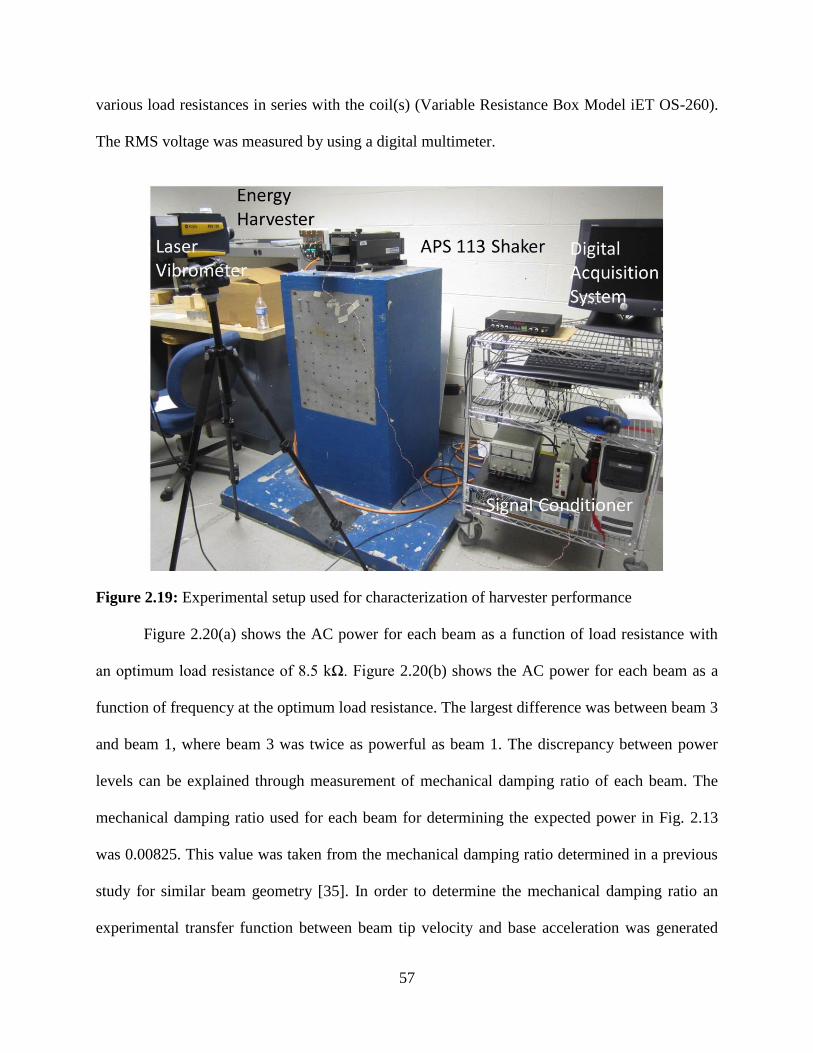
57
various load resistances in series with the coil(s) (Variable Resistance Box Model iET OS-260).
The RMS voltage was measured by using a digital multimeter.
Figure 2.19: Experimental setup used for characterization of harvester performance
Figure 2.20(a) shows the AC power for each beam as a function of load resistance with
an optimum load resistance of 8.5 kΩ. Figure 2.20(b) shows the AC power for each beam as a
function of frequency at the optimum load resistance. The largest difference was between beam 3
and beam 1, where beam 3 was twice as powerful as beam 1. The discrepancy between power
levels can be explained through measurement of mechanical damping ratio of each beam. The
mechanical damping ratio used for each beam for determining the expected power in Fig. 2.13
was 0.00825. This value was taken from the mechanical damping ratio determined in a previous
study for similar beam geometry [35]. In order to determine the mechanical damping ratio an
experimental transfer function between beam tip velocity and base acceleration was generated

58
for each beam by using 30 to 70 Hz sinusoidal sweep at 0.2 G base acceleration. The
experimental transfer function between the acceleration at the harvester base ( ) and the
relative velocity between the beam tip and the harvester base ( ) for each beam was fitted
using a 2 pole 1 zero curve fit as given by the expression below:
( )
( ) (2.29)
From the analytical transfer function the damping ratio can be calculated by following the
method described in detail elsewhere [35]. Table 2.3 lists the damping ratio of each beam as well
as the damping ratio for the beam in the prior study. Also listed in Table 3 is the transformation
factor, which couples the mechanical energy to electrical energy as shown in Eq. (2.21). The
slight differences in transformation factor between the four beams can be attributed to the
difference in number of windings due to limitations in manufacturing of the coils. The
transformation factor for each of the four beams is higher than the previous prototype due to an
increase in number of the coil turns from ~2400 to ~2600.
Figure 2.20: (a) Power vs. load resistance, and (b) Power vs. frequency at the optimum load
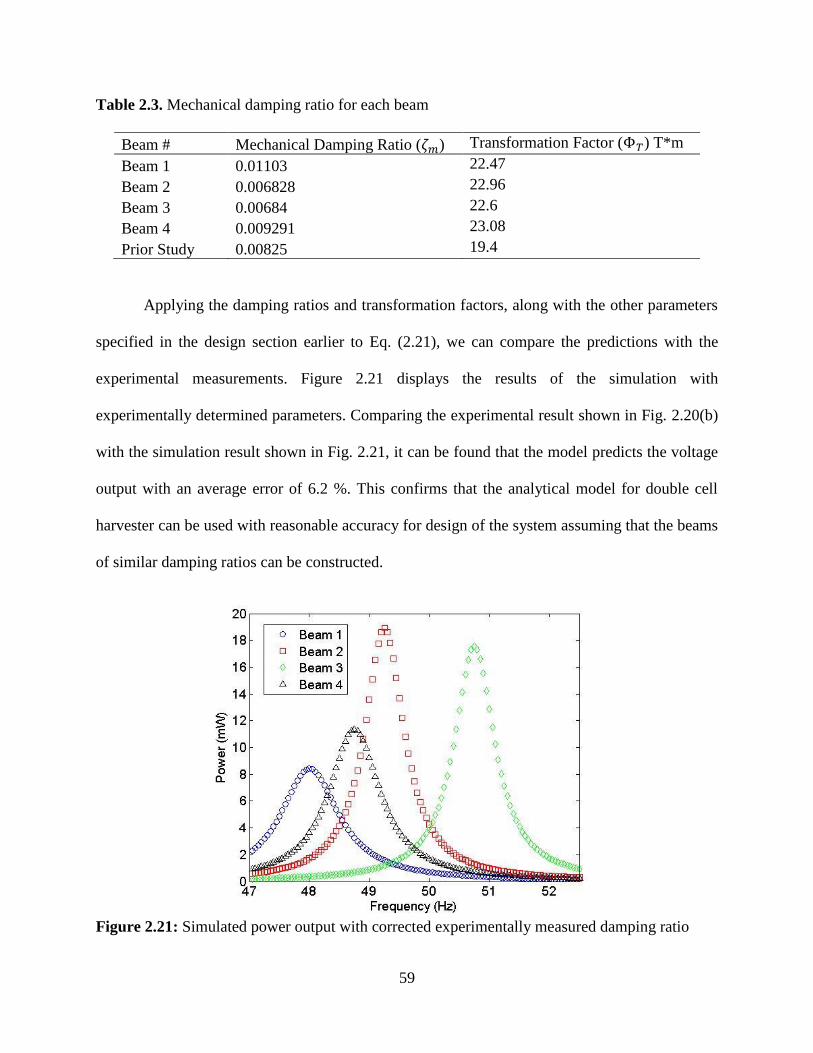
59
Table 2.3. Mechanical damping ratio for each beam
Beam # Mechanical Damping Ratio ( ) Transformation Factor ( ) T*m
Beam 1 0.01103 22.47
Beam 2 0.006828 22.96
Beam 3 0.00684 22.6
Beam 4 0.009291 23.08
Prior Study 0.00825 19.4
Applying the damping ratios and transformation factors, along with the other parameters
specified in the design section earlier to Eq. (2.21), we can compare the predictions with the
experimental measurements. Figure 2.21 displays the results of the simulation with
experimentally determined parameters. Comparing the experimental result shown in Fig. 2.20(b)
with the simulation result shown in Fig. 2.21, it can be found that the model predicts the voltage
output with an average error of 6.2 %. This confirms that the analytical model for double cell
harvester can be used with reasonable accuracy for design of the system assuming that the beams
of similar damping ratios can be constructed.
Figure 2.21: Simulated power output with corrected experimentally measured damping ratio
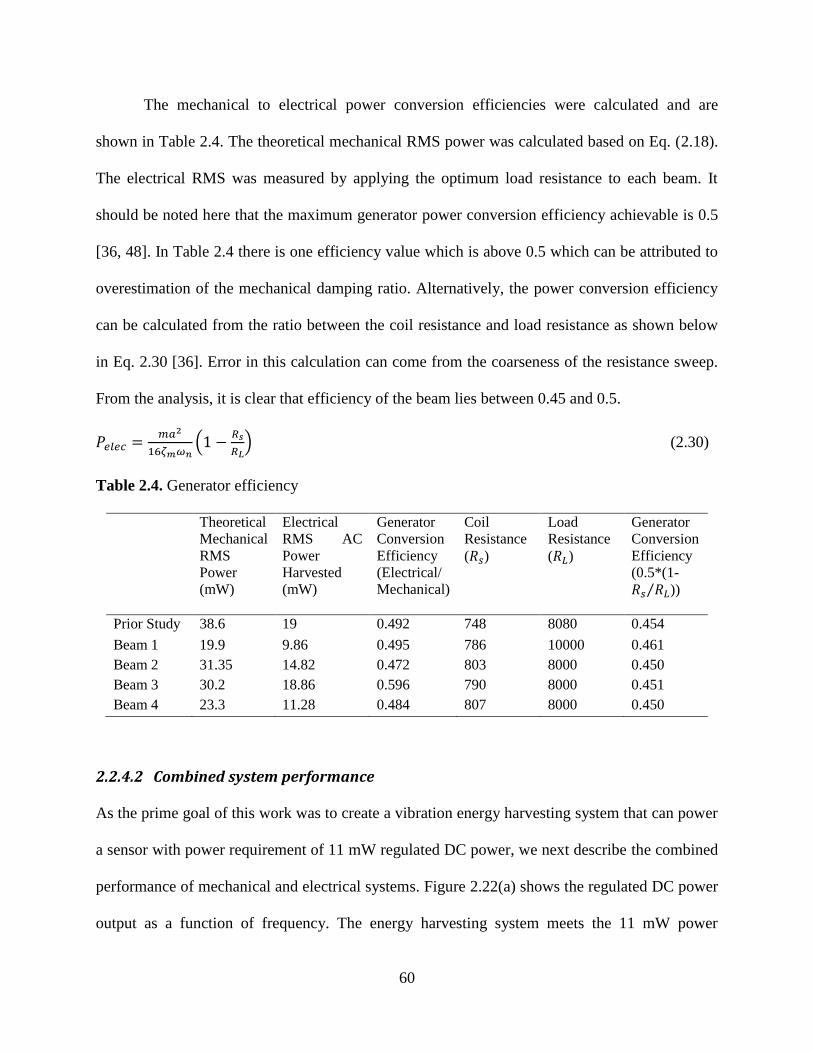
60
The mechanical to electrical power conversion efficiencies were calculated and are
shown in Table 2.4. The theoretical mechanical RMS power was calculated based on Eq. (2.18).
The electrical RMS was measured by applying the optimum load resistance to each beam. It
should be noted here that the maximum generator power conversion efficiency achievable is 0.5
[36, 48]. In Table 2.4 there is one efficiency value which is above 0.5 which can be attributed to
overestimation of the mechanical damping ratio. Alternatively, the power conversion efficiency
can be calculated from the ratio between the coil resistance and load resistance as shown below
in Eq. 2.30 [36]. Error in this calculation can come from the coarseness of the resistance sweep.
From the analysis, it is clear that efficiency of the beam lies between 0.45 and 0.5.
(
) (2.30)
Table 2.4. Generator efficiency
Theoretical
Mechanical
RMS
Power
(mW)
Electrical
RMS AC
Power
Harvested
(mW)
Generator
Conversion
Efficiency
(Electrical/
Mechanical)
Coil
Resistance
( )
Load
Resistance
( )
Generator
Conversion
Efficiency
(0.5*(1-
⁄ ))
Prior Study 38.6 19 0.492 748 8080 0.454
Beam 1 19.9 9.86 0.495 786 10000 0.461
Beam 2 31.35 14.82 0.472 803 8000 0.450
Beam 3 30.2 18.86 0.596 790 8000 0.451
Beam 4 23.3 11.28 0.484 807 8000 0.450
2.2.4.2 Combined system performance
As the prime goal of this work was to create a vibration energy harvesting system that can power
a sensor with power requirement of 11 mW regulated DC power, we next describe the combined
performance of mechanical and electrical systems. Figure 2.22(a) shows the regulated DC power
output as a function of frequency. The energy harvesting system meets the 11 mW power

61
requirement for a 4 Hz bandwidth from 47.75 – 51.75 Hz with an AC to regulated DC power
conversion efficiency of 78%. At the center frequency, the system harvests an average power of
19 mW. The excess power generated from this harvester is sufficient to power the transmitter on
a wireless sensor node. The Texas Instruments EZ430-RF2500T is commonly used for wireless
sensor nodes, and can be programmed to transmit data with the available power. With a 3.3 V
power supply, this device consumes 330 W of power in sleep mode, and 36.3 mW of power
when actively transmitting at -12 dBm signal strength and 250 kbps. By cycling between sleep
mode and transmission mode at a 10% duty cycle and 1 sec period, it is possible to get a 25 kbps
link that consumes about 3.9 mW of power with a maximum latency of 1 sec. Figure 2.22(b)
shows the AC to regulated DC electrical output power efficiency as a function of frequency. The
average efficiency across the 4 Hz bandwidth was 78% which is one of the highest reported
magnitudes for electromagnetic vibration harvesting system. Figure 2.22(c) shows the electrical
efficiency breakdown at each stage within the energy harvesting system.
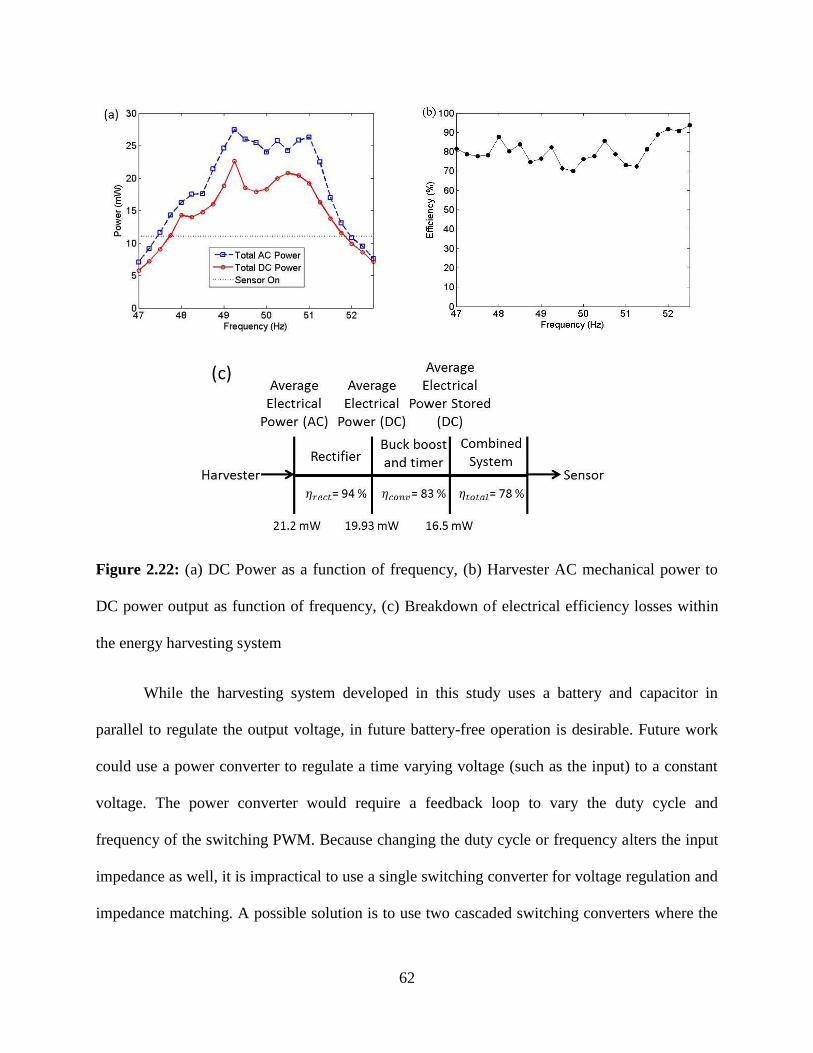
62
Figure 2.22: (a) DC Power as a function of frequency, (b) Harvester AC mechanical power to
DC power output as function of frequency, (c) Breakdown of electrical efficiency losses within
the energy harvesting system
While the harvesting system developed in this study uses a battery and capacitor in
parallel to regulate the output voltage, in future battery-free operation is desirable. Future work
could use a power converter to regulate a time varying voltage (such as the input) to a constant
voltage. The power converter would require a feedback loop to vary the duty cycle and
frequency of the switching PWM. Because changing the duty cycle or frequency alters the input
impedance as well, it is impractical to use a single switching converter for voltage regulation and
impedance matching. A possible solution is to use two cascaded switching converters where the
63
first one matches the impedance and stores the energy in a capacitor, with a second converter
that regulates the voltage. The control for this becomes more complicated, and additional
efficiency losses will be incurred by the second stage. However, it is possible to remove the need
for a battery as an energy storage element in this way.
To compare our prototype to the state-of-the-art, we can calculate a volume figure of
merit and a bandwidth figure of merit [49] as:
(2.31)
(2.32)
where is the source displacement, is the total prototype volume, is the resonant
frequency or center frequency and is the bandwidth 1 decibel down from the value at the
center frequency. Table 2.5 shows a summary of the various inductive harvesters reported in
literature along with the harvester developed in this study. Given the fact, that we overdesigned
our generator to generate excess power at all the operating frequencies, the overall system was
found to perform relatively well. As it can be seen from Fig. 2.22(a), the power requirement for
the sensor can be easily met with just three cantilevers resulting in drastic reduction in volume.
In that case the performance our harvester will be dramatically higher compared to published
literature. However, an overdesigned system has advantage in terms of accounting for any
random fluctuations that can occur during the deployment.
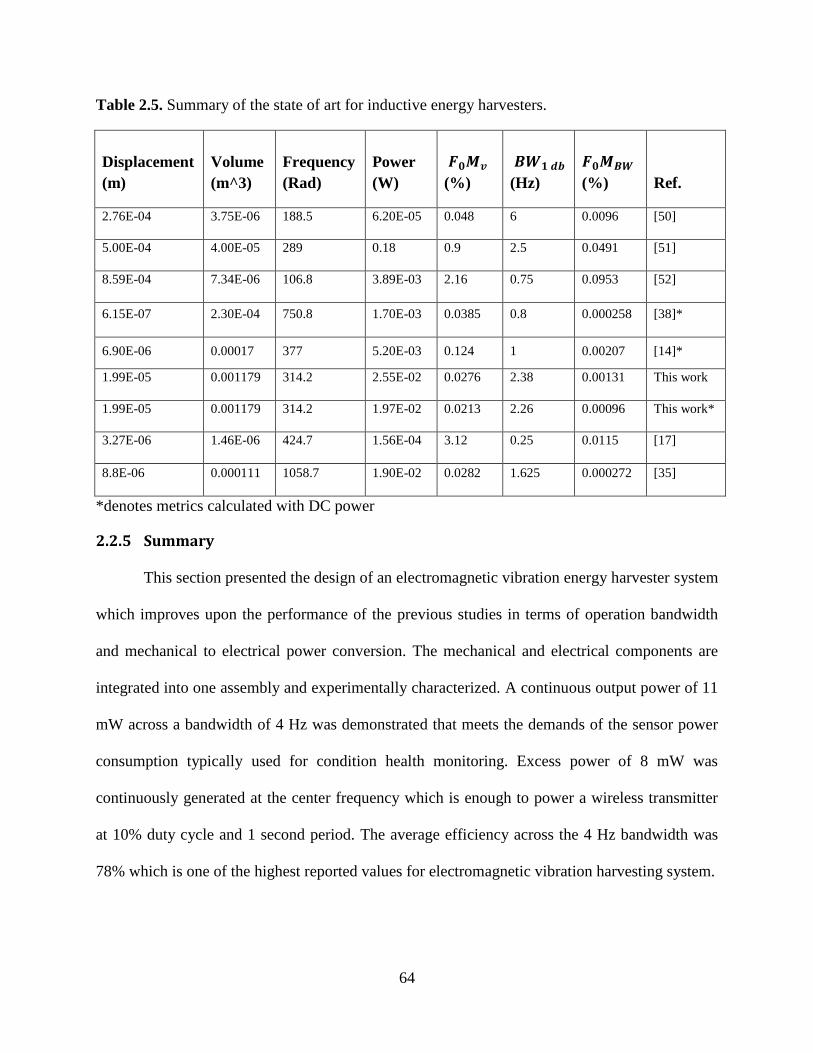
64
Table 2.5. Summary of the state of art for inductive energy harvesters.
Displacement
(m)
Volume
(m^3)
Frequency
(Rad)
Power
(W)
(%)
(Hz)
(%) Ref.
2.76E-04 3.75E-06 188.5 6.20E-05 0.048 6 0.0096 [50]
5.00E-04 4.00E-05 289 0.18 0.9 2.5 0.0491 [51]
8.59E-04 7.34E-06 106.8 3.89E-03 2.16 0.75 0.0953 [52]
6.15E-07 2.30E-04 750.8 1.70E-03 0.0385 0.8 0.000258 [38]*
6.90E-06 0.00017 377 5.20E-03 0.124 1 0.00207 [14]*
1.99E-05 0.001179 314.2 2.55E-02 0.0276 2.38 0.00131 This work
1.99E-05 0.001179 314.2 1.97E-02 0.0213 2.26 0.00096 This work*
3.27E-06 1.46E-06 424.7 1.56E-04 3.12 0.25 0.0115 [17]
8.8E-06 0.000111 1058.7 1.90E-02 0.0282 1.625 0.000272 [35]
*denotes metrics calculated with DC power
2.2.5 Summary
This section presented the design of an electromagnetic vibration energy harvester system
which improves upon the performance of the previous studies in terms of operation bandwidth
and mechanical to electrical power conversion. The mechanical and electrical components are
integrated into one assembly and experimentally characterized. A continuous output power of 11
mW across a bandwidth of 4 Hz was demonstrated that meets the demands of the sensor power
consumption typically used for condition health monitoring. Excess power of 8 mW was
continuously generated at the center frequency which is enough to power a wireless transmitter
at 10% duty cycle and 1 second period. The average efficiency across the 4 Hz bandwidth was
78% which is one of the highest reported values for electromagnetic vibration harvesting system.

65
3 CHAPTER 3: LOW FREQUENCY (< 50 Hz) VIBRATION ENERGY
HARVESTING
3.1 Multi-mechanism non-linear vibration harvester combining inductive and magnetostrictive mechanisms
In this study, we focus on developing a Multi-Mechanism Energy Harvester (MMEH)
which combines magnetostrictive and inductive mechanisms with overall shape and size similar
to AA battery. The multi-mechanism harvester was theoretically modeled, fabricated and
experimentally characterized. The theoretical model combining analytical and FEM modeling
techniques provides the system dynamics and output power for specific generator and
magnetostrictive geometry at various source conditions. The prototype consisted of a cylindrical
tube consisting of a magnetic levitation cavity where a center magnet oscillated through a copper
coil. Magnetostrictive rods were mounted on the bottom and top cap of the cylindrical tube. In
response to external vibrations, electrical energy was harvested from the relative motion between
magnet and coil through Faraday’s effect and from the magnetostrictive material through the
Villari effect. The experimental results were compared to theoretical predictions for both
mechanisms which showed reasonable agreement. The difference between model predictions and
experiments are discussed in detail. The inductive mechanism generated 5.3 mW, 2.57 mW, 0.27
mW at 0.9 G, 0.7 G and 0.4 G respectively.
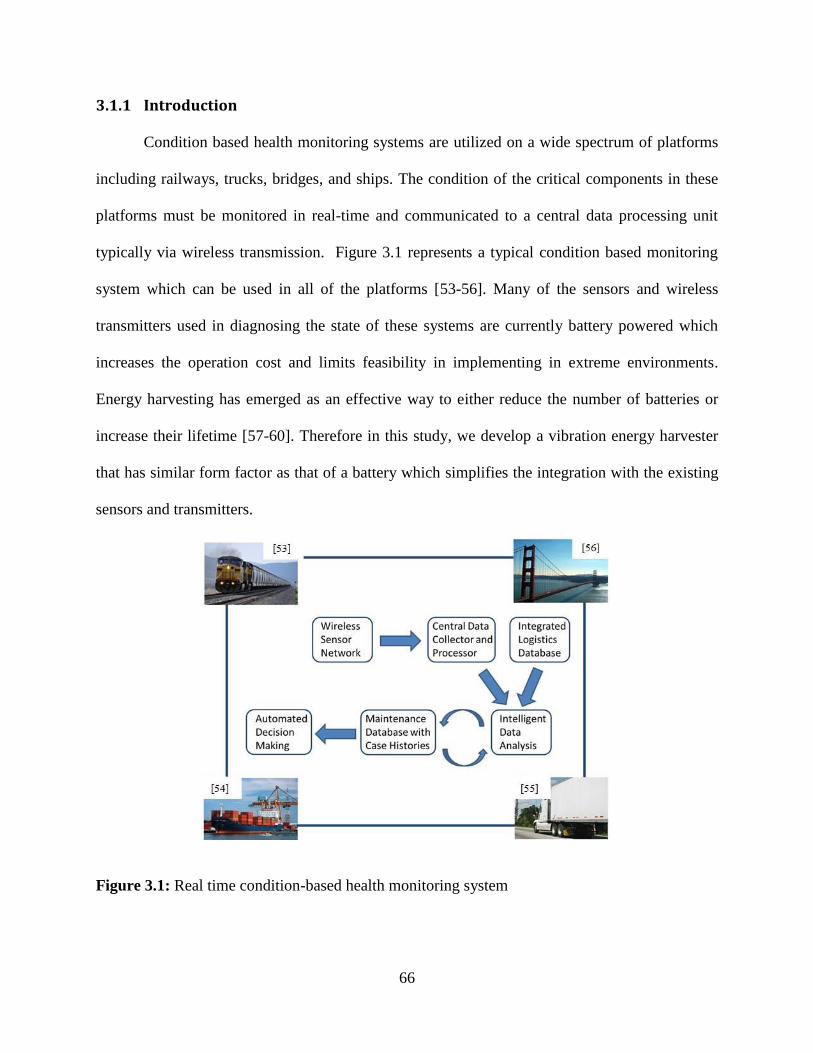
66
3.1.1 Introduction
Condition based health monitoring systems are utilized on a wide spectrum of platforms
including railways, trucks, bridges, and ships. The condition of the critical components in these
platforms must be monitored in real-time and communicated to a central data processing unit
typically via wireless transmission. Figure 3.1 represents a typical condition based monitoring
system which can be used in all of the platforms [53-56]. Many of the sensors and wireless
transmitters used in diagnosing the state of these systems are currently battery powered which
increases the operation cost and limits feasibility in implementing in extreme environments.
Energy harvesting has emerged as an effective way to either reduce the number of batteries or
increase their lifetime [57-60]. Therefore in this study, we develop a vibration energy harvester
that has similar form factor as that of a battery which simplifies the integration with the existing
sensors and transmitters.
Figure 3.1: Real time condition-based health monitoring system
67
The dominant vibration magnitudes available within railways, trucks, bridges, and ships
typically exist at frequencies below 20 Hz. Within this frequency range the vibration frequency
can fluctuate requiring the capability to harvest at broad range of frequencies [47, 61-68]. These
conditions require a low frequency, high power density, and broadband vibration energy
harvester. In vibration energy harvesting there are predominately two types of harvesters;
cantilever beam and magnetic levitation based designs. Cantilever beam harvesters consist of a
beam clamped at one end and free at the opposite end. Under applied vibration, relative motion
between the free end and the end clamped to the harvester structure is created. Piezoelectric
material can be bonded to the beam surface or an inductive coil attached to the free end to
generate energy by harvesting strain or velocity. Magnetic levitation harvesters consist of a
levitating magnet suspended by top and bottom stationary magnets attached to the harvester
structure usually of cylindrical form factor. A coil is wrapped around the structure in order to
harvest energy through electromagnetic induction. A magnetic flux density change occurs within
the coil due to the oscillating center magnet. Cantilever beam based harvesters typically
optimally operate at frequencies greater than 50 Hz [6, 9, 17, 23, 25, 35, 38]. Magnetic levitation
based harvesters typically operate below 50 Hz [50-52, 69-71]. The difference in operation
frequency range between the two harvester types is due to stiffness magnitude control. The
stiffness created by repulsive magnets in a magnetic levitation system can be decreased by
decreasing the strength of the outer magnets or distance between the top and bottom magnets,
whereas cantilever beam stiffness is determined by the beam geometry. Cantilever beam stiffness
cannot be decreased to the lower levels achieved by magnetic levitation harvesters without
sacrificing the structural integrity of the beam or by increasing the cantilever length that results
in impractical size of the harvester. Another advantage inherent to the magnetic levitation
68
systems is a non-linear stiffness profile. This is due to the repulsive force between magnetic
poles that varies as the square of the distance between them. The non-linear stiffness profile
causes magnetic levitation harvesters to have a non-linear frequency response which allows
harvesting more power within a broad range of frequencies as compared to linear frequency
response. Therefore a magnetic levitation based harvester was chosen for this work.
To further increase the capability of this harvester multi-mechanism energy harvesting
was investigated. Multi-mechanism vibration energy harvesting consists of harvesting vibration
through two different mechanisms simultaneously. Multi-mechanism harvesters have been
developed for both cantilever based designs [73] and magnetic levitation based harvesters [52].
Each of these designs combined the inductive mechanism with the piezoelectric mechanism. In
this study, we combined the inductive mechanism with the magnetostrictive mechanism.
Magnetostrictive energy harvesters utilize the Villari effect of magnetostrictive materials such as
TbDyFe (Terfenol-D) or FeGa (Galfenol). The Villari effect describes the change in magnetic
permeability of a magnetostrictive material under an applied varying stress. The structure
typically consists of a coil wound around a magnetostrictive material that is magnetically bias
with permanent magnets. As stress is applied, the magnetostrictive material strains generating a
magnetic flux density change within the coil inducing current flow. The Villari effect was first
utilized for energy harvesting using a cylindrical Terfenol-D rod of 30 mm diameter and 25 mm
length that was pre-stressed and magnetically biased along the axial direction at values of 25
MPa and 500 Oe respectively. Electromechanical models were developed predicting 350 mW of
power generation under an applied stress of 0.9 MPa at 1000 Hz [74]. In another study,
researchers compare the performance of Terfenol-D and Galfenol utilized in the cylindrical
configuration. Terfenol-D was biased at values of 200 Oe and 12.5 MPa and Galfenol at values
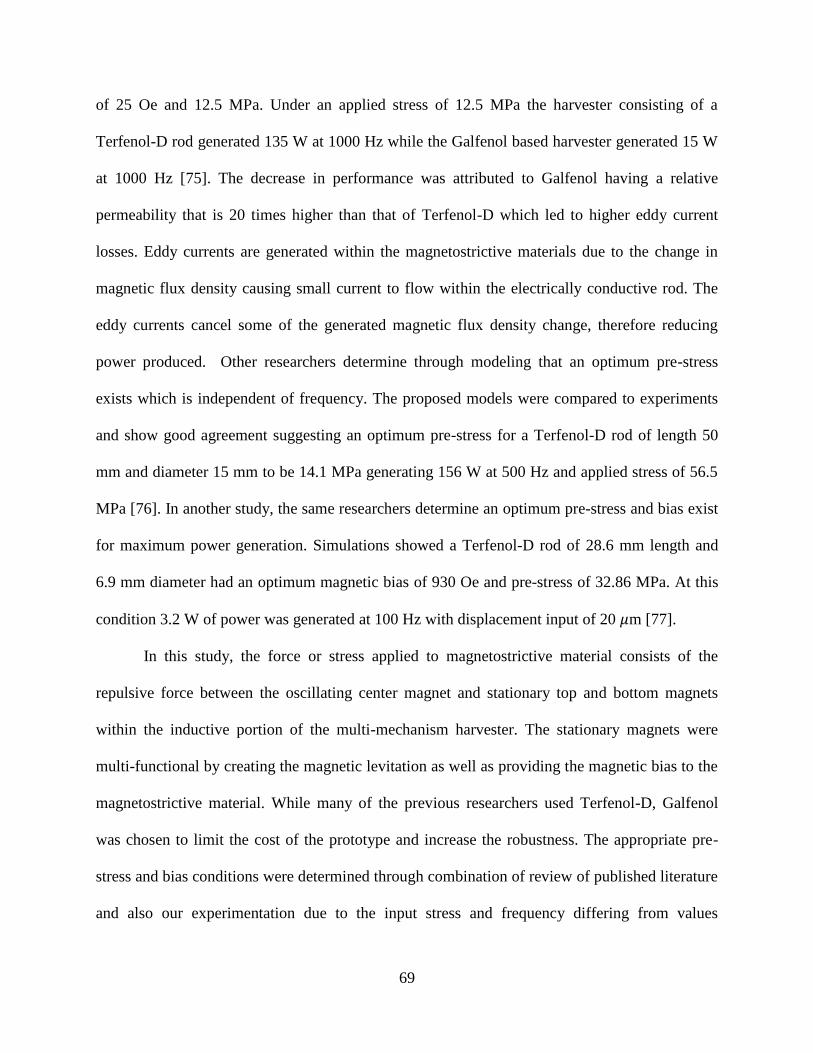
69
of 25 Oe and 12.5 MPa. Under an applied stress of 12.5 MPa the harvester consisting of a
Terfenol-D rod generated 135 W at 1000 Hz while the Galfenol based harvester generated 15 W
at 1000 Hz [75]. The decrease in performance was attributed to Galfenol having a relative
permeability that is 20 times higher than that of Terfenol-D which led to higher eddy current
losses. Eddy currents are generated within the magnetostrictive materials due to the change in
magnetic flux density causing small current to flow within the electrically conductive rod. The
eddy currents cancel some of the generated magnetic flux density change, therefore reducing
power produced. Other researchers determine through modeling that an optimum pre-stress
exists which is independent of frequency. The proposed models were compared to experiments
and show good agreement suggesting an optimum pre-stress for a Terfenol-D rod of length 50
mm and diameter 15 mm to be 14.1 MPa generating 156 W at 500 Hz and applied stress of 56.5
MPa [76]. In another study, the same researchers determine an optimum pre-stress and bias exist
for maximum power generation. Simulations showed a Terfenol-D rod of 28.6 mm length and
6.9 mm diameter had an optimum magnetic bias of 930 Oe and pre-stress of 32.86 MPa. At this
condition 3.2 W of power was generated at 100 Hz with displacement input of 20 m [77].
In this study, the force or stress applied to magnetostrictive material consists of the
repulsive force between the oscillating center magnet and stationary top and bottom magnets
within the inductive portion of the multi-mechanism harvester. The stationary magnets were
multi-functional by creating the magnetic levitation as well as providing the magnetic bias to the
magnetostrictive material. While many of the previous researchers used Terfenol-D, Galfenol
was chosen to limit the cost of the prototype and increase the robustness. The appropriate pre-
stress and bias conditions were determined through combination of review of published literature
and also our experimentation due to the input stress and frequency differing from values

70
published in previous studies. The repulsive force was 2 N during resonance of the inductive
system which occurred at 14 Hz. Nickel rods were also evaluated as an alternative to Galfenol in
an effort to further reduce the cost of the prototype. The inductive portion of the harvester
provided low frequency and broadband capability. With the addition of the magnetostrictive
portion we aimed to improve upon the power density of the inductive portion delivering a high
power density, broad band, and low frequency multi-mechanism harvester.
3.1.2 Multi-mechanism energy harvester design
The multi-mechanism energy harvester developed in this study is shown in Fig. 3.2. The
device includes outer housing (not shown) to cover a primary coil (PC) and two secondary coils
(SC), inner cover to support coil and stainless steel rod (magnet bearing surface) (IC), stationary
permanent magnet (SPM) at the top and bottom, oscillating permanent magnet (OPM), base for
attaching to vibration shaker (B), and magnetostrictive cap material (MC) at top and bottom.
Energy will be harvested by two mechanisms: (1) from the magnetostrictive material in top and
bottom cap which induces voltage in the surrounding secondary coil due to the Villari effect, and
(2) from the levitating permanent magnet which oscillates within the cylindrical cavity and
induces current in the coil through Faraday’s principle.
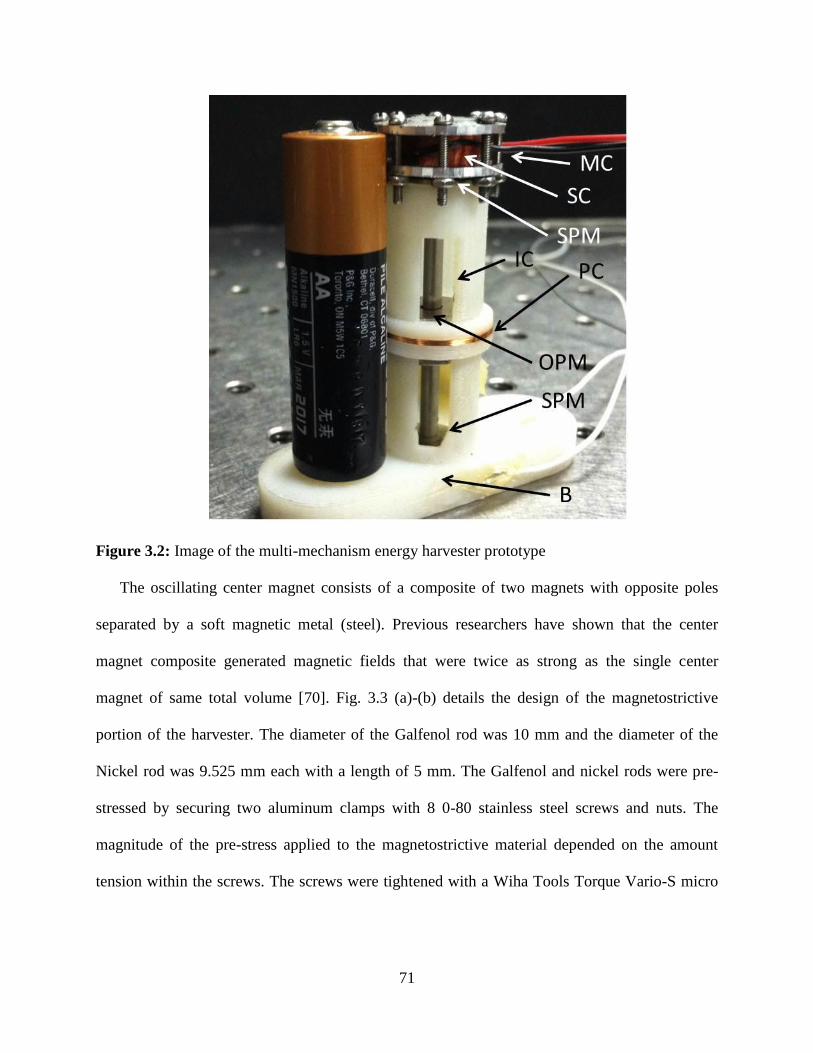
71
Figure 3.2: Image of the multi-mechanism energy harvester prototype
The oscillating center magnet consists of a composite of two magnets with opposite poles
separated by a soft magnetic metal (steel). Previous researchers have shown that the center
magnet composite generated magnetic fields that were twice as strong as the single center
magnet of same total volume [70]. Fig. 3.3 (a)-(b) details the design of the magnetostrictive
portion of the harvester. The diameter of the Galfenol rod was 10 mm and the diameter of the
Nickel rod was 9.525 mm each with a length of 5 mm. The Galfenol and nickel rods were pre-
stressed by securing two aluminum clamps with 8 0-80 stainless steel screws and nuts. The
magnitude of the pre-stress applied to the magnetostrictive material depended on the amount
tension within the screws. The screws were tightened with a Wiha Tools Torque Vario-S micro
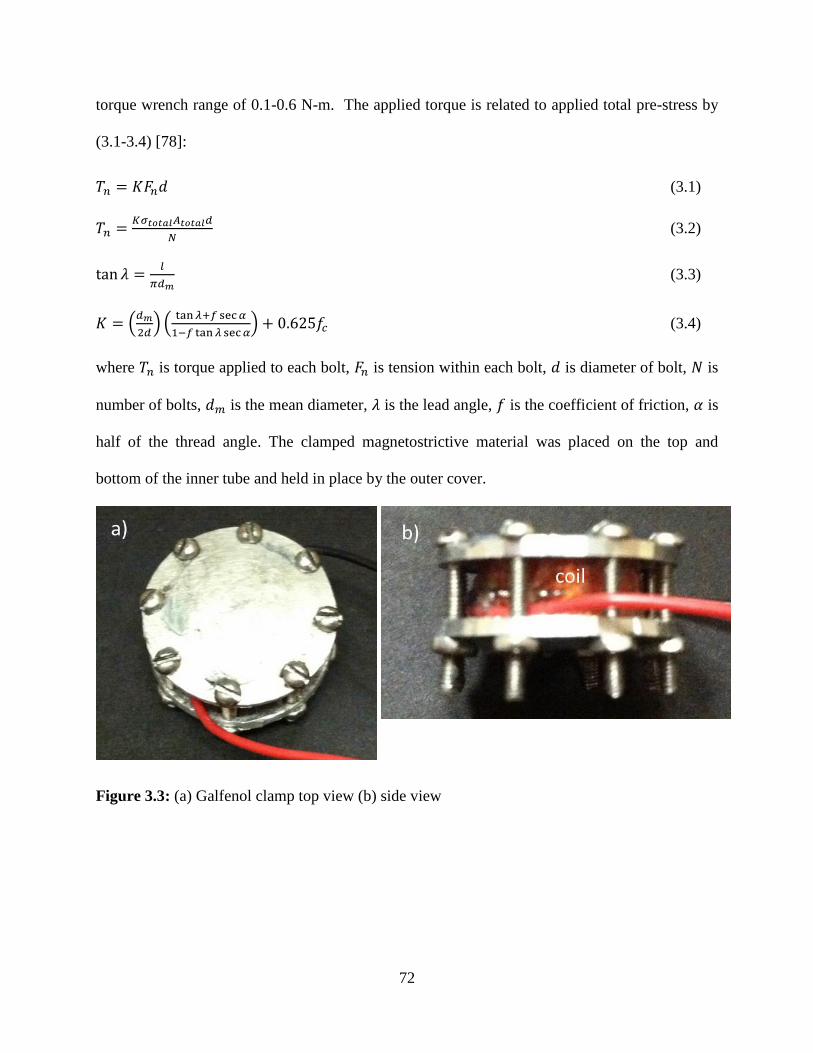
72
torque wrench range of 0.1-0.6 N-m. The applied torque is related to applied total pre-stress by
(3.1-3.4) [78]:
(3.1)
(3.2)
(3.3)
(
) (
) (3.4)
where is torque applied to each bolt, is tension within each bolt, is diameter of bolt, is
number of bolts, is the mean diameter, is the lead angle, is the coefficient of friction, is
half of the thread angle. The clamped magnetostrictive material was placed on the top and
bottom of the inner tube and held in place by the outer cover.
Figure 3.3: (a) Galfenol clamp top view (b) side view
73
3.1.3 Analytical model for energy harvester
3.1.3.1 Inductive mechanism
In order to predict the output power of harvester, the dynamics of center magnet composite and
the magnetic flux density distribution within the harvester was theoretically modeled. The
dynamics of the oscillating center magnet composite were modeled by using a nonlinear spring-
mass-damper mechanical system with an external applied base excitation given as:
( ) ( ) ( ) ( ) ( )
( ) (3.5)
where is a vibrating mass, is the mechanical damping constant, is the linear stiffness
constant of the spring, and are the nonlinear stiffness constants of the spring, ( ) is the
relative acceleration between the base of the structure ( ) and the vibrating mass ( ), is the
gravitational constant. In linear systems, gravity is normally canceled by the static equilibrium
with the spring, but due to the nonlinear stiffness constants gravitational force is included. In the
mechanical system discussed in this paper, the mass refers to mass of the center magnet
composite. The stiffness refers to the stiffness created by the repulsive force exerted on the
center magnet by the top/bottom magnets. The stiffness constants for the system were
approximated using the following non-linear relationship:
(3.6)
where is the repulsive force exerted by the outer magnets on the center magnet composite, is
the displacement of the center magnet composite, is the linear stiffness constant, and and
are the non-linear stiffness constants. Computational simulations using ANSYS magnetics
package were used to estimate the repulsive force as a function of center magnet composite
displacement. Solid 236 elements for magnets, air, soft magnetic material (steel) were used in the
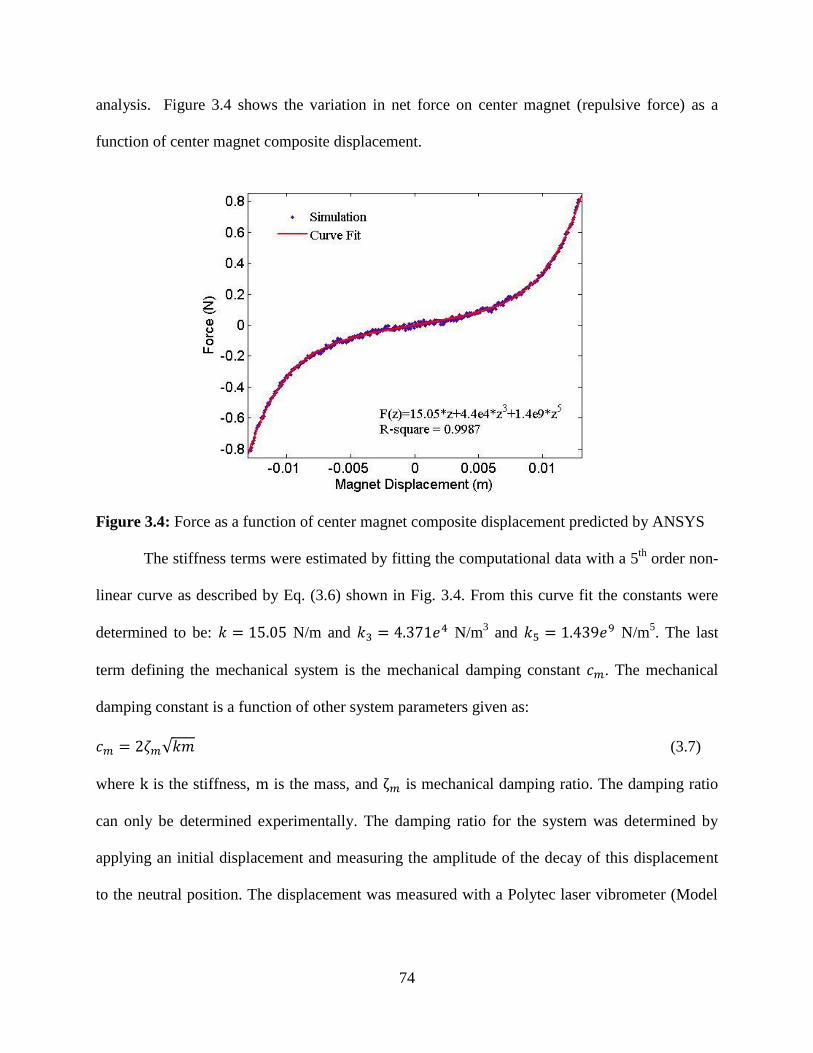
74
analysis. Figure 3.4 shows the variation in net force on center magnet (repulsive force) as a
function of center magnet composite displacement.
Figure 3.4: Force as a function of center magnet composite displacement predicted by ANSYS
The stiffness terms were estimated by fitting the computational data with a 5th
order non-
linear curve as described by Eq. (3.6) shown in Fig. 3.4. From this curve fit the constants were
determined to be: N/m and N/m3 and N/m
5. The last
term defining the mechanical system is the mechanical damping constant . The mechanical
damping constant is a function of other system parameters given as:
√ (3.7)
where is the stiffness, is the mass, and is mechanical damping ratio. The damping ratio
can only be determined experimentally. The damping ratio for the system was determined by
applying an initial displacement and measuring the amplitude of the decay of this displacement
to the neutral position. The displacement was measured with a Polytec laser vibrometer (Model
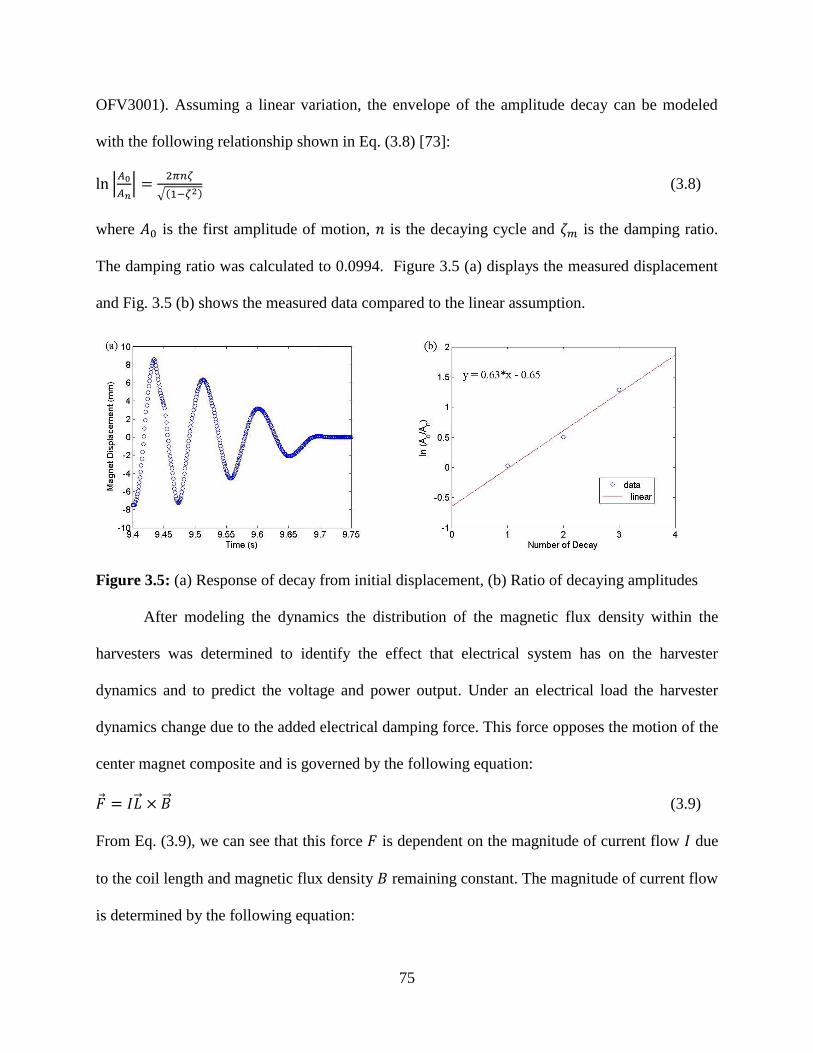
75
OFV3001). Assuming a linear variation, the envelope of the amplitude decay can be modeled
with the following relationship shown in Eq. (3.8) [73]:
|
|
√( ) (3.8)
where is the first amplitude of motion, is the decaying cycle and is the damping ratio.
The damping ratio was calculated to 0.0994. Figure 3.5 (a) displays the measured displacement
and Fig. 3.5 (b) shows the measured data compared to the linear assumption.
Figure 3.5: (a) Response of decay from initial displacement, (b) Ratio of decaying amplitudes
After modeling the dynamics the distribution of the magnetic flux density within the
harvesters was determined to identify the effect that electrical system has on the harvester
dynamics and to predict the voltage and power output. Under an electrical load the harvester
dynamics change due to the added electrical damping force. This force opposes the motion of the
center magnet composite and is governed by the following equation:
(3.9)
From Eq. (3.9), we can see that this force is dependent on the magnitude of current flow due
to the coil length and magnetic flux density remaining constant. The magnitude of current flow
is determined by the following equation:
76
( ) (3.10)
From Eq. (10), the current is dependent upon the relative velocity between magnet and coil as
the coil resistance , load resistance magnetic flux density , and coil length are constant.
The magnetic field was assumed to not vary in time for the initial modeling. Only the maximum
magnet flux and relative velocity were predicted with the modeling, therefore only
the peak voltage and peak power were predicted accurately. Therefore the electrical damping
constant can be derived from the following relationship:
( )
( )
( ) (3.11)
The electrical damping force is only applied when the magnet is within the coil volume. Due to
large range of motion of the center magnet composite as compared to the thin region of coil, this
additional damping term cannot be applied for all ( ). A piecewise function was added to Eq.
(3.5) to incorporate the additional damping effect only when the center magnet passes through
the coil. In order to predict the relative velocity between center magnet and coil we numerically
solve Eq. (3.5) using the ode 45 solver in MATLAB 7.12.0 (R2011a). A MATLAB script was
written to predict the response of the mechanical system for a range of excitation frequencies;
therefore the input signal to the system was a sinusoidal wave form of 7 – 18.5 Hz frequency
content. The initial position and velocity at t=0 used for the simulations was the center magnet
equilibrium position (-3.8 mm) and zero initial velocity. As the MATLAB script sweeps through
the various frequencies, the same equilibrium position was used for the initial position condition,
but the initial velocity condition is updated from the steady state velocity of the previous
frequency. Peak power can be calculated by evaluating Eqs. (3.12-3.14) as determined by
applying Kirchoff’s law to the magnetic circuit.
(3.12)
77
(3.13)
(
)
(3.14)
where the quantity represents the maximum relative displacement of the center magnet with
respect to coil, RL is the load resistance, is the maximum magnetic flux density within the
coil, is the length of coil, Re is the coil resistance. The coil inductance was not included in the
modeling of the electrical system. It has been stated that inductance in inductive harvesters
operating at low frequencies (< 1 kHz) can be neglected [24,79]. To confirm the assumption, the
inductance of the coil was measured to be 6.95mH at 100 Hz. The resistance of the coil was 348
ohms and the resistance of the load was 700 ohms. To compare the magnitudes of the terms we
convert the inductance to impedance by multiplying by the frequency in radians to obtain an
equivalent impedance of 4.36 ohms. Therefore, the assumption that the inductance can be
neglected is confirmed.
Every term in Eqs. (3.12-3.14) can determined except for the quantity which will
be referred as the transformation factor for the rest of the analysis. In order to estimate the
transformation factor we determine spatial distribution of magnetic flux density and discretize
the coil length using an experimentally verified approach described in literature [26, 35, 52]. The
transformation factor which governs mechanical energy to electrical energy conversion is
determined through the relationship:
∫( ) (3.15)
where is the relative velocity between center magnet composite and coil, is the magnetic flux
density cutting the coil, is the conductor length. By assuming that the coil velocity is
orthogonal to magnetic field vectors, the line integral in Eq. (3.15) reduces to Eq. (3.16):
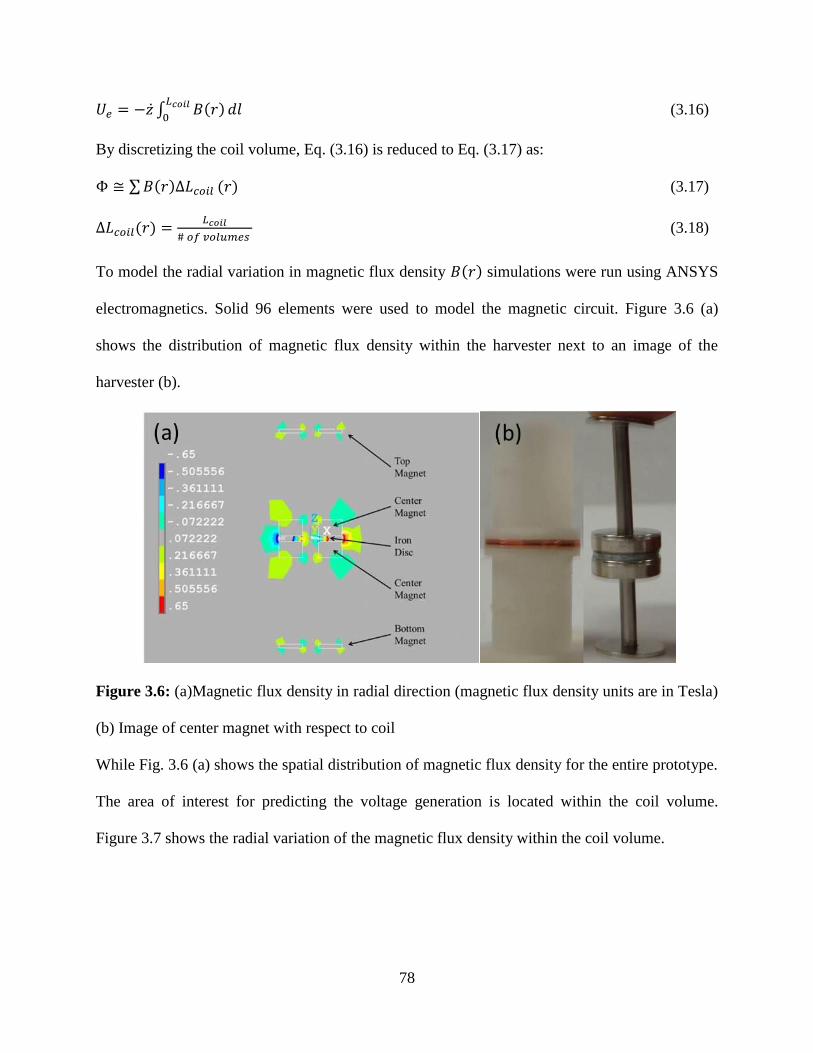
78
∫ ( )
(3.16)
By discretizing the coil volume, Eq. (3.16) is reduced to Eq. (3.17) as:
∑ ( ) ( ) (3.17)
( )
(3.18)
To model the radial variation in magnetic flux density ( ) simulations were run using ANSYS
electromagnetics. Solid 96 elements were used to model the magnetic circuit. Figure 3.6 (a)
shows the distribution of magnetic flux density within the harvester next to an image of the
harvester (b).
Figure 3.6: (a)Magnetic flux density in radial direction (magnetic flux density units are in Tesla)
(b) Image of center magnet with respect to coil
While Fig. 3.6 (a) shows the spatial distribution of magnetic flux density for the entire prototype.
The area of interest for predicting the voltage generation is located within the coil volume.
Figure 3.7 shows the radial variation of the magnetic flux density within the coil volume.
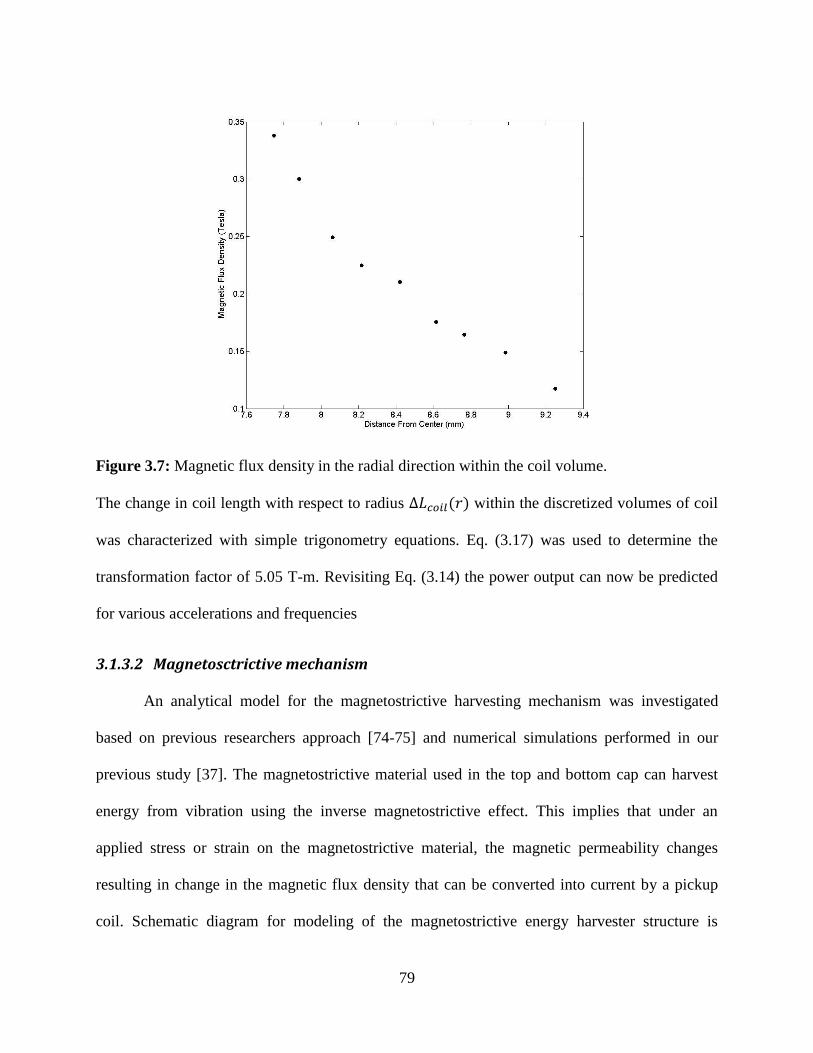
79
Figure 3.7: Magnetic flux density in the radial direction within the coil volume.
The change in coil length with respect to radius ( ) within the discretized volumes of coil
was characterized with simple trigonometry equations. Eq. (3.17) was used to determine the
transformation factor of 5.05 T-m. Revisiting Eq. (3.14) the power output can now be predicted
for various accelerations and frequencies
3.1.3.2 Magnetosctrictive mechanism
An analytical model for the magnetostrictive harvesting mechanism was investigated
based on previous researchers approach [74-75] and numerical simulations performed in our
previous study [37]. The magnetostrictive material used in the top and bottom cap can harvest
energy from vibration using the inverse magnetostrictive effect. This implies that under an
applied stress or strain on the magnetostrictive material, the magnetic permeability changes
resulting in change in the magnetic flux density that can be converted into current by a pickup
coil. Schematic diagram for modeling of the magnetostrictive energy harvester structure is
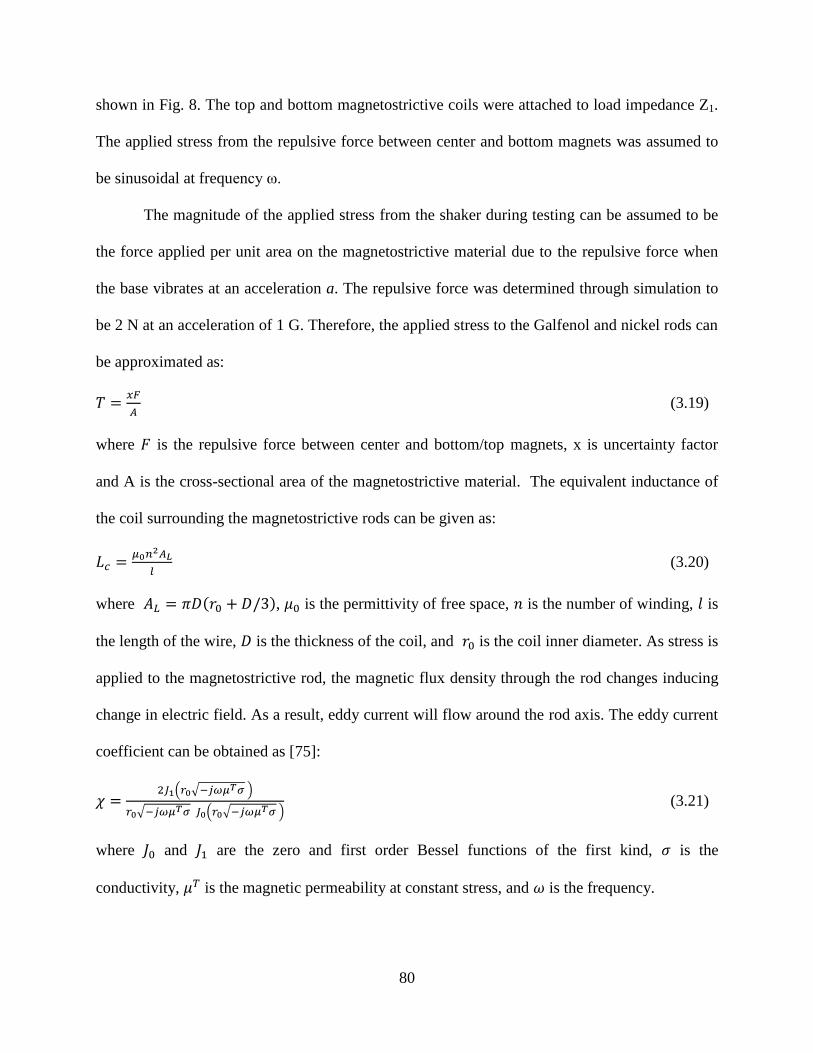
80
shown in Fig. 8. The top and bottom magnetostrictive coils were attached to load impedance Z1.
The applied stress from the repulsive force between center and bottom magnets was assumed to
be sinusoidal at frequency ω.
The magnitude of the applied stress from the shaker during testing can be assumed to be
the force applied per unit area on the magnetostrictive material due to the repulsive force when
the base vibrates at an acceleration a. The repulsive force was determined through simulation to
be 2 N at an acceleration of 1 G. Therefore, the applied stress to the Galfenol and nickel rods can
be approximated as:
(3.19)
where is the repulsive force between center and bottom/top magnets, x is uncertainty factor
and A is the cross-sectional area of the magnetostrictive material. The equivalent inductance of
the coil surrounding the magnetostrictive rods can be given as:
(3.20)
where ( ), is the permittivity of free space, is the number of winding, is
the length of the wire, is the thickness of the coil, and is the coil inner diameter. As stress is
applied to the magnetostrictive rod, the magnetic flux density through the rod changes inducing
change in electric field. As a result, eddy current will flow around the rod axis. The eddy current
coefficient can be obtained as [75]:
( √ )
√ ( √ ) (3.21)
where and are the zero and first order Bessel functions of the first kind, is the
conductivity, is the magnetic permeability at constant stress, and is the frequency.
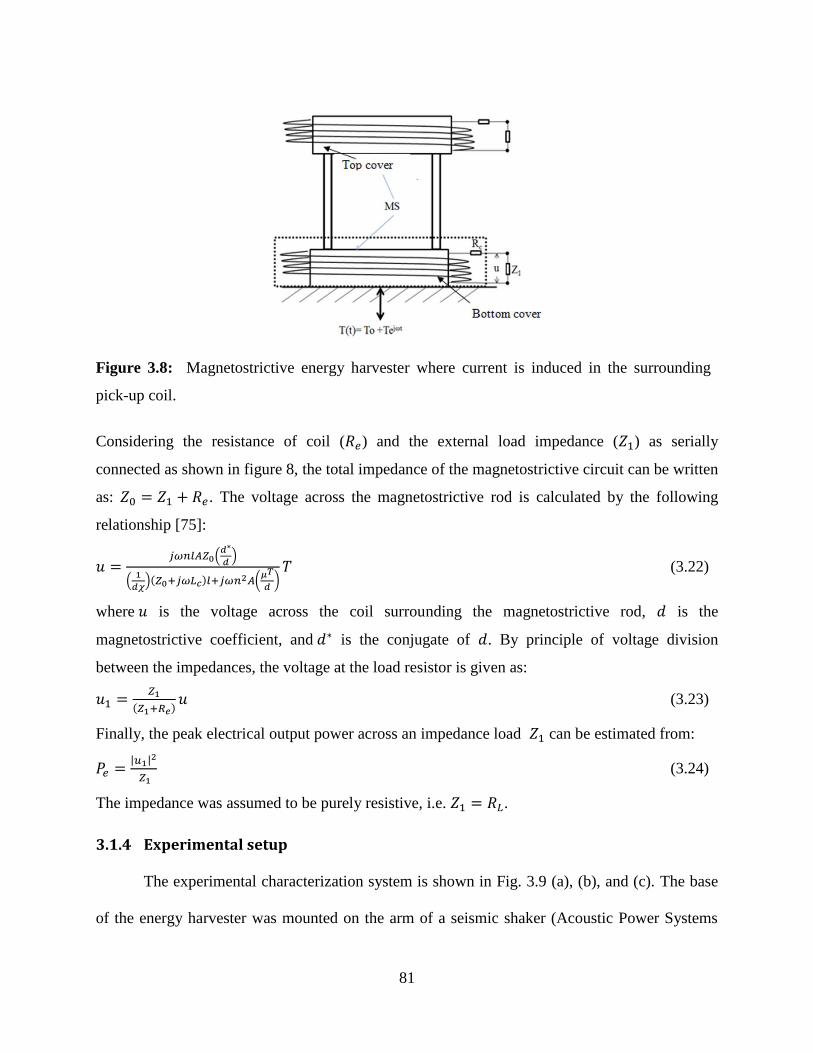
81
Considering the resistance of coil ( ) and the external load impedance ( ) as serially
connected as shown in figure 8, the total impedance of the magnetostrictive circuit can be written
as: . The voltage across the magnetostrictive rod is calculated by the following
relationship [75]:
(
)
(
)( ) (
) (3.22)
where is the voltage across the coil surrounding the magnetostrictive rod, is the
magnetostrictive coefficient, and is the conjugate of . By principle of voltage division
between the impedances, the voltage at the load resistor is given as:
( ) (3.23)
Finally, the peak electrical output power across an impedance load can be estimated from:
| |
(3.24)
The impedance was assumed to be purely resistive, i.e. .
3.1.4 Experimental setup
The experimental characterization system is shown in Fig. 3.9 (a), (b), and (c). The base
of the energy harvester was mounted on the arm of a seismic shaker (Acoustic Power Systems
Figure 3.8: Magnetostrictive energy harvester where current is induced in the surrounding
pick-up coil.
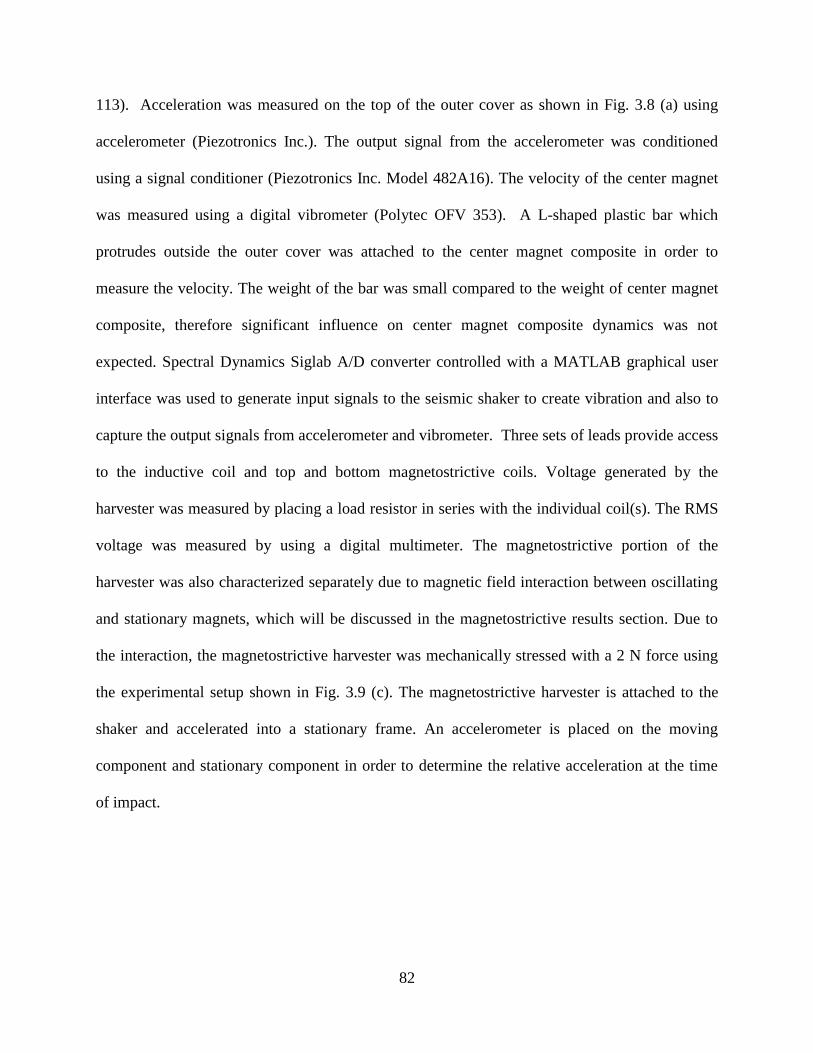
82
113). Acceleration was measured on the top of the outer cover as shown in Fig. 3.8 (a) using
accelerometer (Piezotronics Inc.). The output signal from the accelerometer was conditioned
using a signal conditioner (Piezotronics Inc. Model 482A16). The velocity of the center magnet
was measured using a digital vibrometer (Polytec OFV 353). A L-shaped plastic bar which
protrudes outside the outer cover was attached to the center magnet composite in order to
measure the velocity. The weight of the bar was small compared to the weight of center magnet
composite, therefore significant influence on center magnet composite dynamics was not
expected. Spectral Dynamics Siglab A/D converter controlled with a MATLAB graphical user
interface was used to generate input signals to the seismic shaker to create vibration and also to
capture the output signals from accelerometer and vibrometer. Three sets of leads provide access
to the inductive coil and top and bottom magnetostrictive coils. Voltage generated by the
harvester was measured by placing a load resistor in series with the individual coil(s). The RMS
voltage was measured by using a digital multimeter. The magnetostrictive portion of the
harvester was also characterized separately due to magnetic field interaction between oscillating
and stationary magnets, which will be discussed in the magnetostrictive results section. Due to
the interaction, the magnetostrictive harvester was mechanically stressed with a 2 N force using
the experimental setup shown in Fig. 3.9 (c). The magnetostrictive harvester is attached to the
shaker and accelerated into a stationary frame. An accelerometer is placed on the moving
component and stationary component in order to determine the relative acceleration at the time
of impact.
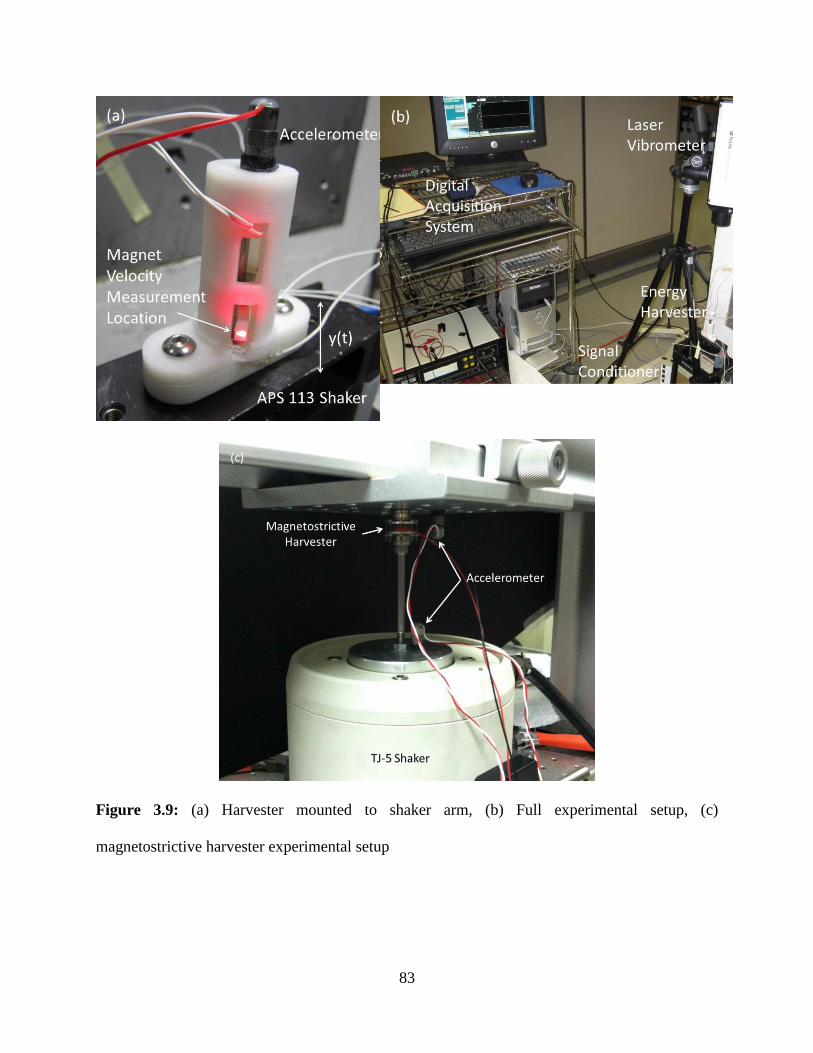
83
Figure 3.9: (a) Harvester mounted to shaker arm, (b) Full experimental setup, (c)
magnetostrictive harvester experimental setup

84
3.1.5 Results and discussion
The analytical models presented earlier were used to simulate the electrodynamics and
power generated by inductive (electromagnetic) and magnetostrictive mechanisms. The
simulations were then compared to the experimental results to validate the proposed models. Any
discrepancies present between model and experiments are discussed in detail. A discussion is
given on the presence of the nonlinearity and broadband capabilities within the inductive
mechanism. Magnetic bias level and pre-stress level effect on power generation in the
magnetostrictive part was investigated. Discussion on future improvements to the current designs
of both inductive and magnetostrictive mechanisms are presented and discussed.
85
3.1.5.1 Inductive mechanism
The following parameters and associated values were applied in the inductive harvester
simulations using Eqs. (3.12-3.14) and used in the fabrication of the inductive portion prototype
listed in Table 3.1.
Table 3.1: List of prototype parameters
Parameters Values
Cylinder (mm) 50 long x 16 OD
Center Magnet (mm) 12.7 OD x 3.2 ID x 3.2 THK
End Magnet (mm) 12.7 OD x 3.2 ID x 0.8 THK
Soft Magnetic (mm) 12.7 OD x 3.2 ID x 1.2 THK
Mechanical Mass (g) 6.53
Stiffness, k (N/m) 15.05
Stiffness, k3 (N/m3) 4.37E+04
Stiffness, k5 (N/m5) 1.44E+09
Damping ratio, ζm 0.0994
Coil Size (mm) 15.5 ID x 18.5 OD x 1 THK
Coil Length (m) 25.2
Coil Resistance (ohms) 348
Wire Diameter (micron) 44
Ф (T*m) 5.05
OD= outside diameter, ID= inside diameter, THK = thickness
To investigate the bandwidth and dynamic response of the harvester, frequency response
functions between base velocity and center magnet composite velocity were simulated within 7
Hz – 18.5 Hz range. The frequency response functions were generated for three different base
accelerations ( ) (0.4 G, 0.7 G and 0.9 G) to determine the effect of acceleration on bandwidth
and power. Forward and backward frequency sweeps were applied to capture the influence from
the jump phenomena on the frequency response function caused by the non-linear stiffness
relationship. This is common effect seen in non-linear mechanical systems [71, 80]. Voltage
predictions were calculated from velocity predictions using Eq. (3.13) and compared to the
measured voltage rather than comparing simulated and experimental velocity directly. The
86
velocity could not be measured for the full range of base amplitudes due to coil volume limiting
the range of motion of the L-shaped lip which is attached to the center magnet composite as
shown in Fig. 3.9 (a).
Figure 3.10 (a-c) displays the results of the simulation compared with experimental
results for the specified geometry in Table 3.1 for 0.4 G, 0.7 G and 0.9 G base excitation
magnitudes. The inductive mechanism generated 5.3 mW, 2.57 mW, 0.27 mW of peak power at
0.9 G, 0.7 G and 0.4 G respectively. The model agrees with experimental data better at the
higher base excitation than at the low excitation magnitudes. The discrepancy was attributed to
the following causes. The coil is positioned at the center of the top and bottom magnets. Due to
the force of gravity, the equilibrium for the center magnet composite is not at the center of the
top and bottom magnets; it is rather 3.8 mm lower. For the simulations it was assumed that when
the center of the magnet passes the center of the coil this velocity stays constant through the
thickness of the coil; thus any velocity gradient in the thickness direction of the coil was
neglected. This would be true for system where the coil is positioned at the equilibrium position
but due to the equilibrium being lower than coil position it is possible that the gradient cannot be
neglected. Another assumption that was made was that the damping constant was assumed to be
linear through the full range of center magnet composite displacement. The damping was
measured by displacing the magnet by 10 mm from equilibrium position and measuring the
decay back to equilibrium. Therefore for lower base accelerations where the magnet may never
reach of maximum displacement of 10 mm the damping constant may vary.
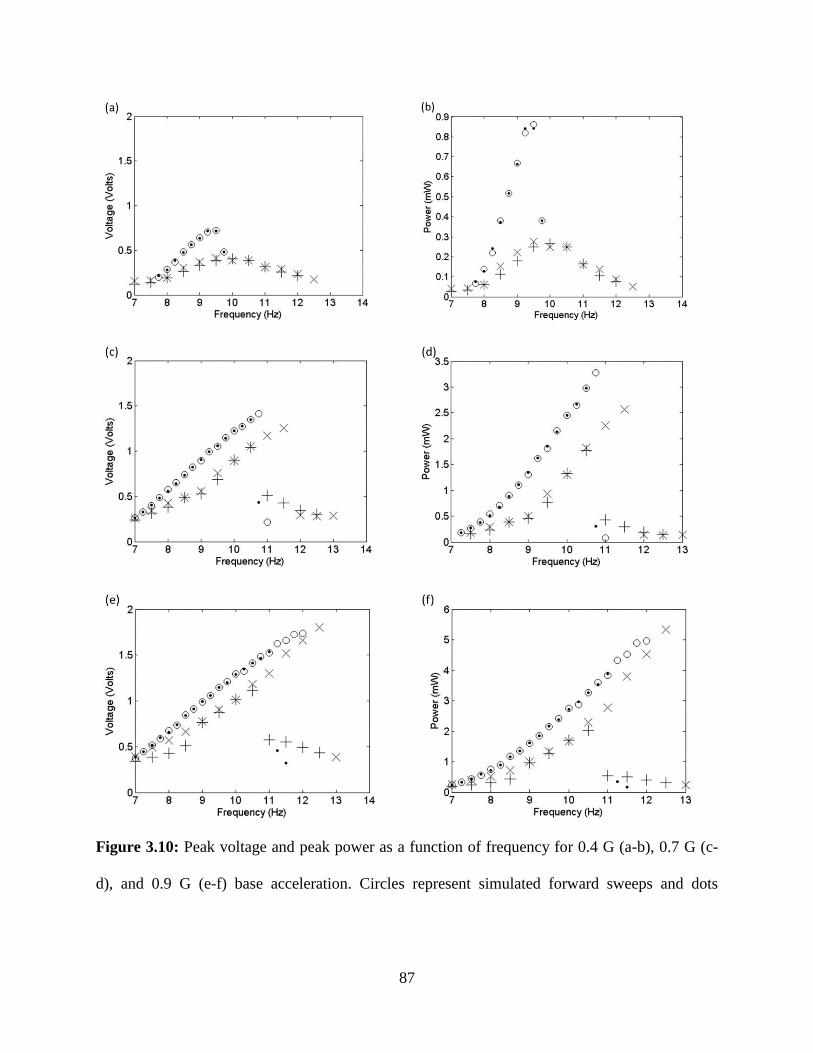
87
Figure 3.10: Peak voltage and peak power as a function of frequency for 0.4 G (a-b), 0.7 G (c-
d), and 0.9 G (e-f) base acceleration. Circles represent simulated forward sweeps and dots

88
represent simulated backward sweeps. X represents experimental forward sweeps and +
represent experimental backward frequency sweeps
To compare our prototype to the state-of-the-art energy harvesters operating below 50 Hz
we can calculate a volume figure of merit and a bandwidth figure of merit [49] as:
(3.25)
(3.26)
Where is the peak amplitude of the source displacement, is the total prototype volume,
is the resonant frequency or center frequency and is the bandwidth 1 decibel down from
the value at the center frequency. Table 3.2 shows a summary of the various inductive magnetic
levitation harvesters referenced in this study as compared to the harvester developed through this
study. The inductive portion of our harvester is comparable to the state of the art in both volume
and bandwidth figure of merit. It should be noted that at the lower acceleration level the
nonlinearity is not present in the frequency response function due to damping limiting the range
of motion of the center magnet composite as seen in Fig. 3.10 (a-b). Therefore at the lower
acceleration levels the bandwidth figure of merit could decrease. Fig. 3.11 displays the 1 G
experimental data used for the calculations.
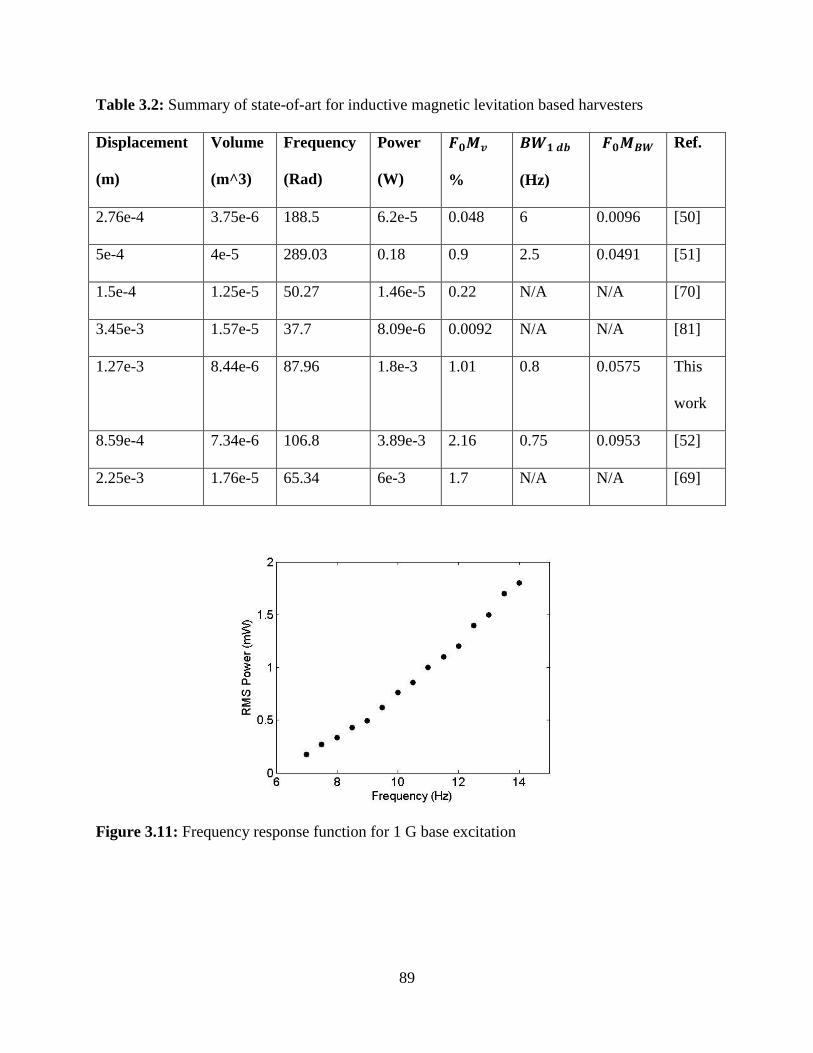
89
Table 3.2: Summary of state-of-art for inductive magnetic levitation based harvesters
Displacement
(m)
Volume
(m^3)
Frequency
(Rad)
Power
(W)
%
(Hz)
Ref.
2.76e-4 3.75e-6 188.5 6.2e-5 0.048 6 0.0096 [50]
5e-4 4e-5 289.03 0.18 0.9 2.5 0.0491 [51]
1.5e-4 1.25e-5 50.27 1.46e-5 0.22 N/A N/A [70]
3.45e-3 1.57e-5 37.7 8.09e-6 0.0092 N/A N/A [81]
1.27e-3 8.44e-6 87.96 1.8e-3 1.01 0.8 0.0575 This
work
8.59e-4 7.34e-6 106.8 3.89e-3 2.16 0.75 0.0953 [52]
2.25e-3 1.76e-5 65.34 6e-3 1.7 N/A N/A [69]
Figure 3.11: Frequency response function for 1 G base excitation
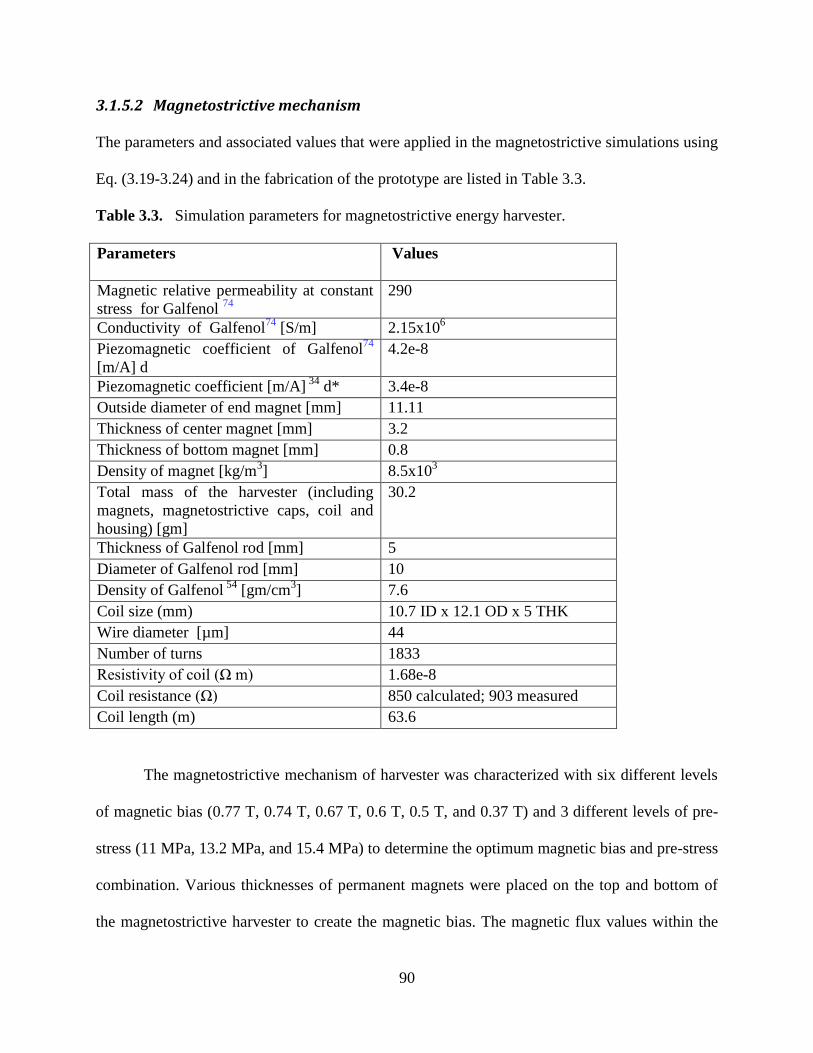
90
3.1.5.2 Magnetostrictive mechanism
The parameters and associated values that were applied in the magnetostrictive simulations using
Eq. (3.19-3.24) and in the fabrication of the prototype are listed in Table 3.3.
Table 3.3. Simulation parameters for magnetostrictive energy harvester.
Parameters Values
Magnetic relative permeability at constant
stress for Galfenol 74
290
Conductivity of Galfenol74
[S/m] 2.15x10⁶
Piezomagnetic coefficient of Galfenol74
[m/A] d
4.2e-8
Piezomagnetic coefficient [m/A] 34
d* 3.4e-8
Outside diameter of end magnet [mm] 11.11
Thickness of center magnet [mm] 3.2
Thickness of bottom magnet [mm] 0.8
Density of magnet [kg/m3] 8.5x10
3
Total mass of the harvester (including
magnets, magnetostrictive caps, coil and
housing) [gm]
30.2
Thickness of Galfenol rod [mm] 5
Diameter of Galfenol rod [mm] 10
Density of Galfenol 54
[gm/cm3] 7.6
Coil size (mm) 10.7 ID x 12.1 OD x 5 THK
Wire diameter [µm] 44
Number of turns 1833
Resistivity of coil (Ω m) 1.68e-8
Coil resistance (Ω) 850 calculated; 903 measured
Coil length (m) 63.6
The magnetostrictive mechanism of harvester was characterized with six different levels
of magnetic bias (0.77 T, 0.74 T, 0.67 T, 0.6 T, 0.5 T, and 0.37 T) and 3 different levels of pre-
stress (11 MPa, 13.2 MPa, and 15.4 MPa) to determine the optimum magnetic bias and pre-stress
combination. Various thicknesses of permanent magnets were placed on the top and bottom of
the magnetostrictive harvester to create the magnetic bias. The magnetic flux values within the
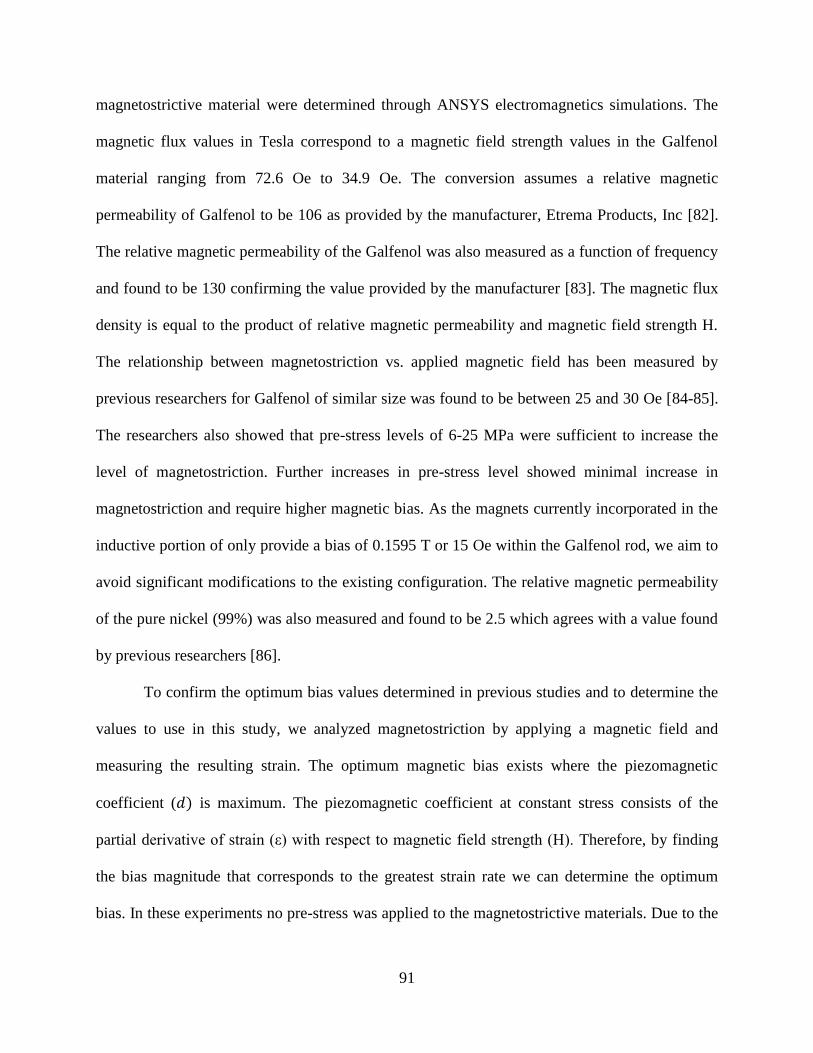
91
magnetostrictive material were determined through ANSYS electromagnetics simulations. The
magnetic flux values in Tesla correspond to a magnetic field strength values in the Galfenol
material ranging from 72.6 Oe to 34.9 Oe. The conversion assumes a relative magnetic
permeability of Galfenol to be 106 as provided by the manufacturer, Etrema Products, Inc [82].
The relative magnetic permeability of the Galfenol was also measured as a function of frequency
and found to be 130 confirming the value provided by the manufacturer [83]. The magnetic flux
density is equal to the product of relative magnetic permeability and magnetic field strength H.
The relationship between magnetostriction vs. applied magnetic field has been measured by
previous researchers for Galfenol of similar size was found to be between 25 and 30 Oe [84-85].
The researchers also showed that pre-stress levels of 6-25 MPa were sufficient to increase the
level of magnetostriction. Further increases in pre-stress level showed minimal increase in
magnetostriction and require higher magnetic bias. As the magnets currently incorporated in the
inductive portion of only provide a bias of 0.1595 T or 15 Oe within the Galfenol rod, we aim to
avoid significant modifications to the existing configuration. The relative magnetic permeability
of the pure nickel (99%) was also measured and found to be 2.5 which agrees with a value found
by previous researchers [86].
To confirm the optimum bias values determined in previous studies and to determine the
values to use in this study, we analyzed magnetostriction by applying a magnetic field and
measuring the resulting strain. The optimum magnetic bias exists where the piezomagnetic
coefficient ( ) is maximum. The piezomagnetic coefficient at constant stress consists of the
partial derivative of strain (ε) with respect to magnetic field strength (H). Therefore, by finding
the bias magnitude that corresponds to the greatest strain rate we can determine the optimum
bias. In these experiments no pre-stress was applied to the magnetostrictive materials. Due to the
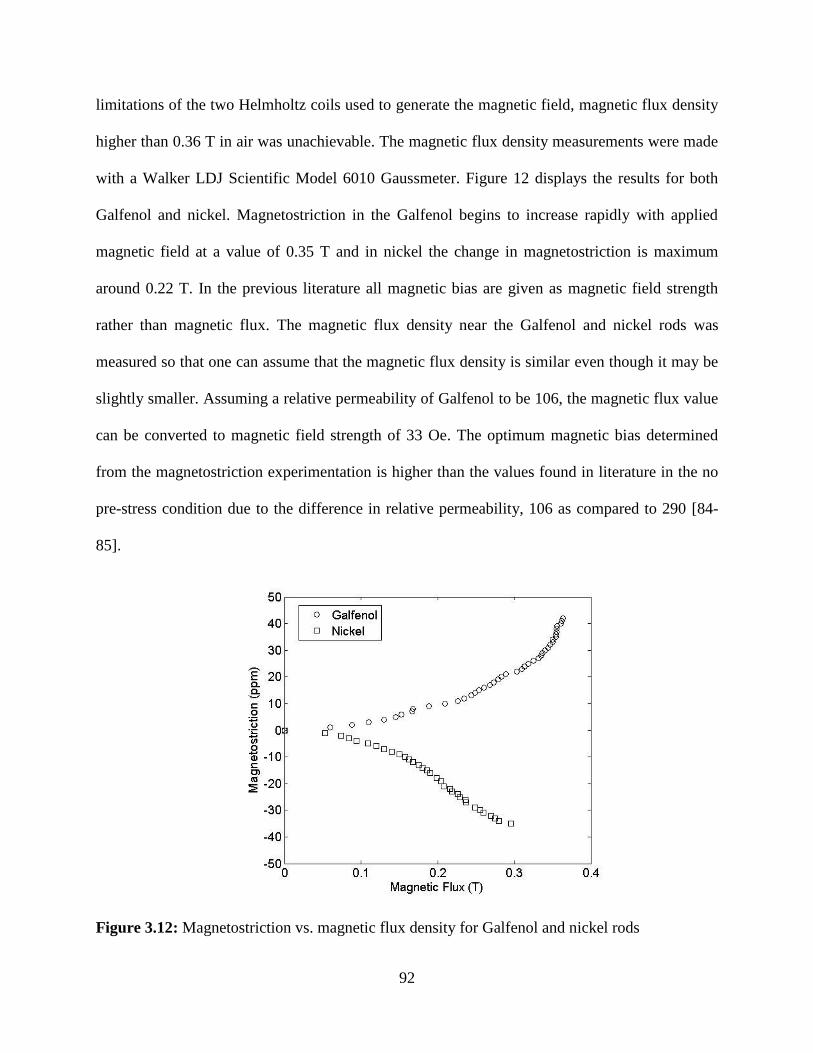
92
limitations of the two Helmholtz coils used to generate the magnetic field, magnetic flux density
higher than 0.36 T in air was unachievable. The magnetic flux density measurements were made
with a Walker LDJ Scientific Model 6010 Gaussmeter. Figure 12 displays the results for both
Galfenol and nickel. Magnetostriction in the Galfenol begins to increase rapidly with applied
magnetic field at a value of 0.35 T and in nickel the change in magnetostriction is maximum
around 0.22 T. In the previous literature all magnetic bias are given as magnetic field strength
rather than magnetic flux. The magnetic flux density near the Galfenol and nickel rods was
measured so that one can assume that the magnetic flux density is similar even though it may be
slightly smaller. Assuming a relative permeability of Galfenol to be 106, the magnetic flux value
can be converted to magnetic field strength of 33 Oe. The optimum magnetic bias determined
from the magnetostriction experimentation is higher than the values found in literature in the no
pre-stress condition due to the difference in relative permeability, 106 as compared to 290 [84-
85].
Figure 3.12: Magnetostriction vs. magnetic flux density for Galfenol and nickel rods
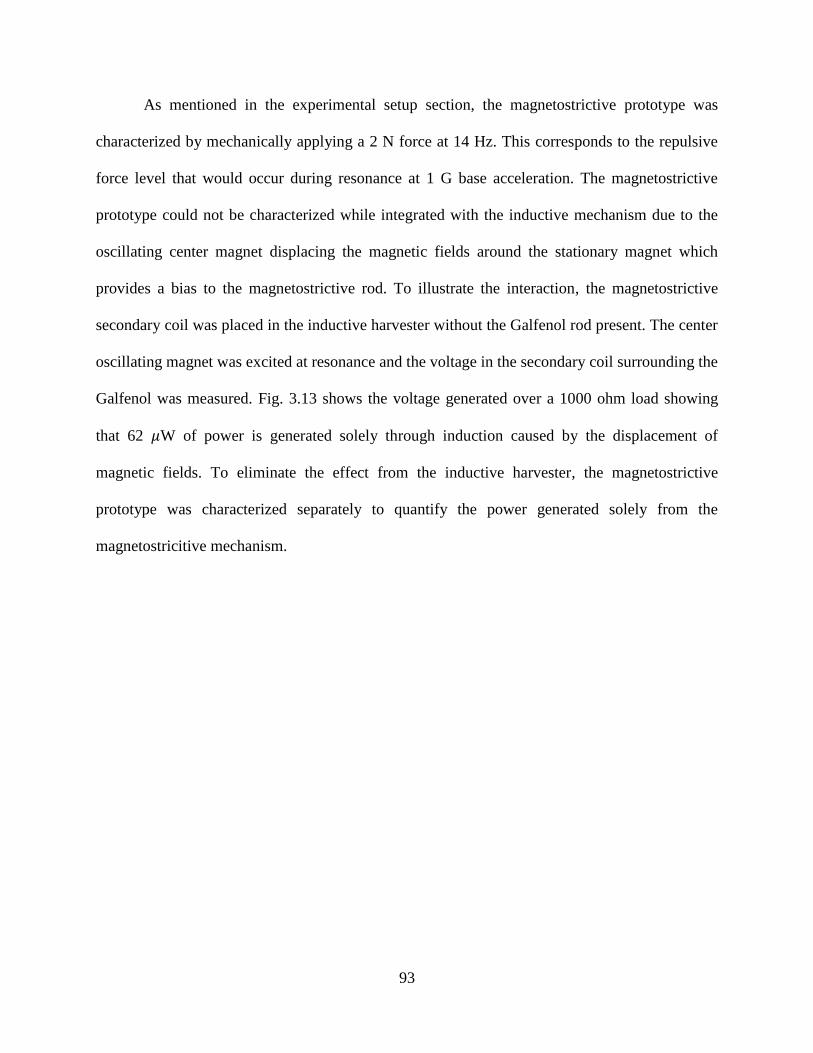
93
As mentioned in the experimental setup section, the magnetostrictive prototype was
characterized by mechanically applying a 2 N force at 14 Hz. This corresponds to the repulsive
force level that would occur during resonance at 1 G base acceleration. The magnetostrictive
prototype could not be characterized while integrated with the inductive mechanism due to the
oscillating center magnet displacing the magnetic fields around the stationary magnet which
provides a bias to the magnetostrictive rod. To illustrate the interaction, the magnetostrictive
secondary coil was placed in the inductive harvester without the Galfenol rod present. The center
oscillating magnet was excited at resonance and the voltage in the secondary coil surrounding the
Galfenol was measured. Fig. 3.13 shows the voltage generated over a 1000 ohm load showing
that 62 W of power is generated solely through induction caused by the displacement of
magnetic fields. To eliminate the effect from the inductive harvester, the magnetostrictive
prototype was characterized separately to quantify the power generated solely from the
magnetostricitive mechanism.
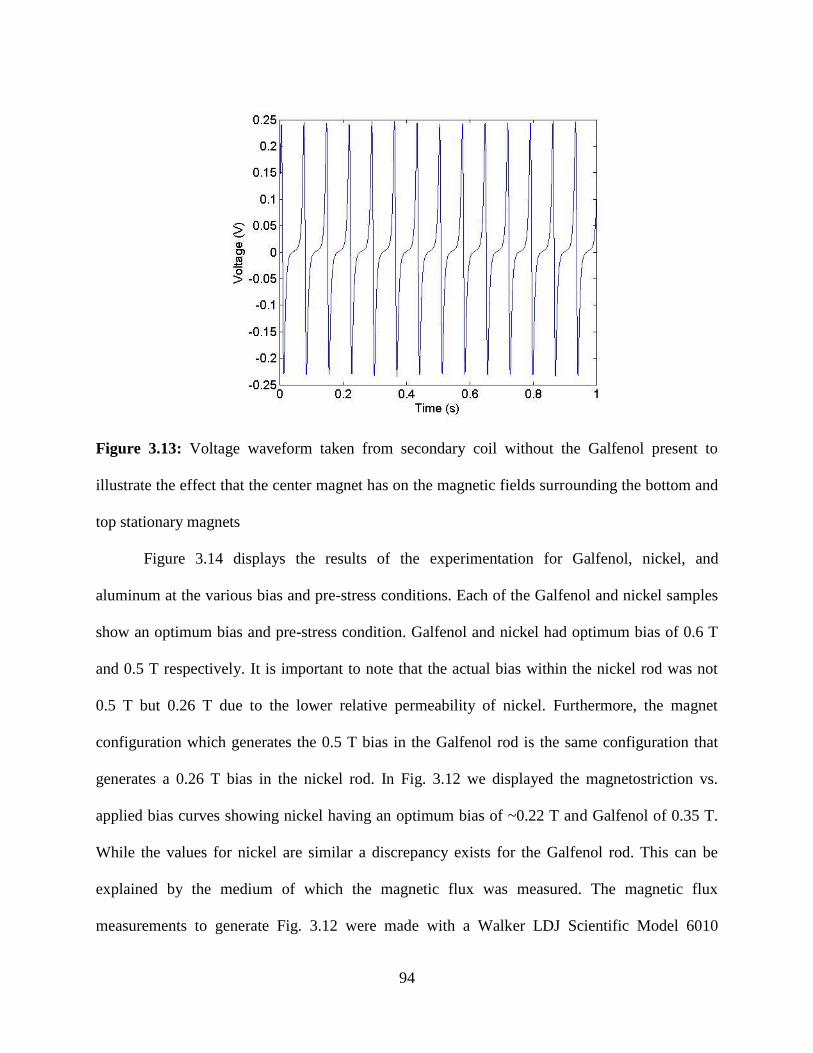
94
Figure 3.13: Voltage waveform taken from secondary coil without the Galfenol present to
illustrate the effect that the center magnet has on the magnetic fields surrounding the bottom and
top stationary magnets
Figure 3.14 displays the results of the experimentation for Galfenol, nickel, and
aluminum at the various bias and pre-stress conditions. Each of the Galfenol and nickel samples
show an optimum bias and pre-stress condition. Galfenol and nickel had optimum bias of 0.6 T
and 0.5 T respectively. It is important to note that the actual bias within the nickel rod was not
0.5 T but 0.26 T due to the lower relative permeability of nickel. Furthermore, the magnet
configuration which generates the 0.5 T bias in the Galfenol rod is the same configuration that
generates a 0.26 T bias in the nickel rod. In Fig. 3.12 we displayed the magnetostriction vs.
applied bias curves showing nickel having an optimum bias of ~0.22 T and Galfenol of 0.35 T.
While the values for nickel are similar a discrepancy exists for the Galfenol rod. This can be
explained by the medium of which the magnetic flux was measured. The magnetic flux
measurements to generate Fig. 3.12 were made with a Walker LDJ Scientific Model 6010

95
Gaussmeter. The probe was placed near the Galfenol but the measurements were made in air. If
the Galfenol is substituted with air in the simulations the values of magnetic flux at the same
location would be 0.3083 T as compared to 0.6 T which is similar to the value measured with the
gaussmeter. Figure 3.14 also displays that an optimum pre-stress of 13.2 MPa for both nickel and
Galfenol existed for maximum power generation which agrees with previous studies [75-76].
The effect of the compression of the clamp on power generation was also investigated. To study
the effect, the Galfenol sample was replaced with aluminum which is a non-ferromagnetic
material. It can be seen that roughly 12 % of the power generated was generated due to the
distance change between the two sets of magnets biasing the Galfenol. As the distance changes
between the two magnetic poles, the magnitude of magnetic flux density within the coil changes.
Figure 3.14 shows that at the optimum conditions the power output of the Galfenol and
nickel rods are similar although it was shown in a previous study and in Fig. 3.12 that the
magnetostriction of Galfenol is much higher than in nickel [87]. The result can be explained by
the level of stress applied to the magnetostrictive materials. The level of stress from the 2 N force
is 25 KPa which leads to small strain. This indicates that the materials are not being strained to
the point where the higher magnetostriction in the Galfenol can be utilized.
96
Figure 3.14: Performance of Galfenol and nickel under various pre-stress and bias conditions
To predict the output power, numerical simulations were performed based on the Eqs.
(3.19-3.24) presented in the magnetostrictive modeling section and parameters listed in Table
3.3. The simulations were compared with the experimentally measured power output of the
magnetostrictive part and the variations of parameters were studied in matching the experimental
data. The relative permeability of the magnetostrictive material was measured separately as a
function of various bias stress and found to be 110 and 90 at 1 ksi (6.9 MPa) and 7 ksi (48.3
MPa) compressive stress respectively. Based on this data and linear interpolation, the value of
the permeability of Galfenol at 15 MPa was estimated and found to be 106. This value was used
in the numerical simulations which provide the estimate of system parameters about the bias
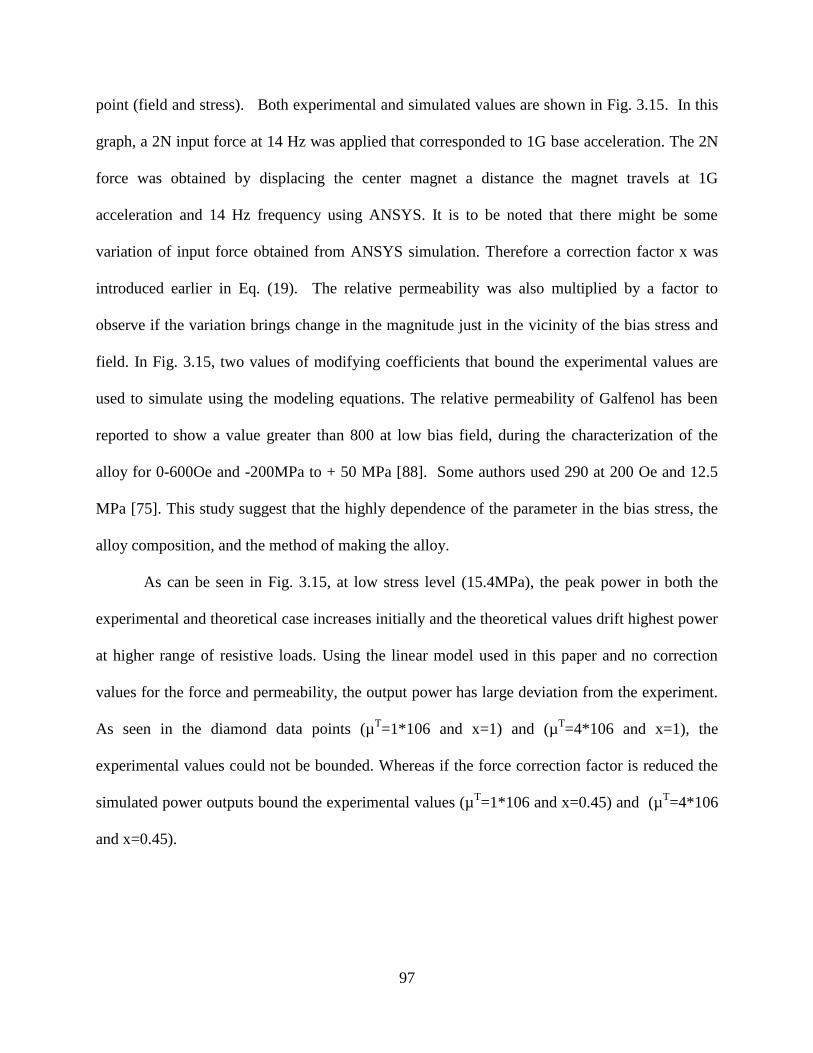
97
point (field and stress). Both experimental and simulated values are shown in Fig. 3.15. In this
graph, a 2N input force at 14 Hz was applied that corresponded to 1G base acceleration. The 2N
force was obtained by displacing the center magnet a distance the magnet travels at 1G
acceleration and 14 Hz frequency using ANSYS. It is to be noted that there might be some
variation of input force obtained from ANSYS simulation. Therefore a correction factor x was
introduced earlier in Eq. (19). The relative permeability was also multiplied by a factor to
observe if the variation brings change in the magnitude just in the vicinity of the bias stress and
field. In Fig. 3.15, two values of modifying coefficients that bound the experimental values are
used to simulate using the modeling equations. The relative permeability of Galfenol has been
reported to show a value greater than 800 at low bias field, during the characterization of the
alloy for 0-600Oe and -200MPa to + 50 MPa [88]. Some authors used 290 at 200 Oe and 12.5
MPa [75]. This study suggest that the highly dependence of the parameter in the bias stress, the
alloy composition, and the method of making the alloy.
As can be seen in Fig. 3.15, at low stress level (15.4MPa), the peak power in both the
experimental and theoretical case increases initially and the theoretical values drift highest power
at higher range of resistive loads. Using the linear model used in this paper and no correction
values for the force and permeability, the output power has large deviation from the experiment.
As seen in the diamond data points (µT=1*106 and x=1) and (µ
T=4*106 and x=1), the
experimental values could not be bounded. Whereas if the force correction factor is reduced the
simulated power outputs bound the experimental values (µT=1*106 and x=0.45) and (µ
T=4*106
and x=0.45).
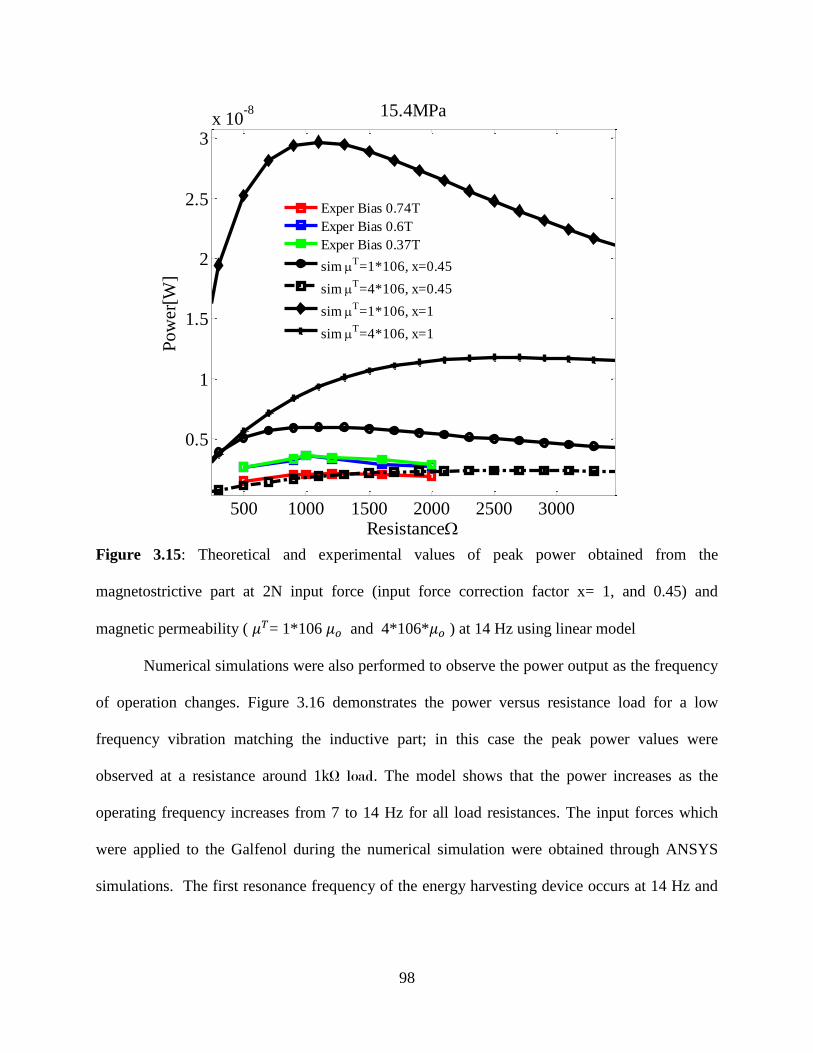
98
Figure 3.15: Theoretical and experimental values of peak power obtained from the
magnetostrictive part at 2N input force (input force correction factor x= 1, and 0.45) and
magnetic permeability ( = 1*106 and 4*106* ) at 14 Hz using linear model
Numerical simulations were also performed to observe the power output as the frequency
of operation changes. Figure 3.16 demonstrates the power versus resistance load for a low
frequency vibration matching the inductive part; in this case the peak power values were
observed at a resistance around 1kΩ load. The model shows that the power increases as the
operating frequency increases from 7 to 14 Hz for all load resistances. The input forces which
were applied to the Galfenol during the numerical simulation were obtained through ANSYS
simulations. The first resonance frequency of the energy harvesting device occurs at 14 Hz and
500 1000 1500 2000 2500 3000
0.5
1
1.5
2
2.5
3x 10
-8 15.4MPa
Resistance
Pow
er[W
]
Exper Bias 0.74T
Exper Bias 0.6T
Exper Bias 0.37T
sim T=1*106, x=0.45
sim T=4*106, x=0.45
sim T=1*106, x=1
sim T=4*106, x=1
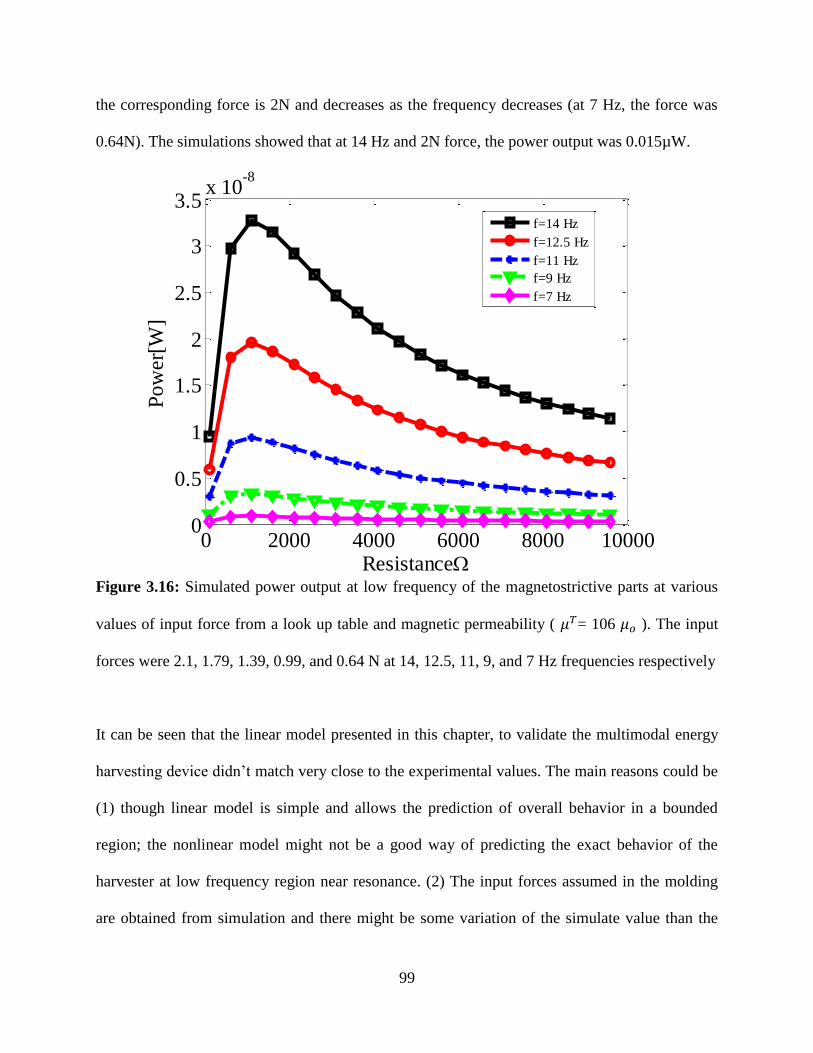
99
the corresponding force is 2N and decreases as the frequency decreases (at 7 Hz, the force was
0.64N). The simulations showed that at 14 Hz and 2N force, the power output was 0.015µW.
Figure 3.16: Simulated power output at low frequency of the magnetostrictive parts at various
values of input force from a look up table and magnetic permeability ( = 106 ). The input
forces were 2.1, 1.79, 1.39, 0.99, and 0.64 N at 14, 12.5, 11, 9, and 7 Hz frequencies respectively
It can be seen that the linear model presented in this chapter, to validate the multimodal energy
harvesting device didn’t match very close to the experimental values. The main reasons could be
(1) though linear model is simple and allows the prediction of overall behavior in a bounded
region; the nonlinear model might not be a good way of predicting the exact behavior of the
harvester at low frequency region near resonance. (2) The input forces assumed in the molding
are obtained from simulation and there might be some variation of the simulate value than the
0 2000 4000 6000 8000 100000
0.5
1
1.5
2
2.5
3
3.5x 10
-8
Resistance
Po
wer
[W]
f=14 Hz
f=12.5 Hz
f=11 Hz
f=9 Hz
f=7 Hz
100
one practically seen while the center magnet applied. (3) The equations were derived for a direct
input oscillating stress about the bias pre-stress and in our case the force applied to the Galfenol
was assumed to be the force that is applied by the center magnet during base excitation (4) the
uncertainty of the system parameters described in the table. A more rigorous modeling is
required to predict the system behavior of the magnetostrictive parts in such a hybrid system.
At low frequency of operation (14 Hz) and optimum bias 0.6T and 13.2 MPa stress, the
experimental power output of magnetostrictive part is 0.0055 . The low power output can be
attributed to the level of input energy for this particular application (25 KPa @ 14 Hz). Many of
the previous research in magnetostrictive energy harvesting have characterized the prototypes at
extremely high input energy and frequency (10-15 MPa @ 100-1000 Hz). To investigate the
capability at higher stress levels we provide additional experimental results. Figure 3.17 displays
the results of the magnetostrictive portion of the energy harvester at higher energy input. Higher
frequencies were not possible due to the limitations of the vibration equipment. Simply
increasing the applied stress magnitude by two orders of magnitude showed gains in power of 4
orders of magnitude generating 35 at 1.6 MPa of applied stress. Additional increases in
applied stress and frequency to the levels shown in literature should show reasonable agreement
to the power levels generated on the order of 100 mW to 1 W.
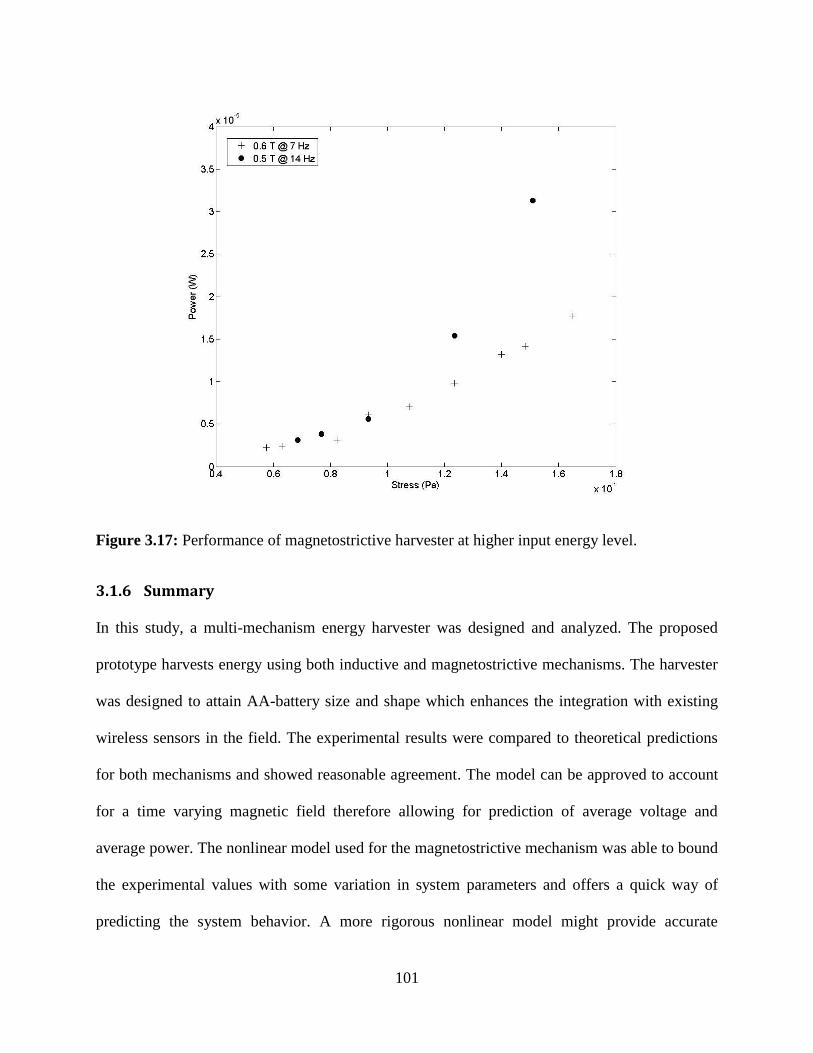
101
Figure 3.17: Performance of magnetostrictive harvester at higher input energy level.
3.1.6 Summary
In this study, a multi-mechanism energy harvester was designed and analyzed. The proposed
prototype harvests energy using both inductive and magnetostrictive mechanisms. The harvester
was designed to attain AA-battery size and shape which enhances the integration with existing
wireless sensors in the field. The experimental results were compared to theoretical predictions
for both mechanisms and showed reasonable agreement. The model can be approved to account
for a time varying magnetic field therefore allowing for prediction of average voltage and
average power. The nonlinear model used for the magnetostrictive mechanism was able to bound
the experimental values with some variation in system parameters and offers a quick way of
predicting the system behavior. A more rigorous nonlinear model might provide accurate

102
solution in matching experimental results. The inductive mechanism generated 5.3 mW, 2.57
mW, 0.27 mW at 0.9 G, 0.7 G and 0.4 G respectively. The maximum power harvested using the
magnetostrictive mechanism was ~0.0055 µW at the stress level pertaining to the repulsive force
in the inductive mechanism. For applications with higher input energy, power generated in the
magnetostriction mechanism should be comparable to the previous prototypes in literature. In
future work other magnetostrictive configurations aside from the cylindrical configuration could
be investigated that strain at the low stress and frequency levels. In the future work section (8.2)
we propose an alternative configuration utilizing a cantilever beam and discuss its capabilities.

103
3.2 Multi-mechanism non-linear vibration harvester combining inductive and piezoelectric mechanisms
In order to enhance the power density of existing energy harvesters, a variety of
multimodal energy harvesting techniques have been proposed. Multimodal energy harvesters can
be categorized as: (i) Multi-Source Energy Harvester (MSEH), (ii) Multi-Mechanism Energy
Harvester (MMEH), and (iii) Single Source Multi-Mode Energy Harvester (S2M
2EH). In this
study, the focus was on developing MMEH which combines the inductive and piezoelectric
mechanisms. The multi-mechanism harvester was modeled using FEM techniques and
theoretically analyzed to optimize the performance and reduce the overall shape and size similar
to that of AA battery. The theoretical model combining analytical and FEM modeling techniques
provides the system dynamics and output power for specific generator and cymbal geometry at
various source conditions. In the proposed design, a cylindrical tube contains a magnetic
levitation cavity where a center magnet oscillates through a copper coil. Piezoelectric cymbal
transducers were mounted on the top and bottom sections of the cylindrical shell. In response to
the external vibrations, electrical energy was harvested from the relative motion between magnet
and coil through Faraday’s effect and from the piezoelectric material through the direct
piezoelectric effect. Experimental results validate the predictions from theoretical model and
show the promise of multimodal harvester for powering wireless sensor nodes in automobile,
aircraft, and rail applications.
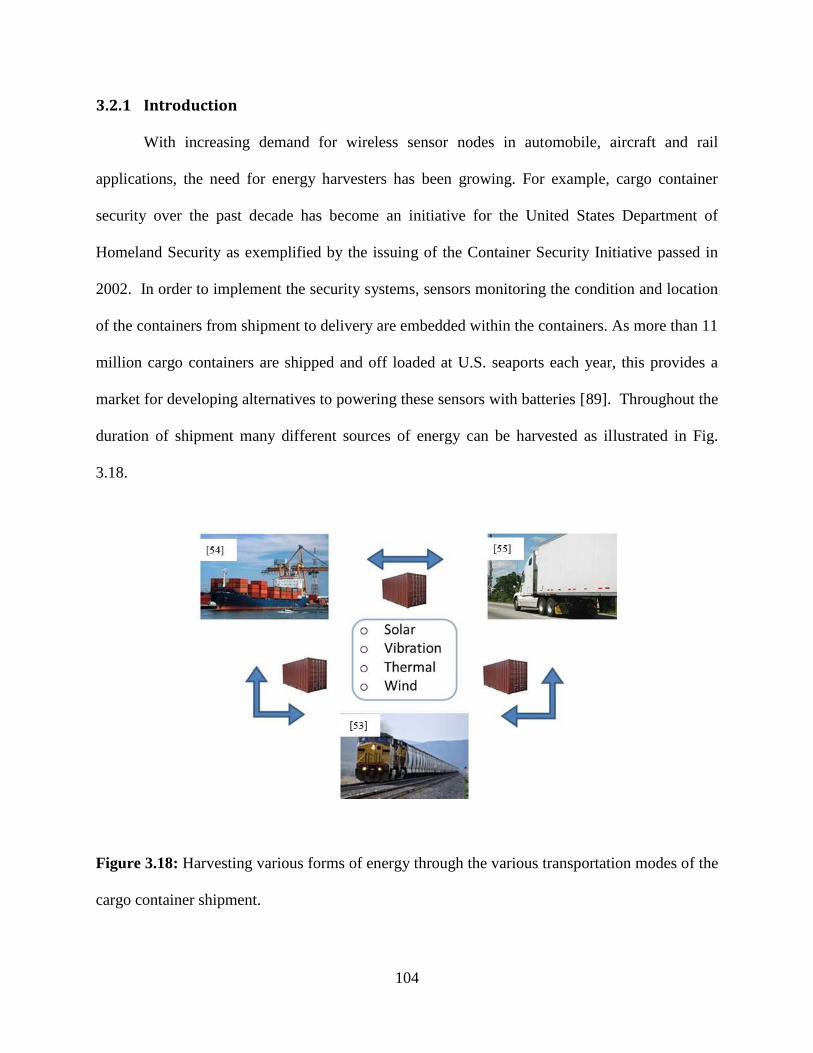
104
3.2.1 Introduction
With increasing demand for wireless sensor nodes in automobile, aircraft and rail
applications, the need for energy harvesters has been growing. For example, cargo container
security over the past decade has become an initiative for the United States Department of
Homeland Security as exemplified by the issuing of the Container Security Initiative passed in
2002. In order to implement the security systems, sensors monitoring the condition and location
of the containers from shipment to delivery are embedded within the containers. As more than 11
million cargo containers are shipped and off loaded at U.S. seaports each year, this provides a
market for developing alternatives to powering these sensors with batteries [89]. Throughout the
duration of shipment many different sources of energy can be harvested as illustrated in Fig.
3.18.
Figure 3.18: Harvesting various forms of energy through the various transportation modes of the
cargo container shipment.

105
In order to integrate the harvester into existing sensors we design for high power density. To this
end, we investigate various multi-functional energy harvesters to power the sensors.
Multifunctional energy harvesters can be categorized as: (i) Multi-Source Energy Harvester
(MSEH), (ii) Single Source Multi-Mode Energy Harvester (S2M
2EH), and (iii) Multi-Mechanism
Energy Harvester (MMEH). MSEH could consist of harvesting solar, wind and vibration
simultaneously during the container shipment. An example of S2M
2EH could be harvesting
energy through various modes of vibration: such as simultaneously harvesting energy from
harmonics of first bending mode or bending and torsional modes. MMEH could consist of
harvesting vibration through various mechanisms such as piezoelectric and inductive
mechanisms simultaneously. Of the different multi-functional harvesting techniques presented,
we choose to fabricate and characterize a MMEH combining piezoelectric and inductive
mechanisms due to the possibility of fabricating a high power density harvester having similar
size as an AA battery.
During the travel lifecycle, the cargo container shipped via ship, rail or truck experiences various
magnitudes and frequency of vibration as summarized in Table 3.4.
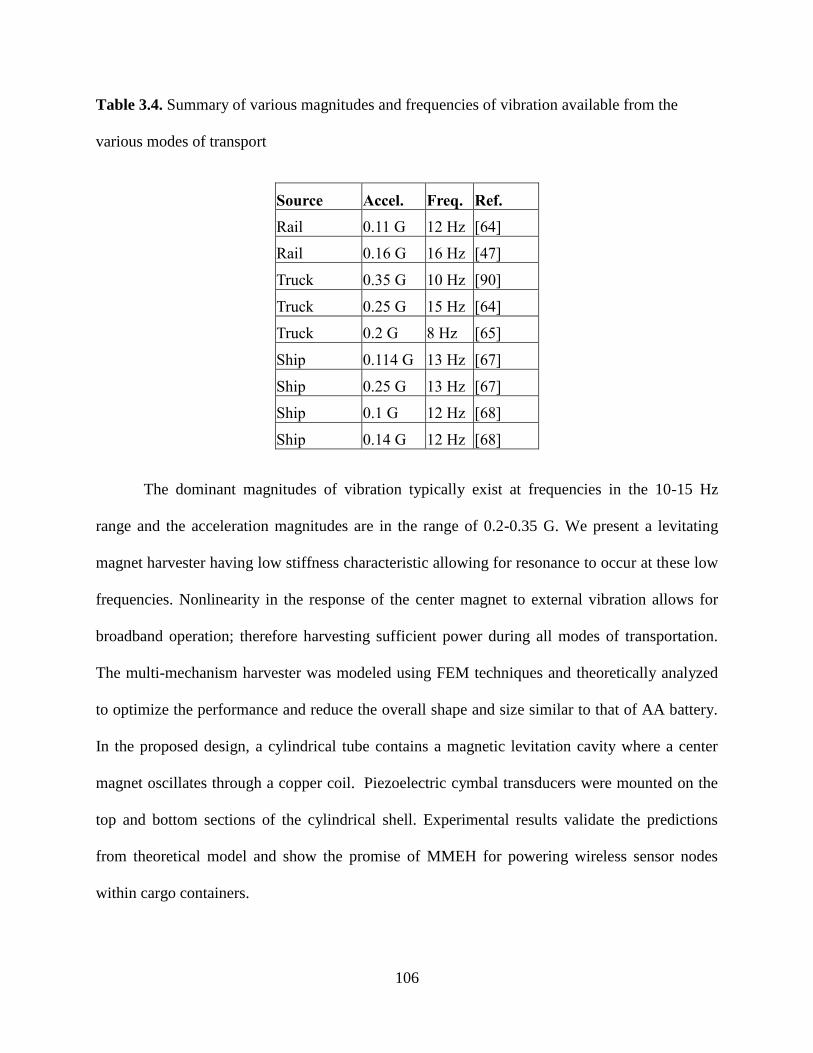
106
Table 3.4. Summary of various magnitudes and frequencies of vibration available from the
various modes of transport
Source Accel. Freq. Ref.
Rail 0.11 G 12 Hz [64]
Rail 0.16 G 16 Hz [47]
Truck 0.35 G 10 Hz [90]
Truck 0.25 G 15 Hz [64]
Truck 0.2 G 8 Hz [65]
Ship 0.114 G 13 Hz [67]
Ship 0.25 G 13 Hz [67]
Ship 0.1 G 12 Hz [68]
Ship 0.14 G 12 Hz [68]
The dominant magnitudes of vibration typically exist at frequencies in the 10-15 Hz
range and the acceleration magnitudes are in the range of 0.2-0.35 G. We present a levitating
magnet harvester having low stiffness characteristic allowing for resonance to occur at these low
frequencies. Nonlinearity in the response of the center magnet to external vibration allows for
broadband operation; therefore harvesting sufficient power during all modes of transportation.
The multi-mechanism harvester was modeled using FEM techniques and theoretically analyzed
to optimize the performance and reduce the overall shape and size similar to that of AA battery.
In the proposed design, a cylindrical tube contains a magnetic levitation cavity where a center
magnet oscillates through a copper coil. Piezoelectric cymbal transducers were mounted on the
top and bottom sections of the cylindrical shell. Experimental results validate the predictions
from theoretical model and show the promise of MMEH for powering wireless sensor nodes
within cargo containers.

107
3.2.2 Multi-mechanism energy harvester (MMEH) design
The MMEH generates electrical energy from vibrations through two mechanisms:
inductive and piezoelectric. The energy harvester was designed to have the same form factor as
that of AA battery for easy integration with existing sensor nodes. As shown in Fig. 3.19, the
energy harvester is shorter than the AA battery which allows space for the addition of the
conditioning circuitry and energy storage. The inductive mechanism consists of a levitating
magnet suspended between two magnets located on the top and bottom of the harvester which
are not visible in Fig. 3.19. The oscillating or levitating magnet is shown and consists of two
magnets attached with opposite polarity separated by a soft magnetic disc (steel). The
configuration has been shown by previous researchers to create a magnetic field that is 2X the
strength of a single oscillating magnet of the same size [70]. The wire size used for the coil was
46 AWG in order to create sufficient voltage to avoid losses in rectification of voltage signal.
The coil fill factor was 0.67 and the coil resistance was 1034 ohms. During vibration the center
oscillating magnet exerts an equal and opposite force on the top and bottom magnets. We
propose to harvest this force with a piezoelectric cymbal transducer. Two cymbal transducers
were evaluated which are also shown in Fig. 3.19. Brass and steel were evaluated as the cap
material. The cap thickness was 0.25 mm and cavity height 0.3 mm. The piezoelectric material
thickness was 1 mm for both caps. The piezoelectric material diameter was 15 mm for the steel
cymbal and 12.7 mm for the brass cymbal.
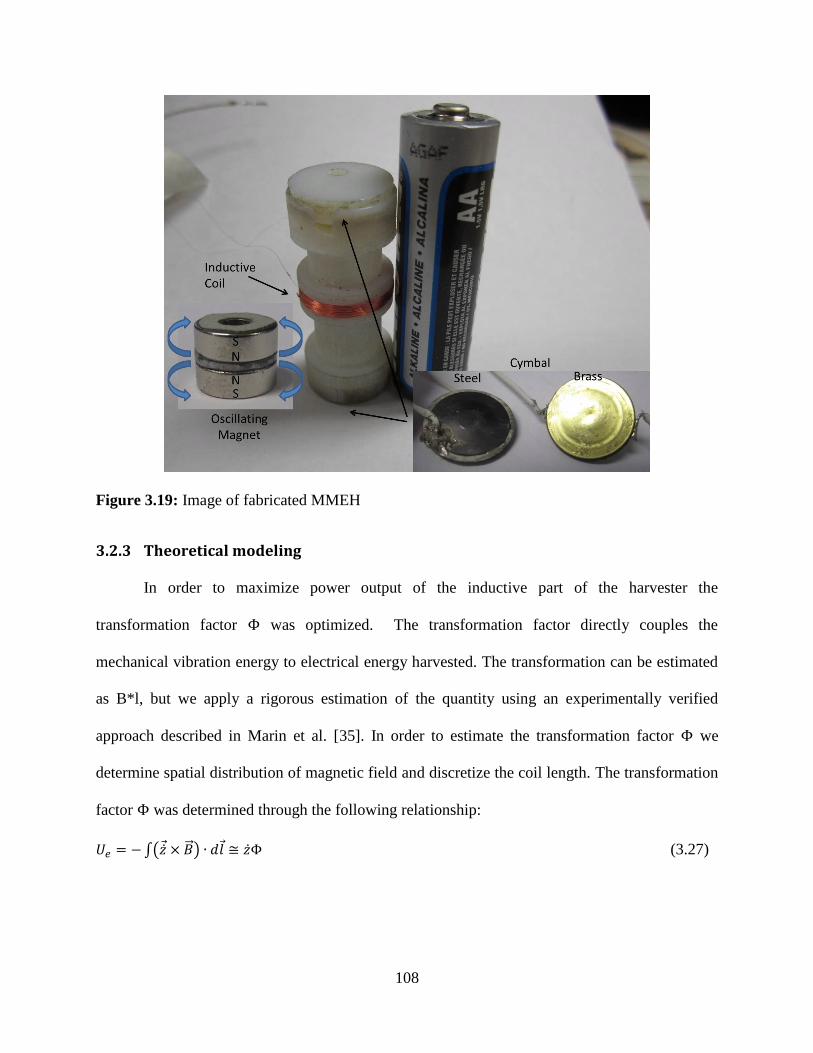
108
Figure 3.19: Image of fabricated MMEH
3.2.3 Theoretical modeling
In order to maximize power output of the inductive part of the harvester the
transformation factor was optimized. The transformation factor directly couples the
mechanical vibration energy to electrical energy harvested. The transformation can be estimated
as B*l, but we apply a rigorous estimation of the quantity using an experimentally verified
approach described in Marin et al. [35]. In order to estimate the transformation factor we
determine spatial distribution of magnetic field and discretize the coil length. The transformation
factor was determined through the following relationship:
∫( ) (3.27)
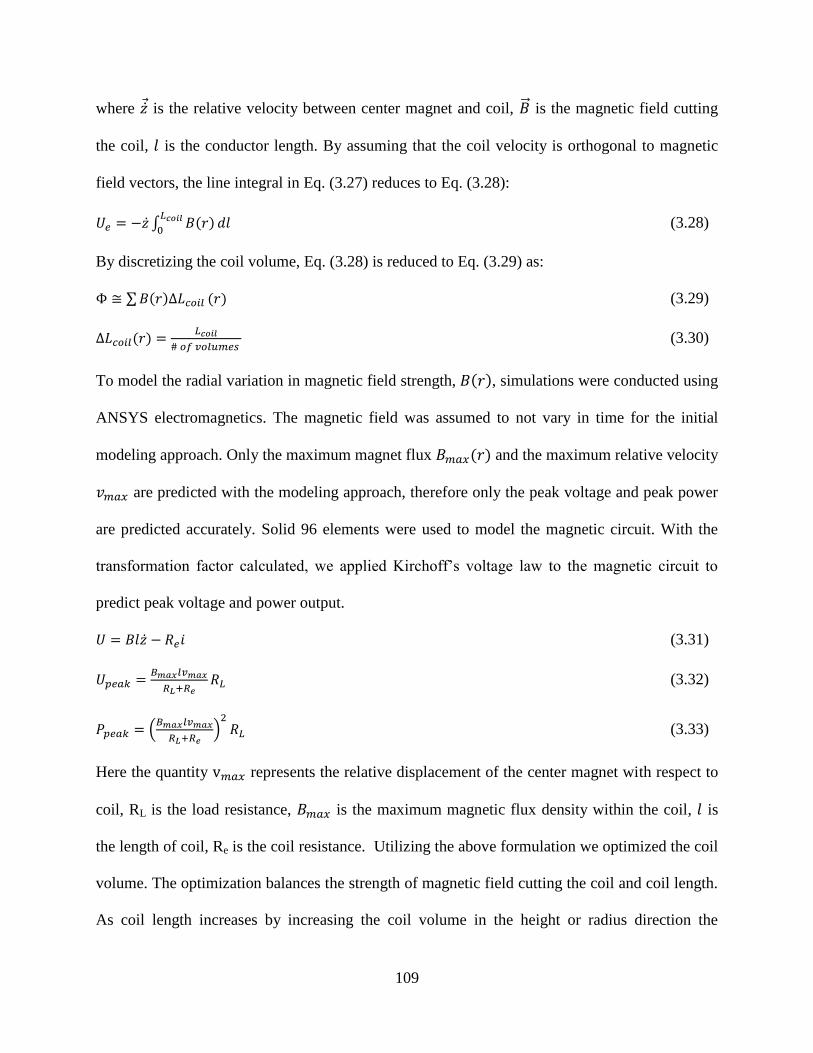
109
where is the relative velocity between center magnet and coil, is the magnetic field cutting
the coil, is the conductor length. By assuming that the coil velocity is orthogonal to magnetic
field vectors, the line integral in Eq. (3.27) reduces to Eq. (3.28):
∫ ( )
(3.28)
By discretizing the coil volume, Eq. (3.28) is reduced to Eq. (3.29) as:
∑ ( ) ( ) (3.29)
( )
(3.30)
To model the radial variation in magnetic field strength, ( ), simulations were conducted using
ANSYS electromagnetics. The magnetic field was assumed to not vary in time for the initial
modeling approach. Only the maximum magnet flux ( ) and the maximum relative velocity
are predicted with the modeling approach, therefore only the peak voltage and peak power
are predicted accurately. Solid 96 elements were used to model the magnetic circuit. With the
transformation factor calculated, we applied Kirchoff’s voltage law to the magnetic circuit to
predict peak voltage and power output.
(3.31)
(3.32)
(
) (3.33)
Here the quantity represents the relative displacement of the center magnet with respect to
coil, RL is the load resistance, is the maximum magnetic flux density within the coil, is
the length of coil, Re is the coil resistance. Utilizing the above formulation we optimized the coil
volume. The optimization balances the strength of magnetic field cutting the coil and coil length.
As coil length increases by increasing the coil volume in the height or radius direction the
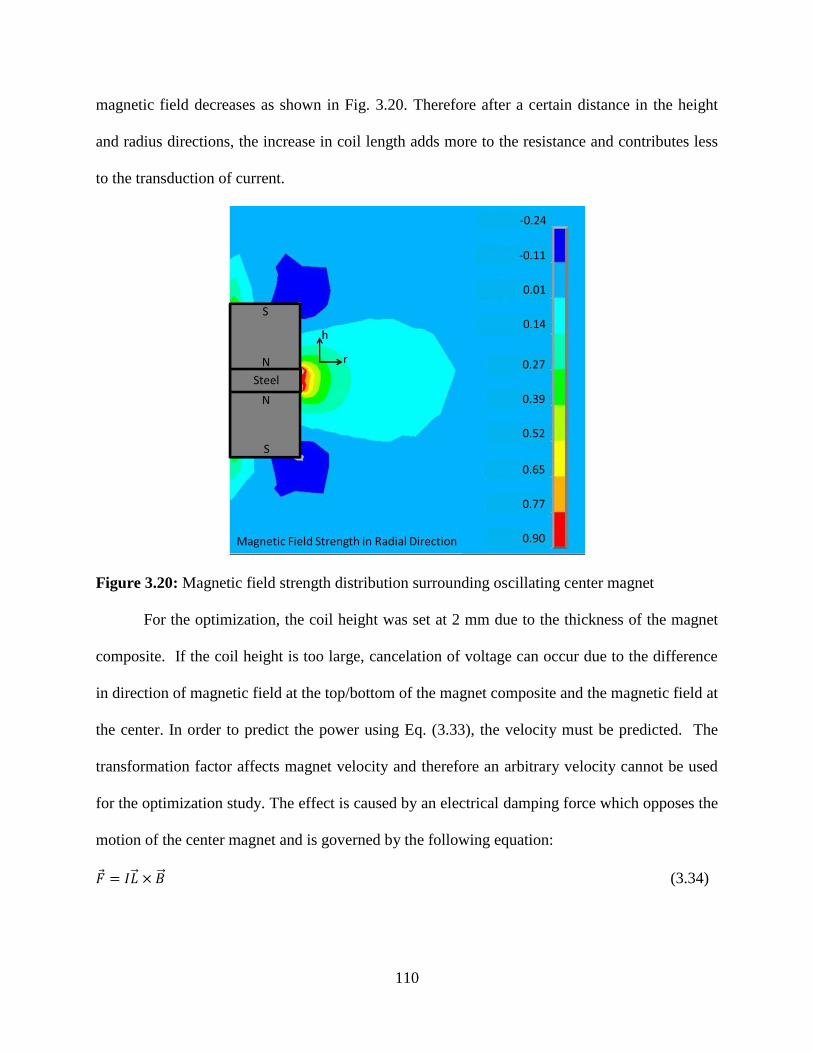
110
magnetic field decreases as shown in Fig. 3.20. Therefore after a certain distance in the height
and radius directions, the increase in coil length adds more to the resistance and contributes less
to the transduction of current.
Figure 3.20: Magnetic field strength distribution surrounding oscillating center magnet
For the optimization, the coil height was set at 2 mm due to the thickness of the magnet
composite. If the coil height is too large, cancelation of voltage can occur due to the difference
in direction of magnetic field at the top/bottom of the magnet composite and the magnetic field at
the center. In order to predict the power using Eq. (3.33), the velocity must be predicted. The
transformation factor affects magnet velocity and therefore an arbitrary velocity cannot be used
for the optimization study. The effect is caused by an electrical damping force which opposes the
motion of the center magnet and is governed by the following equation:
(3.34)

111
From Eq. (3.34), we can see that this force is dependent on the magnitude of current flow due
to the coil length and magnetic flux density remaining constant. The current is dependent
upon the velocity as the coil resistance , load resistance , maximum magnetic flux density
, and coil length are constant. Therefore the electrical damping constant can be derived
as:
( )
( )
( ) (3.35)
In order to predict the velocity we numerically solve the governing equation of motion for the
harvester given as:
( ) ( ) ( ) ( ) ( ) ( )
( ) (3.36)
where is the mass of the center magnet compostite, cm is the mechanical damping constant, ce
is the electrical damping constant, is the linear stiffness constant of the spring, and are
the nonlinear stiffness constants of the spring, ( ) is the relative acceleration between the
acceleration of the harvester ( ) and the vibrating magnet ( ), is the gravitational
acceleration constant. The mechanical damping constant, cm was assumed to have a value of
0.055 based upon a previous work on a similar harvester configuration [71]. The stiffness terms
were estimated by simulating the repulsive force as a function of center magnet displacement
using ANSYS Electromagnetics. The analysis was executed by using Solid 236 elements for
magnets, air, and soft magnetic material (steel). Fig. 3.21 (a-c) shows the radial variation of the
magnetic field strength, coil length, and RMS power as function of distance from center of tube.
The peak power was predicted and halved to approximate the average or RMS power. In section
3.1 RMS power was not experimentally recorded for the inductive mechanism, so this study
provides the ability to compare this approximation to experimental data. From the simulations, it
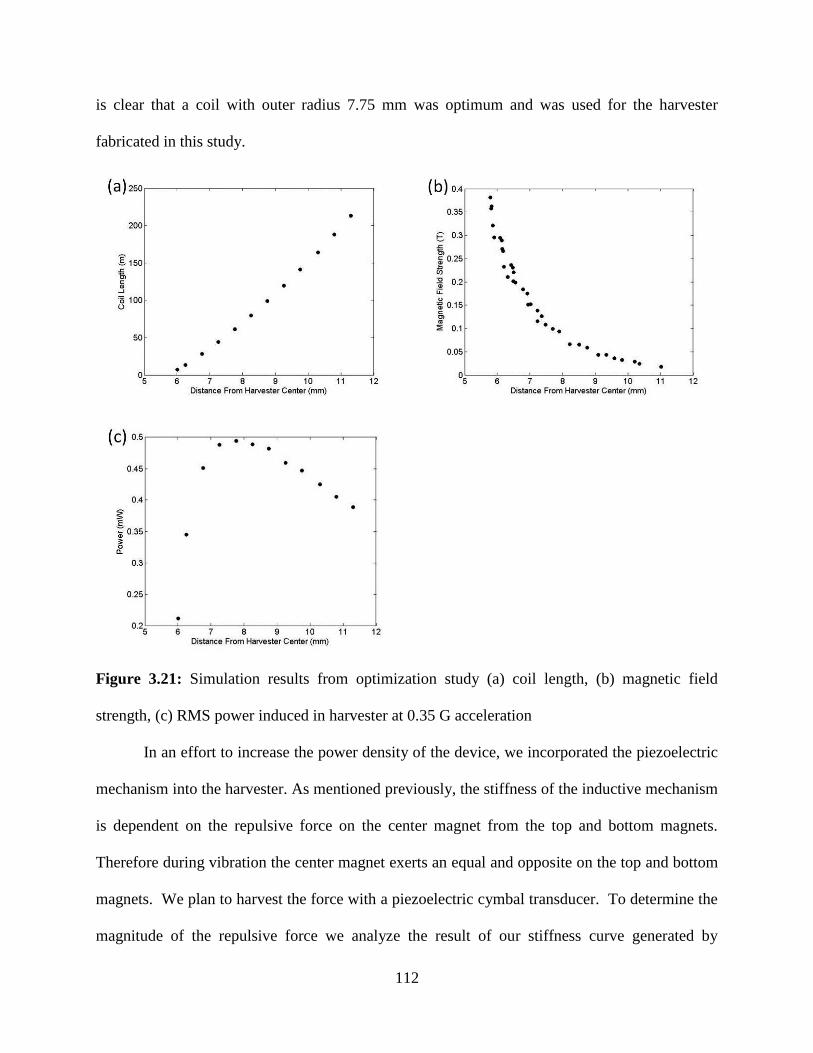
112
is clear that a coil with outer radius 7.75 mm was optimum and was used for the harvester
fabricated in this study.
Figure 3.21: Simulation results from optimization study (a) coil length, (b) magnetic field
strength, (c) RMS power induced in harvester at 0.35 G acceleration
In an effort to increase the power density of the device, we incorporated the piezoelectric
mechanism into the harvester. As mentioned previously, the stiffness of the inductive mechanism
is dependent on the repulsive force on the center magnet from the top and bottom magnets.
Therefore during vibration the center magnet exerts an equal and opposite on the top and bottom
magnets. We plan to harvest the force with a piezoelectric cymbal transducer. To determine the
magnitude of the repulsive force we analyze the result of our stiffness curve generated by
113
ANSYS electromagnetics in the previous section shown in Fig. 3.22. From analysis, the magnet
and piezoelectric cymbal transducer will experience a maximum force of 0.6 N.
Figure 3.22: Net force on center magnet as a function of center magnet displacement
To assist in design and investigate the capability of the cymbal we performed simulations in
ANSYS structural and multiphysics to predict the power output of the piezoelectric cymbal.
First, we determined the type of piezoelectric suitable for harvesting. In the off resonance
condition the center magnet experiences minimal displacement and therefore minimum force is
transferred to the piezoelectric cymbal transducer. Therefore the optimum operating condition
for the harvester will be in the 10-20 Hz frequency range which is typical resonant region for
magnetic levitation harvester. Soft piezoelectric material exhibits high performance coefficients
(such as d33 and k33) while hard piezoelectric material provides high mechanical quality factor
(Qm) or low hysteretic losses. The magnitude of Qm plays an important role at resonance. At
resonance, an approximation of the strain (x) of a longitudinally vibrating bar can be given as:
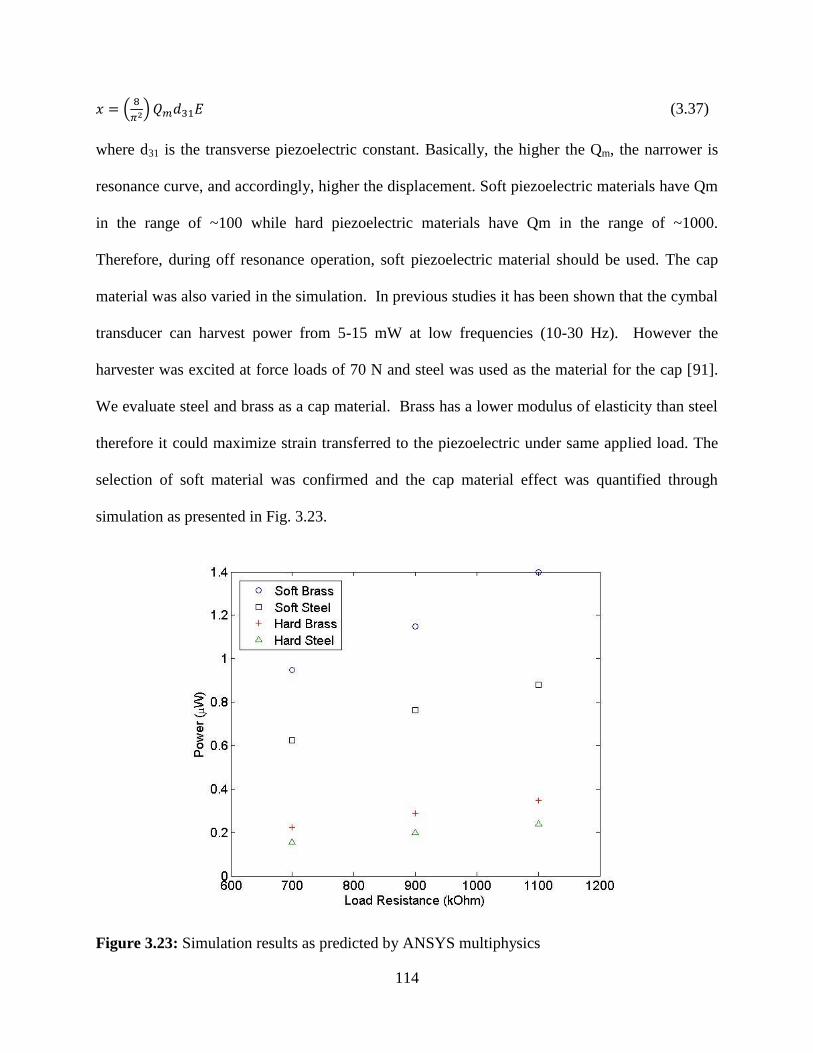
114
(
) (3.37)
where d31 is the transverse piezoelectric constant. Basically, the higher the Qm, the narrower is
resonance curve, and accordingly, higher the displacement. Soft piezoelectric materials have Qm
in the range of ~100 while hard piezoelectric materials have Qm in the range of ~1000.
Therefore, during off resonance operation, soft piezoelectric material should be used. The cap
material was also varied in the simulation. In previous studies it has been shown that the cymbal
transducer can harvest power from 5-15 mW at low frequencies (10-30 Hz). However the
harvester was excited at force loads of 70 N and steel was used as the material for the cap [91].
We evaluate steel and brass as a cap material. Brass has a lower modulus of elasticity than steel
therefore it could maximize strain transferred to the piezoelectric under same applied load. The
selection of soft material was confirmed and the cap material effect was quantified through
simulation as presented in Fig. 3.23.
Figure 3.23: Simulation results as predicted by ANSYS multiphysics
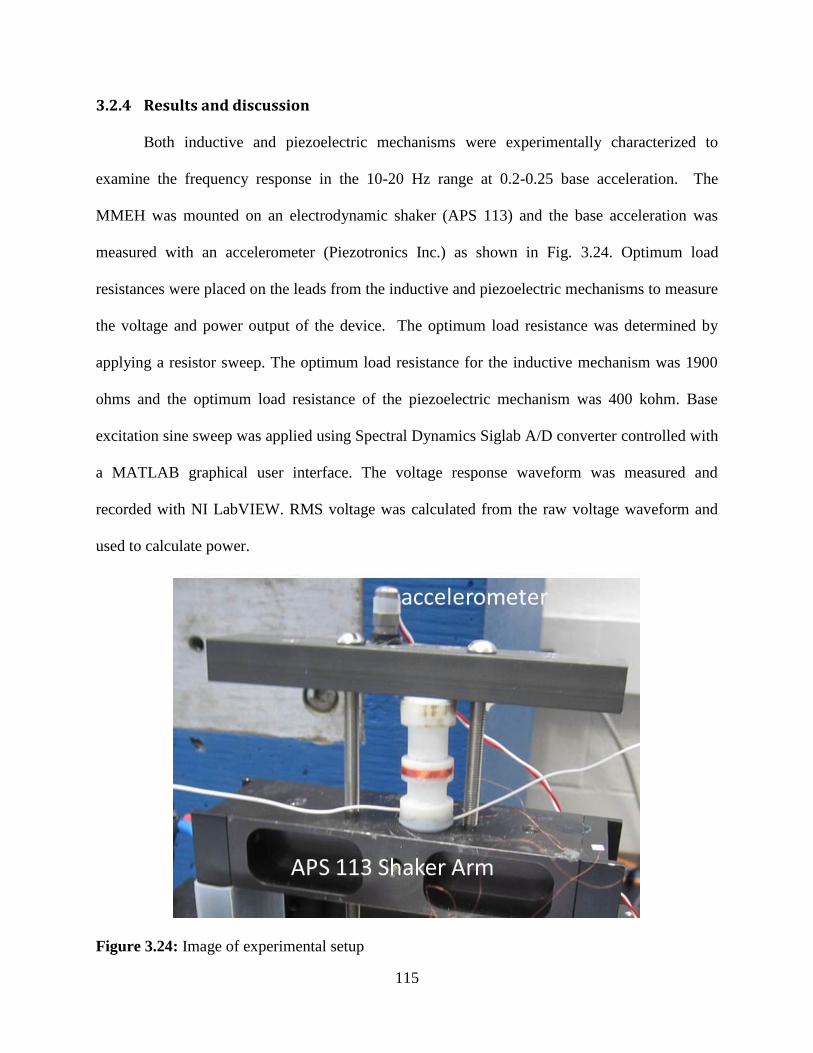
115
3.2.4 Results and discussion
Both inductive and piezoelectric mechanisms were experimentally characterized to
examine the frequency response in the 10-20 Hz range at 0.2-0.25 base acceleration. The
MMEH was mounted on an electrodynamic shaker (APS 113) and the base acceleration was
measured with an accelerometer (Piezotronics Inc.) as shown in Fig. 3.24. Optimum load
resistances were placed on the leads from the inductive and piezoelectric mechanisms to measure
the voltage and power output of the device. The optimum load resistance was determined by
applying a resistor sweep. The optimum load resistance for the inductive mechanism was 1900
ohms and the optimum load resistance of the piezoelectric mechanism was 400 kohm. Base
excitation sine sweep was applied using Spectral Dynamics Siglab A/D converter controlled with
a MATLAB graphical user interface. The voltage response waveform was measured and
recorded with NI LabVIEW. RMS voltage was calculated from the raw voltage waveform and
used to calculate power.
Figure 3.24: Image of experimental setup
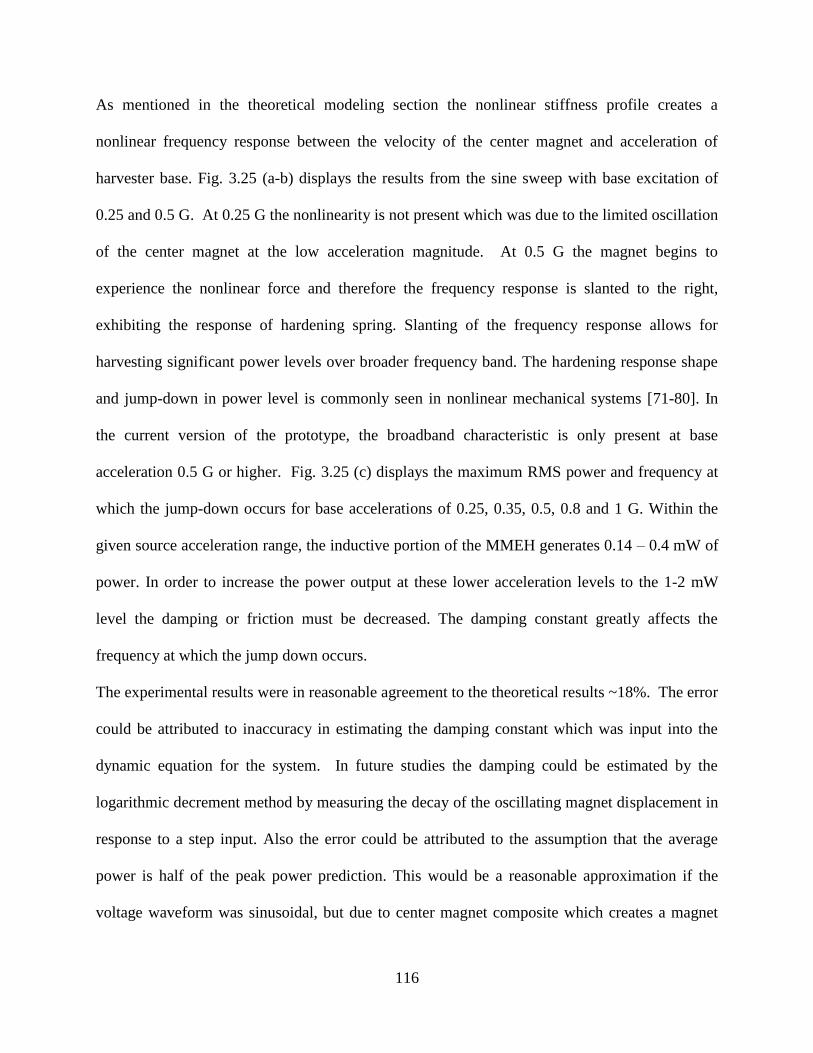
116
As mentioned in the theoretical modeling section the nonlinear stiffness profile creates a
nonlinear frequency response between the velocity of the center magnet and acceleration of
harvester base. Fig. 3.25 (a-b) displays the results from the sine sweep with base excitation of
0.25 and 0.5 G. At 0.25 G the nonlinearity is not present which was due to the limited oscillation
of the center magnet at the low acceleration magnitude. At 0.5 G the magnet begins to
experience the nonlinear force and therefore the frequency response is slanted to the right,
exhibiting the response of hardening spring. Slanting of the frequency response allows for
harvesting significant power levels over broader frequency band. The hardening response shape
and jump-down in power level is commonly seen in nonlinear mechanical systems [71-80]. In
the current version of the prototype, the broadband characteristic is only present at base
acceleration 0.5 G or higher. Fig. 3.25 (c) displays the maximum RMS power and frequency at
which the jump-down occurs for base accelerations of 0.25, 0.35, 0.5, 0.8 and 1 G. Within the
given source acceleration range, the inductive portion of the MMEH generates 0.14 – 0.4 mW of
power. In order to increase the power output at these lower acceleration levels to the 1-2 mW
level the damping or friction must be decreased. The damping constant greatly affects the
frequency at which the jump down occurs.
The experimental results were in reasonable agreement to the theoretical results ~18%. The error
could be attributed to inaccuracy in estimating the damping constant which was input into the
dynamic equation for the system. In future studies the damping could be estimated by the
logarithmic decrement method by measuring the decay of the oscillating magnet displacement in
response to a step input. Also the error could be attributed to the assumption that the average
power is half of the peak power prediction. This would be a reasonable approximation if the
voltage waveform was sinusoidal, but due to center magnet composite which creates a magnet
117
flux density reversal between the top, middle, and bottom of the magnet the waveform is not
sinusoidal.
Figure 3.25: Inductive mechanism experimental results (a) frequency response for 0.25 G (b)
frequency response for 0.5 G (c) and maximum RMS power at various accelerations
The piezoelectric mechanism was tested under similar conditions to the inductive mechanism.
The cymbal with the steel cap was used for the experimentation due to faulty electrodes on the
cymbal with the brass cap. Fig. 3.26 (a-b) displays the results from the sine sweep with base
excitation of 0.35 and 1 G. At both 0.35 G and 1 G base excitation the interaction between the
inductive and the piezoelectric mechanisms was present. The interaction is illustrated by the
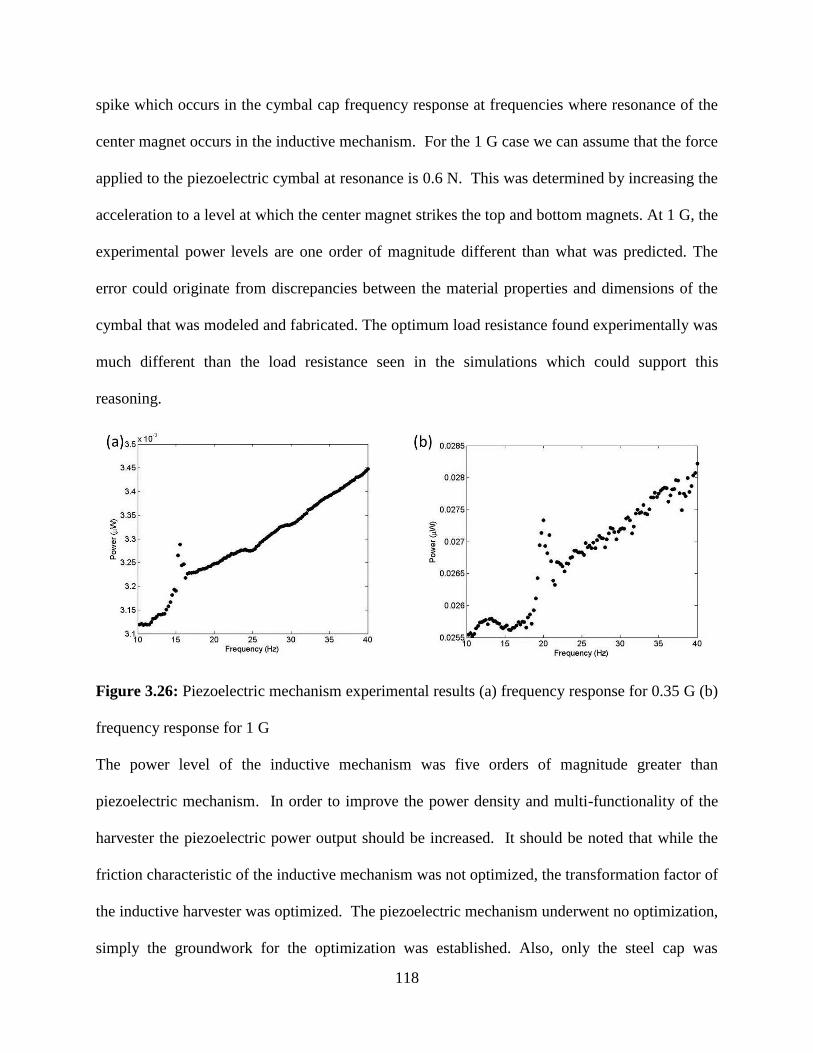
118
spike which occurs in the cymbal cap frequency response at frequencies where resonance of the
center magnet occurs in the inductive mechanism. For the 1 G case we can assume that the force
applied to the piezoelectric cymbal at resonance is 0.6 N. This was determined by increasing the
acceleration to a level at which the center magnet strikes the top and bottom magnets. At 1 G, the
experimental power levels are one order of magnitude different than what was predicted. The
error could originate from discrepancies between the material properties and dimensions of the
cymbal that was modeled and fabricated. The optimum load resistance found experimentally was
much different than the load resistance seen in the simulations which could support this
reasoning.
Figure 3.26: Piezoelectric mechanism experimental results (a) frequency response for 0.35 G (b)
frequency response for 1 G
The power level of the inductive mechanism was five orders of magnitude greater than
piezoelectric mechanism. In order to improve the power density and multi-functionality of the
harvester the piezoelectric power output should be increased. It should be noted that while the
friction characteristic of the inductive mechanism was not optimized, the transformation factor of
the inductive harvester was optimized. The piezoelectric mechanism underwent no optimization,
simply the groundwork for the optimization was established. Also, only the steel cap was
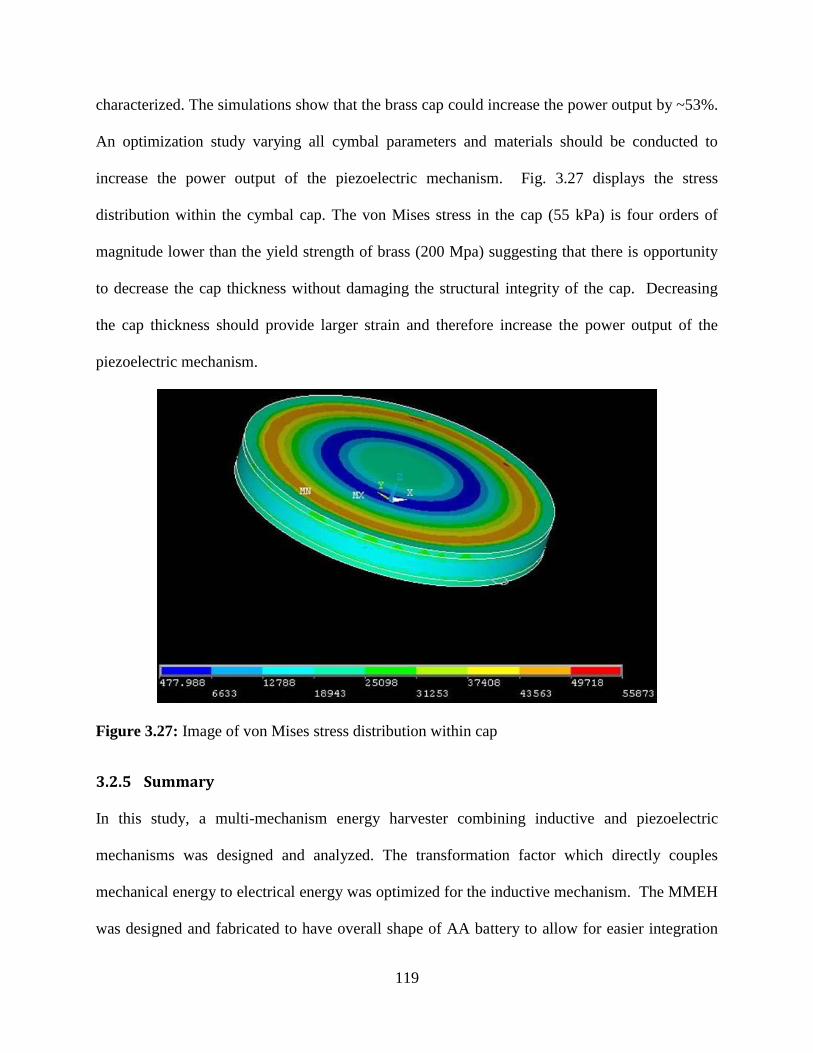
119
characterized. The simulations show that the brass cap could increase the power output by ~53%.
An optimization study varying all cymbal parameters and materials should be conducted to
increase the power output of the piezoelectric mechanism. Fig. 3.27 displays the stress
distribution within the cymbal cap. The von Mises stress in the cap (55 kPa) is four orders of
magnitude lower than the yield strength of brass (200 Mpa) suggesting that there is opportunity
to decrease the cap thickness without damaging the structural integrity of the cap. Decreasing
the cap thickness should provide larger strain and therefore increase the power output of the
piezoelectric mechanism.
Figure 3.27: Image of von Mises stress distribution within cap
3.2.5 Summary
In this study, a multi-mechanism energy harvester combining inductive and piezoelectric
mechanisms was designed and analyzed. The transformation factor which directly couples
mechanical energy to electrical energy was optimized for the inductive mechanism. The MMEH
was designed and fabricated to have overall shape of AA battery to allow for easier integration

120
into existing sensor networks. The inductive mechanism generates between 0.4 and 4.2 mW at
accelerations between 0.2 and 1 G. The maximum power harvested occurs within the source
frequency range, and at accelerations 0.5 G or higher an increase in the bandwidth of the
harvester is achieved. The coupling or multi-functionality of the prototype was confirmed
through analysis of the piezoelectric transducer and experimental characterization. While the
power output of the piezoelectric mechanism is low the parameters for future optimization were
identified. With completion of the piezoelectric mechanism optimization study and decrease in
friction present in the inductive mechanism, the MMEH could serve as a substitute for batteries
in the sensor node application.

121
4 CHAPTER 4: DESIGN FOR HIGH EFFICIENCY VIBRATION ENERGY HARVESTING
4.1 Combined isolator and absorber to create relative motion for high efficiency vibration energy harvesting
Relative motion is required for vibration energy harvesting: inductive (magnet moving
past coil) and piezoelectric (strain). Typically relative motion is created by amplifying the source
displacement and storage of mechanical energy in an auxiliary vibrating mass. The amount of
power that can be extracted from a vibration source depends on the magnitude of the force of the
vibrating mass attached to the vibrating structure. Therefore, in this study a novel technique was
developed create the relative motion without amplification of original source displacement by
cancelling the vibration at one location and transferring the source vibration directly to another
location through combination of a vibration isolator with a vibration absorber. In this novel
configuration, termed as Direct Vibration Harvester (DVH), the power is harvested from the
force of the vibrating source mass rather than an auxiliary mass allowing for enhancements in the
harvester bandwidth and power density. A prototype was designed and fabricated which
harvested 45 mW @ 0.9 G base acceleration and weighed 462 grams. Through analytical
modeling it was determined that a prototype could generate 87 mW @ 1 G base acceleration and
only weigh 243 grams. Also, an optimal balance between the bandwidth and the maximum
power harvested was identified through parametric analysis.
122
4.1.1 Introduction
Vibration energy harvesting has been widely researched in an effort to provide power
source to the distributed wireless sensor nodes. The power requirements of various health and
condition monitoring systems continue to decrease and thus many industries may find it more
economical to use vibration energy harvesting in some scenarios to power the sensors. Currently,
at the larger dimensions, induction based vibration energy harvesters are preferred and within
this category there are two suitable mechanisms, namely four bar magnet configuration [9, 17,
19, 22-24, 36] and magnetic levitation [50-51, 69-72]. The four bar magnet design consists of a
cantilever beam attached to a base which is mounted on a vibration source. Towards the free end
of the cantilever beam a copper coil is attached. The harvester base houses four bar magnets
which are placed on each side of the coil. As the source vibrates, relative motion is created
between the magnets (base) and coil (cantilever beam) generating voltage through
electromagnetic induction. The magnetic levitation harvester consists of a levitating magnet
suspended between the two magnets with opposite polarity attached to the top and bottom base
within a cylindrical tube. A coil is wrapped around the base (tube) in order to harvest electrical
energy through electromagnetic induction. Our contribution to both the existing four bar magnet
[26, 35] and magnetic levitation [37, 52] have focused on enhancing the electromagnetic
coupling which is the factor relating the conversion of mechanical to electrical energy.
Stephen has derived the maximum mechanical power available in these harvesters and
the maximum achievable mechanical to electrical efficiency by using the typical spring-mass-
damper modeling approach [36]. The magnitude of the mechanical RMS power available in
these prototypes can be determined through the following relationship:
(4.1)
123
where is the seismic mass, is the source acceleration, is the mechanical damping ratio,
and is the source frequency. As the source acceleration and frequency are fixed in a typical
application and the damping ratio is dependent upon the material properties or dynamic friction,
the seismic mass limits the amount of power that can be harvested. This is an additional mass
which is attached to a larger vibrating source mass. Stephen also shows that maximum electrical
power that can be extracted from the mechanical power is described through the following
relationship:
(
) (4.2)
where is the coil resistance and is the load resistance. From Eq. 4.2 it is clear that the
maximum conversion efficiency achievable is 0.5. In the previous chapter, a high efficiency of
0.454 was demonstrated through design improvement of the existing four bar magnet prototype
[35].
Researchers have also started to consider alternatives to the four bar magnet and
magnetic levitation prototypes to further improve the power density. In this aspect, efforts have
been made to utilize vibration absorbers as vibration attenuators and energy harvesters. Cornwell
et al. were one of the first investigators that considered vibration absorbers for energy harvesting
[92]. A cantilever beam with tip mass, which acts as an absorber mass, and spring was attached
to a host structure that represented a three story building representing the primary mass and
spring. The base of the structure was rigidly attached to the ground and the structure was excited
with an electrodynamic shaker. Figure 4.1(a) displays the spring-mass-damper representation for
this arrangement. The disadvantage of this absorber arrangement is that it cannot be mounted on
a vibrating body but is useful for buildings which are excited by wind induced vibration. Other
researchers have considered dynamic magnifiers which are essentially vibration absorbers
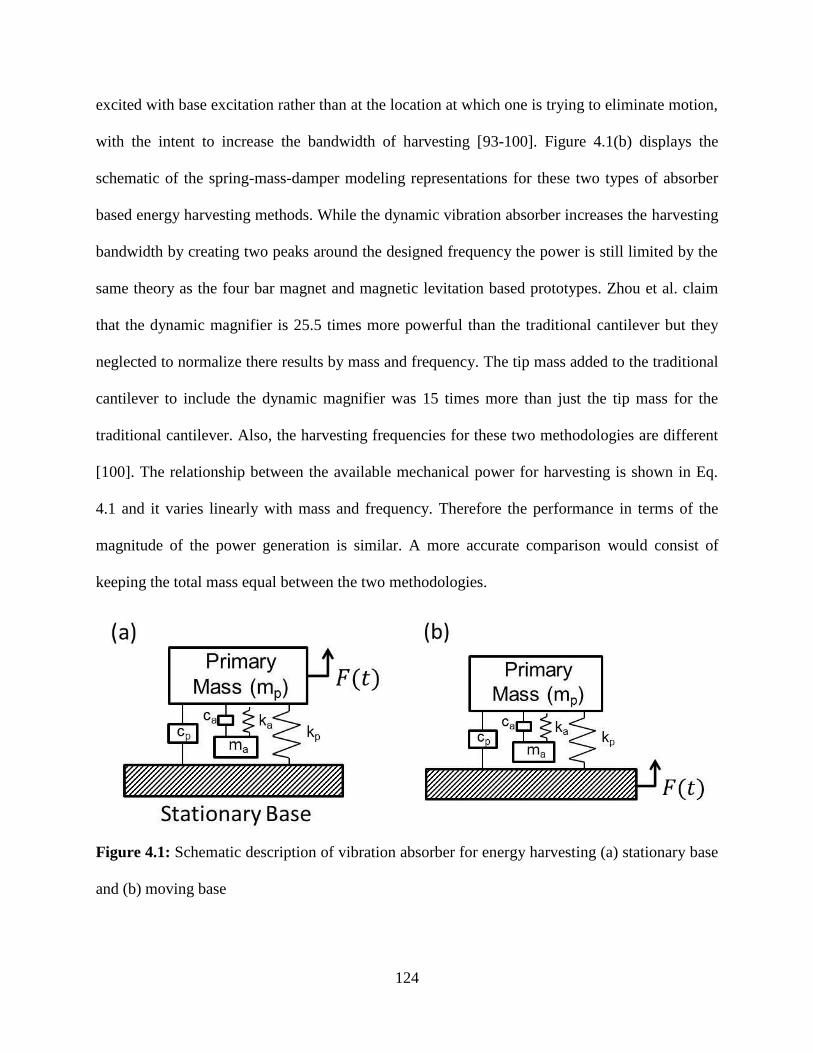
124
excited with base excitation rather than at the location at which one is trying to eliminate motion,
with the intent to increase the bandwidth of harvesting [93-100]. Figure 4.1(b) displays the
schematic of the spring-mass-damper modeling representations for these two types of absorber
based energy harvesting methods. While the dynamic vibration absorber increases the harvesting
bandwidth by creating two peaks around the designed frequency the power is still limited by the
same theory as the four bar magnet and magnetic levitation based prototypes. Zhou et al. claim
that the dynamic magnifier is 25.5 times more powerful than the traditional cantilever but they
neglected to normalize there results by mass and frequency. The tip mass added to the traditional
cantilever to include the dynamic magnifier was 15 times more than just the tip mass for the
traditional cantilever. Also, the harvesting frequencies for these two methodologies are different
[100]. The relationship between the available mechanical power for harvesting is shown in Eq.
4.1 and it varies linearly with mass and frequency. Therefore the performance in terms of the
magnitude of the power generation is similar. A more accurate comparison would consist of
keeping the total mass equal between the two methodologies.
Figure 4.1: Schematic description of vibration absorber for energy harvesting (a) stationary base
and (b) moving base
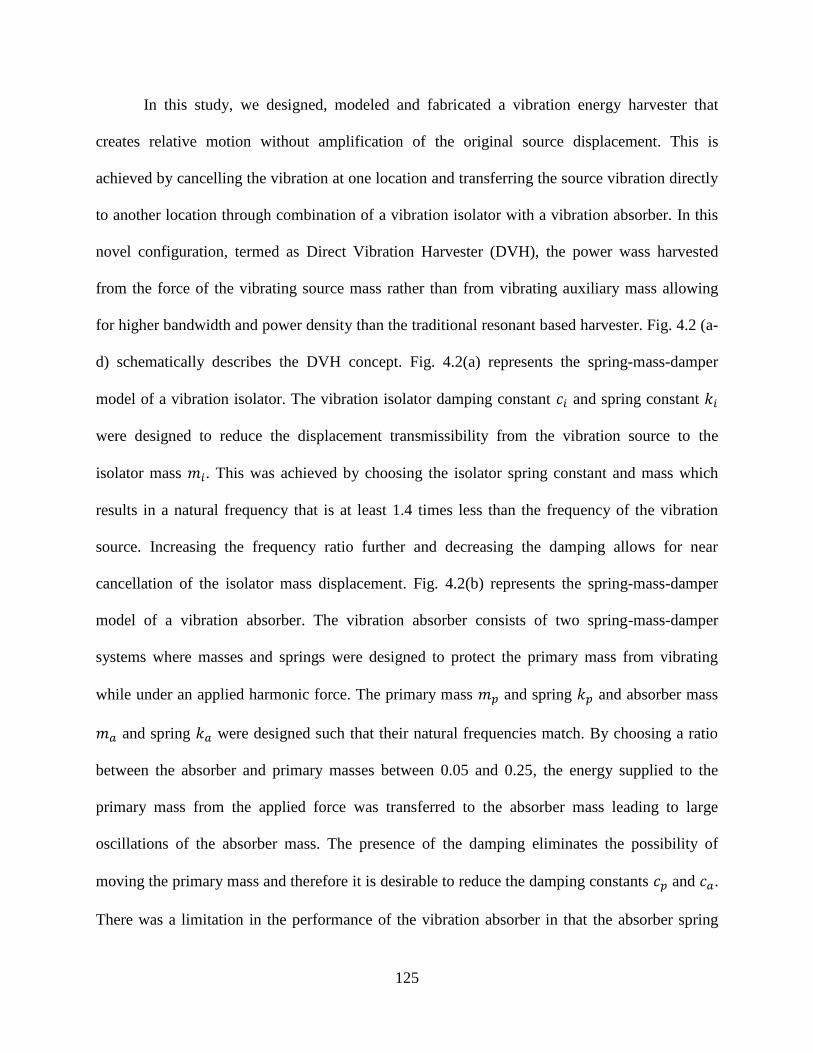
125
In this study, we designed, modeled and fabricated a vibration energy harvester that
creates relative motion without amplification of the original source displacement. This is
achieved by cancelling the vibration at one location and transferring the source vibration directly
to another location through combination of a vibration isolator with a vibration absorber. In this
novel configuration, termed as Direct Vibration Harvester (DVH), the power wass harvested
from the force of the vibrating source mass rather than from vibrating auxiliary mass allowing
for higher bandwidth and power density than the traditional resonant based harvester. Fig. 4.2 (a-
d) schematically describes the DVH concept. Fig. 4.2(a) represents the spring-mass-damper
model of a vibration isolator. The vibration isolator damping constant and spring constant
were designed to reduce the displacement transmissibility from the vibration source to the
isolator mass . This was achieved by choosing the isolator spring constant and mass which
results in a natural frequency that is at least 1.4 times less than the frequency of the vibration
source. Increasing the frequency ratio further and decreasing the damping allows for near
cancellation of the isolator mass displacement. Fig. 4.2(b) represents the spring-mass-damper
model of a vibration absorber. The vibration absorber consists of two spring-mass-damper
systems where masses and springs were designed to protect the primary mass from vibrating
while under an applied harmonic force. The primary mass and spring and absorber mass
and spring were designed such that their natural frequencies match. By choosing a ratio
between the absorber and primary masses between 0.05 and 0.25, the energy supplied to the
primary mass from the applied force was transferred to the absorber mass leading to large
oscillations of the absorber mass. The presence of the damping eliminates the possibility of
moving the primary mass and therefore it is desirable to reduce the damping constants and .
There was a limitation in the performance of the vibration absorber in that the absorber spring

126
stiffness must be able to withstand the full force of excitation and the deflection that results.
Later in this chapter, we will discuss in detail how this limitation affects the performance of
DVH and how the electromechanical damping constant limits the amount of power extracted
from the system. By combining the two systems (absorber and isolator) we propose to create
relative motion between the moving vibration source and the almost stationary primary mass as
shown in Fig. 4.2(c). The energy from the relative motion is not limited by the amount of energy
stored in vibrating mass attached to the vibrating source at resonance; rather the energy from the
vibrating source can be directly harvested. Source displacements from real world applications are
often on the level of 0.02 mm to 2 mm. As the DVH does not amplify the source displacement,
this presents a challenge to harvest the high force/energy content and low displacement vibration.
To this end, we can convert the linear vibration to rotational motion and amplify the rotational
motion using a gear train as shown in Fig. 4.2(d).
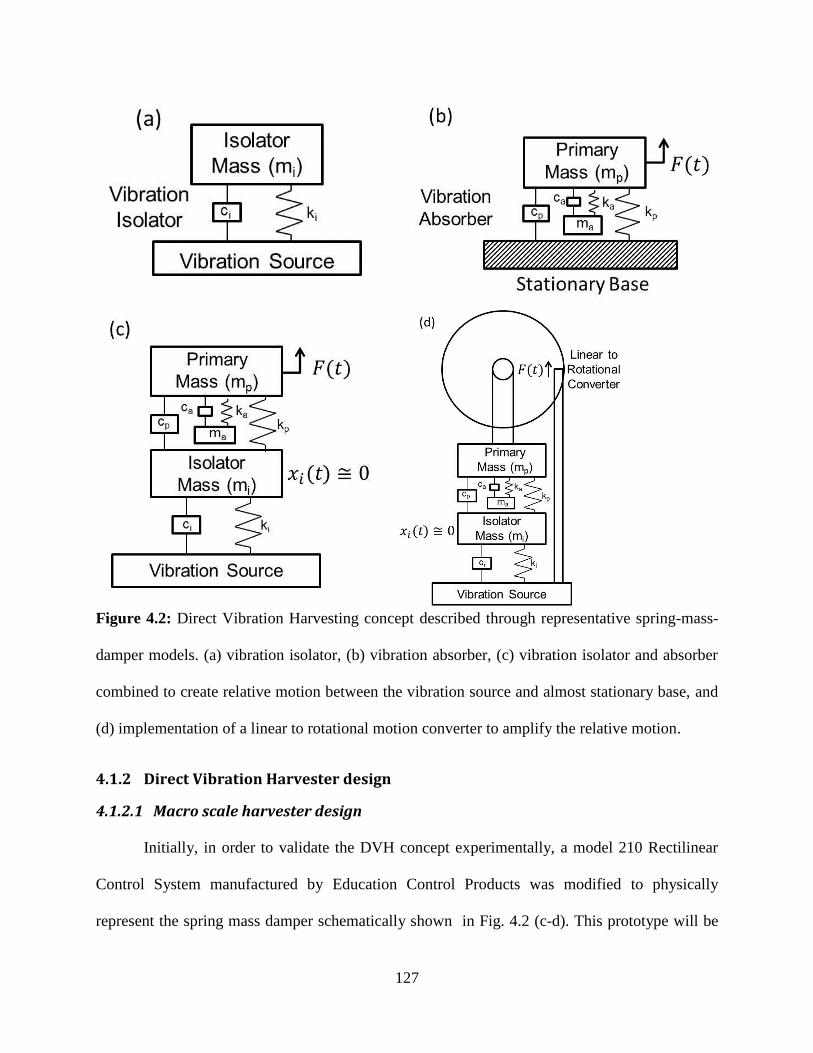
127
Figure 4.2: Direct Vibration Harvesting concept described through representative spring-mass-
damper models. (a) vibration isolator, (b) vibration absorber, (c) vibration isolator and absorber
combined to create relative motion between the vibration source and almost stationary base, and
(d) implementation of a linear to rotational motion converter to amplify the relative motion.
4.1.2 Direct Vibration Harvester design
4.1.2.1 Macro scale harvester design
Initially, in order to validate the DVH concept experimentally, a model 210 Rectilinear
Control System manufactured by Education Control Products was modified to physically
represent the spring mass damper schematically shown in Fig. 4.2 (c-d). This prototype will be
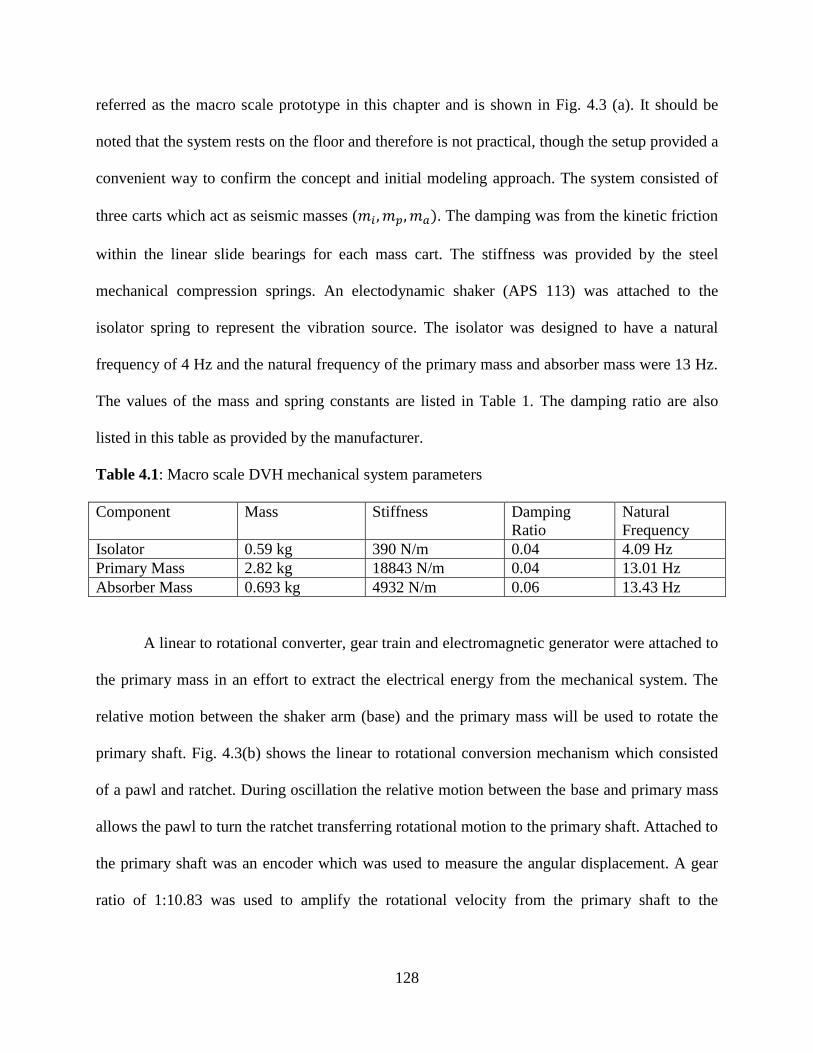
128
referred as the macro scale prototype in this chapter and is shown in Fig. 4.3 (a). It should be
noted that the system rests on the floor and therefore is not practical, though the setup provided a
convenient way to confirm the concept and initial modeling approach. The system consisted of
three carts which act as seismic masses ( ). The damping was from the kinetic friction
within the linear slide bearings for each mass cart. The stiffness was provided by the steel
mechanical compression springs. An electodynamic shaker (APS 113) was attached to the
isolator spring to represent the vibration source. The isolator was designed to have a natural
frequency of 4 Hz and the natural frequency of the primary mass and absorber mass were 13 Hz.
The values of the mass and spring constants are listed in Table 1. The damping ratio are also
listed in this table as provided by the manufacturer.
Table 4.1: Macro scale DVH mechanical system parameters
Component Mass Stiffness Damping
Ratio
Natural
Frequency
Isolator 0.59 kg 390 N/m 0.04 4.09 Hz
Primary Mass 2.82 kg 18843 N/m 0.04 13.01 Hz
Absorber Mass 0.693 kg 4932 N/m 0.06 13.43 Hz
A linear to rotational converter, gear train and electromagnetic generator were attached to
the primary mass in an effort to extract the electrical energy from the mechanical system. The
relative motion between the shaker arm (base) and the primary mass will be used to rotate the
primary shaft. Fig. 4.3(b) shows the linear to rotational conversion mechanism which consisted
of a pawl and ratchet. During oscillation the relative motion between the base and primary mass
allows the pawl to turn the ratchet transferring rotational motion to the primary shaft. Attached to
the primary shaft was an encoder which was used to measure the angular displacement. A gear
ratio of 1:10.83 was used to amplify the rotational velocity from the primary shaft to the
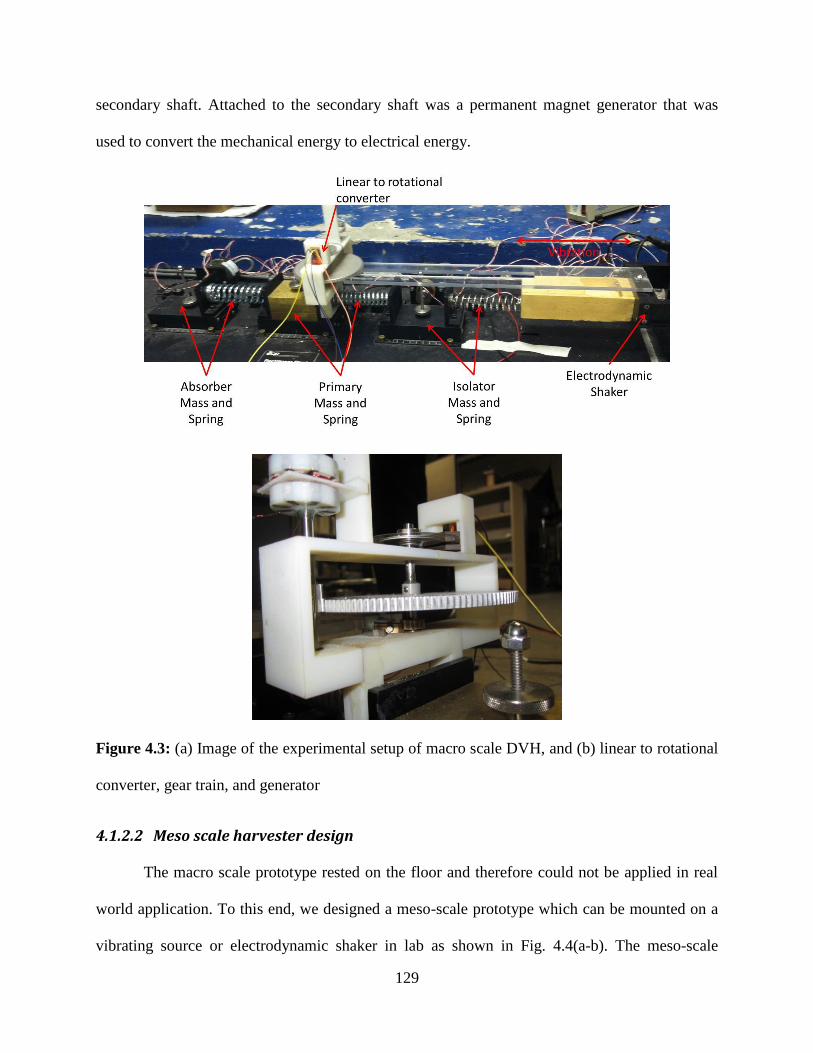
129
secondary shaft. Attached to the secondary shaft was a permanent magnet generator that was
used to convert the mechanical energy to electrical energy.
Figure 4.3: (a) Image of the experimental setup of macro scale DVH, and (b) linear to rotational
converter, gear train, and generator
4.1.2.2 Meso scale harvester design
The macro scale prototype rested on the floor and therefore could not be applied in real
world application. To this end, we designed a meso-scale prototype which can be mounted on a
vibrating source or electrodynamic shaker in lab as shown in Fig. 4.4(a-b). The meso-scale

130
prototype consists of three masses which can vibrate freely along low friction linear rail
bearings. The masses are connected by various steel mechanical springs to provide the required
stiffness. The structure is mounted on an electrodynamic shaker (APS 113) which provides the
source displacement as shown in Fig. 4.4(a). The values for the mass and spring constants are
listed in Table 4.2 below.
Table 4.2: Meso-scale DVH mechanical system parameters
Component Mass Stiffness Damping
Ratio
Natural
Frequency
Isolator 0.083 kg 42 N/m Unknown 3.58 Hz
Primary Mass 0.3 kg 2189 N/m Unknown 13.6 Hz
Absorber Mass 0.079 kg 618 N/m Unknown 14.04 Hz
A linear to rotational converter, gear train, and electromagnetic generator assembly are attached
to the primary mass as shown in Fig. 4.4(b). The relative motion between the shaker arm (base)
and primary mass was used to rotate the primary shaft. The linear to rotational motion converter
consists of a rack and pinion in an effort to enhance the conversion efficiency. With a rack and
pinion the force is transferred to the shaft in multiple directions and therefore rotates the shaft in
two directions. This is undesirable as the generator would spin in one direction and then reverse
preventing the ability to utilize the inertia of the generator. Therefore, a double clutch and
differential was implemented to convert the oscillatory rotation to uni-directional rotation. Rather
than designing a custom mechanism, Kobalt manufactured Double Drive screw driver that
contains this mechanism was utilized. A similar mechanism was also custom designed for an
energy harvester integrated in a suspension damper [101]. The rotational velocity was amplified
using a planetary gear set which was purchased from Edmund Scientific. The planetary gear set
can achieve gear ratios from 1:4 to 1:400. Attached to the secondary shaft was a permanent
magnet generator used to convert the mechanical energy to electrical energy. The details of the

131
modeling and design of this rotational generator can be found in Section 5 of the dissertation.
The resistance of the generator was 1964 ohms and the generator constant was 16.82 V*s/m.
Figure 4.4: Image of meso-scale direct vibration harvester (a) close-up of combined isolator and
absorber system (b) close-up of linear to rotational converter, gear train, and generator
132
4.1.3 Analytical Modeling and Theoretical Analysis
To model the dynamics of the direct vibration harvester a spring-mass-damper approach
was used. The equation of motion for the isolator under constant displacement from a vibration
source consisted of:
( ) ( ) ( ) ( ) (4.2)
where is the isolator mass, and are the isolator and primary mass damping constants,
and are the isolator and primary mass spring constants, are the displacements of
the source mass, isolator mass, and primary mass, and is the source vibration frequency. Eq.
4.2 can be re-arranged to a more convenient form and expressed as:
( ) ( ) (4.3)
The equation of motion for the primary absorber mass with applied force from the vibrating
source consisted of:
( ) ( ) ( ) ( ) (4.4)
where is the primary mass and is the force applied to primary mass from source. Eq.
4.4 can be rewritten in a more convenient form and expressed as:
( ) ( ) (4.5)
The equation for the motion of the secondary absorber mass was:
( ) ( ) (4.6)
The coupled equations of motion were separated into mass, damping and stiffness
matrices and numerically solved using MATLAB ode 45 solver. The analysis was utilized to
design the two different size scale harvesters introduced above. To first determine if relative
motion between the harvester base and primary mass could be created through combination of
isolator and absorber the dynamics of the system were simulated without the electromechnical
133
coupling term which will be added later in this section. Fig. 4.5 (a-c) displays the results of the
dynamic simulation for the macro and meso scale prototypes under a base excitation of 0.25 G.
The force of the source was calculated using the mass of the shaker arm which was 2.3 kg for the
APS 113. The macro scale prototype was excited at 13.4 Hz which leads to a base velocity and
base displacement of 29.2 mm/s and 0.347 mm at 0.25 G. For the macro scale prototype, motion
is essentially canceled at the primary mass and 29.1 mm/s and 0.272 mm of relative motion
existed. The meso scale prototype was excited at 14 Hz which leads to a base velocity and base
displacement of 27.8 m/s and 0.316 mm at 0.25 G. For the meso scale prototype under the same
base excitation as the macro scale prototype,27.3 mm/s and 0.739 mm of relative motion existed.
As shown in Fig. 4.5 (a-b), unlike the macro scale prototype, the meso scale prototype was not
cancelling the motion of the primary mass. It is clear from the plot of displacement in Fig. 4.5b
that the primary mass is moving more than the primary mass suggesting that absorber is unable
to transfer the force. The absorber spring in the macro scale prototype is 8 times stiffer than the
meso scale prototype. The meso scale system was then simulated with a 0.25 G base excitation
from a smaller shaker with moving mass of only 0.2 kg and the results are shown in Fig 4.5(c).
At this cancellation is achieved,27.8 mm/s and 0.273 mm of relative motion existed. The
following simulations prove the relative motion between the shaker arm and primary mass with
the combination of a vibration isolator and absorber. We confirm these theoretical results in the
experimental results section of this study.

134
Figure 4.5: Dynamic simulation of (a) macro scale prototype in response to base excitation of
0.25 G and 13.4 Hz (b) meso scale prototype in response to base excitation of 0.25 G and 14 Hz
with larger shaker (c) meso scale prototype in response to base excitation of 0.25 G and 14 Hz
with smaller shaker
The simulation results in Fig. 4.5(a) did not include any conversion from mechanical to electrical
energy as we did not include the electromechanical coupling term. In order to add the coupling
term we have to modify Eqs. (4.4-4.5). The dynamic model assumes that all the applied force
from the source is transferred to the primary mass and then to the absorber mass. When we attach
a linear to rotational converter to the primary mass, the force applied from the shaker arm does

135
not transfer directly to the primary mass due to the moment arm of the pinion. When we place an
electrical load on the generator the backwards coupling torque is applied to the shaft and due to
the moment arm of the pinion a force is applied to the primary mass. In our modeling approach
we assume that the force from the source can overcome any electrical load that we place on the
system. To derive the backwards coupling force at the rotational generator we start with the force
on a moving conductor in a magnetic field which consists of:
(4.7)
According to the above equation the force is solely dependent upon the magnitude of current
flow since the coil length and magnetic flux density remain constant in the rotational
generator. If the velocity vector is perpendicular to the magnetic flux vector the magnitude of
current flow can be determined by Eq. (4.8):
( ) ( ) ( )
( ) (4.8)
From Eq. (4.8), the current is solely dependent upon the velocity ( ) and magnetic flux density
( ) as the coil resistance , load resistance , and coil length are all constant in the
rotational generator. For the rest of the analysis, we replace ( ) with ( ) which provides a
more accurate representation of the electromagnetic coupling term [35]. The force can be derived
by the following relationship:
( ) ( ) ( ) ( )( ( ) )
( )
( ( ))
( ) (4.9)
Eq. (4.9) contains a coupling term which varies with time. Through simulation we predict the
maximum and divide by √ as the variation ( ) is sinusoidal. Therefore, the average
generator torque in terms of angular velocity can be derived by the following relationship:
√ ( )
( )
( )
( ) (4.10)
136
where is the radius of the generator which was 10 mm. To relate the torque at the generator
to a force at the pinion which translates to a damping force applied to the primary mass we set
torque at the pinion equal to the torque at the generator to derive the electrical damping constant
. Therefore the torque at the pinion can be written as:
( ) (4.11)
where
(4.12)
where is the radius of the pin which was 6.5 mm. In Eq. (4.11), the relative velocity varies
with time with sinusoidal relationship. The relative velocity in Eq. (4.10) is a constant. In order
to relate the relative velocity to a constant angular velocity, the maximum value of the relative
velocity divided by the sqrt (2) for one period during steady state is used for the approximation
for the angular velocity of the pinion.
Setting the and solving for leads to the following relationship:
( )
( )
(4.13)
The equation of motion for the primary absorber mass with the electromechanical coupling term
included now consists of:
( ) ( ) (4.14)
Kirchhoff’s voltage law was applied in Eqs. (4.15-4.18) to compute the maximum steady state
voltage and steady state power.
( )
√ ( ) ( ) (4.15)
( ) ( )
√ (4.16)

137
( ) ( )
( ) (4.17)
( )
( ) (4.18)
To investigate the scaling relationship of the energy harvester we vary the gear ratio
which varies the magnitude of the electromechanical coupling term to determine the optimum
gear ratio for a variety of different isolator, primary, absorber mass values. While the primary
and absorber mass values were varied the spring constants were varied accordingly so the natural
frequency was 13.6 Hz for all combinations. The performance of each configuration is compared
in terms of power output normalized by total mass. A base excitation of 1 G and a linear to
rotational conversion efficiency of 62% is used for the parametric analysis. Fig. 4.6 (a-e)
displays the results of the analysis. In Fig. 4.6(a), 14 different configurations of primary and
absorber masses for two isolator mass values are compared to determine if the mass of the
isolator affects the power output. From Fig. 4.6(a), it was determined that there was no
correlation between normalized power output and isolator mass. Therefore, for the rest of the
analysis only the 14 primary/absorber mass combinations are analyzed. Fig. 4.6(b) analyzes the
effect of the absorber/primary mass ratio on normalized power output. From the analysis a linear
and direct relationship between mass ratio and power output existed. The result is somewhat
unexpected as it is typical for a well-designed absorber mass ratio to be between 0.05 and 0.25
[30]. To investigate the affect further, we analyze the dependence of the magnitude of both the
primary mass and absorber mass on the power output. The results of the analysis shown in Fig.
4.6(c-e) clearly illustrate the effect. Power output normalized by mass is linearly and directly
dependent on the absorber mass for every value of the primary mass as seen in Fig. 4.6(d). The
primary mass has a different effect; power output normalized by mass seems increase with the
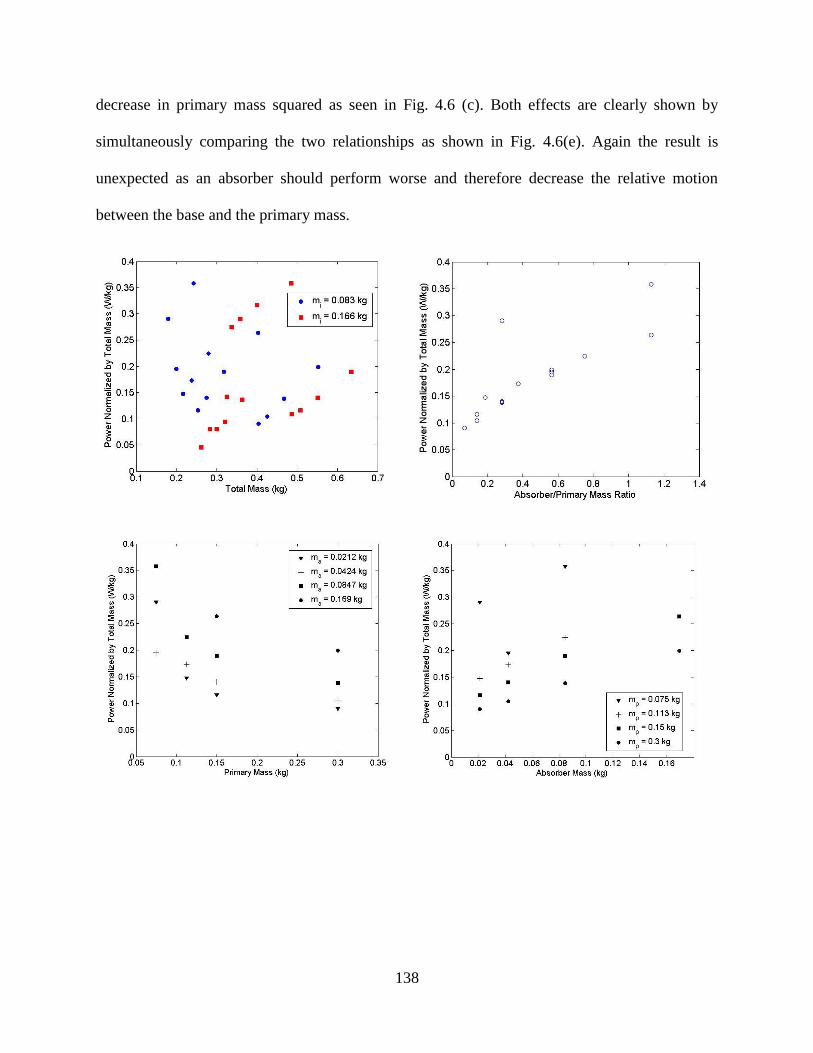
138
decrease in primary mass squared as seen in Fig. 4.6 (c). Both effects are clearly shown by
simultaneously comparing the two relationships as shown in Fig. 4.6(e). Again the result is
unexpected as an absorber should perform worse and therefore decrease the relative motion
between the base and the primary mass.
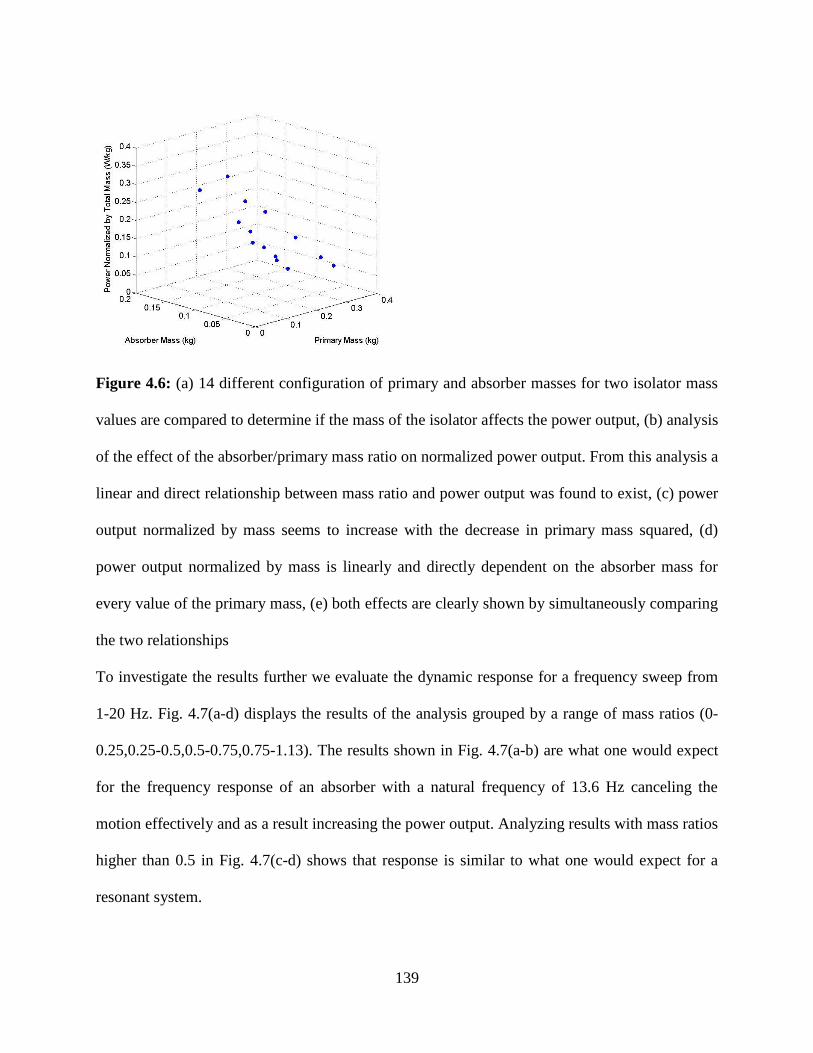
139
Figure 4.6: (a) 14 different configuration of primary and absorber masses for two isolator mass
values are compared to determine if the mass of the isolator affects the power output, (b) analysis
of the effect of the absorber/primary mass ratio on normalized power output. From this analysis a
linear and direct relationship between mass ratio and power output was found to exist, (c) power
output normalized by mass seems to increase with the decrease in primary mass squared, (d)
power output normalized by mass is linearly and directly dependent on the absorber mass for
every value of the primary mass, (e) both effects are clearly shown by simultaneously comparing
the two relationships
To investigate the results further we evaluate the dynamic response for a frequency sweep from
1-20 Hz. Fig. 4.7(a-d) displays the results of the analysis grouped by a range of mass ratios (0-
0.25,0.25-0.5,0.5-0.75,0.75-1.13). The results shown in Fig. 4.7(a-b) are what one would expect
for the frequency response of an absorber with a natural frequency of 13.6 Hz canceling the
motion effectively and as a result increasing the power output. Analyzing results with mass ratios
higher than 0.5 in Fig. 4.7(c-d) shows that response is similar to what one would expect for a
resonant system.
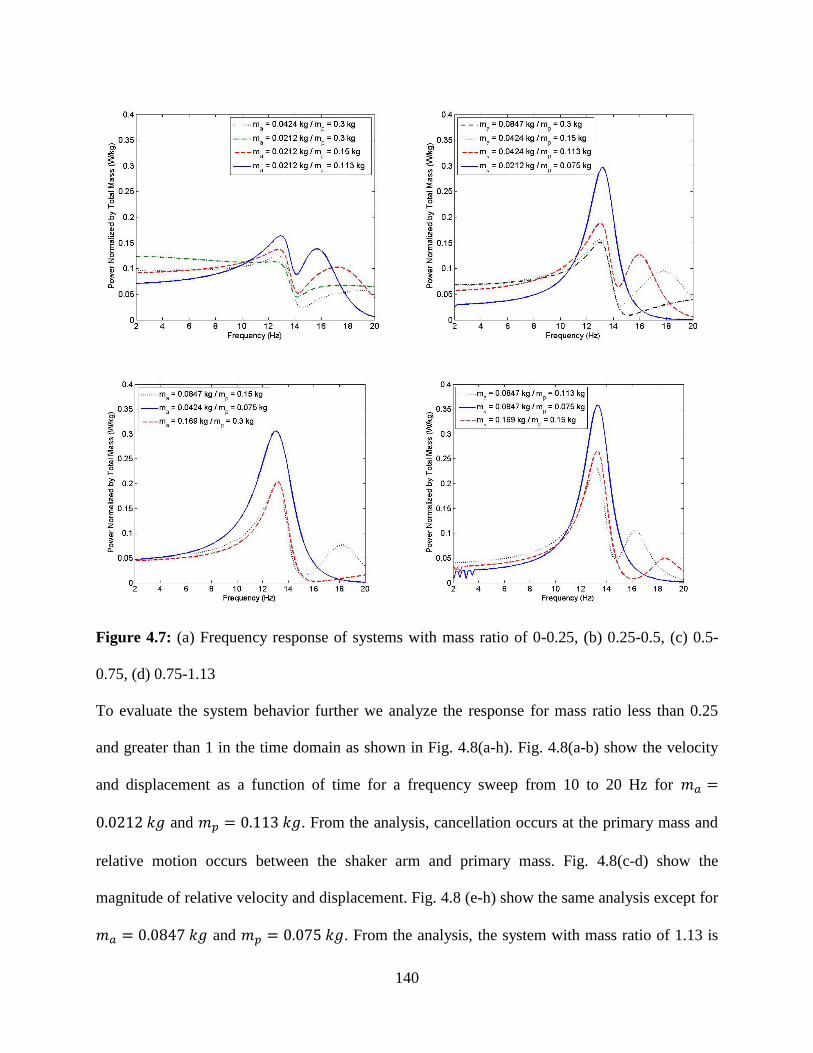
140
Figure 4.7: (a) Frequency response of systems with mass ratio of 0-0.25, (b) 0.25-0.5, (c) 0.5-
0.75, (d) 0.75-1.13
To evaluate the system behavior further we analyze the response for mass ratio less than 0.25
and greater than 1 in the time domain as shown in Fig. 4.8(a-h). Fig. 4.8(a-b) show the velocity
and displacement as a function of time for a frequency sweep from 10 to 20 Hz for
and . From the analysis, cancellation occurs at the primary mass and
relative motion occurs between the shaker arm and primary mass. Fig. 4.8(c-d) show the
magnitude of relative velocity and displacement. Fig. 4.8 (e-h) show the same analysis except for
and . From the analysis, the system with mass ratio of 1.13 is
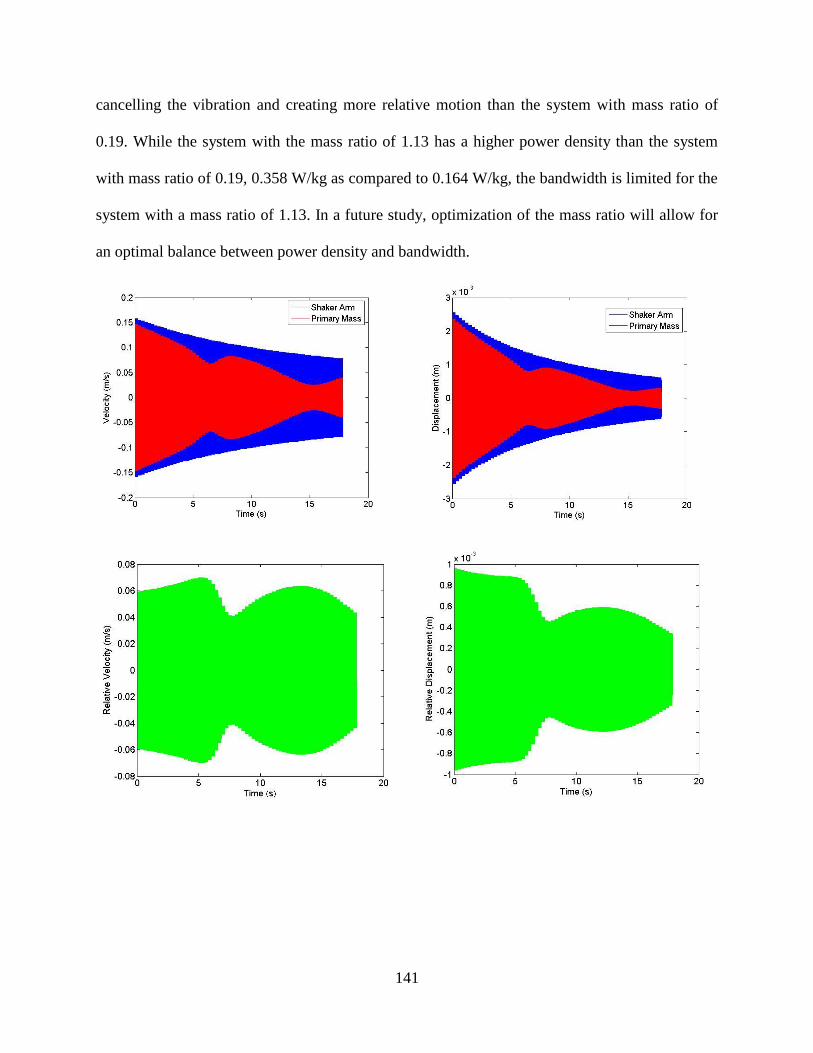
141
cancelling the vibration and creating more relative motion than the system with mass ratio of
0.19. While the system with the mass ratio of 1.13 has a higher power density than the system
with mass ratio of 0.19, 0.358 W/kg as compared to 0.164 W/kg, the bandwidth is limited for the
system with a mass ratio of 1.13. In a future study, optimization of the mass ratio will allow for
an optimal balance between power density and bandwidth.
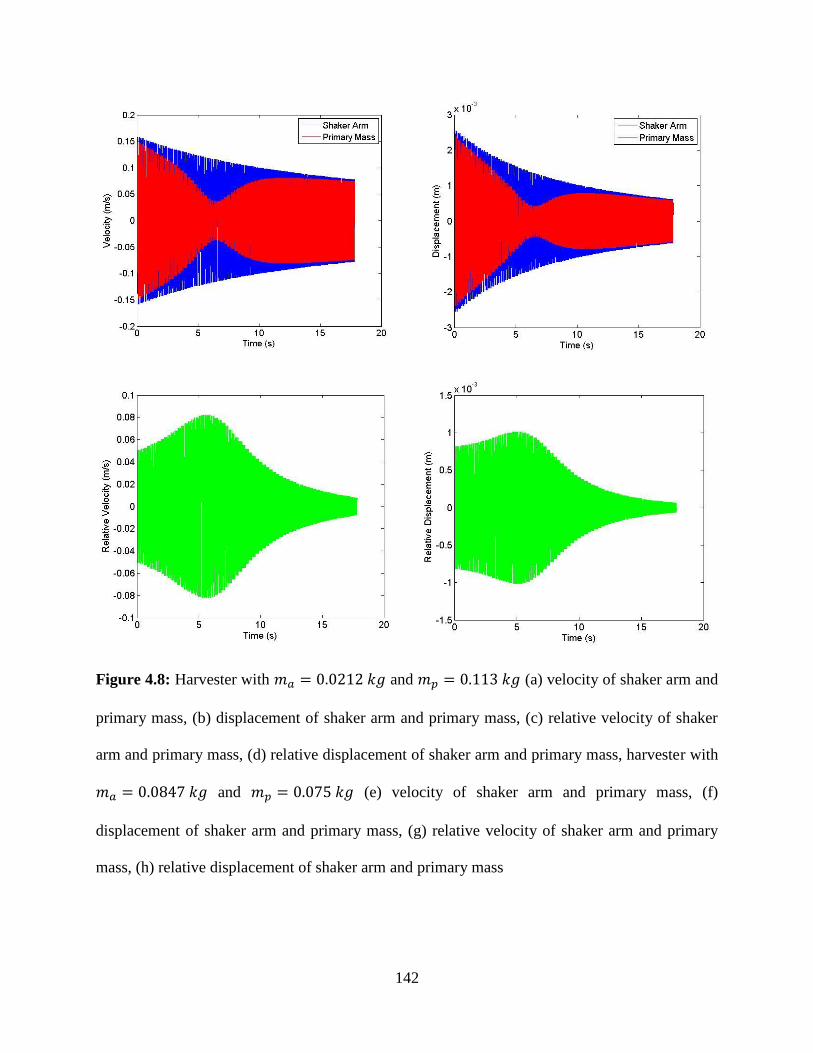
142
Figure 4.8: Harvester with and (a) velocity of shaker arm and
primary mass, (b) displacement of shaker arm and primary mass, (c) relative velocity of shaker
arm and primary mass, (d) relative displacement of shaker arm and primary mass, harvester with
and (e) velocity of shaker arm and primary mass, (f)
displacement of shaker arm and primary mass, (g) relative velocity of shaker arm and primary
mass, (h) relative displacement of shaker arm and primary mass
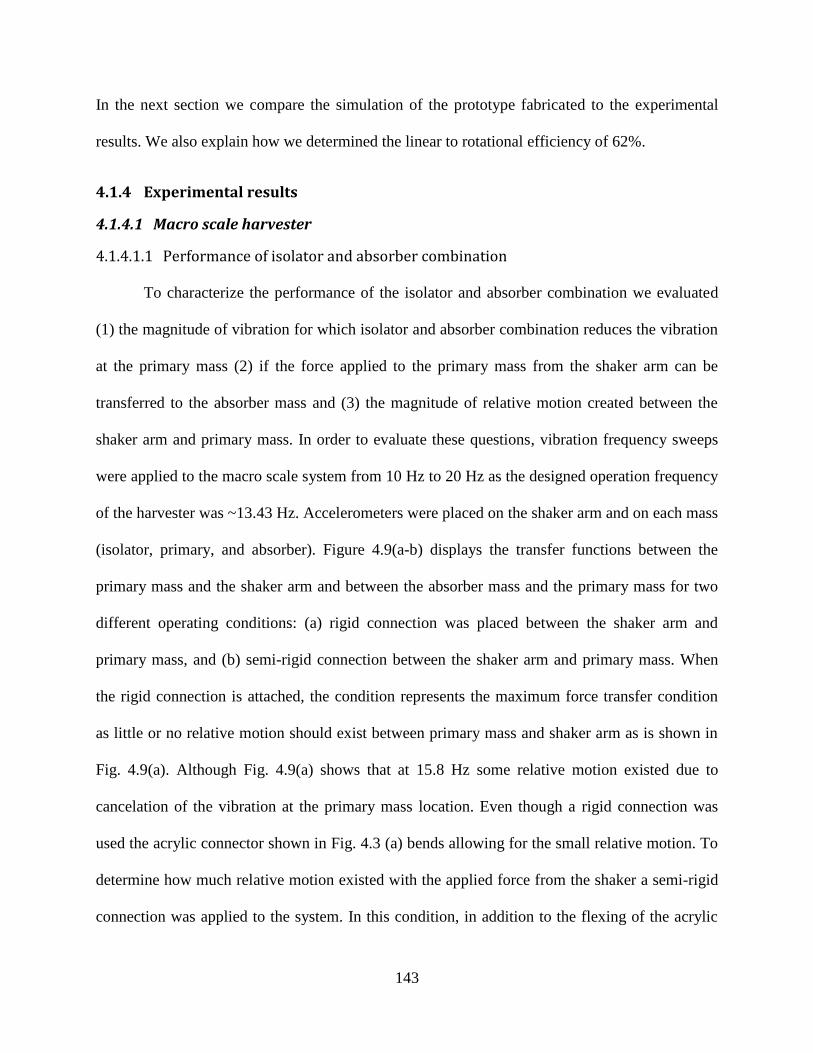
143
In the next section we compare the simulation of the prototype fabricated to the experimental
results. We also explain how we determined the linear to rotational efficiency of 62%.
4.1.4 Experimental results
4.1.4.1 Macro scale harvester
4.1.4.1.1 Performance of isolator and absorber combination
To characterize the performance of the isolator and absorber combination we evaluated
(1) the magnitude of vibration for which isolator and absorber combination reduces the vibration
at the primary mass (2) if the force applied to the primary mass from the shaker arm can be
transferred to the absorber mass and (3) the magnitude of relative motion created between the
shaker arm and primary mass. In order to evaluate these questions, vibration frequency sweeps
were applied to the macro scale system from 10 Hz to 20 Hz as the designed operation frequency
of the harvester was ~13.43 Hz. Accelerometers were placed on the shaker arm and on each mass
(isolator, primary, and absorber). Figure 4.9(a-b) displays the transfer functions between the
primary mass and the shaker arm and between the absorber mass and the primary mass for two
different operating conditions: (a) rigid connection was placed between the shaker arm and
primary mass, and (b) semi-rigid connection between the shaker arm and primary mass. When
the rigid connection is attached, the condition represents the maximum force transfer condition
as little or no relative motion should exist between primary mass and shaker arm as is shown in
Fig. 4.9(a). Although Fig. 4.9(a) shows that at 15.8 Hz some relative motion existed due to
cancelation of the vibration at the primary mass location. Even though a rigid connection was
used the acrylic connector shown in Fig. 4.3 (a) bends allowing for the small relative motion. To
determine how much relative motion existed with the applied force from the shaker a semi-rigid
connection was applied to the system. In this condition, in addition to the flexing of the acrylic
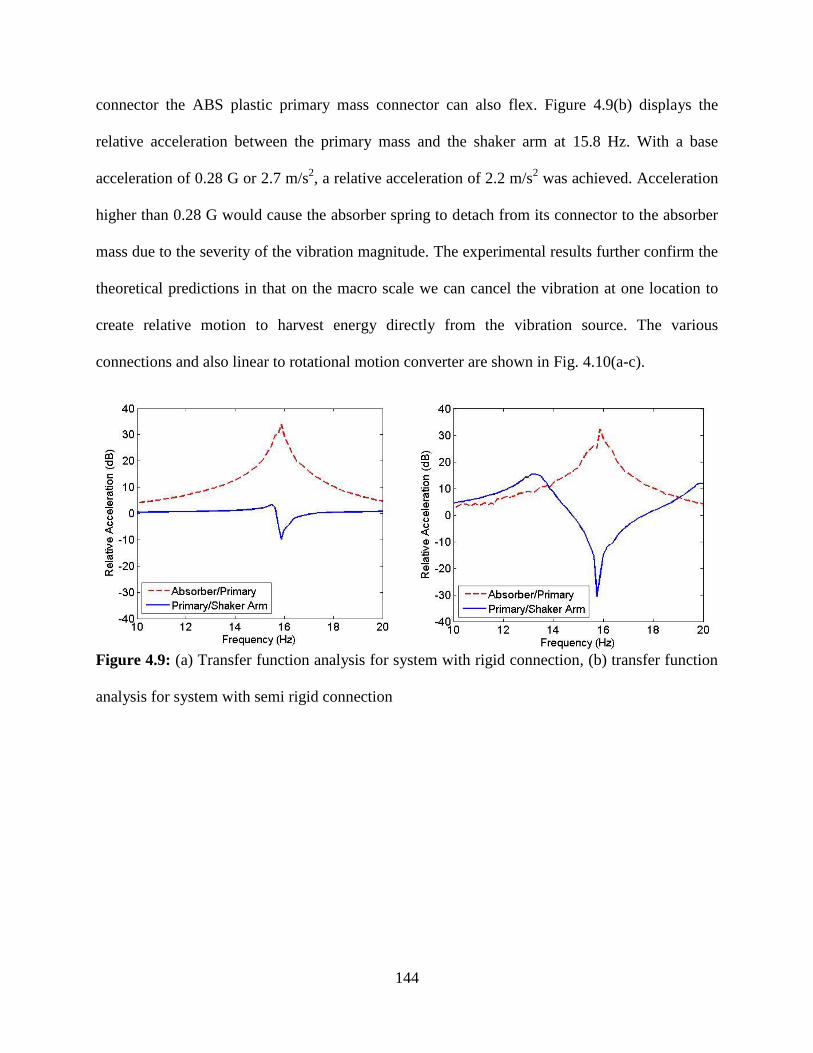
144
connector the ABS plastic primary mass connector can also flex. Figure 4.9(b) displays the
relative acceleration between the primary mass and the shaker arm at 15.8 Hz. With a base
acceleration of 0.28 G or 2.7 m/s2, a relative acceleration of 2.2 m/s
2 was achieved. Acceleration
higher than 0.28 G would cause the absorber spring to detach from its connector to the absorber
mass due to the severity of the vibration magnitude. The experimental results further confirm the
theoretical predictions in that on the macro scale we can cancel the vibration at one location to
create relative motion to harvest energy directly from the vibration source. The various
connections and also linear to rotational motion converter are shown in Fig. 4.10(a-c).
Figure 4.9: (a) Transfer function analysis for system with rigid connection, (b) transfer function
analysis for system with semi rigid connection
145
Figure 4.10: Images of the various connections used in the analysis (a) linear to rotational
coupler (b) rigid connection, (c) semi-rigid connection.
4.1.4.1.2 Energy harvesting capability and performance
To determine the energy harvesting capability electrical loads were placed at the output
of the permanent magnet generator. The macro scale energy harvester was tested at four different
base acceleration values of 1.07 Grms, 1.24 Grms, 1.41 Grms and 1.76 Grms. The steady state
velocities of the primary shaft were measured in both open circuit and closed circuit with various
resistances to determine the electrodynamic effect on the system as shown in Fig. 4.11(a). As the
load resistance is decreased towards short circuit condition, the electrodynamic force due to
current flowing in the generator decreases the steady state angular velocity demonstrating that
we are extracting electrical energy out of the system. Figure 4.11(b) displays the power as a
function of load resistance at each base acceleration level. An optimum load resistance which
leads to maximum power extraction exists for each acceleration value. This optimum load
resistance increases in value as the base acceleration is increased.
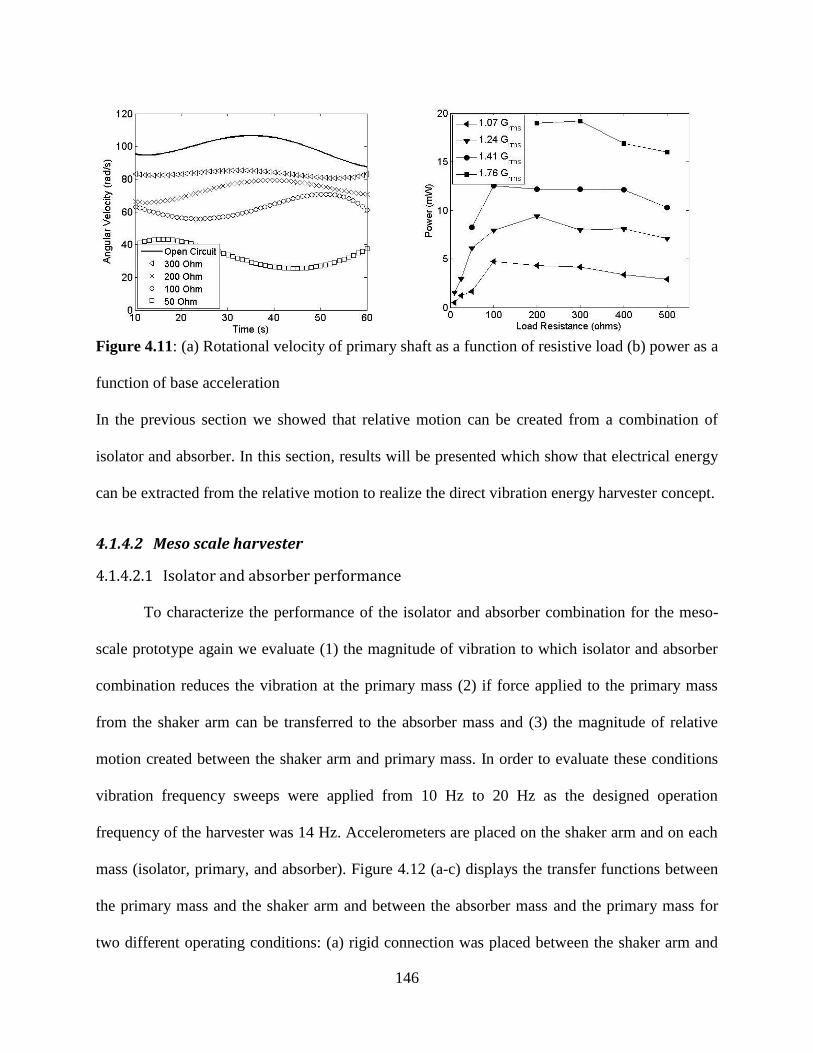
146
Figure 4.11: (a) Rotational velocity of primary shaft as a function of resistive load (b) power as a
function of base acceleration
In the previous section we showed that relative motion can be created from a combination of
isolator and absorber. In this section, results will be presented which show that electrical energy
can be extracted from the relative motion to realize the direct vibration energy harvester concept.
4.1.4.2 Meso scale harvester
4.1.4.2.1 Isolator and absorber performance
To characterize the performance of the isolator and absorber combination for the meso-
scale prototype again we evaluate (1) the magnitude of vibration to which isolator and absorber
combination reduces the vibration at the primary mass (2) if force applied to the primary mass
from the shaker arm can be transferred to the absorber mass and (3) the magnitude of relative
motion created between the shaker arm and primary mass. In order to evaluate these conditions
vibration frequency sweeps were applied from 10 Hz to 20 Hz as the designed operation
frequency of the harvester was 14 Hz. Accelerometers are placed on the shaker arm and on each
mass (isolator, primary, and absorber). Figure 4.12 (a-c) displays the transfer functions between
the primary mass and the shaker arm and between the absorber mass and the primary mass for
two different operating conditions: (a) rigid connection was placed between the shaker arm and
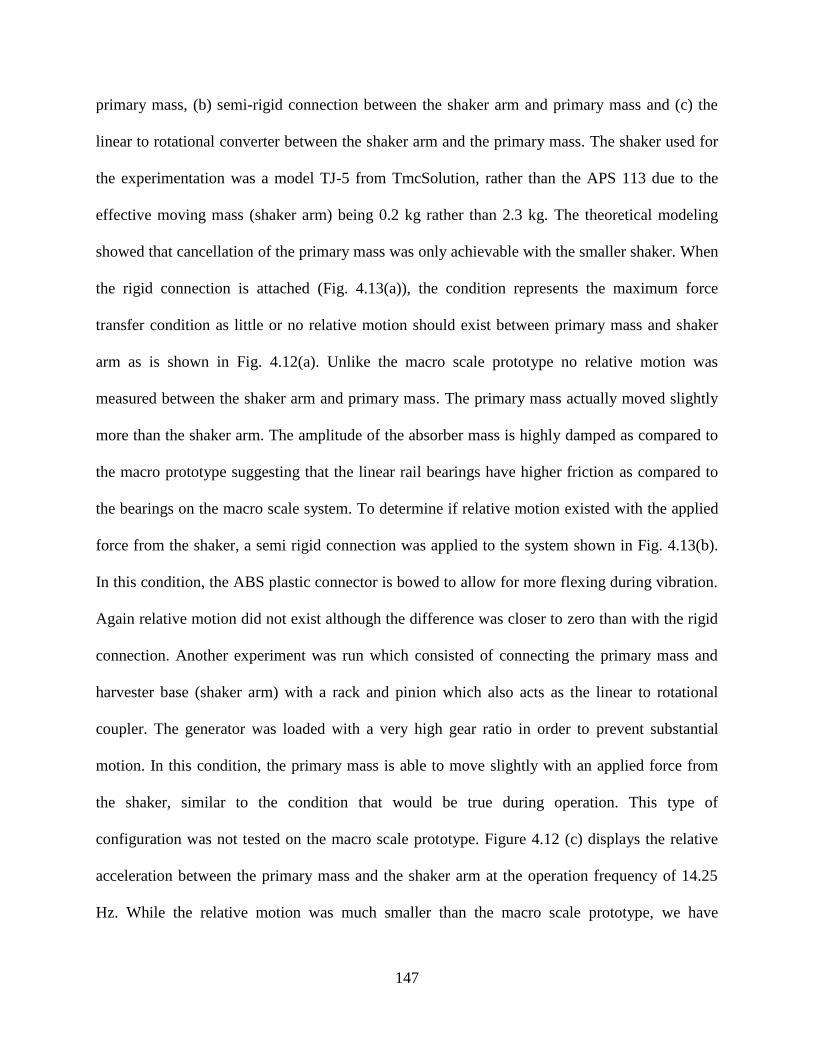
147
primary mass, (b) semi-rigid connection between the shaker arm and primary mass and (c) the
linear to rotational converter between the shaker arm and the primary mass. The shaker used for
the experimentation was a model TJ-5 from TmcSolution, rather than the APS 113 due to the
effective moving mass (shaker arm) being 0.2 kg rather than 2.3 kg. The theoretical modeling
showed that cancellation of the primary mass was only achievable with the smaller shaker. When
the rigid connection is attached (Fig. 4.13(a)), the condition represents the maximum force
transfer condition as little or no relative motion should exist between primary mass and shaker
arm as is shown in Fig. 4.12(a). Unlike the macro scale prototype no relative motion was
measured between the shaker arm and primary mass. The primary mass actually moved slightly
more than the shaker arm. The amplitude of the absorber mass is highly damped as compared to
the macro prototype suggesting that the linear rail bearings have higher friction as compared to
the bearings on the macro scale system. To determine if relative motion existed with the applied
force from the shaker, a semi rigid connection was applied to the system shown in Fig. 4.13(b).
In this condition, the ABS plastic connector is bowed to allow for more flexing during vibration.
Again relative motion did not exist although the difference was closer to zero than with the rigid
connection. Another experiment was run which consisted of connecting the primary mass and
harvester base (shaker arm) with a rack and pinion which also acts as the linear to rotational
coupler. The generator was loaded with a very high gear ratio in order to prevent substantial
motion. In this condition, the primary mass is able to move slightly with an applied force from
the shaker, similar to the condition that would be true during operation. This type of
configuration was not tested on the macro scale prototype. Figure 4.12 (c) displays the relative
acceleration between the primary mass and the shaker arm at the operation frequency of 14.25
Hz. While the relative motion was much smaller than the macro scale prototype, we have
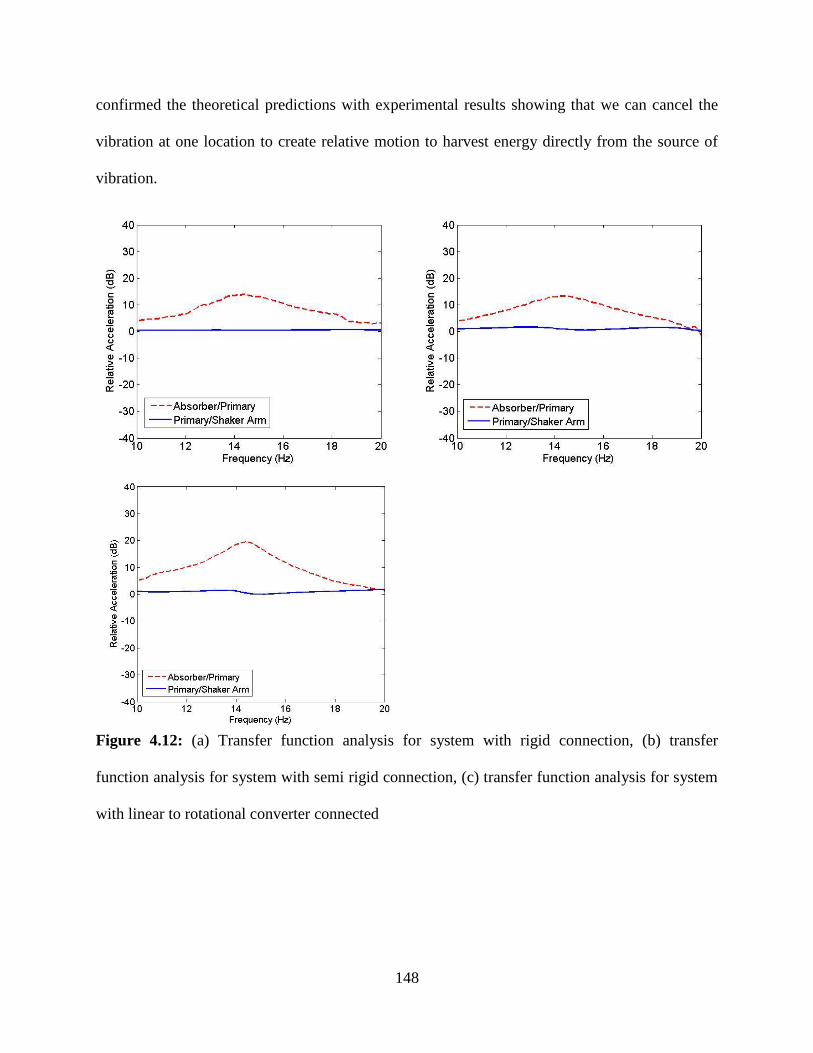
148
confirmed the theoretical predictions with experimental results showing that we can cancel the
vibration at one location to create relative motion to harvest energy directly from the source of
vibration.
Figure 4.12: (a) Transfer function analysis for system with rigid connection, (b) transfer
function analysis for system with semi rigid connection, (c) transfer function analysis for system
with linear to rotational converter connected
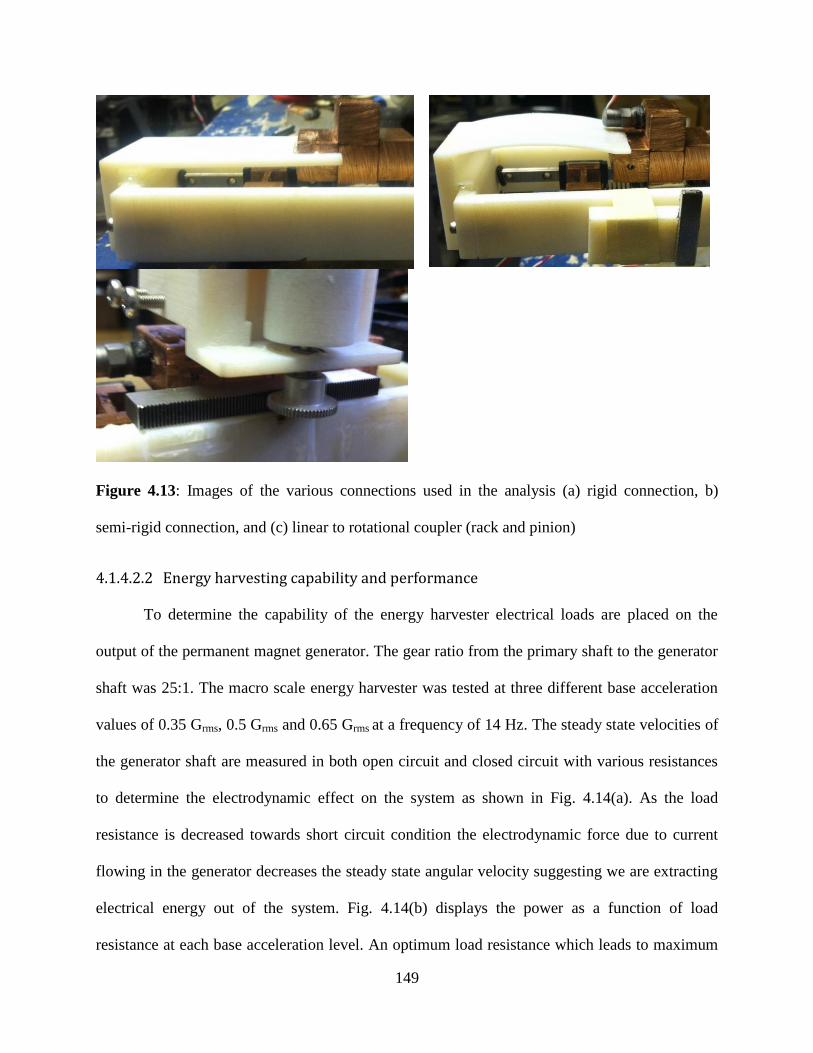
149
Figure 4.13: Images of the various connections used in the analysis (a) rigid connection, b)
semi-rigid connection, and (c) linear to rotational coupler (rack and pinion)
4.1.4.2.2 Energy harvesting capability and performance
To determine the capability of the energy harvester electrical loads are placed on the
output of the permanent magnet generator. The gear ratio from the primary shaft to the generator
shaft was 25:1. The macro scale energy harvester was tested at three different base acceleration
values of 0.35 Grms, 0.5 Grms and 0.65 Grms at a frequency of 14 Hz. The steady state velocities of
the generator shaft are measured in both open circuit and closed circuit with various resistances
to determine the electrodynamic effect on the system as shown in Fig. 4.14(a). As the load
resistance is decreased towards short circuit condition the electrodynamic force due to current
flowing in the generator decreases the steady state angular velocity suggesting we are extracting
electrical energy out of the system. Fig. 4.14(b) displays the power as a function of load
resistance at each base acceleration level. An optimum load resistance which leads to maximum

150
power extraction exists for each acceleration value. This optimum load resistance increases in
value as the base acceleration is increased. In the previous section we showed that relative
motion can be created from a combination of isolator and absorber. In this section the following
result shows that electrical energy can be extracted from this relative motion to realize the direct
vibration energy harvester concept.
Figure 4.14: (a) Rotational velocity of primary shaft as a function of resistive load (b) power as a
function of base acceleration
To evaluate the accuracy of the theoretical modeling we compare the experimental results
to the theoretical results. Figure 4.15 displays the results of the simulation with mass values of
the prototype. The trend of optimum load resistance matches well with the theoretical predictions
although the theoretical predictions over predict the power output. This is due to the simulations
assuming 100% linear to rotational energy conversion efficiency. For the analysis in the
theoretical section a factor of 0.62 was applied to the power output to account for the linear to
rotational motion lost.
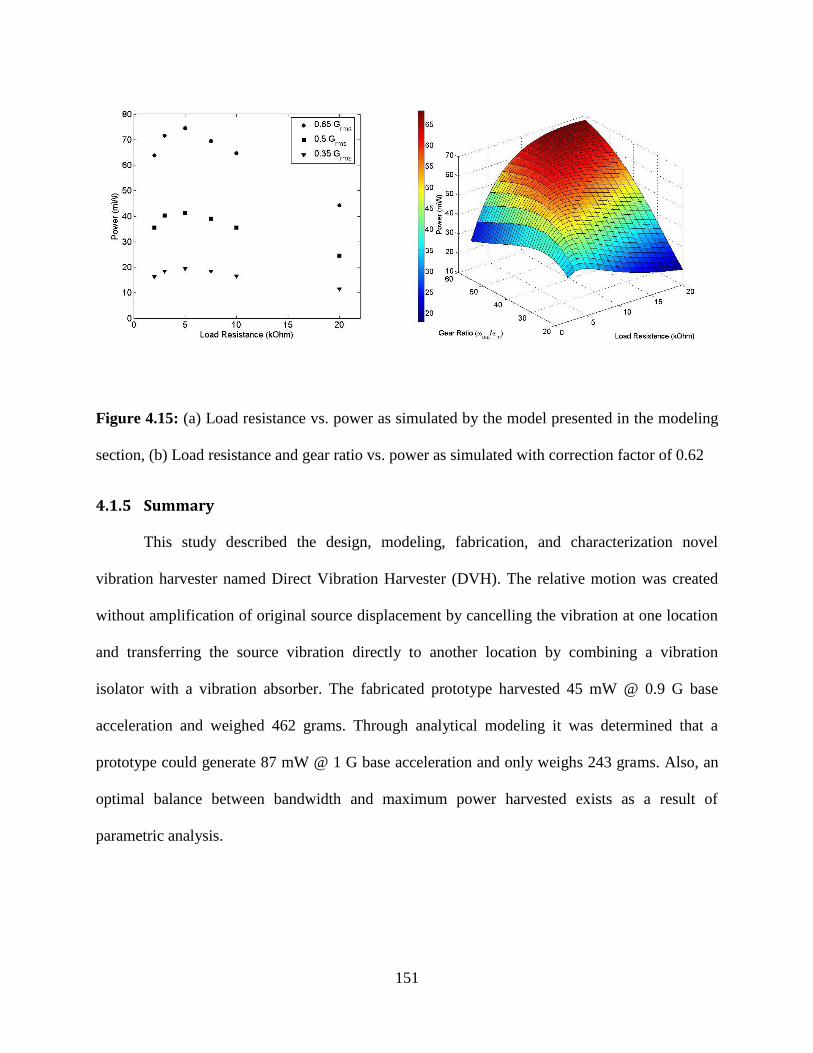
151
Figure 4.15: (a) Load resistance vs. power as simulated by the model presented in the modeling
section, (b) Load resistance and gear ratio vs. power as simulated with correction factor of 0.62
4.1.5 Summary
This study described the design, modeling, fabrication, and characterization novel
vibration harvester named Direct Vibration Harvester (DVH). The relative motion was created
without amplification of original source displacement by cancelling the vibration at one location
and transferring the source vibration directly to another location by combining a vibration
isolator with a vibration absorber. The fabricated prototype harvested 45 mW @ 0.9 G base
acceleration and weighed 462 grams. Through analytical modeling it was determined that a
prototype could generate 87 mW @ 1 G base acceleration and only weighs 243 grams. Also, an
optimal balance between bandwidth and maximum power harvested exists as a result of
parametric analysis.

152
4.2 Constant displacement and low frequency harvester utilizing a crank shaft to convert linear motion to rotational motion.
In the previous study, an attempt was made to utilize a crankshaft mechanism to apply the
force to the primary mass to create the relative motion between the base and the primary mass
and also convert the linear motion into rotational motion. During initial characterization it was
seen that cancellation of the motion of the primary mass was not achieved, although the harvester
was able to harvest high levels of power, 142 mW at 1.12 G and 10 Hz base excitation. The
operation concept of this harvester is different than DVH for a few reasons. The harvester needs
a constant displacement which is equal to the length of the crankshaft link. Therefore, the
performance in harvesting bandwidth is less than the DVH. Also the harvester requires a
mechanical kick start to initiate shaft rotation. Therefore, we analyze the crankshaft harvester in
a separate study. The performance is compared to the DVH and traditional harveters in terms of
bandwidth and power density.
153
4.2.1 Introduction
Linear to rotational conversion has investigated by several researchers in an effort to
enhance power density and bandwidth of vibration energy harvesters. Energy harvesting utilizing
linear to rotational motion was first invented by Seiko watch company in 1988 [102] The
concept consists of using a concentric mass which can rotate when imbalanced. Magnets can be
attached to the rotor and passed over coils to harvest electricity. While the concept was
developed much earlier, the first researchers to utilize linear to rotational conversion for
vibration energy harvesting were Spreeman et al. in 2006 [103]. The researchers developed an
energy harvester of total volume 1.5 cm3 and was capable of producing 0.4-3 mW for a vibration
amplitude ranging from 100-75 at frequencies ranging from 30 to 80 Hz. The harvester
consists of a pendulum with embedded magnets which can rotate over induction coils. The
prototype required an initial rotation, but at steady state follows the frequency of excitation
showing harvesting at a wide bandwidth. Many researchers have published on the eccentric mass
harvester focusing on efficient power management [104-106], powering biomedical devices
[107-109], harvesting energy from automobiles [110-111]. In each of these previous studies the
prototype eccentric mass was attached to a pendulum and used to rotate a rotor over a stator. In
this study we describe the design, modeling, and fabrication of a linear to rotational energy
harvester which utilizes a crank shaft to convert linear motion to rotational motion. One end of
the crank shaft is attached to the base of the harvester which can be mounted on a vibration body
and the other end is attached to a mass which is free to slide relative to the base on linear rail
bearings.
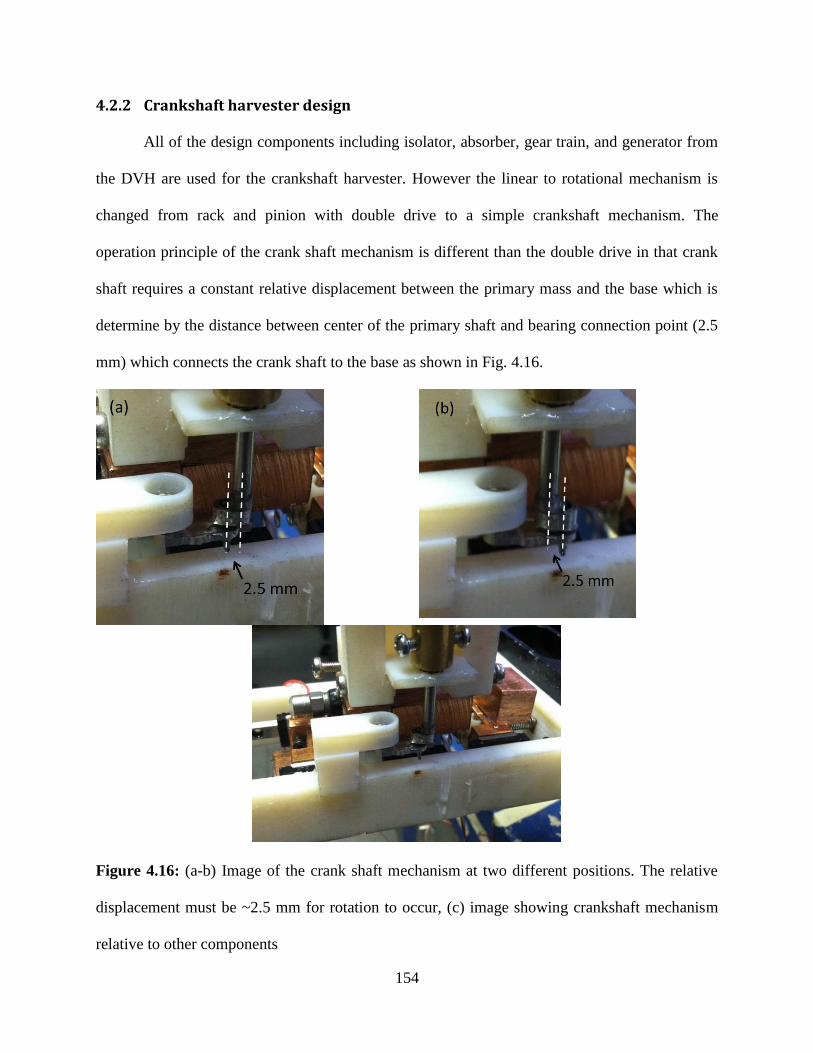
154
4.2.2 Crankshaft harvester design
All of the design components including isolator, absorber, gear train, and generator from
the DVH are used for the crankshaft harvester. However the linear to rotational mechanism is
changed from rack and pinion with double drive to a simple crankshaft mechanism. The
operation principle of the crank shaft mechanism is different than the double drive in that crank
shaft requires a constant relative displacement between the primary mass and the base which is
determine by the distance between center of the primary shaft and bearing connection point (2.5
mm) which connects the crank shaft to the base as shown in Fig. 4.16.
Figure 4.16: (a-b) Image of the crank shaft mechanism at two different positions. The relative
displacement must be ~2.5 mm for rotation to occur, (c) image showing crankshaft mechanism
relative to other components
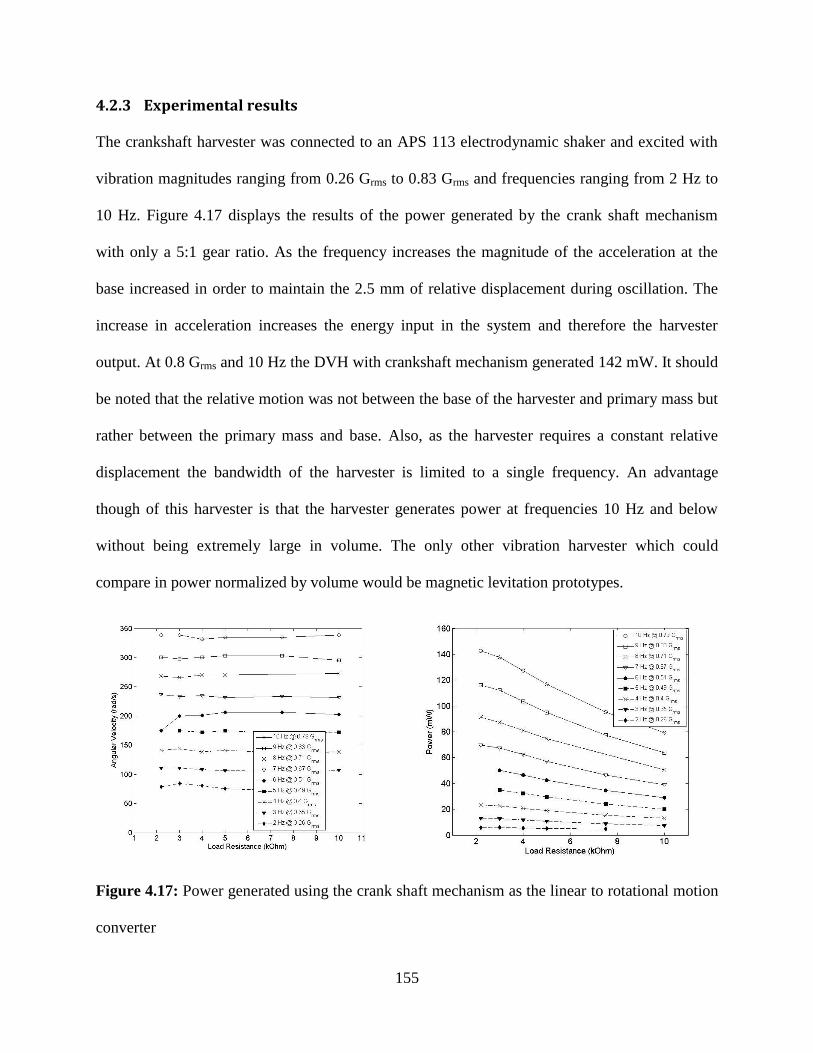
155
4.2.3 Experimental results
The crankshaft harvester was connected to an APS 113 electrodynamic shaker and excited with
vibration magnitudes ranging from 0.26 Grms to 0.83 Grms and frequencies ranging from 2 Hz to
10 Hz. Figure 4.17 displays the results of the power generated by the crank shaft mechanism
with only a 5:1 gear ratio. As the frequency increases the magnitude of the acceleration at the
base increased in order to maintain the 2.5 mm of relative displacement during oscillation. The
increase in acceleration increases the energy input in the system and therefore the harvester
output. At 0.8 Grms and 10 Hz the DVH with crankshaft mechanism generated 142 mW. It should
be noted that the relative motion was not between the base of the harvester and primary mass but
rather between the primary mass and base. Also, as the harvester requires a constant relative
displacement the bandwidth of the harvester is limited to a single frequency. An advantage
though of this harvester is that the harvester generates power at frequencies 10 Hz and below
without being extremely large in volume. The only other vibration harvester which could
compare in power normalized by volume would be magnetic levitation prototypes.
Figure 4.17: Power generated using the crank shaft mechanism as the linear to rotational motion
converter

156
4.2.4 Summary
In this study, we described the design and experimental characterization of a novel linear
to rotational energy harvester which differs than the traditional approach of mounting an
eccentric mass on a pendulum. The system utilizes a crankshaft connecting the vibration source
to a mass which can freely move linearly along guide rails. While the prototype required an
initial velocity or “kick” start, the prototype generated 142 mW at 0.79 Grms and 10 Hz showing
promise as an energy harvesting solution. To fully understand the capability of the prototype the
governing equations of motion should be derived and a parametric analysis should be conducted
in a future study.
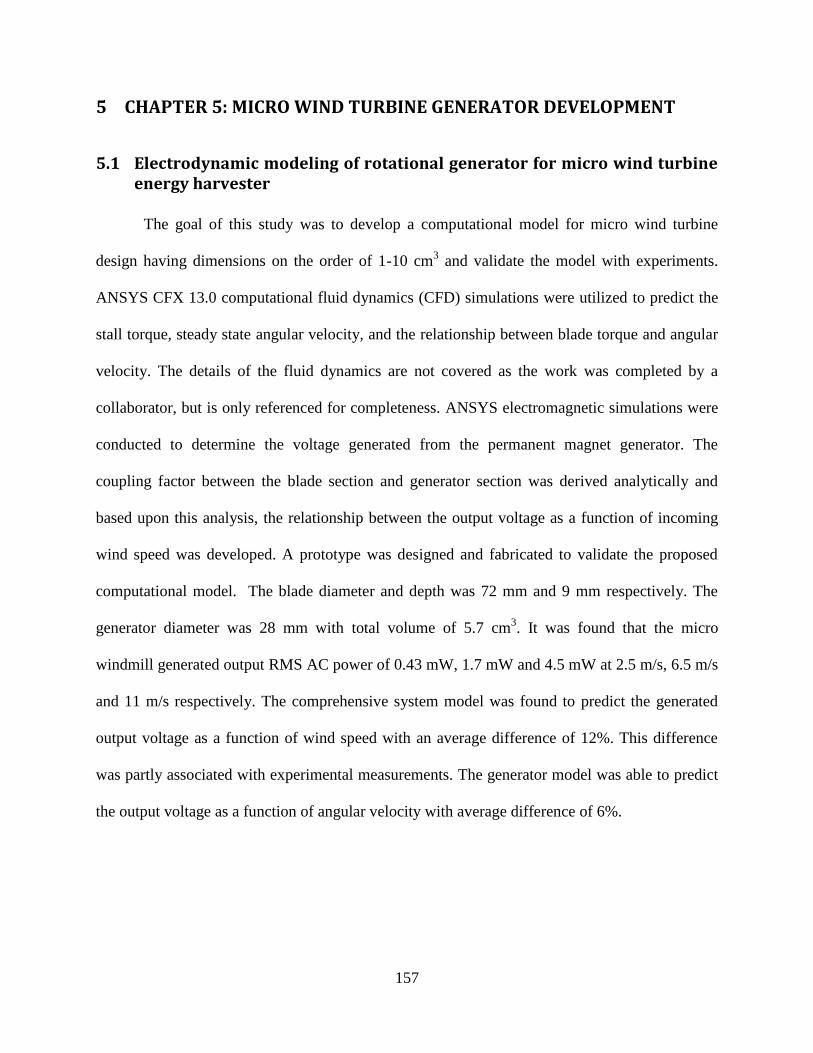
157
5 CHAPTER 5: MICRO WIND TURBINE GENERATOR DEVELOPMENT
5.1 Electrodynamic modeling of rotational generator for micro wind turbine energy harvester
The goal of this study was to develop a computational model for micro wind turbine
design having dimensions on the order of 1-10 cm3 and validate the model with experiments.
ANSYS CFX 13.0 computational fluid dynamics (CFD) simulations were utilized to predict the
stall torque, steady state angular velocity, and the relationship between blade torque and angular
velocity. The details of the fluid dynamics are not covered as the work was completed by a
collaborator, but is only referenced for completeness. ANSYS electromagnetic simulations were
conducted to determine the voltage generated from the permanent magnet generator. The
coupling factor between the blade section and generator section was derived analytically and
based upon this analysis, the relationship between the output voltage as a function of incoming
wind speed was developed. A prototype was designed and fabricated to validate the proposed
computational model. The blade diameter and depth was 72 mm and 9 mm respectively. The
generator diameter was 28 mm with total volume of 5.7 cm3. It was found that the micro
windmill generated output RMS AC power of 0.43 mW, 1.7 mW and 4.5 mW at 2.5 m/s, 6.5 m/s
and 11 m/s respectively. The comprehensive system model was found to predict the generated
output voltage as a function of wind speed with an average difference of 12%. This difference
was partly associated with experimental measurements. The generator model was able to predict
the output voltage as a function of angular velocity with average difference of 6%.

158
5.1.1 Introduction
The cost of energy has steadily increased over the past 40 years and even more rapidly
within the past decade, as shown in Fig. 5.1 [112]. With increasing energy cost the demand for
energy efficient residential and commercial buildings is growing. To this end, the US
Department of Energy is investing significant resources in Building Technologies Program to
incorporate both energy saving and energy generation concepts [113]. This is exemplified by The
Greater Philadelphia Innovation Cluster (GPIC) for Energy Efficient Buildings which received
$129 million from the Federal Government's Energy Regional Innovation Cluster (E-RIC)
Initiative (http://gpichub.org/). The award included $122 million from the U.S. DOE to create an
Energy Innovation Hub to develop innovative energy efficient building technologies, designs and
systems.
Figure 5.1: Timeline of energy cost for residential and commercial buildings. Data taken from
U.S. Energy Information Administration
Year
Av
era
ge
pri
ce
(Ce
nts
pe
rK
ilo
wa
tt-h
ou
r)
1970 1980 1990 2000 2010 20200
2
4
6
8
10
12
14
Residential
Commercial

159
Whole building design incorporates strategy to optimize the efficiency through control
system that actively diagnoses and modifies building conditions, such as localized climate and
lighting control. This requires distributed sensor network to collect real-time data and feedback
to the control loop. For example, temperature and lighting conditions of various rooms and
hallways within the building should be monitored in real-time. Establishing a wireless sensor
network to acquire, collect and organize the data eliminates the need for extensive wiring.
Currently wireless sensor nodes are predominately powered by batteries which have limited
lifetime. Depending upon the number and location of wireless sensor nodes required for
maintenance, replacing batteries can be impractical and expensive. Therefore there is critical
need to develop alternatives for powering the wireless sensor network.
In this paper, we propose the concept of micro turbines driven by HVAC flow. We have
determined that within HVAC ducts there is sufficient airflow to generate electricity for wireless
sensors. While placing the micro turbine energy harvesters within the flow will cause the HVAC
blower to consume slightly more energy to achieve same airflow, the gains in building energy
conservation through climate and lighting control should outweigh the losses in blower
efficiency. Typical flow speeds within HVAC ducts in various areas of a typical academic
building are shown in Fig. 5.2. Duct flow speeds can vary from 2 m/s to 13 m/s depending on the
location. The diameter of the HVAC ducts are also shown in Fig. 5.2 and were taken into
account for design of prototype discussed in this paper.
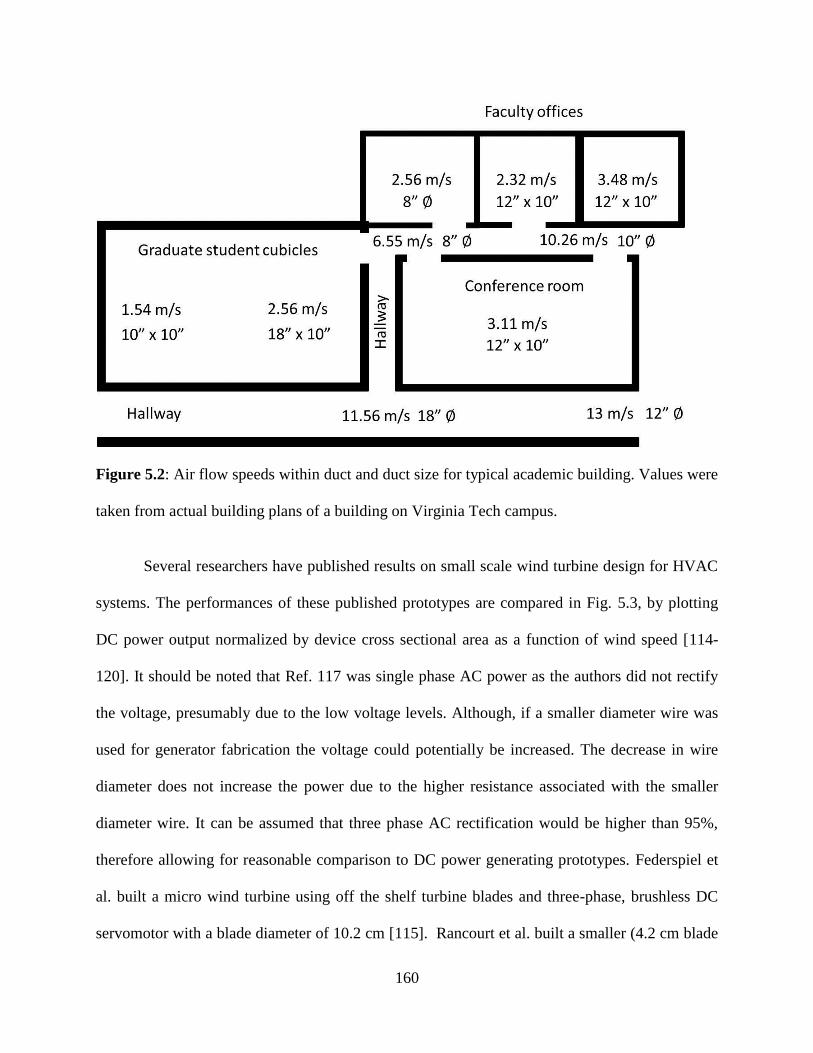
160
Figure 5.2: Air flow speeds within duct and duct size for typical academic building. Values were
taken from actual building plans of a building on Virginia Tech campus.
Several researchers have published results on small scale wind turbine design for HVAC
systems. The performances of these published prototypes are compared in Fig. 5.3, by plotting
DC power output normalized by device cross sectional area as a function of wind speed [114-
120]. It should be noted that Ref. 117 was single phase AC power as the authors did not rectify
the voltage, presumably due to the low voltage levels. Although, if a smaller diameter wire was
used for generator fabrication the voltage could potentially be increased. The decrease in wire
diameter does not increase the power due to the higher resistance associated with the smaller
diameter wire. It can be assumed that three phase AC rectification would be higher than 95%,
therefore allowing for reasonable comparison to DC power generating prototypes. Federspiel et
al. built a micro wind turbine using off the shelf turbine blades and three-phase, brushless DC
servomotor with a blade diameter of 10.2 cm [115]. Rancourt et al. built a smaller (4.2 cm blade
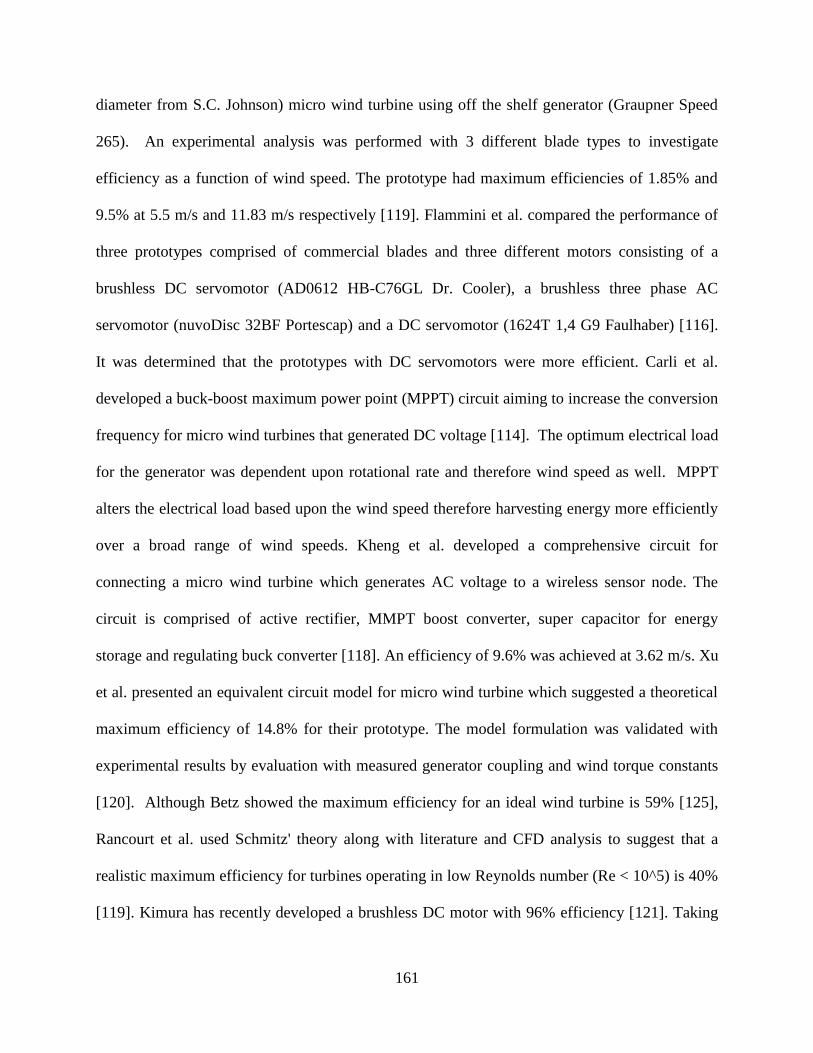
161
diameter from S.C. Johnson) micro wind turbine using off the shelf generator (Graupner Speed
265). An experimental analysis was performed with 3 different blade types to investigate
efficiency as a function of wind speed. The prototype had maximum efficiencies of 1.85% and
9.5% at 5.5 m/s and 11.83 m/s respectively [119]. Flammini et al. compared the performance of
three prototypes comprised of commercial blades and three different motors consisting of a
brushless DC servomotor (AD0612 HB-C76GL Dr. Cooler), a brushless three phase AC
servomotor (nuvoDisc 32BF Portescap) and a DC servomotor (1624T 1,4 G9 Faulhaber) [116].
It was determined that the prototypes with DC servomotors were more efficient. Carli et al.
developed a buck-boost maximum power point (MPPT) circuit aiming to increase the conversion
frequency for micro wind turbines that generated DC voltage [114]. The optimum electrical load
for the generator was dependent upon rotational rate and therefore wind speed as well. MPPT
alters the electrical load based upon the wind speed therefore harvesting energy more efficiently
over a broad range of wind speeds. Kheng et al. developed a comprehensive circuit for
connecting a micro wind turbine which generates AC voltage to a wireless sensor node. The
circuit is comprised of active rectifier, MMPT boost converter, super capacitor for energy
storage and regulating buck converter [118]. An efficiency of 9.6% was achieved at 3.62 m/s. Xu
et al. presented an equivalent circuit model for micro wind turbine which suggested a theoretical
maximum efficiency of 14.8% for their prototype. The model formulation was validated with
experimental results by evaluation with measured generator coupling and wind torque constants
[120]. Although Betz showed the maximum efficiency for an ideal wind turbine is 59% [125],
Rancourt et al. used Schmitz' theory along with literature and CFD analysis to suggest that a
realistic maximum efficiency for turbines operating in low Reynolds number (Re < 10^5) is 40%
[119]. Kimura has recently developed a brushless DC motor with 96% efficiency [121]. Taking
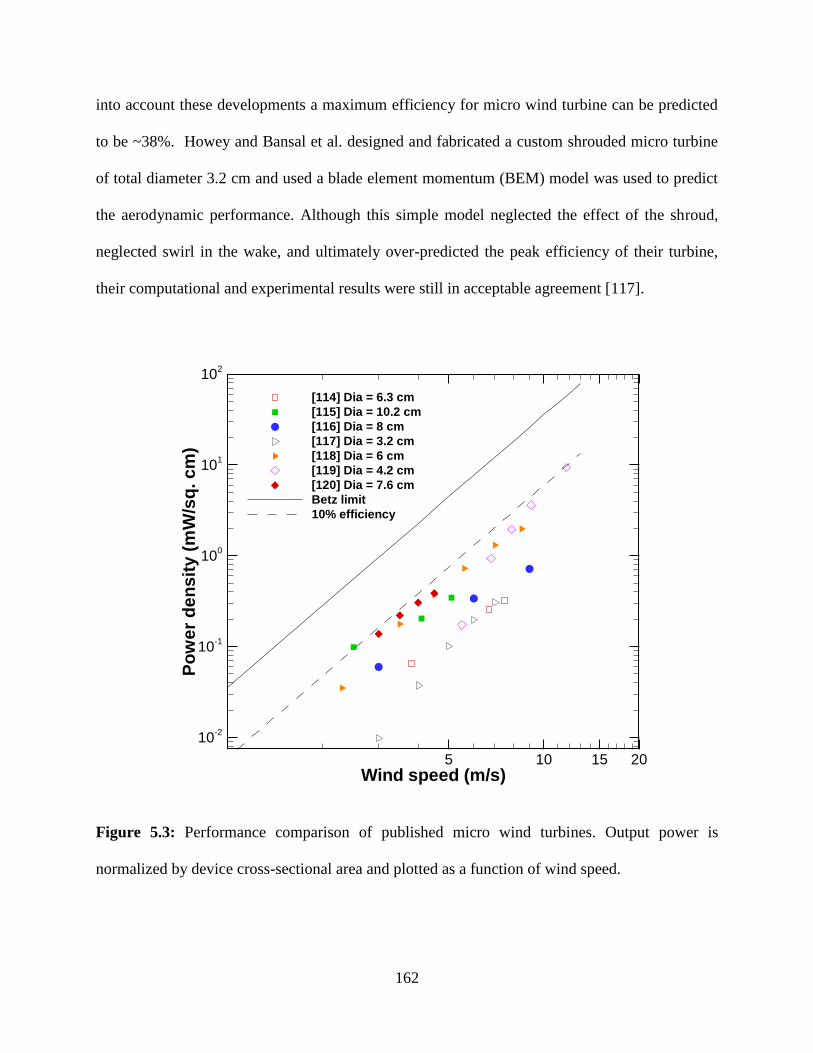
162
into account these developments a maximum efficiency for micro wind turbine can be predicted
to be ~38%. Howey and Bansal et al. designed and fabricated a custom shrouded micro turbine
of total diameter 3.2 cm and used a blade element momentum (BEM) model was used to predict
the aerodynamic performance. Although this simple model neglected the effect of the shroud,
neglected swirl in the wake, and ultimately over-predicted the peak efficiency of their turbine,
their computational and experimental results were still in acceptable agreement [117].
Figure 5.3: Performance comparison of published micro wind turbines. Output power is
normalized by device cross-sectional area and plotted as a function of wind speed.
Wind speed (m/s)
Po
we
rd
en
sit
y(m
W/s
q.c
m)
5 10 15 20
10-2
10-1
100
101
102
[114] Dia = 6.3 cm
[115] Dia = 10.2 cm
[116] Dia = 8 cm
[117] Dia = 3.2 cm
[118] Dia = 6 cm
[119] Dia = 4.2 cm
[120] Dia = 7.6 cm
Betz limit
10% efficiency

163
In this study, we attempt to develop and validate a comprehensive system level
computational model addressing all components of a micro wind turbine. The model combines
computational analysis conducted using ANSYS software with rotational dynamics and
electromagnetic induction mathematics. For the blade section, CFD simulations performed with
ANSYS CFX 13.0 were used to predict stall torque, steady state angular velocity and the
relationship between blade torque and angular velocity. ANSYS electromagnetic simulations
were used to characterize the spatial distribution of magnetic field flux density within generator
section. The transformation factor that couples the angular velocity with the generated voltage
was derived, allowing for investigation of generator influence on torque generated from blade
section. The coupling term allows for the prediction of voltage and power as function of
incoming wind speed. To validate the model a micro wind turbine was designed and fabricated
with blade diameter of 72 mm and generator volume of 5.7 cm3. The prototype was tested in a
wind tunnel for a wide range of input flow velocities corresponding to Fig. 5.2. The results from
the simulation are compared to experimental data which shows good agreement with an average
difference of 12%. This difference was partly associated with the experimental measurements as
the generator model predicted voltage as a function of angular velocity with average difference
of 6%.
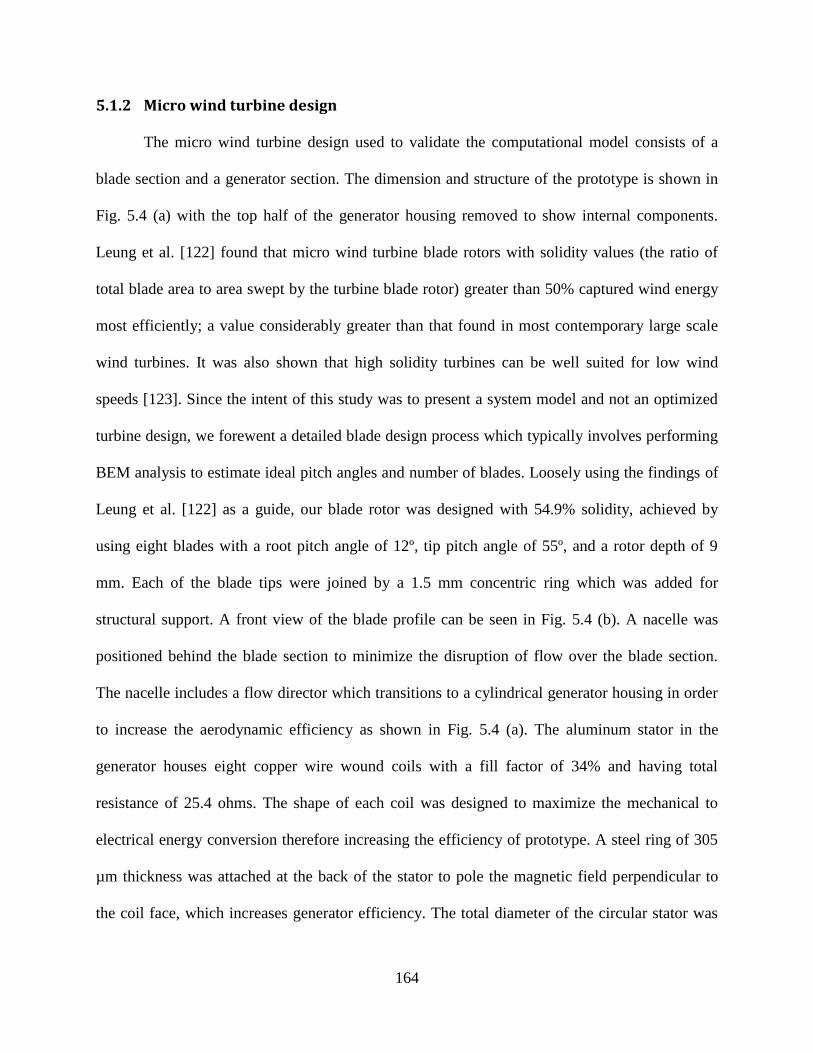
164
5.1.2 Micro wind turbine design
The micro wind turbine design used to validate the computational model consists of a
blade section and a generator section. The dimension and structure of the prototype is shown in
Fig. 5.4 (a) with the top half of the generator housing removed to show internal components.
Leung et al. [122] found that micro wind turbine blade rotors with solidity values (the ratio of
total blade area to area swept by the turbine blade rotor) greater than 50% captured wind energy
most efficiently; a value considerably greater than that found in most contemporary large scale
wind turbines. It was also shown that high solidity turbines can be well suited for low wind
speeds [123]. Since the intent of this study was to present a system model and not an optimized
turbine design, we forewent a detailed blade design process which typically involves performing
BEM analysis to estimate ideal pitch angles and number of blades. Loosely using the findings of
Leung et al. [122] as a guide, our blade rotor was designed with 54.9% solidity, achieved by
using eight blades with a root pitch angle of 12º, tip pitch angle of 55º, and a rotor depth of 9
mm. Each of the blade tips were joined by a 1.5 mm concentric ring which was added for
structural support. A front view of the blade profile can be seen in Fig. 5.4 (b). A nacelle was
positioned behind the blade section to minimize the disruption of flow over the blade section.
The nacelle includes a flow director which transitions to a cylindrical generator housing in order
to increase the aerodynamic efficiency as shown in Fig. 5.4 (a). The aluminum stator in the
generator houses eight copper wire wound coils with a fill factor of 34% and having total
resistance of 25.4 ohms. The shape of each coil was designed to maximize the mechanical to
electrical energy conversion therefore increasing the efficiency of prototype. A steel ring of 305
µm thickness was attached at the back of the stator to pole the magnetic field perpendicular to
the coil face, which increases generator efficiency. The total diameter of the circular stator was
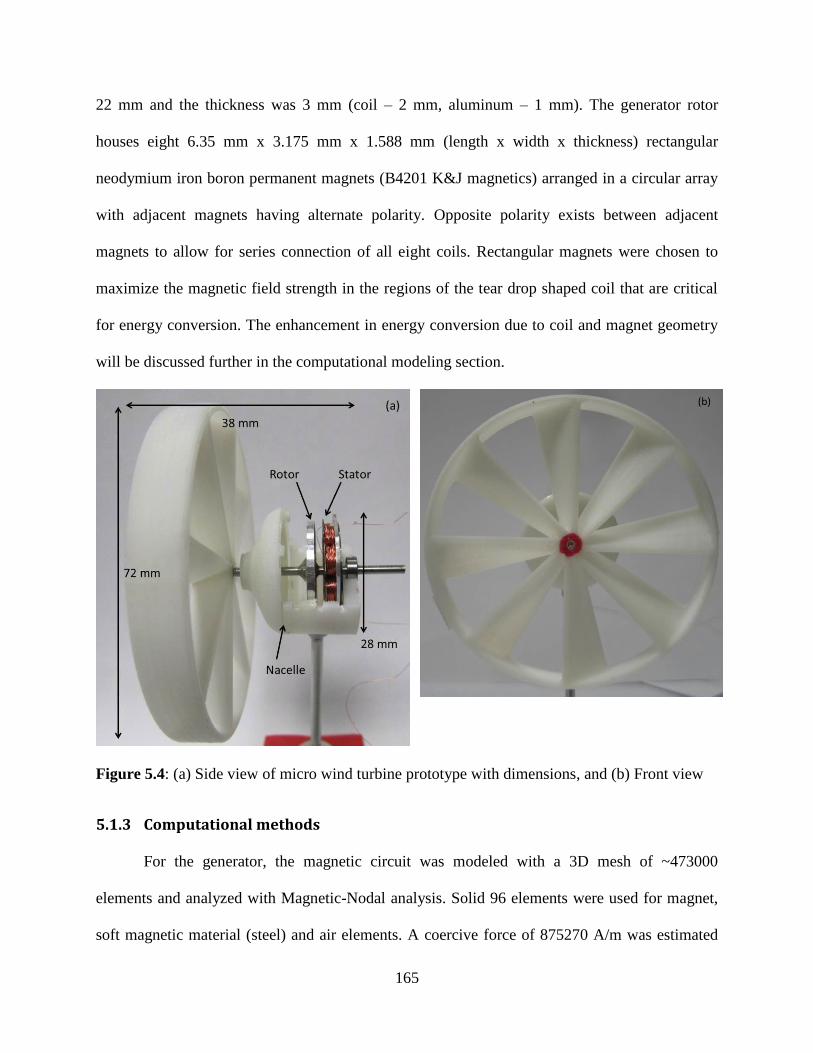
165
22 mm and the thickness was 3 mm (coil – 2 mm, aluminum – 1 mm). The generator rotor
houses eight 6.35 mm x 3.175 mm x 1.588 mm (length x width x thickness) rectangular
neodymium iron boron permanent magnets (B4201 K&J magnetics) arranged in a circular array
with adjacent magnets having alternate polarity. Opposite polarity exists between adjacent
magnets to allow for series connection of all eight coils. Rectangular magnets were chosen to
maximize the magnetic field strength in the regions of the tear drop shaped coil that are critical
for energy conversion. The enhancement in energy conversion due to coil and magnet geometry
will be discussed further in the computational modeling section.
Figure 5.4: (a) Side view of micro wind turbine prototype with dimensions, and (b) Front view
5.1.3 Computational methods
For the generator, the magnetic circuit was modeled with a 3D mesh of ~473000
elements and analyzed with Magnetic-Nodal analysis. Solid 96 elements were used for magnet,
soft magnetic material (steel) and air elements. A coercive force of 875270 A/m was estimated
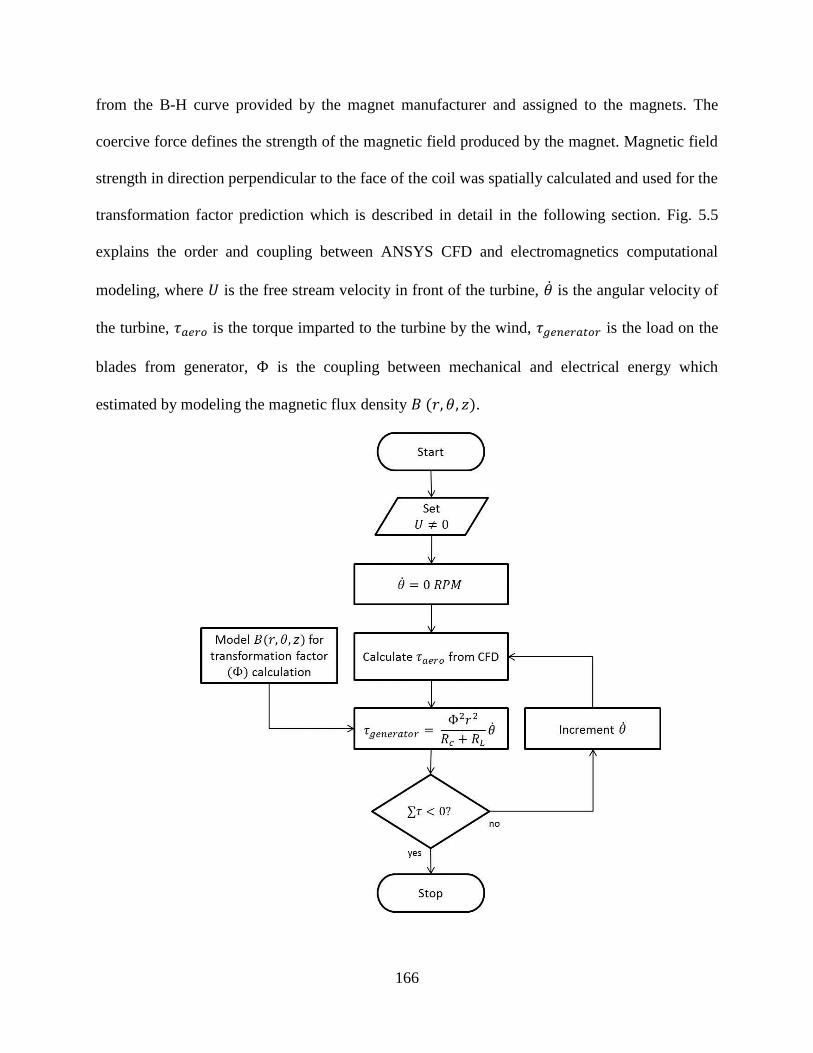
166
from the B-H curve provided by the magnet manufacturer and assigned to the magnets. The
coercive force defines the strength of the magnetic field produced by the magnet. Magnetic field
strength in direction perpendicular to the face of the coil was spatially calculated and used for the
transformation factor prediction which is described in detail in the following section. Fig. 5.5
explains the order and coupling between ANSYS CFD and electromagnetics computational
modeling, where is the free stream velocity in front of the turbine, is the angular velocity of
the turbine, is the torque imparted to the turbine by the wind, is the load on the
blades from generator, is the coupling between mechanical and electrical energy which
estimated by modeling the magnetic flux density ( ).

167
Figure 5.5. Process for obtaining CFD results for a given wind speed. is the free stream
velocity in front of the turbine, is the angular velocity of the turbine, is the torque
imparted to the turbine by the wind, is the load on the blades from generator, is the
coupling between mechanical and electrical energy which estimated by modeling the magnetic
flux density ( )
5.1.4 Analytical model for micro wind turbine harvester
In order to develop a computational model for the entire wind turbine system, the
governing equations for each system were derived. When the turbine is stationary, the maximal
torque or stall torque is produced on the blades due to the angle of attack also being
maximal. Local angle of attack can be defined as:
(5.3)
where is the local pitch angle and , the angle between the rotor plane and the relative
velocity, is given by
( ( )
( )) (5.4)
at radius where and are the axial and tangential induction factors. These factors represent
the interaction between the flow and the rotating blade rotor: is the fractional decrease in
velocity as the free stream flow is decelerated axially, and is the fractional increase in
tangential velocity due to the reaction from torque being imparted to the rotor. As increases,
the angle of attack becomes shallower and torque declines, eventually balancing with losses due
to drag. At this operating point where the sum of torques is equal to zero, all harvested wind
energy has been converted to rotational energy and steady state angular velocity is reached.
The equilibrium at is given by Eq. (5.5):
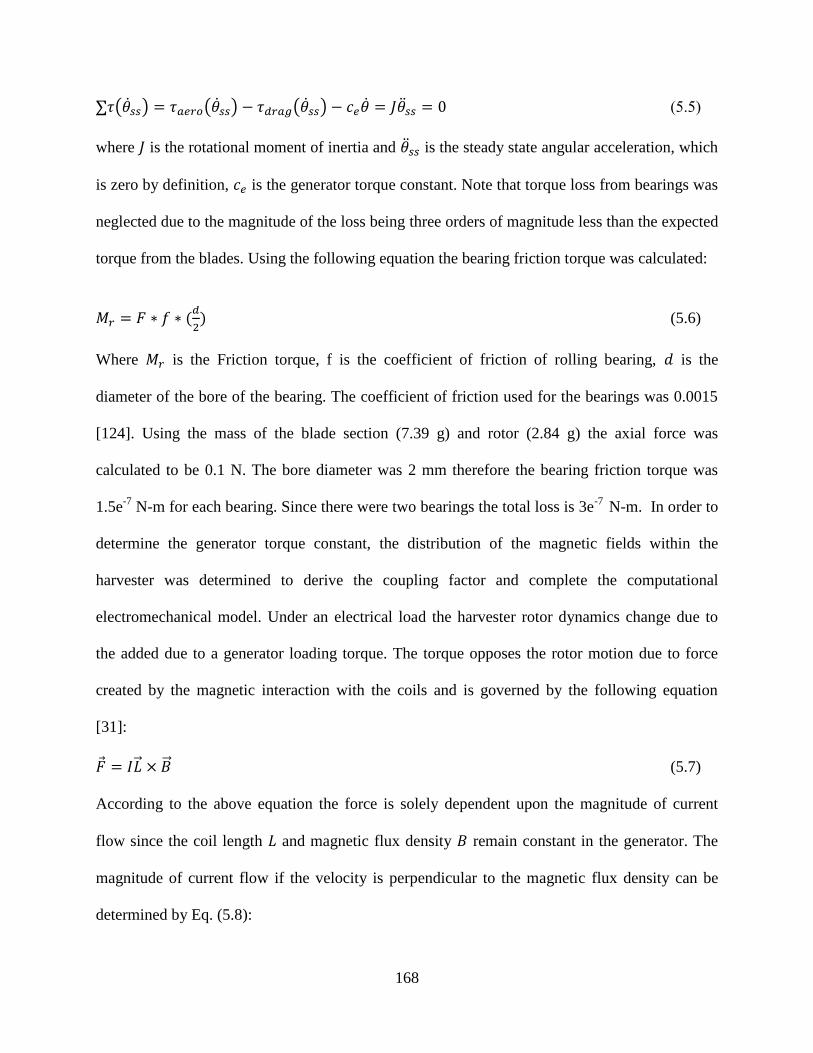
168
∑ ( ) ( ) ( ) (5.5)
where is the rotational moment of inertia and is the steady state angular acceleration, which
is zero by definition, is the generator torque constant. Note that torque loss from bearings was
neglected due to the magnitude of the loss being three orders of magnitude less than the expected
torque from the blades. Using the following equation the bearing friction torque was calculated:
(
) (5.6)
Where is the Friction torque, f is the coefficient of friction of rolling bearing, is the
diameter of the bore of the bearing. The coefficient of friction used for the bearings was 0.0015
[124]. Using the mass of the blade section (7.39 g) and rotor (2.84 g) the axial force was
calculated to be 0.1 N. The bore diameter was 2 mm therefore the bearing friction torque was
1.5e-7
N-m for each bearing. Since there were two bearings the total loss is 3e-7
N-m. In order to
determine the generator torque constant, the distribution of the magnetic fields within the
harvester was determined to derive the coupling factor and complete the computational
electromechanical model. Under an electrical load the harvester rotor dynamics change due to
the added due to a generator loading torque. The torque opposes the rotor motion due to force
created by the magnetic interaction with the coils and is governed by the following equation
[31]:
(5.7)
According to the above equation the force is solely dependent upon the magnitude of current
flow since the coil length and magnetic flux density remain constant in the generator. The
magnitude of current flow if the velocity is perpendicular to the magnetic flux density can be
determined by Eq. (5.8):
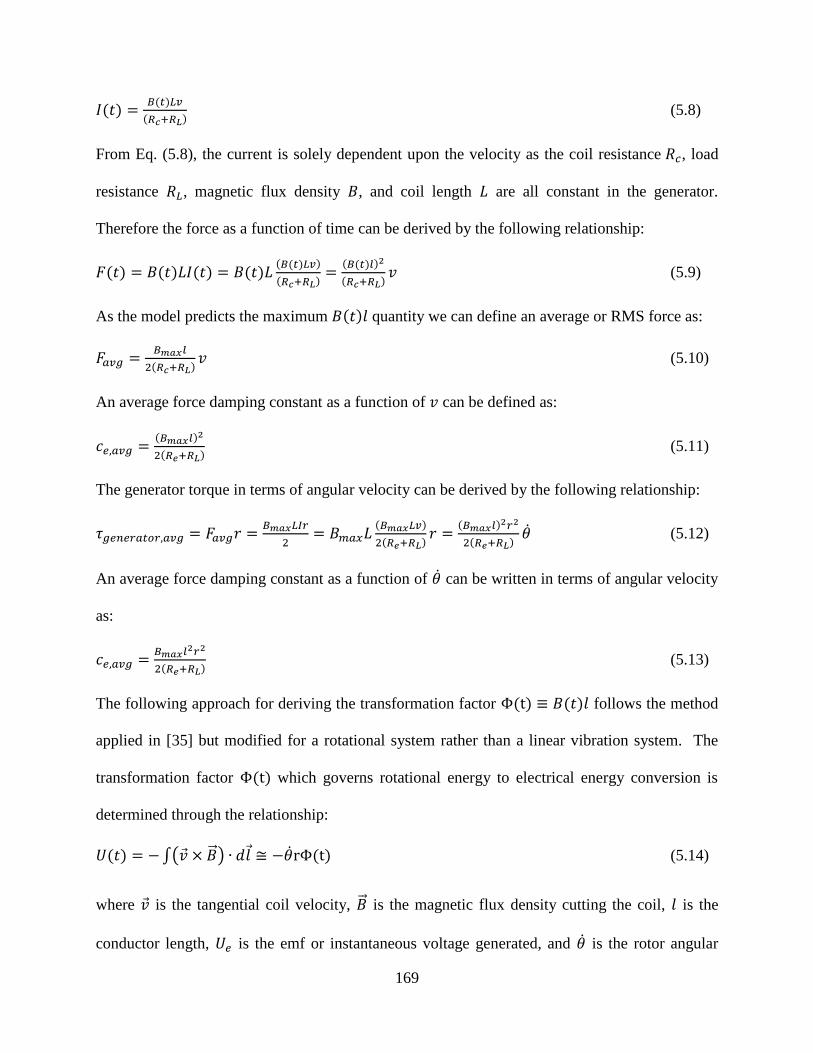
169
( ) ( )
( ) (5.8)
From Eq. (5.8), the current is solely dependent upon the velocity as the coil resistance , load
resistance , magnetic flux density , and coil length are all constant in the generator.
Therefore the force as a function of time can be derived by the following relationship:
( ) ( ) ( ) ( ) ( ( ) )
( )
( ( ) )
( ) (5.9)
As the model predicts the maximum ( ) quantity we can define an average or RMS force as:
( ) (5.10)
An average force damping constant as a function of can be defined as:
( )
( ) (5.11)
The generator torque in terms of angular velocity can be derived by the following relationship:
( )
( )
( )
( ) (5.12)
An average force damping constant as a function of can be written in terms of angular velocity
as:
( ) (5.13)
The following approach for deriving the transformation factor ( ) ( ) follows the method
applied in [35] but modified for a rotational system rather than a linear vibration system. The
transformation factor ( ) which governs rotational energy to electrical energy conversion is
determined through the relationship:
( ) ∫( ) ( ) (5.14)
where is the tangential coil velocity, is the magnetic flux density cutting the coil, is the
conductor length, is the emf or instantaneous voltage generated, and is the rotor angular

170
velocity. By assuming that the coil velocity is orthogonal to magnetic field vectors, the line
integral in Eq. (5.13) reduces to Eq. (5.14):
( ) ∫ ( )( ) ( )
( ( )) (5.15)
where is the angle between and the differential conductor length , are
coordinates within the coil volume, ( ) is the distance from the center of rotation to the
coordinate ( ), and is the radius at edge of rotor. By discretizing the coil volume, Eq.
(5.14) is reduced to Eq. (5.15) as:
( ) ∑ ( )( ) ( ( )
) ( ( )) (5.16)
(5.17)
In order to determine ( )( )in Eq. (5.15), the spatial variation in magnetic flux density
within the coil volume was evaluated by using ANSYS electromagnetics. Before analyzing the
variation in magnetic flux density in the and directions, we needed to determine how many
sections the coil volume should be discretized in the z direction. Fig. 5.6 displays the average
magnetic flux density of all sections in z direction versus number of sections in z direction. It
was determined that the difference between 3 and 4 sections was less than 0.01%, therefore for
this analysis the coil volume was split into 3 equal sections in the z direction for the ANSYS
analysis.
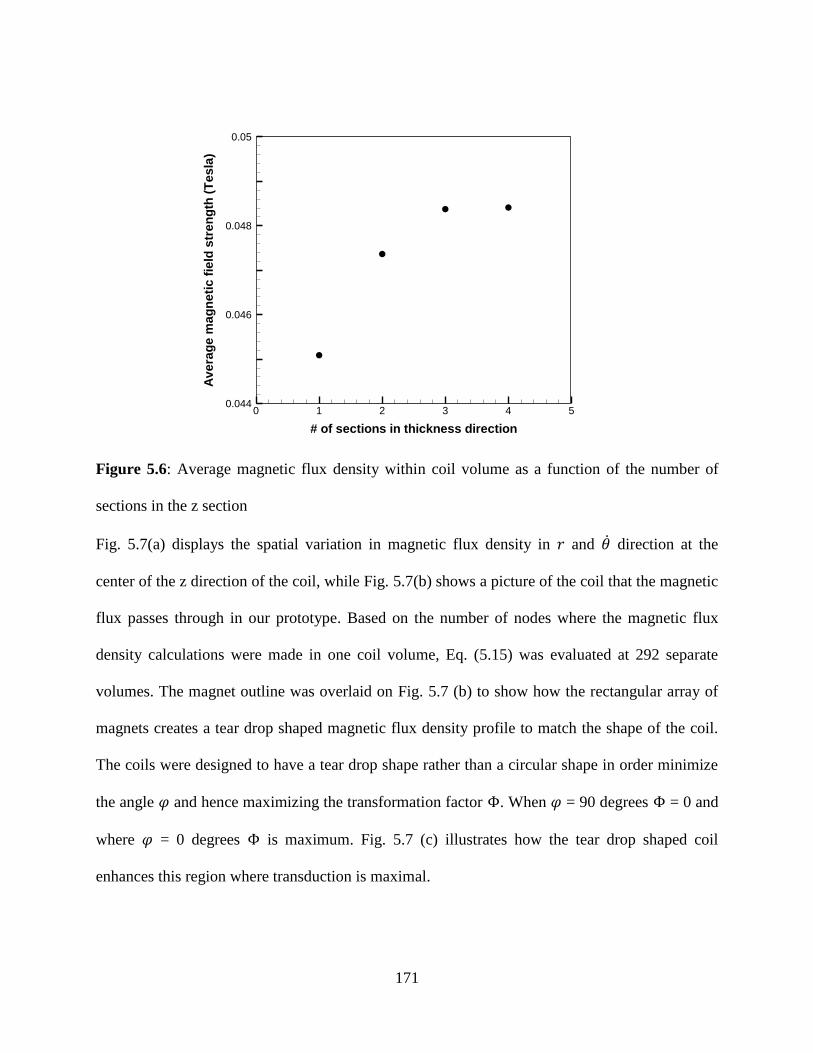
171
Figure 5.6: Average magnetic flux density within coil volume as a function of the number of
sections in the z section
Fig. 5.7(a) displays the spatial variation in magnetic flux density in and direction at the
center of the z direction of the coil, while Fig. 5.7(b) shows a picture of the coil that the magnetic
flux passes through in our prototype. Based on the number of nodes where the magnetic flux
density calculations were made in one coil volume, Eq. (5.15) was evaluated at 292 separate
volumes. The magnet outline was overlaid on Fig. 5.7 (b) to show how the rectangular array of
magnets creates a tear drop shaped magnetic flux density profile to match the shape of the coil.
The coils were designed to have a tear drop shape rather than a circular shape in order minimize
the angle and hence maximizing the transformation factor . When = 90 degrees = 0 and
where = 0 degrees is maximum. Fig. 5.7 (c) illustrates how the tear drop shaped coil
enhances this region where transduction is maximal.
# of sections in thickness direction
Av
era
ge
ma
gn
eti
cfi
eld
str
en
gth
(Te
sla
)
0 1 2 3 4 50.044
0.046
0.048
0.05
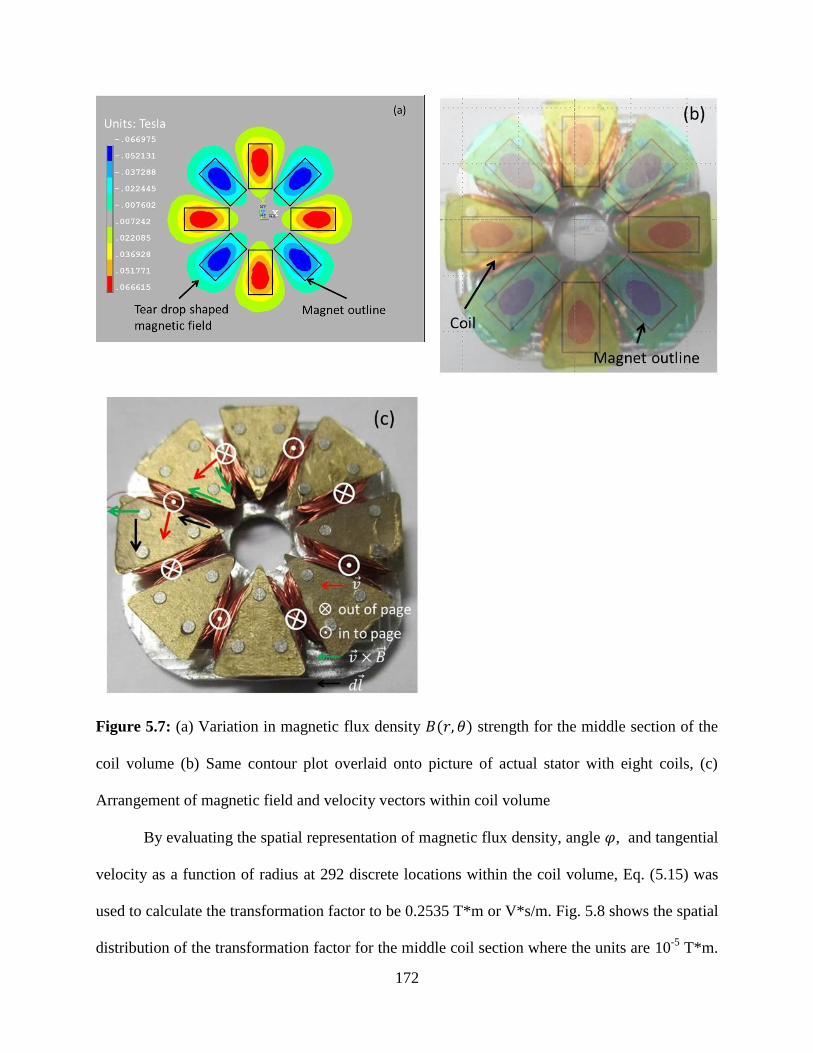
172
Figure 5.7: (a) Variation in magnetic flux density ( ) strength for the middle section of the
coil volume (b) Same contour plot overlaid onto picture of actual stator with eight coils, (c)
Arrangement of magnetic field and velocity vectors within coil volume
By evaluating the spatial representation of magnetic flux density, angle , and tangential
velocity as a function of radius at 292 discrete locations within the coil volume, Eq. (5.15) was
used to calculate the transformation factor to be 0.2535 T*m or V*s/m. Fig. 5.8 shows the spatial
distribution of the transformation factor for the middle coil section where the units are 10-5
T*m.
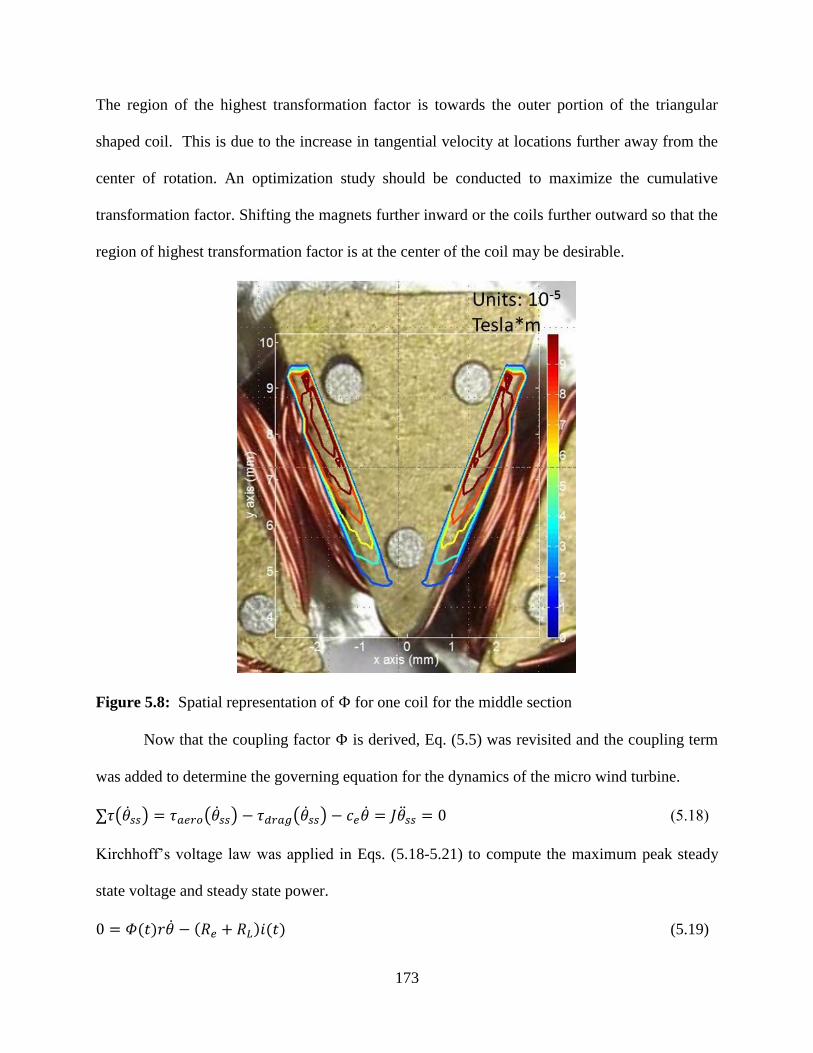
173
The region of the highest transformation factor is towards the outer portion of the triangular
shaped coil. This is due to the increase in tangential velocity at locations further away from the
center of rotation. An optimization study should be conducted to maximize the cumulative
transformation factor. Shifting the magnets further inward or the coils further outward so that the
region of highest transformation factor is at the center of the coil may be desirable.
Figure 5.8: Spatial representation of for one coil for the middle section
Now that the coupling factor is derived, Eq. (5.5) was revisited and the coupling term
was added to determine the governing equation for the dynamics of the micro wind turbine.
∑ ( ) ( ) ( ) (5.18)
Kirchhoff’s voltage law was applied in Eqs. (5.18-5.21) to compute the maximum peak steady
state voltage and steady state power.
( ) ( ) ( ) (5.19)
174
( ) ( )
(5.20)
( ) ( ) ( )
(5.21)
( ) ( ) ( )
( ) (5.22)
With the assumption that ( ) has sinusoidal variation the average power can be calculated as:
( ) (5.23)
5.1.5 Experimental setup
In order to guide the development of the theoretical model, the prototype micro wind
turbine was characterized in an open return wind tunnel. Figure 5.9 shows the setup at the test
section, which measured 14” wide and 5.375” tall. The rotational velocity was measured using a
Shimpo DT-209X tachometer with software acquiring and recording measurements in real time.
Wind tunnel velocity was calculated from dynamic pressure measured by two different methods:
with a Pitot-static tube and with dual static ports mounted on opposite walls at the entrance of the
test section. The differential pressure from the Pitot-static tube was measured with a model 668-5
transducer from Dwyer Instruments, Inc. The Dwyer transducer measurement range was 0 – 5
in. W.C. with 1% accuracy. The pressure difference between the static ports and atmosphere
(corrected for room temperature) was measured with a model 267 transducer from Setra
Systems, Inc. The Setra transducer measurement was 0 – 2.5 in. W.C with 0.25% accuracy. Due
to the better accuracy and more useful measurement range, the Setra transducer and static ports
were used. It should be noted that the velocity calculated from these static pressure
measurements was the average velocity across the profile and would be lower than the free
stream velocity, although this error may be negligible because of their location at the beginning
of the test section where the boundary layer is thin. Voltage generated by the harvester was
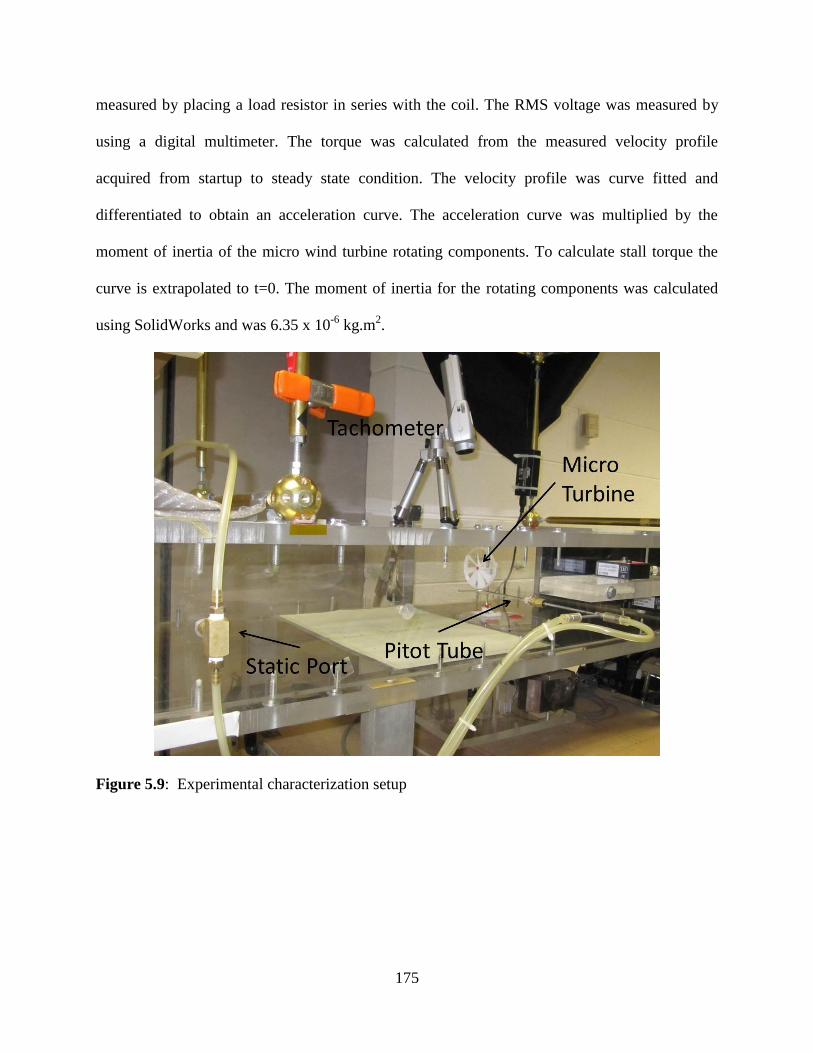
175
measured by placing a load resistor in series with the coil. The RMS voltage was measured by
using a digital multimeter. The torque was calculated from the measured velocity profile
acquired from startup to steady state condition. The velocity profile was curve fitted and
differentiated to obtain an acceleration curve. The acceleration curve was multiplied by the
moment of inertia of the micro wind turbine rotating components. To calculate stall torque the
curve is extrapolated to t=0. The moment of inertia for the rotating components was calculated
using SolidWorks and was 6.35 x 10⁻⁶
kg.m2.
Figure 5.9: Experimental characterization setup
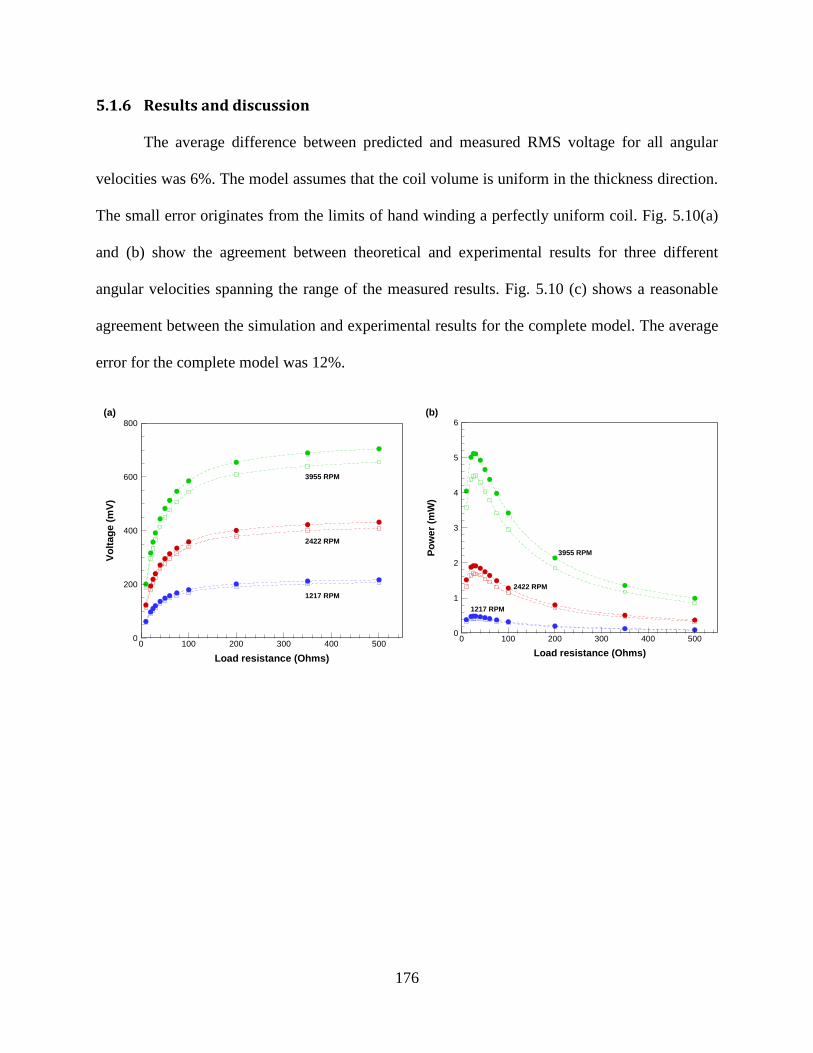
176
5.1.6 Results and discussion
The average difference between predicted and measured RMS voltage for all angular
velocities was 6%. The model assumes that the coil volume is uniform in the thickness direction.
The small error originates from the limits of hand winding a perfectly uniform coil. Fig. 5.10(a)
and (b) show the agreement between theoretical and experimental results for three different
angular velocities spanning the range of the measured results. Fig. 5.10 (c) shows a reasonable
agreement between the simulation and experimental results for the complete model. The average
error for the complete model was 12%.
Load resistance (Ohms)
Vo
lta
ge
(mV
)
0 100 200 300 400 5000
200
400
600
800
3955 RPM
2422 RPM
1217 RPM
(a)
Load resistance (Ohms)
Po
we
r(m
W)
0 100 200 300 400 5000
1
2
3
4
5
6
3955 RPM
2422 RPM
1217 RPM
(b)
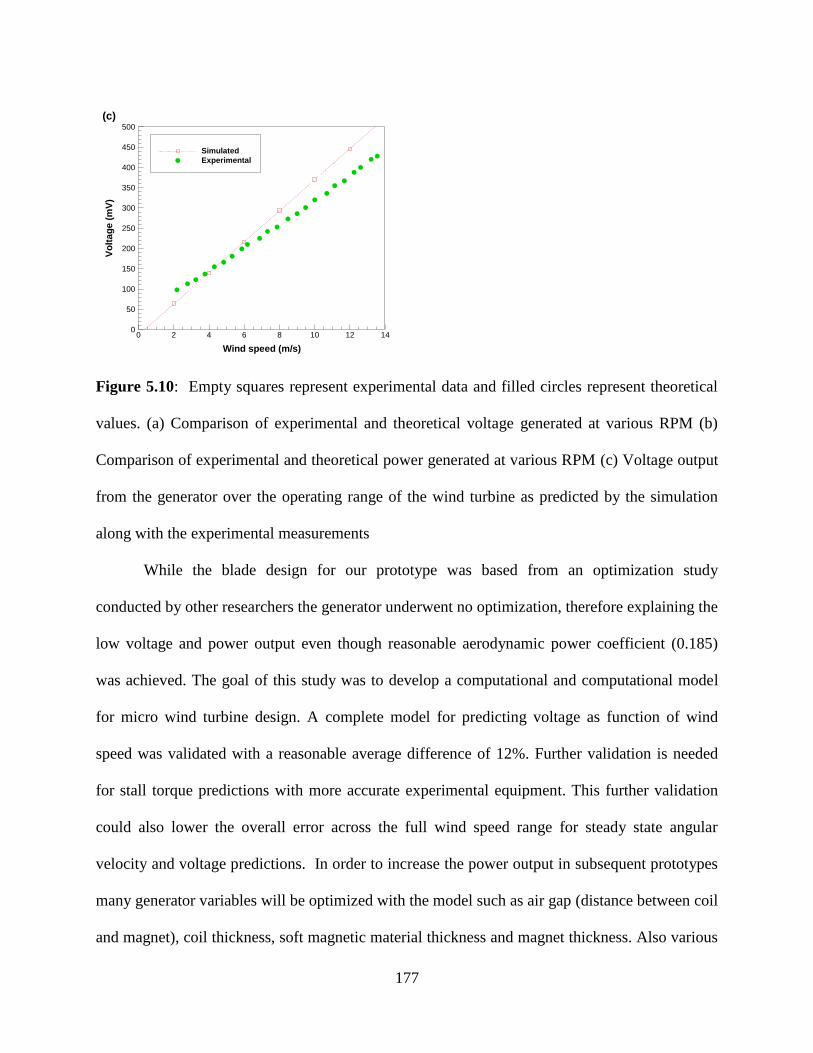
177
Figure 5.10: Empty squares represent experimental data and filled circles represent theoretical
values. (a) Comparison of experimental and theoretical voltage generated at various RPM (b)
Comparison of experimental and theoretical power generated at various RPM (c) Voltage output
from the generator over the operating range of the wind turbine as predicted by the simulation
along with the experimental measurements
While the blade design for our prototype was based from an optimization study
conducted by other researchers the generator underwent no optimization, therefore explaining the
low voltage and power output even though reasonable aerodynamic power coefficient (0.185)
was achieved. The goal of this study was to develop a computational and computational model
for micro wind turbine design. A complete model for predicting voltage as function of wind
speed was validated with a reasonable average difference of 12%. Further validation is needed
for stall torque predictions with more accurate experimental equipment. This further validation
could also lower the overall error across the full wind speed range for steady state angular
velocity and voltage predictions. In order to increase the power output in subsequent prototypes
many generator variables will be optimized with the model such as air gap (distance between coil
and magnet), coil thickness, soft magnetic material thickness and magnet thickness. Also various
Wind speed (m/s)
Vo
lta
ge
(mV
)
0 2 4 6 8 10 12 140
50
100
150
200
250
300
350
400
450
500
Simulated
Experimental
(c)
178
permanent magnet generator configurations will be investigated and compared based on
power/volume using the model presented in this study.
5.1.7 Summary
In this study, a combinatory computational and computational model for small scale wind turbine
design (1-10 cm3) was developed. A prototype was designed and fabricated to validate the
proposed computational model. The prototype was characterized at wind speeds that are typical
of HVAC air flow. The average difference associated with predicting steady state velocity as a
function of wind speed through CFD simulations was 5.9% at wind speeds above 4 m/s. The
average difference associated with predicting generated voltage as a function angular velocity
with the generator model was ~6%. The coupled comprehensive system model which predicts
generated voltage as a function of wind speed was 12%. A novel coil/magnet shape was
presented which enhances the conversion of rotational energy into electrical energy. Aside from
this design feature, the generator underwent no further optimization and therefore explains the
low power output for the prototype presented in the study. To summarize, the important
performance parameters for the prototype were: start-up/cut-in speed was about 1 m/s and the
maximum output power was 6.2 mW at wind speed of 13 m/s. It should be noted that the sole
purpose of the prototype was to validate the computational model. The computational model
presented is the first model in literature that couples the two systems: generator and blades. With
the formulation we can predict the torque load that the generator places on the wind turbine.
With the model presented in this study we will be able to optimize the generator and therefore
increase the overall efficiency of a future micro wind turbine prototype.

179
5.2 Design of high power density generator for micro wind turbine In the previous study, we present a model for generator design for micro wind turbine.
Reasonable agreement between experimental result and predictions of 6% were achieved. In this
study, we optimize a new generator design which increases the generator constant or
transformation factor from 0.2535 V*s/m to 11.89 V*s/m. The new configuration consists of two
circular arrays of magnets with a coil section in between as opposed to the old configuration of
one array of magnets and a soft magnetic poling piece. A micro wind turbine with a blade
diameter of 72 mm and generator volume of 5.7 cm3 is fabricated. At the 2 m/s, 3 m/s, 3.7 m/s, 6
m/s, and 8 m/s condition the power density was 0.0386, 0.151, 0.27, 1.063, and 2.231 mW/cm2
respectively which sets the state of art for micro wind turbine performance.

180
5.2.1 Introduction
Many researchers have developed micro scale wind turbine to harvest flow within HVAC
system in order to power wireless sensor nodes. We have summarized these works in section 5.1
showing previous state of the art power density numbers of 0.222, 0.725, and 1.309 mW/cm2 at
3.5 m/s, 5.6 m/s, and 7 m/s respectively. In section 5.1, we developed and introduced an
optimization model for the coupled blade and generator systems as the previous researchers have
either optimized just the blades or the generator. In this study we use the model to achieve higher
efficiencies than the previous state of the art.
5.2.2 Micro wind turbine design
The generator described in the section 5.1 will be referred to as the 1st generation
generator. The 2nd
generation generator developed in this study consisted of two rotors each
housing 8 rectangular magnets arranged in a circular array. This was a design improvement upon
the 1st generation which only had one rotor and stator. The design changed increased the
generator constant from 0.254 V*s/m to 2.04 V*s/m with load resistances of 25.4 ohms and 42
ohms respectively. Figure 5.11 displays a drawing of the magnet coil arrangement for the
generator topologies.

181
Figure 5.11: (a) 1
st generation generator magnetic circuit layout, (b) 2
nd generation generator
magnetic circuit layout
The stator housed eight triangle shape coils as this was the magnetic field distribution generated
by the eight rectangular magnets. The length width and thickness of the magnets were 1/8” by
1/4” by 1/8” respectively leading to an overall generator with diameter of 22 mm for the 2nd
generation generator. Using the previously developed model we optimized the generator air gap
or distance between the rotors due to the tradeoff between coil volume and magnet spacing
existing [2]. The coil thickness was varied according to the air gap. Due to the thickness of the
coil housing and allowable spacing between coil housing and magnet face the coil thickness was
2 mm less than the air gap. Fig. 5.12 displays the results from the simulation which shows an
optimum air gap of 3.75 mm. The power reported refers to the power over a load resistance equal
to the resistance of the coil. However, during construction the allowable 0.5 mm gap between
coil housing and magnet face was not achieved due to issues with coil winding. Therefore, the
coil thickness within the 3.75 mm gap was 1.25 mm rather than the simulated 1.75 mm.
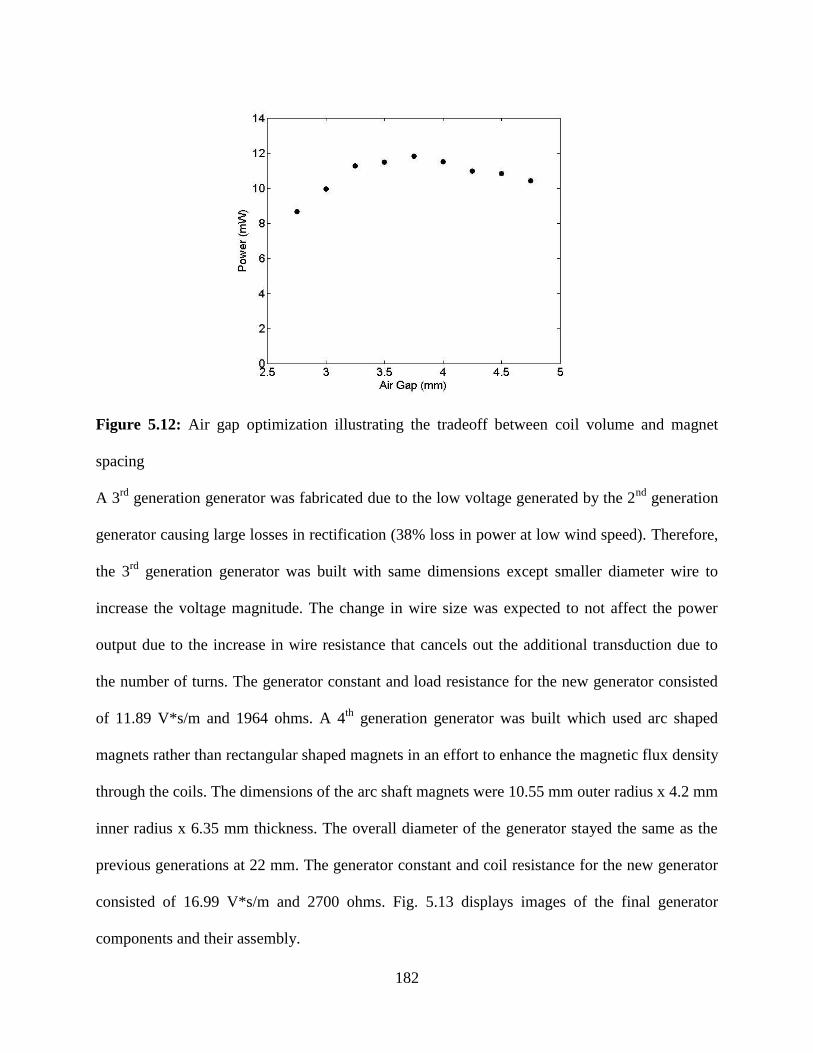
182
Figure 5.12: Air gap optimization illustrating the tradeoff between coil volume and magnet
spacing
A 3rd
generation generator was fabricated due to the low voltage generated by the 2nd
generation
generator causing large losses in rectification (38% loss in power at low wind speed). Therefore,
the 3rd
generation generator was built with same dimensions except smaller diameter wire to
increase the voltage magnitude. The change in wire size was expected to not affect the power
output due to the increase in wire resistance that cancels out the additional transduction due to
the number of turns. The generator constant and load resistance for the new generator consisted
of 11.89 V*s/m and 1964 ohms. A 4th
generation generator was built which used arc shaped
magnets rather than rectangular shaped magnets in an effort to enhance the magnetic flux density
through the coils. The dimensions of the arc shaft magnets were 10.55 mm outer radius x 4.2 mm
inner radius x 6.35 mm thickness. The overall diameter of the generator stayed the same as the
previous generations at 22 mm. The generator constant and coil resistance for the new generator
consisted of 16.99 V*s/m and 2700 ohms. Fig. 5.13 displays images of the final generator
components and their assembly.
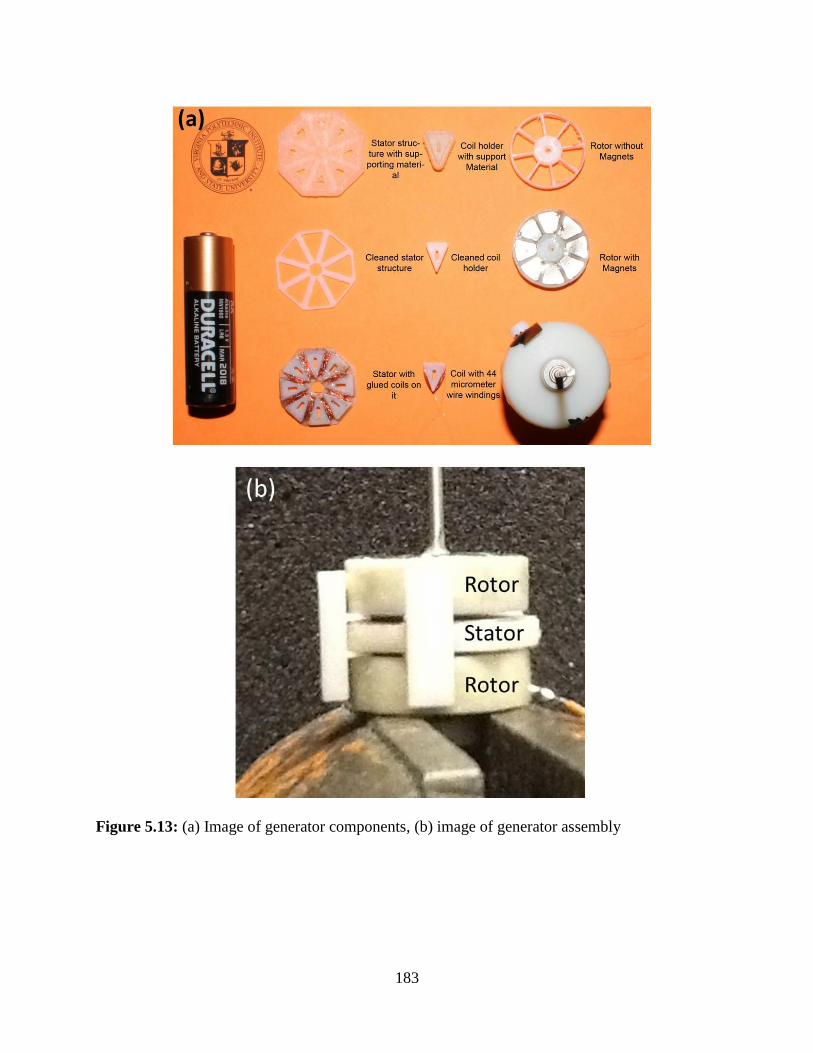
183
Figure 5.13: (a) Image of generator components, (b) image of generator assembly
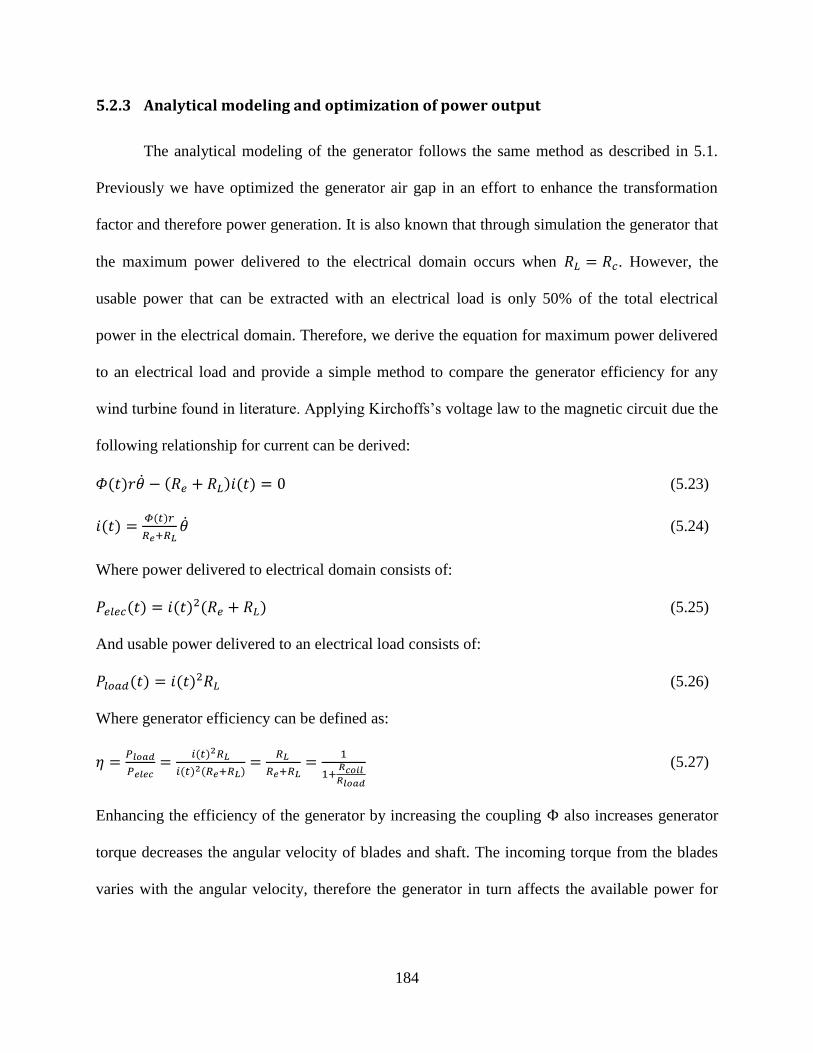
184
5.2.3 Analytical modeling and optimization of power output
The analytical modeling of the generator follows the same method as described in 5.1.
Previously we have optimized the generator air gap in an effort to enhance the transformation
factor and therefore power generation. It is also known that through simulation the generator that
the maximum power delivered to the electrical domain occurs when . However, the
usable power that can be extracted with an electrical load is only 50% of the total electrical
power in the electrical domain. Therefore, we derive the equation for maximum power delivered
to an electrical load and provide a simple method to compare the generator efficiency for any
wind turbine found in literature. Applying Kirchoffs’s voltage law to the magnetic circuit due the
following relationship for current can be derived:
( ) ( ) ( ) (5.23)
( ) ( )
(5.24)
Where power delivered to electrical domain consists of:
( ) ( ) ( ) (5.25)
And usable power delivered to an electrical load consists of:
( ) ( ) (5.26)
Where generator efficiency can be defined as:
( )
( ) ( )
(5.27)
Enhancing the efficiency of the generator by increasing the coupling also increases generator
torque decreases the angular velocity of blades and shaft. The incoming torque from the blades
varies with the angular velocity, therefore the generator in turn affects the available power for
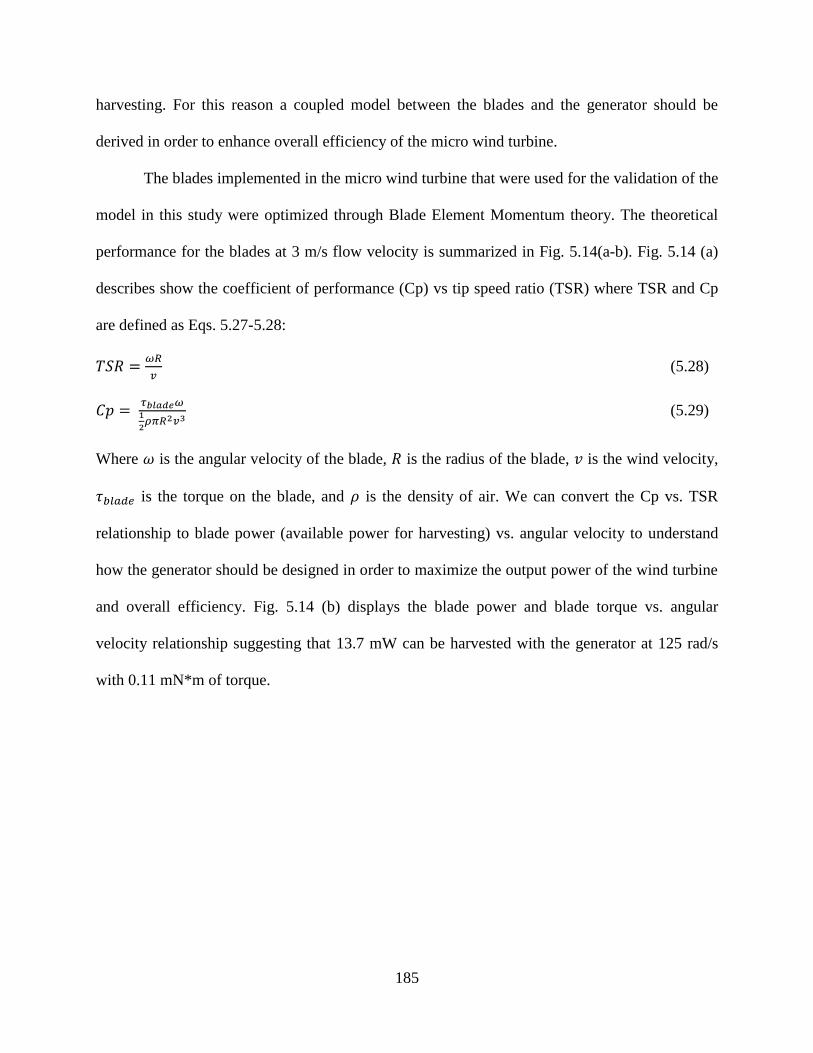
185
harvesting. For this reason a coupled model between the blades and the generator should be
derived in order to enhance overall efficiency of the micro wind turbine.
The blades implemented in the micro wind turbine that were used for the validation of the
model in this study were optimized through Blade Element Momentum theory. The theoretical
performance for the blades at 3 m/s flow velocity is summarized in Fig. 5.14(a-b). Fig. 5.14 (a)
describes show the coefficient of performance (Cp) vs tip speed ratio (TSR) where TSR and Cp
are defined as Eqs. 5.27-5.28:
(5.28)
(5.29)
Where is the angular velocity of the blade, is the radius of the blade, is the wind velocity,
is the torque on the blade, and is the density of air. We can convert the Cp vs. TSR
relationship to blade power (available power for harvesting) vs. angular velocity to understand
how the generator should be designed in order to maximize the output power of the wind turbine
and overall efficiency. Fig. 5.14 (b) displays the blade power and blade torque vs. angular
velocity relationship suggesting that 13.7 mW can be harvested with the generator at 125 rad/s
with 0.11 mN*m of torque.
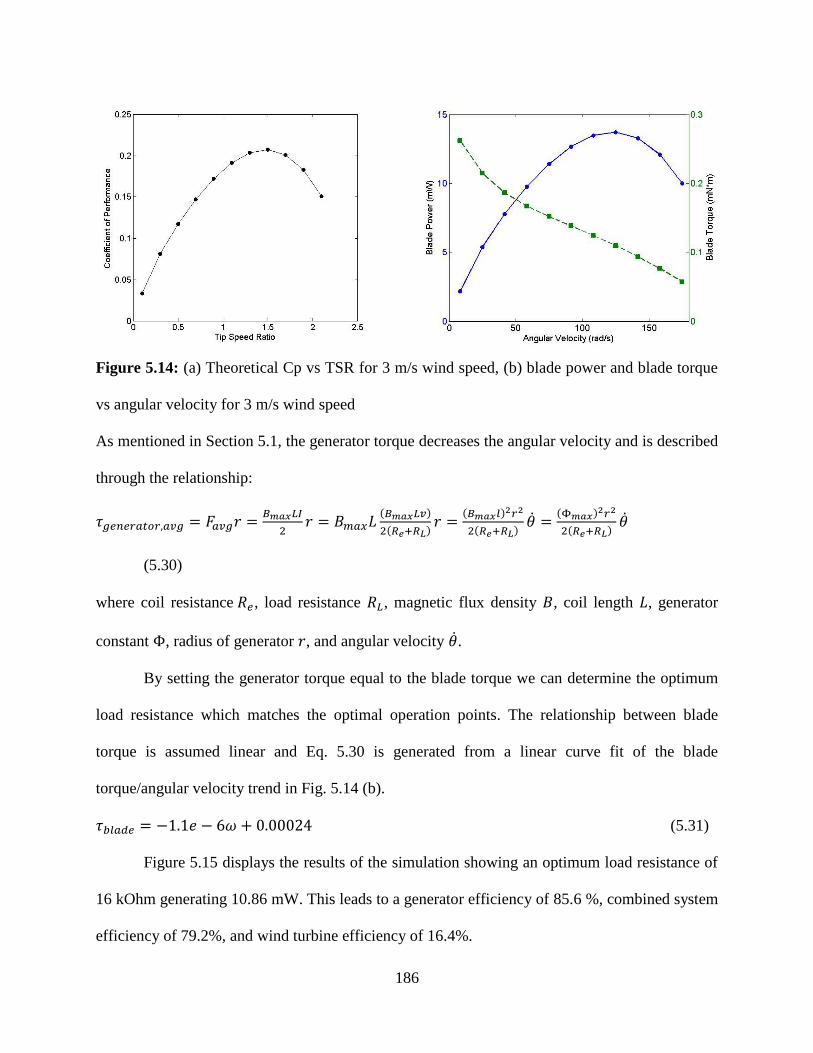
186
Figure 5.14: (a) Theoretical Cp vs TSR for 3 m/s wind speed, (b) blade power and blade torque
vs angular velocity for 3 m/s wind speed
As mentioned in Section 5.1, the generator torque decreases the angular velocity and is described
through the relationship:
( )
( )
( )
( )
( )
( )
(5.30)
where coil resistance , load resistance , magnetic flux density , coil length , generator
constant , radius of generator , and angular velocity .
By setting the generator torque equal to the blade torque we can determine the optimum
load resistance which matches the optimal operation points. The relationship between blade
torque is assumed linear and Eq. 5.30 is generated from a linear curve fit of the blade
torque/angular velocity trend in Fig. 5.14 (b).
(5.31)
Figure 5.15 displays the results of the simulation showing an optimum load resistance of
16 kOhm generating 10.86 mW. This leads to a generator efficiency of 85.6 %, combined system
efficiency of 79.2%, and wind turbine efficiency of 16.4%.
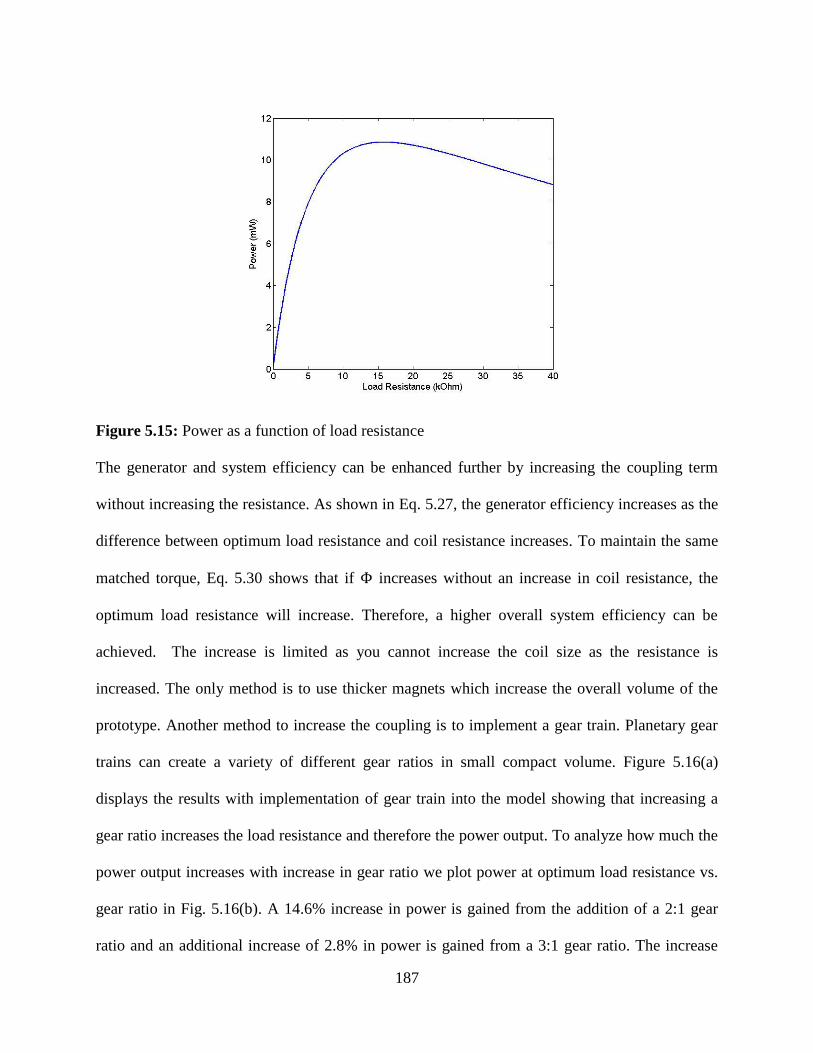
187
Figure 5.15: Power as a function of load resistance
The generator and system efficiency can be enhanced further by increasing the coupling term
without increasing the resistance. As shown in Eq. 5.27, the generator efficiency increases as the
difference between optimum load resistance and coil resistance increases. To maintain the same
matched torque, Eq. 5.30 shows that if increases without an increase in coil resistance, the
optimum load resistance will increase. Therefore, a higher overall system efficiency can be
achieved. The increase is limited as you cannot increase the coil size as the resistance is
increased. The only method is to use thicker magnets which increase the overall volume of the
prototype. Another method to increase the coupling is to implement a gear train. Planetary gear
trains can create a variety of different gear ratios in small compact volume. Figure 5.16(a)
displays the results with implementation of gear train into the model showing that increasing a
gear ratio increases the load resistance and therefore the power output. To analyze how much the
power output increases with increase in gear ratio we plot power at optimum load resistance vs.
gear ratio in Fig. 5.16(b). A 14.6% increase in power is gained from the addition of a 2:1 gear
ratio and an additional increase of 2.8% in power is gained from a 3:1 gear ratio. The increase
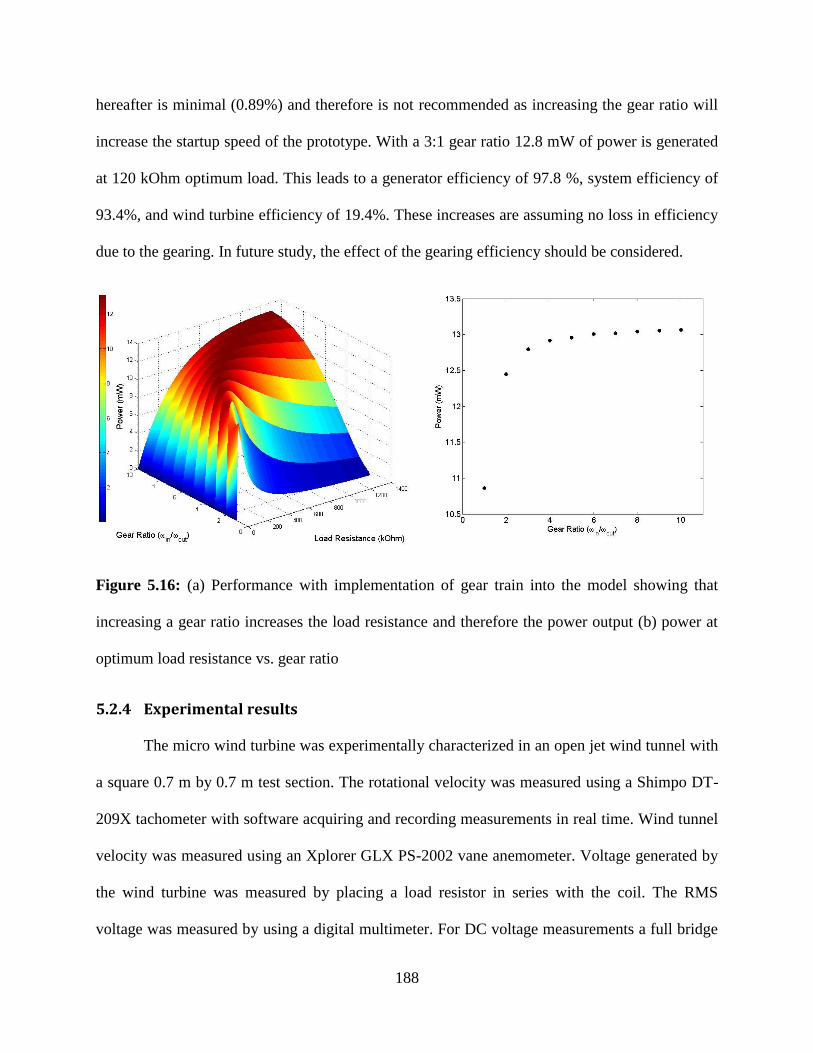
188
hereafter is minimal (0.89%) and therefore is not recommended as increasing the gear ratio will
increase the startup speed of the prototype. With a 3:1 gear ratio 12.8 mW of power is generated
at 120 kOhm optimum load. This leads to a generator efficiency of 97.8 %, system efficiency of
93.4%, and wind turbine efficiency of 19.4%. These increases are assuming no loss in efficiency
due to the gearing. In future study, the effect of the gearing efficiency should be considered.
Figure 5.16: (a) Performance with implementation of gear train into the model showing that
increasing a gear ratio increases the load resistance and therefore the power output (b) power at
optimum load resistance vs. gear ratio
5.2.4 Experimental results
The micro wind turbine was experimentally characterized in an open jet wind tunnel with
a square 0.7 m by 0.7 m test section. The rotational velocity was measured using a Shimpo DT-
209X tachometer with software acquiring and recording measurements in real time. Wind tunnel
velocity was measured using an Xplorer GLX PS-2002 vane anemometer. Voltage generated by
the wind turbine was measured by placing a load resistor in series with the coil. The RMS
voltage was measured by using a digital multimeter. For DC voltage measurements a full bridge
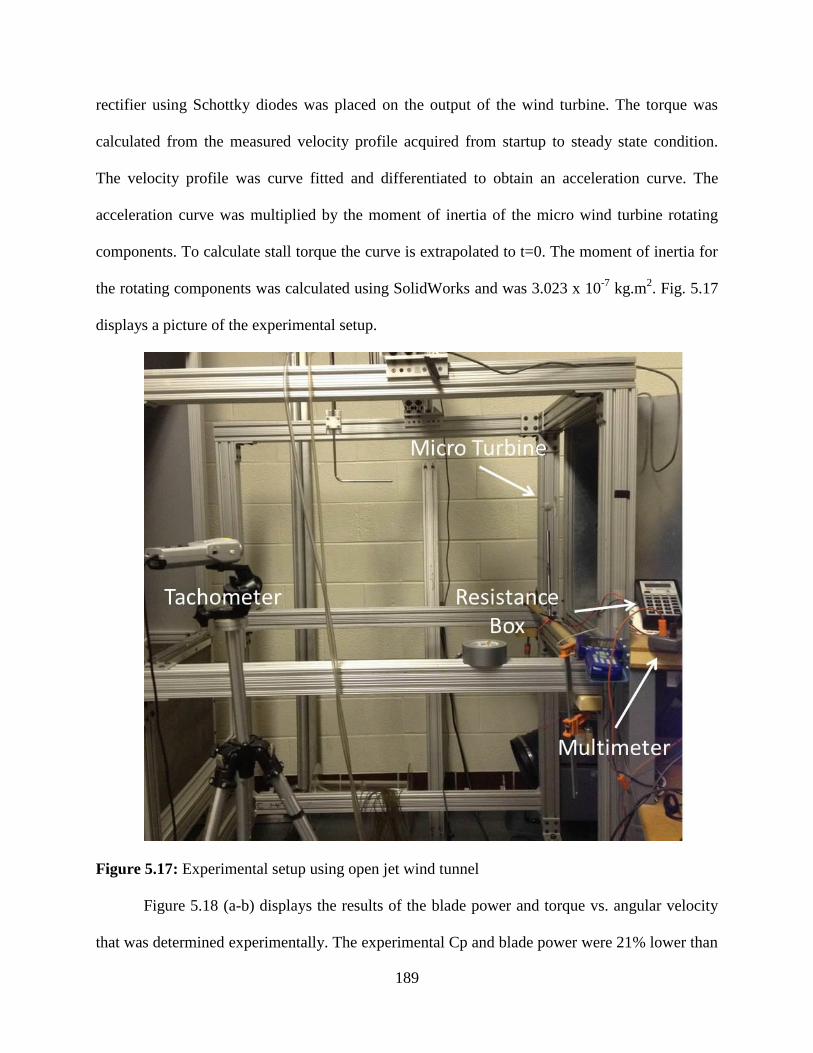
189
rectifier using Schottky diodes was placed on the output of the wind turbine. The torque was
calculated from the measured velocity profile acquired from startup to steady state condition.
The velocity profile was curve fitted and differentiated to obtain an acceleration curve. The
acceleration curve was multiplied by the moment of inertia of the micro wind turbine rotating
components. To calculate stall torque the curve is extrapolated to t=0. The moment of inertia for
the rotating components was calculated using SolidWorks and was 3.023 x 10⁻⁷
kg.m2. Fig. 5.17
displays a picture of the experimental setup.
Figure 5.17: Experimental setup using open jet wind tunnel
Figure 5.18 (a-b) displays the results of the blade power and torque vs. angular velocity
that was determined experimentally. The experimental Cp and blade power were 21% lower than
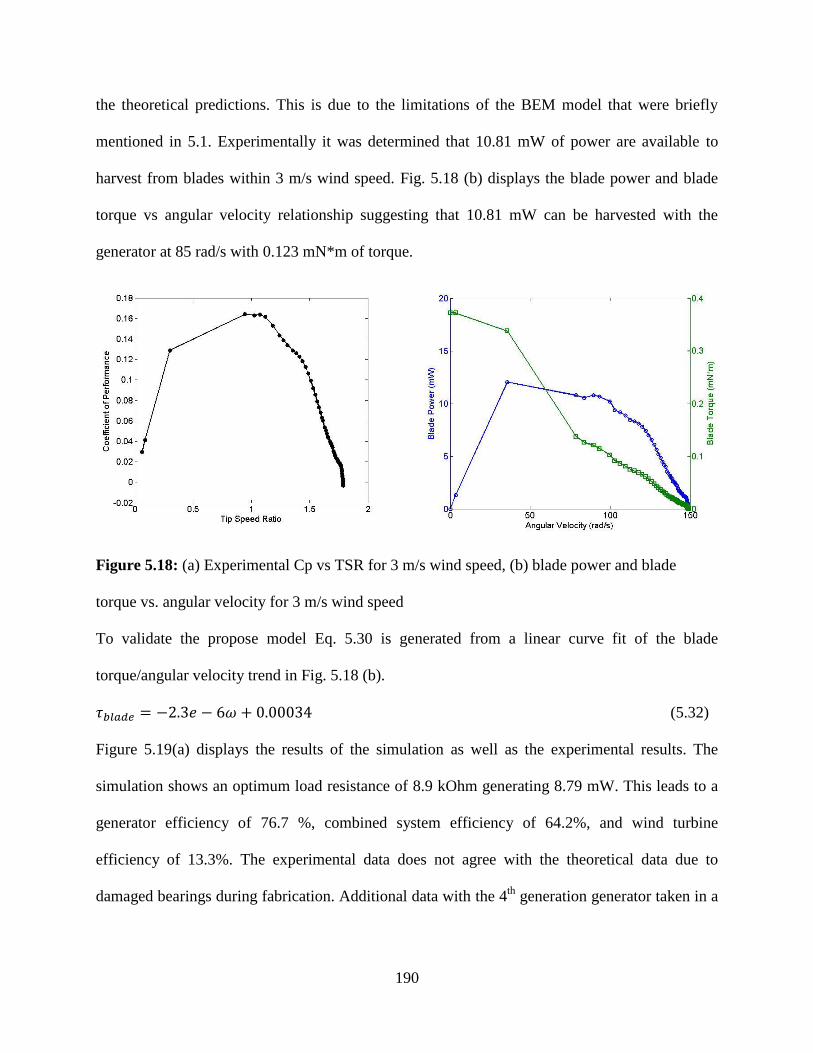
190
the theoretical predictions. This is due to the limitations of the BEM model that were briefly
mentioned in 5.1. Experimentally it was determined that 10.81 mW of power are available to
harvest from blades within 3 m/s wind speed. Fig. 5.18 (b) displays the blade power and blade
torque vs angular velocity relationship suggesting that 10.81 mW can be harvested with the
generator at 85 rad/s with 0.123 mN*m of torque.
Figure 5.18: (a) Experimental Cp vs TSR for 3 m/s wind speed, (b) blade power and blade
torque vs. angular velocity for 3 m/s wind speed
To validate the propose model Eq. 5.30 is generated from a linear curve fit of the blade
torque/angular velocity trend in Fig. 5.18 (b).
(5.32)
Figure 5.19(a) displays the results of the simulation as well as the experimental results. The
simulation shows an optimum load resistance of 8.9 kOhm generating 8.79 mW. This leads to a
generator efficiency of 76.7 %, combined system efficiency of 64.2%, and wind turbine
efficiency of 13.3%. The experimental data does not agree with the theoretical data due to
damaged bearings during fabrication. Additional data with the 4th
generation generator taken in a
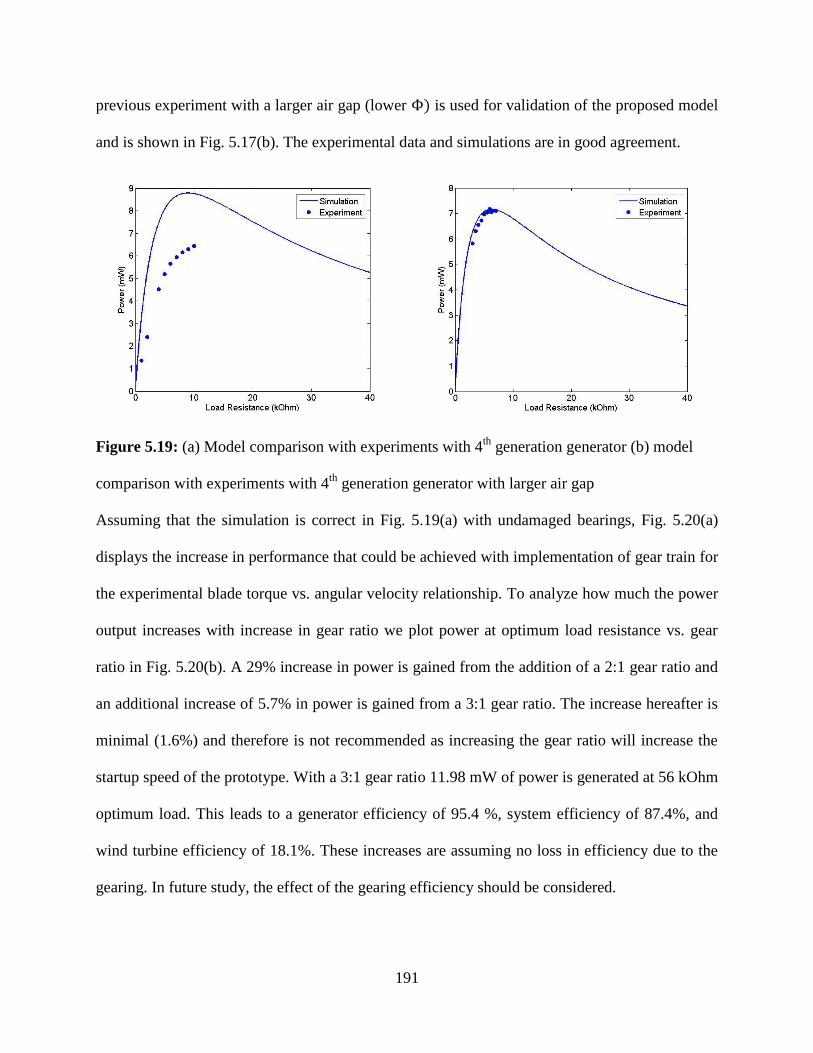
191
previous experiment with a larger air gap (lower ) is used for validation of the proposed model
and is shown in Fig. 5.17(b). The experimental data and simulations are in good agreement.
Figure 5.19: (a) Model comparison with experiments with 4th
generation generator (b) model
comparison with experiments with 4th
generation generator with larger air gap
Assuming that the simulation is correct in Fig. 5.19(a) with undamaged bearings, Fig. 5.20(a)
displays the increase in performance that could be achieved with implementation of gear train for
the experimental blade torque vs. angular velocity relationship. To analyze how much the power
output increases with increase in gear ratio we plot power at optimum load resistance vs. gear
ratio in Fig. 5.20(b). A 29% increase in power is gained from the addition of a 2:1 gear ratio and
an additional increase of 5.7% in power is gained from a 3:1 gear ratio. The increase hereafter is
minimal (1.6%) and therefore is not recommended as increasing the gear ratio will increase the
startup speed of the prototype. With a 3:1 gear ratio 11.98 mW of power is generated at 56 kOhm
optimum load. This leads to a generator efficiency of 95.4 %, system efficiency of 87.4%, and
wind turbine efficiency of 18.1%. These increases are assuming no loss in efficiency due to the
gearing. In future study, the effect of the gearing efficiency should be considered.
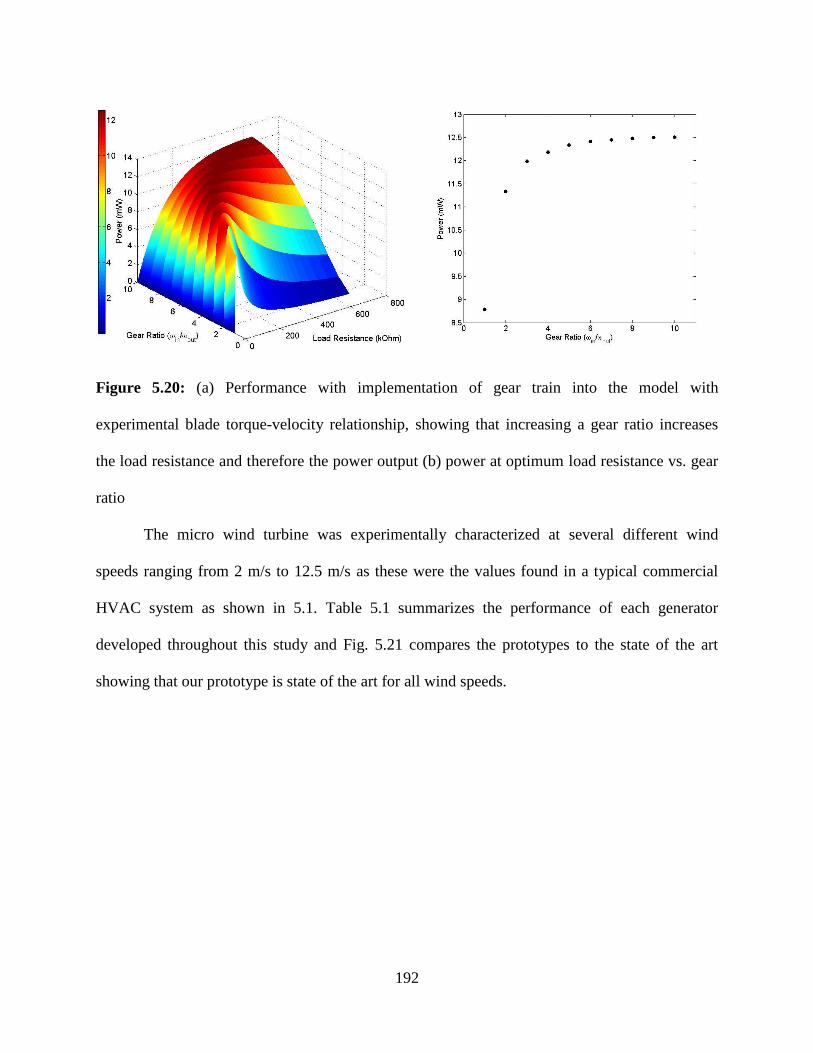
192
Figure 5.20: (a) Performance with implementation of gear train into the model with
experimental blade torque-velocity relationship, showing that increasing a gear ratio increases
the load resistance and therefore the power output (b) power at optimum load resistance vs. gear
ratio
The micro wind turbine was experimentally characterized at several different wind
speeds ranging from 2 m/s to 12.5 m/s as these were the values found in a typical commercial
HVAC system as shown in 5.1. Table 5.1 summarizes the performance of each generator
developed throughout this study and Fig. 5.21 compares the prototypes to the state of the art
showing that our prototype is state of the art for all wind speeds.
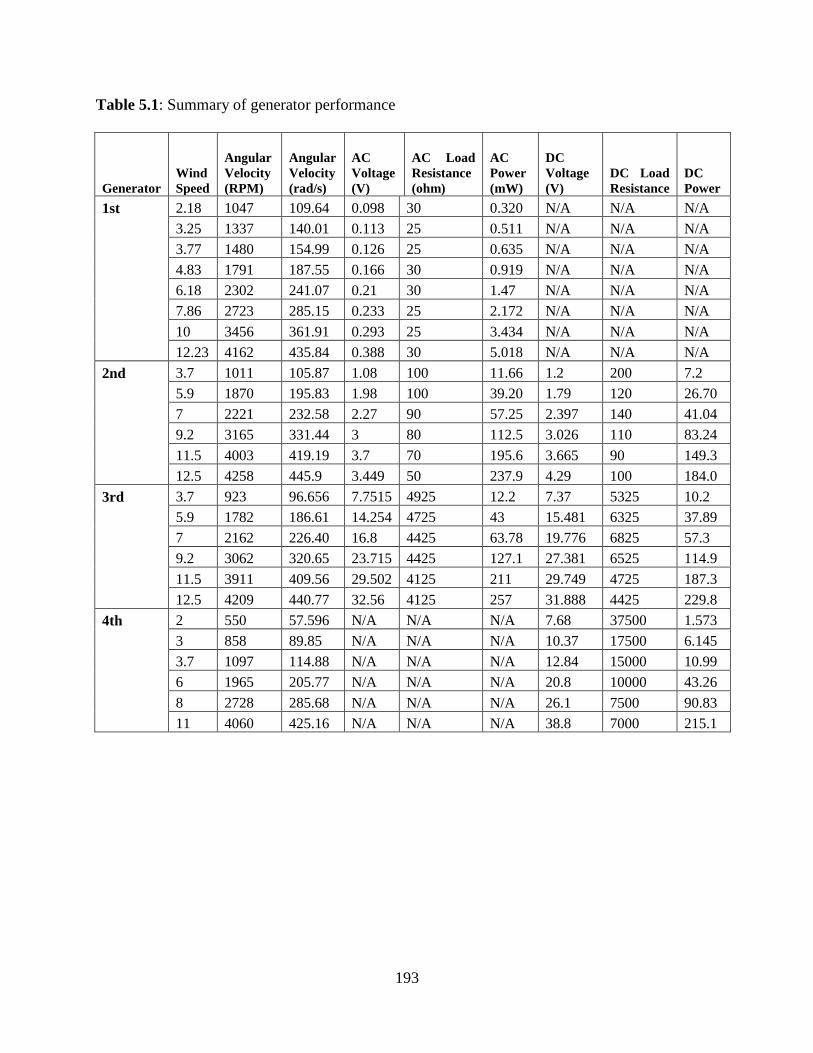
193
Table 5.1: Summary of generator performance
Generator
Wind
Speed
Angular
Velocity
(RPM)
Angular
Velocity
(rad/s)
AC
Voltage
(V)
AC Load
Resistance
(ohm)
AC
Power
(mW)
DC
Voltage
(V)
DC Load
Resistance
DC
Power
1st 2.18 1047 109.64 0.098 30 0.320 N/A N/A N/A
3.25 1337 140.01 0.113 25 0.511 N/A N/A N/A
3.77 1480 154.99 0.126 25 0.635 N/A N/A N/A
4.83 1791 187.55 0.166 30 0.919 N/A N/A N/A
6.18 2302 241.07 0.21 30 1.47 N/A N/A N/A
7.86 2723 285.15 0.233 25 2.172 N/A N/A N/A
10 3456 361.91 0.293 25 3.434 N/A N/A N/A
12.23 4162 435.84 0.388 30 5.018 N/A N/A N/A
2nd 3.7 1011 105.87 1.08 100 11.66 1.2 200 7.2
5.9 1870 195.83 1.98 100 39.20 1.79 120 26.70
7 2221 232.58 2.27 90 57.25 2.397 140 41.04
9.2 3165 331.44 3 80 112.5 3.026 110 83.24
11.5 4003 419.19 3.7 70 195.6 3.665 90 149.3
12.5 4258 445.9 3.449 50 237.9 4.29 100 184.0
3rd 3.7 923 96.656 7.7515 4925 12.2 7.37 5325 10.2
5.9 1782 186.61 14.254 4725 43 15.481 6325 37.89
7 2162 226.40 16.8 4425 63.78 19.776 6825 57.3
9.2 3062 320.65 23.715 4425 127.1 27.381 6525 114.9
11.5 3911 409.56 29.502 4125 211 29.749 4725 187.3
12.5 4209 440.77 32.56 4125 257 31.888 4425 229.8
4th 2 550 57.596 N/A N/A N/A 7.68 37500 1.573
3 858 89.85 N/A N/A N/A 10.37 17500 6.145
3.7 1097 114.88 N/A N/A N/A 12.84 15000 10.99
6 1965 205.77 N/A N/A N/A 20.8 10000 43.26
8 2728 285.68 N/A N/A N/A 26.1 7500 90.83
11 4060 425.16 N/A N/A N/A 38.8 7000 215.1
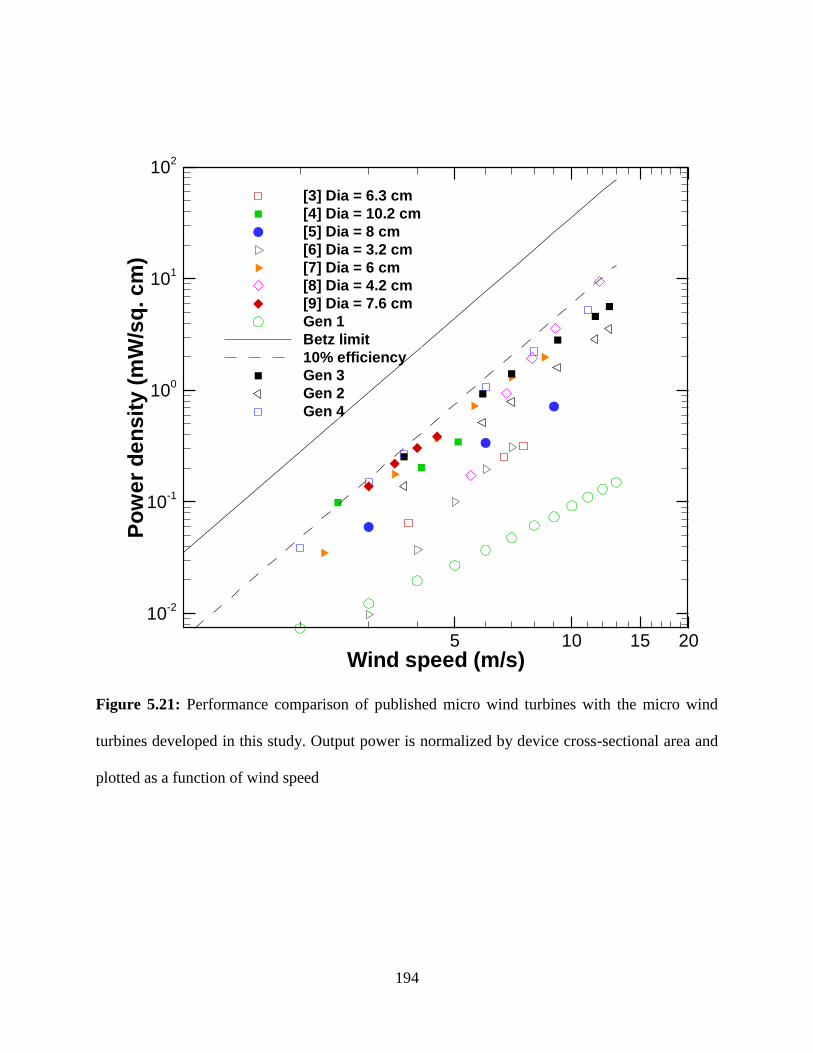
194
Figure 5.21: Performance comparison of published micro wind turbines with the micro wind
turbines developed in this study. Output power is normalized by device cross-sectional area and
plotted as a function of wind speed
Wind speed (m/s)
Po
we
rd
en
sit
y(m
W/s
q.c
m)
5 10 15 20
10-2
10-1
100
101
102
[3] Dia = 6.3 cm
[4] Dia = 10.2 cm
[5] Dia = 8 cm
[6] Dia = 3.2 cm
[7] Dia = 6 cm
[8] Dia = 4.2 cm
[9] Dia = 7.6 cm
Gen 1
Betz limit
10% efficiency
Gen 3
Gen 2
Gen 4

195
5.2.5 Summary
In this study, we used the model developed in Section 5.1 to design a generator to operate at the
angular velocity corresponding to maximum coefficient of power for the blades. Utilizing the
model, a method of optimizing the overall system efficiency by increasing and decreasing
was determined. While we set the state of the art with our 4th
generation generator implemented
in the micro wind turbine, there was still room for improvement through further generator
optimization and implementation of gear train.

196
6 CHAPTER 6: DESIGNING ENERGY HARVESTERS FOR WIRELESS SENSOR NETWORK IMPEMENTATION IN SMART BUILDINGS
6.1 Pen harvester for integration within smart buildings
With the continued advancement in electronics the power requirement for micro-sensors
has been decreasing opening the possibility for incorporating on-board energy harvesting devices
to create self-powered sensors. The requirement for the energy harvesters are small size, light
weight and the possibility of a low-budget mass production. In this study, we focus on
developing an energy harvester for powering a pulse rate sensor. We propose to integrate an
inductive energy harvester within a commonly available pen to harvest vibration energy from
normal human motions like jogging and jumping. An existing prototype was reviewed which
consists of a magnet wedged between two mechanical springs housed within a cylindrical shell.
A single copper coil surrounds the cylindrical shell which harvests energy through Faraday’s
effect during magnet oscillation. This study reports a design change to the previous prototype
providing a significant reduction in the device foot print without causing major losses in power
generation. By breaking the single coil in the previous prototype into three separate coils an
increase in power density was achieved. Several pulse rate sensors were evaluated to determine a
target power requirement of 0.3 mW. To evaluate the prototype as a potential solution, the
harvester was excited at various frequencies and accelerations typically produced through
jogging and jumping motion. The improved prototype generated 0.043 mW at 0.56 grms and 3
Hz; and 0.13 mW at 1.14 grms at 5 Hz. The design change allowed reduction in total volume
from 8.59 cm3 to 1.31 cm
3 without significant losses in power generation.

197
6.1.1 Introduction
Energy harvesting represents the process in which electrical energy is generated from
freely available ambient environment sources such as solar energy, thermal energy, wind energy
and kinetic energy. The mechanical energy can be converted into electric energy through various
mechanisms such as inductive, piezoelectric, magnetoelectric, electrets and electroactive
polymers. In this study, we develop a harvester that can convert vibration energy generated from
typical human motion into electrical energy. The generated electricity can be provided wirelessly
to implantable and body worn medical sensors. Common medical sensors with their respective
power requirements are shown in Fig. 6.1.
Figure 6.1: Power requirement for various implantable and body worn medical sensors
The requirement for vibration energy harvester in the body sensor network is that it
should be small, lightweight, and comfortably fit within the clothing and/or belongings carried
every day. Also the vibration energy harvester should be designed to operate optimally at the
source conditions. In a study conducted by Jaeseok et al., the magnitude of vibration was
measured at six different locations on eight different people with accelerometers [128].

198
Analyzing the results from their study, the vibration frequencies and accelerations typically
generated during human motion are between 0.5 - 5 Hz and 0.2 - 1.6 G. These frequencies and
accelerations are similar to reported data in studies conducted by Saha et al. and Naruse et al.
[70, 129].
In a previous study, we developed a vibration energy harvester for human body and
integrated the prototype into a marker pen [27]. The energy harvester generated 0.37 mW at 3.5
Hz and 1.17 mW at 5 Hz meeting the power requirement of a common pulse rate sensor (~ 0.3
mW). While the power requirement was met, a marker pen is typically not carried every day by
the average human. Therefore the focus of this study was to reduce the form factor of the energy
harvester to integrate into a common pen, while maintaining the 0.3 mW power requirement. To
this end, we present the design and analysis of a prototype which improves upon the magnet
geometry and coil configuration of the previously developed prototype. We discuss the results of
a detailed analysis of the design changes effect on power output. The improved pen harvester
incorporates magnetic springs instead of mechanical springs used in the previous version in order
to decrease friction. As a result, the transduction of mechanical energy to electrical energy was
enhanced. We present a method for modeling the nonlinear dynamics which improves upon the
modeling presented in the previous work. The pen harvester was fabricated and experimentally
characterized to evaluate the capability of powering various implantable and body worn medical
devices
6.1.2 Pen harvester design
The overall length and diameter of the previous prototype was 70 mm and 12.5 mm
respectively. The prototype developed in this study has an overall length of 45 mm and overall
diameter of 6.1 mm as shown in Fig. 6.2 (a). In the previous prototype a single cylindrical

199
magnet oscillated within one coil. In an effort to decrease the size of the harvester without
significantly decreasing electromagnetic transduction, we modified the design which contains an
oscillating center composite magnet as shown in Fig. 6.2 (b). The center composite magnet
consists of three 2.54 mm diameter by 4.76 mm long cylindrical magnets. It has been shown that
a center composite magnet consisting of two magnets with opposite polarity generates magnetic
fields that are twice as strong as the single center magnet of same total volume [70]. As the
prototype length was decreased, the coil was split into three sections to enhance the transduction
within the limited oscillation range. Each coil section was 5 mm in length consisting of 38 AWG
wire. The increase in electromagnetic transduction as a result of the two design changes was
analyzed and explained in the theoretical analysis section of the paper. To reduce friction, we
incorporated magnetic springs rather than mechanical springs used in the previous prototype.
The magnetic springs were created by oscillating a levitating magnet between two magnets
which have opposite polarity. The magnetic levitation introduces nonlinearity to the system. The
benefit of the nonlinear response of the center magnet velocity to base acceleration was modeled
and analyzed in the theoretical analysis section of the paper.
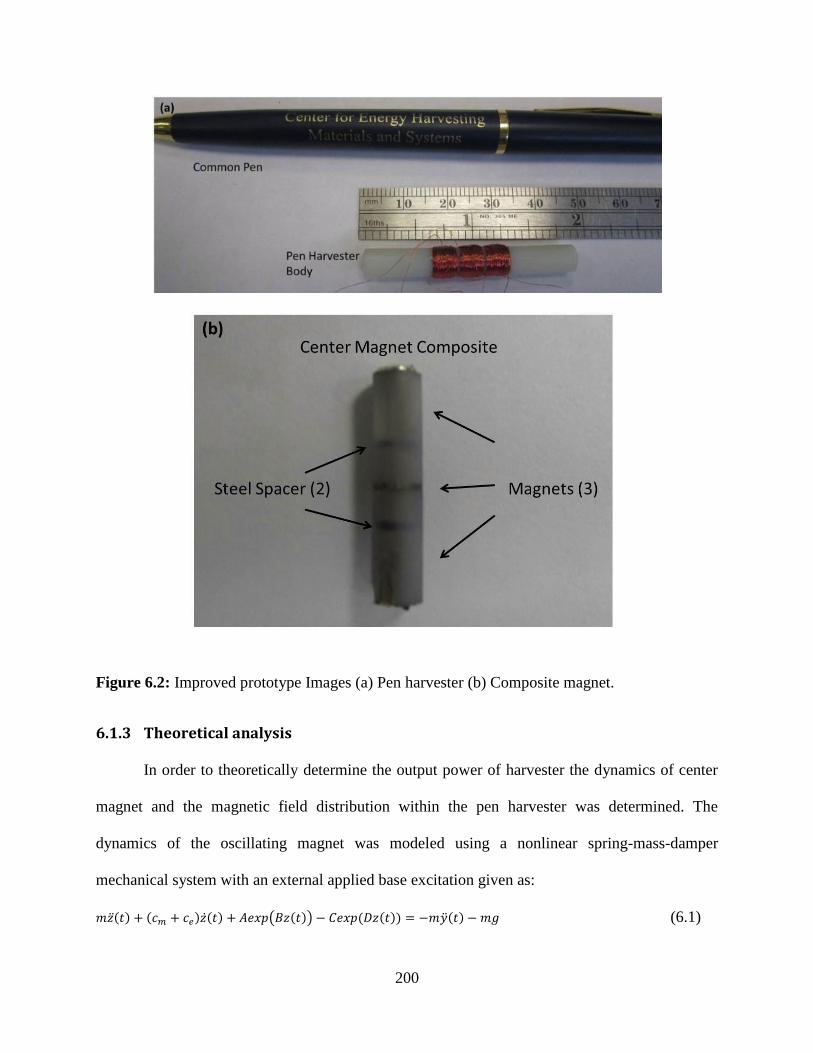
200
Figure 6.2: Improved prototype Images (a) Pen harvester (b) Composite magnet.
6.1.3 Theoretical analysis
In order to theoretically determine the output power of harvester the dynamics of center
magnet and the magnetic field distribution within the pen harvester was determined. The
dynamics of the oscillating magnet was modeled using a nonlinear spring-mass-damper
mechanical system with an external applied base excitation given as:
( ) ( ) ( ) ( ( )) ( ( )) ( ) (6.1)
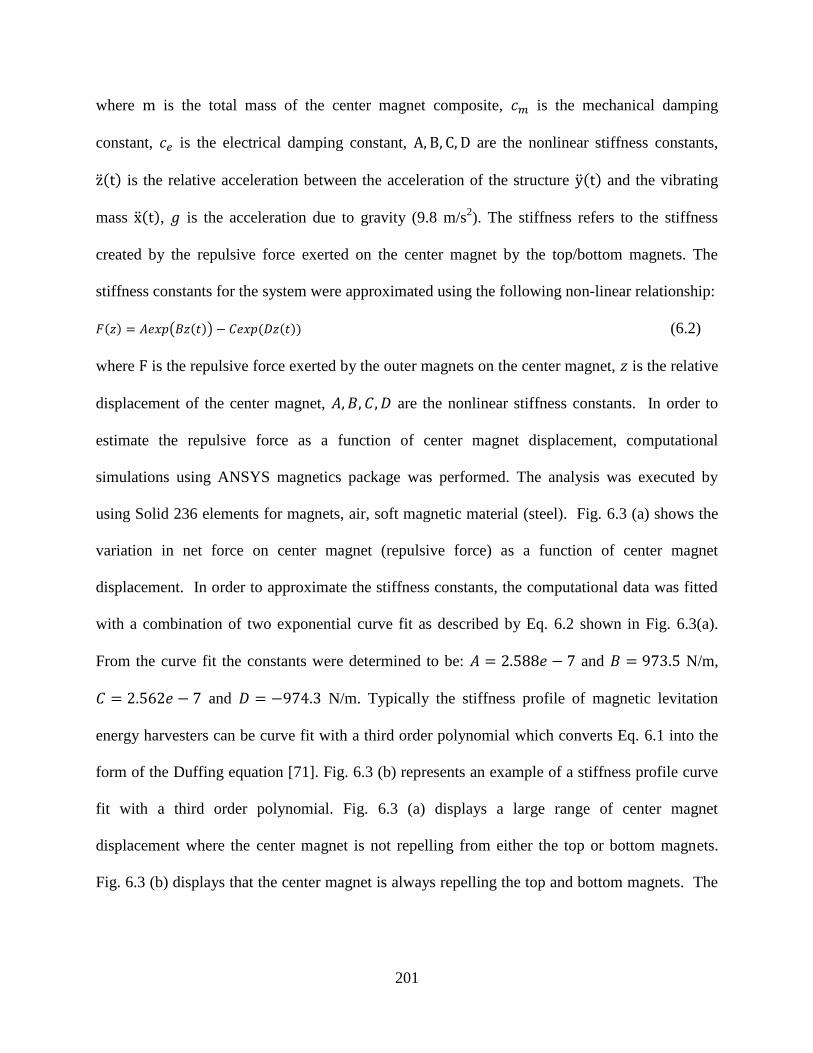
201
where is the total mass of the center magnet composite, is the mechanical damping
constant, is the electrical damping constant, are the nonlinear stiffness constants,
( ) is the relative acceleration between the acceleration of the structure ( ) and the vibrating
mass ( ), is the acceleration due to gravity (9.8 m/s2). The stiffness refers to the stiffness
created by the repulsive force exerted on the center magnet by the top/bottom magnets. The
stiffness constants for the system were approximated using the following non-linear relationship:
( ) ( ( )) ( ( )) (6.2)
where is the repulsive force exerted by the outer magnets on the center magnet, is the relative
displacement of the center magnet, are the nonlinear stiffness constants. In order to
estimate the repulsive force as a function of center magnet displacement, computational
simulations using ANSYS magnetics package was performed. The analysis was executed by
using Solid 236 elements for magnets, air, soft magnetic material (steel). Fig. 6.3 (a) shows the
variation in net force on center magnet (repulsive force) as a function of center magnet
displacement. In order to approximate the stiffness constants, the computational data was fitted
with a combination of two exponential curve fit as described by Eq. 6.2 shown in Fig. 6.3(a).
From the curve fit the constants were determined to be: and N/m,
and N/m. Typically the stiffness profile of magnetic levitation
energy harvesters can be curve fit with a third order polynomial which converts Eq. 6.1 into the
form of the Duffing equation [71]. Fig. 6.3 (b) represents an example of a stiffness profile curve
fit with a third order polynomial. Fig. 6.3 (a) displays a large range of center magnet
displacement where the center magnet is not repelling from either the top or bottom magnets.
Fig. 6.3 (b) displays that the center magnet is always repelling the top and bottom magnets. The
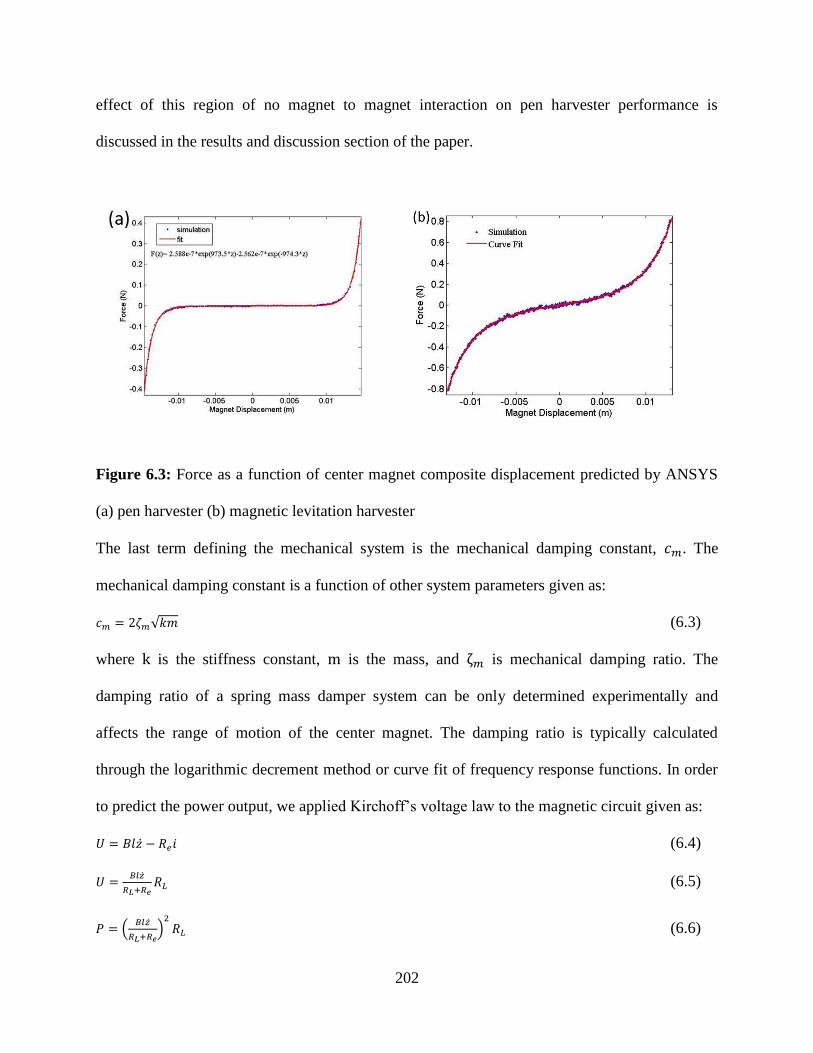
202
effect of this region of no magnet to magnet interaction on pen harvester performance is
discussed in the results and discussion section of the paper.
Figure 6.3: Force as a function of center magnet composite displacement predicted by ANSYS
(a) pen harvester (b) magnetic levitation harvester
The last term defining the mechanical system is the mechanical damping constant, . The
mechanical damping constant is a function of other system parameters given as:
√ (6.3)
where is the stiffness constant, is the mass, and is mechanical damping ratio. The
damping ratio of a spring mass damper system can be only determined experimentally and
affects the range of motion of the center magnet. The damping ratio is typically calculated
through the logarithmic decrement method or curve fit of frequency response functions. In order
to predict the power output, we applied Kirchoff’s voltage law to the magnetic circuit given as:
(6.4)
(6.5)
(
)
(6.6)
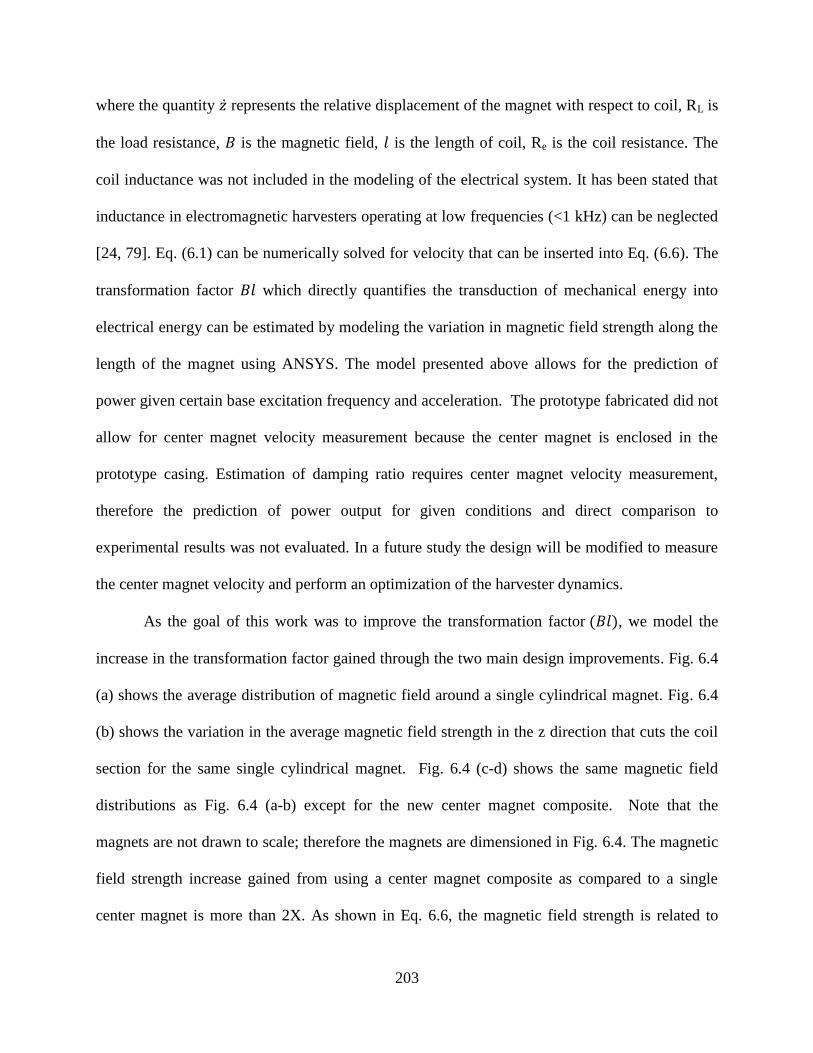
203
where the quantity represents the relative displacement of the magnet with respect to coil, RL is
the load resistance, is the magnetic field, is the length of coil, Re is the coil resistance. The
coil inductance was not included in the modeling of the electrical system. It has been stated that
inductance in electromagnetic harvesters operating at low frequencies (<1 kHz) can be neglected
[24, 79]. Eq. (6.1) can be numerically solved for velocity that can be inserted into Eq. (6.6). The
transformation factor which directly quantifies the transduction of mechanical energy into
electrical energy can be estimated by modeling the variation in magnetic field strength along the
length of the magnet using ANSYS. The model presented above allows for the prediction of
power given certain base excitation frequency and acceleration. The prototype fabricated did not
allow for center magnet velocity measurement because the center magnet is enclosed in the
prototype casing. Estimation of damping ratio requires center magnet velocity measurement,
therefore the prediction of power output for given conditions and direct comparison to
experimental results was not evaluated. In a future study the design will be modified to measure
the center magnet velocity and perform an optimization of the harvester dynamics.
As the goal of this work was to improve the transformation factor ( ), we model the
increase in the transformation factor gained through the two main design improvements. Fig. 6.4
(a) shows the average distribution of magnetic field around a single cylindrical magnet. Fig. 6.4
(b) shows the variation in the average magnetic field strength in the z direction that cuts the coil
section for the same single cylindrical magnet. Fig. 6.4 (c-d) shows the same magnetic field
distributions as Fig. 6.4 (a-b) except for the new center magnet composite. Note that the
magnets are not drawn to scale; therefore the magnets are dimensioned in Fig. 6.4. The magnetic
field strength increase gained from using a center magnet composite as compared to a single
center magnet is more than 2X. As shown in Eq. 6.6, the magnetic field strength is related to

204
power squared, thus the design change was a significant improvement to the previous prototype
which consisted of a single center magnet.
Figure 6.4: Magnetic field distribution for single center magnet (a-b) and composite center
magnet (c-d)
In the previous prototype, a single coil was used with length greater than the length of magnet.
The design was not optimum since during significant regions of center magnet displacement no
voltage was created due to cancellation of current transduction within the coil. The cancellation
occurs because the direction of the magnetic field vectors at each end of the magnet is opposite.
For the new prototype the single coil is split into three separate coils of similar length to the
middle magnet within the center magnet composite. All three coils are connected therefore the
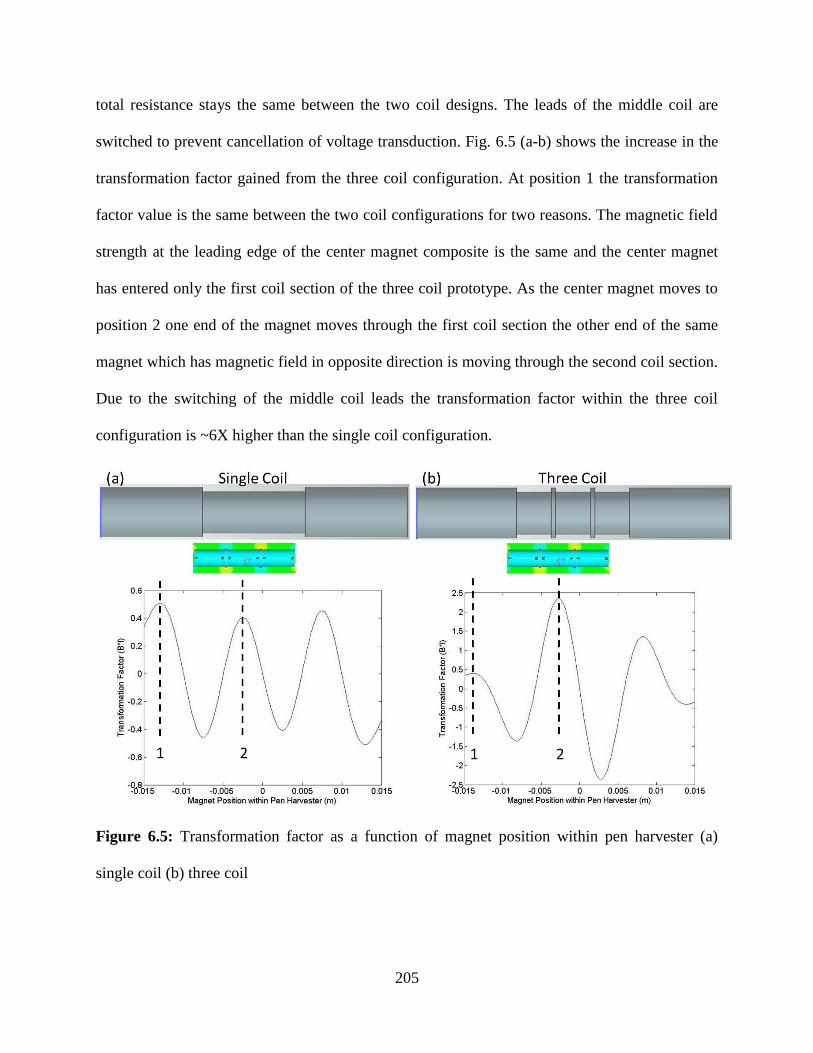
205
total resistance stays the same between the two coil designs. The leads of the middle coil are
switched to prevent cancellation of voltage transduction. Fig. 6.5 (a-b) shows the increase in the
transformation factor gained from the three coil configuration. At position 1 the transformation
factor value is the same between the two coil configurations for two reasons. The magnetic field
strength at the leading edge of the center magnet composite is the same and the center magnet
has entered only the first coil section of the three coil prototype. As the center magnet moves to
position 2 one end of the magnet moves through the first coil section the other end of the same
magnet which has magnetic field in opposite direction is moving through the second coil section.
Due to the switching of the middle coil leads the transformation factor within the three coil
configuration is ~6X higher than the single coil configuration.
Figure 6.5: Transformation factor as a function of magnet position within pen harvester (a)
single coil (b) three coil
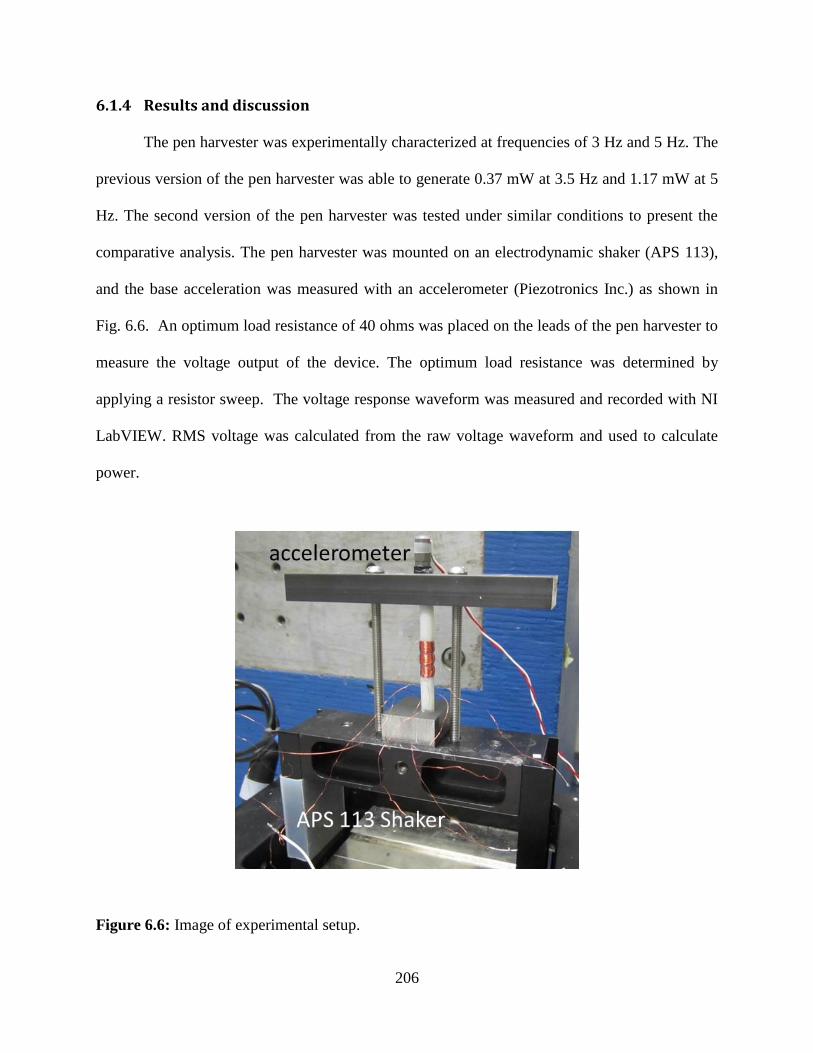
206
6.1.4 Results and discussion
The pen harvester was experimentally characterized at frequencies of 3 Hz and 5 Hz. The
previous version of the pen harvester was able to generate 0.37 mW at 3.5 Hz and 1.17 mW at 5
Hz. The second version of the pen harvester was tested under similar conditions to present the
comparative analysis. The pen harvester was mounted on an electrodynamic shaker (APS 113),
and the base acceleration was measured with an accelerometer (Piezotronics Inc.) as shown in
Fig. 6.6. An optimum load resistance of 40 ohms was placed on the leads of the pen harvester to
measure the voltage output of the device. The optimum load resistance was determined by
applying a resistor sweep. The voltage response waveform was measured and recorded with NI
LabVIEW. RMS voltage was calculated from the raw voltage waveform and used to calculate
power.
Figure 6.6: Image of experimental setup.
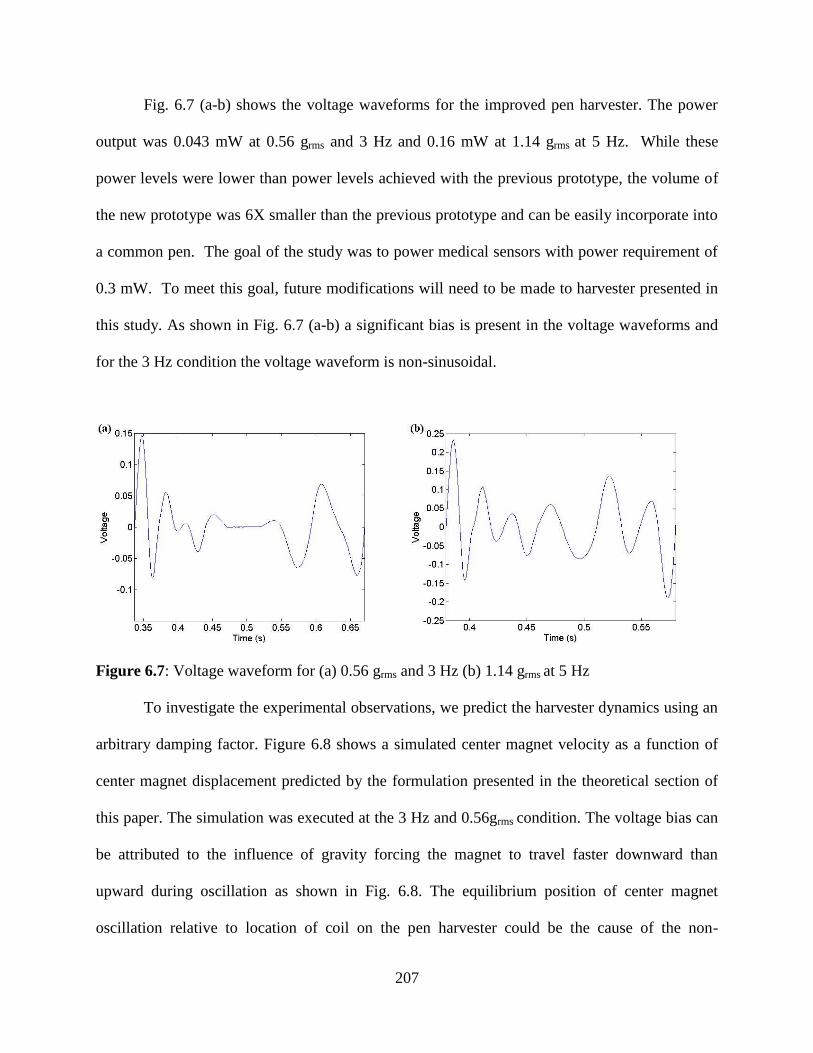
207
Fig. 6.7 (a-b) shows the voltage waveforms for the improved pen harvester. The power
output was 0.043 mW at 0.56 grms and 3 Hz and 0.16 mW at 1.14 grms at 5 Hz. While these
power levels were lower than power levels achieved with the previous prototype, the volume of
the new prototype was 6X smaller than the previous prototype and can be easily incorporate into
a common pen. The goal of the study was to power medical sensors with power requirement of
0.3 mW. To meet this goal, future modifications will need to be made to harvester presented in
this study. As shown in Fig. 6.7 (a-b) a significant bias is present in the voltage waveforms and
for the 3 Hz condition the voltage waveform is non-sinusoidal.
Figure 6.7: Voltage waveform for (a) 0.56 grms and 3 Hz (b) 1.14 grms at 5 Hz
To investigate the experimental observations, we predict the harvester dynamics using an
arbitrary damping factor. Figure 6.8 shows a simulated center magnet velocity as a function of
center magnet displacement predicted by the formulation presented in the theoretical section of
this paper. The simulation was executed at the 3 Hz and 0.56grms condition. The voltage bias can
be attributed to the influence of gravity forcing the magnet to travel faster downward than
upward during oscillation as shown in Fig. 6.8. The equilibrium position of center magnet
oscillation relative to location of coil on the pen harvester could be the cause of the non-
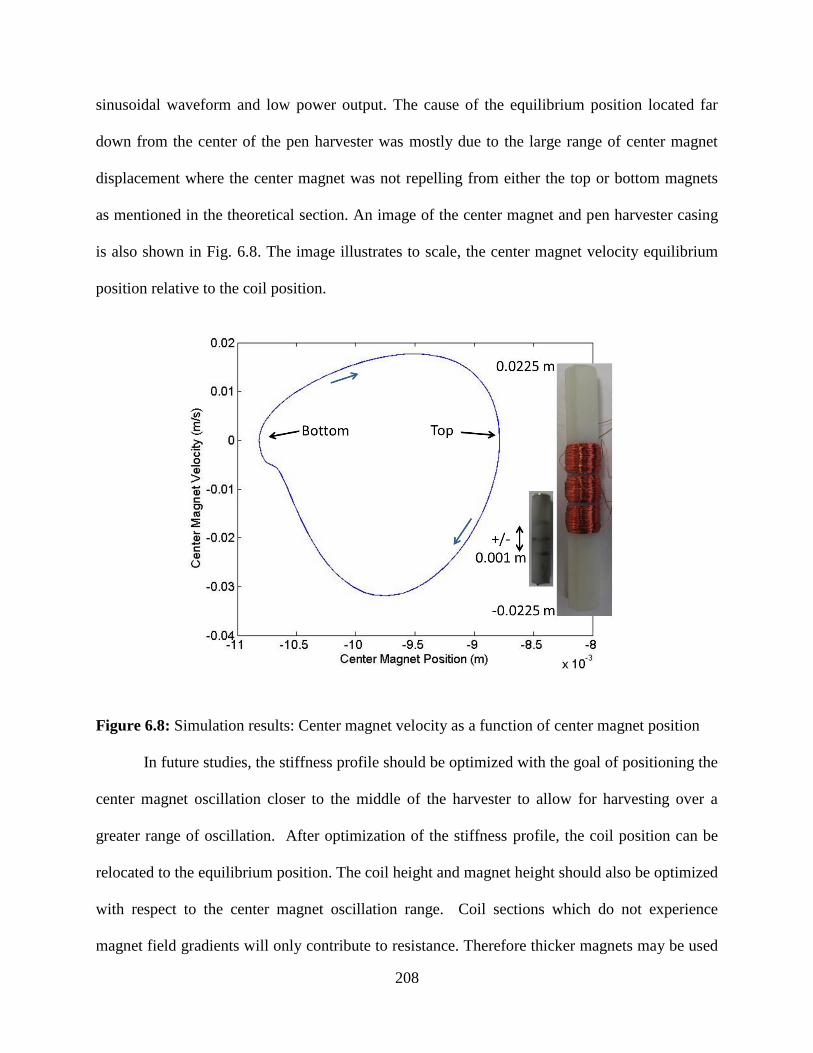
208
sinusoidal waveform and low power output. The cause of the equilibrium position located far
down from the center of the pen harvester was mostly due to the large range of center magnet
displacement where the center magnet was not repelling from either the top or bottom magnets
as mentioned in the theoretical section. An image of the center magnet and pen harvester casing
is also shown in Fig. 6.8. The image illustrates to scale, the center magnet velocity equilibrium
position relative to the coil position.
Figure 6.8: Simulation results: Center magnet velocity as a function of center magnet position
In future studies, the stiffness profile should be optimized with the goal of positioning the
center magnet oscillation closer to the middle of the harvester to allow for harvesting over a
greater range of oscillation. After optimization of the stiffness profile, the coil position can be
relocated to the equilibrium position. The coil height and magnet height should also be optimized
with respect to the center magnet oscillation range. Coil sections which do not experience
magnet field gradients will only contribute to resistance. Therefore thicker magnets may be used
209
on the top and bottom of the composite since the ends of these magnets will not be contributing
to the transduction of current. Increasing magnet thickness would increase the moving mass and
magnetic field strength at the center. As a result, the harvested power would be enhanced.
6.1.5 Summary
The improved version of pen harvester decreases the volume of the previous prototype reported
in literature by 6X while generating power close to the power requirement of the medical
sensors. The newly designed pen harvester generated 0.043 mW at 0.56 grms and 3 Hz and 0.16
mW at 1.14 grms at 5 Hz. The harvester can be easily integrated inside a pen in order to harvest
energy from human daily motions. The size was decreased without major losses in power
generation through two design modifications which increase the transformation factor.
Theoretical simulations show that the center magnet composite and the new coil configuration
increased the transformation factor by 2X and 6X respectively. Further optimization of the
stiffness profile, magnet height, coil height and coil position are needed, that should greatly
improve the performance of the current prototype. With these future improvements the pen
harvester could provide solution for powering implantable and body worn medical devices.
210
7 CONCLUSIONS
7.1 Summary
Three very different types of inductive vibration energy harvesting prototypes developed
previously and documented in literature were reviewed in Sections 2, 3 and 4 (four-bar magnet,
magnetic levitation and linear to rotational). Our advancements to the previous art are
documented in Sections 2 and 3. In section 4, to enhance the performance further upon the
existing technology we introduce a new method to harvest vibration energy. To illustrate how we
improve and add to the existing literature we will review the performance of the state of the art in
terms of volume and bandwidth figures of merit. These figure of merits were introduced in
Section 3.1.5 and provide a method for fairly comparing the performance of inductive prototypes
by normalizing by volume and available mechanical energy based on the device volume and
vibration amplitude and frequency. Figure 7.1 displays the state of art before the work described
in the dissertation was completed. Throughout the dissertation the energy harvesters are applied
to various applications which require power on the order of 12-82 mW. Given the acceleration
and frequencies which are available for harvesting in these applications, using existing four-bar
magnet and magnetic levitation the volume of the harvester would have to be greater than 100
cm^3 as shown in Figure 1.1 (b). From Figure 7.1 it is clear that overall the magnetic levitation
prototype is preferred over the four-bar magnet and linear to rotational prototypes. Although for
applications with vibration source frequencies over 50 Hz the magnetic levitation prototypes
cannot be used due to the method by which the stiffness is created. The magnetic repulsion can
be increased to increase the frequency but higher amplitudes than typical in environment are
required to excite the harvester, therefore we also developed the four-bar magnet technology
further. Figure 7.1 shows that there is a large difference in the two four-bar magnet prototypes
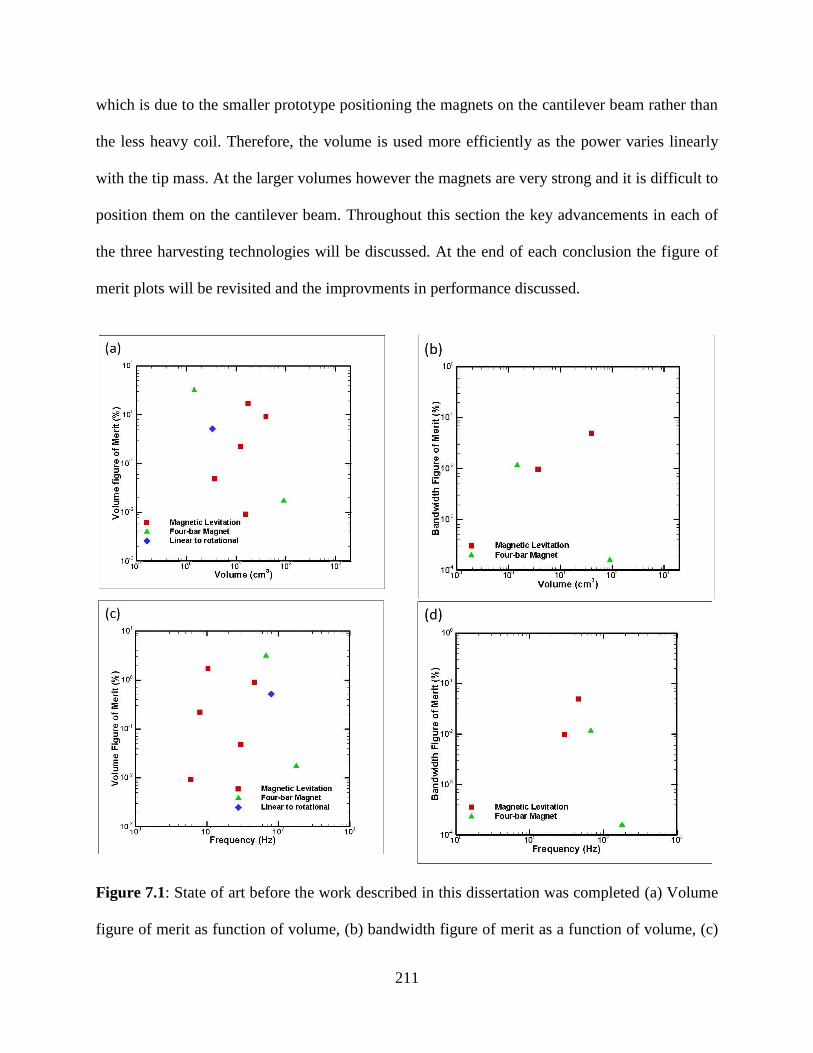
211
which is due to the smaller prototype positioning the magnets on the cantilever beam rather than
the less heavy coil. Therefore, the volume is used more efficiently as the power varies linearly
with the tip mass. At the larger volumes however the magnets are very strong and it is difficult to
position them on the cantilever beam. Throughout this section the key advancements in each of
the three harvesting technologies will be discussed. At the end of each conclusion the figure of
merit plots will be revisited and the improvments in performance discussed.
Figure 7.1: State of art before the work described in this dissertation was completed (a) Volume
figure of merit as function of volume, (b) bandwidth figure of merit as a function of volume, (c)
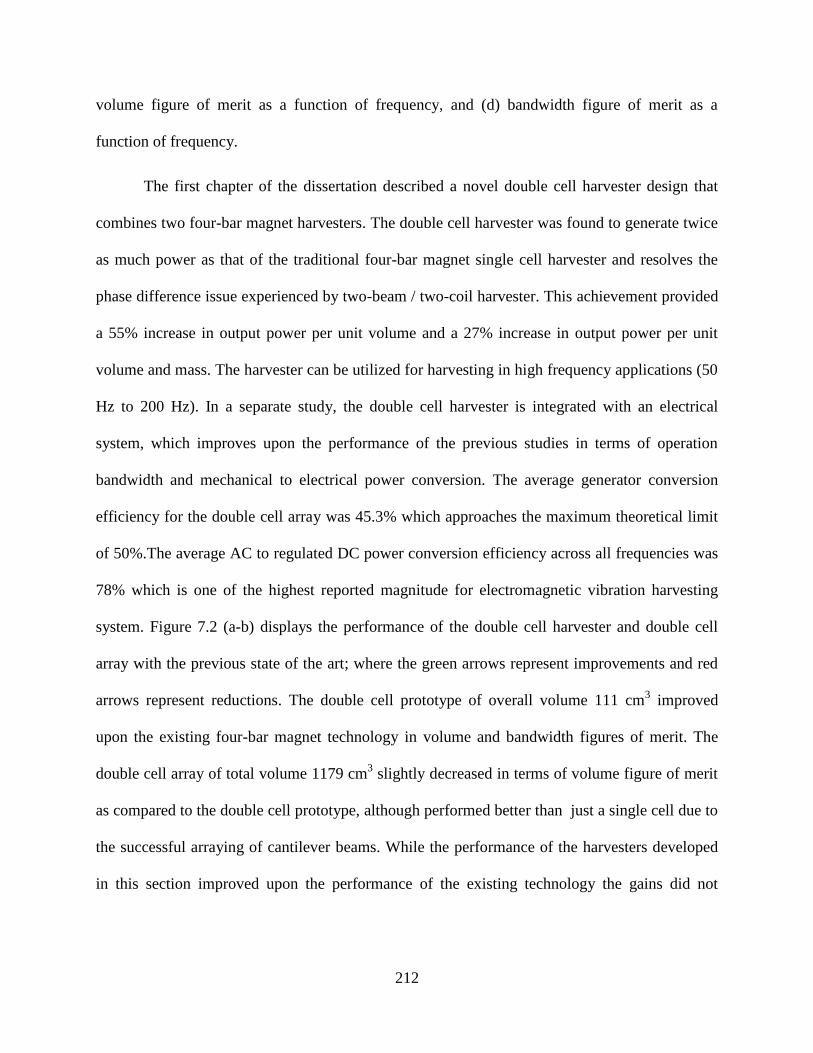
212
volume figure of merit as a function of frequency, and (d) bandwidth figure of merit as a
function of frequency.
The first chapter of the dissertation described a novel double cell harvester design that
combines two four-bar magnet harvesters. The double cell harvester was found to generate twice
as much power as that of the traditional four-bar magnet single cell harvester and resolves the
phase difference issue experienced by two-beam / two-coil harvester. This achievement provided
a 55% increase in output power per unit volume and a 27% increase in output power per unit
volume and mass. The harvester can be utilized for harvesting in high frequency applications (50
Hz to 200 Hz). In a separate study, the double cell harvester is integrated with an electrical
system, which improves upon the performance of the previous studies in terms of operation
bandwidth and mechanical to electrical power conversion. The average generator conversion
efficiency for the double cell array was 45.3% which approaches the maximum theoretical limit
of 50%.The average AC to regulated DC power conversion efficiency across all frequencies was
78% which is one of the highest reported magnitude for electromagnetic vibration harvesting
system. Figure 7.2 (a-b) displays the performance of the double cell harvester and double cell
array with the previous state of the art; where the green arrows represent improvements and red
arrows represent reductions. The double cell prototype of overall volume 111 cm3 improved
upon the existing four-bar magnet technology in volume and bandwidth figures of merit. The
double cell array of total volume 1179 cm3 slightly decreased in terms of volume figure of merit
as compared to the double cell prototype, although performed better than just a single cell due to
the successful arraying of cantilever beams. While the performance of the harvesters developed
in this section improved upon the performance of the existing technology the gains did not
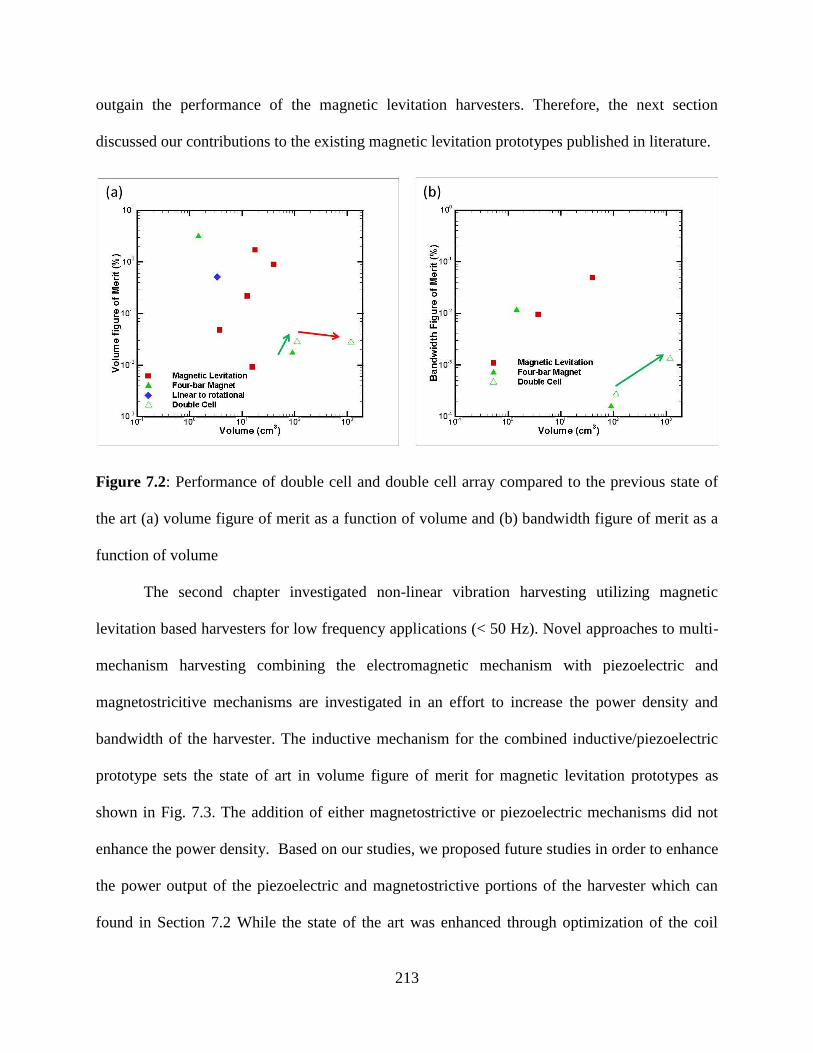
213
outgain the performance of the magnetic levitation harvesters. Therefore, the next section
discussed our contributions to the existing magnetic levitation prototypes published in literature.
Figure 7.2: Performance of double cell and double cell array compared to the previous state of
the art (a) volume figure of merit as a function of volume and (b) bandwidth figure of merit as a
function of volume
The second chapter investigated non-linear vibration harvesting utilizing magnetic
levitation based harvesters for low frequency applications (< 50 Hz). Novel approaches to multi-
mechanism harvesting combining the electromagnetic mechanism with piezoelectric and
magnetostricitive mechanisms are investigated in an effort to increase the power density and
bandwidth of the harvester. The inductive mechanism for the combined inductive/piezoelectric
prototype sets the state of art in volume figure of merit for magnetic levitation prototypes as
shown in Fig. 7.3. The addition of either magnetostrictive or piezoelectric mechanisms did not
enhance the power density. Based on our studies, we proposed future studies in order to enhance
the power output of the piezoelectric and magnetostrictive portions of the harvester which can
found in Section 7.2 While the state of the art was enhanced through optimization of the coil
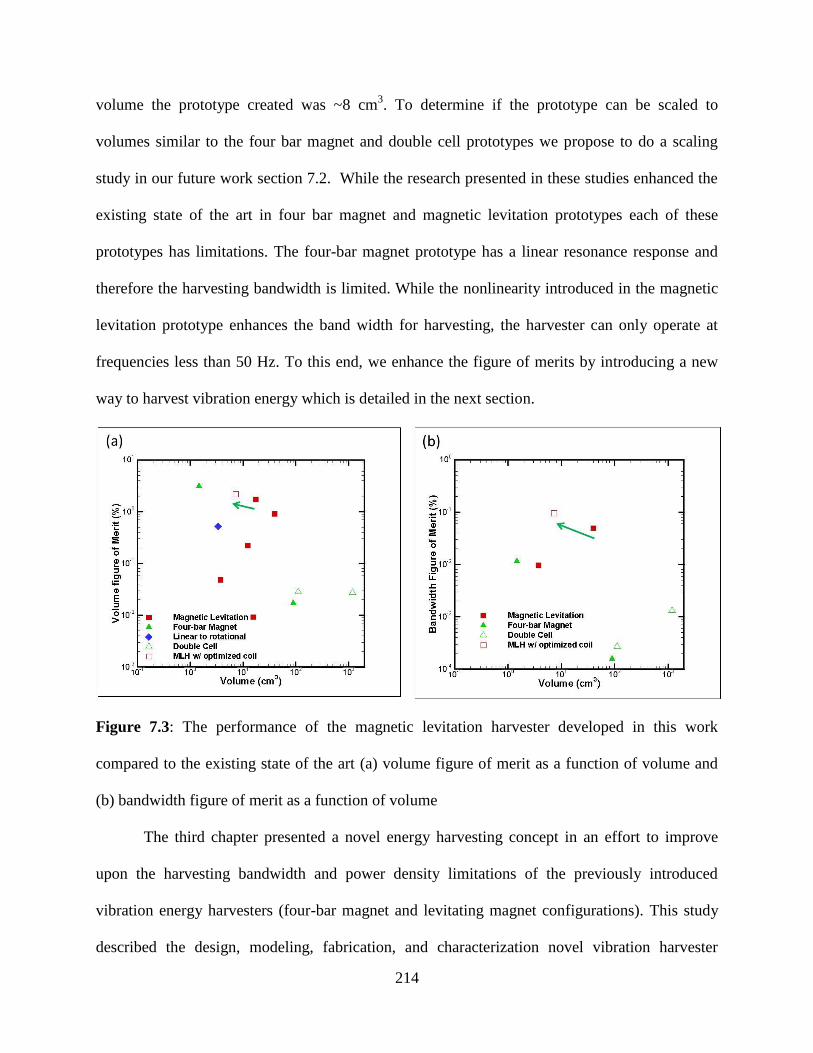
214
volume the prototype created was ~8 cm3. To determine if the prototype can be scaled to
volumes similar to the four bar magnet and double cell prototypes we propose to do a scaling
study in our future work section 7.2. While the research presented in these studies enhanced the
existing state of the art in four bar magnet and magnetic levitation prototypes each of these
prototypes has limitations. The four-bar magnet prototype has a linear resonance response and
therefore the harvesting bandwidth is limited. While the nonlinearity introduced in the magnetic
levitation prototype enhances the band width for harvesting, the harvester can only operate at
frequencies less than 50 Hz. To this end, we enhance the figure of merits by introducing a new
way to harvest vibration energy which is detailed in the next section.
Figure 7.3: The performance of the magnetic levitation harvester developed in this work
compared to the existing state of the art (a) volume figure of merit as a function of volume and
(b) bandwidth figure of merit as a function of volume
The third chapter presented a novel energy harvesting concept in an effort to improve
upon the harvesting bandwidth and power density limitations of the previously introduced
vibration energy harvesters (four-bar magnet and levitating magnet configurations). This study
described the design, modeling, fabrication, and characterization novel vibration harvester
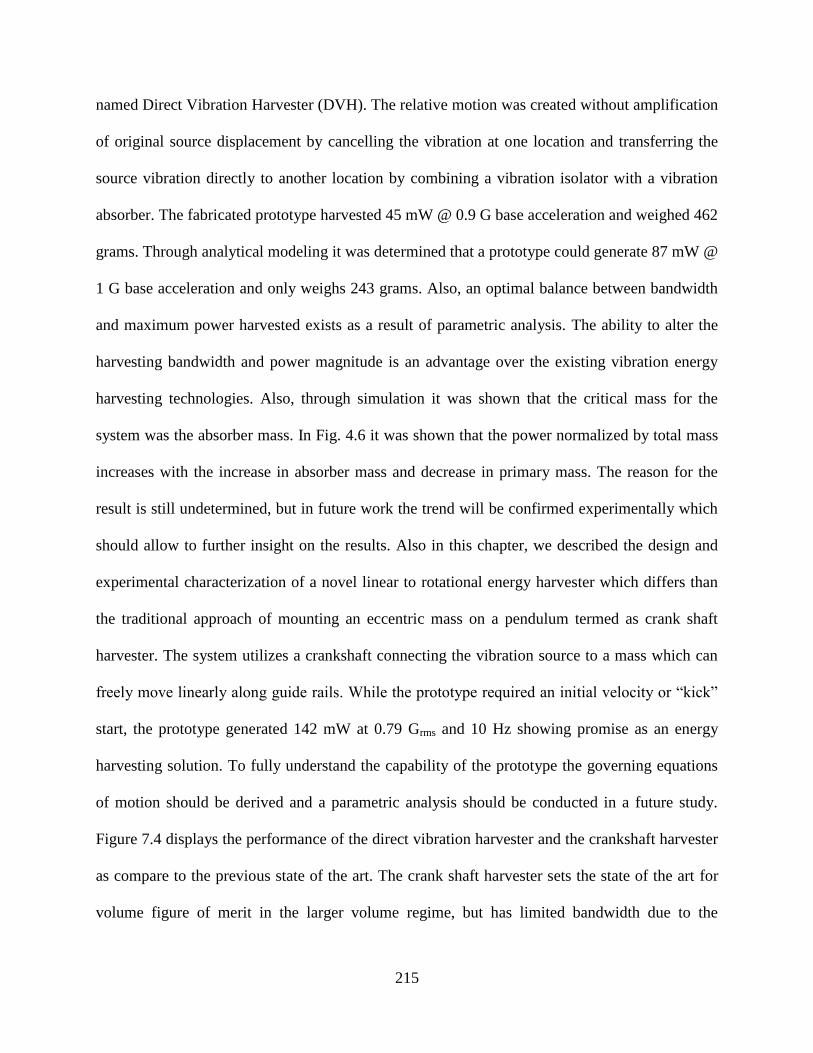
215
named Direct Vibration Harvester (DVH). The relative motion was created without amplification
of original source displacement by cancelling the vibration at one location and transferring the
source vibration directly to another location by combining a vibration isolator with a vibration
absorber. The fabricated prototype harvested 45 mW @ 0.9 G base acceleration and weighed 462
grams. Through analytical modeling it was determined that a prototype could generate 87 mW @
1 G base acceleration and only weighs 243 grams. Also, an optimal balance between bandwidth
and maximum power harvested exists as a result of parametric analysis. The ability to alter the
harvesting bandwidth and power magnitude is an advantage over the existing vibration energy
harvesting technologies. Also, through simulation it was shown that the critical mass for the
system was the absorber mass. In Fig. 4.6 it was shown that the power normalized by total mass
increases with the increase in absorber mass and decrease in primary mass. The reason for the
result is still undetermined, but in future work the trend will be confirmed experimentally which
should allow to further insight on the results. Also in this chapter, we described the design and
experimental characterization of a novel linear to rotational energy harvester which differs than
the traditional approach of mounting an eccentric mass on a pendulum termed as crank shaft
harvester. The system utilizes a crankshaft connecting the vibration source to a mass which can
freely move linearly along guide rails. While the prototype required an initial velocity or “kick”
start, the prototype generated 142 mW at 0.79 Grms and 10 Hz showing promise as an energy
harvesting solution. To fully understand the capability of the prototype the governing equations
of motion should be derived and a parametric analysis should be conducted in a future study.
Figure 7.4 displays the performance of the direct vibration harvester and the crankshaft harvester
as compare to the previous state of the art. The crank shaft harvester sets the state of the art for
volume figure of merit in the larger volume regime, but has limited bandwidth due to the
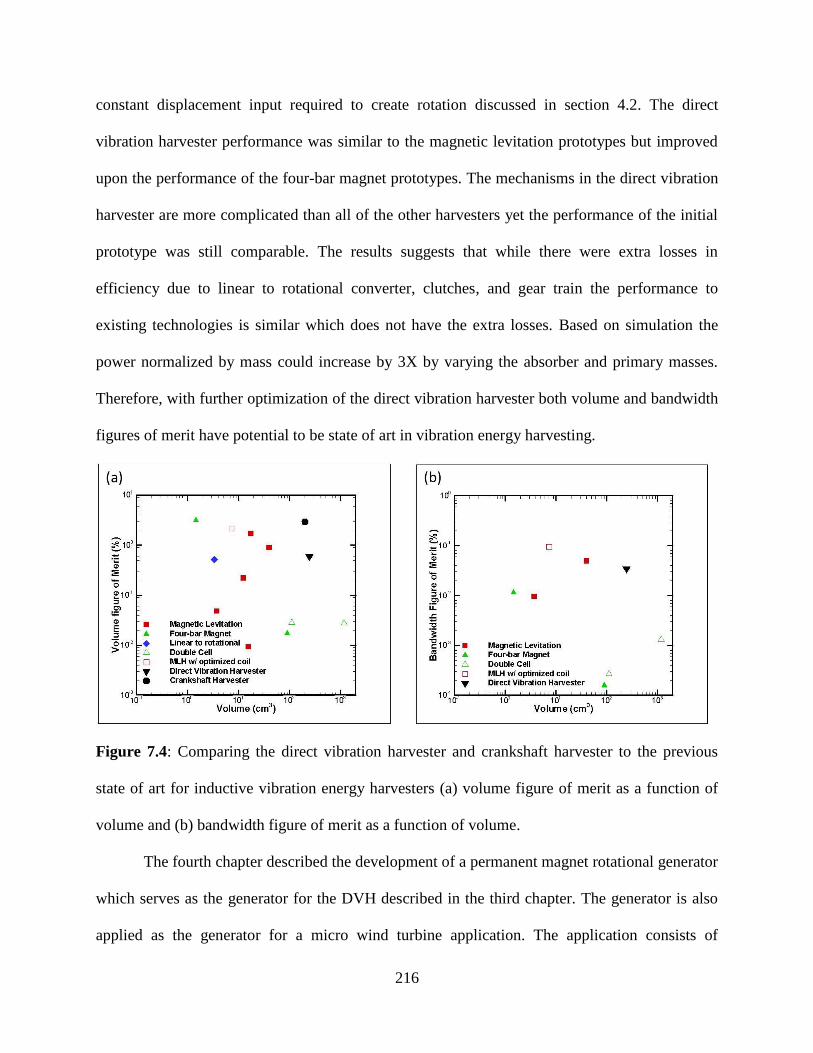
216
constant displacement input required to create rotation discussed in section 4.2. The direct
vibration harvester performance was similar to the magnetic levitation prototypes but improved
upon the performance of the four-bar magnet prototypes. The mechanisms in the direct vibration
harvester are more complicated than all of the other harvesters yet the performance of the initial
prototype was still comparable. The results suggests that while there were extra losses in
efficiency due to linear to rotational converter, clutches, and gear train the performance to
existing technologies is similar which does not have the extra losses. Based on simulation the
power normalized by mass could increase by 3X by varying the absorber and primary masses.
Therefore, with further optimization of the direct vibration harvester both volume and bandwidth
figures of merit have potential to be state of art in vibration energy harvesting.
Figure 7.4: Comparing the direct vibration harvester and crankshaft harvester to the previous
state of art for inductive vibration energy harvesters (a) volume figure of merit as a function of
volume and (b) bandwidth figure of merit as a function of volume.
The fourth chapter described the development of a permanent magnet rotational generator
which serves as the generator for the DVH described in the third chapter. The generator is also
applied as the generator for a micro wind turbine application. The application consists of

217
harvesting airflow within HVAC ducts in residential and commercial buildings to power various
sensors. HVAC ducts within Durham hall were modified in order to provide an experimental
platform to evaluate the capability of the harvester. A computational model to optimize overall
micro wind turbine efficiency was presented and validated experimentally with micro wind
turbine prototype. The micro wind turbine prototype set the state of the art in terms of power
density.
Lastly, the fifth chapter describes the implementation of the various energy harvesters in
a “smart building”. To this end, an additional energy harvester is developed which can be
integrated into a common pen, and used to monitor the location and condition of the human
within the building.
7.2 Future work
In Section 3.1 we designed, fabricated, and characterized an energy harvester which
combined the inductive mechanism with a magnetostrictive mechanism. The prototype used a
cylindrical shaped piece of Galfenol with an inductive coil wrapped around it. This configuration
in the other studies has shown promise for harvesting of high force - high frequency vibration.
We attempted to utilize this geometry for the low force - low frequency repulsive force through
the magnetic levitation harvester and determined that it was not suitable in this regime. To this
end, a second configuration was also fabricated and characterized which included a Galfenol
cantilever at the bottom of the harvester. Two additional magnets were added at the bottom of
the harvester with reverse polarity so as to not affect the dynamic performance of the inductive
mechanism. The reversal in magnetic field within the cantilever during oscillation causes a
magnetic flux change through a coil which is wrapped around the cantilever beam. This
configuration was previously developed by Xing et. al, who had two rectangular bar magnets to
218
apply the bias [130]. Our modification in using three cylindrical magnets arranged with opposite
polarity should lead to an increase in power normalized by volume and mass. In order to achieve
resonance at the low frequencies we mounted a cantilever beam at the base of the harvester in
order to generate higher strain than with the cylindrical configuration. Higher strain leads to
greater change in magnetic permeability in the Galfenol and therefore higher flux change within
the coil. Figure 7.5 displays a picture of the fabricated prototype.
Figure 7.5: Picture of magnetostrictive cantilever beam prototype
In Section 3.2 we combined the inductive mechanism with the piezoelectric mechanism.
The piezoelectric mechanism underwent no optimization; simply the groundwork for the
optimization was established. The simulations showed that the brass cap could increase the
power output by ~53%. An optimization study varying all cymbal parameters and materials
should be conducted in the future to increase the power output of the piezoelectric mechanism.
219
Throughout this thesis, three very different size scale levitating magnet prototypes (400
cm3, 8 cm
3, and 1 cm
3) were experimentally characterized. To this date, there has not been an
experimental study that clearly identifies how the performance of these prototypes scales with
size. In my research, key parameters have been identified which greatly affect the optimum
operation frequencies and accelerations of magnetic levitation prototypes. We derived the scaling
relationship for mass, stiffness, and electromagnetic coupling. Interactions between the different
parameters were expected. For the magnetic levitation prototype the magnetic field strength is
dependent upon the surface area and thickness of the magnet. Both of these parameters also
affect the stiffness of the system dynamics of the harvester therefore, can only be increased to
limited extent. The use of a center magnet composite instead of a single cylindrical magnet
creates an increase in magnetic field strength and aligns the magnetic fields perpendicular to the
coil. Unlike the four bar magnet prototype, the optimization of the coil shape does not increase
the power output. For the magnetic levitation prototype the coil volume (outer radius and height)
was optimized. At some outer radius of the coil, the gain in voltage transduction from the
additional magnetic field is cancelled by the additional resistive losses in the coil due to the
decay of the magnetic field in the radial direction. This optimization was utilized in a previous
study to determine the coil volume in the radial direction [52]. Also the coil height must be
optimized, as the range of motion of the center magnet was large as compared to the height of
the coil. This height was optimized to decrease the amount of cancellation of voltage
transduction within the coil due to direction of the magnetic fields. Therefore, coil height,
magnetic field strength (outer radius), and stiffness in the dynamic system are all interrelated.
The relationships are summarized in Fig. 7.6. The results from the study should provide a
blueprint for levitating magnet harvester design.
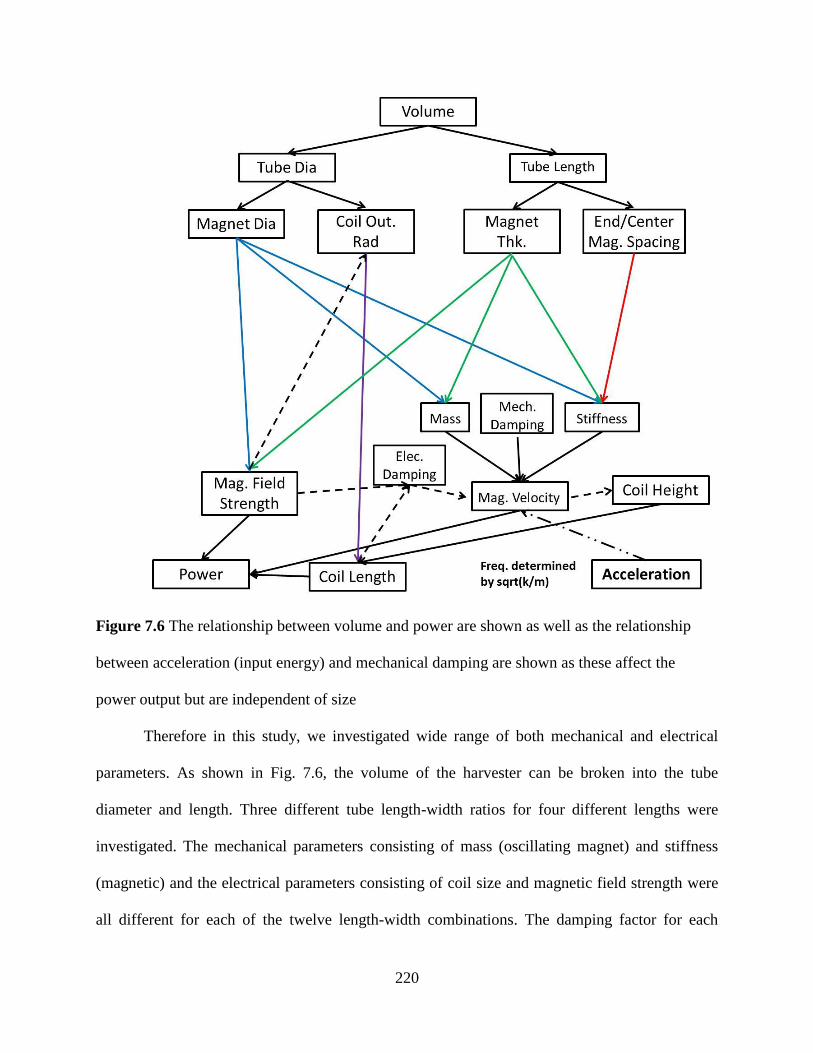
220
Figure 7.6 The relationship between volume and power are shown as well as the relationship
between acceleration (input energy) and mechanical damping are shown as these affect the
power output but are independent of size
Therefore in this study, we investigated wide range of both mechanical and electrical
parameters. As shown in Fig. 7.6, the volume of the harvester can be broken into the tube
diameter and length. Three different tube length-width ratios for four different lengths were
investigated. The mechanical parameters consisting of mass (oscillating magnet) and stiffness
(magnetic) and the electrical parameters consisting of coil size and magnetic field strength were
all different for each of the twelve length-width combinations. The damping factor for each
221
prototype at three different levels was also varied. Each of the configurations needs to be
analyzed with focus on characterizing the effect of harvester dimension on the operation
frequency and power generation. Existing experimental data can then be used to compare with
the analytical results. The results from the study should provide guideline for designing
electromagnetic magnetic levitation prototype for a wide range of applications.
In Section 4.1, the performance of a novel vibration energy harvester termed as direct
vibration harvester was investigated. The overall mechanical energy to electrical energy
efficiency was assumed to be 62% based upon an empirical analysis. A more detailed theory
would consist of performing an energy analysis which will be conducted in a future study. The
energy loss between the shaker arm and primary shaft (linear to rotational conversion efficiency),
generator efficiency and overall energy loss between the shaker arm to generator (harvesting
efficiency) will be calculated. To calculate energy at each of the locations the mass and mass
moment of inertias need to be calculated. The equivalent inertia which can be used to calculate
the rotational energy within the primary shaft is determined by Eq. 7.1:
(7.1)
In addition to the energy analysis the theoretical analysis descibeied in Sec. 4.1.3 should be
expanded to a full parametric analysis in order to optimize the prototype.
In Section 4.2 we describe the design and experimental characterization of a novel linear
to rotational energy harvester which differs than the traditional approach of mounting an
eccentric mass on a pendulum. The system utilizes a crankshaft connecting the vibration source
to a mass which can freely move linearly along guide rails. While the prototype required an
initial velocity or “kick” start, the prototype generated 142 mW at 0.79 Grms and 10 Hz showing

222
promise as an energy harvesting solution. To fully understand the capability of the prototype the
governing equations of motion should be derived and a parametric analysis should be conducted.
In Section 5.1 we described an analytical model which can be used to design a generator
to optimally operate at the maximum coefficient of power for a given set of blades maximizing
overall system efficiency. In Section 5.2 we used the model to design a generator to operate near
the optimum point. While the state-of-the-art was achieved with the 4th
generation generator, still
there was room for improvement. Through further experimentation, the extent to which the
system efficiency can be enhanced through increasing and decreasing will be determined.
Again the physical limitation is the magnetic field strength which varies with magnet thickness.
Also, the integration of gear train to operate at matching torques but with different velocities
should be investigated to determine the performance. We also plan to implement the prototype
in a HVAC duct for powering a wireless motion sensor. HVAC ducts in Durham Hall can serve
as a useful experimental platform.
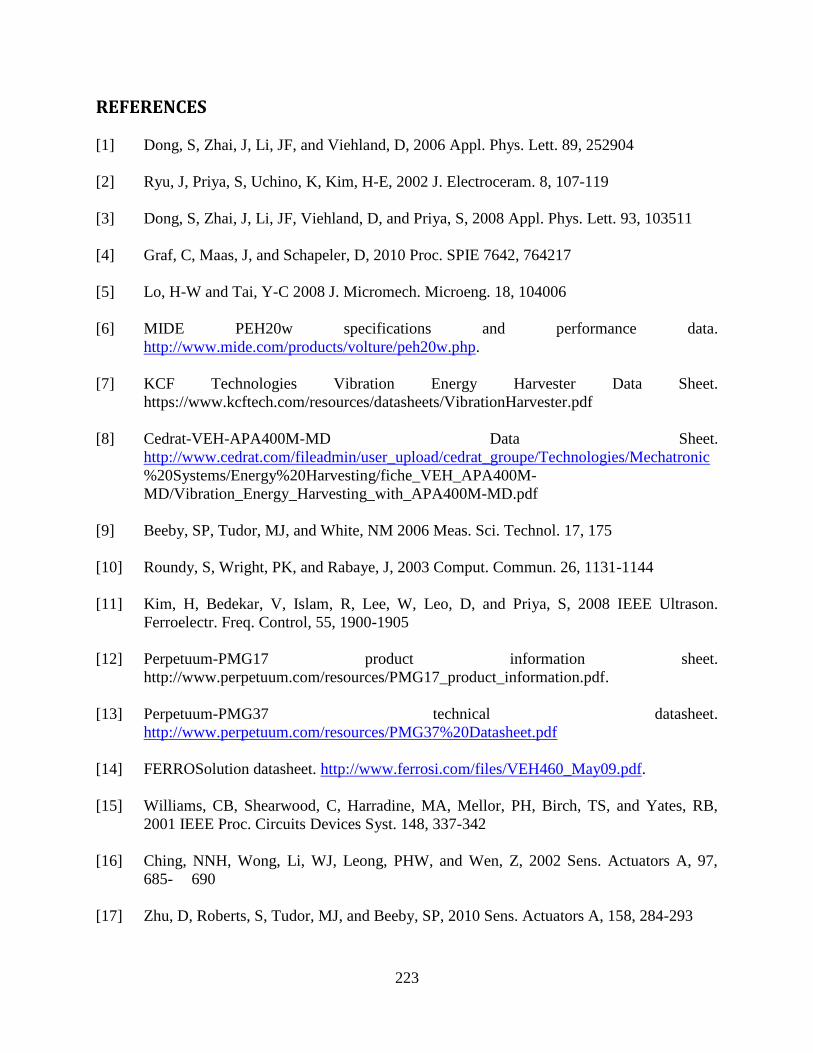
223
REFERENCES
[1] Dong, S, Zhai, J, Li, JF, and Viehland, D, 2006 Appl. Phys. Lett. 89, 252904
[2] Ryu, J, Priya, S, Uchino, K, Kim, H-E, 2002 J. Electroceram. 8, 107-119
[3] Dong, S, Zhai, J, Li, JF, Viehland, D, and Priya, S, 2008 Appl. Phys. Lett. 93, 103511
[4] Graf, C, Maas, J, and Schapeler, D, 2010 Proc. SPIE 7642, 764217
[5] Lo, H-W and Tai, Y-C 2008 J. Micromech. Microeng. 18, 104006
[6] MIDE PEH20w specifications and performance data.
http://www.mide.com/products/volture/peh20w.php.
[7] KCF Technologies Vibration Energy Harvester Data Sheet.
https://www.kcftech.com/resources/datasheets/VibrationHarvester.pdf
[8] Cedrat-VEH-APA400M-MD Data Sheet.
http://www.cedrat.com/fileadmin/user_upload/cedrat_groupe/Technologies/Mechatronic
%20Systems/Energy%20Harvesting/fiche_VEH_APA400M-
MD/Vibration_Energy_Harvesting_with_APA400M-MD.pdf
[9] Beeby, SP, Tudor, MJ, and White, NM 2006 Meas. Sci. Technol. 17, 175
[10] Roundy, S, Wright, PK, and Rabaye, J, 2003 Comput. Commun. 26, 1131-1144
[11] Kim, H, Bedekar, V, Islam, R, Lee, W, Leo, D, and Priya, S, 2008 IEEE Ultrason.
Ferroelectr. Freq. Control, 55, 1900-1905
[12] Perpetuum-PMG17 product information sheet.
http://www.perpetuum.com/resources/PMG17_product_information.pdf.
[13] Perpetuum-PMG37 technical datasheet.
http://www.perpetuum.com/resources/PMG37%20Datasheet.pdf
[14] FERROSolution datasheet. http://www.ferrosi.com/files/VEH460_May09.pdf.
[15] Williams, CB, Shearwood, C, Harradine, MA, Mellor, PH, Birch, TS, and Yates, RB,
2001 IEEE Proc. Circuits Devices Syst. 148, 337-342
[16] Ching, NNH, Wong, Li, WJ, Leong, PHW, and Wen, Z, 2002 Sens. Actuators A, 97,
685- 690
[17] Zhu, D, Roberts, S, Tudor, MJ, and Beeby, SP, 2010 Sens. Actuators A, 158, 284-293
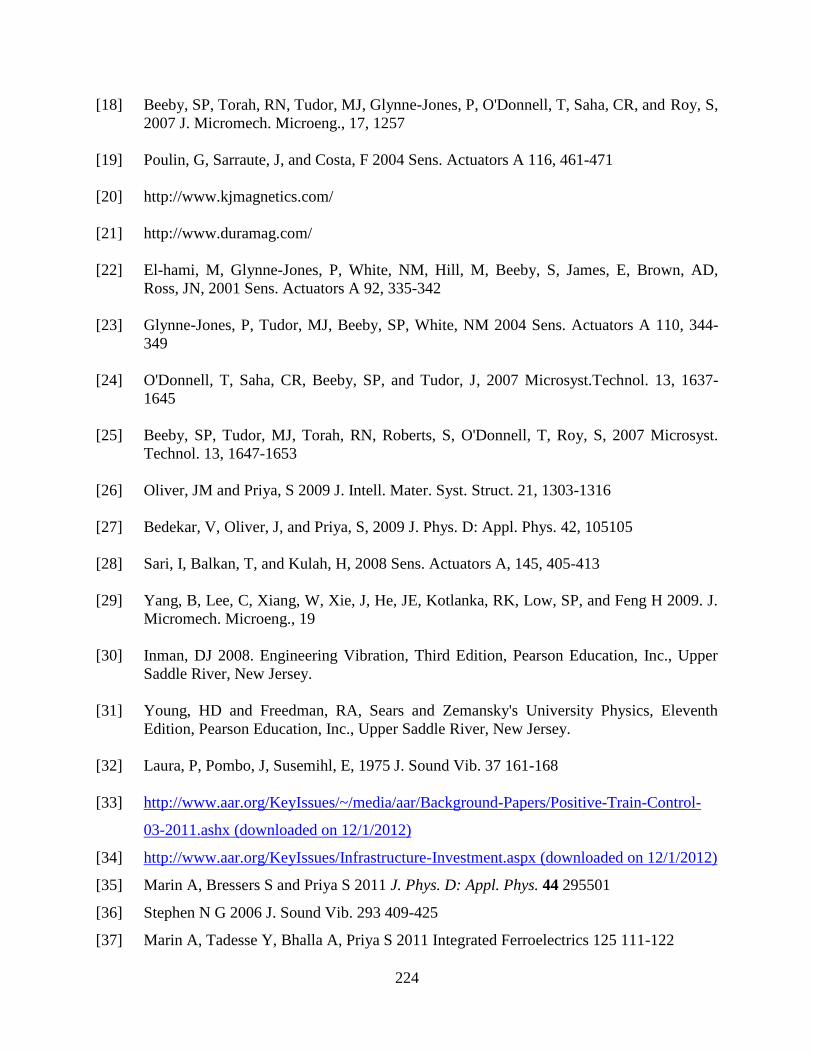
224
[18] Beeby, SP, Torah, RN, Tudor, MJ, Glynne-Jones, P, O'Donnell, T, Saha, CR, and Roy, S,
2007 J. Micromech. Microeng., 17, 1257
[19] Poulin, G, Sarraute, J, and Costa, F 2004 Sens. Actuators A 116, 461-471
[20] http://www.kjmagnetics.com/
[21] http://www.duramag.com/
[22] El-hami, M, Glynne-Jones, P, White, NM, Hill, M, Beeby, S, James, E, Brown, AD,
Ross, JN, 2001 Sens. Actuators A 92, 335-342
[23] Glynne-Jones, P, Tudor, MJ, Beeby, SP, White, NM 2004 Sens. Actuators A 110, 344-
349
[24] O'Donnell, T, Saha, CR, Beeby, SP, and Tudor, J, 2007 Microsyst.Technol. 13, 1637-
1645
[25] Beeby, SP, Tudor, MJ, Torah, RN, Roberts, S, O'Donnell, T, Roy, S, 2007 Microsyst.
Technol. 13, 1647-1653
[26] Oliver, JM and Priya, S 2009 J. Intell. Mater. Syst. Struct. 21, 1303-1316
[27] Bedekar, V, Oliver, J, and Priya, S, 2009 J. Phys. D: Appl. Phys. 42, 105105
[28] Sari, I, Balkan, T, and Kulah, H, 2008 Sens. Actuators A, 145, 405-413
[29] Yang, B, Lee, C, Xiang, W, Xie, J, He, JE, Kotlanka, RK, Low, SP, and Feng H 2009. J.
Micromech. Microeng., 19
[30] Inman, DJ 2008. Engineering Vibration, Third Edition, Pearson Education, Inc., Upper
Saddle River, New Jersey.
[31] Young, HD and Freedman, RA, Sears and Zemansky's University Physics, Eleventh
Edition, Pearson Education, Inc., Upper Saddle River, New Jersey.
[32] Laura, P, Pombo, J, Susemihl, E, 1975 J. Sound Vib. 37 161-168
[33] http://www.aar.org/KeyIssues/~/media/aar/Background-Papers/Positive-Train-Control-
03-2011.ashx (downloaded on 12/1/2012)
[34] http://www.aar.org/KeyIssues/Infrastructure-Investment.aspx (downloaded on 12/1/2012)
[35] Marin A, Bressers S and Priya S 2011 J. Phys. D: Appl. Phys. 44 295501
[36] Stephen N G 2006 J. Sound Vib. 293 409-425
[37] Marin A, Tadesse Y, Bhalla A, Priya S 2011 Integrated Ferroelectrics 125 111-122
225
[38] Perpetuum-PMG FSH product information sheet.
http://www.perpetuum.com/resources/PMG%20FSH%20Datasheet.pdf Downloaded on
10/3/12
[39] Torah R, Glynne-Jones P, Tudor M, O'Donnell T, Roy S and Beeby S 2008 Meas. Sci.
Technol. 19 125202
[40] Yuen S C L, Lee J M H, Li W J, and Leong P H W 2007 IEEE Pervas. Comput. 6 64-72
[41] Morais R, Silva N M, Santos P M, Frias C M, Ferreira J A F, Ramos A M, Simoes J A O,
Baptista, J M R and Reis M C 2011 Sens. Act. A 172 259-268
[42] Arroyo E and Badel A 2011 Sens. Act. A 171 266-273
[43] Maurath D, Becker P F, Spreemann D and Manoli Y 2012 IEEE J. Solid-State Circuits 47
1369-1379
[45] Kong N, Ha D S, Erturk A and Inman D J 2010 J. Intel. Mat. Syst. Str. 21 1293–1302
[46] http://ict.uiuc.edu/railroad/CEE/pdf/PPT%27s/previousppts/univ_illinois_shust.pdf
(downloaded on 11/30/12)
[47] http://www.atsconsulting.com/PDF_Files/High%20Speed%20Rail%20Vibs.pdf
(downloaded on 11/30/12)
[48] Challa V R, Cheng S, and Arnold D P 2013 Smart Mater. Struct 22 025005
[49] Mitcheson P D, Yeatman EM, Rao G K 2008 Proc. IEEE 96 (9) 1457-1486
[50] Galchev T, Hanseup K, and Najafi K 2011 J. Microelectromech. Syst. 20(4) 852-866
[51] Constantinou P, Mellor PH, and Wilcox P 2007 Electric Machines & Drives Conference,
2007. IEEE International.
[52] Marin A and Priya S 2012 Proc. of SPIE 8341
[53] http://www.dustnetworks.com/applications/transportation
[54] http://www.dhs.gov/files/programs/gc_1218476542736.shtm
[55] http://www.fhwa.dot.gov/publications/research/general/11053/index.cfm
[56] http://www.cs.berkeley.edu/~binetude/ggb/
[57] Kim H, Priya S and Uchino K: Energy scavenging in Automobile Applications.
ACTUATOR Conf. Bremen, Germany; 2004.
[58] Taylor GW, Burns JR, Kammann SM, Powers WB and Welsh TR: The Energy
Harvesting Eel: a small subsurface ocean/river power generator. IEEE J Oceanic Eng.
2001; 26: 539-547.
226
[59] Priya S: Advances in Energy Harvesting Using Low Profile Piezoelectric Transducers. J
Electroceram. 2007; 19: 165 – 182.
[60] Chen C and Priya S: Electric Energy Generator. IEEE Trans Ultrason Ferroelectr Freq
Control. 2006; 53(3): 656-661.
[61] Jingqiu H, Ogai H, Shao C, Zheng J, Maruyama I, Nagata S, and Inujima H. (2010). On
vibration signal analysis in Bridge Health Monitoring System by using Independent
Component Analysis. SICE Annual Conference 2010, Proceedings of.
[62] Turner JD and Pretlove AJ (1988). "A study of the spectrum of traffic-induced bridge
vibration." Journal of Sound and Vibration 122(1): 31-42.
[63] Whelan MJ, Gangone MV, Janoyan KD, Cross K, and Jha R, “Reliable high-rate bridge
monitoring using dense wireless sensor arrays,” in Proc. 6th Int’l. Workshop on
Structural Health Monitoring 2007, pp. 1207–1215.
[64] Singh SP, Sandhu APS, Singh J, Joneson E (2007). "Measurement and analysis of truck
and rail shipping environment in India." Packaging Technology and Science 20(6): 381-
392.
[65] Garcia-Romeu-Martinez M-A, Singh SP, Cloquell-Ballester V-A. (2008). "Measurement
and analysis of vibration levels for truck transport in Spain as a function of payload,
suspension and speed." Packaging Technology and Science 21(8): 439-451.
[66] Chonhenchob V, Singh SP, Singh JJ, Sittipod S, Swasdee D, Pratheepthinthong S.
(2010). "Measurement and analysis of truck and rail vibration levels in Thailand."
Packaging Technology and Science 23(2): 91-100.
[67] Singh SP, Saha K, Singh J, Sandhu APS. (2011). "Measurement and Analysis of
Vibration and Temperature Levels in Global Intermodal Container Shipments on Truck,
Rail and Ship." Packaging Technology and Science: n/a-n/a.
[68] http://www.eagle.org/eagleExternalPortalWEB/ShowProperty/BEA
Repository/Rules&Guides/Current/147_ShipVibration/Pub147_ShipVib. Downloaded on
10/3/12
[69] Dallago E, Marchesi M, and Venchi G, 2010 Power Electronics, IEEE Transactions on
25(8): 1989-1997
[70] Saha CR, O’Donnell T, Wang N, McCloskey P 2008 Sens Actuators A., 147: 248-253
[71] Mann BP and Sims ND 2009 Journal of Sound and Vibration, 319: 515-530.
227
[72] Bonisoli E, Canova A, Freschi F, Moos S, Repetto M, Tornincasa S. 2010 Magnetics,
IEEE Transactions on 46(8): 2856-2859.
[73] Tadesse Y, Zhang S and Priya S: Multimodal energy harvesting system: piezoelectric and
electromagnetic. J Int Mater Syst Struct. 2009; 20: 625–632.
[74] Lundgren A, Tiberg H, Kvarnsjo L, Bergqvis A, and Engdahl G. 1993 Magnetics, IEEE
Transactions on 29(6): 3150-3152.
[75] Zhao X and Lord DG: 2006 J Appl Phys.; 99 08M703.
[76] Berbyuk V. and Sodhani J. 2008 Computers & Structures 86(3–5): 307-313.
[77] Berbyuk V. 2011 Structural Dynamics and Renewable Energy, Volume 1. T. Proulx,
Springer New York. 10: 199-210.
[78] Budynas RJ and Nisbett JK, 2008. Shigley’s Mechanical Engineering Design, Eighth
Edition, McGraw-Hill Companies, Inc., New York, NY.
[79] Nakano K, Elliott S, and Rustighi E, 2007 Smart Mater Struct. 16: 948-958.
[80] Brennan MJ, Kovacic I, Carrella A, and Waters, TP 2008 Journal of Sound and Vibration
318(4-5): 1250-1261.
[81] Rahimi A, Zorlu O, Muhtaroglu A, and Kulah H 2012 Sensors Journal, IEEE 12(6):
2287-2298.
[82] Summers, E, Meloy, R, and Restorff, JB 2009 J Appl Phys., 106 024914
[83] Cedillo E, Ocampo J, Rivera V, Valenzuela R. 1980. Journal of Physics E: Scientific
Instruments 13(4): 383.
[84] Yoo J-H, Pelligrini G, Datta S, and Flatau AB 2011 Smart Materials and Structures
20(7): 075008.
[85] Ueno T, Summers E, Lograsso T, Higuchi T 2005 Proc. SPIE 5761
[86] Glathart JL 1939 Physical Review 55(9): 833-838.
[87] Ueno T and Higuchi T 2007 Micro-NanoMechatronics and Human Science
[88] Wun-Fogle M, Restorff JB, and Clark AE, 2006 IEEE Transactions on Magnetics, 42: 10,
3120-3122.
[89] http://www.cbp.gov/xp/cgov/trade/cargo_security/
[90] http://www.cmoset.com/uploads/WP_AE_01_RandomVibeWSN.pdf
[91] Kim, H., Priya, S., and Uchino, K., 2006 Jpn. J. Appl. Phys. 45 5836
228
[92] Cornwell P J, Goethal J, Kowko J, and Damianakis M 2005 J. Intell. Mater. Syst. Struct.
16 825-834
[93] Lee S, Youn B D, and Jung B C 2009 Smart Mater. Struct. 18 095021
[94] Chtiba O M, Choura S, Nayfeh A H and El-Borgi, S 2010 329 261-276
[95] Ma P S, Kim J E, and Kim Y Y 2010 Proc. of SPIE 7643
[96] Aldraihem O and Baz A 2011 J. Intell. Mater. Syst. Struct. 22 521-530
[97] Arafa M, Akl W, Aladwani A, Aldraihem O, and Baz A 2011 Proc. of SPIE 7977
[98] Tang X and Zuo L 2011 J. Sound Vib. 330 5199-5209
[99] Li W, Liu T S, and Hsiao CC 2011 Mechatronics 21 1183-1189.
[100] Zhou W, Penamalli G R, and Zuo L 2012 Smart Mater. Struct. 21 015014
[101] Li Z, Zuo L, Kuang J, and Luhrs G 2013 Smart Mater. Struct. 22 025008
[102] http://global.epson.com/company/corporate_history/milestone_products/pdf/19_ags.pdf
[103] Spreemann D, Manoli Y, Folkmer B, and Mintenbeck D 2006 J. Micromech. Microeng.
16 S169-S173
[104] Toh T T, Mitcheson P D, Holmes A S, and Yeatman E 2008 J. Micromech. Microeng. 18
104008
[105] Lu C H, Wang Y J, Sung C K, and Chao P C P 2011 IEEE Trans. Magnetics 47 10 2395-
2398
[106] Chao P C P, Shao C I, Lu C X, Sung C K 2011 Microsyst. Technol 17 1025-1036
[107] Romero E, Warrington R O, and Neuman M R 2009 IEEE EMBS 2752-2755
[108] Romero E, Neuman M R, and Warrington R O 2009 PowerMEMS 2009 237-240
[109] Romero E, Nueman M R, and Warrington R O 2011 MEMS 2011 1325-1328
[110] Wang Y-J, Chen C-D, and Sung C-K 2010 Sens. Act. A 159 2010 196-203
[111] Wang Y-J, Chen C-D, and Sung C-K 2013 IEEE/ASME Transactions on Mecatronics
18 754-763
[112] http://www.eia.gov/energyexplained/index.cfm?page=electricity_factors_affecting_prices
[113] http://www1.eere.energy.gov/buildings/index.html
[114] Carli, D, Brunelli, D, Bertozzi, D, and Benini, L 2010 Power Electronics Electrical
Drives Automation and Motion (SPEEDAM)
[115] Federspiel, CC, and Chen, J 2003. Proc. of IEEE.
229
[116] Flammini, A, Marioli, D, Sardini, E, and Serpelloni, M, 2010 Instrumentation and
Measurement Technology Conference (I2MTC), IEEE
[117] Howey, DA, Bansal, A, and Holmes, AS, 2011 Smart Materials and Structures 20(8):
085021.
[118] Kheng, YT and Panda, SK, 2011 Power Electronics, IEEE Transactions on 26(1): 38-50.
[119] Rancourt, D, Tabesh, A, and Fréchette, LC, 2007 Proc. PowerMEMS,
[120] Xu, FJ, Yuan, FG, Hu, JZ, and Qiu, YP, 2010 Proc. SPIE 7647, 764741
[121] http://newenergyandfuel.com/http:/newenergyandfuel/com/2009/04/06/japanese-
researchers-breakthrough-96-electric-motor-efficiency/
[122] Leung, DYC, Deng, Y, Leung, MKH, 2010 Proceedings of the World Congress on
Engineering Vol II
[123] Duquette, MM and Visser, KD, 2003 Journal of Solar Energy Engineering (125), 425-
432
[124] http://www.roymech.co.uk/Useful_Tables/Tribology/Bearing%20Friction.html
[125] Betz, A. Das Maximum der theoretisch möglichen Ausnützung des Windes durch
Windmotoren. Zeitschrift für das gesamte Turbinenwesen 1920; 26: 307–309
[126] Yang-Li, Y, Jian-Feng, H, Ta-Feng, T, Chia-Ching, L, and Shyh-Liang, L., 2008 Eng.
Med. Biol. Soc.,
[127] Wei, X. and Liu, J, 2008 Front. Energy Power Eng. Chin. 2(1): 1-13
[128] Jaeseok, Y, Patel, SN, Reynolds, MS, and Abowd, GD, 2011 IEEE Trans. Mob. Comput.
10(5): 669-683
[129] Naruse, Y, Matsubara, N, Mabuchi, K., Izumi, M, and Suzuki, S 2009 J. Micromech.
Microengi. 19(9): 094002
[130] Xing, X, Lou, J, Yang, GM, Obi, O, Driscoll, C, and Sun, NX 2009 Appl. Phys. Lett. 95,
134103
230
APPENDIX A: ANSYS FEA CODES
A.1 Single cell magnetic flux analysis
/PREP7
coilthickin=0.004
airgap=0.0071
magthk=0.00635
BLOCK,-airgap/2,airgap/2,-0.0254,0.0254,0.0016,0.0143
BLOCK,-airgap/2,airgap/2,-0.0254,0.0254,-0.0016,0.0016
BLOCK,-airgap/2,airgap/2,-0.0254,0.0254,-0.0016,-0.0143
BLOCK,airgap/2,(airgap/2)+magthk,-0.0254,0.0254,0.0016,0.0143
BLOCK,airgap/2,(airgap/2)+magthk,-0.0254,0.0254,-0.0016,0.0016
BLOCK,airgap/2,(airgap/2)+magthk,-0.0254,0.0254,-0.0016,-0.0143
BLOCK,-airgap/2,(-airgap/2)-magthk,-0.0254,0.0254,0.0016,0.0143
BLOCK,-airgap/2,(-airgap/2)-magthk,-0.0254,0.0254,-0.0016,0.0016
BLOCK,-airgap/2,(-airgap/2)-magthk,-0.0254,0.0254,-0.0016,-0.0143
SPHERE,0,0.0508*1.5,0,90
SPHERE,0,0.0508*1.5,90,180
SPHERE,0,0.0508*1.5,180,270
SPHERE,0,0.0508*1.5,270,360
SPHERE,0,0.0508*3,0,90
SPHERE,0,0.0508*3,90,180
SPHERE,0,0.0508*3,180,270
SPHERE,0,0.0508*3,270,360
vovlap,all
et,1,SOLID96
mp,mgxx,1,875270
mp,mgxx,2,-875270
mp,murx,1,1
mp,murx,2,1
mp,murx,3,1
231
vsel,s,,,23,,,,1
vatt,1,1,1
vsel,s,,,27,29,,,1
vatt,1,1,1
vsel,s,,,36,,,,1
vatt,2,1,1
vsel,s,,,40,42,2,,1
vatt,2,1,1
vsel,s,,,45,,,,1
vatt,2,1,1
vsel,s,,,18,21,,,1
vatt,3,1,1,
vsel,s,,,22,26,2,,1
vatt,3,1,1,
vsel,s,,,25,,,,1
vatt,3,1,1,
vsel,s,,,30,35,,,1
vatt,3,1,1,
vsel,s,,,37,39,,,1
vatt,3,1,1,
vsel,s,,,41,43,2,,1
vatt,3,1,1,
vsel,s,,,44,,,,1
vatt,3,1,1,
vsel,s,,,46,49,,,1
vatt,3,1,1,
allsel
SMRT,1
MSHAPE,1,3D
MSHKEY,0
VSEL,ALL
232
VMESH,ALL
NSEL,S,LOC,Y,-0.0254,0.0254
NSEL,R,LOC,Z,-0.0143,0.0143
NSEL,R,LOC,X,2*(-airgap/2),2*airgap/2
nrefine,all,,,3
allsel
finish
/SOLU
magsolv,3,,,,,1
finish
/POST1
nsel,all
wprota,0,90,0
wprota,0,0,90
/cplane,1
sucr,center,cplane,,,,,
SUMAP,xflux,B,x
/GO
SUPL,center,xflux,0
SUPR,center,xflux
wpoffs,0,0,-1*(coilthickin/3)
/cplane,1
sucr,left,cplane,,,,,
SUMAP,xflux,B,x
/GO
!SUPL,TONYD,xflux,0
SUPR,left,xflux
wpoffs,0,0,2*(coilthickin/3)
/cplane,1
sucr,right,cplane,,,,,
SUMAP,xflux,B,x
233
/GO
!SUPL,TONYD,xflux,0
SUPR,right,xflux
A.2 Double cell magnetic flux density analysis
/PREP7
*SET,coilthickin,0.008
*SET,airgap,0.0111
*SET,magthk,0.009525
BLOCK,-airgap/2,airgap/2,-0.0254,0.0254,0.0016,0.0143
BLOCK,-airgap/2,airgap/2,-0.0254,0.0254,-0.0016,0.0016
BLOCK,-airgap/2,airgap/2,-0.0254,0.0254,-0.0016,-0.0143
BLOCK,airgap/2,(airgap/2)+magthk,-0.0254,0.0254,0.0016,0.0143
BLOCK,airgap/2,(airgap/2)+magthk,-0.0254,0.0254,-0.0016,0.0016
BLOCK,airgap/2,(airgap/2)+magthk,-0.0254,0.0254,-0.0016,-0.0143
BLOCK,-airgap/2,(-airgap/2)-magthk,-0.0254,0.0254,0.0016,0.0143
BLOCK,-airgap/2,(-airgap/2)-magthk,-0.0254,0.0254,-0.0016,0.0016
BLOCK,-airgap/2,(-airgap/2)-magthk,-0.0254,0.0254,-0.0016,-0.0143
SPHERE,0,0.0508*1.5,0,90
SPHERE,0,0.0508*1.5,90,180
SPHERE,0,0.0508*1.5,180,270
SPHERE,0,0.0508*1.5,270,360
SPHERE,0,0.0508*3,0,90
SPHERE,0,0.0508*3,90,180
SPHERE,0,0.0508*3,180,270
SPHERE,0,0.0508*3,270,360
vovlap,all
et,1,SOLID96
mp,mgxx,1,875270
mp,mgxx,2,-875270
mp,murx,1,1
234
mp,murx,2,1
mp,murx,3,1
vsel,s,,,23,,,,1
vatt,1,1,1
vsel,s,,,27,29,,,1
vatt,1,1,1
vsel,s,,,36,,,,1
vatt,2,1,1
vsel,s,,,40,42,2,,1
vatt,2,1,1
vsel,s,,,45,,,,1
vatt,2,1,1
vsel,s,,,18,21,,,1
vatt,3,1,1,
vsel,s,,,22,26,2,,1
vatt,3,1,1,
vsel,s,,,25,,,,1
vatt,3,1,1,
vsel,s,,,30,35,,,1
vatt,3,1,1,
vsel,s,,,37,39,,,1
vatt,3,1,1,
vsel,s,,,41,43,2,,1
vatt,3,1,1,
vsel,s,,,44,,,,1
vatt,3,1,1,
vsel,s,,,46,49,,,1
vatt,3,1,1,
allsel
SMRT,1
MSHAPE,1,3D
235
MSHKEY,0
VSEL,ALL
VMESH,ALL
NSEL,S,LOC,Y,-0.0254,0.0254
NSEL,R,LOC,Z,-0.0143,0.0143
NSEL,R,LOC,X,2*(-airgap/2),2*airgap/2
nrefine,all,,,3
allsel
finish
/SOLU
magsolv,3,,,,,1
finish
/POST1
nsel,all
!wprota,0,90,0
wprota,0,0,90
/cplane,1
sucr,center,cplane,,,,,
SUMAP,xflux,B,x
/GO
!SUPL,TONYD,xflux,0
SUPR,center,xflux
wpoffs,0,0,-1*(coilthickin/3)
/cplane,1
sucr,left,cplane,,,,,
SUMAP,xflux,B,x
/GO
!SUPL,TONYD,xflux,0
SUPR,left,xflux
wpoffs,0,0,2*(coilthickin/3)
/cplane,1

236
sucr,right,cplane,,,,,
SUMAP,xflux,B,x
/GO
!SUPL,TONYD,xflux,0
SUPR,right,xflux
/REPLOT,RESIZE
/REPLOT,RESIZE
FINISH
A.3 Double cell array magnetic flux density analysis
/PREP7
airgapin=0.0071
airgapout=0.0071
coilthickin=0.004
coilthickout=0.004
magthk=0.00635
BLOCK,-magthk/2,magthk/2,-0.0254,0.0254,0.0016,0.0143
BLOCK,-magthk/2,magthk/2,-0.0254,0.0254,-0.0016,0.0016
BLOCK,-magthk/2,magthk/2,-0.0254,0.0254,-0.0016,-0.0143
VGEN,2,1,3,1,airgapin+magthk,,,
VGEN,2,7,9,1,(airgapout+magthk),,,
VGEN,2,1,3,1,-1*(airgapin+magthk),,,
VGEN,2,19,21,1,-1*(airgapout+magthk),,,
BLOCK,magthk/2,(magthk/2)+airgapin,-0.0254,0.0254,0.0016,0.0143
BLOCK,magthk/2,(magthk/2)+airgapin,-0.0254,0.0254,-0.0016,0.0016
BLOCK,magthk/2,(magthk/2)+airgapin,-0.0254,0.0254,-0.0016,-0.0143
VGEN,2,28,30,1,airgapin+magthk,,,
BLOCK,(magthk/2)+2*magthk+2*airgapin,(magthk/2)+2*magthk+2*airgapin+airgapout,-
0.0254,0.0254,0.0016,0.0143
BLOCK,(magthk/2)+2*magthk+2*airgapin,(magthk/2)+2*magthk+2*airgapin+airgapout,-
0.0254,0.0254,-0.0016,0.0016

237
BLOCK,(magthk/2)+2*magthk+2*airgapin,(magthk/2)+2*magthk+2*airgapin+airgapout,-
0.0254,0.0254,-0.0016,-0.0143
VGEN,2,34,36,1,airgapout+magthk,,,
BLOCK,-magthk/2,(-magthk/2)-airgapin,-0.0254,0.0254,0.0016,0.0143
BLOCK,-magthk/2,(-magthk/2)-airgapin,-0.0254,0.0254,-0.0016,0.0016
BLOCK,-magthk/2,(-magthk/2)-airgapin,-0.0254,0.0254,-0.0016,-0.0143
VGEN,2,40,42,1,-1*(airgapin+magthk),,,
BLOCK,(-magthk/2)-2*magthk-2*airgapin,(-magthk/2)-2*magthk-2*airgapin-airgapout,-
0.0254,0.0254,0.0016,0.0143
BLOCK,(-magthk/2)-2*magthk-2*airgapin,(-magthk/2)-2*magthk-2*airgapin-airgapout,-
0.0254,0.0254,-0.0016,0.0016
BLOCK,(-magthk/2)-2*magthk-2*airgapin,(-magthk/2)-2*magthk-2*airgapin-airgapout,-
0.0254,0.0254,-0.0016,-0.0143
VGEN,2,46,48,1,-1*(airgapout+magthk),,,
SPHERE,0,0.0508*1.5,0,90
SPHERE,0,0.0508*1.5,90,180
SPHERE,0,0.0508*1.5,180,270
SPHERE,0,0.0508*1.5,270,360
SPHERE,0,0.0508*3,0,90
SPHERE,0,0.0508*3,90,180
SPHERE,0,0.0508*3,180,270
SPHERE,0,0.0508*3,270,360
vovlap,all
et,1,SOLID96
mp,mgxx,1,875270
mp,mgxx,2,-875270
mp,murx,1,1
mp,murx,2,1
mp,murx,3,1
vsel,s,,,28,31,,,1
vatt,1,1,1

238
vsel,s,,,33,35,2,,1
vatt,1,1,1
vsel,s,,,36,37,,,1
vatt,1,1,1
vsel,s,,,41,47,2,,1
vatt,2,1,1
vsel,s,,,53,55,2,,1
vatt,2,1,1
vsel,s,,,56,59,3,,1
vatt,2,1,1
vsel,s,,,24,27,,,1
vatt,3,1,1,
vsel,s,,,32,34,2,,1
vatt,3,1,1,
vsel,s,,,38,40,,,1
vatt,3,1,1,
vsel,s,,,42,54,2,,1
vatt,3,1,1,
vsel,s,,,49,51,2,,1
vatt,3,1,1,
vsel,s,,,57,58,,,1
vatt,3,1,1,
vsel,s,,,60,67,,,1
vatt,3,1,1,
allsel
SMRT,1
MSHAPE,1,3D
MSHKEY,0
VSEL,ALL
VMESH,ALL

239
NSEL,S,LOC,Y,-0.0254,0.0254
NSEL,R,LOC,Z,-0.0143,0.0143
NSEL,R,LOC,X,magthk/2,(magthk/2)+airgapin
NSEL,A,LOC,X,(magthk/2)+airgapin+magthk,(magthk/2)+2*airgapin+magthk
NSEL,R,LOC,Y,-0.0254,0.0254
NSEL,R,LOC,Z,-0.0143,0.0143
NSEL,A,LOC,X,(magthk/2)+2*airgapin+2*magthk,(magthk/2)+2*airgapin+airgapout+2*magth
k
NSEL,R,LOC,Y,-0.0254,0.0254
NSEL,R,LOC,Z,-0.0143,0.0143
NSEL,A,LOC,X,(magthk/2)+2*airgapin+airgapout+3*magthk,(magthk/2)+2*airgapin+2*airgap
out+3*magthk
NSEL,R,LOC,Y,-0.0254,0.0254
NSEL,R,LOC,Z,-0.0143,0.0143
NSEL,A,LOC,X,-magthk/2,(-magthk/2)-airgapin
NSEL,R,LOC,Y,-0.0254,0.0254
NSEL,R,LOC,Z,-0.0143,0.0143
NSEL,A,LOC,X,(-magthk/2)-airgapin-magthk,(-magthk/2)-2*airgapin-magthk
NSEL,R,LOC,Y,-0.0254,0.0254
NSEL,R,LOC,Z,-0.0143,0.0143
NSEL,A,LOC,X,(-magthk/2)-2*airgapin-2*magthk,(-magthk/2)-2*airgapin-airgapout-2*magthk
NSEL,R,LOC,Y,-0.0254,0.0254
NSEL,R,LOC,Z,-0.0143,0.0143
NSEL,A,LOC,X,(-magthk/2)-2*airgapin-airgapout-3*magthk,(-magthk/2)-2*airgapin-
2*airgapout-3*magthk
NSEL,R,LOC,Y,-0.0254,0.0254
NSEL,R,LOC,Z,-0.0143,0.0143
nrefine,all,,,2
allsel
finish
/SOLU
240
magsolv,3,,,,,1
finish
/POST1
nsel,all
wprota,0,0,90
wpoffs,0,0,(magthk/2)+(airgapin/2)
/cplane,1
sucr,R1cent,cplane,,,,,
SUMAP,xflux,B,x
/GO
!SUPL,TONYD,xflux,0
SUPR,R1cent,xflux
wpoffs,0,0,-1*(coilthickin/3)
/cplane,1
sucr,R1left,cplane,,,,,
SUMAP,xflux,B,x
/GO
!SUPL,TONYD,xflux,0
SUPR,R1left,xflux
wpoffs,0,0,2*(coilthickin/3)
/cplane,1
sucr,R1right,cplane,,,,,
SUMAP,xflux,B,x
/GO
!SUPL,TONYD,xflux,0
SUPR,R1right,xflux
wpoffs,0,0,-1*(coilthickin/3)
wpoffs,0,0,(magthk)+(airgapin)
/cplane,1
sucr,R2cent,cplane,,,,,
SUMAP,xflux,B,x
241
/GO
!SUPL,TONYD,xflux,0
SUPR,R2cent,xflux
wpoffs,0,0,-1*(coilthickin/3)
/cplane,1
sucr,R2left,cplane,,,,,
SUMAP,xflux,B,x
/GO
!SUPL,TONYD,xflux,0
SUPR,R2left,xflux
wpoffs,0,0,2*(coilthickin/3)
/cplane,1
sucr,R2right,cplane,,,,,
SUMAP,xflux,B,x
/GO
!SUPL,TONYD,xflux,0
SUPR,R2right,xflux
wpoffs,0,0,-1*(coilthickin/3)
wpoffs,0,0,(magthk)+(airgapin/2)+(airgapout/2)
/cplane,1
sucr,R3center,cplane,,,,,
SUMAP,xflux,B,x
/GO
!SUPL,TONYD,xflux,0
SUPR,R3center,xflux
wpoffs,0,0,-1*(coilthickout/3)
/cplane,1
sucr,R3left,cplane,,,,,
SUMAP,xflux,B,x
/GO
!SUPL,TONYD,xflux,0
242
SUPR,R3left,xflux
wpoffs,0,0,2*(coilthickout/3)
/cplane,1
sucr,R3right,cplane,,,,,
SUMAP,xflux,B,x
/GO
!SUPL,TONYD,xflux,0
SUPR,R3right,xflux
wpoffs,0,0,-1*(coilthickout/3)
wpoffs,0,0,(magthk)+(airgapout)
/cplane,1
sucr,R4center,cplane,,,,,
SUMAP,xflux,B,x
/GO
!SUPL,TONYD,xflux,0
SUPR,R4center,xflux
wpoffs,0,0,-1*(coilthickout/3)
/cplane,1
sucr,R4left,cplane,,,,,
SUMAP,xflux,B,x
/GO
!SUPL,TONYD,xflux,0
SUPR,R4left,xflux
wpoffs,0,0,2*(coilthickout/3)
/cplane,1
sucr,R4right,cplane,,,,,
SUMAP,xflux,B,x
/GO
!SUPL,TONYD,xflux,0
SUPR,R4right,xflux

243
A.4 Magnetic levitation magnetic flux density analysis
/PREP7
d=0.001
CYLIND,,0.003175,-0.003175-d/2-0.011-0.00079375,-0.003175-d/2-0.011,0,360,
CYLIND,0.0015875,0.0047625,-0.003175-d/2,-d/2,0,360,
CYLIND,0.0015875,0.0047625,-d/2,d/2,0,360,
CYLIND,0.0015875,0.0047625,d/2,d/2+0.003175,0,360,
CYLIND,,0.003175,d/2+0.003175+0.011,d/2+0.003175+0.011+0.00079375,0,360,
SPHERE,0,(d/2+0.003175+0.011+0.00079375)*3,0,90
SPHERE,0,(d/2+0.003175+0.011+0.00079375)*3,90,180
SPHERE,0,(d/2+0.003175+0.011+0.00079375)*3,180,270
SPHERE,0,(d/2+0.003175+0.011+0.00079375)*3,270,360
SPHERE,0,(d/2+0.003175+0.011+0.00079375)*6,0,90
SPHERE,0,(d/2+0.003175+0.011+0.00079375)*6,90,180
SPHERE,0,(d/2+0.003175+0.011+0.00079375)*6,180,270
SPHERE,0,(d/2+0.003175+0.011+0.00079375)*6,270,360
vovlap,all
et,1,SOLID96
mp,mgzz,2,875270
mp,mgzz,3,-875270
mp,murx,4,100
mp,murx,3,1
mp,murx,2,1
mp,murx,1,1
vsel,s,,,18,21,,1
vatt,3,1,1
vsel,s,,,26,29,,1
vatt,2,1,1
vsel,s,,,30,33,,1
vatt,4,1,1
vsel,s,,,34,37,,1
vatt,3,1,1
vsel,s,,,22,25,,1
vatt,2,1,1
vsel,s,,,14,17,,1
vatt,1,1,1
vsel,s,,,38,41,,1
vatt,1,1,1
allsel
SMRT,1
MSHAPE,1,3D
MSHKEY,0
VSEL,ALL
VMESH,ALL

244
nsel,all
nsel,s,loc,x,-0.008,0.008
nsel,r,loc,y,-0.008,0.008
!refining the region of interest for better calculations
nsel,r,loc,z,-0.002-d/2,0.002+d/2
nrefine,all,,,2
allsel
finish
/SOLU
magsolv,3,,,,,1
finish
/POST1
nsel,all
!nsel,s,loc,x,-0.05,0.05
!nsel,r,loc,y,-0.05,0.05
!nsel,u,loc,x,-0.0137,0.0137
!nsel,u,loc,y,-0.0137,0.0137
wprota,0,90,0
/cplane,1
sucr,tonyd,cplane,,,,,
SUMAP,xflux,B,X
/GO
SUPL,TONYD,xflux,0
SUPR,TONYD,xflux
A.5 Magnetic levitation magnetic force analysis
/PREP7
CYLIND,,0.0015875,-d/2-0.00079375,-d/2,0,360, ! lower magnet volume
CYLIND,0.00079375,0.00238125,d/2,d/2+0.0015875,0,360, ! upper (moving) magnet volume
CYLIND,0.00079375,0.00238125,d/2+0.0015875,d/2+0.0016375,0,360,
CYLIND,0.00079375,0.00238125,d/2+0.0016375,d/2+0.003225,0,360,
BLOCK,-2*(d+0.009),2*(d+0.009),-2*(d+0.009),2*(d+0.009),-2*(d+0.009),2*(d+0.009) ! air
box
vovlap,all
! Finite element model
et,1,SOLID236 ! magnetic solid
keyop,1,7,1 ! condense forces to the corner nodes
SMRT,1
MSHAPE,1,3D

245
MSHKEY,0
VSEL,ALL
VMESH,ALL
! Material properties
mp,mgzz,2,875270
mp,mgzz,3,-875270
mp,murx,4,100
mp,murx,3,1
mp,murx,2,1
mp,murx,1,1
vsel,s,,,1,,,1
emod,all,mat,2
vsel,s,,,2,,,1
emod,all,mat,3
vsel,s,,,6,,,1
emod,all,mat,4
vsel,s,,,7,,,1
emod,all,mat,2
vsel,s,,,8,,,1
emod,all,mat,1
allsel
esel,s,mat,,2,3
eplot
allsel
fini
/SOLU
solve
fini
/POST1
vsel,s,,,1,,,1 ! select lower magnet along with the
! associated elements and nodes

246
esln
EMFT ! sum up magnetic forces
allsel
esel,s,mat,,2,3
allsel
fini
*SET,dist(i),d
*SET,F(i,1),_fzsum ! FX sum calculated by EMFT
*SET,d,d+0.00025 ! upper magnet displacement update
*enddo
/COM,ANSYS RELEASE 12.0.1 UP20090415 03:08:58 03/29/2013
/axlab,x,Distance d (m)
/axlab,y,Forces acting the magnet (N)
/gcol,1,Fz
*vplot,dist(1),F(1,1)
*CREATE,ansuitmp
*CFOPEN,'config12d','txt',' '
*VWRITE,dist(1), , , , , , , , ,
(e13.4)
*CFCLOS
*END
/INPUT,ansuitmp
*CREATE,ansuitmp
*CFOPEN,'config12f','txt',' '
*VWRITE,F(1), , , , , , , , ,
(e13.4)
*CFCLOS
*END
/INPUT,ansuitmp
/REPLOT,RESIZE

247
A.6 Rotational generator magnetic flux analysis for rectangular magnets
/PREP7
block,-0.0015875,0.0015875,0.0043,0.01065,-0.00455,-0.001375
block,-0.0015875,0.0015875,-0.0043,-0.01065,-0.00455,-0.001375
CSYS,1
VGEN,4,1, 2, , ,45,, , ,
CSYS,0
block,-0.0015875,0.0015875,0.0043,0.01065,0.001375,0.00455
block,-0.0015875,0.0015875,-0.0043,-0.01065,0.001375,0.00455
CSYS,1
VGEN,4,9, 10, , ,45,, , ,
CSYS,0
SPHERE,,0.0319,0,360,
SPHERE,,0.0639,0,360,
vovlap,all
ET,1,SOLID96
MP,MGZZ,2,875270
MP,MGZZ,3,-875270
MP,MURX,1,1
MP,MURX,2,1
MP,MURX,3,1
VSEL,S,,,1,2,1,1
vatt,2,1,1
VSEL,S,,,9,10,1,1
vatt,2,1,1
VSEL,S,,,5,6,1,1
vatt,2,1,1
VSEL,S,,,13,14,1,1
vatt,2,1,1
VSEL,S,,,3,4,1,1
vatt,3,1,1
VSEL,S,,,11,12,1,1
vatt,3,1,1
VSEL,S,,,7,8,1,1
vatt,3,1,1
VSEL,S,,,15,16,1,1
vatt,3,1,1
VSEL,S,,,19,20,,1
vatt,1,1,1
allsel
SMRTSIZE,1
MSHAPE,1,3D
MSHKEY,0
VSEL,ALL
VMESH,ALL
248
allsel
nsel,all
nsel,s,loc,x,-0.013825,0.013825
nsel,r,loc,y,-0.013825,0.013825
nsel,r,loc,z,-0.001375,0.001375
nsel,u,loc,x,-0.001125,0.001125
nsel,u,loc,y,-0.001125,0.001125
nrefine,all,,,2
allsel
finish
/solu
magsolv,3,,,,,1
finish
/SOLU
FINISH
/PREP7
FINISH
/POST1
/REPLOT,RESIZE
/REPLOT,RESIZE
wpoff,0,0,0
/cplane,1
sucr,tonyd,cplane,,,,,
SUMAP,zflux,B,Z
/GO
SUPL,TONYD,ZFLUX,0
SUPR,TONYD,ZFLUX
A.7 Rotational generator magnetic flux analysis for arc shaped magnets
/PREP7
wpoff,0,0,0.002025
CYL4,0,0,0.0042,-9,0.01055,31,0.006350
CYL4,0,0,0.0042,171,0.01055,211,0.006350
CSYS,1
VGEN,4,1, 2, , ,45,, , ,
CSYS,0
wpoff,0,0,-0.002025
wpoff,0,0,-0.002025
wpoff,0,0,-0.006350
CYL4,0,0,0.0042,-9,0.01055,31,0.006350

249
CYL4,0,0,0.0042,171,0.01055,211,0.006350
CSYS,1
VGEN,4,9, 10, , ,45,, , ,
CSYS,0
wpoff,0,0,0.006350
wpoff,0,0,0.002025
SPHERE,,0.025,0,360,
SPHERE,,0.04,0,360,
vovlap,all
ET,1,SOLID96
MP,MGZZ,2,875270
MP,MGZZ,3,-875270
MP,MURX,1,1
MP,MURX,2,1
MP,MURX,3,1
VSEL,S,,,1,2,1,1
vatt,2,1,1
VSEL,S,,,9,10,1,1
vatt,2,1,1
VSEL,S,,,5,6,1,1
vatt,2,1,1
VSEL,S,,,13,14,1,1
vatt,2,1,1
VSEL,S,,,3,4,1,1
vatt,3,1,1
VSEL,S,,,11,12,1,1
vatt,3,1,1
VSEL,S,,,7,8,1,1
vatt,3,1,1
VSEL,S,,,15,16,1,1
vatt,3,1,1

250
VSEL,S,,,19,20,,1
vatt,1,1,1
allsel
SMRTSIZE,1
MSHAPE,1,3D
MSHKEY,0
VSEL,ALL
VMESH,ALL
allsel
nsel,s,loc,x,0,0.013825
nsel,a,loc,y,0,0.013825
nsel,a,loc,z,-0.002,0.002
nrefine,all,,,1
allsel
/solu
magsolv,3,,,,,1
/POST1
/REPLOT,RESIZE
wpoff,0,0,0
/cplane,1
sucr,tonyd,cplane,,,,,
SUMAP,zflux,B,Z
/GO
SUPL,TONYD,ZFLUX,0
SUPR,TONYD,ZFLUX
FINISH
wpoff,0,0,0.00042
/cplane,2
sucr,darian1,cplane,,,,,
SUMAP,zflux,B,Z

251
/GO
SUPR,darian1,ZFLUX

252

253
APPENDIX B: MATLAB CODES
B.1 Double cell array analysis
Below are five sets of text which correspond to five different m files. The first m file titled
“Automatic.m” calls the other functions (4 files). The following code takes the ouput from the
ANSYS results from A.1 to A.3 and sorts the data, breaks the coil face into many discrete areas,
and calculates the angle phi, average y, and average B for each of the areas. The output from
ANSYS should be saved as “R1LEFT.DATA” to allow the MATLAB code to extract the data.
The title can be changed but also musst be changed in automatic.m. The MATLAB code will
output variables for every ANSYS file input. The four column variable contains the y-
coordinate, z-coordinate, B, angle phi.
%NAME TEXT BELOW Automatic.m
disp('Welcome for Extracting and Angle Calculation'); disp('Written by Darian A.Schaab (02/20/2013) v.3.0');
%% Extracting data from ansys file %Change here the source files
extract_data1 = sortData('R1LEFT.DATA'); extract_data2 = sortData('R1CENT.DATA'); extract_data3 = sortData('R1RIGHT.DATA'); extract_data4 = sortData('R2LEFT.DATA'); extract_data5 = sortData('R2CENT.DATA'); extract_data6 = sortData('R2RIGHT.DATA'); extract_data7 = sortData('R3LEFT.DATA'); extract_data8 = sortData('R3CENTER.DATA'); extract_data9 = sortData('R3RIGHT.DATA'); extract_data10 = sortData('R4LEFT.DATA'); extract_data11 = sortData('R4CENTER.DATA'); extract_data12 = sortData('R4RIGHT.DATA');
%% Cutting and averaging data to area of interest
select_data1 = averagedata(extract_data1,-16.2e-3,16.2e-3,-13.4e-3,13.4e-
3,17,14); select_data2 = averagedata(extract_data2,-16.2e-3,16.2e-3,-13.4e-3,13.4e-
3,17,14); select_data3 = averagedata(extract_data3,-16.2e-3,16.2e-3,-13.4e-3,13.4e-
3,17,14); select_data4 = averagedata(extract_data4,-16.2e-3,16.2e-3,-13.4e-3,13.4e-
3,17,14); select_data5 = averagedata(extract_data5,-16.2e-3,16.2e-3,-13.4e-3,13.4e-
3,17,14); select_data6 = averagedata(extract_data6,-16.2e-3,16.2e-3,-13.4e-3,13.4e-
3,17,14); select_data7 = averagedata(extract_data7,-16.2e-3,16.2e-3,-13.4e-3,13.4e-
3,17,14);

254
select_data8 = averagedata(extract_data8,-16.2e-3,16.2e-3,-13.4e-3,13.4e-
3,17,14); select_data9 = averagedata(extract_data9,-16.2e-3,16.2e-3,-13.4e-3,13.4e-
3,17,14); select_data10 = averagedata(extract_data10,-16.2e-3,16.2e-3,-13.4e-3,13.4e-
3,17,14); select_data11 = averagedata(extract_data11,-16.2e-3,16.2e-3,-13.4e-3,13.4e-
3,17,14); select_data12 = averagedata(extract_data12,-16.2e-3,16.2e-3,-13.4e-3,13.4e-
3,17,14);
XNEED(1:158,1) = [-0.00952941;-0.01143529;-0.00952941;-0.00952941;-
0.01143529;-0.01334117;-0.01334117;-0.01143529;-0.00952941;-0.00952941;-
0.01143529;-0.01334117;-0.01524705;-0.01524705;-0.013341176;-0.01334117;-
0.01143529;-0.011435294;-0.00952941;-0.00952941176470588;-
0.00952941176470588;-0.00762352941176471;-0.00762352941176471;-
0.00762352941176471;-0.00762352941176471;-0.00762352941176471;-
0.00762352941176471;-0.00571764705882353;-0.00571764705882353;-
0.00571764705882353;-0.00571764705882353;-0.00381176470588235;-
0.00381176470588235;-0.00381176470588235;-0.00381176470588235;-
0.00571764705882353;-0.00381176470588235;-0.00190588235294118;-
0.00190588235294118;-0.00190588235294118;-0.00190588235294118;-
0.00190588235294118;-1.19262238973405e-18;-1.19262238973405e-18;-
1.19262238973405e-18;-1.19262238973405e-18;-1.19262238973405e-
18;0.00190588235294118;0.00190588235294118;0.00190588235294118;0.001905882352
94118;0.00190588235294118;0.00381176470588235;0.00381176470588235;0.003811764
70588235;0.00381176470588235;0.00571764705882353;0.00571764705882353;0.005717
64705882353;0.00571764705882353;0.00571764705882353;0.00381176470588235;0.007
62352941176471;0.00762352941176471;0.00762352941176471;0.00762352941176471;0.
00952941176470588;0.00952941176470588;0.00952941176470588;0.00952941176470588
;0.0114352941176471;0.0133411764705882;0.0114352941176471;0.0114352941176471;
0.0133411764705882;0.0152470588235294;0.0133411764705882;0.0114352941176471;0
.00952941176470588;0.00762352941176471;0.0114352941176471;0.00952941176470588
;0.0133411764705882;0.0152470588235294;0.0152470588235294;0.0133411764705882;
0.0114352941176471;0.00952941176470588;0.00762352941176471;0.0095294117647058
8;0.0114352941176471;0.0133411764705882;0.0152470588235294;0.0133411764705882
;0.0114352941176471;0.00952941176470588;0.00762352941176471;0.005717647058823
53;0.00381176470588235;0.00190588235294118;-1.19262238973405e-18;-
0.00190588235294118;-0.00381176470588235;-0.00571764705882353;-
0.00762352941176471;-0.00952941176470588;-0.0152470588235294;-
0.0114352941176471;-0.0133411764705882;-0.0152470588235294;-
0.0114352941176471;-0.0133411764705882;-0.0133411764705882;-
0.0114352941176471;-0.00952941176470588;-0.00762352941176471;-
0.00571764705882353;-0.00381176470588235;-0.00190588235294118;-
1.19262238973405e-
18;0.00571764705882353;0.00190588235294118;0.00381176470588235;0.007623529411
76471;0.00952941176470588;0.0114352941176471;0.0133411764705882;0.01143529411
76471;0.00952941176470588;0.00762352941176471;0.00571764705882353;0.003811764
70588235;0.00190588235294118;-1.19262238973405e-18;-0.00190588235294118;-
0.00381176470588235;-0.00571764705882353;-0.00762352941176471;-
0.00952941176470588;-
0.0114352941176471;0.00952941176470588;0.00762352941176471;0.0057176470588235
3;0.00571764705882353;0.00381176470588235;0.00190588235294118;-
1.19262238973405e-18;-0.00190588235294118;-0.00381176470588235;-
0.00571764705882353;-0.00762352941176471;-
0.00952941176470588;0.00381176470588235;0.00190588235294118;-

255
1.19262238973405e-18;-0.00190588235294118;-0.00571764705882353;-
0.00381176470588235]; YNEED(1:158,1) = [-0.01052857;-0.008614285;-0.00861428;-0.006700000;-
0.00670000000000000;-0.00670000000000000;-0.00478571428571429;-
0.00478571428571429;-0.00478571428571429;-0.00287142857142857;-
0.00287142857142857;-0.00287142857142857;-0.00287142857142857;-
0.000957142857142857;0.000957142857142857;-
0.000957142857142857;0.000957142857142857;-0.000957142857142857;-
0.000957142857142857;0.000957142857142857;0.00287142857142857;0.0028714285714
2857;-0.00287142857142857;-0.00478571428571429;-0.00670000000000000;-
0.00861428571428572;-0.0105285714285714;-0.0105285714285714;-
0.00861428571428572;-0.00670000000000000;-0.00478571428571429;-
0.00478571428571429;-0.00670000000000000;-0.00861428571428572;-
0.0105285714285714;-0.0124428571428571;-0.0124428571428571;-
0.0124428571428571;-0.0105285714285714;-0.00861428571428572;-
0.00670000000000000;-0.00478571428571429;-0.00478571428571429;-
0.00670000000000000;-0.00861428571428572;-0.0105285714285714;-
0.0124428571428571;-0.0124428571428571;-0.0105285714285714;-
0.00861428571428572;-0.00670000000000000;-0.00478571428571429;-
0.00478571428571429;-0.00670000000000000;-0.00861428571428572;-
0.0105285714285714;-0.0124428571428571;-0.00478571428571429;-
0.00670000000000000;-0.00861428571428572;-0.0105285714285714;-
0.0124428571428571;-0.0105285714285714;-0.00861428571428572;-
0.00670000000000000;-0.00478571428571429;-0.0105285714285714;-
0.00861428571428572;-0.00670000000000000;-0.00478571428571429;-
0.00861428571428572;-0.00670000000000000;-0.00670000000000000;-
0.00478571428571429;-0.00478571428571429;-0.00287142857142857;-
0.00287142857142857;-0.00287142857142857;-0.00287142857142857;-
0.00287142857142857;-0.000957142857142857;-0.000957142857142857;-
0.000957142857142857;-
0.000957142857142857;0.000957142857142857;0.000957142857142857;0.000957142857
142857;0.000957142857142857;0.00287142857142857;0.00287142857142857;0.0028714
2857142857;0.00287142857142857;0.00287142857142857;0.00478571428571429;0.0047
8571428571429;0.00478571428571429;0.00478571428571429;0.00478571428571429;0.0
0478571428571429;0.00478571428571429;0.00478571428571429;0.00478571428571429;
0.00478571428571429;0.00478571428571429;0.00478571428571429;0.004785714285714
29;0.000957142857142857;0.00287142857142857;0.00287142857142857;0.00287142857
142857;0.00478571428571429;0.00478571428571429;0.00670000000000000;0.00670000
000000000;0.00670000000000000;0.00670000000000000;0.00670000000000000;0.00670
000000000000;0.00670000000000000;0.00670000000000000;0.00670000000000000;0.00
670000000000000;0.00670000000000000;0.00670000000000000;0.00670000000000000;0
.00670000000000000;0.00670000000000000;0.00861428571428572;0.0086142857142857
2;0.00861428571428572;0.00861428571428572;0.00861428571428572;0.0086142857142
8572;0.00861428571428572;0.00861428571428572;0.00861428571428572;0.0086142857
1428572;0.00861428571428572;0.00861428571428572;0.00861428571428572;0.0105285
714285714;0.0105285714285714;0.0124428571428571;0.0105285714285714;0.01052857
14285714;0.0105285714285714;0.0105285714285714;0.0105285714285714;0.010528571
4285714;0.0105285714285714;0.0105285714285714;0.0105285714285714;0.0124428571
428571;0.0124428571428571;0.0124428571428571;0.0124428571428571;0.01244285714
28571;0.0124428571428571;];
%PlotElipse %Uncomment to see Plot plot(XNEED(1:158,1),YNEED(1:158,1),'g*')
coil1 = 0; test = 0;
256
%% Selecting data from select_data variable
for ii = 1:1:238 for jj = 1:1:158
if (select_data1(ii,1)+10e-08 >= XNEED(jj,1) && select_data1(ii,1)-
10e-08 <= XNEED(jj,1))
if (select_data1(ii,2)+10e-08 >= YNEED(jj,1) &&
select_data1(ii,2)-10e-8 <=YNEED(jj,1)) test = test+1; coil1(test,1:3) = [XNEED(jj,1),YNEED(jj,1),
select_data1(jj,3)];
end end end end
coil2 = 0; test = 0;
for ii = 1:1:238 for jj = 1:1:158
if (select_data2(ii,1)+10e-08 >= XNEED(jj,1) && select_data2(ii,1)-
10e-08 <= XNEED(jj,1))
if (select_data2(ii,2)+10e-08 >= YNEED(jj,1) &&
select_data2(ii,2)-10e-8 <=YNEED(jj,1)) test = test+1; coil2(test,1:3) = [XNEED(jj,1),YNEED(jj,1),
select_data2(jj,3)];
end end end end
coil3 = 0; test = 0;
for ii = 1:1:238 for jj = 1:1:158
if (select_data3(ii,1)+10e-08 >= XNEED(jj,1) && select_data3(ii,1)-
10e-08 <= XNEED(jj,1))
if (select_data3(ii,2)+10e-08 >= YNEED(jj,1) &&
select_data3(ii,2)-10e-8 <=YNEED(jj,1)) test = test+1;
257
coil3(test,1:3) = [XNEED(jj,1),YNEED(jj,1),
select_data3(jj,3)];
end end end end
coil4 = 0; test = 0;
for ii = 1:1:238 for jj = 1:1:158
if (select_data4(ii,1)+10e-08 >= XNEED(jj,1) && select_data4(ii,1)-
10e-08 <= XNEED(jj,1))
if (select_data4(ii,2)+10e-08 >= YNEED(jj,1) &&
select_data4(ii,2)-10e-8 <=YNEED(jj,1)) test = test+1; coil4(test,1:3) = [XNEED(jj,1),YNEED(jj,1),
select_data4(jj,3)];
end end end end
coil5 = 0; test = 0;
for ii = 1:1:238 for jj = 1:1:158
if (select_data5(ii,1)+10e-08 >= XNEED(jj,1) && select_data5(ii,1)-
10e-08 <= XNEED(jj,1))
if (select_data5(ii,2)+10e-08 >= YNEED(jj,1) &&
select_data5(ii,2)-10e-8 <=YNEED(jj,1)) test = test+1; coil5(test,1:3) = [XNEED(jj,1),YNEED(jj,1),
select_data5(jj,3)];
end end end end
coil6 = 0; test = 0;
for ii = 1:1:238 for jj = 1:1:158
258
if (select_data6(ii,1)+10e-08 >= XNEED(jj,1) && select_data6(ii,1)-
10e-08 <= XNEED(jj,1))
if (select_data6(ii,2)+10e-08 >= YNEED(jj,1) &&
select_data6(ii,2)-10e-8 <=YNEED(jj,1)) test = test+1; coil6(test,1:3) = [XNEED(jj,1),YNEED(jj,1),
select_data6(jj,3)];
end end end end
coil7= 0; test = 0;
for ii = 1:1:238 for jj = 1:1:158
if (select_data7(ii,1)+10e-08 >= XNEED(jj,1) && select_data7(ii,1)-
10e-08 <= XNEED(jj,1))
if (select_data7(ii,2)+10e-08 >= YNEED(jj,1) &&
select_data7(ii,2)-10e-8 <=YNEED(jj,1)) test = test+1; coil7(test,1:3) = [XNEED(jj,1),YNEED(jj,1),
select_data7(jj,3)];
end end end end
coil8 = 0; test = 0;
for ii = 1:1:238 for jj = 1:1:158
if (select_data8(ii,1)+10e-08 >= XNEED(jj,1) && select_data8(ii,1)-
10e-08 <= XNEED(jj,1))
if (select_data8(ii,2)+10e-08 >= YNEED(jj,1) &&
select_data8(ii,2)-10e-8 <=YNEED(jj,1)) test = test+1; coil8(test,1:3) = [XNEED(jj,1),YNEED(jj,1),
select_data8(jj,3)];
end end end end
259
coil9 = 0; test = 0;
for ii = 1:1:238 for jj = 1:1:158
if (select_data9(ii,1)+10e-08 >= XNEED(jj,1) && select_data9(ii,1)-
10e-08 <= XNEED(jj,1))
if (select_data9(ii,2)+10e-08 >= YNEED(jj,1) &&
select_data9(ii,2)-10e-8 <=YNEED(jj,1)) test = test+1; coil9(test,1:3) = [XNEED(jj,1),YNEED(jj,1),
select_data9(jj,3)];
end end end end
coil10 = 0; test = 0;
for ii = 1:1:238 for jj = 1:1:158
if (select_data10(ii,1)+10e-08 >= XNEED(jj,1) && select_data10(ii,1)-
10e-08 <= XNEED(jj,1))
if (select_data10(ii,2)+10e-08 >= YNEED(jj,1) &&
select_data10(ii,2)-10e-8 <=YNEED(jj,1)) test = test+1; coil10(test,1:3) = [XNEED(jj,1),YNEED(jj,1),
select_data10(jj,3)];
end end end end
coil11 = 0; test = 0;
for ii = 1:1:238 for jj = 1:1:158
if (select_data11(ii,1)+10e-08 >= XNEED(jj,1) && select_data11(ii,1)-
10e-08 <= XNEED(jj,1))
if (select_data11(ii,2)+10e-08 >= YNEED(jj,1) &&
select_data11(ii,2)-10e-8 <=YNEED(jj,1)) test = test+1; coil11(test,1:3) = [XNEED(jj,1),YNEED(jj,1),
select_data11(jj,3)];
260
end end end end
coil12 = 0; test = 0;
for ii = 1:1:238 for jj = 1:1:158
if (select_data12(ii,1)+10e-08 >= XNEED(jj,1) && select_data12(ii,1)-
10e-08 <= XNEED(jj,1))
if (select_data12(ii,2)+10e-08 >= YNEED(jj,1) &&
select_data12(ii,2)-10e-8 <=YNEED(jj,1)) test = test+1; coil12(test,1:3) = [XNEED(jj,1),YNEED(jj,1),
select_data12(jj,3)];
end end end end
clear jj; clear ii; clear test; clear XNEED; clear YNEED;
phi1 = phiArray(coil1,13.35/16.1, 4.5/8.26);
coil1(1:158,4) = phi1(1:158,4); coil2(1:158,4) = phi1(1:158,4); coil3(1:158,4) = phi1(1:158,4); coil4(1:158,4) = phi1(1:158,4); coil5(1:158,4) = phi1(1:158,4); coil6(1:158,4) = phi1(1:158,4); coil7(1:158,4) = phi1(1:158,4); coil8(1:158,4) = phi1(1:158,4); coil9(1:158,4) = phi1(1:158,4); coil10(1:158,4) = phi1(1:158,4); coil11(1:158,4) = phi1(1:158,4); coil12(1:158,4) = phi1(1:158,4); clear phi1; disp('Finished algorythm');
%NAME TEXT BELOW averagedata.m
function [ listdata ] = averagedata( dataF, minval_x, maxval_x, minval_y,
maxval_y, numblock_x, numblock_y ) %UNTITLED Summary of this function goes here
261
% Detailed explanation goes here
ii = 1; kk = 0; dataF1 = 0;
while ii <= size(dataF,1)
if ((dataF(ii,1)> minval_x) && (dataF(ii,1)<maxval_x)) if ((dataF(ii,2)> minval_y) &&(dataF(ii,2)<maxval_y)) kk = kk +1; dataF1(kk,1:4) = dataF(ii,1:4); end
end
ii = ii+1; end
disp('Lines of data in the specific array:'); disp(kk); disp('Scanned data points:'); disp(ii);
% plot3(dataF1(:,1),dataF1(:,2),dataF1(:,4),'o') % xlim([minval_x maxval_x]); % ylim([minval_y maxval_y]); % xlabel('y-direction in m') % ylabel('z-direction in m') % zlabel('Magnet Field in T')
averagecell =dataF1;
datasort = sortcase(dataF1, maxval_x, minval_x, maxval_y, minval_y,
numblock_x, numblock_y);
figure;
for kk = 1:1:numblock_x
for jj = 1:1:numblock_y
if datasort(kk,jj,2) ~= 0 polisheddata(kk,jj) =
datasort(kk,jj,1)/datasort(kk,jj,2); else polisheddata(kk,jj) = 0; end
delta_x = (maxval_x-minval_x)/(numblock_x); delta_y = (maxval_y-minval_y)/(numblock_y);
if polisheddata(kk,jj) ~= 0
262
plot3((minval_x + kk*delta_x-delta_x/2),(minval_y +
jj*delta_y-delta_y/2),polisheddata(kk,jj),'o') % disp(polisheddata(kk,jj)) else plot3((minval_x + kk*delta_x-delta_x/2),(minval_y +
jj*delta_y-delta_y/2),polisheddata(kk,jj),'ro') end
listdata((kk*numblock_y-numblock_y+jj),1:3) = [(minval_x +
kk*delta_x-delta_x/2),(minval_y + jj*delta_y-delta_y/2), polisheddata(kk,jj)
];
% disp(listdata((kk*numblock_y-numblock_y+jj),1:3)); % disp(polisheddata(kk,jj));
hold on xlim([minval_x maxval_x]); ylim([minval_y maxval_y]); xlabel('y-direction in m') ylabel('z-direction in m') zlabel('Magnet Field in T')
end
end % % % while ii <= size(dataF,1) % % if ((dataF(ii,1)> minval_x) && (dataF(ii,1)<maxval_x)) % if ((dataF(ii,2)> minval_y) &&(dataF(ii,2)<maxval_y)) % kk = kk +1; % dataF1(kk,1:4) = dataF(ii,1:4); % end % % end % % ii = ii+1; % end
end
function [datasort] = sortcase(dataF2, maxval_x, minval_x, maxval_y,
minval_y, numblock_x, numblock_y)
ii = 1; datasort = zeros(numblock_x,numblock_y,2);
delta_x = (maxval_x-minval_x)/(numblock_x); delta_y = (maxval_y-minval_y)/(numblock_y);
263
while ii <= size(dataF2,1)
%ii goes through all values of dataF1
for kk = 1:1:numblock_x
%kk goes through all colums to numblock_x
if ((dataF2(ii,1)> (minval_x +(kk-1)*delta_x)) && (dataF2(ii,1)<
(minval_x + kk*delta_x)))
for jj = 1:1:numblock_y
%%jj goes through all lines to numblock_y
% test1 = dataF1(ii,2)
if ((dataF2(ii,2)> (minval_y + (jj-1)*delta_y))
&&(dataF2(ii,2)< (minval_y + jj*delta_y)))
% test= size(datasort)
% if ([size(datasort,1) size(datasort,2)] == [kk,jj]) &&
(datasort(1,1) ~= 0) %Checks if datasort must be
initialised datasort(kk,jj,1) = datasort(kk,jj,1)+ dataF2(ii,4); datasort(kk,jj,2) = datasort(kk,jj,2) +1; % else % datasort(kk,jj,1) =dataF1(ii,4); % datasort(kk,jj,2) = 1; % end end
end end
end
ii = ii + 1; end
end
%datasort(colum, line, 1)= B_sum %datasort(colum, line, 2)= number
%NAME TEXT BELOW phiArray.m
function [ all ] = phiArray( allpoints , start_ratio, end_ratio) % Function calculates angles in dependency of a point and a elipse % wich is runnding through. start_ration and end_ration are the ratios of % the coating ellipses. A interpolation was established, which changes % it linearely vom start_ratio to end_ratio.
264
ratiof = @(tt)start_ratio-(end_ratio -start_ratio)*tt; %linear
interpolation of ratio in dependency of tt element [0 1]
for ii = 1:1:size(allpoints,1)
phi = phicircle([allpoints(ii,1);allpoints(ii,2)], ratiof);
if phi > (pi/2) phi = pi-phi; end
all(ii,1:4)= [allpoints(ii,1) allpoints(ii,2) phi cos(phi)];
end
end
function [ angl_phi ] = phicircle(xx, ratiof) %PHICIRCLE Calculates Angle of Wire in the round section % Define center position of rotation axis. Also define position of % coilpin. The function will find angle between coil and middle vector.
dir_vcrossB = [1 0];
%% Interpolating ratio
% Radii of outside and inside elipses ay1 = 8.26e-3; %inside elipse y-radius bz1 = 4.5e-3; %inside elipse z-radius
ay2 = 16.1e-3; %outside elipse y-radius bz2 = 13.35e-3; %outside elipse z-radius
anglealpha = atan(xx(2)/xx(1)); % Calculating angle
anglealpha in relation to point coordinates
r_min = sqrt((ay1*cos(anglealpha))^2+bz1*sin(anglealpha)^2); %minimum and
maximum radius at angle anglealpha r_max = sqrt((ay2*cos(anglealpha))^2+bz2*sin(anglealpha)^2);
ratio = ratiof((sqrt(xx(1)^2+xx(2)^2)-r_min)/(r_max-r_min));
%% Generating angle
dir_tanci = [-sin(anglealpha);
ratio*cos(anglealpha)]./sqrt((sin(anglealpha))^2+(ratio*cos(anglealpha))^2);
%Builds tangential vector with length 1
265
angl_phi = acos(dir_tanci(1)*dir_vcrossB(1)+dir_tanci(2)*dir_vcrossB(2));
% Calculates angle phi
%return; %Shut off plotting
%% Ploting for understanding
plot([xx(1) xx(1)-(dir_vcrossB(1)/1000)],[xx(2) xx(2)-
(dir_vcrossB(2)/1000)]); hold on; plot([xx(1) xx(1)-(dir_tanci(1)/1000)],[xx(2) xx(2)-(dir_tanci(2)/1000)]);
%rectangle('Position',[vec_pin(1)-norm(xx-vec_pin),vec_pin(2)-norm(xx-
vec_pin),2*norm(xx-vec_pin),2*norm(xx-vec_pin)],'Curvature',[1,1]); axis equal;
end
% NAME TEXT BELOW PlotElipse.m
%% Draws the Elipse Area in which the simulation points lie
t = 0:0.01:(2*pi); %% Radii for the elipses ay1 = 8.26e-3; %inside elipse y-radius bz1 = 4.5e-3; %inside elipse z-radius
ay2 = 16.1e-3; %outside elipse y-radius bz2 = 13.35e-3; %outside elipse z-radius
%% Plotting
y1 = ay1*cos(t); z1 = bz1*sin(t);
y2 = ay2*cos(t); z2 = bz2*sin(t);
hold on; plot(y1,z1,'r') plot(y2,z2,'r')
clear t y1 z1 y2 z2 ay1 bz1 ay2 bz2;
%NAME TEXT BELOW sortData.m
% sortedData expects the name of a file that is in the directory % of the function. % It returns cell array with Colums [x y z B]
function sortedData = sortData(data_url)
rawdata = fopen(data_url,'r');

266
n = 1; % line counter currentLine = fgetl(rawdata);
while ischar(currentLine) ~= 0 if strncmpi(currentLine,' XYZ',13) parts = strread(currentLine,'%s', 'delimiter', ' '); X = str2double(parts(3)); Y = str2double(parts(4)); Z = str2double(parts(5));
sortedData(n,3) = X; sortedData(n,1) = Y; sortedData(n,2) = Z;
elseif strncmpi(currentLine,' Sval',14) parts = strread(currentLine,'%s', 'delimiter', ' '); B = str2double(parts(3)); sortedData(n,4) = B; n = n+1;
end
currentLine = fgetl(rawdata);
end
fclose(rawdata);
B.2 Magnetic levitation analysis
Below are three sets of text which correspond to three different m files. The first m file titled
“numerical_live.m” calls the other functions (2 files). The following code takes the mechanical
parameters of the magnetic levitation harvester from “f.m” and performs a frequency sweep
through 1.7 to 81.7 rad/s. The code automatically takes the steady state velocity and position
from the previous frequency and sets it as the initial conditions for the next frequency. The
“piecewisespie.m” file only applies the damping constant ce when the magnet is within the coil
volume.
%NAME TEXT below numerical_live.m
clear all close all
xo=[-0.0087;0];
267
ts=[0 5]; wt=[1.7:1:81.7]; %wt=fliplr(wtt);
for i = 1:length(wt) w=wt(i); global w;
[t,x]=ode45('f',ts,xo);
velocity(i)=min(x(0.8*length(x):0.9*length(x),2)); position(i)=max(x(0.8*length(x):0.9*length(x),1)); positionlow(i)=(min(x(0.8*length(x):0.9*length(x),1)));
% xo=[0;velocity(i)];
xo=[(position(i)+positionlow(i))/2;velocity(i)];
% figure % plot(t,x(:,1)) % figure % plot(t,x(:,2))
end
figure plot(t,x(:,1)) figure plot(t,x(:,2)) % figure % hold on % plot(wt/(2*pi),(((((((velocity*-
1)*(17.91))/(3088+(3088*2.5)))*(3088*2.5))/sqrt(2)).^2)/(3088*2.5))*1000,'o')
figure plot(wt/(2*pi),velocity*-1,'o') % % figure % plot(wt/(2*pi),position,'r',wt/(2*pi),positionlow,'b')
%NAME TEXT BELOW fspie.m
function v=f (t,x) global w
m=0.0037;k=15.74;k3=670200;k5=3846000000;c=(2*0.115*sqrt(k*m));ce=(0.029);Fo=
9.8*.35;Fg=-9.8; v=[x(2);x(1).*-k/m+(x(1).^3).*-k3/m+0*(x(1).^5).*-k5/m+x(2).*-
c/m+(piecewisespie(x(1))*(x(2).*-ce/m))-Fo*cos(w*t)+Fg];
%NAME TEXT BELOW piecewisespie.m

268
function em=piecewisespie(x)
if x < -0.0015 em = 0; elseif x > 0.0015 em = 0; elseif x < -0.001 && x > -0.0015 em = 0.5; elseif x > 0.001 && x < 0.0015 em = 0.5; else em = 1;
% if x < -0.00395 && x > -0.00495 % em=0.33; % elseif x > 0.00395 && x < 0.00495 % em=0.33; % elseif x > -0.0005 && x < 0.0005 % em = 1; % else % em=0; End
B.3 Direct vibration harvester analysis
Below are two sets of text which correspond to two different m files. The first m file titled
“varymratio.m” calls the other functions “total_meso_elecsinglefinal”. The following code takes
the mechanical parameters of the direct vibration harvester from “total_meso_elecsinglefinal”
and varies parameters such as gear ratio, load resistance and input frequency. The output consists
of position and velocity of the isolator, absorber and primary masses as well as the power output
of the harvester.
% NAME TEXT BELOW varymratio.m clear all close all
% nfft=8192; % fs=1000;
xo=[0;0;0;0;0;0]; ts=[0 30];
N=[20:1:60]; RL=[2000:1000:20000]; %wt=[3:1:126]'; % R=[2000:100:20000];
for i=1:length(N)
w=14*2*pi;
269
% global w;
N_gear=N(i); global N_gear; % global Rl
for j=1:length(RL)
load=RL(j); global load;
[t,x]=ode45('total_meso_elecsinglefinal',ts,xo);
base_velocity=((9.8*0.91)/w)*cos(w*t); base_displacement=((9.8*0.91)/(w^2))*sin(w*t);
primary_velocity=x(:,5); primary_disp=x(:,2); absorber_disp=x(:,3);
relativevelocity(i,j)=max(base_velocity(5000:5500)-
primary_velocity(5000:5500)); relativedisp(i,j)=max(base_displacement(5000:5500)-primary_disp(5000:5500)); absorberdisp(i,j)=max(absorber_disp(5000:5500));
ce(i,j)=((N_gear.^2).*((0.01^2)/(0.0065^2)).*(((11.885)^2)./(1964+load))); power(i,j)=((((N_gear.^2).*((0.01^2)/(0.0065^2)).*(((11.885)^2)./(1964+load))
).*((max(base_velocity(5000:5500)-
primary_velocity(5000:5500))./sqrt(2)).^2))/(1964+load))*load;
% iso_velocity=x(:,4); % iso_disp=x(:,1); % % % % % absorber_velocity=x(:,6); end
end
surf(RL,N,power) % ce=(N.^2).*((0.01^2)/(0.0065^2)).*(((10.06)^2)./(1964+3000)); % power=((ce.*((relativevelocity./sqrt(2)).^2))/(1964+3000))*3000; % % figure % plot(N,power) % % figure % % plot(N,((relativevelocity./sqrt(2))./0.0065).*N)
270
% figure % plot(base_velocity,'b') % hold on % plot(base_velocity-primary_velocity,'g') % hold on % plot(primary_velocity,'r') % % figure % plot(base_displacement,'b') % hold on % plot(base_displacement-primary_disp,'g') % hold on % plot(primary_disp,'r') % % figure % plot(absorber_disp,'r')
% NAME TEXT BELOW total_meso_elecsinglefinal.m
function v=total_meso_elecsinglefinal(t,x) global w % global N_gear % global load % global Rl
mp=0.3; ma=0.0847; mi=0.083;
kp=2189; ka=618; ki=42;
wi=sqrt(ki/mi); wp=sqrt(kp/mp); % wb=wp; wa=sqrt(ka/ma);
zetai=0.04; zeta=0.04;
cp=zetai*2*mp*wp; ca=zeta*2*ma*wa; ci=zetai*2*mi*wi; ce=((35^2).*((0.01^2)/(0.0065^2)).*(((11.885)^2)/(1964+2000)));
Y=(9.8)./((w).^2); % Y=0.002207;
M=[mi 0 0; 0 mp 0; 0 0 ma];

271
C=[ci+cp -cp 0; -cp cp+ca+ce -ca; 0 -ca ca]; K=[ki+kp -kp 0; -kp kp+ka -ka; 0 -ka ka]; B=[ci*Y*w*cos(w*t)+ki*Y*sin(w*t); (1*(ce*Y*w*cos(w*t))); 0];
A1=[zeros(3) eye(3); -inv(M)*K -inv(M)*C]; g=inv(M)*B;
v=A1*x+[0;0;0;g];
B.4 Micro wind turbine analysis for calculating
Below are five sets of text which correspond to five different m files. The first m file titled
“Automatic.m” calls the other four m files. The following code takes the output from the
ANSYS results from A.6 or A.7 and sorts the data, breaks the coil face into many discrete areas,
and calculates the angle phi, average y, and average B for each of the areas. The third line in
Automatic.m extracts the data and therefore the name and location of ANSYS file goes here..
The MATLAB code will output variables for the ANSYS file input. The four column variable
contains the y-coordinate, z-coordinate, B, angle phi.
%NAME TEXT BELOW Automatic.m disp('Welcome for Extracting and Angle Calculation'); disp('Written by Darian A.Schaab (10/28/2012)');
extract_data = sortData('C:\Users\darian.schaab\Maschbau\5. Semester\ME4015 -
Senior Design
Project\Generator\Simulation\gap_optimizing\2_75\10252012_gap_275_z_025.txt')
; select_data = averagedata(extract_data,-0.0035,0,0.003,0.0117,8,24);
XNEED(1:38,1) = [-0.00328125;-0.00284375;-0.00284375;-0.00284375;-
0.00240625;-0.00240625;-0.00240625;-0.00240625;-0.00240625;-0.00240625;-
0.00196875;-0.00196875;-0.00196875;-0.00196875;-0.00196875;-0.00196875;-
0.00196875;-0.00196875;-0.00153125;-0.00153125;-0.00153125;-0.00153125;-
0.00153125;-0.00153125;-0.00153125;-0.00153125;-0.00109375;-0.00109375;-
0.00109375;-0.00109375;-0.00109375;-0.00109375;-0.00109375;-0.00109375;-
0.000656250;-0.000656250;-0.000656250;-0.000656250;]; YNEED(1:38,1) = [ 0.00861875; 0.00861875; 0.00825625; 0.00789375; 0.00680625;
0.00716875; 0.00753125; 0.00789375; 0.00825625; 0.00861875; 0.00825625;
0.00789375; 0.00753125; 0.00716875; 0.00680625; 0.00644375; 0.00608125;
0.00571875; 0.00463125; 0.00499375; 0.00535625; 0.00571875; 0.00608125;
0.00644375; 0.00680625; 0.00716875; 0.00608125; 0.00571875; 0.00535625;
0.00499375; 0.00463125; 0.00426875; 0.00390625; 0.00354375; 0.00535625;
0.00499375; 0.00463125; 0.00426875;];
XNEED(1:19,2) = [-0.00328125;-0.00328125;-0.00284375;-0.00284375;-
0.00284375;-0.00284375;-0.00240625;-0.00240625;-0.00240625;-0.00240625;-
0.00240625;-0.00196875;-0.00196875;-0.00196875;-0.00196875;-0.00153125;-
0.00153125;-0.00153125;-0.00153125;];
272
YNEED(1:19,2) =
[0.00898125;0.00934375;0.00898125;0.00934375;0.00970625;0.0100687500000000;0.
00898125;0.00934375;0.00970625;0.0100687500000000;0.0104312500000000;0.009343
75;0.00970625;0.0100687500000000;0.0104312500000000;0.0107937500000000;0.0104
312500000000;0.0100687500000000;0.00970625;];
XNEED(1:7,3) = [-0.000656250;-0.000656250;-0.000656250;-0.000218750;-
0.000218750;-0.000218750;-0.000218750;]; YNEED(1:7,3) =
[0.00318125;0.00354375;0.00390625;0.00426875;0.00390625;0.00354375;0.00318125
;];
coil1 = 0; test = 0;
for ii = 1:1:192 for jj = 1:1:38
if (select_data(ii,1)+10e-019 >= XNEED(jj,1) && select_data(ii,1)-
10e-019 <= XNEED(jj,1))
if (select_data(ii,2)+10e-019 >= YNEED(jj,1) &&
select_data(ii,2)-10e-019 <=YNEED(jj,1)) test = test+1; coil1(test,1:3) = [XNEED(jj,1),YNEED(jj,1),
select_data(jj,3)];
end end end end
coil2 = 0; test = 0;
for ii = 1:1:192 for jj = 1:1:19
if (select_data(ii,1)+10e-019 >= XNEED(jj,2) && select_data(ii,1)-
10e-019 <= XNEED(jj,2))
if (select_data(ii,2)+10e-019 >= YNEED(jj,2) &&
select_data(ii,2)-10e-019 <=YNEED(jj,2)) test = test+1; coil2(test,1:3) = [XNEED(jj,2),YNEED(jj,2),
select_data(jj,3)];
end end end end
coil3 = 0; test = 0;
273
for ii = 1:1:192 for jj = 1:1:7
if (select_data(ii,1)+10e-019 >= XNEED(jj,3) && select_data(ii,1)-
10e-019 <= XNEED(jj,3))
if (select_data(ii,2)+10e-019 >= YNEED(jj,3) &&
select_data(ii,2)-10e-019 <=YNEED(jj,3)) test = test+1; coil3(test,1:3) = [XNEED(jj,3),YNEED(jj,3),
select_data(jj,3)];
end end end end
clear jj; clear ii; clear test; clear XNEED; clear YNEED;
phi1 = straightcoil(coil1); coil1(1:38,4) = phi1(1:38,4); clear phi1; disp('Calculated all Angles for Area 1');
phi2 = phiArray(coil2, [-0.0015138;0.0088646]); coil2(1:19,4) = phi2(1:19,4); clear phi2; disp('Calculated all Angles for Area 2');
phi3 = phiArray(coil3, [0 ;0.0050013]); coil3(1:7,4) = phi3(1:7,4); clear phi3; disp('Calculated all Angles for Area 3');
%NAME TEXT BELOW averagedata.m
function [ listdata ] = averagedata( dataF, minval_x, maxval_x, minval_y,
maxval_y, numblock_x, numblock_y ) %UNTITLED Summary of this function goes here % Detailed explanation goes here
ii = 1; kk = 0; dataF1 = 0;
while ii <= size(dataF,1)
if ((dataF(ii,1)> minval_x) && (dataF(ii,1)<maxval_x)) if ((dataF(ii,2)> minval_y) &&(dataF(ii,2)<maxval_y))
274
kk = kk +1; dataF1(kk,1:4) = dataF(ii,1:4); end
end
ii = ii+1; end
disp('Lines of data in the specific array:'); disp(kk); disp('Scanned data points:'); disp(ii);
plot3(dataF1(:,1),dataF1(:,2),dataF1(:,4),'o') xlim([minval_x maxval_x]); ylim([minval_y maxval_y]); xlabel('x-direction in m') ylabel('y-direction in m') zlabel('Magnet Field in T')
averagecell =dataF1;
datasort = sortcase(dataF1, maxval_x, minval_x, maxval_y, minval_y,
numblock_x, numblock_y);
figure;
for kk = 1:1:numblock_x
for jj = 1:1:numblock_y
if datasort(kk,jj,2) ~= 0 polisheddata(kk,jj) =
datasort(kk,jj,1)/datasort(kk,jj,2); else polisheddata(kk,jj) = 0; end
delta_x = (maxval_x-minval_x)/(numblock_x); delta_y = (maxval_y-minval_y)/(numblock_y);
if polisheddata(kk,jj) ~= 0 plot3((minval_x + kk*delta_x-delta_x/2),(minval_y +
jj*delta_y-delta_y/2),polisheddata(kk,jj),'o')
else plot3((minval_x + kk*delta_x-delta_x/2),(minval_y +
jj*delta_y-delta_y/2),polisheddata(kk,jj),'ro') end
275
listdata((kk*numblock_y-numblock_y+jj),1:3) = [(minval_x +
kk*delta_x-delta_x/2),(minval_y + jj*delta_y-delta_y/2), polisheddata(kk,jj)
];
hold on xlim([minval_x maxval_x]); ylim([minval_y maxval_y]); xlabel('x-direction in m') ylabel('y-direction in m') zlabel('Magnet Field in T')
end
end % % % while ii <= size(dataF,1) % % if ((dataF(ii,1)> minval_x) && (dataF(ii,1)<maxval_x)) % if ((dataF(ii,2)> minval_y) &&(dataF(ii,2)<maxval_y)) % kk = kk +1; % dataF1(kk,1:4) = dataF(ii,1:4); % end % % end % % ii = ii+1; % end
end
function [datasort] = sortcase(dataF1, maxval_x, minval_x, maxval_y,
minval_y, numblock_x, numblock_y)
ii = 1; datasort = zeros(numblock_x,numblock_y,2);
delta_x = (maxval_x-minval_x)/(numblock_x); delta_y = (maxval_y-minval_y)/(numblock_y);
while ii <= size(dataF1,1)
%ii goes through all values of dataF1
for kk = 1:1:numblock_x
%kk goes through all colums to numblock_x
if ((dataF1(ii,1)> (minval_x +(kk-1)*delta_x)) && (dataF1(ii,1)<
(minval_x + kk*delta_x)))
276
for jj = 1:1:numblock_y
%%jj goes through all lines to numblock_y
% test1 = dataF1(ii,2)
if ((dataF1(ii,2)> (minval_y + (jj-1)*delta_y))
&&(dataF1(ii,2)< (minval_y + jj*delta_y)))
% test= size(datasort)
% if ([size(datasort,1) size(datasort,2)] == [kk,jj]) &&
(datasort(1,1) ~= 0) %Checks if datasort must be
initialised datasort(kk,jj,1) = datasort(kk,jj,1)+ dataF1(ii,4); datasort(kk,jj,2) = datasort(kk,jj,2) +1; % else % datasort(kk,jj,1) =dataF1(ii,4); % datasort(kk,jj,2) = 1; % end end
end end
end
ii = ii + 1; end
end
%datasort(colum, line, 1)= B_sum %datasort(colum, line, 2)= number
%NAME TEXT BELOW phiArray.m
function [ all ] = phiArray( allpoints, vec_pin ) %UNTITLED2 Summary of this function goes here % Detailed explanation goes here
for ii = 1:1:size(allpoints,1)
phi = phicircle([allpoints(ii,1);allpoints(ii,2)], vec_pin);
if phi > (pi/2) phi = pi-phi; end
all(ii,1:4)= [allpoints(ii,1) allpoints(ii,2) phi cos(phi)];

277
end
end
function [ angl_phi ] = phicircle(xx, vec_pin) %PHICIRCLE Calculates Angle of Wire in the round section % Define center position of rotation axis. Also define position of % coilpin. The function will find angle between coil and middle vector.
%%Location Definition vec_center = [0;0]; %pin1 %vec_pin = [-0.0015138;0.0088646]; %pin2 %vec_pin = [0 ;0.0050013]
%% Generating angle
dir_xxcen = (xx-vec_center)/norm(xx-vec_center);
dir_tanci = [cos(atan((xx(1)-vec_pin(1))/(xx(2)-vec_pin(2))));-
sin(atan((xx(1)-vec_pin(1))/(xx(2)-vec_pin(2))))];
angl_phi = acos(dir_xxcen(1)*dir_tanci(1)+dir_xxcen(2)*dir_tanci(2));
%return; %Shut off plotting
%% Ploting for understanding
plot([xx(1) xx(1)-(dir_xxcen(1)/1000)],[xx(2) xx(2)-(dir_xxcen(2)/1000)]); hold on; plot([xx(1) xx(1)-(dir_tanci(1)/1000)],[xx(2) xx(2)-(dir_tanci(2)/1000)]); plot(vec_center(1),vec_center(2), 'o'); plot(vec_pin(1),vec_pin(2), 'rx'); %rectangle('Position',[vec_pin(1)-norm(xx-vec_pin),vec_pin(2)-norm(xx-
vec_pin),2*norm(xx-vec_pin),2*norm(xx-vec_pin)],'Curvature',[1,1]); axis equal;
end
%NAME TEXT BELOW sortData.m
% sortedData expects the name of a file that is in the directory % of the function. % It returns cell array with Colums [x y z B]
function sortedData = sortData(data_url)
rawdata = fopen(data_url,'r');
278
n = 1; % line counter currentLine = fgetl(rawdata);
while ischar(currentLine) ~= 0 if strncmpi(currentLine,' XYZ',13) parts = strread(currentLine,'%s', 'delimiter', ' '); X = str2double(parts(3)); Y = str2double(parts(4)); Z = str2double(parts(5));
sortedData(n,1) = X; sortedData(n,2) = Y; sortedData(n,3) = Z;
elseif strncmpi(currentLine,' Sval',14) parts = strread(currentLine,'%s', 'delimiter', ' '); B = str2double(parts(3)); sortedData(n,4) = B; n = n+1;
end
currentLine = fgetl(rawdata);
end
fclose(rawdata);
% NAME TEXT BELOW straightcoil.m
function [ all ] = straightcoil( allpoints ) %UNTITLED Summary of this function goes here % Detailed explanation goes here
for ii = 1:1:size(allpoints,1)
phi = straight([allpoints(ii,1);allpoints(ii,2)]);
if phi > (pi/2) phi = pi-phi; end
all(ii,1:4)= [allpoints(ii,1) allpoints(ii,2) phi cos(phi)];
end

279
end
function [phi] = straight(xx)
%%Location Definition vec_center = [0;0]; %pin1 vec_pin1 = [-0.0015138;0.0088646]; %pin2 vec_pin2 = [0 ;0.0050013];
dir_coil = (vec_pin1-vec_pin2)/norm(vec_pin1-vec_pin2);
dir_xxcen = (xx-vec_center)/norm(xx-vec_center);
phi = acos(dir_xxcen(1)*dir_coil(1)+dir_xxcen(2)*dir_coil(2));
end
B.5 Micro wind turbine analysis for determining varying gear ratio and load resistance effect on power clear all %% Defining variables and values syms w Rl Phi transmission
Phi= 11.97; %1.4; 12.2; 11.2 Rc= 2700; %41.5; 2700; 2700
[RloadM, transM] = meshgrid(1:1000:100000,1:0.125:5);
%% Defining functions of system
slopeBl=0.00041./transmission./(180.*transmission); startupT=0.00041./transmission;
generator_torque = Phi.^2*0.01.^2.*w./(2*(Rc+Rl)); blade_torque = startupT-slopeBl.*w;
%% solving for SS-velocity
wss = solve(generator_torque-blade_torque==0,w)
%% Creating functionhandles
wfcthdl = matlabFunction(wss) genetrfcthdl = matlabFunction(generator_torque)
%% Evaluating functions on mesh
w_ss = wfcthdl(RloadM,transM);
280
powergenerator = Phi.^2*0.01.^2*w_ss.^2.*RloadM./(2*(Rc+RloadM).^2);
%% Plotting functions hSurface = surf(RloadM,transM,w_ss); set(hSurface,'FaceColor',[1 0 0],'FaceAlpha',0.5);
xlabel('load resistance in Ohm') ylabel('transmission ratio w_i_n/w_o_u_t') zlabel('Steady state velocity in 1/s') view(3)
figure hSurface2 = surf(RloadM,transM,powergenerator); set(hSurface2,'FaceColor',[1 1 0],'FaceAlpha',0.5);
xlabel('load resistance in Ohm') ylabel('transmission ratio w_i_n/w_o_u_t') zlabel('Generatorpower in W') view(3)
Related Documents