Journal of Asian Concrete Federation Vol. 6, No. 2, pp. 1-13, December 2020 ISSN 2465-7964 / eISSN 2465-7972 https://doi.org/10.18702/acf.2020.12.6.2.1 1 Technical Paper Mechanical characterization of a FRCM system with aramid fiber fabric embedded in green high-strength cementitious matrix Munkhtuvshin Ochirbud, Donguk Choi*, Undram Naidanjav, S.-S. Ha, C.-Y. Lee (Received August 13, 2020; Revised October 26, 2020; Accepted October 28, 2020; Published December 31, 2020) Abstract: Fabric reinforced cementitious matrix (FRCM) system can be applied to strengthen existing RC structures. In this experimental study, aramid fiber (AF) mesh was used along with green high- strength mortar (f’c = 75.6 MPa) incorporating fine waste glass powder as partial replacement of cement and 100% recycled fine aggregate. Test objective was to provide basic design parameters through me- chanical characterization of the AF-FRCM system. Three different types of tests were conducted: Uni- axial test of tensile specimens; flexural test of composite short beams; and pull-off test of thin FRCM placed on top of normal strength concrete. Thickness of FRCM was about 10 mm while the volumetric ratio of the fiber fabric to gross volume was 1.3% (0.65% in each direction). Tensile test results showed that the load-displacement relationship of the FRCM was relatively ductile, while tensile behavior of the AF governed at the peak load. Nominal tensile strength of the FRCM cross-section was 6.4 MPa at 4.6% strain of the composite material. Short beam strength of 1.3 MPa was determined from flexural test of composite short beams (or interlaminar shear test) performed following ASTM D2344M. In the pull-off test, two different failure modes were identified: Interface failure or substrate failure in tension. Average pull-off strength was 2.84 MPa. Design values were suggested based on current test results of the AF- FRCM. Keywords: FRCM; aramid fiber; green high-strength mortar; tensile test; composite short beam; pull- off test. 1 Introduction Fabric-reinforced cementitious matrix (FRCM) system is a relatively new technology in the area of strengthening and repair of RC and masonry struc- tures. Externally-bonded FRCM system typically consists of one or more layers of 2D or 3D fiber fab- ric and the cementitious matrix in which the fiber fabric is embedded. The performance of the FRCM system at elevated temperatures is significantly en- hanced compared to that of the external fiber rein- forced polymer (FRP) strengthening as the fiber fab- ric is protected in the inorganic cementitious matrix [1]. The FRCM technology is applicable to wet sur- face. As the fibers are not directly exposed to outdoor environment, the fiber fabric is prevented from out- door weathering such as ultra violet exposure. The FRCM technology has originally evolved from the ferrocement, where the metallic reinforcement is re- placed by fabrics of dry fibers [2]. Research performed to define mechanical prop- erties of the FRCM system and develop more effi- cient technology to strengthen RC members have been active during the last decade. Existing studies on the mechanical characterization of the FRCM sys- tem include tensile behavior of the FRCM, bond and/or pull-off behavior of FRCM bonded to con- crete, and interlaminar shear behavior [3-10]. Many researchers concentrated on the behavior of the FRCM-strengthened RC members such as flexural Munkhtuvshin Ochirbud is a M.S. student of the School of Ar- chitecture, Hankyong National University, South Korea. Corresponding author Donguk Choi is a Professor in the School of Architecture & Design Convergence, Hankyong Na- tional University, South Korea. Undram Naidanjav is a M.S. student of the School of Architec- ture, Hankyong National University, South Korea. S.-S. Ha is a Professor of the Divison of Real Estate and Con- strucion Engineering, Kangnam University, South Korea. C.-Y. Lee is a Principal Researcher and CEO of CareCon, Ltd, South Korea.

Welcome message from author
This document is posted to help you gain knowledge. Please leave a comment to let me know what you think about it! Share it to your friends and learn new things together.
Transcript
Journal of Asian Concrete Federation
Vol. 6, No. 2, pp. 1-13, December 2020
ISSN 2465-7964 / eISSN 2465-7972
https://doi.org/10.18702/acf.2020.12.6.2.1
1
Technical Paper
Mechanical characterization of a FRCM system with aramid
fiber fabric embedded in green high-strength cementitious
matrix
Munkhtuvshin Ochirbud, Donguk Choi*, Undram Naidanjav, S.-S. Ha, C.-Y. Lee
(Received August 13, 2020; Revised October 26, 2020; Accepted October 28, 2020; Published December 31, 2020)
Abstract: Fabric reinforced cementitious matrix (FRCM) system can be applied to strengthen existing
RC structures. In this experimental study, aramid fiber (AF) mesh was used along with green high-
strength mortar (f’c = 75.6 MPa) incorporating fine waste glass powder as partial replacement of cement
and 100% recycled fine aggregate. Test objective was to provide basic design parameters through me-
chanical characterization of the AF-FRCM system. Three different types of tests were conducted: Uni-
axial test of tensile specimens; flexural test of composite short beams; and pull-off test of thin FRCM
placed on top of normal strength concrete. Thickness of FRCM was about 10 mm while the volumetric
ratio of the fiber fabric to gross volume was 1.3% (0.65% in each direction). Tensile test results showed
that the load-displacement relationship of the FRCM was relatively ductile, while tensile behavior of the
AF governed at the peak load. Nominal tensile strength of the FRCM cross-section was 6.4 MPa at 4.6%
strain of the composite material. Short beam strength of 1.3 MPa was determined from flexural test of
composite short beams (or interlaminar shear test) performed following ASTM D2344M. In the pull-off
test, two different failure modes were identified: Interface failure or substrate failure in tension. Average
pull-off strength was 2.84 MPa. Design values were suggested based on current test results of the AF-
FRCM.
Keywords: FRCM; aramid fiber; green high-strength mortar; tensile test; composite short beam; pull-
off test.
1 Introduction
Fabric-reinforced cementitious matrix (FRCM)
system is a relatively new technology in the area of
strengthening and repair of RC and masonry struc-
tures. Externally-bonded FRCM system typically
consists of one or more layers of 2D or 3D fiber fab-
ric and the cementitious matrix in which the fiber
fabric is embedded. The performance of the FRCM
system at elevated temperatures is significantly en-
hanced compared to that of the external fiber rein-
forced polymer (FRP) strengthening as the fiber fab-
ric is protected in the inorganic cementitious matrix
[1]. The FRCM technology is applicable to wet sur-
face. As the fibers are not directly exposed to outdoor
environment, the fiber fabric is prevented from out-
door weathering such as ultra violet exposure. The
FRCM technology has originally evolved from the
ferrocement, where the metallic reinforcement is re-
placed by fabrics of dry fibers [2].
Research performed to define mechanical prop-
erties of the FRCM system and develop more effi-
cient technology to strengthen RC members have
been active during the last decade. Existing studies
on the mechanical characterization of the FRCM sys-
tem include tensile behavior of the FRCM, bond
and/or pull-off behavior of FRCM bonded to con-
crete, and interlaminar shear behavior [3-10]. Many
researchers concentrated on the behavior of the
FRCM-strengthened RC members such as flexural
Munkhtuvshin Ochirbud is a M.S. student of the School of Ar-
chitecture, Hankyong National University, South Korea.
Corresponding author Donguk Choi is a Professor in the
School of Architecture & Design Convergence, Hankyong Na-
tional University, South Korea.
Undram Naidanjav is a M.S. student of the School of Architec-
ture, Hankyong National University, South Korea.
S.-S. Ha is a Professor of the Divison of Real Estate and Con-
strucion Engineering, Kangnam University, South Korea.
C.-Y. Lee is a Principal Researcher and CEO of CareCon, Ltd,
South Korea.
Journal of Asian Concrete Federation, Vol. 6, No. 2, December 2020
2
and shear strengthening of RC beams as well as con-
finement of concrete columns [11-19]. Ebead and El-
Sherif studied the behavior of RC beams strength-
ened in flexure using near surface embedded-FRCM
[20]. It is noted that the FRCM can be an efficient
technology to repair historic structures such as
arches and vault as it is applicable on the curved sur-
face [21].
Although the performance of many different fi-
bers has been investigated such as carbon fiber, glass
fiber, basalt fiber, or polyparaphenylene benzobisox-
asole (PBO) fiber, there are still few published re-
sults of research on the mechanical characterization
of aramid fiber fabric embedded in cementitious ma-
trix. Caggegi et al. investigated the tensile properties
of uniaxial aramid textile and quadriaxial aramid tex-
tile fabric [22]. Due to dense textile of aramid fibers,
cementitious matrix delaminated during tensile test-
ing and hence low fiber stress of 1,089 MPa at ulti-
mate was reported for the uniaxial aramid textile.
Higher ultimate strength of the aramid fiber of 1,354
MPa was shown by the quadriaxial textile where the
aramid fabric slippage was observed from the ce-
mentitious matrix. In another investigation by
Ascione et al., coated bidirectional glass-aramid fi-
ber textile was tested [23]. The glass-aramid textile
showed 1,784 MPa strength of the fiber in tension at
ultimate. In this test, due to use of hydraulic grip of
the UTM which restrained the free slippage of the
fabric from the cementitious matrix during tensile
test, the final failure mode was rupture of the glass-
aramid fibers at 2.02% strain.
In this study, aramid fiber (AF) was used in a
form of 2D fabric (AF mesh) along with a green
high-strength mortar utilizing recycled materials
such as finely ground waste glass powder and recy-
cled fine aggregate. Three different experimental
programs were carried out: Uniaxial test of FRCM
tensile specimens, flexural test of composite short
beams made of double FRCM layers following
ASTM D2344M, and pull-off test using FRCM-con-
crete blocks [24]. The purpose was to provide basic
design parameters and the rational mechanical char-
acterization of the AF-FRCM system. It is noted that
the cementitious matrix (mortar) used in this study is
of significantly higher strength than low-to-medium
strength mortars often used for FRCM [8]. Use of a
high-strength mortar was deemed necessary to in-
crease the tensile capacity of the AF-FRCM system.
As the binder content increases with use of the high-
strength mortar, fine waste glass powder was used to
partially replace cement. Recycled fine aggregate
was also used to replace natural sand, considering
economical aspect of the AF-FRCM system as well
as to promote sustainability.
2 Experimental program
2.1 Materials
2.1.1 Aramid fiber mesh
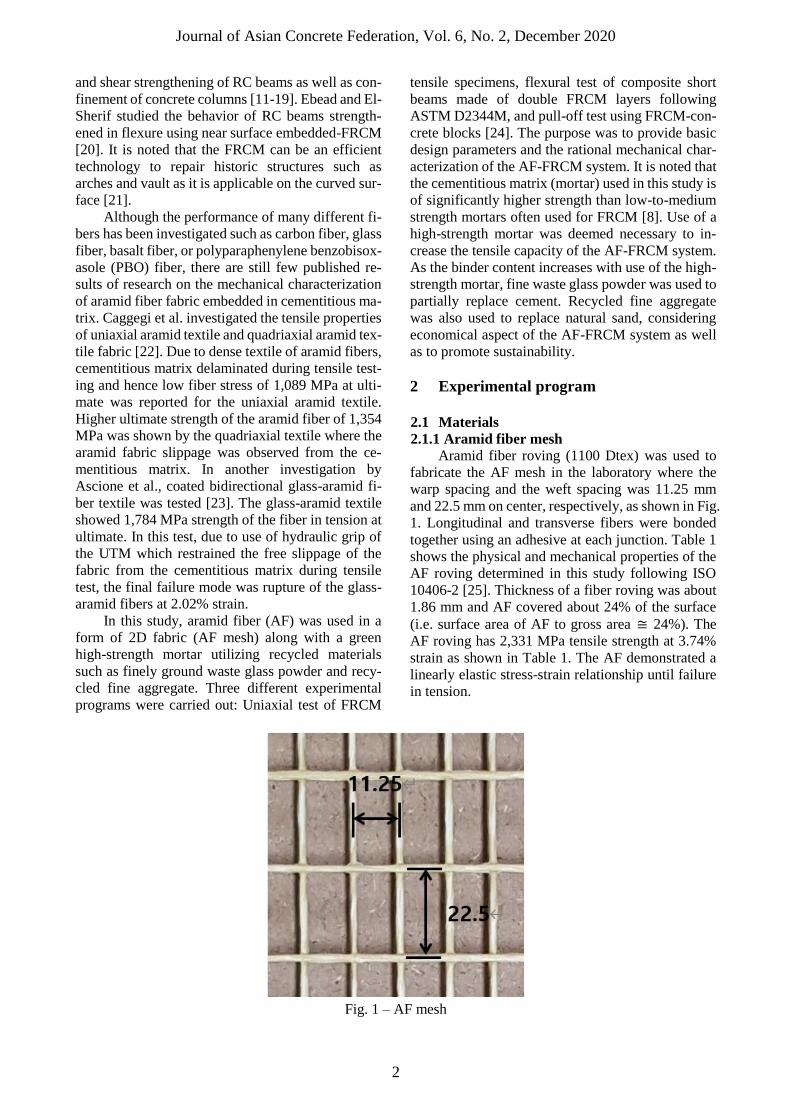
Aramid fiber roving (1100 Dtex) was used to
fabricate the AF mesh in the laboratory where the
warp spacing and the weft spacing was 11.25 mm
and 22.5 mm on center, respectively, as shown in Fig.
1. Longitudinal and transverse fibers were bonded
together using an adhesive at each junction. Table 1
shows the physical and mechanical properties of the
AF roving determined in this study following ISO
10406-2 [25]. Thickness of a fiber roving was about
1.86 mm and AF covered about 24% of the surface
(i.e. surface area of AF to gross area ≅ 24%). The
AF roving has 2,331 MPa tensile strength at 3.74%
strain as shown in Table 1. The AF demonstrated a
linearly elastic stress-strain relationship until failure
in tension.
Fig. 1 – AF mesh
Journal of Asian Concrete Federation, Vol. 6, No. 2, December 2020
3
Table 1 – Physical and mechanical properties of AF roving
Cross-sectional area (mm2) 0.737
Density (g/mm3) 0.00144
Strength, ffu (MPa) 2,331
Ultimate strain, εfu 0.0374
Elastic modulus, Ef (GPa) 61.4
Coefficient of thermal expansion (m/m/°C) -2.4 × 10⁻⁶
NOTE: Results of 12 tensile tests of AF roving, where density and coefficient of thermal expansion were supplied by
manufacturer.
2.1.2 Green high-strength cementitious matrix
A high-strength cementitious matrix for the
FRCM system was necessary because the FRCM
technology was to be used for the purpose of
strengthening RC members after the current phase of
study. As the material cost of the high-strength ce-
mentitious matrix increases due to use of silica fume
(SF) and siliceous sand in large quantities, it was de-
termined to introduce recycled materials as constitu-
ents such as fine waste glass powder (WGP) and re-
cycled fine aggregate (RFA) [27]. While there are
several types of the waste glass powders used in Ko-
rea such as those produced from LCD waste glass,
green or brown glass bottles, plate glass, the WGP
used in this study was manufactured by crushing and
grinding waste green bottles. The finely ground
WGP (< 50 μm) is an amorphous material with more
than 78% silica content. Table 2 shows the mix de-
sign of the green high-strength mortar used in this
study, where WGP partly replaces SF in Table 2.
Sand used was 100% RFA produced from demol-
ished concrete. The wet-processed RFA was sup-
plied by a commercial producer. The maximum par-
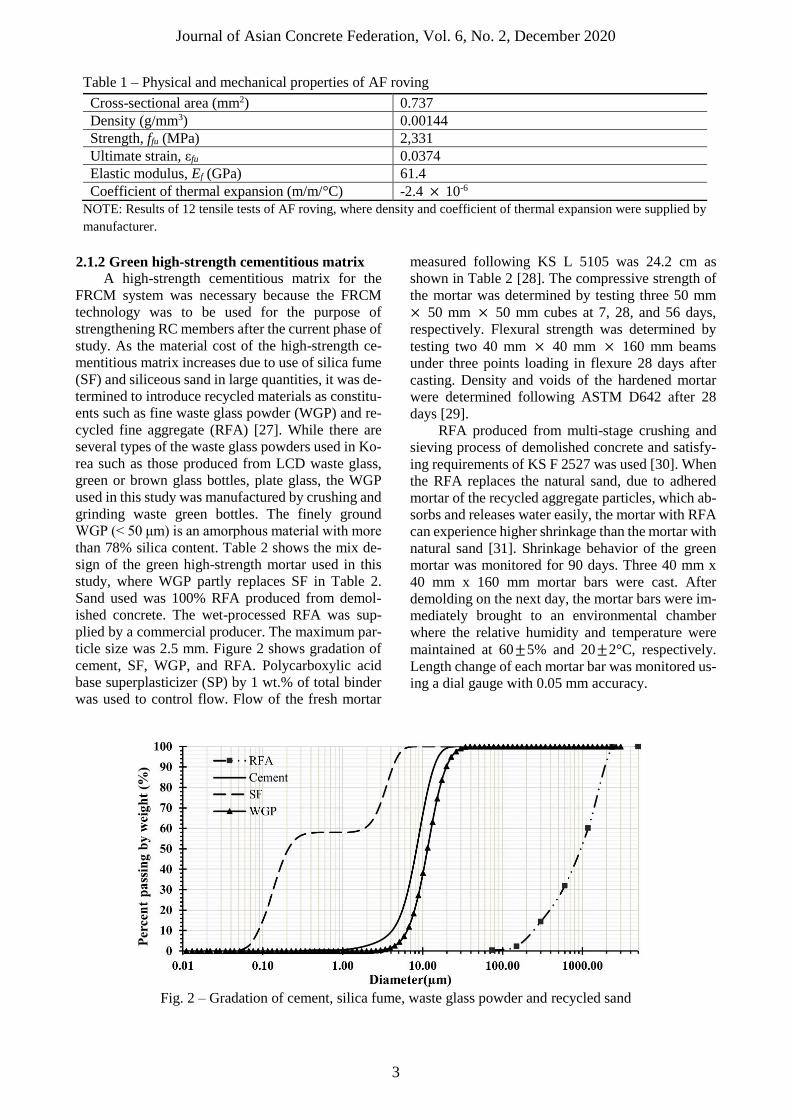
ticle size was 2.5 mm. Figure 2 shows gradation of
cement, SF, WGP, and RFA. Polycarboxylic acid
base superplasticizer (SP) by 1 wt.% of total binder
was used to control flow. Flow of the fresh mortar
measured following KS L 5105 was 24.2 cm as
shown in Table 2 [28]. The compressive strength of
the mortar was determined by testing three 50 mm
× 50 mm × 50 mm cubes at 7, 28, and 56 days,
respectively. Flexural strength was determined by
testing two 40 mm × 40 mm × 160 mm beams
under three points loading in flexure 28 days after
casting. Density and voids of the hardened mortar
were determined following ASTM D642 after 28
days [29].
RFA produced from multi-stage crushing and
sieving process of demolished concrete and satisfy-
ing requirements of KS F 2527 was used [30]. When
the RFA replaces the natural sand, due to adhered
mortar of the recycled aggregate particles, which ab-
sorbs and releases water easily, the mortar with RFA
can experience higher shrinkage than the mortar with
natural sand [31]. Shrinkage behavior of the green
mortar was monitored for 90 days. Three 40 mm x
40 mm x 160 mm mortar bars were cast. After
demolding on the next day, the mortar bars were im-
mediately brought to an environmental chamber
where the relative humidity and temperature were
maintained at 60±5% and 20±2°C, respectively.
Length change of each mortar bar was monitored us-
ing a dial gauge with 0.05 mm accuracy.
Fig. 2 – Gradation of cement, silica fume, waste glass powder and recycled sand
Journal of Asian Concrete Federation, Vol. 6, No. 2, December 2020
4
Table 2 – Mix design for green high-strength mortar and flow of fresh mortar
C
(kg/m3)
SF
(kg/m3)
WGP
(kg/m3)
RFA
(kg/m3)
W
(kg/m3) w/b
SP
(kg/m3)
Flow
(cm)
550 27.5 110 1,487 206 0.3 6.88 24.2
NOTE: Density of C, SF, WGP, RFA is 3.15, 2.2, 2.5, 2.47, respectively; water absorption of RFA is 2.34% in oven-
dry state.
2.2 Test method
2.2.1 Tensile test of FRCM
A thin FRCM plate (width = 405 mm, height =
450 mm, thickness ≈ 10 mm) was fabricated. AF
mesh that consisted of one fiber roving at 11.25-mm
center-to-center spacing (warp) and two fiber
rovings at 22.5-mm spacing on center (weft) was
first installed at half-depth of the 10-mm-thick plate,
and then the green high-strength mortar was cast to
full depth. The thin plate was wet cured until test date.
Nine 45-mm-wide and 450-mm-long FRCM flat
bars were cut from the plate using waterjet 28 days
after casting. Two specimens cut from both sides of
the plate were used for preliminary tests, and there-
fore a total of seven tensile test specimens was re-
tained for the tensile tests. The tensile test started 56
days after casting. One week prior to testing, a set of
two rectangular 6-mm-thick steel plates was bonded
to each end of the tensile test specimen on both sides
using two-part epoxy. The behavior of 120-mm
length in the middle was monitored during the tensile
test. The tensile test was performed under displace-
ment control at a rate of 1 mm per minute using In-
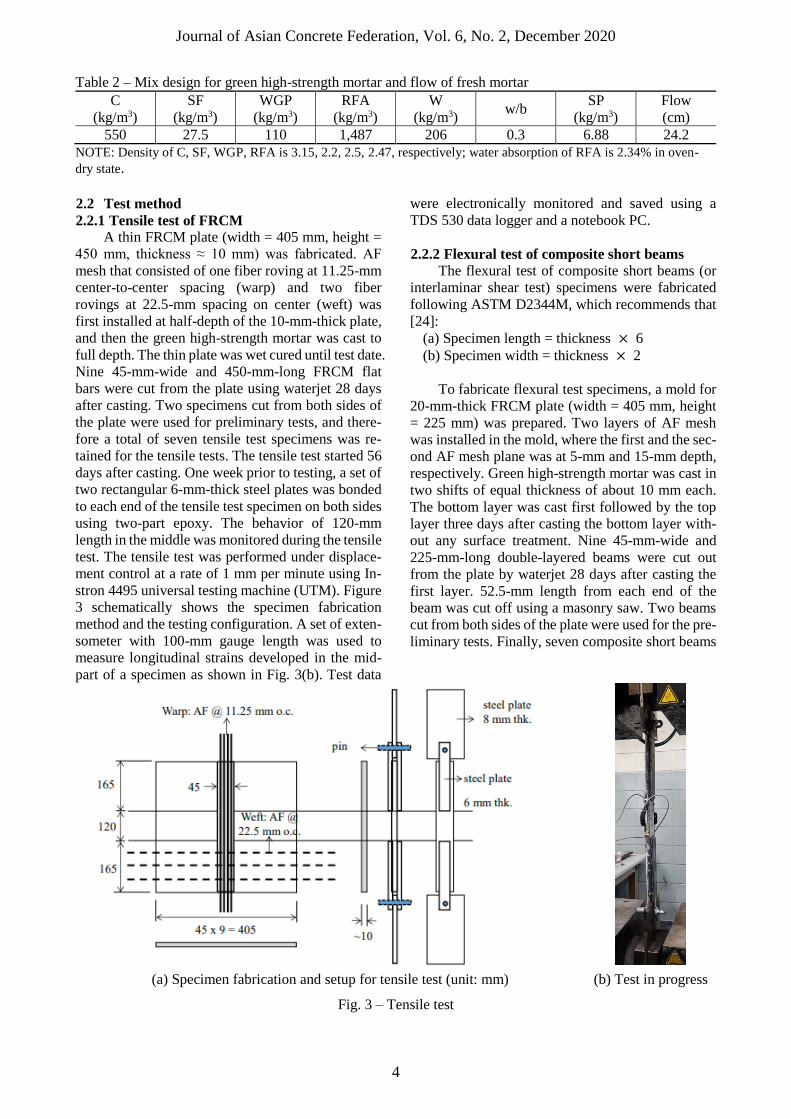
stron 4495 universal testing machine (UTM). Figure
3 schematically shows the specimen fabrication
method and the testing configuration. A set of exten-
someter with 100-mm gauge length was used to
measure longitudinal strains developed in the mid-
part of a specimen as shown in Fig. 3(b). Test data
were electronically monitored and saved using a
TDS 530 data logger and a notebook PC.
2.2.2 Flexural test of composite short beams
The flexural test of composite short beams (or
interlaminar shear test) specimens were fabricated
following ASTM D2344M, which recommends that
[24]:
(a) Specimen length = thickness × 6
(b) Specimen width = thickness × 2
To fabricate flexural test specimens, a mold for
20-mm-thick FRCM plate (width = 405 mm, height
= 225 mm) was prepared. Two layers of AF mesh
was installed in the mold, where the first and the sec-
ond AF mesh plane was at 5-mm and 15-mm depth,
respectively. Green high-strength mortar was cast in
two shifts of equal thickness of about 10 mm each.
The bottom layer was cast first followed by the top
layer three days after casting the bottom layer with-
out any surface treatment. Nine 45-mm-wide and
225-mm-long double-layered beams were cut out
from the plate by waterjet 28 days after casting the
first layer. 52.5-mm length from each end of the
beam was cut off using a masonry saw. Two beams
cut from both sides of the plate were used for the pre-
liminary tests. Finally, seven composite short beams
(a) Specimen fabrication and setup for tensile test (unit: mm) (b) Test in progress
Fig. 3 – Tensile test

Journal of Asian Concrete Federation, Vol. 6, No. 2, December 2020
5
(a) Schematics of specimen fabrication (unit: mm) (b) Test under progress
Fig. 4 – Flexural test of composite short beams
were used toward the flexural tests: Each beam was
about 120 mm long, 45 mm wide, and consisted of
double layers of FRCM with equal depth of 10 mm
each: i.e., total thickness was about 20 mm (See Fig.
4). The composite beams were tested under three
points loading.
The short-beam strength was determined using
Eq. (1) as suggested by ASTM D2344M [24]:
𝐹𝑠𝑏𝑠 = 0.75 × 𝑃𝑚𝑎𝑥
𝑏 x ℎ (1)
where Fsbs is short-beam strength (MPa), Pmax is
maximum load observed during test (N), b = meas-
ured specimen width (mm), and h is measured spec-
imen thickness (mm).
Figure 4 shows schematics of the specimen fab-
rication and the flexural test setup for composite
short beams. The flexural test was performed under
displacement control at a ramp rate of 1 mm per mi-
nute using a 50-kN UTM. Test data were electroni-
cally monitored and saved. Load, displacement, fail-
ure modes, and crack patterns were carefully ob-
served during and after test.
2.2.3 Pull-off test
For the pull-off test, a 500 mm × 500 mm ×
100 mm normal strength concrete block (fc’ = 30
MPa) was first cast. After 28 days, top surface of the
concrete block was roughened using two different
methods: sand blasting and shot blasting. The sand
patch method following ASTM STP763 was used to
measure the roughness, which revealed that the av-
erage depth of the roughened surface was 0.69 mm
and 0.76 mm, respectively, for the sand blasting and
(a) AF mesh installed on top of concrete block prior
to mortar casting
(b) Pull-off test in progress
Fig. 5 – Pull-off test
Journal of Asian Concrete Federation, Vol. 6, No. 2, December 2020
6
shot blasting [32]. After the sand/shot blasting was
completed, 3.5-mm thick, 50-mm wide, and 500-mm
long hardwood sections (wood plates) were bonded
along perimeters on top of the concrete block using
adhesive. AF mesh was manually installed using the
AF rovings at 11.25-mm center-to-center spacing in
one direction and at 22.5-mm spacing on center in
the other direction. After the AF mesh was installed,
the second layer of 3.5-mm thick hardwood sections
were bonded on top of the existing hardwood sec-
tions using adhesive so that the total height of the
two-layers of hardwood sections plus the AF mesh
(at mid height in between the two hardwood layers)
altogether was about 8 mm (See Fig. 5(a)). Then
green high-strength mortar was cast in one shift. The
concrete block with FRCM overlay was consolidated
using a vibrating table. The FRCM system was wet
cured until test which commenced after 28 days. One
week before testing, using a hand grinder, the FRCM
overlaid on the concrete block was cut in 45 mm x
45 mm grid pattern as shown in Fig. 5(b). Depth of
the cutting was about 25 mm. A steel end plate (40
mm x 40 mm) was bonded to the top surface of the
FRCM using two-part epoxy. A pull-off testing ap-
paratus was connected to the steel end plate after al-
lowing the epoxy to develop full strength for one
week. To avoid any possible interference between
adjacent pull-off tests, a checker board testing pat-
tern was adopted as shown in Fig. 5(b). The maxi-
mum load was recorded and the failure mode was
observed and recorded.
3 Test results
3.1 Properties of green cementitious matrix
When tests for the mechanical characterization
started at 56 days, average compressive strength of
three cubes was 75.6 MPa. Average flexural strength
determined from flexural test of two mortar bars was
5.50 MPa at 28 days. Density and voids of the hard-
ened mortar were determined following ASTM
D642 after 28 days as shown in Table 3 [29]. It is
noted that the water-to-binder (w/b) ratio of 0.3
shown in Table 3 does not include free water availa-
ble from superplasticizer (the sp consists of 30%
solid and 70% water by wt.). Including the content
of free water available by addition of the sp, the ef-
fective water-to-bonder ratio is 0.365, which ex-
plains a relatively large voids of 17.6% in Table 3.
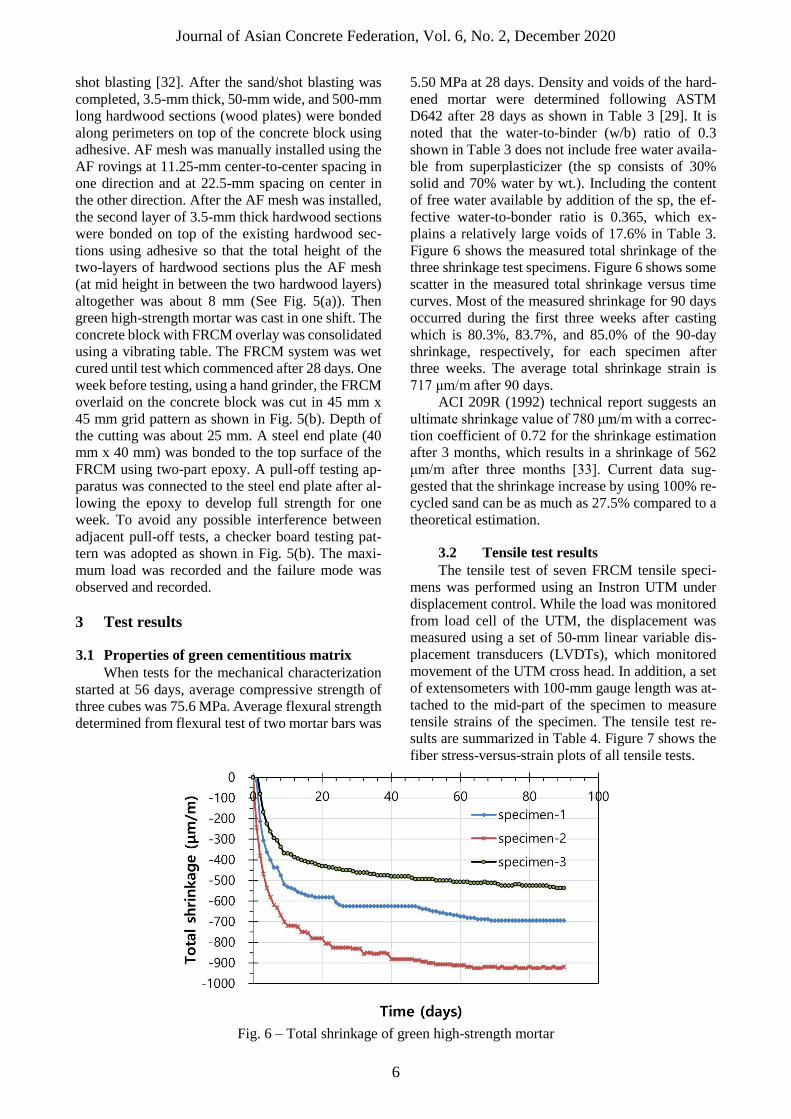
Figure 6 shows the measured total shrinkage of the
three shrinkage test specimens. Figure 6 shows some
scatter in the measured total shrinkage versus time
curves. Most of the measured shrinkage for 90 days
occurred during the first three weeks after casting
which is 80.3%, 83.7%, and 85.0% of the 90-day
shrinkage, respectively, for each specimen after
three weeks. The average total shrinkage strain is
717 μm/m after 90 days.
ACI 209R (1992) technical report suggests an
ultimate shrinkage value of 780 μm/m with a correc-
tion coefficient of 0.72 for the shrinkage estimation
after 3 months, which results in a shrinkage of 562
μm/m after three months [33]. Current data sug-
gested that the shrinkage increase by using 100% re-
cycled sand can be as much as 27.5% compared to a
theoretical estimation.
3.2 Tensile test results
The tensile test of seven FRCM tensile speci-
mens was performed using an Instron UTM under
displacement control. While the load was monitored
from load cell of the UTM, the displacement was
measured using a set of 50-mm linear variable dis-
placement transducers (LVDTs), which monitored
movement of the UTM cross head. In addition, a set
of extensometers with 100-mm gauge length was at-
tached to the mid-part of the specimen to measure
tensile strains of the specimen. The tensile test re-
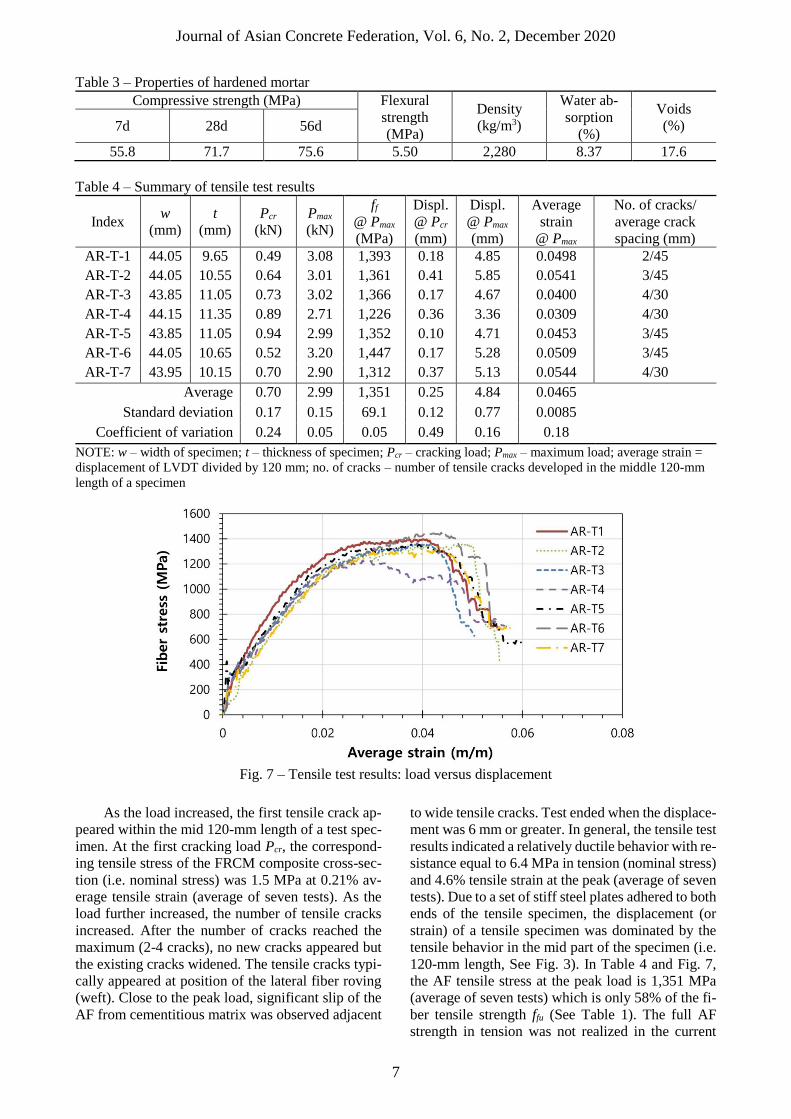
sults are summarized in Table 4. Figure 7 shows the
fiber stress-versus-strain plots of all tensile tests.
Fig. 6 – Total shrinkage of green high-strength mortar
Journal of Asian Concrete Federation, Vol. 6, No. 2, December 2020
7
Table 3 – Properties of hardened mortar
Compressive strength (MPa) Flexural
strength
(MPa)
Density
(kg/m3)
Water ab-
sorption
(%)
Voids
(%) 7d 28d 56d
55.8 71.7 75.6 5.50 2,280 8.37 17.6
Table 4 – Summary of tensile test results
Index w
(mm)
t
(mm)
Pcr
(kN)
Pmax
(kN)
ff
@ Pmax
(MPa)
Displ.
@ Pcr
(mm)
Displ.
@ Pmax
(mm)
Average
strain
@ Pmax
No. of cracks/
average crack
spacing (mm)
AR-T-1 44.05 9.65 0.49 3.08 1,393 0.18 4.85 0.0498 2/45
AR-T-2 44.05 10.55 0.64 3.01 1,361 0.41 5.85 0.0541 3/45
AR-T-3 43.85 11.05 0.73 3.02 1,366 0.17 4.67 0.0400 4/30
AR-T-4 44.15 11.35 0.89 2.71 1,226 0.36 3.36 0.0309 4/30
AR-T-5 43.85 11.05 0.94 2.99 1,352 0.10 4.71 0.0453 3/45
AR-T-6 44.05 10.65 0.52 3.20 1,447 0.17 5.28 0.0509 3/45
AR-T-7 43.95 10.15 0.70 2.90 1,312 0.37 5.13 0.0544 4/30
Average 0.70 2.99 1,351 0.25 4.84 0.0465
Standard deviation 0.17 0.15 69.1 0.12 0.77 0.0085
Coefficient of variation 0.24 0.05 0.05 0.49 0.16 0.18
NOTE: w – width of specimen; t – thickness of specimen; Pcr – cracking load; Pmax – maximum load; average strain =
displacement of LVDT divided by 120 mm; no. of cracks – number of tensile cracks developed in the middle 120-mm
length of a specimen
Fig. 7 – Tensile test results: load versus displacement
As the load increased, the first tensile crack ap-
peared within the mid 120-mm length of a test spec-
imen. At the first cracking load Pcr, the correspond-
ing tensile stress of the FRCM composite cross-sec-
tion (i.e. nominal stress) was 1.5 MPa at 0.21% av-
erage tensile strain (average of seven tests). As the
load further increased, the number of tensile cracks
increased. After the number of cracks reached the
maximum (2-4 cracks), no new cracks appeared but
the existing cracks widened. The tensile cracks typi-
cally appeared at position of the lateral fiber roving
(weft). Close to the peak load, significant slip of the
AF from cementitious matrix was observed adjacent
to wide tensile cracks. Test ended when the displace-
ment was 6 mm or greater. In general, the tensile test
results indicated a relatively ductile behavior with re-
sistance equal to 6.4 MPa in tension (nominal stress)
and 4.6% tensile strain at the peak (average of seven
tests). Due to a set of stiff steel plates adhered to both
ends of the tensile specimen, the displacement (or
strain) of a tensile specimen was dominated by the
tensile behavior in the mid part of the specimen (i.e.
120-mm length, See Fig. 3). In Table 4 and Fig. 7,
the AF tensile stress at the peak load is 1,351 MPa
(average of seven tests) which is only 58% of the fi-
ber tensile strength ffu (See Table 1). The full AF
strength in tension was not realized in the current
Journal of Asian Concrete Federation, Vol. 6, No. 2, December 2020
8
AF-FRCM system. The average strain at the peak of
4.6% (extensometer) was significantly greater than
the AF rupture strain of 3.74%, which indicated that
the AF mesh slipped from the cementitious matrix
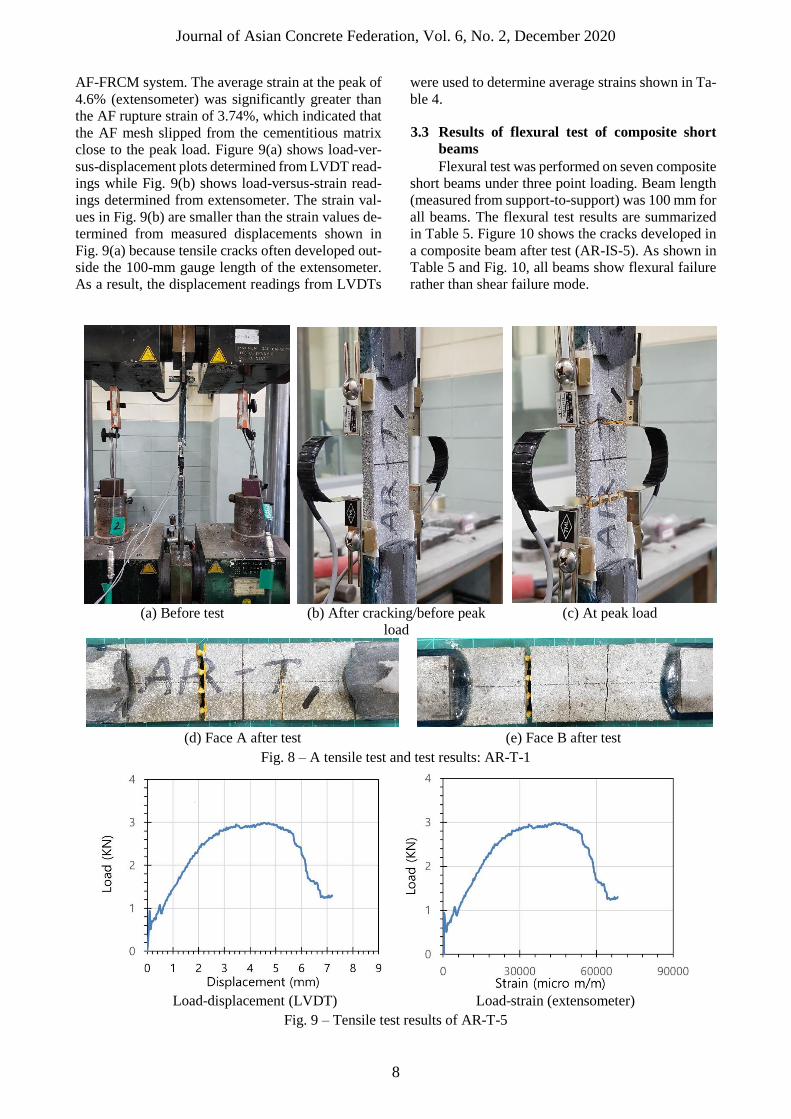
close to the peak load. Figure 9(a) shows load-ver-
sus-displacement plots determined from LVDT read-
ings while Fig. 9(b) shows load-versus-strain read-
ings determined from extensometer. The strain val-
ues in Fig. 9(b) are smaller than the strain values de-
termined from measured displacements shown in
Fig. 9(a) because tensile cracks often developed out-
side the 100-mm gauge length of the extensometer.
As a result, the displacement readings from LVDTs
were used to determine average strains shown in Ta-
ble 4.
3.3 Results of flexural test of composite short
beams
Flexural test was performed on seven composite
short beams under three point loading. Beam length
(measured from support-to-support) was 100 mm for
all beams. The flexural test results are summarized
in Table 5. Figure 10 shows the cracks developed in
a composite beam after test (AR-IS-5). As shown in
Table 5 and Fig. 10, all beams show flexural failure
rather than shear failure mode.
(a) Before test
(b) After cracking/before peak
load
(c) At peak load
(d) Face A after test (e) Face B after test
Fig. 8 – A tensile test and test results: AR-T-1
Load-displacement (LVDT) Load-strain (extensometer)
Fig. 9 – Tensile test results of AR-T-5

Journal of Asian Concrete Federation, Vol. 6, No. 2, December 2020
9
In all short beams, one or two flexural crack(s)
occurred close to the mid-span. Crack(s) gradually
progressed beyond the interface and inclined toward
the loading point. At ultimate, the concrete crushing
at the top compression fiber was observed resulting
in a flexural failure. Figure 11 shows the load-ver-
sus-mid-span deflection plots of all flexural test
specimens. As shown in Fig. 11, the load resisting
capacity of the composite beams does not signifi-
cantly drop after the peak is reached. The flexural
test was terminated when the displacement at center
was 5 mm or greater.
In Table 5 and Figure 11, the peak loads range
between 1.30 kN and 1.51 kN. The peak loads are
reached at mid-span displacement between 1.34 mm
and 4.46 mm. The short beam strength in Table 5 was
determined using Eq. (1). The average short beam
strength is 1.30 MPa and the strength ranges between
1.24 MPa and 1.38 MPa.
Fig. 10 – Cracks developed after flexural test: AR-IS-5
Fig. 11 – Load vs. displacement: flexural test of composite short beams
Table 5 – Summary of flexural test results
Index
Short beam dimensions Shear span
Ratio (a/h)
Pmax
(kN)
Displ.
at Pmax
(mm)
Short beam
strength
(MPa)
Failure mode L
(mm)
h
(mm)
w
(mm)
AR1-IS-1 115.1 18.55 43.85 2.70 1.48 2.56 1.37 flexural failure
AR1-IS-2 114.2 18.20 44.15 2.75 1.39 2.23 1.29 flexural failure
AR1-IS-3 114.0 18.65 44.05 2.68 1.51 2.60 1.38 flexural failure
AR1-IS-4 112.1 18.80 43.95 2.66 1.41 4.46 1.28 flexural failure
AR1-IS-5 113.3 18.80 44.10 2.66 1.37 1.34 1.24 flexural failure
AR1-IS-6 113.6 18.30 44.30 2.73 1.38 1.50 1.27 flexural failure
AR1-IS-7 114.2 17.55 43.95 2.85 1.30 3.13 1.26 flexural failure
Average 1.40 2.55 1.30
Standard deviation 0.07 1.05 0.05
Coefficient of variation 0.05 0.41 0.04
NOTE: L – length of beam; h – height of beam; w – width of beam; a – shear span; Pmax – maximum load; Displ. at Pmax
– beam mid-span displacement at Pmax.
Journal of Asian Concrete Federation, Vol. 6, No. 2, December 2020
10
3.4 Pull-off test results
The pull-off test was performed using a pull-off
testing apparatus as shown in Fig. 5(b). Test results
are summarized in Table 6 in terms of peak load,
pull-off strength, and failure mode. A total of twelve
tests was performed on the shot-blasted and the sand-
blasted interfaces, respectively. From the shot-
blasted interface, four failures occurred at the inter-
face between the FRCM and concrete (average pull-
off strength = 3.25 MPa) while six failures occurred
in existing concrete below the interface or substrate
(average pull-off strength = 2.99 MPa). From the
sand-blasted interface, four failures occurred at the
interface (average pull-off strength = 1.62 MPa)
while eight failures occurred in the substrate (aver-
age pull-off strength = 3.15 MPa). Overall, the pull-
off strength of the shot-blasted interface (3.09 MPa)
is greater than that of the sand-blasted interface (2.64
MPa). From all pull-off tests, the average pull-off
strength is 2.84 MPa.
4 Discussions
The volumetric ratio of the AF mesh to gross
volume was 1.3% in this study (or 0.65% in the axial
direction). The fiber amount was sufficient so that
the fiber tensile behavior governed the tensile behav-
ior of the FRCM system. At Pmax of 2.99 kN (average
of seven tests), the nominal tensile resistance (i.e.
Pmax divided by the gross section) of the FRCM com-
posite section was 6.4 MPa. A characteristic strength
(or a design value) can be defined as the average
value minus one standard deviation (ACI 549.4R).
The peak load was reached at an average strain of
4.65% with standard deviation of 0.85%, resulting in
characteristic strain at the peak of 3.8%. Overall the
tensile behavior was ductile with relatively good ca-
pacity of deformation accompanied by multiple
number of clearly visible cracks (two to four cracks
over 120-mm length with average crack spacing be-
tween 30 mm and 45 mm, See Table 4).
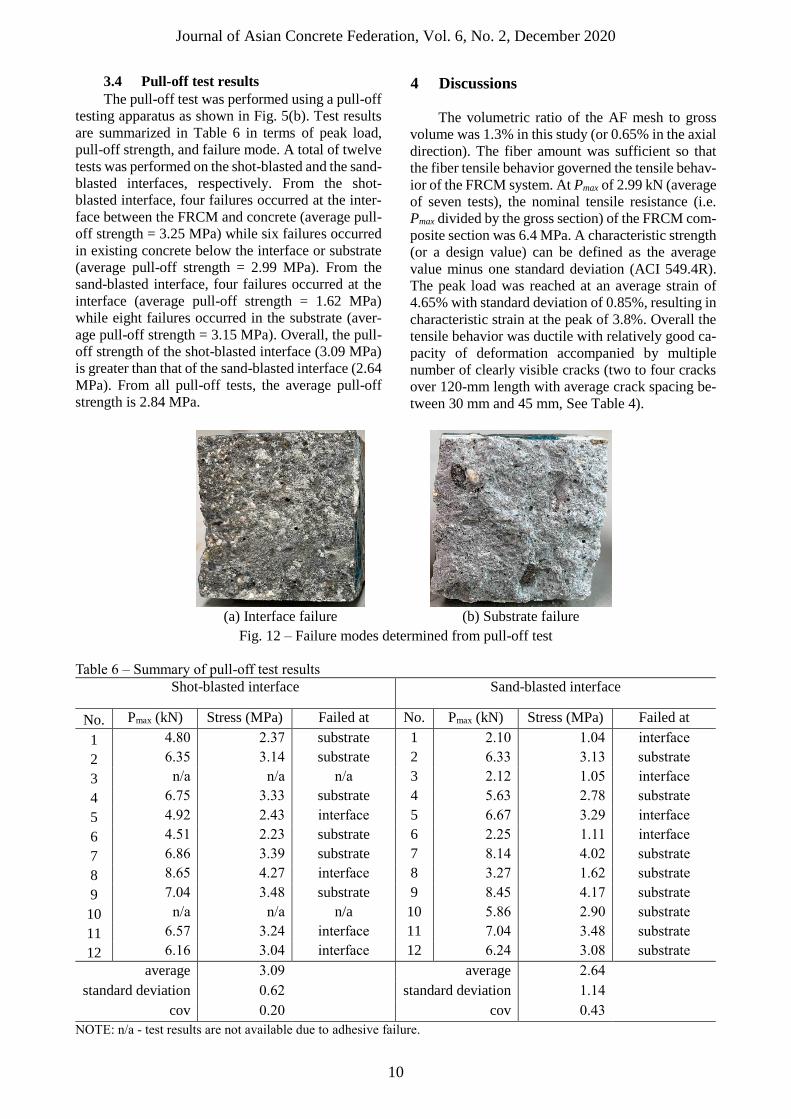
(a) Interface failure (b) Substrate failure
Fig. 12 – Failure modes determined from pull-off test
Table 6 – Summary of pull-off test results
Shot-blasted interface Sand-blasted interface
No. Pmax (kN) Stress (MPa) Failed at No. Pmax (kN) Stress (MPa) Failed at
1 4.80 2.37 substrate 1 2.10 1.04 interface
2 6.35 3.14 substrate 2 6.33 3.13 substrate
3 n/a n/a n/a 3 2.12 1.05 interface
4 6.75 3.33 substrate 4 5.63 2.78 substrate
5 4.92 2.43 interface 5 6.67 3.29 interface
6 4.51 2.23 substrate 6 2.25 1.11 interface
7 6.86 3.39 substrate 7 8.14 4.02 substrate
8 8.65 4.27 interface 8 3.27 1.62 substrate
9 7.04 3.48 substrate 9 8.45 4.17 substrate
10 n/a n/a n/a 10 5.86 2.90 substrate
11 6.57 3.24 interface 11 7.04 3.48 substrate
12 6.16 3.04 interface 12 6.24 3.08 substrate
average 3.09 average 2.64
standard deviation 0.62 standard deviation 1.14
cov 0.20 cov 0.43
NOTE: n/a - test results are not available due to adhesive failure.
Journal of Asian Concrete Federation, Vol. 6, No. 2, December 2020
11
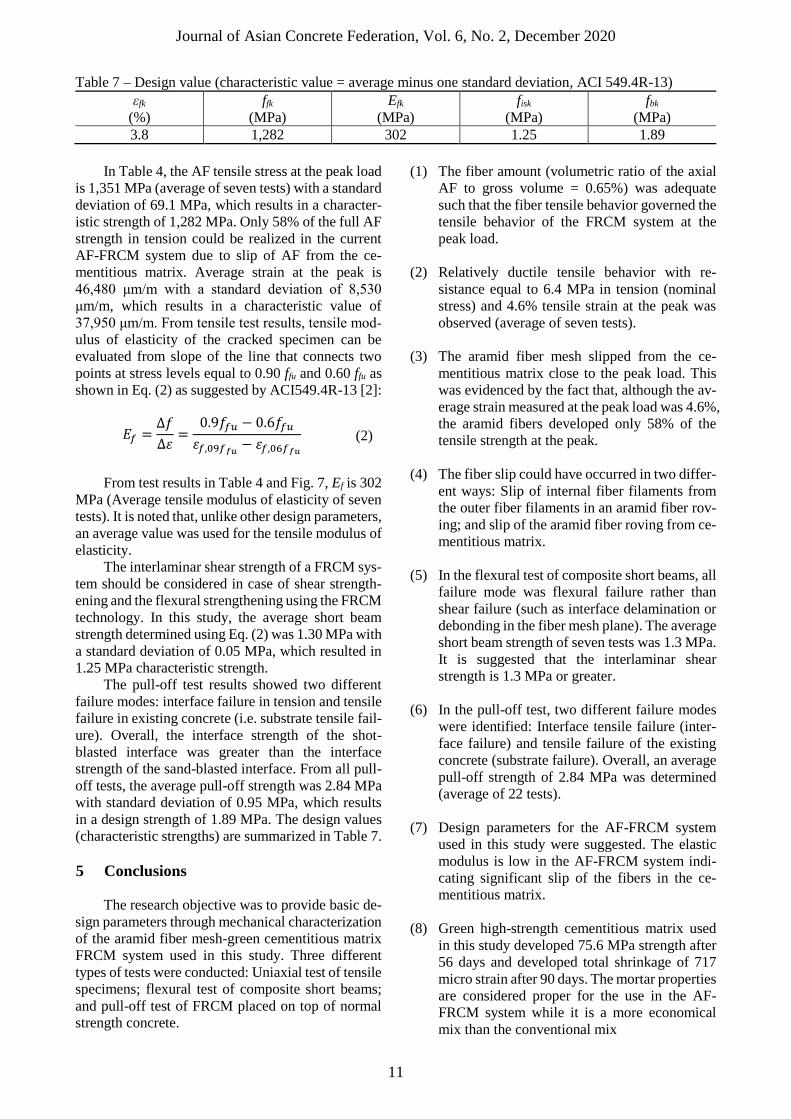
Table 7 – Design value (characteristic value = average minus one standard deviation, ACI 549.4R-13)
εfk
(%)
ffk
(MPa)
Efk
(MPa)
fisk
(MPa)
fbk
(MPa)
3.8 1,282 302 1.25 1.89
In Table 4, the AF tensile stress at the peak load
is 1,351 MPa (average of seven tests) with a standard
deviation of 69.1 MPa, which results in a character-
istic strength of 1,282 MPa. Only 58% of the full AF
strength in tension could be realized in the current
AF-FRCM system due to slip of AF from the ce-
mentitious matrix. Average strain at the peak is
46,480 μm/m with a standard deviation of 8,530
μm/m, which results in a characteristic value of
37,950 μm/m. From tensile test results, tensile mod-
ulus of elasticity of the cracked specimen can be
evaluated from slope of the line that connects two
points at stress levels equal to 0.90 ffu and 0.60 ffu as
shown in Eq. (2) as suggested by ACI549.4R-13 [2]:
𝐸𝑓 =∆𝑓
∆𝜀=
0.9𝑓𝑓𝑢 − 0.6𝑓𝑓𝑢
𝜀𝑓,09𝑓𝑓𝑢− 𝜀𝑓,06𝑓𝑓𝑢
(2)
From test results in Table 4 and Fig. 7, Ef is 302
MPa (Average tensile modulus of elasticity of seven
tests). It is noted that, unlike other design parameters,
an average value was used for the tensile modulus of
elasticity.
The interlaminar shear strength of a FRCM sys-
tem should be considered in case of shear strength-
ening and the flexural strengthening using the FRCM
technology. In this study, the average short beam
strength determined using Eq. (2) was 1.30 MPa with
a standard deviation of 0.05 MPa, which resulted in
1.25 MPa characteristic strength.
The pull-off test results showed two different
failure modes: interface failure in tension and tensile
failure in existing concrete (i.e. substrate tensile fail-
ure). Overall, the interface strength of the shot-
blasted interface was greater than the interface
strength of the sand-blasted interface. From all pull-
off tests, the average pull-off strength was 2.84 MPa
with standard deviation of 0.95 MPa, which results
in a design strength of 1.89 MPa. The design values
(characteristic strengths) are summarized in Table 7.
5 Conclusions
The research objective was to provide basic de-
sign parameters through mechanical characterization
of the aramid fiber mesh-green cementitious matrix
FRCM system used in this study. Three different
types of tests were conducted: Uniaxial test of tensile
specimens; flexural test of composite short beams;
and pull-off test of FRCM placed on top of normal
strength concrete.
(1) The fiber amount (volumetric ratio of the axial
AF to gross volume = 0.65%) was adequate
such that the fiber tensile behavior governed the
tensile behavior of the FRCM system at the
peak load.
(2) Relatively ductile tensile behavior with re-
sistance equal to 6.4 MPa in tension (nominal
stress) and 4.6% tensile strain at the peak was
observed (average of seven tests).
(3) The aramid fiber mesh slipped from the ce-
mentitious matrix close to the peak load. This
was evidenced by the fact that, although the av-
erage strain measured at the peak load was 4.6%,
the aramid fibers developed only 58% of the
tensile strength at the peak.
(4) The fiber slip could have occurred in two differ-
ent ways: Slip of internal fiber filaments from
the outer fiber filaments in an aramid fiber rov-
ing; and slip of the aramid fiber roving from ce-
mentitious matrix.
(5) In the flexural test of composite short beams, all
failure mode was flexural failure rather than
shear failure (such as interface delamination or
debonding in the fiber mesh plane). The average
short beam strength of seven tests was 1.3 MPa.
It is suggested that the interlaminar shear
strength is 1.3 MPa or greater.
(6) In the pull-off test, two different failure modes
were identified: Interface tensile failure (inter-
face failure) and tensile failure of the existing
concrete (substrate failure). Overall, an average
pull-off strength of 2.84 MPa was determined
(average of 22 tests).
(7) Design parameters for the AF-FRCM system
used in this study were suggested. The elastic
modulus is low in the AF-FRCM system indi-
cating significant slip of the fibers in the ce-
mentitious matrix.
(8) Green high-strength cementitious matrix used
in this study developed 75.6 MPa strength after
56 days and developed total shrinkage of 717
micro strain after 90 days. The mortar properties
are considered proper for the use in the AF-
FRCM system while it is a more economical
mix than the conventional mix
Journal of Asian Concrete Federation, Vol. 6, No. 2, December 2020
12
Acknowledgement
This research was supported by a grant
(20CTAP-C152175-02) from Technology Advance-
ment Research Program (TARP) funded by the Min-
istry of Land, Infrastructure, and Transport of the
Korean government
References
1. Firmo, J.P.; Correia, J.R.; and Bisby, L.A. (2015)
“Fire behavior of FRP-strengthened reinforced
concrete structural elements: A state-of-the-art
review,” Composites Part B: Engineering, vol.
80, pp. 198-216.
2. ACI 549.4R (2013) Guide to Design and Con-
struction of Externally-Bonded Fabric-Rein-
forced Cementitious Matrix (FRCM) Systems
for Repair and Strengthening Concrete and Ma-
sonry Structures, American Concrete Institute,
Farmington Hills, MI.
3. Larbi, A.S.; Agbossou, A.; and Hamelin, P.
(2013) “Experimental and numerical investiga-
tion about textile-reinforced concrete and hybrid
solutions for repairing and/or strengthening re-
inforced concrete beams,” Composite Structures,
vol. 99, pp. 152-162.
4. Peled, A.; and Mobasher B. (2007) “Tensile be-
havior of Fabric Cement-Based Composites:
Pultruded and Cast,” ASCE Journal of Materials,
vol. 19, no. 4, pp. 340-348.
5. Caggegi, C.; Lanoye, E.; Djama, K.; Bassil, A.;
and Gabor A. (2017) “Tensile behaviour of a
basalt TRM strengthening system: Influence of
mortar and reinforcing textile ratios,” Compo-
sites Part B: Engineering, vol. 130, pp. 90-102.
6. Domini J.; and Corinaldesi V. (2017) “Mechan-
ical characterization of different FRCM systems
for structural reinforcement,” Construction and
Building Materials, vol. 145, pp. 565-575.
7. Ebead, U.; and Younis, A. (2019) “Pull-off char-
acterization of FRCM/Concrete interface,”
Composites Part B: Engineering, vol. 165, pp.
545-553.
8. Elsanadedy, H.M.; Abbas, H.; Almusallam,
T.H.; and Al-Salloum, Y.A. (2019) “Organic
versus inorganic composites for bond-critical
strengthening applications of RC structures –
State-of-the-art review,” Composites Part B:
Engineering, vol. 174, pp. 106947.
9. Mazzuca, S.; Hadad, H.A.; Ombres, L.; and
Nanni, A. (2019) “Mechanical Characterization
of Steel-Reinforced Grout for Strengthening of
Existing Masonry and Concrete Structures,”
ASCE Journal of Materials, vol. 31, no. 5, pp.
0019037.
10. Zamir, M.; Sripada, R.; and Peled, A. (2019)
“Hybrid fillers in carbon-fabric-reinforced ce-
ment-based composites,” Cement and Con-
crete Composites, vol. 98, pp. 113-124.
11. Dong, J.F.; Wang, Q.Y.; and Guan, Z.W. (2012)
“Structural behavior of RC beams externally
strengthened with FRP sheets under fatigue and
monotonic loading,” Engineering Structures,
vol. 41, pp. 24-33.
12. Baggio, D.; Soudki, K.; and Noel, M. (2014)
“Strengthening of shear critical RC beams with
various FRP systems,” Construction and Build-
ing Materials, vol. 66, pp. 634-644.
13. Bournas, D.A.; Pavese, A.; and Tizani W. (2015)
“Tensile capacity of FRP anchors in connecting
FRP and TRM sheets to concrete,” Engineering
Structures, vol. 82, pp. 72-81.
14. Gonzales-Libreros, J.H.; Sabau, C.; Sneed, L.H.;
Pellegrino, C.; and Sas G. (2017) “State of re-
search on shear strengthening of RC beams with
FRCM composites,” Construction and Building
Materials, vol. 149, pp. 444-458.
15. Al-Gemeel, A.N.; and Zhuge, Y. (2019) “Using
textile reinforced engineered cementitious com-
posite for concrete columns confinement,”
Composite Structures, vol. 210, pp. 695-706.
16. Marcinczak, D.; Trapko, T.; and Musial, M.
(2019) “Shear strengthening of reinforced con-
crete beams with PBO-FRCM composites with
anchorage,” Composites Part B: Engineering,
vol. 158, pp. 149-161.
17. Hadad, H.A.; Erickson, B.; and Nanni, A. (2020)
“Flexural analysis and design of FRCM-
strengthened RC beams,” Construction and
Building Materials, vol. 244, pp. 118371.
18. Raoof, S.M.; and Bournas, D.A. (2017) “TRM
versus FRP in flexural strengthening of RC
beams: behavior at high temperatures,” Con-
struction and Building Materials, vol. 154, pp.
424-437.
19. Messori, M.; Nobili, A.; Signorini, C.; and Sola
A. (2019) “Effect of high temperature exposure
on epoxy-coated glass textile reinforced mortar
(GTRM) composites,” Construction and Build-
ing Materials, vol. 212, pp. 765-774.
20. Ebead, U.; and El-Sherif, H. (2019) “Near sur-
face embedded-FRCM for flexural strengthen-
ing of reinforced concrete beams,” Construction
and Building Materials, vol. 204, pp. 166-176.
21. Carozzi, F.G.; Poggi, C.; Bertolesi, E.; Milani,
G. (2018) “Ancient masonry arches and vaults
strengthened with TRM, SRG and FRP compo-
sites: Experimental evaluation,” Composite
Structures, vol. 187, pp. 466-480.
22. Caggegi, C.; Carrozi, F.G.; Santis, S.D.; Fab-
brocino, F.; Focacci, F.; Hojdys, L.; Lanoye, E.;
and Zuccarino, L. (2017) “Experimental analy-
sis on tensile and bond properties of PBO and
Journal of Asian Concrete Federation, Vol. 6, No. 2, December 2020
13
aramid fabric reinforced cementitious matrix for
strengthening masonry structures,” Composites
Part B: Engineering, vol. 127, pp. 175-195.
23. Ascione, L.; De Felice, G.; and De Santis, S.
(2015) “A qualification method for externally
bonded Fibre Reinforced Cementitious Matrix
(FRCM) strengthening systems,” Composite
Part B: Engineering, vol. 78: pp. 497-506.
24. ASTM D2344M (2016) Standard Test Method
for Short-Beam Strength of Polymer Matrix
Composite Materials and Their Laminates,
ASTM International, West Conshohocken, PA.
25. ISO 10406-2 (2015) Fibre-reinforced polymer
(FRP) reinforcement of concrete – test methods
– Part 2: FRP sheets, Geneva, Switzerland.
26. Choi, D.-U.; Fowler, D.W.; and Wheat, D.L.
(1996) “Thermal Stresses in Polymer Concrete
Overlays,” American Concrete Institute, Special
Publication SP-166, Properties and Uses of Pol-
ymers in Concrete, pp. 93-122.
27. Soliman, N.A.; and Tagnit-Hamou, A. (2017)
“Partial substitution of silica fume with fine
glass powder in UHPC: Filling the micro gap,”
Construction and Building Materials, vol. 139,
pp. 374-383.
28. KS L 5105 (2007) Testing method for compres-
sive strength of hydraulic mortar, Korean
Agency for Technology and Standards (KATS).
29. ASTM D642 (2013) Standard Test Method for
Density, Absorption, and Voids in Hardened
concrete, ASTM International, West Con-
shohocken, PA.
30. KS F 2527 (2018) Concrete aggregates, Korean
Agency for Technology and Standards (KATS).
31. Chinzorigt, G.; Lim, M.K.; Yu, M.; Lee, H.;
Enkbold, O.; and Choi, D. (2020) “Strength,
shrinkage and creep and durability aspects of
concrete including CO2 treated recycled fine ag-
gregate,” Cement and Concrete research, vol.
136, pp. 106062.
32. ASTM STP763, Measuring Surface Texture by
the Sand-Patch Method, ASTM International,
West Conshohocken, PA.
33. ACI 209R (1992) Prediction of Creep, Shrink-
age, and Temperature Effects in Concrete Struc-
tures, American Concrete Institute, Farmington
Hills, MI.
Journal of Asian Concrete Federation
Vol. 6, No. 2, pp. 14-23, December 2020
ISSN 2465-7964 / eISSN 2465-7972
https://doi.org/10.18702/acf.2020.12.6.2.14
14
Technical Paper
Influences of nylon fiber geometries and contents on me-
chanical behavior of reinforced mortar
Teeranai Srimahachota*, Haruka Matsuura, Shun Yamaguchi, Hiroshi Yokota
(Received Jul 29, 2020; Revised November 12, 2020; Accepted December 5, 2020; Published December 31, 2020)
Abstract: Used nylon fishing nets were utilized as recycled nylon (RN) short fibers for reinforcing ce-
ment mortar. Fishing nets were cut into specified shapes and lengths, then mixed into mortar. In this
study, the influences of fiber geometries such as diameter, aspect ratio and the fiber content on the me-
chanical properties of mortar were emphasized. Changes in flowability of fresh mortar, compressive
strength, flexural strength, failure behavior, flexural toughness, residual strength factors were experimen-
tally investigated and compared among various mixes. Experimental results indicated that fiber geome-
tries as well as fiber content directly affect the mechanical properties of mortar. Adding fibers was found
to reduce flowability and compressive strength of the mortar. For instance, using sharp-shapes reduced
compressive strength by 41% while using cross-shapes improved flexural strength by 44.5%. Improve-
ment in flexural strength and flexural toughness were found in association with the fiber content. RN
fiber contributes to the post-peak loading capacity and prevents abrupt failure of concrete structures.
Keywords: Recycled nylon fiber; used fishing nets; fiber reinforced mortar; mechanical behavior.
1 Introduction
Abandoned, lost or discarded fishing gears
(ALDFG), particularly fishing nets, in the ocean is
becoming environmental issues. It was estimated
that more than 705,000 tons of ALDFG were lost in
the ocean and more than 100,000 marine lives were
killed by ALDFG annually [1]. ALDFG accounts
more than 46% of the plastics in the Great Pacific
Garbage Patch, and the number of ALDFG is grow-
ing rapidly [2]. Recent studies found that ALDFG
damages many coral reefs by scraping their tissues
[3]. ALDFG can be navigational threats by causing
entanglement of ship’s propeller causing economic
losses [4]. Therefore, there is a demanding issue in
finding suitable recycling solutions for ALDFG to
mitigate environmental impacts.
Modern fishing nets are usually made of very
strong, durable materials such as nylon and high-
density polyethylene (HDPE), which make fishing
nets basically non-biodegradable. Fishing nets can
be utilized into many textile products, such as clothes,
carpets, sunglasses, and accessories [1, 5, 6]. How-
ever, there are still challenges in recycling used fish-
ing nets because the considerable amounts of energy
and resources are required in the recycling process,
and the huge amounts of CO2 are emitted [7].
Synthetic fibers have been widely used as rein-
forcement in cementitious materials as they improve
mechanical properties and durability of concrete [8].
Polypropylene and nylon fibers were found to im-
prove freeze-thaw resistance, splitting tensile
strength, flexural strength of the mortar as well as
prevent spalling of concrete under high temperature.
However, the decrease in workability and compres-
sive strength was reported [9-11]. Polyvinyl alcohol
(PVA) fiber helps improving compressive strength,
tensile strength, and fatigue and freeze-thaw re-
sistance of the structure [12-14]. Nylon fiber also
helped mitigating micro-cracks propagation by the
crack bridging effect [15]. In addition, nylon fiber
reinforced mortar showed outstanding mechanical
properties over the polypropylene due to the better
distribution of fiber in the cement mix [16].
Recently, recycled fibers have drawn the inter-
est of engineers due to the relatively low material
cost and for environmental preservation. Recycled
fibers, such as polyethylene terephthalate (PET) fi-
bers from plastic bottles and recycled nylon (RN) fi-
bers from waste carpets were found to improve both
Corresponding author Teeranai Srimahachota is a PhD Can-
didate in the Graduate School of Engineering, Hokkaido Uni-
versity, Japan.
Haruka Matsuura is a M.S. student in the Graduate School of
Engineering, Hokkaido University, Japan.
Shun Yamaguchi is a M.S. student in the Graduate School of
Engineering, Hokkaido University, Japan.
Hiroshi Yokota is a Professor in the Faculty of Engineering,
Hokkaido University, Japan.
Journal of Asian Concrete Federation, Vol. 6, No. 2, December 2020
15
mechanical properties and durability of cementitious
materials [17-22]. Recycled fibers showed accepta-
ble alkaline resistivity, which ensures safe applica-
tion for concrete [23-25]. In addition, recycled
HDPE fibers express comparable mechanical perfor-
mance and durability as the new polypropylene fi-
bers in reinforced cement mortar [24]. RN fiber from
used fishing nets was found safely applicable for ce-
mentitious materials without harmful effects [25].
Orasutthikul et al. reported that RN fiber from used
fishing nets improves flexural strength and flexural
toughness as well as contributes to post-peak capac-
ity of the mortar under bending loads [26]. The RN
fiber from used fishing nets showed the comparable
efficiency in reinforcing mortar as of other recycled
fibers.
This research utilized used fishing nets as RN
short fibers for reinforcing cement mortar. The aim
of this study is to investigate the influences of fiber
geometries such as diameter, length and shape as
well as fiber content on the mechanical behavior of
reinforced mortar. Flowability of fresh mortar, com-
pressive strength, flexural strength, failure behavior,
flexural toughness, and residual capacity factors
were experimentally investigated to evaluate the ef-
fectiveness of the reinforcement.
2 Experimental program 2.1 Test specimens
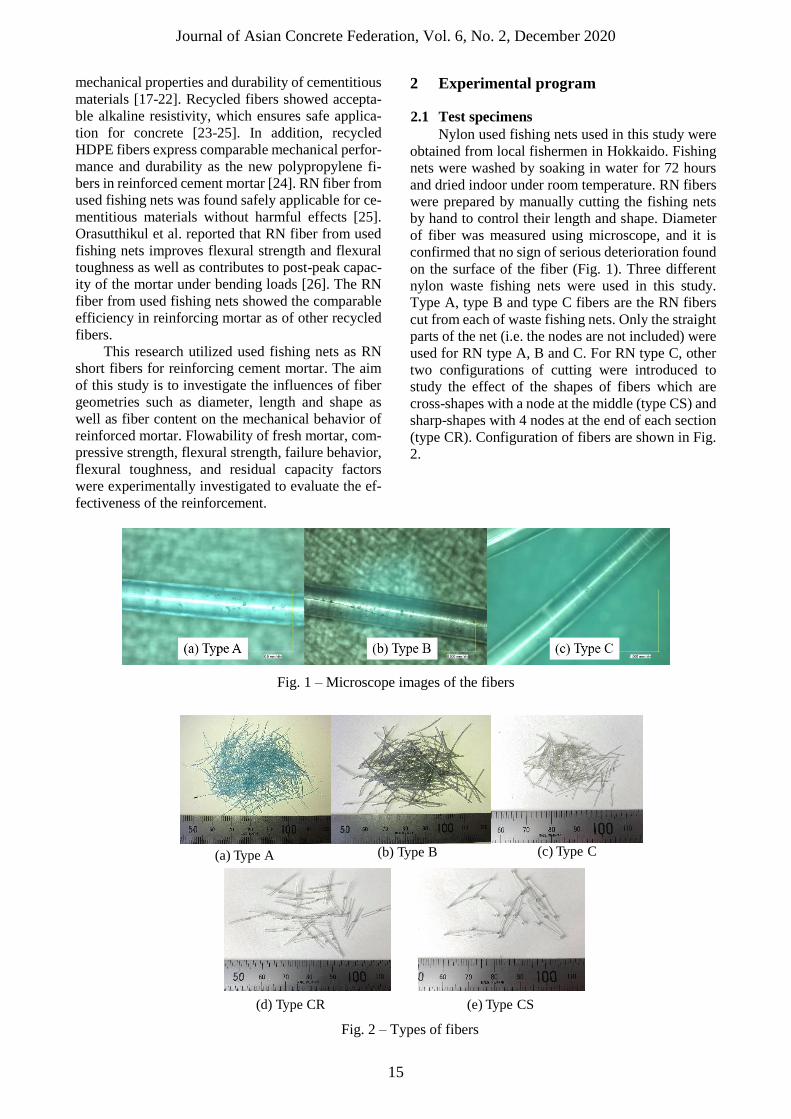
Nylon used fishing nets used in this study were
obtained from local fishermen in Hokkaido. Fishing
nets were washed by soaking in water for 72 hours
and dried indoor under room temperature. RN fibers
were prepared by manually cutting the fishing nets
by hand to control their length and shape. Diameter
of fiber was measured using microscope, and it is
confirmed that no sign of serious deterioration found
on the surface of the fiber (Fig. 1). Three different
nylon waste fishing nets were used in this study.
Type A, type B and type C fibers are the RN fibers
cut from each of waste fishing nets. Only the straight
parts of the net (i.e. the nodes are not included) were
used for RN type A, B and C. For RN type C, other
two configurations of cutting were introduced to
study the effect of the shapes of fibers which are
cross-shapes with a node at the middle (type CS) and
sharp-shapes with 4 nodes at the end of each section
(type CR). Configuration of fibers are shown in Fig.
2.
Fig. 1 – Microscope images of the fibers
Fig. 2 – Types of fibers
(a) Type A (b) Type B (c) Type C
(d) Type CR (e) Type CS
Journal of Asian Concrete Federation, Vol. 6, No. 2, December 2020
20
Table 1 – Mechanical properties of the fibers
Fiber Diameter
(mm)
Fiber configu-
ration
Tensile strength
(MPa)
Failure strain
(%)
Young’s modulus
(GPa)
Type A 0.24 Straight 344 36.5 0.94
Type B 0.52 Straight 246 19.8 1.24
Type C 0.23 Straight 143 34.2 0.42
Type CR 0.23 Cross shapes 143 34.2 0.42
Type CS 0.23 Sharp shapes 143 34.2 0.42
Table 2 – Properties of cement
Density
(g/cm3)
Specific surface area
(cm2/g)
28 days compressive
strength (MPa)
Ignition
loss %
MgO
(%)
SO3
(%) Cl- (%)
3.16 3340 61.6 2.26 1.41 2.10 0.015
Table 3 – Mix proportion of mortar (kg/m3)
Cement Sand Water Fiber
742 1087 334 11.3
Uniaxial tensile tests following ASTM C1557
[27] were conducted on each type fibers using uni-
versal testing machine (UTM) with the constant
cross-head displacement at 2 mm/min. The proper-
ties of the fibers are given in Table 1. Assuming lin-
ear relationship between stress and strain during the
test, Young’s modulus of fibers were calculated from
the ratio of tensile strength and the failure strain.
2.2 Mix design and casting procedures
Mortar prisms with the dimension of 40 mm ×
40 mm × 160 mm and the mortar cylinders measur-
ing 50 mm in diameter and 100 mm in length were
prepared for the tests. Ordinary Portland cement
(OPC) having the density of 3.16 g/cm3 and the river
sand having the fineness modulus of 2.99 were used
for the mixing. Properties of the OPC are given in
Table 2. The mix proportion of the mortar is pre-
sented in Table 3; the water-to-cement ratio was 0.45.
The density of RN fiber was set at 1.13 g/cm3 accord-
ing to the general value of nylon. The fiber content
by volume was set at 1.0% and 2.0% to avoid the
formation of fiber cluster during the mixing. Details
of the test specimens are given in Table 4. The con-
trol specimen, plain mortar without fiber added, is
named as NF (non-fiber). In addition, the mix with
RN type A and type B fibers at the fiber fraction of
1.0% each was introduced to investigate the com-
bined effect of fiber diameters. The mixes with of
types A and B are named as M-20-1.0 and M-40-1.0
for the length of 20 mm and 40 mm fiber, respec-
tively.
Preparation of mortar specimens was conducted
according to our previous study [26]. Cement and
sand were mixed together for 1 minutes at first, then
RN fibers were slowly added during the mixing. Wa-
ter was subsequently added and mixed for further 2-
3 minutes to avoid fiber cluster. Two prism speci-
mens and three cylinder specimens were casted and
cured in water for 28 days before the tests.
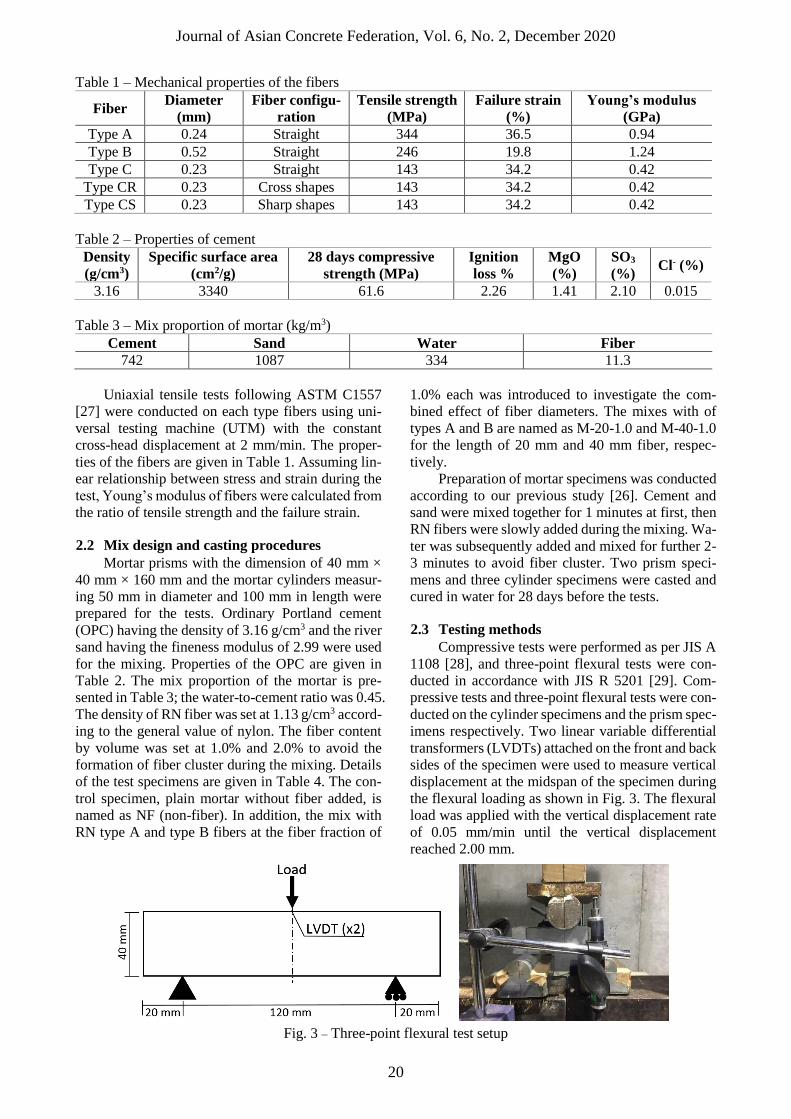
2.3 Testing methods
Compressive tests were performed as per JIS A
1108 [28], and three-point flexural tests were con-
ducted in accordance with JIS R 5201 [29]. Com-
pressive tests and three-point flexural tests were con-
ducted on the cylinder specimens and the prism spec-
imens respectively. Two linear variable differential
transformers (LVDTs) attached on the front and back
sides of the specimen were used to measure vertical
displacement at the midspan of the specimen during
the flexural loading as shown in Fig. 3. The flexural
load was applied with the vertical displacement rate
of 0.05 mm/min until the vertical displacement
reached 2.00 mm.
Fig. 3 – Three-point flexural test setup

Journal of Asian Concrete Federation, Vol. 6, No. 2, December 2020
17
Table 4 – Details of test specimens
Specimen
name
Diameter of fiber, D
(mm)
Length of fiber, L
(mm)
Aspect ratio of fi-
ber (L/D)
Fiber content by
volume (%)
NF - - - -
A-20-1.0 0.24 20 83 1.0
A-20-2.0 0.24 20 83 2.0
A-40-1.0 0.24 40 167 1.0
A-40-2.0 0.24 40 167 2.0
B-20-1.0 0.52 20 38 1.0
B-20-2.0 0.52 20 38 2.0
B-30-1.0 0.52 30 58 1.0
B-30-2.0 0.52 30 58 2.0
B-40-1.0 0.52 40 77 1.0
B-40-2.0 0.52 40 77 2.0
C-10-1.0 0.23 10 43 1.0
C-10-2.0 0.23 10 43 2.0
M-20-1.0 0.24 + 0.52 20 - 1.0 each
M-40-1.0 0.24 + 0.52 40 - 1.0 each
CR-20-1.0 0.23 20 - 1.0
CR-20-2.0 0.23 20 - 2.0
CS-20-1.0 0.23 20 - 1.0
CS-20-2.0 0.23 20 - 2.0
3 Results and discussions
3.1 Mortar flow
The flow diameter of fresh mortar was meas-
ured in accordance with JIS R 5201 [29], and the re-
sults are given in Table 5. Adding fibers resulted in
the reduction of flow diameter ranging from 2 – 22%.
The reduction was remarkable for type C, which was
11% to 19%. Using fiber with the higher aspect ratio
reduced flowability of fresh mortar in type A and
type B mixes as seen in A-40-1.0 and B-40-1.0 that
have the aspect ratio of 167 and 77, respectively.
However, for type C, regardless of the smaller aspect
ratio, fiber cluster was formed during mixing be-
cause of relatively small diameter. Increase in the fi-
ber fraction to 2.0% caused further reduction in flow
diameter by approximately 1.5 – 2.0 times as ob-
served from the cases of A-20-2.0, C-10-2.0, CS-20-
2.0 and CR-20-2.0. Using fibers with the smaller di-
ameter tended to reduce flowability. Moreover, it
was observed during the mixing that type A and type
C tend to form fiber cluster during the mixing.
Longer fibers (i.e. 40 mm) tend to further reduce the
flow diameter as observed in A-40-2.0 and M-40-1.0.
On the contrary, the length and fiber content of
type B did not show clear influences on the flowabil-
ity. For M-20-1.0 and M-40-1.0, the reduction in
flow diameter seems to have the same tendency as
type A. Fresh mortar with CS fibers showed greater
reduction in flow diameter than that with CR fibers
because the CS fiber has two knots at its ends (see
Fig. 2(e)). Fresh mortar with CR and CS expressed
similar trend to that with type C; therefore, the diam-
eter of fiber shows a greater influence on the flowa-
bility than the shape of fiber.
The fiber geometry had a great influence on the
flowability of fresh mortar. For the same type of fi-
bers, fiber with higher aspect ratio seems to reduce
the flowability of fresh mortar. Using fibers with the
smaller diameter also reduces the flowability of fresh
mortar because more fibers are presenting in the mix
at the same fiber content. In addition, thinner fibers
tend to be tangle together and form fiber cluster dur-
ing the mixing. However, this behavior depends on
the surface characteristics and the stiffness of the fi-
ber, which needs more confirmations in the future.
3.2 Compressive strength
The results from the compressive strength tests
and the three-point flexural tests are summarized in
Table 5. These results were averaged from 3 cylinder
specimens and 2 prism specimens for compressive
and flexural strengths, respectively.
Test results showed that adding fibers reduces
the compressive strength of mortar, especially for
CR and CS mixes. Increasing fiber content from 1%
to 2% causes further reduction of the compressive
strength. It was suggested by Lee et al. (2012) and
Karahan et al. (2011) that adding fibers reduces the
modulus of elasticity and increases air content in ce-
ment matrix [11, 30-31]. Moreover, the reduction in
compressive strength of CR and CS was probably
caused by the knots of fibers, which increases void
in the cement matrix. Reduction in compressive
strength was observed when applying RN fibers
Journal of Asian Concrete Federation, Vol. 6, No. 2, December 2020
18
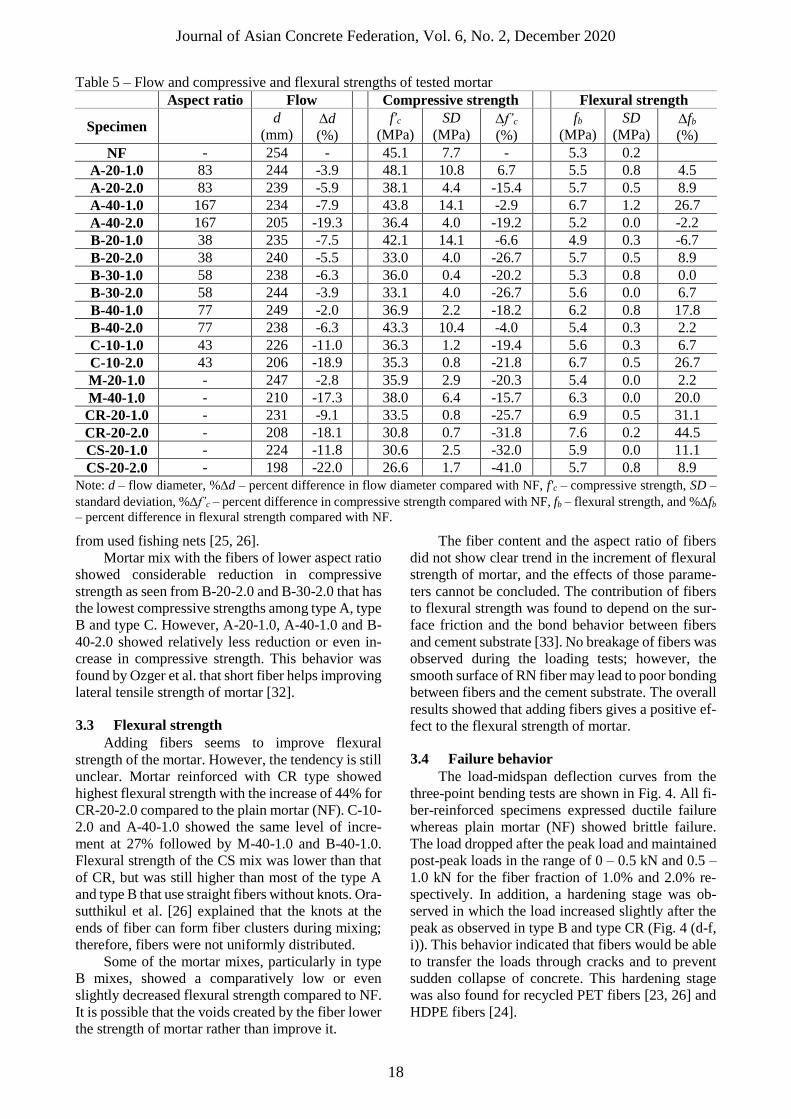
Table 5 – Flow and compressive and flexural strengths of tested mortar
Aspect ratio Flow Compressive strength Flexural strength
Specimen d
(mm) d
(%)
f'c
(MPa)
SD
(MPa) f’c
(%)
fb
(MPa)
SD
(MPa) fb
(%)
NF - 254 - 45.1 7.7 - 5.3 0.2
A-20-1.0 83 244 -3.9 48.1 10.8 6.7 5.5 0.8 4.5
A-20-2.0 83 239 -5.9 38.1 4.4 -15.4 5.7 0.5 8.9
A-40-1.0 167 234 -7.9 43.8 14.1 -2.9 6.7 1.2 26.7
A-40-2.0 167 205 -19.3 36.4 4.0 -19.2 5.2 0.0 -2.2
B-20-1.0 38 235 -7.5 42.1 14.1 -6.6 4.9 0.3 -6.7
B-20-2.0 38 240 -5.5 33.0 4.0 -26.7 5.7 0.5 8.9
B-30-1.0 58 238 -6.3 36.0 0.4 -20.2 5.3 0.8 0.0
B-30-2.0 58 244 -3.9 33.1 4.0 -26.7 5.6 0.0 6.7
B-40-1.0 77 249 -2.0 36.9 2.2 -18.2 6.2 0.8 17.8
B-40-2.0 77 238 -6.3 43.3 10.4 -4.0 5.4 0.3 2.2
C-10-1.0 43 226 -11.0 36.3 1.2 -19.4 5.6 0.3 6.7
C-10-2.0 43 206 -18.9 35.3 0.8 -21.8 6.7 0.5 26.7
M-20-1.0 - 247 -2.8 35.9 2.9 -20.3 5.4 0.0 2.2
M-40-1.0 - 210 -17.3 38.0 6.4 -15.7 6.3 0.0 20.0
CR-20-1.0 - 231 -9.1 33.5 0.8 -25.7 6.9 0.5 31.1
CR-20-2.0 - 208 -18.1 30.8 0.7 -31.8 7.6 0.2 44.5
CS-20-1.0 - 224 -11.8 30.6 2.5 -32.0 5.9 0.0 11.1
CS-20-2.0 - 198 -22.0 26.6 1.7 -41.0 5.7 0.8 8.9
Note: d – flow diameter, %d – percent difference in flow diameter compared with NF, f'c – compressive strength, SD –
standard deviation, %f’c – percent difference in compressive strength compared with NF, fb – flexural strength, and %fb
– percent difference in flexural strength compared with NF.
from used fishing nets [25, 26].
Mortar mix with the fibers of lower aspect ratio
showed considerable reduction in compressive
strength as seen from B-20-2.0 and B-30-2.0 that has
the lowest compressive strengths among type A, type
B and type C. However, A-20-1.0, A-40-1.0 and B-
40-2.0 showed relatively less reduction or even in-
crease in compressive strength. This behavior was
found by Ozger et al. that short fiber helps improving
lateral tensile strength of mortar [32].
3.3 Flexural strength
Adding fibers seems to improve flexural
strength of the mortar. However, the tendency is still
unclear. Mortar reinforced with CR type showed
highest flexural strength with the increase of 44% for
CR-20-2.0 compared to the plain mortar (NF). C-10-
2.0 and A-40-1.0 showed the same level of incre-
ment at 27% followed by M-40-1.0 and B-40-1.0.
Flexural strength of the CS mix was lower than that
of CR, but was still higher than most of the type A
and type B that use straight fibers without knots. Ora-
sutthikul et al. [26] explained that the knots at the
ends of fiber can form fiber clusters during mixing;
therefore, fibers were not uniformly distributed.
Some of the mortar mixes, particularly in type
B mixes, showed a comparatively low or even
slightly decreased flexural strength compared to NF.
It is possible that the voids created by the fiber lower
the strength of mortar rather than improve it.
The fiber content and the aspect ratio of fibers
did not show clear trend in the increment of flexural
strength of mortar, and the effects of those parame-
ters cannot be concluded. The contribution of fibers
to flexural strength was found to depend on the sur-
face friction and the bond behavior between fibers
and cement substrate [33]. No breakage of fibers was
observed during the loading tests; however, the
smooth surface of RN fiber may lead to poor bonding
between fibers and the cement substrate. The overall
results showed that adding fibers gives a positive ef-
fect to the flexural strength of mortar.
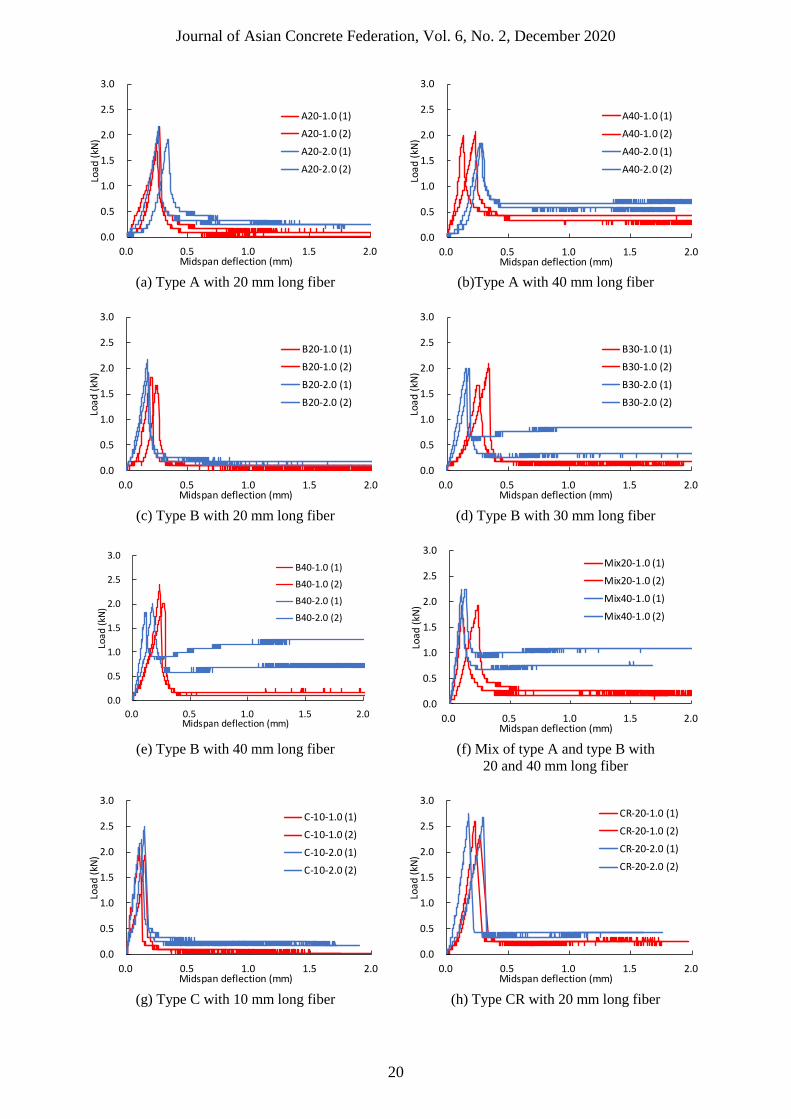
3.4 Failure behavior
The load-midspan deflection curves from the
three-point bending tests are shown in Fig. 4. All fi-
ber-reinforced specimens expressed ductile failure
whereas plain mortar (NF) showed brittle failure.
The load dropped after the peak load and maintained
post-peak loads in the range of 0 – 0.5 kN and 0.5 –
1.0 kN for the fiber fraction of 1.0% and 2.0% re-
spectively. In addition, a hardening stage was ob-
served in which the load increased slightly after the
peak as observed in type B and type CR (Fig. 4 (d-f,
i)). This behavior indicated that fibers would be able
to transfer the loads through cracks and to prevent
sudden collapse of concrete. This hardening stage
was also found for recycled PET fibers [23, 26] and
HDPE fibers [24].
Journal of Asian Concrete Federation, Vol. 6, No. 2, December 2020
20
(a) Type A with 20 mm long fiber
(b)Type A with 40 mm long fiber
(c) Type B with 20 mm long fiber
(d) Type B with 30 mm long fiber
(e) Type B with 40 mm long fiber
(f) Mix of type A and type B with
20 and 40 mm long fiber
(g) Type C with 10 mm long fiber (h) Type CR with 20 mm long fiber
0.0
0.5
1.0
1.5
2.0
2.5
3.0
0.0 0.5 1.0 1.5 2.0
Load
(kN
)
Midspan deflection (mm)
A20-1.0 (1)
A20-1.0 (2)
A20-2.0 (1)
A20-2.0 (2)
0.0
0.5
1.0
1.5
2.0
2.5
3.0
0.0 0.5 1.0 1.5 2.0
Load
(kN
)
Midspan deflection (mm)
A40-1.0 (1)
A40-1.0 (2)
A40-2.0 (1)
A40-2.0 (2)
0.0
0.5
1.0
1.5
2.0
2.5
3.0
0.0 0.5 1.0 1.5 2.0
Load
(kN
)
Midspan deflection (mm)
B20-1.0 (1)
B20-1.0 (2)
B20-2.0 (1)
B20-2.0 (2)
0.0
0.5
1.0
1.5
2.0
2.5
3.0
0.0 0.5 1.0 1.5 2.0
Load
(kN
)
Midspan deflection (mm)
B30-1.0 (1)
B30-1.0 (2)
B30-2.0 (1)
B30-2.0 (2)
0.0
0.5
1.0
1.5
2.0
2.5
3.0
0.0 0.5 1.0 1.5 2.0
Load
(kN
)
Midspan deflection (mm)
B40-1.0 (1)
B40-1.0 (2)
B40-2.0 (1)
B40-2.0 (2)
0.0
0.5
1.0
1.5
2.0
2.5
3.0
0.0 0.5 1.0 1.5 2.0
Load
(kN
)
Midspan deflection (mm)
Mix20-1.0 (1)
Mix20-1.0 (2)
Mix40-1.0 (1)
Mix40-1.0 (2)
0.0
0.5
1.0
1.5
2.0
2.5
3.0
0.0 0.5 1.0 1.5 2.0
Load
(kN
)
Midspan deflection (mm)
C-10-1.0 (1)
C-10-1.0 (2)
C-10-2.0 (1)
C-10-2.0 (2)
0.0
0.5
1.0
1.5
2.0
2.5
3.0
0.0 0.5 1.0 1.5 2.0
Load
(kN
)
Midspan deflection (mm)
CR-20-1.0 (1)
CR-20-1.0 (2)
CR-20-2.0 (1)
CR-20-2.0 (2)
Journal of Asian Concrete Federation, Vol. 6, No. 2, December 2020
20
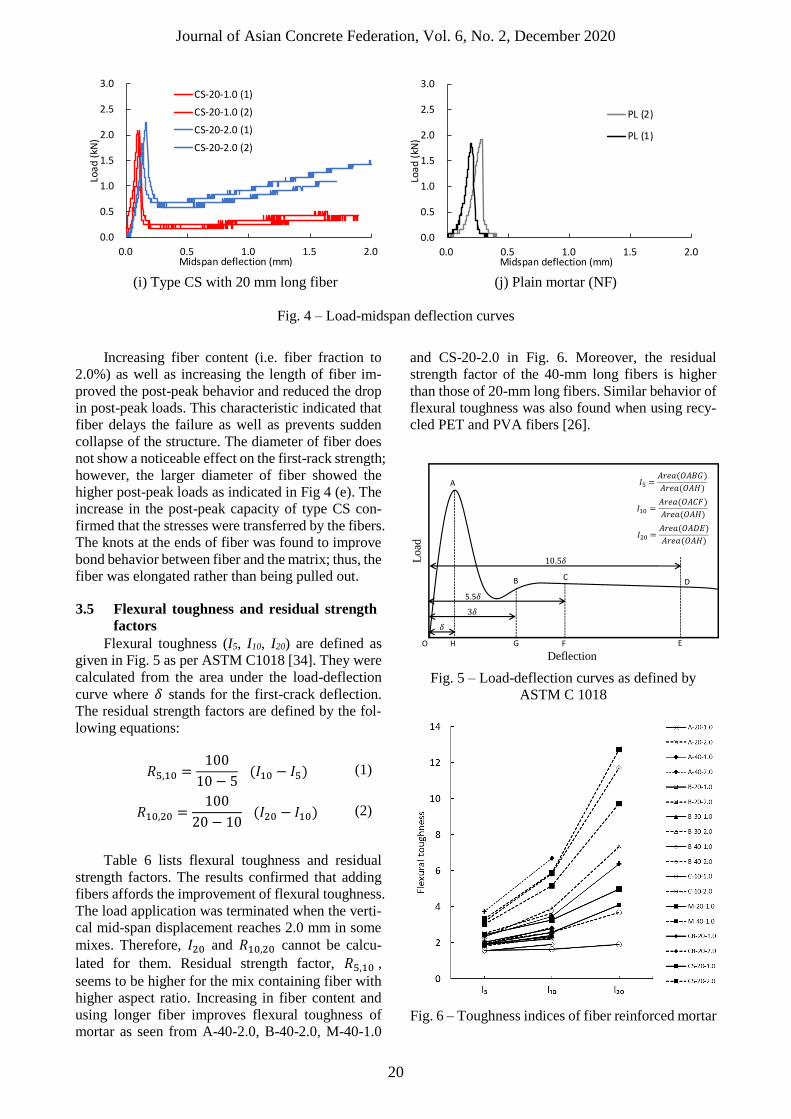
(i) Type CS with 20 mm long fiber
(j) Plain mortar (NF)
Fig. 4 – Load-midspan deflection curves
Increasing fiber content (i.e. fiber fraction to
2.0%) as well as increasing the length of fiber im-
proved the post-peak behavior and reduced the drop
in post-peak loads. This characteristic indicated that
fiber delays the failure as well as prevents sudden
collapse of the structure. The diameter of fiber does
not show a noticeable effect on the first-rack strength;
however, the larger diameter of fiber showed the
higher post-peak loads as indicated in Fig 4 (e). The
increase in the post-peak capacity of type CS con-
firmed that the stresses were transferred by the fibers.
The knots at the ends of fiber was found to improve
bond behavior between fiber and the matrix; thus, the
fiber was elongated rather than being pulled out.
3.5 Flexural toughness and residual strength
factors
Flexural toughness (I5, I10, I20) are defined as
given in Fig. 5 as per ASTM C1018 [34]. They were
calculated from the area under the load-deflection
curve where 𝛿 stands for the first-crack deflection.
The residual strength factors are defined by the fol-
lowing equations:
𝑅5,10 =100
10 − 5 (𝐼10 − 𝐼5) (1)
𝑅10,20 =100
20 − 10 (𝐼20 − 𝐼10) (2)
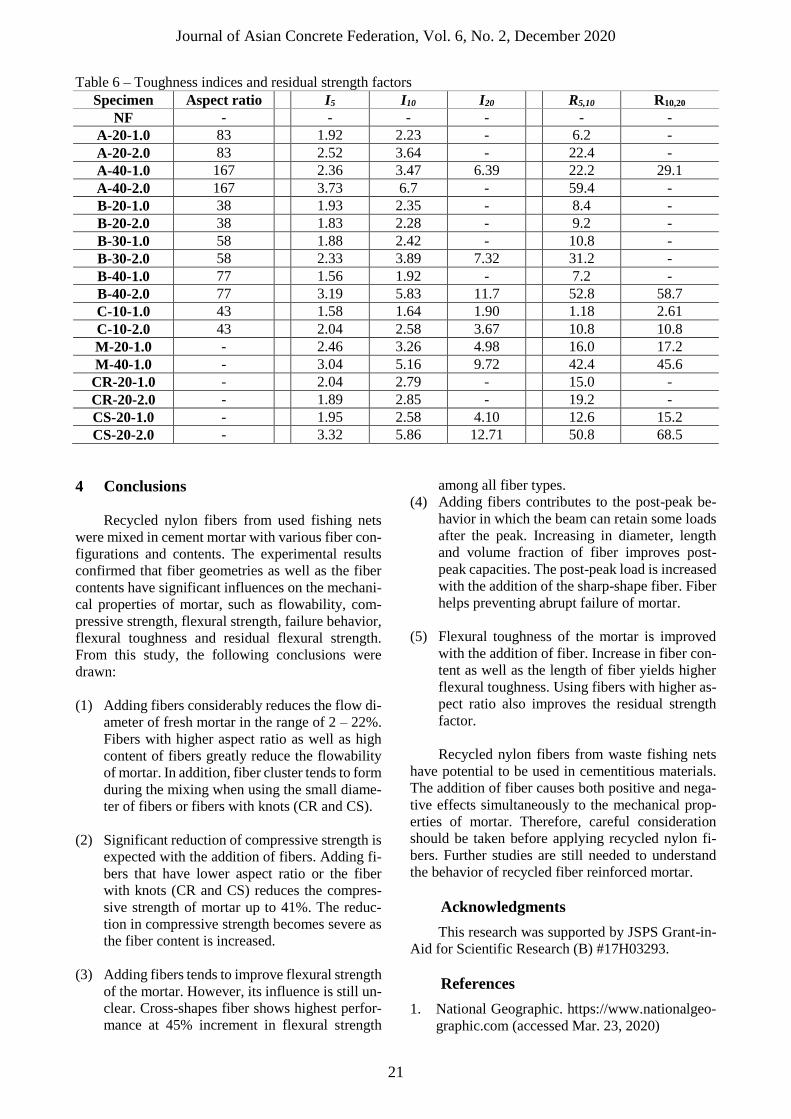
Table 6 lists flexural toughness and residual
strength factors. The results confirmed that adding
fibers affords the improvement of flexural toughness.
The load application was terminated when the verti-
cal mid-span displacement reaches 2.0 mm in some
mixes. Therefore, 𝐼20 and 𝑅10,20 cannot be calcu-
lated for them. Residual strength factor, 𝑅5,10 ,
seems to be higher for the mix containing fiber with
higher aspect ratio. Increasing in fiber content and
using longer fiber improves flexural toughness of
mortar as seen from A-40-2.0, B-40-2.0, M-40-1.0
and CS-20-2.0 in Fig. 6. Moreover, the residual
strength factor of the 40-mm long fibers is higher
than those of 20-mm long fibers. Similar behavior of
flexural toughness was also found when using recy-
cled PET and PVA fibers [26].
Fig. 5 – Load-deflection curves as defined by
ASTM C 1018
Fig. 6 – Toughness indices of fiber reinforced mortar
0.0
0.5
1.0
1.5
2.0
2.5
3.0
0.0 0.5 1.0 1.5 2.0
Load
(kN
)
Midspan deflection (mm)
CS-20-1.0 (1)
CS-20-1.0 (2)
CS-20-2.0 (1)
CS-20-2.0 (2)
0.0
0.5
1.0
1.5
2.0
2.5
3.0
0.0 0.5 1.0 1.5 2.0
Load
(kN
)
Midspan deflection (mm)
PL (2)
PL (1)
𝛿
5.5𝛿
𝛿
10 5𝛿
A
B CD
EFGHO
Deflection
Load
𝐼5 = ( )
( )
𝐼10 = ( )
( )
𝐼20 = ( )
( )
Journal of Asian Concrete Federation, Vol. 6, No. 2, December 2020
21
Table 6 – Toughness indices and residual strength factors
Specimen Aspect ratio I5 I10 I20 R5,10 R10,20
NF - - - - - -
A-20-1.0 83 1.92 2.23 - 6.2 -
A-20-2.0 83 2.52 3.64 - 22.4 -
A-40-1.0 167 2.36 3.47 6.39 22.2 29.1
A-40-2.0 167 3.73 6.7 - 59.4 -
B-20-1.0 38 1.93 2.35 - 8.4 -
B-20-2.0 38 1.83 2.28 - 9.2 -
B-30-1.0 58 1.88 2.42 - 10.8 -
B-30-2.0 58 2.33 3.89 7.32 31.2 -
B-40-1.0 77 1.56 1.92 - 7.2 -
B-40-2.0 77 3.19 5.83 11.7 52.8 58.7
C-10-1.0 43 1.58 1.64 1.90 1.18 2.61
C-10-2.0 43 2.04 2.58 3.67 10.8 10.8
M-20-1.0 - 2.46 3.26 4.98 16.0 17.2
M-40-1.0 - 3.04 5.16 9.72 42.4 45.6
CR-20-1.0 - 2.04 2.79 - 15.0 -
CR-20-2.0 - 1.89 2.85 - 19.2 -
CS-20-1.0 - 1.95 2.58 4.10 12.6 15.2
CS-20-2.0 - 3.32 5.86 12.71 50.8 68.5
4 Conclusions
Recycled nylon fibers from used fishing nets
were mixed in cement mortar with various fiber con-
figurations and contents. The experimental results
confirmed that fiber geometries as well as the fiber
contents have significant influences on the mechani-
cal properties of mortar, such as flowability, com-
pressive strength, flexural strength, failure behavior,
flexural toughness and residual flexural strength.
From this study, the following conclusions were
drawn:
(1) Adding fibers considerably reduces the flow di-
ameter of fresh mortar in the range of 2 – 22%.
Fibers with higher aspect ratio as well as high
content of fibers greatly reduce the flowability
of mortar. In addition, fiber cluster tends to form
during the mixing when using the small diame-
ter of fibers or fibers with knots (CR and CS).
(2) Significant reduction of compressive strength is
expected with the addition of fibers. Adding fi-
bers that have lower aspect ratio or the fiber
with knots (CR and CS) reduces the compres-
sive strength of mortar up to 41%. The reduc-
tion in compressive strength becomes severe as
the fiber content is increased.
(3) Adding fibers tends to improve flexural strength
of the mortar. However, its influence is still un-
clear. Cross-shapes fiber shows highest perfor-
mance at 45% increment in flexural strength
among all fiber types.
(4) Adding fibers contributes to the post-peak be-
havior in which the beam can retain some loads
after the peak. Increasing in diameter, length
and volume fraction of fiber improves post-
peak capacities. The post-peak load is increased
with the addition of the sharp-shape fiber. Fiber
helps preventing abrupt failure of mortar.
(5) Flexural toughness of the mortar is improved
with the addition of fiber. Increase in fiber con-
tent as well as the length of fiber yields higher
flexural toughness. Using fibers with higher as-
pect ratio also improves the residual strength
factor.
Recycled nylon fibers from waste fishing nets
have potential to be used in cementitious materials.
The addition of fiber causes both positive and nega-
tive effects simultaneously to the mechanical prop-
erties of mortar. Therefore, careful consideration
should be taken before applying recycled nylon fi-
bers. Further studies are still needed to understand
the behavior of recycled fiber reinforced mortar.
Acknowledgments
This research was supported by JSPS Grant-in-
Aid for Scientific Research (B) #17H03293.
References
1. National Geographic. https://www.nationalgeo-
graphic.com (accessed Mar. 23, 2020)
Journal of Asian Concrete Federation, Vol. 6, No. 2, December 2020
22
2. Lebreton, L.; Slat, B,; Ferrari, F.; Sainte, B. R.;
Aitken, J.; Marthouse, R.; Hajbane, S.; Cunsolo,
S.; Schwarz, A.; Levivier, A.; Noble, K.;
Debeljak, P.; Maral, H.; Schoeneich, R. A.;
Brambini, R.; and Reisser, J. (2018) “Evidence
that the Great Pacific Garbage Patch is rapidly
accumulating plastic,” Scientific Reports, vol. 8,
pp. 1-15.
3. Valderrama, L. B.; Matthews, L.; and Hoeksema,
W. (2018) “Pollution and coral damage caused
by derelict fishing gear on coral reefs around
Koh Tao, Gulf of Thailand,” Marine Pollution
Bulletin, vol. 135, pp. 1107-1116.
4. Hong, S.; Lee, J.; and Lim, S. (2017) “Naviga-
tional threats by derelict fishing gear to navy
ships in the Korean seas,” Marine Pollution Bul-
letin, vol. 119, pp. 100-105.
5. Wang, Y. (2010) “Fiber and textile waste utili-
zation,” Waste and Biomass Valorization, vol. 1,
pp. 135-143.
6. Charter, M.; Carruthers, R.; and Femmer, J. S.
(2018) “Products from waste fishing nets acces-
sories, clothing, footwear, home ware, recrea-
tion,” Circular Ocean, vol. 04, pp. 1-31.
7. National Geographic. https://www.nationalgeo-
graphic.com (accessed Mar. 23, 2020)
8. Zheng, Z.; and Feldman, D. (1995) “Synthetic
fibre-reinforced Concrete,” Progress in Polymer
Science, vol. 20, pp. 185-210.
9. Zhang, P.; and Li, Q. F. (2013) “Effect of poly-
propylene fiber on durability of concrete com-
posite containing fly ash and silica fume,” Com-
posites Part B: Engineering, vol. 45, pp. 1587-
1594.
10. Ramezanianpour, A. A.; Esmaeili, M.; Ghahari,
S. A.; and Najafi, M. H. (2013) “Laboratory
study on the effect of polypropylene fiber on du-
rability, and physical and mechanical character-
istic of concrete for application in sleepers,”
Construction and Building Materials, vol. 44, pp.
411-418.
11. Lee, G.; Han, D.; Han, M. C.; Han, C. G.; and
Son, H. J. (2012) “Combining polypropylene
and nylon fibers to optimize fiber addition for
spalling protection of high-strength concrete,”
Construction and Building Materials, vol. 34, pp.
313-320.
12. Khan, S. U.; Nuruddin, M. F.; and Shafiq, N.
(2014) “Strength development of concrete in-
corporating metakaolin and PVA fibres,” Ap-
plied Mechanics and Materials, vol. 567, pp.
505-510.
13. Jang, J. G.; Kim, H. K.; Kim, T. S.; Min, B. J.,
and Lee, H. K. (2014) “Improved flexural fa-
tigue resistance of PVA fiber-reinforced con-
crete subjected to freezing and thawing cycles,”
Construction and Building Materials, vol. 59, pp.
129-135.
14. Ozkan, S.; and Demir, F. (2020) “The hybrid ef-
fects of PVA fiber and basalt fiber on mechani-
cal performance of cost effective hybrid ce-
mentitious composites,” Construction and
Building Materials, vol. 263, 120564.
15. Lee, S. (2019) “Effect of nylon fiber addition on
the performance of recycled aggregate concrete,”
Applied Sciences, vol. 9, pp. 767.
16. Song, P. S.; Hwang, S.; and Sheu, B. C. (2005)
“Strength properties of nylon- and polypropyl-
ene-fiber-reinforced concretes,” Cement and
Concrete Research, vol. 35, pp. 1546-1550.
17. Siddique, R.; Khatib, J.; and Kaur, I. (2008)
“Use of recycled plastic in concrete: A review,”
Waste Management, vol. 28, pp. 1835-1852.
18. Ozger, O. B.; Girardi, F.; Giannuzzi, G. M.; Sa-
lomoni, V. A.; Majorana, C. E.; Fambri, L.; Bal-
dassino, N.; and Di Maggio, R. (2013) “Effect
of nylon fibres on mechanical and thermal prop-
erties of hardened concrete for energy storage
systems,” Materials and Design, vol. 51, pp.
989-997.
19. Qin, Y.; Zhang, X.; and Chai, J. (2019) “Dam-
age performance and compressive behavior of
early-age green concrete with recycled nylon fi-
ber fabric under an axial load,” Construction and
Building Materials, vol. 209, pp. 105-114.
20. Silva, D. A.; Betioli, A. M.; Gleize, P. J. P.; Ro-
man, H. R.; Gómez, L. A.; and Ribeiro, J. L.D.
(2005) “Degradation of recycled PET fibers in
Portland cement-based materials,” Cement and
Concrete Research, vol. 35, pp. 1741-1746.
21. Foti, D. (2013) “Use of recycled waste pet bot-
tles fibers for the reinforcement of concrete,”
Composite Structures, vol. 96, pp. 396-404.
22. Pereira De Oliveira, L. A.; and Castro-Gomes, J.
P. (2011) “Physical and mechanical behaviour
of recycled PET fibre reinforced mortar,” Con-
struction and Building Materials, vol. 25, pp.
1712-1717
23. Fraternali, F.; Farina, I.; Polzone, C.; Pagliuca,
E.; and Feo, L. (2013) “On the use of R-PET
strips for the reinforcement of cement mortars,”
Composites Part B: Engineering, vol. 46, pp.
207-210.
24. Pešić, N.; Živanović, S.; Garcia, R.; and Papas-
tergiou, P. (2016) “Mechanical properties of
concrete reinforced with recycled HDPE plastic
fibres,” Construction and Building Materials,
vol. 114, pp. 362-370.
25. Spadea, S.; Farina, I.; Carrafiello, A.; and Fra-
ternali, F. (2015) “Recycled nylon fibers as ce-
ment mortar reinforcement,” Construction and
Building Materials, vol. 80, pp. 200-209.
Journal of Asian Concrete Federation, Vol. 6, No. 2, December 2020
23
26. Orasutthikul, S.; Unno, D.; and Yokota, H.
(2017) “Effectiveness of recycled nylon fiber
from waste fishing net with respect to fiber rein-
forced mortar,” Construction and Building Ma-
terials, vol. 146, pp. 594-602.
27. ASTM C1557 (2003). “Standard test method for
tensile strength and Young’s modulus of fibers,”
ASTM International, PA.
28. JIS A 1108 (2018). “Method of test for compres-
sive strength of concrete,” Japan Standards As-
sociation, Tokyo. (In Japanese)
29. JIS R 5201 (2015). “Physical testing methods
for cement,” Japan Standards Association, To-
kyo. (In Japanese)
30. Karahan, O.; and Atiş, C. D. (2011) “The dura-
bility properties of polypropylene fiber rein-
forced fly ash concrete,” Materials and Design,
vol. 32, pp. 1044-1049.
31. Palmquist, S. M.; Kintzel, E.; and Andrew, K.
(2011) “Scanning electron microscopy to exam-
ine concrete with carbon nanofibers,” 5th Pan
American Conference for NDT, Cancun, Mex-
ico.
32. Ozger, O.; Girardi, F.; Giannuzzi, G.; Salomoni,
V.; Majorana, C.; Fambri, L.; Baldassino, N.;
and Di Maggio, R. (2013) “Effect of nylon fibres
on mechanical and thermal properties of hard-
ened concrete for energy storage systems,” Con-
struction and Building Materials, vol. 51, pp.
989-997.
33. Redon, C.; Li, V. C.; Wu, C.; Hoshiro H.; Saito
T.; and Ogawa, A. (2001) “Measuring and mod-
ifying interface properties of PVA fibers in ECC
matrix,” Journal of Materials in Civil Engineer-
ing, vol. 13, pp. 399-406.
34. ASTM C 1018. “Standard test method for flex-
ural toughness and first-crack strength of fiber
reinforced concrete,” ASTM International, PA.
Journal of Asian Concrete Federation
Vol. 6, No. 2, pp. 24-36, December 2020
ISSN 2465-7964 / eISSN 2465-7972
https://doi.org/10.18702/acf.2020.12.6.2.24
24
Technical Paper
Comparison of creep models and experimental verification of
creep coefficients for normal and high strength concrete
P. N. Ojha*, Brijesh Singh, Abhishek Singh, Vikas Patel
(Received May 4, 2020; Revised December 10, 2020; Accepted December 13, 2020; Published December 31, 2020)
Abstract: A concrete structure when subjected to sustained load presents progressive strain over time,
which is associated with the creep phenomenon. The creep characteristic of high strength concrete as-
sumes importance in the back drop of increase in prestressed concrete constructions. The paper covers
the comparison of creep coefficients with different creep models like Bazant’s B-3, ACI, AASHTO, GL-
2000 and FIB model code 2010 for concrete mixes having water to cementitious ratio of 0.47, 0.36, 0.27
and 0.20. The comparison of different models are done for a relative humidity of 60 percent and design
life of 100 years. For comparison of creep coefficient using different models the age at loading are kept
as 7, 28 and 365 days. Thereafter, values are compared with experimentally obtained results of concrete
mixes having water to cementitious ratio of 0.47 and 0.20 for age at loading of 28 days and up to 180
days loading period. Time induced creep strain of high strength concrete is determined using creep rig of
capacity 2000 kN. Creep strains are measured at regular time intervals on concrete designed with water
to cementitious ratio of 0.47 and 0.20 wherein fly ash and silica fume were also used.
Keywords: Creep coefficient; normal strength concrete; high strength concrete; creep model.
1 Introduction
Creep performance is an important index in the
long-term properties of concrete, and the linear com-
pressive creep deformation can reach 1-4 times of the
short-term elasticity compressive deformation.
Therefore, the creep behaviour must be considered
in the design of concrete structures in order to pro-
vide necessary safety and serviceability. For the im-
portant engineering structures, creep experiment of
the specimen, which is made from the same concrete
used in the structures, is the most reliable method.
However, due to the complexity and diversity, there
are not always sufficient condition to carry out creep
experiment, so the empirical formula fitted from the
obtained experimental data is essential [1]. There are
many creep models available internationally, such as
CEB-FIP series models, ACI 209 series models, GL-
2000 model, AASHTO, B3 model, China Academy
of Building Research model, Zhu Bofang model and
Li Chengmu model et al. [2-7]. However, there are
many differences in the influence factors, formula
forms, applicable scope and prediction accuracy of
these models due to limitation of specific experi-
mental condition and the emphasis of different re-
searchers. The correction factor of mixture ratio of
concrete was given in CEB-FIP series models. The
correction factor of collapsibility, sand ratio and air
content were considered in ACI 209 series models.
The correction factor of water cement ratio, cement
content, sand ratio and concrete density was consid-
ered in B3 model. Recent research relates the creep
response to the packing density distributions of cal-
cium silicate-hydrates. At high stress levels, addi-
tional deformation occurs due to the breakdown of
the bond between the cement paste and aggregate
particles [8-15]. Therefore, designers and engineers
need to know the creep properties of concrete and
must be able to take them into account in the struc-
ture analysis. As per IS: 456-2000 [16], creep of con-
crete depends on the constituents of concrete, size of
the member, environmental conditions (humidity
and temperature), stress in the concrete, age at load-
ing and the duration of loading. As long as the
stress in concrete does not exceed one-third of its
characteristic compressive strength, creep may be as-
sumed to be proportional to the stress. High strength
concrete is significantly in use now a days in number
Corresponding author P. N. Ojha is a Joint Director in the Na-
tional Council for Cement & Building Materials, India.
Brijesh Singh is a Group Manager in National Council for Ce-
ment & Building Materials, India.
Abhishek Singh is a Project Engineer in the National Council
for Cement & Building Materials, India.
Vikas Patel is a Project Engineer in National Council for Ce-
ment & Building Materials, India.
Journal of Asian Concrete Federation, Vol. 6, No. 2, December 2020
25
of concrete structures, the most common applica-
tions being the columns of high rise buildings, long
span bridges, longer spans for beams or fewer beams
for a given span length, offshore structures, etc.
High-strength concrete is a more sensitive material
than normal strength concrete and it must be treated
with care both in design and in construction. The aim
of the paper is to compare the creep coefficients with
different creep models like Bazant’s B-3, ACI,
AASHTO, GL-2000 and FIB model code 2010 for
concrete mixes having water to cementitious ratio of
0.47, 0.36, 0.27 and 0.20. The comparison of differ-
ent models is done for a relative humidity of 60 per-
cent and design life of 100 years. For comparison of
creep coefficient using different models the age at
loading are kept as 7, 28 and 365 days. Thereafter,
values are compared with experimentally obtained
results of concrete mixes having water to cementi-
tious ratio of 0.47 and 0.20 for age at loading of 28
days.
2 Experimental program
2.1 Concrete ingredients:
Crushed aggregate with a maximum nominal
size of 20 mm was used as coarse aggregate and nat-
ural riverbed sand confirming to Zone II as per IS:
383 was used as fine aggregate. Their physical prop-
erties are given in Table 1. The petrographic studies
conducted on coarse aggregate indicated that the ag-
gregate sample is medium grained with a crystalline
texture and partially weathered sample of granite.
The major mineral constituents were quartz, biotite,
plagioclase-feldspar and orthoclase-feldspar. Acces-
sory minerals are calcite, muscovite, tourmaline and
iron oxide. The petrographic studies of fine aggre-
gate indicated that the minerals present in order of
abundance are quartz, orthoclase-feldspar, horn-
blende, biotite, muscovite, microcline-feldspar, gar-
net, plagioclase-feldspar, tourmaline, calcite and
iron oxide. For both the coarse aggregate and fine
aggregate sample the strained quartz percentage and
their Undulatory Extinction Angle (UEA) are within
permissible limits as per IS: 383-2016 (Strain Quartz
percentage less than 20% and Undulatory Extinction
Angle less than 15o). The silt content in fine aggre-
gate as per wet sieving method is 0.70 percent.
Ordinary Portland cement (OPC 53 Grade) with
fly ash and silica fume are used in this study. The
chemical and physical compositions of cement OPC
53 Grade, Properties of fly ash and silica fume are
given in Table 2. Polycarboxylic group-based super-
plasticizer for w/c ratio 0.36, 0.27 and 0.20 and
Naphthalene based for w/c ratio 0.47 complying with
requirements of Indian Standard: 9103 is used
throughout the investigation. Water complying with
requirements of IS: 456-2000 for construction pur-
pose was used. The 3 days, 7 days and 28 days’ com-
pressive strength of cement OPC 53 Grade were
36.00 MPa, 45.50 MPa and 57.50 MPa respectively.
The 28 days’ compressive strength of controlled
sample and sample cast with fly ash was 38.53 MPa
and 31.64 MPa respectively, when testing was done
in accordance with IS: 1727. The 7 days’ compres-
sive strength of controlled sample and sample cast
with silica fume was 12.76 MPa and 14.46 MPa re-
spectively, when testing was done in accordance
with IS: 1727.
2.2 Mix design details
In this study, the four different mixes with w/c
ratio 0.47, 0.36, 0.27 and 0.20 using granite aggre-
gate were selected for studying creep coefficient.
The slump of the fresh concrete was kept in the range
of 75-100 mm. A pre-study was carried out to deter-
mine the optimum superplasticizer dosage for
achieving the desired workability based on the slump
Table 1 – Properties of aggregates
Property Coarse Aggregate
Fine Aggregate 20 mm 10 mm
Specific gravity 2.83 2.83 2.64
Water absorption (%) 0.3 0.3 0.8
Sieve
Analysis
Cumulative Per-
centage
Passing (%)
20mm 98 100 100
10 mm 1 68 100
4.75 mm 0 2 95
2.36 mm 0 0 87
1.18 mm 0 0 68
600 µ 0 0 38
300 µ 0 0 10
150 µ 0 0 2
Pan 0 0 0
Abrasion, Impact & Crushing Value 19, 13, 19 - -
Flakiness % & Elongation % 29, 25 - -
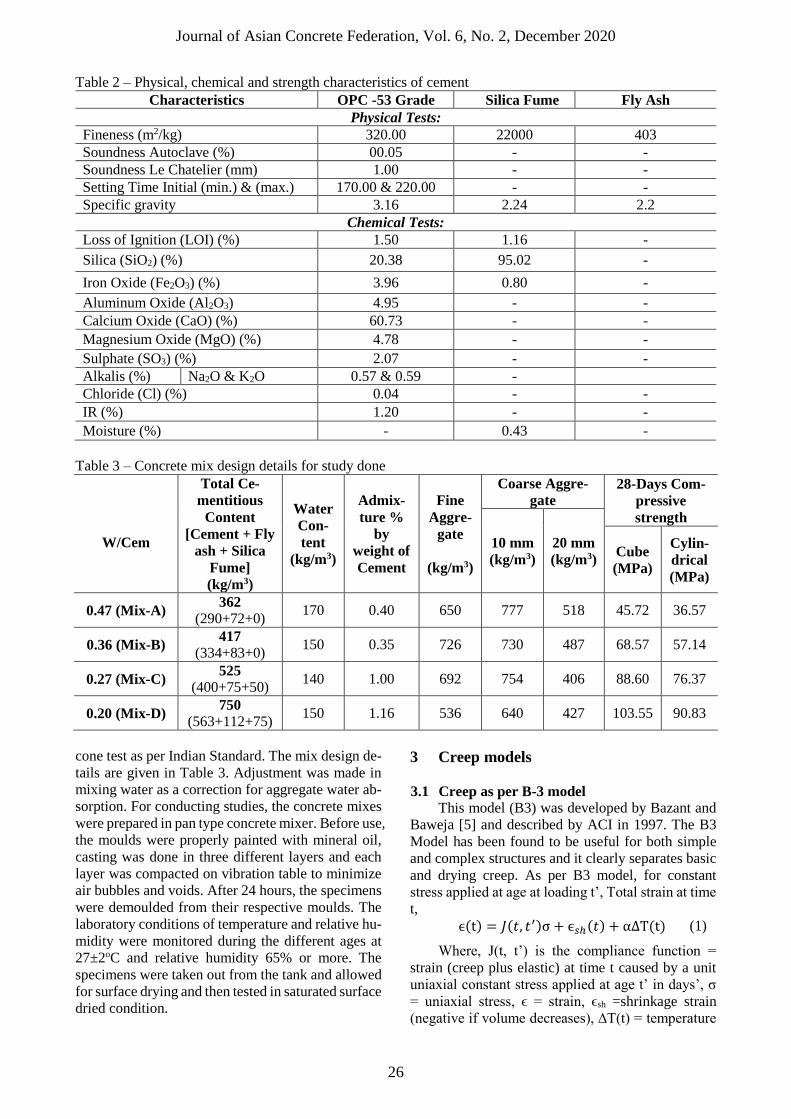
Journal of Asian Concrete Federation, Vol. 6, No. 2, December 2020
26
Table 2 – Physical, chemical and strength characteristics of cement
Characteristics OPC -53 Grade Silica Fume Fly Ash
Physical Tests:
Fineness (m2/kg) 320.00 22000 403
Soundness Autoclave (%) 00.05 - -
Soundness Le Chatelier (mm) 1.00 - -
Setting Time Initial (min.) & (max.) 170.00 & 220.00 - -
Specific gravity 3.16 2.24 2.2
Chemical Tests:
Loss of Ignition (LOI) (%) 1.50 1.16 -
Silica (SiO2) (%) 20.38 95.02 -
Iron Oxide (Fe2O3) (%) 3.96 0.80 -
Aluminum Oxide (Al2O3) 4.95 - -
Calcium Oxide (CaO) (%) 60.73 - -
Magnesium Oxide (MgO) (%) 4.78 - -
Sulphate (SO3) (%) 2.07 - -
Alkalis (%) Na2O & K2O 0.57 & 0.59 -
Chloride (Cl) (%) 0.04 - -
IR (%) 1.20 - -
Moisture (%) - 0.43 -
Table 3 – Concrete mix design details for study done
W/Cem
Total Ce-
mentitious
Content
[Cement + Fly
ash + Silica
Fume]
(kg/m3)
Water
Con-
tent
(kg/m3)
Admix-
ture %
by
weight of
Cement
Fine
Aggre-
gate
(kg/m3)
Coarse Aggre-
gate
28-Days Com-
pressive
strength
10 mm
(kg/m3)
20 mm
(kg/m3) Cube
(MPa)
Cylin-
drical
(MPa)
0.47 (Mix-A) 362
(290+72+0) 170 0.40 650 777 518 45.72 36.57
0.36 (Mix-B) 417
(334+83+0) 150 0.35 726 730 487 68.57 57.14
0.27 (Mix-C) 525
(400+75+50) 140 1.00 692 754 406 88.60 76.37
0.20 (Mix-D) 750
(563+112+75) 150 1.16 536 640 427 103.55 90.83
cone test as per Indian Standard. The mix design de-
tails are given in Table 3. Adjustment was made in
mixing water as a correction for aggregate water ab-
sorption. For conducting studies, the concrete mixes
were prepared in pan type concrete mixer. Before use,
the moulds were properly painted with mineral oil,
casting was done in three different layers and each
layer was compacted on vibration table to minimize
air bubbles and voids. After 24 hours, the specimens
were demoulded from their respective moulds. The
laboratory conditions of temperature and relative hu-
midity were monitored during the different ages at
27±2oC and relative humidity 65% or more. The
specimens were taken out from the tank and allowed
for surface drying and then tested in saturated surface
dried condition.
3 Creep models
3.1 Creep as per B-3 model
This model (B3) was developed by Bazant and
Baweja [5] and described by ACI in 1997. The B3
Model has been found to be useful for both simple
and complex structures and it clearly separates basic
and drying creep. As per B3 model, for constant
stress applied at age at loading t’, Total strain at time
t,
ϵ(t) = 𝐽(𝑡, 𝑡′)σ + ϵ𝑠ℎ(𝑡) + α∆T(t) (1)
Where, J(t, t’) is the compliance function =
strain (creep plus elastic) at time t caused by a unit
uniaxial constant stress applied at age t’ in days’, σ
= uniaxial stress, ϵ = strain, ϵsh =shrinkage strain
(negative if volume decreases), ∆T(t) = temperature

Journal of Asian Concrete Federation, Vol. 6, No. 2, December 2020
27
change from reference temperature at time t, and α =
thermal expansion coefficient.
The compliance function may further be de-
composed as
𝐽(𝑡, 𝑡′) = 𝑞1 + C0(𝑡, 𝑡′) + 𝐶𝑑(𝑡, 𝑡′, 𝑡0) (2)
where, q1 = instantaneous strain due to unit stress,
q1 = 0.6 x 10⁶ /E28 and E28 (MPa) = 4734(fc)0.5, C0(t,
t’) = compliance function for basic creep (creep at
constant moisture content and no moisture move-
ment through the material), and Cd(t, t’, t0) = addi-
tional compliance function due to simultaneous dry-
ing.
The creep coefficient, φ(t, t′ ) should be calcu-
lated from the compliance function,
φ(𝑡, 𝑡′) = E(𝑡′)𝐽(𝑡, 𝑡′) − 1 (3)
where, E(t′) = (static) modulus of elasticity at loading
age t ′
Calculations of Creep and Time Dependent Strain
Components
The total basic creep compliance is obtained by
equation as follows:
C0(𝑡, 𝑡
′) = 𝑞2 ∙ 𝑄(𝑡, 𝑡′) + 𝑞3 ∙ ln[1 +(𝑡 − 𝑡′)𝑛] + 𝑞4 ∙ ln(𝑡/𝑡′)
(4)
where, q2, q3 and q4 represent the aging viscoelas-
tic compliance, non-aging viscoelastic compliance,
and flow compliance respectively, as deduced from
the solidification theory, q2 = 185.4 c0.5 fc-0.9 , q3 =
0.29(w/c)4.q2, q4 = 20.3(a/c)-0.7.
The values of Q(t, t′) can be obtained from the
following approximate formula (derived by Bazant
and Prasannan, 1989 [17]) which has an error of less
than 1% for n = 0.1 and m = 0.5;
𝑄(𝑡, 𝑡′) = 𝑄𝑓(𝑡′) [1 + (
𝑄𝑓(𝑡′)
𝑍(𝑡, 𝑡′))
𝑟(𝑡′)
]
−1/𝑟(𝑡′)
(5)
where, r(t’) = 1.7(t’)0.12+8, Z(t, t’) = (t’)-m ln[1+(t-t’)n]
(m=0.5, n=0.1), Qf(t’) = [0.086(t’)2/9+1.21(t’)4/9]−1
Additional Creep Due to Drying (Drying Creep)
𝐶𝑑(𝑡, 𝑡′, 𝑡0) = 𝑞5 ∙ [𝑒−8𝐻(𝑡) − 𝑒−8𝐻(𝑡0′)]
0.5 (6)
If t ≥t/0, t/
0= max(t/ , t0). Otherwise, Cd(t, t/, t0) = 0,
t/0 is the time at which drying and loading first act
simultaneously, and
𝐻(𝑡) = 1 − (1 − ℎ)𝑆(𝑡) (7)
where, q5 = 7.57 × 10⁵ .fC-1. |ɛsh∞|-0.60.
ϵ𝑠ℎ∞ = ϵ𝑠∞ (𝐸(607)
𝐸(𝑡0 + 𝜏𝑠ℎ)) (8)
where,
𝐸(𝑡) = 𝐸(28) (𝑡
4 + 0.85𝑡)0.5
(9)
ϵ𝑠∞ = −𝛼1𝛼2(1.9 × 10⁻²𝑤2.1𝑓𝑐
−0.28
+ 270) (𝑖𝑛 10−6) (10)
This means that ɛs∞= ɛsh∞ for t0 = 7 days and τsh
= 600 days.
Time dependence: S(t) = tanh((t-t0)/ τsh)0.5, size
dependence: τsh= kt(ks.D)2, effective cross-section
thickness (D = 2v/s) which coincides with the actual
thickness in the case of a slab, v/s = volume to sur-
face ratio of the concrete member. kt = 295740.59 ×
t0-0.08.fc
-0.25 days/cm2, ks is the cross-section shape
factor (Table 5).
High accuracy in this respect is not needed ks ≈
1 can be assumed for analysis.
Following parameters and coefficients were
considered while making calculations for experi-
mental mixes using creep and shrinkage prediction
model B3 by Zdenek P. Bazant and Sandeep Baweja,
Type I cement was used in this study. Hence,
α1 was taken as 1.
Since all the samples were sealed by wrap-
ping in Butyl Rubber Sheet up to 28 days, α2
was taken as 1.2
Age at which drying of specimen began was
taken as 28 days.
Relative humidity of environment during
curing and loading was maintained at 60%
and same was used for calculations.
Type of specimen was considered as infinite
cylinder. Hence, kS was taken as 1.15.
All the other factors were calculated using
above mentioned formulas by using differ-
ent values of fcm, t, t0 and other parameters
associated to individual mixes.
Table 4 – Coefficients based on cement type and
curing conditions
α1
1.0 for type I cement
0.85 for type II cement
1.1 for type III cement
α2
0.75 for steam-curing
1.2 for sealed or normal curing in air
with initial protection against drying
1.0 for curing in water or at 100% rela-
tive humidity.
Table 5 – Cross-section shape factor (ks)
ks
1 Infinite slab
1.15 Infinite cylinder
1.25 Infinite square prism
1.30 Sphere
1.55 Cube
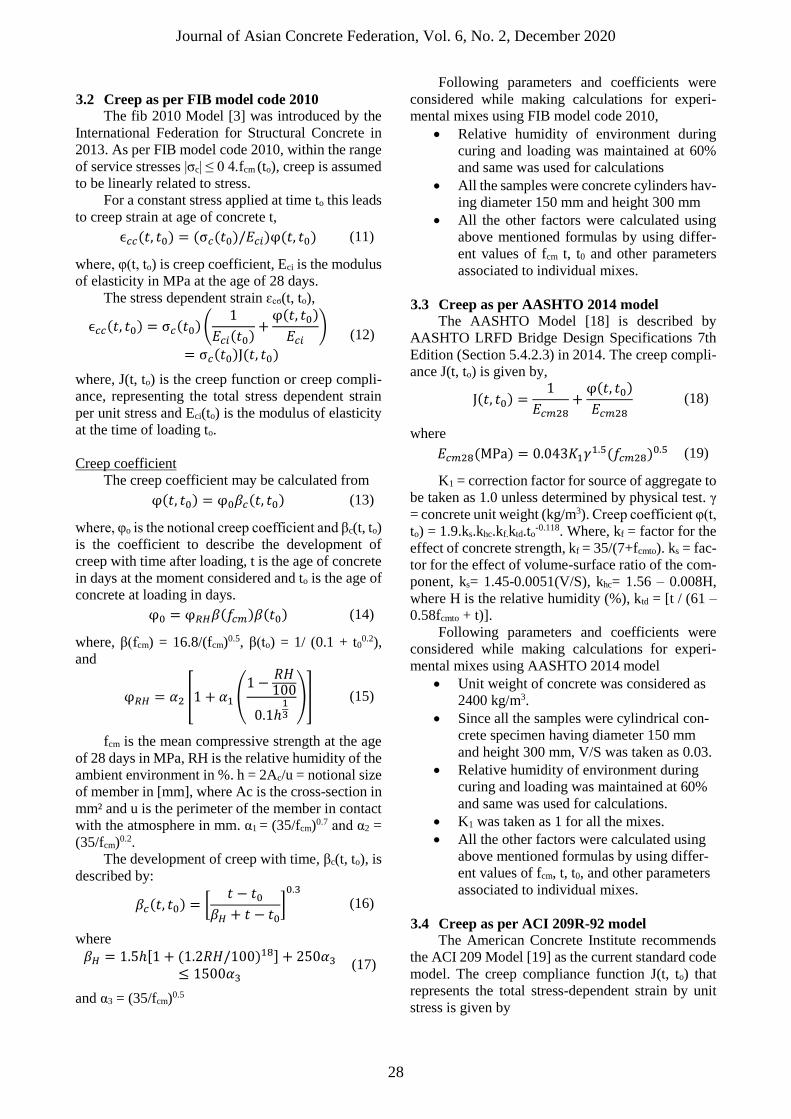
Journal of Asian Concrete Federation, Vol. 6, No. 2, December 2020
28
3.2 Creep as per FIB model code 2010
The fib 2010 Model [3] was introduced by the
International Federation for Structural Concrete in
2013. As per FIB model code 2010, within the range
of service stresses |σc| ≤ 0 4.fcm (to), creep is assumed
to be linearly related to stress.
For a constant stress applied at time to this leads
to creep strain at age of concrete t,
ϵ𝑐𝑐(𝑡, 𝑡0) = (σ𝑐(𝑡0)/𝐸𝑐𝑖)φ(𝑡, 𝑡0) (11)
where, φ(t, to) is creep coefficient, Eci is the modulus
of elasticity in MPa at the age of 28 days.
The stress dependent strain ɛcσ(t, to),
ϵ𝑐𝑐(𝑡, 𝑡0) = σ𝑐(𝑡0) (1
𝐸𝑐𝑖(𝑡0)+
φ(𝑡, 𝑡0)
𝐸𝑐𝑖)
= σ𝑐(𝑡0)J(𝑡, 𝑡0)
(12)
where, J(t, to) is the creep function or creep compli-
ance, representing the total stress dependent strain
per unit stress and Eci(to) is the modulus of elasticity
at the time of loading to.
Creep coefficient
The creep coefficient may be calculated from
φ(𝑡, 𝑡0) = φ0𝛽𝑐(𝑡, 𝑡0) (13)
where, φo is the notional creep coefficient and βc(t, to)
is the coefficient to describe the development of
creep with time after loading, t is the age of concrete
in days at the moment considered and to is the age of
concrete at loading in days.
φ0 = φ𝑅𝐻𝛽(𝑓𝑐𝑚)𝛽(𝑡0) (14)
where, β(fcm) = 16.8/(fcm)0.5, β(to) = 1/ (0.1 + t00.2),
and
φ𝑅𝐻 = 𝛼2 [1 + 𝛼1 (1 −
𝑅𝐻100
0.1ℎ13
)] (15)
fcm is the mean compressive strength at the age
of 28 days in MPa, RH is the relative humidity of the
ambient environment in %. h = 2Ac/u = notional size
of member in [mm], where Ac is the cross-section in
mm² and u is the perimeter of the member in contact
with the atmosphere in mm. α1 = (35/fcm)0.7 and α2 =
(35/fcm)0.2.
The development of creep with time, βc(t, to), is
described by:
𝛽𝑐(𝑡, 𝑡0) = [𝑡 − 𝑡0
𝛽𝐻 + 𝑡 − 𝑡0]0.3
(16)
where
𝛽𝐻 = 1.5ℎ[1 + (1.2𝑅𝐻/100)18] + 250𝛼3
≤ 1500𝛼3 (17)
and α3 = (35/fcm)0.5
Following parameters and coefficients were
considered while making calculations for experi-
mental mixes using FIB model code 2010,
Relative humidity of environment during
curing and loading was maintained at 60%
and same was used for calculations
All the samples were concrete cylinders hav-
ing diameter 150 mm and height 300 mm
All the other factors were calculated using
above mentioned formulas by using differ-
ent values of fcm t, t0 and other parameters
associated to individual mixes.
3.3 Creep as per AASHTO 2014 model
The AASHTO Model [18] is described by
AASHTO LRFD Bridge Design Specifications 7th
Edition (Section 5.4.2.3) in 2014. The creep compli-
ance J(t, to) is given by,
J(𝑡, 𝑡0) =1
𝐸𝑐𝑚28+
φ(𝑡, 𝑡0)
𝐸𝑐𝑚28 (18)
where
𝐸𝑐𝑚28(MPa) = 0.043𝐾1𝛾1.5(𝑓𝑐𝑚28)
0.5 (19)
K1 = correction factor for source of aggregate to
be taken as 1.0 unless determined by physical test. γ
= concrete unit weight (kg/m3). Creep coefficient φ(t,
to) = 1.9.ks.khc.kf.ktd.to-0.118. Where, kf = factor for the
effect of concrete strength, kf = 35/(7+fcmto). ks = fac-
tor for the effect of volume-surface ratio of the com-
ponent, ks= 1.45-0.0051(V/S), khc= 1.56 – 0.008H,
where H is the relative humidity (%), ktd = [t / (61 –
0.58fcmto + t)].
Following parameters and coefficients were
considered while making calculations for experi-
mental mixes using AASHTO 2014 model
Unit weight of concrete was considered as
2400 kg/m3.
Since all the samples were cylindrical con-
crete specimen having diameter 150 mm
and height 300 mm, V/S was taken as 0.03.
Relative humidity of environment during
curing and loading was maintained at 60%
and same was used for calculations.
K1 was taken as 1 for all the mixes.
All the other factors were calculated using
above mentioned formulas by using differ-
ent values of fcm, t, t0, and other parameters
associated to individual mixes.
3.4 Creep as per ACI 209R-92 model
The American Concrete Institute recommends
the ACI 209 Model [19] as the current standard code
model. The creep compliance function J(t, to) that
represents the total stress-dependent strain by unit
stress is given by
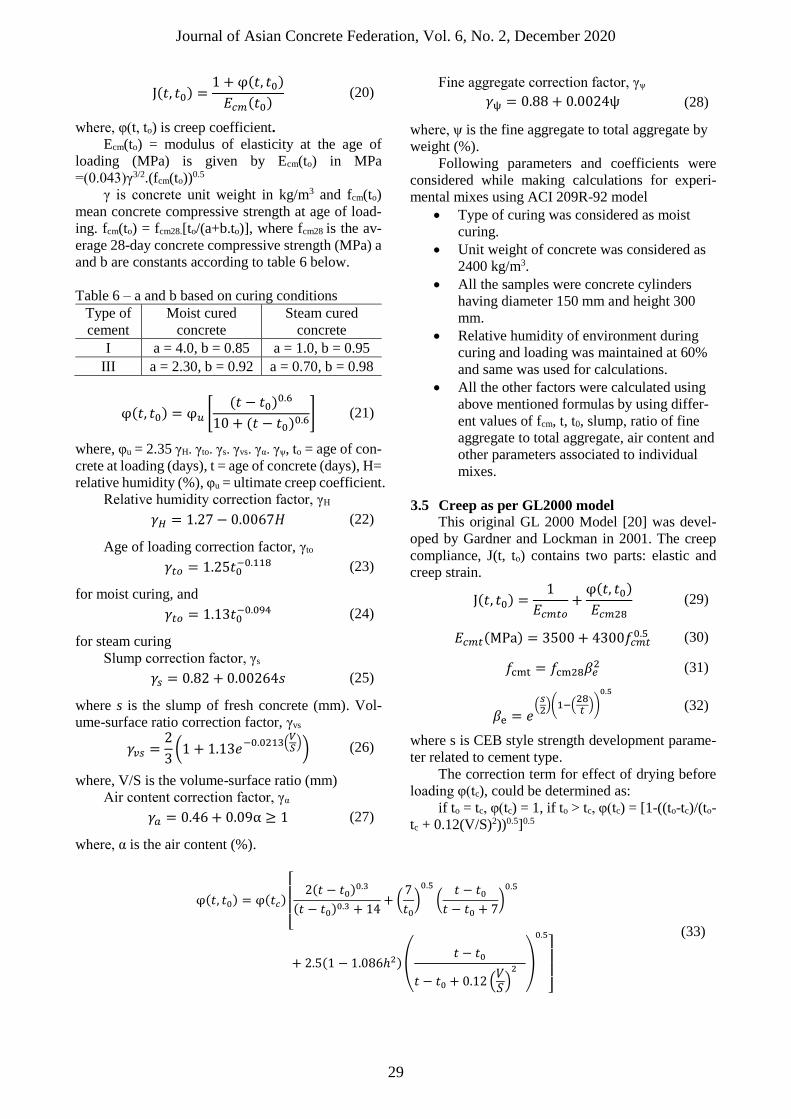
Journal of Asian Concrete Federation, Vol. 6, No. 2, December 2020
29
J(𝑡, 𝑡0) =1 + φ(𝑡, 𝑡0)
𝐸𝑐𝑚(𝑡0) (20)
where, φ(t, to) is creep coefficient.
Ecm(to) = modulus of elasticity at the age of
loading (MPa) is given by Ecm(to) in MPa
=(0.043)γ3/2.(fcm(to))0.5
γ is concrete unit weight in kg/m3 and fcm(to)
mean concrete compressive strength at age of load-
ing. fcm(to) = fcm28.[to/(a+b.to)], where fcm28 is the av-
erage 28-day concrete compressive strength (MPa) a
and b are constants according to table 6 below.
Table 6 – a and b based on curing conditions
Type of
cement
Moist cured
concrete
Steam cured
concrete
I a = 4.0, b = 0.85 a = 1.0, b = 0.95
III a = 2.30, b = 0.92 a = 0.70, b = 0.98
φ(𝑡, 𝑡0) = φ𝑢 [(𝑡 − 𝑡0)
0.6
10 + (𝑡 − 𝑡0)0.6
] (21)
where, φu = 2.35 γH. γto. γs. γvs. γα. γψ, to = age of con-
crete at loading (days), t = age of concrete (days), H=
relative humidity (%), φu = ultimate creep coefficient.
Relative humidity correction factor, γH
𝛾𝐻 = 1.27 − 0.0067𝐻 (22)
Age of loading correction factor, γto
𝛾𝑡𝑜 = 1.25𝑡0−0.118 (23)
for moist curing, and
𝛾𝑡𝑜 = 1.13𝑡0−0.094 (24)
for steam curing
Slump correction factor, γs
𝛾𝑠 = 0.82 + 0.00264𝑠 (25)
where s is the slump of fresh concrete (mm). Vol-
ume-surface ratio correction factor, γvs
𝛾𝑣𝑠 =2
3(1 + 1.13𝑒
−0.0213(𝑉𝑆)) (26)
where, V/S is the volume-surface ratio (mm)
Air content correction factor, γα
𝛾𝑎 = 0.46 + 0.09α ≥ 1 (27)
where, α is the air content (%).
Fine aggregate correction factor, γψ
𝛾ψ = 0.88 + 0.0024ψ (28)
where, ψ is the fine aggregate to total aggregate by
weight (%).
Following parameters and coefficients were
considered while making calculations for experi-
mental mixes using ACI 209R-92 model
Type of curing was considered as moist
curing.
Unit weight of concrete was considered as
2400 kg/m3.
All the samples were concrete cylinders
having diameter 150 mm and height 300
mm.
Relative humidity of environment during
curing and loading was maintained at 60%
and same was used for calculations.
All the other factors were calculated using
above mentioned formulas by using differ-
ent values of fcm, t, t0, slump, ratio of fine
aggregate to total aggregate, air content and
other parameters associated to individual
mixes.
3.5 Creep as per GL2000 model
This original GL 2000 Model [20] was devel-
oped by Gardner and Lockman in 2001. The creep
compliance, J(t, to) contains two parts: elastic and
creep strain.
J(𝑡, 𝑡0) =1
𝐸𝑐𝑚𝑡𝑜+
φ(𝑡, 𝑡0)
𝐸𝑐𝑚28 (29)
𝐸𝑐𝑚𝑡(MPa) = 3500 + 4300𝑓𝑐𝑚𝑡0.5 (30)
𝑓cmt = 𝑓cm28𝛽𝑒2 (31)
𝛽e = 𝑒
(𝑠2)(1−(
28𝑡
))
0.5
(32)
where s is CEB style strength development parame-
ter related to cement type.
The correction term for effect of drying before
loading φ(tc), could be determined as:
if to = tc, φ(tc) = 1, if to > tc, φ(tc) = [1-((to-tc)/(to-
tc + 0.12(V/S)2))0.5]0.5
φ(𝑡, 𝑡0) = φ(𝑡𝑐)
[
2(𝑡 − 𝑡0)0.3
(𝑡 − 𝑡0)0.3 + 14
+ (7
𝑡0)
0.5
(𝑡 − 𝑡0
𝑡 − 𝑡0 + 7)
0.5
+ 2.5(1 − 1.086ℎ2)(𝑡 − 𝑡0
𝑡 − 𝑡0 + 0.12 (𝑉𝑆)
2
)
0.5
]
(33)
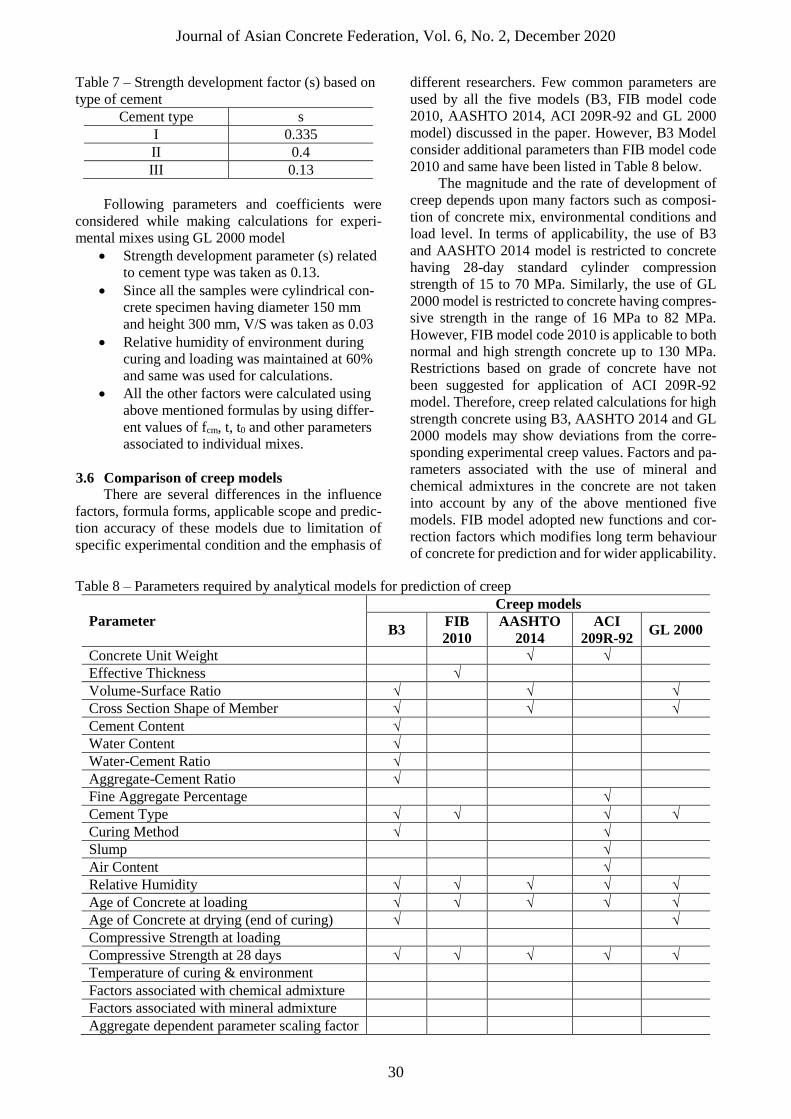
Journal of Asian Concrete Federation, Vol. 6, No. 2, December 2020
30
Table 7 – Strength development factor (s) based on
type of cement
Cement type s
I 0.335
II 0.4
III 0.13
Following parameters and coefficients were
considered while making calculations for experi-
mental mixes using GL 2000 model
Strength development parameter (s) related
to cement type was taken as 0.13.
Since all the samples were cylindrical con-
crete specimen having diameter 150 mm
and height 300 mm, V/S was taken as 0.03
Relative humidity of environment during
curing and loading was maintained at 60%
and same was used for calculations.
All the other factors were calculated using
above mentioned formulas by using differ-
ent values of fcm, t, t0 and other parameters
associated to individual mixes.
3.6 Comparison of creep models
There are several differences in the influence
factors, formula forms, applicable scope and predic-
tion accuracy of these models due to limitation of
specific experimental condition and the emphasis of
different researchers. Few common parameters are
used by all the five models (B3, FIB model code
2010, AASHTO 2014, ACI 209R-92 and GL 2000
model) discussed in the paper. However, B3 Model
consider additional parameters than FIB model code
2010 and same have been listed in Table 8 below.
The magnitude and the rate of development of
creep depends upon many factors such as composi-
tion of concrete mix, environmental conditions and
load level. In terms of applicability, the use of B3
and AASHTO 2014 model is restricted to concrete
having 28-day standard cylinder compression
strength of 15 to 70 MPa. Similarly, the use of GL
2000 model is restricted to concrete having compres-
sive strength in the range of 16 MPa to 82 MPa.
However, FIB model code 2010 is applicable to both
normal and high strength concrete up to 130 MPa.
Restrictions based on grade of concrete have not
been suggested for application of ACI 209R-92
model. Therefore, creep related calculations for high
strength concrete using B3, AASHTO 2014 and GL
2000 models may show deviations from the corre-
sponding experimental creep values. Factors and pa-
rameters associated with the use of mineral and
chemical admixtures in the concrete are not taken
into account by any of the above mentioned five
models. FIB model adopted new functions and cor-
rection factors which modifies long term behaviour
of concrete for prediction and for wider applicability.
Table 8 – Parameters required by analytical models for prediction of creep
Parameter
Creep models
B3 FIB
2010
AASHTO
2014
ACI
209R-92 GL 2000
Concrete Unit Weight √ √
Effective Thickness √
Volume-Surface Ratio √ √ √
Cross Section Shape of Member √ √ √
Cement Content √
Water Content √
Water-Cement Ratio √
Aggregate-Cement Ratio √
Fine Aggregate Percentage √
Cement Type √ √ √ √
Curing Method √ √
Slump √
Air Content √
Relative Humidity √ √ √ √ √
Age of Concrete at loading √ √ √ √ √
Age of Concrete at drying (end of curing) √ √
Compressive Strength at loading
Compressive Strength at 28 days √ √ √ √ √
Temperature of curing & environment
Factors associated with chemical admixture
Factors associated with mineral admixture
Aggregate dependent parameter scaling factor

Journal of Asian Concrete Federation, Vol. 6, No. 2, December 2020
31
4 Creep coefficient as per creep models
Creep coefficient of four different mixes (A, B,
C & D) as shown in Table- has been worked out us-
ing Bazant’s B-3, ACI 209-R 92, AASHTO 2014,
GL-2000 and FIB model code 2010. The creep coef-
ficients are determined for three different ages at
loading (7, 28 and 365 days) for design life of 100
years and relative humidity of 60% (Figure 1 to Fig-
ure 3). The comparison of creep coefficients as per
different models indicates that there is sharp increase
in creep coefficient for each model upto around 365
days age. The rate of increase of each model drasti-
cally slows down after 365 days irrespective of the
grade of concrete. Both B3 model and GL 2000
shows higher creep coefficients at early age except
in case of mix A having water to cementitious ratio
of 0.47 and age at loading of 7 days. The AASHTO
2014 Model in general gave the lowest values of
creep coefficient except in case of mix A having wa-
ter to cementitious ratio of 0.47 and age at loading of
7 days. The rate of increase in creep coefficient after
365 days age in case of B3 Model is relatively higher
than other models. Both ACI and FIB model code
2010 gave creep coefficients in between the B3 and
AASHTO models except in case of mix A having
water to cementitious ratio of 0.47 and age at loading
of 7 days and similar trend is observed in higher
grades of concrete. The magnitude of creep coeffi-
cient depends on a wide range of factors including
the stress range, element size, concrete mix, coarse
gravel content, cement content, type of cement, wa-
ter/cement ratio, relative humidity, temperature, time
of loading, type and duration of curing and maturity.
Including most of these factors in creep coefficient
calculations is tedious. B3 Model and ACI 209R-92
requires most numbers of parameters for creep pre-
diction. FIB Model code 2010, GL 2000 Model and
AASHTO 2014 Model require less number of pa-
rameters to predict the creep coefficient.
In order to check the performance of these mod-
els for high strength concrete; an experimental study
has been conducted with two mixes EM-1 and EM-
2 with water to cementitious ratio of 0.47 and 0.20
respectively and results are discussed in paragraph 5.
(a) Mix-A, w/c =0.47, age at loading = 7 days (b) Mix-B, w/c =0.36, age at loading = 7 days
(c) Mix-C, w/c =0.27, age at loading = 7 days (d) Mix-D, w/c =0.20, age at loading = 7 days
Fig. 1 – Comparison of creep coefficient of concrete mix (a) Mix-A, (b) Mix-B, (c) Mix-C, (d) Mix-D
with different creep models (age at loading of 7 days)
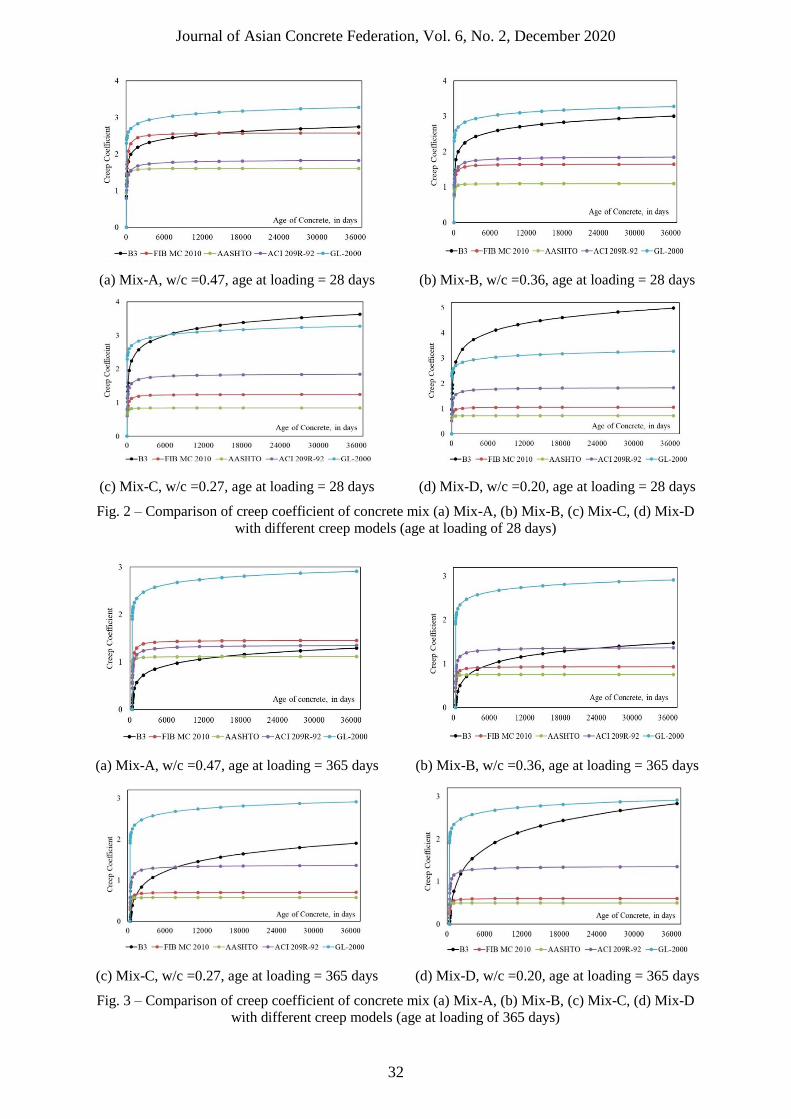
Journal of Asian Concrete Federation, Vol. 6, No. 2, December 2020
32
(a) Mix-A, w/c =0.47, age at loading = 28 days (b) Mix-B, w/c =0.36, age at loading = 28 days
(c) Mix-C, w/c =0.27, age at loading = 28 days (d) Mix-D, w/c =0.20, age at loading = 28 days
Fig. 2 – Comparison of creep coefficient of concrete mix (a) Mix-A, (b) Mix-B, (c) Mix-C, (d) Mix-D
with different creep models (age at loading of 28 days)
(a) Mix-A, w/c =0.47, age at loading = 365 days (b) Mix-B, w/c =0.36, age at loading = 365 days
(c) Mix-C, w/c =0.27, age at loading = 365 days (d) Mix-D, w/c =0.20, age at loading = 365 days
Fig. 3 – Comparison of creep coefficient of concrete mix (a) Mix-A, (b) Mix-B, (c) Mix-C, (d) Mix-D
with different creep models (age at loading of 365 days)

Journal of Asian Concrete Federation, Vol. 6, No. 2, December 2020
20
5 Experimental creep study in compression
Creep is the continuous increase of the strain in
concrete without any change in the applied stress.
Creep depends on several factors, including mixture
proportioning, environmental conditions, curing
conditions, geometry of concrete member, loading
history and stress conditions. Creep of concrete de-
pends on the stress in the concrete, age at loading and
the duration of loading. As long as the stress in con-
crete does not exceed about 40 percent of character-
istic compressive strength, creep may be assumed to
be proportional to the stress. The creep co-efficient
ɸ(t, to) is given by the equation:
ɸ(𝑡, 𝑡0) =𝜀𝑐𝑐(𝑡)
𝜀𝑐𝑖(𝑡0) (34)
where, εcc(t) = creep strain at time t > t0, (This does
not include the instantaneous strain in concrete at the
time of loading), εci(t0) = initial strain at loading, and
t0 = age of concrete at the time of loading
The creep test was carried out on a cylindrical
specimen of size 150 mm diameter and 300 mm
height as per ASTM C-512 for concrete with water
to cementitious ratio of 0.47 (EM-1) and 0.20 (EM-
2) with same mix proportions as shown in table 3 for
mix A and mix D respectively. The compressive
strength of each mix was used for calculation of the
load to be applied to the specimens, which was taken
as 40% of the average compressive strength. The cyl-
inders were sulphur capped before being stacked up
on top of one another in the creep rig. The vibrating
wire strain gauges were inserted in cylindrical spec-
imens at the time of casting. The specimens were
cured by wrapping in Butyl Rubber Sheet up to 28
days. Relative Humidity was maintained at 60% and
temperature was maintained at 270C. The tempera-
ture and relative humidity were maintained at same
level after 28 days as well. The creep as per ASTM
C-512 is being measured using manual data readout
units. In creep test, samples are kept in controlled
and loaded condition for the time period of 180 days
(Figure 4). Each strength and control specimen was
kept under the same curing and storage treatment as
the loaded specimen.
The steps for calculating creep strain at a given age
are as follows:
EM-1: Water Cementitious Ratio: 0.47and Aver-
age: fcy: 45.66 MPa
Stress applied: 18.26 MPa (40% of fcy)
Total load applied: 323 kN
Age at the time of loading: 28 days
Average strain immediately after loading at time t0 =
484.31 (µ-strain)
Average strain of unloaded specimens at the time of
loading at time t0 = 19.03 (µ-strain)
Load induced strain per unit stress immediately after
loading = (484.31-19.03)/18.26 = 25.48 (µ-strain/
(MPa))
Average strain of loaded specimens at 180 days of
loading = 1321.08 (µ-strain)
Average strain of unloaded specimens at 180 days of
loading = 258.57 (µ-strain)
Load induced strain per unit stress at 180 days of
loading = (1321.08-258.57)/18.26 = 58.19 (µ-strain/
(MPa)
Therefore, the Creep strain per unit stress = (58.19-
25.48) = 32.71 µ-strain/ (MPa)
EM-2: Water Cementitious Ratio: 0.20 and Aver-
age fcy: 100.21 MPa
Stress applied: 40.08 MPa (40% of fcy)
Total load applied: 708 kN
Age at the time of loading: 28 Days
Average strain immediately after loading at time t0:
1006.80 (µ-strain)
Average strain of unloaded specimens immediately
after loading: 0.00 (µ-strain)
Load induced strain per unit stress immediately after
loading = (1006.80 – 0)/40.08 = 25.11(µ-strain)
Average strain of loaded specimens at 180 days of
loading = 1784.05 (µ-strain)
Average strain of unloaded specimens at 180 days of
loading = 131.77 (µ-strain)
Load induced strain per unit stress at 180 days of
loading = (1784.08-131.77)/40.08 = 41.22 (µ-strain/
(MPa)
Therefore, the Creep strain per unit stress = (41.22-
25.11) = 16.11 µ-strain/ (MPa)
Test results of creep up to 180 days are given in
Table 9.
Fig. 4 – Creep testing arrangement
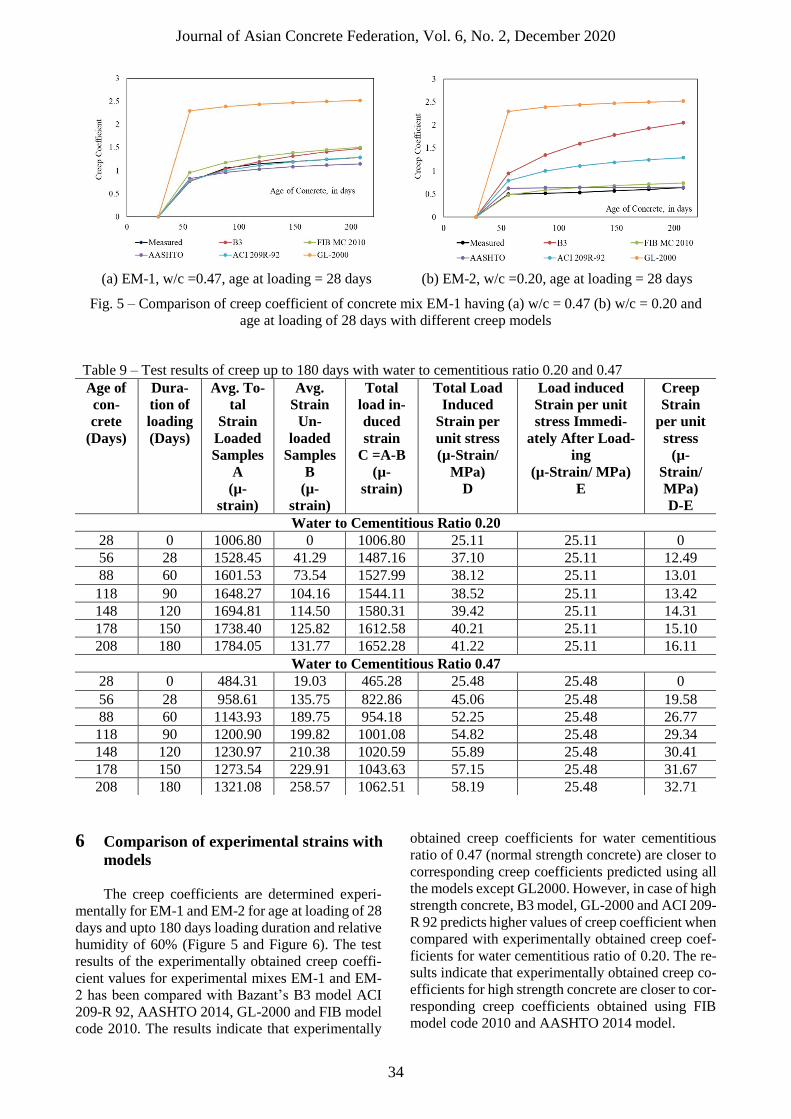
Journal of Asian Concrete Federation, Vol. 6, No. 2, December 2020
34
(a) EM-1, w/c =0.47, age at loading = 28 days (b) EM-2, w/c =0.20, age at loading = 28 days
Fig. 5 – Comparison of creep coefficient of concrete mix EM-1 having (a) w/c = 0.47 (b) w/c = 0.20 and
age at loading of 28 days with different creep models
Table 9 – Test results of creep up to 180 days with water to cementitious ratio 0.20 and 0.47
Age of
con-
crete
(Days)
Dura-
tion of
loading
(Days)
Avg. To-
tal
Strain
Loaded
Samples
A
(µ-
strain)
Avg.
Strain
Un-
loaded
Samples
B
(µ-
strain)
Total
load in-
duced
strain
C =A-B
(µ-
strain)
Total Load
Induced
Strain per
unit stress
(µ-Strain/
MPa)
D
Load induced
Strain per unit
stress Immedi-
ately After Load-
ing
(µ-Strain/ MPa)
E
Creep
Strain
per unit
stress
(µ-
Strain/
MPa)
D-E
Water to Cementitious Ratio 0.20
28 0 1006.80 0 1006.80 25.11 25.11 0
56 28 1528.45 41.29 1487.16 37.10 25.11 12.49
88 60 1601.53 73.54 1527.99 38.12 25.11 13.01
118 90 1648.27 104.16 1544.11 38.52 25.11 13.42
148 120 1694.81 114.50 1580.31 39.42 25.11 14.31
178 150 1738.40 125.82 1612.58 40.21 25.11 15.10
208 180 1784.05 131.77 1652.28 41.22 25.11 16.11
Water to Cementitious Ratio 0.47
28 0 484.31 19.03 465.28 25.48 25.48 0
56 28 958.61 135.75 822.86 45.06 25.48 19.58
88 60 1143.93 189.75 954.18 52.25 25.48 26.77
118 90 1200.90 199.82 1001.08 54.82 25.48 29.34
148 120 1230.97 210.38 1020.59 55.89 25.48 30.41
178 150 1273.54 229.91 1043.63 57.15 25.48 31.67
208 180 1321.08 258.57 1062.51 58.19 25.48 32.71
6 Comparison of experimental strains with
models
The creep coefficients are determined experi-
mentally for EM-1 and EM-2 for age at loading of 28
days and upto 180 days loading duration and relative
humidity of 60% (Figure 5 and Figure 6). The test
results of the experimentally obtained creep coeffi-
cient values for experimental mixes EM-1 and EM-
2 has been compared with Bazant’s B3 model ACI
209-R 92, AASHTO 2014, GL-2000 and FIB model
code 2010. The results indicate that experimentally
obtained creep coefficients for water cementitious
ratio of 0.47 (normal strength concrete) are closer to
corresponding creep coefficients predicted using all
the models except GL2000. However, in case of high
strength concrete, B3 model, GL-2000 and ACI 209-
R 92 predicts higher values of creep coefficient when
compared with experimentally obtained creep coef-
ficients for water cementitious ratio of 0.20. The re-
sults indicate that experimentally obtained creep co-
efficients for high strength concrete are closer to cor-
responding creep coefficients obtained using FIB
model code 2010 and AASHTO 2014 model.
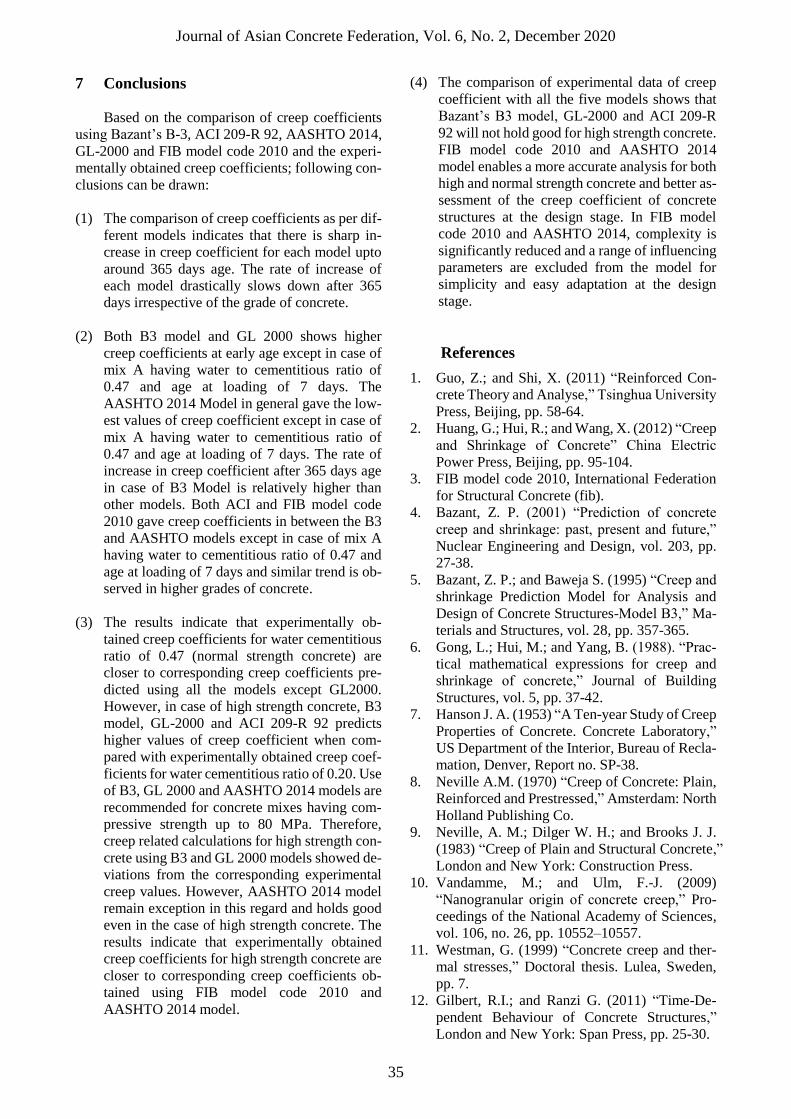
Journal of Asian Concrete Federation, Vol. 6, No. 2, December 2020
35
7 Conclusions
Based on the comparison of creep coefficients
using Bazant’s B-3, ACI 209-R 92, AASHTO 2014,
GL-2000 and FIB model code 2010 and the experi-
mentally obtained creep coefficients; following con-
clusions can be drawn:
(1) The comparison of creep coefficients as per dif-
ferent models indicates that there is sharp in-
crease in creep coefficient for each model upto
around 365 days age. The rate of increase of
each model drastically slows down after 365
days irrespective of the grade of concrete.
(2) Both B3 model and GL 2000 shows higher
creep coefficients at early age except in case of
mix A having water to cementitious ratio of
0.47 and age at loading of 7 days. The
AASHTO 2014 Model in general gave the low-
est values of creep coefficient except in case of
mix A having water to cementitious ratio of
0.47 and age at loading of 7 days. The rate of
increase in creep coefficient after 365 days age
in case of B3 Model is relatively higher than
other models. Both ACI and FIB model code
2010 gave creep coefficients in between the B3
and AASHTO models except in case of mix A
having water to cementitious ratio of 0.47 and
age at loading of 7 days and similar trend is ob-
served in higher grades of concrete.
(3) The results indicate that experimentally ob-
tained creep coefficients for water cementitious
ratio of 0.47 (normal strength concrete) are
closer to corresponding creep coefficients pre-
dicted using all the models except GL2000.
However, in case of high strength concrete, B3
model, GL-2000 and ACI 209-R 92 predicts
higher values of creep coefficient when com-
pared with experimentally obtained creep coef-
ficients for water cementitious ratio of 0.20. Use
of B3, GL 2000 and AASHTO 2014 models are
recommended for concrete mixes having com-
pressive strength up to 80 MPa. Therefore,
creep related calculations for high strength con-
crete using B3 and GL 2000 models showed de-
viations from the corresponding experimental
creep values. However, AASHTO 2014 model
remain exception in this regard and holds good
even in the case of high strength concrete. The
results indicate that experimentally obtained
creep coefficients for high strength concrete are
closer to corresponding creep coefficients ob-
tained using FIB model code 2010 and
AASHTO 2014 model.
(4) The comparison of experimental data of creep
coefficient with all the five models shows that
Bazant’s B3 model, GL-2000 and ACI 209-R
92 will not hold good for high strength concrete.
FIB model code 2010 and AASHTO 2014
model enables a more accurate analysis for both
high and normal strength concrete and better as-
sessment of the creep coefficient of concrete
structures at the design stage. In FIB model
code 2010 and AASHTO 2014, complexity is
significantly reduced and a range of influencing
parameters are excluded from the model for
simplicity and easy adaptation at the design
stage.
References
1. Guo, Z.; and Shi, X. (2011) “Reinforced Con-
crete Theory and Analyse,” Tsinghua University
Press, Beijing, pp. 58-64.
2. Huang, G.; Hui, R.; and Wang, X. (2012) “Creep
and Shrinkage of Concrete” China Electric
Power Press, Beijing, pp. 95-104.
3. FIB model code 2010, International Federation
for Structural Concrete (fib).
4. Bazant, Z. P. (2001) “Prediction of concrete
creep and shrinkage: past, present and future,”
Nuclear Engineering and Design, vol. 203, pp.
27-38.
5. Bazant, Z. P.; and Baweja S. (1995) “Creep and
shrinkage Prediction Model for Analysis and
Design of Concrete Structures-Model B3,” Ma-
terials and Structures, vol. 28, pp. 357-365.
6. Gong, L.; Hui, M.; and Yang, B. (1988). “Prac-
tical mathematical expressions for creep and
shrinkage of concrete,” Journal of Building
Structures, vol. 5, pp. 37-42.
7. Hanson J. A. (1953) “A Ten-year Study of Creep
Properties of Concrete. Concrete Laboratory,”
US Department of the Interior, Bureau of Recla-
mation, Denver, Report no. SP-38.
8. Neville A.M. (1970) “Creep of Concrete: Plain,
Reinforced and Prestressed,” Amsterdam: North
Holland Publishing Co.
9. Neville, A. M.; Dilger W. H.; and Brooks J. J.
(1983) “Creep of Plain and Structural Concrete,”
London and New York: Construction Press.
10. Vandamme, M.; and Ulm, F.-J. (2009)
“Nanogranular origin of concrete creep,” Pro-
ceedings of the National Academy of Sciences,
vol. 106, no. 26, pp. 10552–10557.
11. Westman, G. (1999) “Concrete creep and ther-
mal stresses,” Doctoral thesis. Lulea, Sweden,
pp. 7.
12. Gilbert, R.I.; and Ranzi G. (2011) “Time-De-
pendent Behaviour of Concrete Structures,”
London and New York: Span Press, pp. 25-30.
Journal of Asian Concrete Federation, Vol. 6, No. 2, December 2020
36
13. Gilbert, R.I. (1988) “Time Effects in Concrete
Structures,” Amsterdam: Elsevier Science Pub-
lishers.
14. Janusz, H. (2015) “Conventional Models for
Creep in Normal) and High-Strength Concrete,”
Architecture Civil Engineering Environment
Journal, vol. 8, no. 4, pp.31-38.
15. ACI Committee 211.1 (1991) “Standard Prac-
tice for Selecting Proportions for Normal, Heav-
yweight and Mass Concrete”, American Con-
crete Institute.
16. IS 456:2000, “Plain and reinforced concrete”-
code of practice, BIS New Delhi.
17. Bazant, Z. P.; and Prasannan S. (1989) “Solidi-
fication theory for concrete creep: I. Formula-
tion, and II. Verification and application,”
ASCE Journal of Engineering Mechanics, vol.
115, no. 8, pp. 1691–1725.
18. American Association of State Highway and
Transportation Officials (AASHTO). (2014).
“AASHTO LRFD bridge design specifications,”
American Association of State Highway.
19. ACI Committee 209. (1992). “Prediction of
Creep, Shrinkage, and Temperature Effects in
Concrete Structures,” American Concrete Insti-
tute.
20. Gardner, N. J.; and Zhao, J. W. (1993) “Creep
and shrinkage revisited,” ACI Materials Journal,
vol. 90, no. 3, pp. 236-246.
Journal of Asian Concrete Federation
Vol. 6, No. 2, pp. 37-49, December 2020
ISSN 2465-7964 / eISSN 2465-7972
https://doi.org/10.18702/acf.2020.12.6.2.37
37
Technical Paper
Appraisal of geopolymer lightweight aggregates sintered by
microwave radiations
Nimra Saleem, Khuram Rashid*, Noor Fatima, Sadia Hanif, Ghinwa Naeem, Aamna Aslam,
Miral Fatima, Kiran Aslam
(Received May 15, 2020; Revised November 6, 2020; Accepted December 26, 2020; Published December 31, 2020)
Abstract: This work was designed for the production of geopolymer based lightweight aggregate (LWA)
using industrial by-products. Combination of fly ash (FA) and silica fume (SF) were used as precursors,
whereas, combination of sodium hydroxide and sodium silicate were used as activator. Small amount of
sodium bicarbonate was also used for surface hardening and early strength development. Pellets of dif-
ferent sizes were crafted manually and cured by microwave radiations just for 5 minutes. The physico-
mechanical properties of produced pellets (LWA) were discussed in light of: morphology, density, water
absorption, specific gravity, porosity, aggregate impact value, and particle crushing strength. The prop-
erties of LWA were also compared with literature reported synthetic LWAs cured with different tech-
niques. The water absorption and specific gravity of LWAs were within the specified range provided by
ACI standard. Mechanical strength properties briefed that the produced LWAs were strong enough to
resist compressive load comparable to natural LWAs and many other synthetic LWAs. Thus, proposed
curing method, microwave irradiation, has been found to be a sustainable and fast curing technique than
conventional energy-intensive curing regimes. The results also confirmed that produced LWAs have po-
tential to replace natural LWAs both in cast-in-place and precast concrete elements with possible eco-
nomic, environmental, and technical benefits.
Keywords: Geopolymer lightweight aggregates; geopolymerization; pellets; microwave radiations;
physical and mechanical properties.
1 Introduction
The construction industry is considered to be
one of the most important indicators of economic
state of a country and concrete is the major and most
widely used construction material in civil engineer-
ing field. Bulk concrete production, however, leads
to both environmental pollution and excessive re-
sources consumption [1]. Growing industrial wastes
such as fly ash (FA), ground granulated blast furnace
slag (GBFS), and silica fume (SF) can be utilized as
construction materials, which is considered a healthy
and sustainable practice to dispose the waste off and
conserve the available resources for future genera-
tions [2]. The incorporation of these industrial by-
products as a partial replacement of cement is done
in order to reduce huge CO2 emissions from cement
production [3]. On the other hand, it is well known
that self-weight of concrete structures considerably
influences the design load and economy of structures.
Since, aggregate phase occupies 60-80% of total vol-
ume of concrete [4]. Therefore, the utilization of ar-
tificial LWAs, manufactured from waste and by-
products, in concrete production has attracted signif-
icant research interest. The use of artificial LWAs as
an alternative to natural aggregates not only reduces
the dead load of structures but can also lead to many
positive environmental consequences including (1)
the preservation of natural resources; (2) conserva-
tion of energy required for quarrying processes [5];
Corresponding author Khuram Rashid is an Associate Profes-
sor in the Dept. of Architectural Engineering and Design, Uni-
versity of Engineering and Technology, Lahore, Pakistan.
Nimra Saleem is a student in the Dept. of Architectural Engi-
neering and Design, UET, Lahore, Pakistan.
Noor Fatima is a student in the Dept. of Architectural Engi-
neering and Design, UET, Lahore, Pakistan.
Sadia Hanif is a student in the Dept. of Architectural Engineer-
ing and Design, UET, Lahore, Pakistan.
Ghinwa Naeem is a student in the Dept. of Architectural Engi-
neering and Design, UET, Lahore, Pakistan.
Aamna Aslam is a student in the Dept. of Architectural Engi-
neering and Design, UET, Lahore, Pakistan.
Miral Fatima is a student in the Dept. of Architectural Engi-
neering and Design, UET, Lahore, Pakistan.
Kiran Aslam is a student in the Dept. of Architectural Engi-
neering and Design, UET, Lahore, Pakistan.
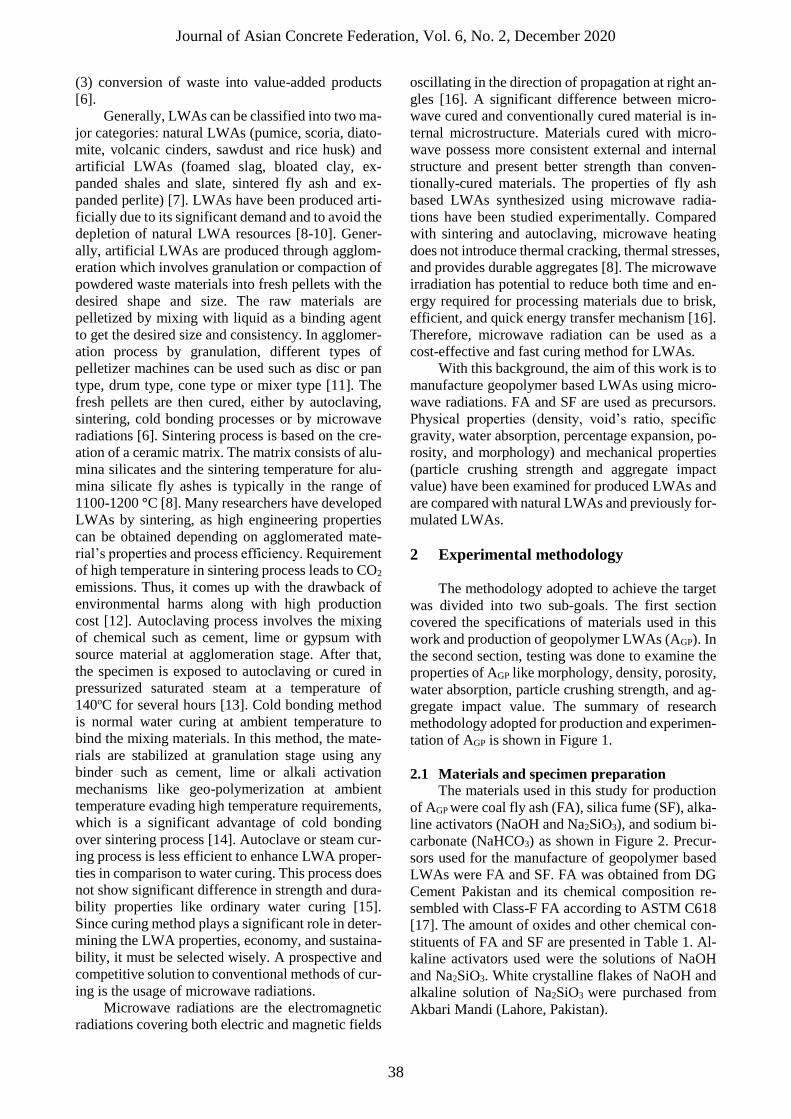
Journal of Asian Concrete Federation, Vol. 6, No. 2, December 2020
38
(3) conversion of waste into value-added products
[6].
Generally, LWAs can be classified into two ma-
jor categories: natural LWAs (pumice, scoria, diato-
mite, volcanic cinders, sawdust and rice husk) and
artificial LWAs (foamed slag, bloated clay, ex-
panded shales and slate, sintered fly ash and ex-
panded perlite) [7]. LWAs have been produced arti-
ficially due to its significant demand and to avoid the
depletion of natural LWA resources [8-10]. Gener-
ally, artificial LWAs are produced through agglom-
eration which involves granulation or compaction of
powdered waste materials into fresh pellets with the
desired shape and size. The raw materials are
pelletized by mixing with liquid as a binding agent
to get the desired size and consistency. In agglomer-
ation process by granulation, different types of
pelletizer machines can be used such as disc or pan
type, drum type, cone type or mixer type [11]. The
fresh pellets are then cured, either by autoclaving,
sintering, cold bonding processes or by microwave
radiations [6]. Sintering process is based on the cre-
ation of a ceramic matrix. The matrix consists of alu-
mina silicates and the sintering temperature for alu-
mina silicate fly ashes is typically in the range of
1100-1200 °C [8]. Many researchers have developed
LWAs by sintering, as high engineering properties
can be obtained depending on agglomerated mate-
rial’s properties and process efficiency. Requirement
of high temperature in sintering process leads to CO2
emissions. Thus, it comes up with the drawback of
environmental harms along with high production
cost [12]. Autoclaving process involves the mixing
of chemical such as cement, lime or gypsum with
source material at agglomeration stage. After that,
the specimen is exposed to autoclaving or cured in
pressurized saturated steam at a temperature of
140oC for several hours [13]. Cold bonding method
is normal water curing at ambient temperature to
bind the mixing materials. In this method, the mate-
rials are stabilized at granulation stage using any
binder such as cement, lime or alkali activation
mechanisms like geo-polymerization at ambient
temperature evading high temperature requirements,
which is a significant advantage of cold bonding
over sintering process [14]. Autoclave or steam cur-
ing process is less efficient to enhance LWA proper-
ties in comparison to water curing. This process does
not show significant difference in strength and dura-
bility properties like ordinary water curing [15].
Since curing method plays a significant role in deter-
mining the LWA properties, economy, and sustaina-
bility, it must be selected wisely. A prospective and
competitive solution to conventional methods of cur-
ing is the usage of microwave radiations.
Microwave radiations are the electromagnetic
radiations covering both electric and magnetic fields
oscillating in the direction of propagation at right an-
gles [16]. A significant difference between micro-
wave cured and conventionally cured material is in-
ternal microstructure. Materials cured with micro-
wave possess more consistent external and internal
structure and present better strength than conven-
tionally-cured materials. The properties of fly ash
based LWAs synthesized using microwave radia-
tions have been studied experimentally. Compared
with sintering and autoclaving, microwave heating
does not introduce thermal cracking, thermal stresses,
and provides durable aggregates [8]. The microwave
irradiation has potential to reduce both time and en-
ergy required for processing materials due to brisk,
efficient, and quick energy transfer mechanism [16].
Therefore, microwave radiation can be used as a
cost-effective and fast curing method for LWAs.
With this background, the aim of this work is to
manufacture geopolymer based LWAs using micro-
wave radiations. FA and SF are used as precursors.
Physical properties (density, void’s ratio, specific
gravity, water absorption, percentage expansion, po-
rosity, and morphology) and mechanical properties
(particle crushing strength and aggregate impact
value) have been examined for produced LWAs and
are compared with natural LWAs and previously for-
mulated LWAs.
2 Experimental methodology
The methodology adopted to achieve the target
was divided into two sub-goals. The first section
covered the specifications of materials used in this
work and production of geopolymer LWAs (AGP). In
the second section, testing was done to examine the
properties of AGP like morphology, density, porosity,
water absorption, particle crushing strength, and ag-
gregate impact value. The summary of research
methodology adopted for production and experimen-
tation of AGP is shown in Figure 1.
2.1 Materials and specimen preparation
The materials used in this study for production
of AGP were coal fly ash (FA), silica fume (SF), alka-
line activators (NaOH and Na2SiO3), and sodium bi-
carbonate (NaHCO3) as shown in Figure 2. Precur-
sors used for the manufacture of geopolymer based
LWAs were FA and SF. FA was obtained from DG
Cement Pakistan and its chemical composition re-
sembled with Class-F FA according to ASTM C618
[17]. The amount of oxides and other chemical con-
stituents of FA and SF are presented in Table 1. Al-
kaline activators used were the solutions of NaOH
and Na2SiO3. White crystalline flakes of NaOH and
alkaline solution of Na2SiO3 were purchased from
Akbari Mandi (Lahore, Pakistan).

Journal of Asian Concrete Federation, Vol. 6, No. 2, December 2020
39
Fig. 1 – Curing condition II and III
Fig. 2 – Materials used in research work: (a) FA, (b) SF, (c) NaHCO3, (d) NaOH, (e) Na2SiO3
400g of NaOH pellets were used to prepare 1
liter of 10M NaOH solution. NaHCO3 (baking soda)
having molecular mass of 84g/mol and density of 2.1
g/cm3 was used for surface hardening of aggregates,
which acts as an accelerator to decrease the setting
time of geopolymer paste [18]. The selection of mix
proportion for the production of AGP was based on hit
and trial method and on previous research
knowledge. The proportion of the AGP for three types
of pellets have been mentioned in Table 2. FA and
SF were used in amounts of 90% and 10% of total
weight of solid materials, respectively. 1% NaHCO3
of solid materials was used as an accelerator. One
mixture was selected (FA20-80SF) and their corre-
sponding properties were investigated in detail. Mix-
ture of two alkaline solutions, 10M NaOH and
Na2SiO3, was used such that the ratio of two solu-
tions (NaOH/Na2SiO3) was kept 0.25. The alkaline
activator to solid ratio selected was equal to 0.53.
Calculated amounts of materials were dry
mixed first for about 1-2 minutes. Further mixing
was carried out for 1-2 minutes on adding 50% of the
alkaline solution. After that, the remaining half of the
alkaline solution was added, and the mixing was con-
tinued for the same duration in order to ensure fine
blending.
Table 1 – Composition of oxides present in FA and SF
Material Oxides (%) Cl LOI Moiture
Content
CaO SiO2 Al2O3 MgO Fe2O3 K2O Na2O (%) (%) (%)
FA 9.02 56.34 23.08 1.70 6.43 0.56 0.28 0.025 < 3 < 1
SF 0.27 93.65 0.28 0.25 0.58 0.49 0.02 3.62 <5 -
Manual Mixing/Homogenization
Hand Crafting (Pellet Shape)
Drying at Room Temperature
Microwave Curing (5 min)
Materials: FA, SF, NaHCO3, Alkaline Activators (NaOH and Na2SiO3)
Composition: NaOH/ Na2SiO3 = 0.25Activator/Solid = 0.53
LWA Sample
2. Testing
Mechanical Properties:• Particle Crushing Strength• Aggregate Impact Value
Physical Properties:• Water Absorption• Specific Gravity• Percentage Expansion
• Morphology • Bulk Density• Porosity
1. LWA Production
(a) (b) (c) (d) (e)
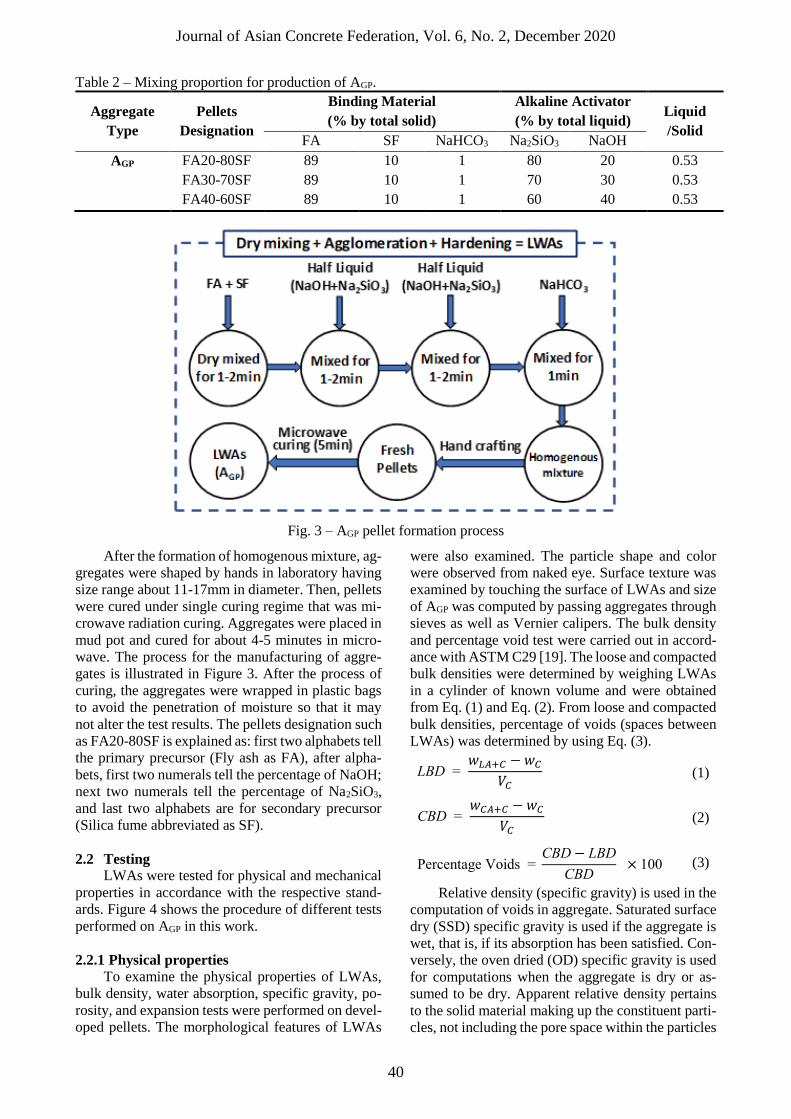
Journal of Asian Concrete Federation, Vol. 6, No. 2, December 2020
40
Table 2 – Mixing proportion for production of AGP.
Aggregate
Type
Pellets
Designation
Binding Material
(% by total solid)
Alkaline Activator
(% by total liquid) Liquid
/Solid FA SF NaHCO3 Na2SiO3 NaOH
AGP FA20-80SF 89 10 1 80 20 0.53
FA30-70SF 89 10 1 70 30 0.53
FA40-60SF 89 10 1 60 40 0.53
Fig. 3 – AGP pellet formation process
After the formation of homogenous mixture, ag-
gregates were shaped by hands in laboratory having
size range about 11-17mm in diameter. Then, pellets
were cured under single curing regime that was mi-
crowave radiation curing. Aggregates were placed in
mud pot and cured for about 4-5 minutes in micro-
wave. The process for the manufacturing of aggre-
gates is illustrated in Figure 3. After the process of
curing, the aggregates were wrapped in plastic bags
to avoid the penetration of moisture so that it may
not alter the test results. The pellets designation such
as FA20-80SF is explained as: first two alphabets tell
the primary precursor (Fly ash as FA), after alpha-
bets, first two numerals tell the percentage of NaOH;
next two numerals tell the percentage of Na2SiO3,
and last two alphabets are for secondary precursor
(Silica fume abbreviated as SF).
2.2 Testing
LWAs were tested for physical and mechanical
properties in accordance with the respective stand-
ards. Figure 4 shows the procedure of different tests
performed on AGP in this work.
2.2.1 Physical properties
To examine the physical properties of LWAs,
bulk density, water absorption, specific gravity, po-
rosity, and expansion tests were performed on devel-
oped pellets. The morphological features of LWAs
were also examined. The particle shape and color
were observed from naked eye. Surface texture was
examined by touching the surface of LWAs and size
of AGP was computed by passing aggregates through
sieves as well as Vernier calipers. The bulk density
and percentage void test were carried out in accord-
ance with ASTM C29 [19]. The loose and compacted
bulk densities were determined by weighing LWAs
in a cylinder of known volume and were obtained
from Eq. (1) and Eq. (2). From loose and compacted
bulk densities, percentage of voids (spaces between
LWAs) was determined by using Eq. (3).
LBD = 𝑤𝐿𝐴+𝐶 − 𝑤𝐶
𝑉𝐶 (1)
CBD = 𝑤𝐶𝐴+𝐶 − 𝑤𝐶
𝑉𝐶 (2)
Percentage Voids = CBD − LBD
CBD × 100 (3)
Relative density (specific gravity) is used in the
computation of voids in aggregate. Saturated surface
dry (SSD) specific gravity is used if the aggregate is
wet, that is, if its absorption has been satisfied. Con-
versely, the oven dried (OD) specific gravity is used
for computations when the aggregate is dry or as-
sumed to be dry. Apparent relative density pertains
to the solid material making up the constituent parti-
cles, not including the pore space within the particles
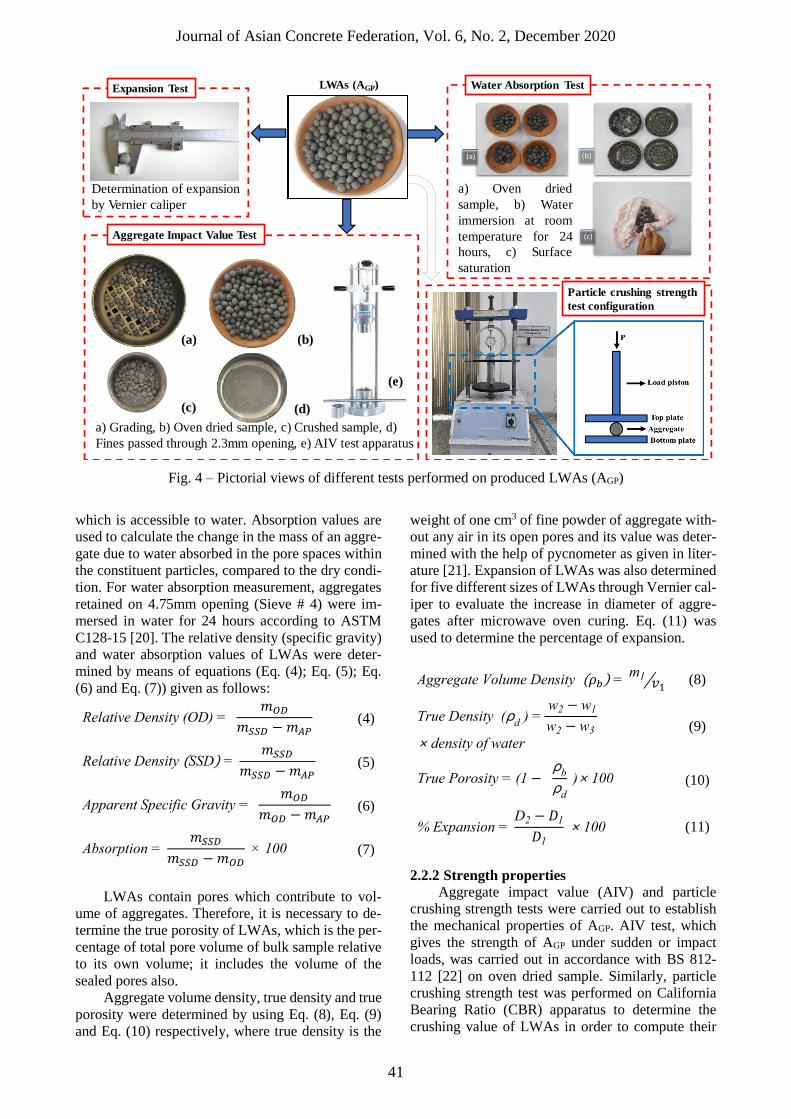
Journal of Asian Concrete Federation, Vol. 6, No. 2, December 2020
41
Fig. 4 – Pictorial views of different tests performed on produced LWAs (AGP)
which is accessible to water. Absorption values are
used to calculate the change in the mass of an aggre-
gate due to water absorbed in the pore spaces within
the constituent particles, compared to the dry condi-
tion. For water absorption measurement, aggregates
retained on 4.75mm opening (Sieve # 4) were im-
mersed in water for 24 hours according to ASTM
C128-15 [20]. The relative density (specific gravity)
and water absorption values of LWAs were deter-
mined by means of equations (Eq. (4); Eq. (5); Eq.
(6) and Eq. (7)) given as follows:
Relative Density (OD) = 𝑚𝑂𝐷
𝑚𝑆𝑆𝐷 − 𝑚𝐴𝑃 (4)
Relative Density (SSD) = 𝑚𝑆𝑆𝐷
𝑚𝑆𝑆𝐷 − 𝑚𝐴𝑃 (5)
Apparent Specific Gravity = 𝑚𝑂𝐷
𝑚𝑂𝐷 − 𝑚𝐴𝑃 (6)
Absorption = 𝑚𝑆𝑆𝐷
𝑚𝑆𝑆𝐷 − 𝑚𝑂𝐷 × 100 (7)
LWAs contain pores which contribute to vol-
ume of aggregates. Therefore, it is necessary to de-
termine the true porosity of LWAs, which is the per-
centage of total pore volume of bulk sample relative
to its own volume; it includes the volume of the
sealed pores also.
Aggregate volume density, true density and true
porosity were determined by using Eq. (8), Eq. (9)
and Eq. (10) respectively, where true density is the
weight of one cm3 of fine powder of aggregate with-
out any air in its open pores and its value was deter-
mined with the help of pycnometer as given in liter-
ature [21]. Expansion of LWAs was also determined
for five different sizes of LWAs through Vernier cal-
iper to evaluate the increase in diameter of aggre-
gates after microwave oven curing. Eq. (11) was
used to determine the percentage of expansion.
Aggregate Volume Density (𝜌𝑏) = m1
𝑣1⁄ (8)
True Density (ρd ) =
w2 − w1
w2 − w3
× density of water
(9)
True Porosity = (1 − ρ
b
ρd
)× 100 (10)
% Expansion = D2 − 𝐷1
𝐷1
× 100 (11)
2.2.2 Strength properties
Aggregate impact value (AIV) and particle
crushing strength tests were carried out to establish
the mechanical properties of AGP. AIV test, which
gives the strength of AGP under sudden or impact
loads, was carried out in accordance with BS 812-
112 [22] on oven dried sample. Similarly, particle
crushing strength test was performed on California
Bearing Ratio (CBR) apparatus to determine the
crushing value of LWAs in order to compute their
(a) (b)
(c) (d)
(e)
(a) (b)
(c) (d)
(e)
a) Grading, b) Oven dried sample, c) Crushed sample, d)
Fines passed through 2.3mm opening, e) AIV test apparatus
Aggregate Impact Value Test
Expansion Test LWAs (AGP)
(a) (b)
Determination of expansion
by Vernier caliper
a) Oven dried
sample, b) Water
immersion at room
temperature for 24
hours, c) Surface
saturation
Water Absorption Test
(c)
Particle crushing strength
test configuration
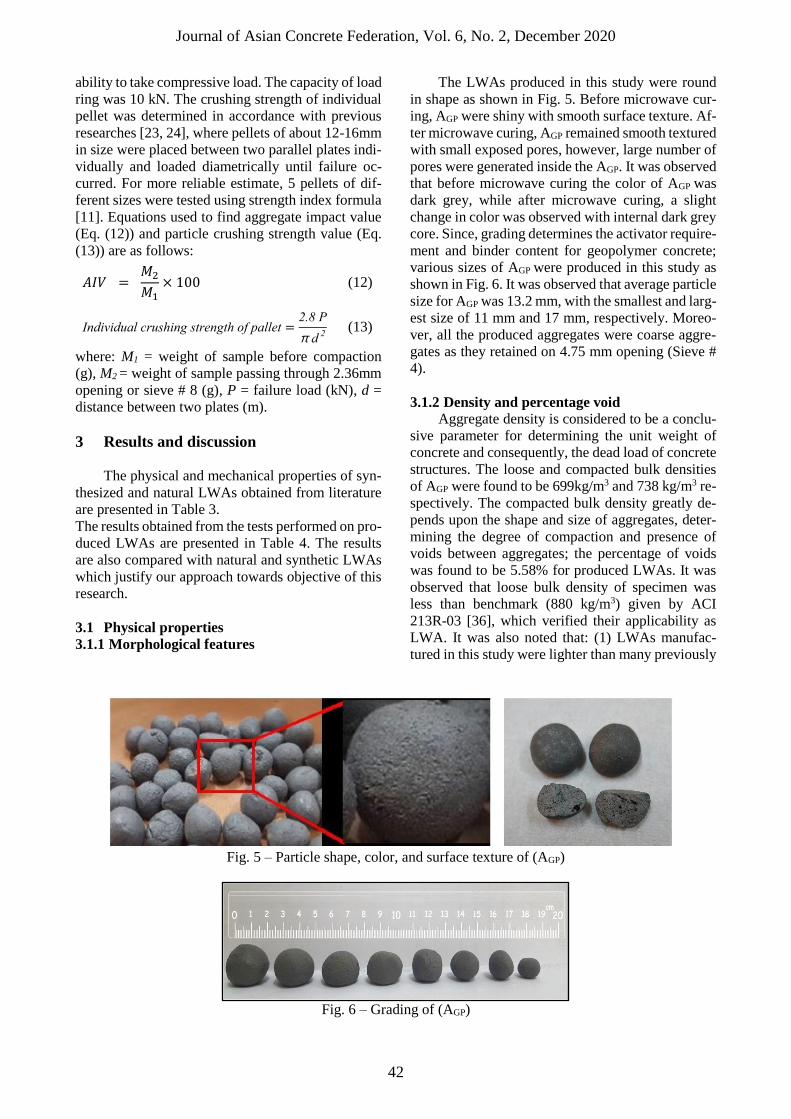
Journal of Asian Concrete Federation, Vol. 6, No. 2, December 2020
42
ability to take compressive load. The capacity of load
ring was 10 kN. The crushing strength of individual
pellet was determined in accordance with previous
researches [23, 24], where pellets of about 12-16mm
in size were placed between two parallel plates indi-
vidually and loaded diametrically until failure oc-
curred. For more reliable estimate, 5 pellets of dif-
ferent sizes were tested using strength index formula
[11]. Equations used to find aggregate impact value
(Eq. (12)) and particle crushing strength value (Eq.
(13)) are as follows:
𝐴𝐼𝑉 = 𝑀2
𝑀1× 100 (12)
Individual crushing strength of pallet =2.8 P
π d 2
(13)
where: M1 = weight of sample before compaction
(g), M2 = weight of sample passing through 2.36mm
opening or sieve # 8 (g), P = failure load (kN), d =
distance between two plates (m).
3 Results and discussion
The physical and mechanical properties of syn-
thesized and natural LWAs obtained from literature
are presented in Table 3.
The results obtained from the tests performed on pro-
duced LWAs are presented in Table 4. The results
are also compared with natural and synthetic LWAs
which justify our approach towards objective of this
research.
3.1 Physical properties
3.1.1 Morphological features
The LWAs produced in this study were round
in shape as shown in Fig. 5. Before microwave cur-
ing, AGP were shiny with smooth surface texture. Af-
ter microwave curing, AGP remained smooth textured
with small exposed pores, however, large number of
pores were generated inside the AGP. It was observed
that before microwave curing the color of AGP was
dark grey, while after microwave curing, a slight
change in color was observed with internal dark grey
core. Since, grading determines the activator require-
ment and binder content for geopolymer concrete;
various sizes of AGP were produced in this study as
shown in Fig. 6. It was observed that average particle
size for AGP was 13.2 mm, with the smallest and larg-
est size of 11 mm and 17 mm, respectively. Moreo-
ver, all the produced aggregates were coarse aggre-
gates as they retained on 4.75 mm opening (Sieve #
4).
3.1.2 Density and percentage void
Aggregate density is considered to be a conclu-
sive parameter for determining the unit weight of
concrete and consequently, the dead load of concrete
structures. The loose and compacted bulk densities
of AGP were found to be 699kg/m3 and 738 kg/m3 re-
spectively. The compacted bulk density greatly de-
pends upon the shape and size of aggregates, deter-
mining the degree of compaction and presence of
voids between aggregates; the percentage of voids
was found to be 5.58% for produced LWAs. It was
observed that loose bulk density of specimen was
less than benchmark (880 kg/m3) given by ACI
213R-03 [36], which verified their applicability as
LWA. It was also noted that: (1) LWAs manufac-
tured in this study were lighter than many previously
Fig. 5 – Particle shape, color, and surface texture of (AGP)
Fig. 6 – Grading of (AGP)

Journal of Asian Concrete Federation, Vol. 6, No. 2, December 2020
43
Table 3 – Raw materials, binders, physical and mechanical properties of natural and synthetic LWAs briefed
in literature
Ref. Binder Alkaline
Activators
Size LBD WA SG PCS AIV Curing
Method
(mm) (kg/m3) (%) OD SSD (MPa) (%)
[11] FA + Me-
takaolin
NaOH (8M) 12 794 29.75 1.16 1.50 2.07 (12mm),
2.03 (10mm)
---- Cold
bonding
[11] FA +
Bentonite
NaOH (8M) 14 867 30.90 1.49 1.96 3.26. (14mm),
2.96 (16mm)
---- Cold
bonding
[25]
FA +
Cement
---- 4-12.5 840
15.00 1.46 8.7 ---- Sintering at
(>900oC)
[26] FA +
Cement
---- ---- 830 16.80 1.40 ---- 27.78 Sintering at
(1000-
1200oC)
[27] FA +
Cement
NaOH,
Na2SiO3
8.125 878 20.25 ---- ---- 22.10 Oven
curing at
70oC
for 24 h
[27] FA +
GBFS
NaOH,
Na2SiO3
8.125 809 28.30 ---- ---- 27.90 Cold
bonding
[28] FA NaOH,
Na2SiO3
9.5-19 789 25.50 1.30 1.63 3.70 ---- Cold
bonding
[28] FA NaOH,
Na2SiO3
9.5-19 933 0.70 1.56 1.57 12 ---- Sintering
[10] FA NaOH,
Na2SiO3
8-10 783 18.19 ---- ---- ---- ---- Sintering
[28] FA NaOH,
Na2SiO3
9.5-19 936 0.70 1.59 1.60 9.60 ---- Cold
bonding
[29] FA +
GBFS
NaOH,
Na2SiO3
10-20 903 10.60 ---- 5.70 ---- Cold
bonding
[29] FA +
GBFS
NaOH,
Na2SiO3
10-20 1002 8.30 ---- 15.50 ---- Cold
bonding
[30] BA + Ce-
ment
---- ---- 938 25.00 1.48 4.00 35.70 Sintering
[30] BA + Ce-
ment
---- ---- 1017 21.50 1.57 5.35 29.20 Sintering
[31] FA + Ben-
tonite
---- ---- 933 0.7 1.56 12 28.00 Cold
bonding
[31] FA + Glass
powder
---- ---- 936 0.7 1.59 9.6 30.00 Cold
bonding
[32] Diatomite ---- 500 7.6 ---- ---- ---- Natural
[33] Pumice ---- 475 25.00 0.80 ---- ---- Natural
[33] Expanded perlite ---- 40 70.00 2.20 ---- ---- Natural
[34] Pumice ---- 0.82-2.17 1.49-1.96 ---- Natural
[26] Natural LWA ---- 1490 0.90 2.65 ---- 15.63 Natural
[35] Calcined diatomite
aggregate
4.75-
12.5
417 112.0 2.45 ---- ---- Natural
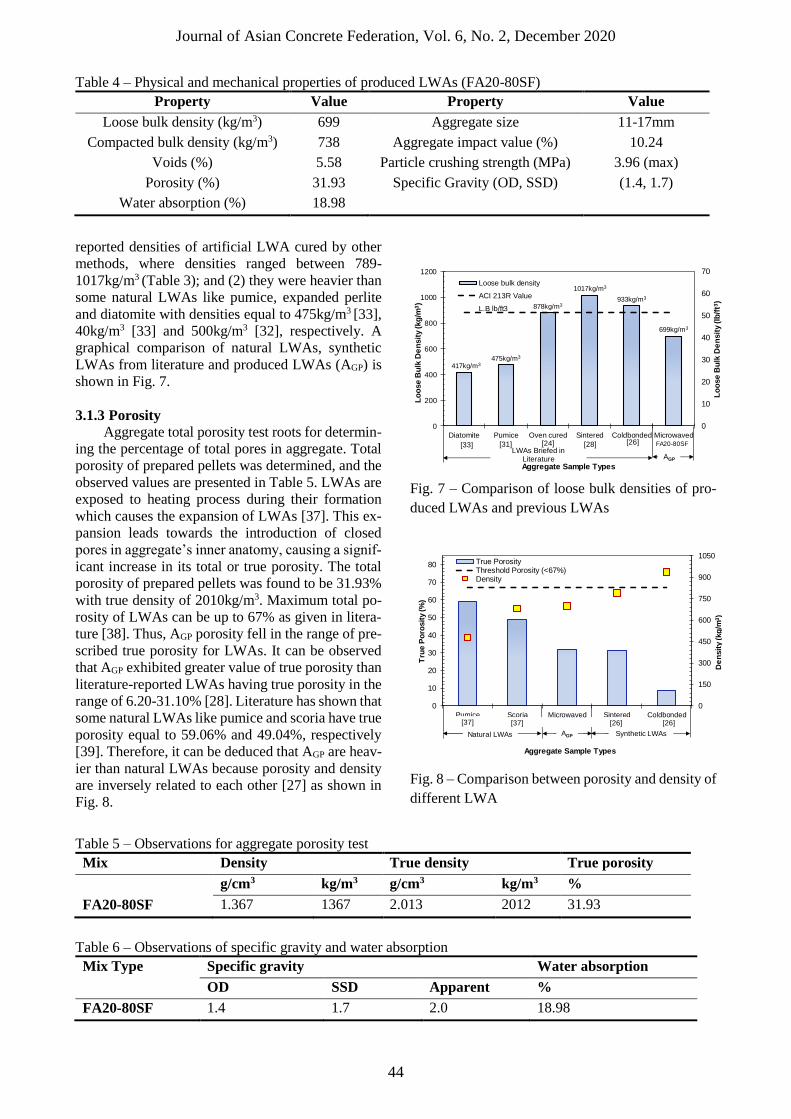
Journal of Asian Concrete Federation, Vol. 6, No. 2, December 2020
44
Table 4 – Physical and mechanical properties of produced LWAs (FA20-80SF)
Property Value Property Value
Loose bulk density (kg/m3) 699 Aggregate size 11-17mm
Compacted bulk density (kg/m3) 738 Aggregate impact value (%) 10.24
Voids (%) 5.58 Particle crushing strength (MPa) 3.96 (max)
Porosity (%) 31.93 Specific Gravity (OD, SSD) (1.4, 1.7)
Water absorption (%) 18.98
reported densities of artificial LWA cured by other
methods, where densities ranged between 789-
1017kg/m3 (Table 3); and (2) they were heavier than
some natural LWAs like pumice, expanded perlite
and diatomite with densities equal to 475kg/m3 [33],
40kg/m3 [33] and 500kg/m3 [32], respectively. A
graphical comparison of natural LWAs, synthetic
LWAs from literature and produced LWAs (AGP) is
shown in Fig. 7.
3.1.3 Porosity
Aggregate total porosity test roots for determin-
ing the percentage of total pores in aggregate. Total
porosity of prepared pellets was determined, and the
observed values are presented in Table 5. LWAs are
exposed to heating process during their formation
which causes the expansion of LWAs [37]. This ex-
pansion leads towards the introduction of closed
pores in aggregate’s inner anatomy, causing a signif-
icant increase in its total or true porosity. The total
porosity of prepared pellets was found to be 31.93%
with true density of 2010kg/m3. Maximum total po-
rosity of LWAs can be up to 67% as given in litera-
ture [38]. Thus, AGP porosity fell in the range of pre-
scribed true porosity for LWAs. It can be observed
that AGP exhibited greater value of true porosity than
literature-reported LWAs having true porosity in the
range of 6.20-31.10% [28]. Literature has shown that
some natural LWAs like pumice and scoria have true
porosity equal to 59.06% and 49.04%, respectively
[39]. Therefore, it can be deduced that AGP are heav-
ier than natural LWAs because porosity and density
are inversely related to each other [27] as shown in
Fig. 8.
Fig. 7 – Comparison of loose bulk densities of pro-
duced LWAs and previous LWAs
Fig. 8 – Comparison between porosity and density of
different LWA
Table 5 – Observations for aggregate porosity test
Mix Density True density True porosity
g/cm3 kg/m3 g/cm3 kg/m3 %
FA20-80SF 1.367 1367 2.013 2012 31.93
Table 6 – Observations of specific gravity and water absorption
Mix Type Specific gravity Water absorption
OD SSD Apparent %
FA20-80SF 1.4 1.7 2.0 18.98
417kg/m3475kg/m3
878kg/m3
1017kg/m3
933kg/m3
699kg/m3
0
10
20
30
40
50
60
70
0
200
400
600
800
1000
1200
Diatomite Pumice Oven cured Sintered Coldbonded Microwaved
Lo
ose
Bu
lk D
en
sit
y (l
b/f
t3)
Lo
ose
Bu
lk D
en
sit
y (k
g/m
3)
Aggregate Sample Types
Loose bulk density
ACI 213R Value
L.B lb/ft3
LWAs Briefed in Literature AGP
[33] [31] [24] [28] FA20-80SF[26]
0
150
300
450
600
750
900
1050
0
10
20
30
40
50
60
70
80
Pumice Scoria Microwaved Sintered ColdbondedD
en
sit
y (k
g/m
3)
Tru
e P
oro
sit
y (%
)
Aggregate Sample Types
True PorosityThreshold Porosity (<67%)Density
AGP Synthetic LWAsNatural LWAs
[37] [37] [26] [26]

Journal of Asian Concrete Federation, Vol. 6, No. 2, December 2020
45
3.1.4 Water absorption and specific gravity
Water absorption (WA) of prepared pellets with
different aggregate sizes ranging between 11-17mm
was calculated after 24 h immersion in water, and the
observations are presented in Table 6. The WA of
AGP was found to be 18.98% which was within the
normal range for LWAs (<25%) in accordance with
ACI-213R [36]. It was observed that WA of many
previously synthesized LWAs lies in the range of
0.70-30.90% as shown in Figure 9. It was seen that
AGP exhibited lesser WA and higher density as com-
pared to the natural LWAs like expanded perlite and
pumice, as their WA values were equal to 70.00%
and 25%, respectively [33]. Thus, more water ab-
sorption of aggregates is associated to lesser density
of aggregates, which is an indication of porous mi-
crostructure as shown in Figure 10. However, most
of the commercial artificial LWAs exhibit water ab-
sorption within 10-18% [40].
Specific gravities (oven dry (OD), saturated sur-
face dry (SSD) and apparent) of AGP were calculated
using Eq. (4), Eq. (5) and Eq. (6), respectively. Spe-
cific gravity (OD) of AGP was found to be 1.4 which
was within the range of 1.16-1.59 of literature-re-
ported synthetic LWAs as shown in Table 3. Accord-
Fig. 9 – Comparison of water absorption of produced
LWAs and previous LWAs
Fig. 10 – Comparison between water absorption and
density of various LWAs
ing to ACI-213R [36], the specific gravity of LWAs
is 1/3 to 2/3 of normal weight aggregates. So, the
manufactured LWAs fulfill the requirements of
AC1-213R. AGP showed greater specific gravity as
compared to natural LWA (pumice) having specific
gravity (OD) equal to 0.82 [34]; concluding, natural
LWAs exhibit lower specific gravities as compared
with synthetic ones as evident from Figure 11.
3.2 Mechanical properties
3.2.1 Particle crushing strength
Particle crushing strength test was conducted on a
range of produced LWAs (13-17mm) as shown in
Table 7. The highest crushing strength of 3.96 MPa
was recorded for particle size of 15mm. It was ob-
served that particle crushing strength increased as the
size of aggregate increased. However, inconsistency
was witnessed in predicting the trend for particle size
of 17mm, which might be there due to non-uni-
formity of particle shape. It was examined that parti-
cle crushing strength of produced LWAs fell in the
range of 2.03-12.00 MPa observed for literature-re-
ported LWAs with particle sizes ranging between
10-20mm as shown in Table 3. In addition, particle
crushing strength of produced LWAs was greater
than that of natural LWAs (1.49-1.96 MPa) [26]. As
natural LWAs (lighter in nature) have lesser strength
thus, it can be deduced conclusively that density and
strength are directly related with each other as shown
in Figure 12.
Fig. 11 – Comparison between specific gravity and
density of LWAs
Table 7 – Observations of particle crushing strength
test
Particle size Aggregate strength
(mm) (MPa)
13 3.66
14 3.94
15 3.96
17 3.08
7.6%
25.0%
20.2%
16.8%
25.5%
18.98%
0
5
10
15
20
25
30
35
Diatomite Pumice Oven cured Sintered Coldbonded Microwaved
Wate
r A
bso
rpti
on
(%
)
Aggregate Sample Types
Water Absorption (%)
ACI 213R Value (<25%)
[31]LWAs Briefed in
LiteratureAGP
[30] [25] [24] [26] FA20-80SF
300
400
500
600
700
800
900
1000
5
10
15
20
25
30
35
Coldbonded Sintered Sintered Microwaved Pumice
De
nsit
y (k
g/m
3)
Wate
r A
bso
rtio
n (
%)
Aggregate Sample Types
Water Absorption
Loose bulk density
Synthetic LWAs AGPNatural
LWA
[9] [32][27] [24] FA20-80SF
1.59 1.561.49
1.4
0.8
300
400
500
600
700
800
900
1000
0.1
0.3
0.5
0.7
0.9
1.1
1.3
1.5
1.7
1.9
Coldbonded Sintered Coldbonded Microwaved Pumice
De
nsit
y (
kg
/m3)
Sp
ecif
ic G
rav
ity
Aggregate Sample Types
Specific Gravity
Density
[32]
Synthetic LWAs AGPNatural
LWA
[26] [26] [10] FA20-80SF
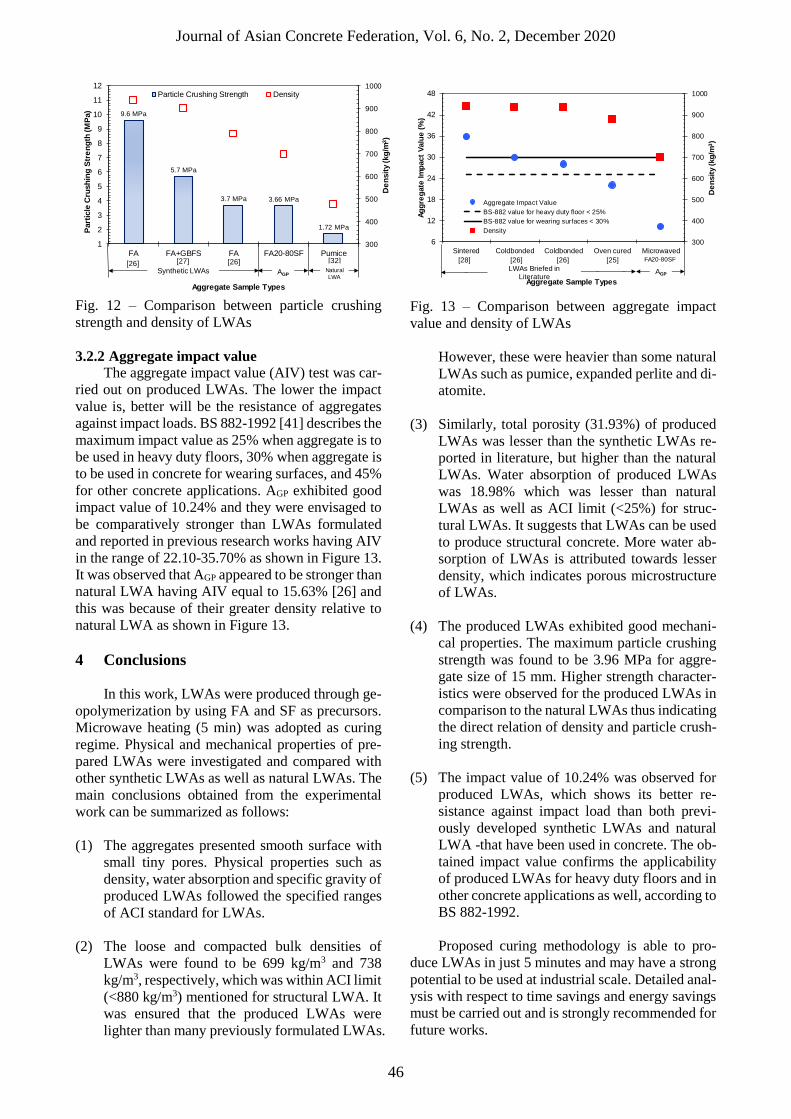
Journal of Asian Concrete Federation, Vol. 6, No. 2, December 2020
46
Fig. 12 – Comparison between particle crushing
strength and density of LWAs
3.2.2 Aggregate impact value
The aggregate impact value (AIV) test was car-
ried out on produced LWAs. The lower the impact
value is, better will be the resistance of aggregates
against impact loads. BS 882-1992 [41] describes the
maximum impact value as 25% when aggregate is to
be used in heavy duty floors, 30% when aggregate is
to be used in concrete for wearing surfaces, and 45%
for other concrete applications. AGP exhibited good
impact value of 10.24% and they were envisaged to
be comparatively stronger than LWAs formulated
and reported in previous research works having AIV
in the range of 22.10-35.70% as shown in Figure 13.
It was observed that AGP appeared to be stronger than
natural LWA having AIV equal to 15.63% [26] and
this was because of their greater density relative to
natural LWA as shown in Figure 13.
4 Conclusions
In this work, LWAs were produced through ge-
opolymerization by using FA and SF as precursors.
Microwave heating (5 min) was adopted as curing
regime. Physical and mechanical properties of pre-
pared LWAs were investigated and compared with
other synthetic LWAs as well as natural LWAs. The
main conclusions obtained from the experimental
work can be summarized as follows:
(1) The aggregates presented smooth surface with
small tiny pores. Physical properties such as
density, water absorption and specific gravity of
produced LWAs followed the specified ranges
of ACI standard for LWAs.
(2) The loose and compacted bulk densities of
LWAs were found to be 699 kg/m3 and 738
kg/m3, respectively, which was within ACI limit
(<880 kg/m3) mentioned for structural LWA. It
was ensured that the produced LWAs were
lighter than many previously formulated LWAs.
Fig. 13 – Comparison between aggregate impact
value and density of LWAs
However, these were heavier than some natural
LWAs such as pumice, expanded perlite and di-
atomite.
(3) Similarly, total porosity (31.93%) of produced
LWAs was lesser than the synthetic LWAs re-
ported in literature, but higher than the natural
LWAs. Water absorption of produced LWAs
was 18.98% which was lesser than natural
LWAs as well as ACI limit (<25%) for struc-
tural LWAs. It suggests that LWAs can be used
to produce structural concrete. More water ab-
sorption of LWAs is attributed towards lesser
density, which indicates porous microstructure
of LWAs.
(4) The produced LWAs exhibited good mechani-
cal properties. The maximum particle crushing
strength was found to be 3.96 MPa for aggre-
gate size of 15 mm. Higher strength character-
istics were observed for the produced LWAs in
comparison to the natural LWAs thus indicating
the direct relation of density and particle crush-
ing strength.
(5) The impact value of 10.24% was observed for
produced LWAs, which shows its better re-
sistance against impact load than both previ-
ously developed synthetic LWAs and natural
LWA -that have been used in concrete. The ob-
tained impact value confirms the applicability
of produced LWAs for heavy duty floors and in
other concrete applications as well, according to
BS 882-1992.
Proposed curing methodology is able to pro-
duce LWAs in just 5 minutes and may have a strong
potential to be used at industrial scale. Detailed anal-
ysis with respect to time savings and energy savings
must be carried out and is strongly recommended for
future works.
9.6 MPa
5.7 MPa
3.7 MPa 3.66 MPa
1.72 MPa
300
400
500
600
700
800
900
1000
1
2
3
4
5
6
7
8
9
10
11
12
FA FA+GBFS FA FA20-80SF Pumice
De
nsit
y (
kg
/m3)
Part
icle
Cru
sh
ing
Str
en
gth
(M
Pa)
Aggregate Sample Types
Particle Crushing Strength Density
[26] [32]
Synthetic LWAs AGPNatural
LWA
[26] [27]
300
400
500
600
700
800
900
1000
6
12
18
24
30
36
42
48
Sintered Coldbonded Coldbonded Oven cured Microwaved
De
nsit
y (k
g/m
3)
Ag
gre
gate
Im
pact
Valu
e (
%)
Aggregate Sample Types
Aggregate Impact Value
BS-882 value for heavy duty floor < 25%
BS-882 value for wearing surfaces < 30%
Density
LWAs Briefed in Literature
AGP
[28] [26] [26] [25] FA20-80SF

Journal of Asian Concrete Federation, Vol. 6, No. 2, December 2020
47
List of Abbreviations
LWA Lightweight aggregate
FA Fly ash
SF Silica fume
GBFS Ground granulated blast furnace slag
AGP Geopolymer light weight aggregates
LBD Loose bulk density (kg/m3)
CBD Compacted bulk density (kg/m3)
SSD Saturated surface dry
OD Oven dry
Cl Chlorine (%)
LOI Loss on ignition (%)
𝑤𝐿𝐴+𝐶 Weight of loose aggregate and con-
tainer (g)
𝑤𝐶𝐴+𝐶 Weight of compacted aggregate and
container (g)
𝑤𝐿𝐴 Weight of loose aggregate (g)
𝑤𝐶𝐴 Weight of compacted aggregate (g)
𝑤𝐶 Weight of empty container (g)
𝑉𝐶 Volume of container (m3)
𝑚𝑂𝐷 Mass of oven dry test sample in air (g)
𝑚𝑆𝑆𝐷 Mass of surface saturated dry test
sample in air (g)
𝑚𝐴𝑃 Apparent mass of saturated test sam-
ple in water (g)
m1 Mass of single aggregate (g)
v1 Volume of single aggregate having
external pores with access of water
and internal pores without access of
water (m3)
w1 Weight of pycnometer filled with wa-
ter (g)
w2 Weight of pycnometer filled with wa-
ter and fine powder aggregate sample
(g)
w3 Weight of pycnometer filled with fine
powder aggregate sample and water
(g)
D1 Diameter of aggregate before curing
(mm)
D2 Diameter of aggregate after curing
(mm)
AIV Aggregate impact value (%)
M1 Weight of sample before compaction
(g)
M2 Weight of sample passing through
2.36mm opening or sieve # 8 (g);
P Failure load (kN)
D Distance between two plates (m)
WA Water absorption (%)
PCS Particle crushing strength (MPa)
SG Specific gravity
𝜌𝑏 Aggregate volume density (kg/m3)
𝜌𝑑 True density (kg/m3)
References
1. Aslam, M.; Shafigh, P.; Jumaat, M.Z.; and
Lachemi M. (2016) “Benefits of using blended
waste coarse lightweight aggregates in structural
lightweight aggregate concrete,” Journal of
Cleaner Production, vol. 119, pp. 108-117.
2. Kisku, N.; Joshi, H.; Ansari, M.; Panda, S.;
Nayak, S.; and Dutta, S.C. (2017) “A critical re-
view and assessment for usage of recycled ag-
gregate as sustainable construction material,”
Construction and Building Materials, vol. 131,
pp. 721-740.
3. Mannan, M.; and Ganapathy, C. (2001) “Mix
design for oil palm shell concrete,” Cement and
Concrete Research, vol. 31, no. 9, pp. 1323-
1325.
4. Oktay, H.; Yumrutaş, R.; and Akpolat, A. (2015)
“Mechanical and thermophysical properties of
lightweight aggregate concretes,” Construction
and Building Materials, vol. 96, pp. 217-225.
5. Mohammed, J.H.; and Hamad, A.J. (2014) “Ma-
terials, properties and application review of
Lightweight concrete,” Technical Review of the
Faculty of Engineering University of Zulia, vol.
37, no. 2, pp. 10-15.
6. Tajra, F.; Elrahman, M.A.; and Stephan, D.
(2019) “The production and properties of cold-
bonded aggregate and its applications in con-
crete: A review,” Construction and Building
Materials, vol. 225, pp. 29-43.
7. Priyanka, M.; Karthikeyan, M.; and Sri Rama
Chand, M. (2020) “Development of mix propor-
tions of geopolymer lightweight aggregate con-
crete with LECA,” Materials Today: Proceed-
ings, vol. 27, pp. 958-962.
8. Bijen, J. (1986) “Manufacturing processes of ar-
tificial lightweight aggregates from fly ash,” In-
ternational Journal of Cement Composites and
Lightweight Concrete, vol. 8, no. 3, pp. 191-199.
Journal of Asian Concrete Federation, Vol. 6, No. 2, December 2020
48
9. Franus, M.; Panek, R.; Madej, J.; and Franus, W.
(2019) “The properties of fly ash derived light-
weight aggregates obtained using microwave ra-
diation,” Construction and Building Materials,
vol. 227 pp. 116677.
10. Nadesan, M.S.; and Dinakar, P. (2017) “Struc-
tural concrete using sintered flyash lightweight
aggregate: A review,” Construction and Build-
ing Materials, vol. 154, pp. 928-944.
11. Gomathi, P.; and Sivakumar, A. (2014) “Cold
Bonded Fly Ash Lightweight Aggregate Con-
taining Different Binders,” Research Journal of
Applied Sciences, Engineering and Technology,
vol. 7, no. 6, pp. 1101-1106.
12. Sharif, S.; Mahmad Nor, A.; Yahya, Z.; Abdul-
lah, M.M.A.B.; Abdul Razak, R.; Jaya Ekaputri,
J.; Faris, M.A.; Nur Hamzah, H.; Abdullah,
M.M.A.B.; Abd Rahim, S.Z.; Ghazali, M.F.;
Mat Saad, N.; Ramli, M.M.; Zainol Murad, S.A.;
and Mat Isa, S.S. (2016) “A Review on the Man-
ufacturing of Lightweight Aggregates Using In-
dustrial By-Product,” MATEC Web of Confer-
ences, vol. 78, pp. 01067.
13. Domagała, L. (2011) “Modification of proper-
ties of structural lightweight concrete with steel
fibres,” Journal of Civil Engineering and Man-
agement, vol. 17, no. 1, pp. 36-44.
14. Topçu, İ.B.; and Uygunoğlu, T. (2007) “Proper-
ties of autoclaved lightweight aggregate con-
crete, Building and Environment, vol. 42, no. 12,
pp. 4108-4116.
15. Reddy, M.V.S.; Nataraja, M.; Sindhu, K.; Ha-
rani, V.; and Madhuralalasa, K. (2016) “Perfor-
mance of light weight concrete using fly ash pel-
lets as coarse aggregate replacement,” Interna-
tional Journal of Engineering Research and
Technology, vol. 9, no. 2, pp. 95-104.
16. Thostenson, E.; and Chou, T.-W. (1999) “Mi-
crowave processing: fundamentals and applica-
tions,” Composites Part A: Applied Science and
Manufacturing, vol. 30, no. 9, pp. 1055-1071.
17. C. ASTM, Standard specification for coal fly
ash and raw or calcined natural pozzolan for use
in concrete, ASTM Int 4 (2012).
18. Wang, Y.; He, F.; Wang, J.; and Hu, Q. (2019)
“Comparison of Effects of Sodium Bicarbonate
and Sodium Carbonate on the Hydration and
Properties of Portland Cement Paste,” Materials,
vol. 12, no. 7, pp. 1033.
19. ASTM C29, Standard test method for bulk den-
sity (“Unit Weight”) and voids in aggregate.
American Society for Testing and Materials:
West Conshohocken, PA, USA. , (2017).
20. ASTM C127–14, Standard Test Method for
Density, Relative Density (Specific Gravity),
and Absorption of Coarse Aggregate, ASTM In-
ternational. West Conshohocken, Pennsylvania
19428–2959, United States (2014).
21. Borys, M.; Kurpińska, M.; Ferenc, T.; Czyż, Z.;
Falkowicz, K.; Kujawska, J.; Kulisz, M.; and
Szala, M. (2017) “Effect of porosity on physical
properties of lightweight cement composite with
foamed glass aggregate,” ITM Web of Confer-
ences, vol. 15, pp. 06005.
22. B. British Standard, Testing aggregates. Method
for determination of aggregate impact value
(AIV), Vol. BS (1990) 812-112.
23. Alqahtani, F.K.; Rashid, K.; Zafar, I.; and Iqbal
Khan, M. (2021) “Assessment of morphological
characteristics and physico-mechanical proper-
ties of geopolymer green foam lightweight ag-
gregate formulated by microwave irradiation,”
Journal of Building Engineering, vol. 35, pp.
102081.
24. Li, Y.; Wu, D.; Zhang, J.; Chang, L.; Wu, D.;
Fang, Z.; and Shi, Y. (2000) “Measurement and
statistics of single pellet mechanical strength of
differently shaped catalysts,” Powder technol-
ogy, vol. 113, no. 1-2, pp. 176-184.
25. Van der Wegen, G.; and Bijen, J. (1985) “Prop-
erties of concrete made with three types of arti-
ficial PFA coarse aggregates,” International
Journal of Cement Composites and Lightweight
Concrete, vol. 7, no. 3, pp. 159-167.
26. Wang, H.-T.; and Wang, L.-C. (2007) “Experi-
mental study on mechanical properties of steel
fiber reinforced lightweight aggregate concrete,”
Jianzhu Cailiao Xuebao(Journal of Building
Materials), vol. 10, no. 2, pp. 188-194.
27. Ul Rehman, M.; Rashid, K.; Ul Haq, E.; Hussain,
M.; and Shehzad, N. (2020) “Physico-mechani-
cal performance and durability of artificial light-
weight aggregates synthesized by cementing
and geopolymerization,” Construction and
Building Materials, vol. 232, pp. 117290.
28. Kockal, N.U.; and Ozturan, T. (2011) “Durabil-
ity of lightweight concretes with lightweight fly
ash aggregates,” Construction and Building Ma-
terials, vol. 25, no. 3, pp. 1430-1438.
29. Bui, L.A.T.; Hwang, C.L.; Chen, C.T.; Lin, K.L.;
and Hsieh, M.Y. (2012) “Manufacture and per-
formance of cold bonded lightweight aggregate
using alkaline activators for high performance
concrete,” Construction and Building Materials,
vol. 35, pp. 1056-1062.
30. Saad, M.; Baalbaki, O.; Khatib, J.; El Kordi, A.;
and Masri, A. (2019) “Manufacturing of Light-
weight Aggregates from Municipal Solid Waste
Incineration Bottom Ash and their Impacts on
Concrete Properties,” 2nd international Con-
gress on Engineering and Architecture, At Mar-
maris / Turkey, pp. 1638-1649.
Journal of Asian Concrete Federation, Vol. 6, No. 2, December 2020
49
31. Bui, L.A.T.; Hwang, C.L.; Chen, C.T.; and
Hsieh, M.Y. (2012) “Characteristics of Cold-
Bonded Lightweight Aggregate Produced with
Different Mineral Admixtures,” Applied Me-
chanics and Materials, vol. 174-177, pp. 978-
983.
32. Mehmedi Vehbi GÖ KÇ , E. (2012) “Use of diat-
omite in the production of lightweight building
elements with cement as binder,” Scientific Re-
search and Essays, vol. 7. No. 7, pp. 774-781.
33. Karakurt, C.; and Ö zen, U. “Influence of natural
lightweight aggregates on the properties of con-
crete,” Journal of the Turkish Chemical Society
Section B: Chemical Engineering 1(Sp. is. 2), pp.
9-16.
34. Rashad, A.M. (2019) “A short manual on natu-
ral pumice as a lightweight aggregate,” Journal
of Building Engineering, vol. 25, pp. 100802.
35. Posi, P.; Lertnimoolchai, S.; Sata, V.; and
Chindaprasirt, P. (2013) “Pressed lightweight
concrete containing calcined diatomite aggre-
gate,” Construction and Building Materials, vol.
47, pp. 896-901.
36. Akers, D.J.; Gruber, R.D.; Ramme, B.W.; Boyle,
M.J.; Grygar, J.G.; Rowe, S.K.; Bremner, T.W.;
Kluckowski, E.S.; Sheetz, S.R.; and Burg, R.G.
(2003) “Guide for Structural Lightweight-Ag-
gregate Concrete,” ACI 213R-03. American
Concrete Institute (ACI), Michigan.
37. Abdulkareem, O.A.; Abdullah, M.; Hussin, K.;
Ismail, K.N. and Binhussain, M. (2013) “Me-
chanical and Microstructural Evaluations of
Lightweight Aggregate Geopolymer Concrete
before and after Exposed to Elevated Tempera-
tures,” Materials, vol. 6, no. 10, pp. 4450-4461.
38. Kurpińska, M.; and Ferenc, T. (2017) “Effect of
porosity on physical properties of lightweight
cement composite with foamed glass aggregate,”
ITM Web of Conferences, EDP Sciences, vol.
15, pp. 06005.
39. Kılıc, A.; and Teymen, A. (2009) “The effects
of scoria and pumice aggregates on the strengths
and unit weights of lightweight concrete,” Sci-
entific Research and Essay, vol. 4, no. 10, pp.
961-965.
40. Colangelo, F.; Messina, F.; and Cioffi, R. (2015)
“Recycling of MSWI fly ash by means of ce-
mentitious double step cold bonding pelletiza-
tion: Technological assessment for the produc-
tion of lightweight artificial aggregates,” Jour-
nal of hazardous materials, vol. 299, pp. 181-
191.
41. Manikandan, R.; and Ramamurthy, K. (2008)
“Effect of curing method on characteristics of
cold bonded fly ash aggregates,” Cement and
concrete composites, vol. 30, no. 9, pp. 848-853.
Journal of Asian Concrete Federation
Vol. 6, No. 2, pp. 50-65, December 2020
ISSN 2465-7964 / eISSN 2465-7972
https://doi.org/10.18702/acf.2020.12.6.2.50
50
Technical Paper
Evaluation of mechanical and durability properties of con-
crete made with Indian bottom ash as replacement of fine ag-
gregate
P. N. Ojha, Amit Trivedi, Brijesh Singh*, Abhishek Singh
(Received June 5, 2020; Revised October 28, 2020; Accepted December 5, 2020; Published December 31, 2020)
Abstract: Bottom ash is a major by-product of the coal-based power generation process and it has particle
size ranging from 45 μm to 150 μm. As per current provisions of IS: 383-2016, bottom ash can be used
as replacement of natural fine aggregate up to 25% in case of lean concrete (less than M15 Grade) only.
However, its use in reinforced and plain concrete is not permitted. Therefore, it is imperative to study the
feasibility of using coal based bottom ash as a replacement of conventional fine aggregates (i.e., natural
and crushed sand) in plain and reinforced concrete to increase the utilization of this industrial byproduct.
In this study, natural and crushed sand were replaced with bottom ash at various percent-ages for prepa-
ration of concrete and study its effect on fresh, hardened and durability properties of concrete. Bottom
ash was collected from Vindhyachal thermal power plant of India. Experimental studies were conducted
at w/c ratio of 0.65 and 0.40. Concrete mixes were studied and analyzed for various mechanical and
durability properties. Based on fresh concrete properties i.e., workability, slump retention and strength
development, it was observed that up to 50% replacement of conventional fine aggregate with bottom
ash is technically feasible.
Keywords: Bottom ash; fine aggregate; characterization; mechanical property; durability.
1 Introduction
Bottom ash is a major by-product of the coal-
based power generation process. In coal based Ther-
mal Power Plant, at the bottom of the furnace, there
is a hopper for collection of bottom ash. The bottom
ash can be collected by wet cooling and wet removal
process or dry cooling and dry removal process from
the bottom of boilers. Characteristics of bottom ash
depend on the process of removal of bottom ash from
the boiler. In wet cooling and wet removal process,
a hopper is always filled with water to quench the
ash. Bottom ash consists of heavier particles that fall
to the bottom of the furnace. Bottom ash is composed
primarily of amorphous or glassy alumino-silicate
materials derived from the melted mineral phases.
Bottom ash differs from fly ash collected from elec-
trostatic precipitators in a dry form in that it contains
significant amount of relatively coarser particles
(greater than 45 μm and up to 150 μm). Coal bottom
ash has angular, irregular, porous and rough surface
textured particles. Coal bottom ash is lighter and
more brittle as compared to natural river sand. The
specific gravity of coal bottom ash varies from 1.8 to
2.6 depending upon the source and type of coal. Coal
bottom ash derived from high Sulphur coal and low
rank coal is not very porous and is quite dense. In
India, over 70% of electricity generated is by coal
fired plants. As per Central Electricity Authority [1]
data 2014-15 the annual production of Ash is 180MT
out of which 30-35MT is bottom ash and rest is fly
ash.
BIS has incorporated the provision of manufac-
tured aggregates to be used in concrete in IS: 383-
2016. It mentions that bottom ash can be used as re-
placement of natural fine aggregate up to 25% in
case of lean concrete (less than M15 Grade) only.
However, it is not permitted to use bottom ash in re-
inforced and plain concrete. At national and interna-
tional level, researchers have carried out study on us-
age of bottom ash as a replacement of fine aggregate
at different percentage levels ranging from 10% to
100%. Fresh and hardened concrete properties
P. N. Ojha is a Joint Director at National Council for Cement
& Building Materials, India.
Amit Trivedi is a General Manager at National Council for Ce-
ment & Building Materials, India.
Corresponding author Brijesh Singh is a Group Manager at
National Council for Cement & Building Materials, India.
Abhishek Singh is a Project Engineer at National Council for
Cement & Building Materials, India.
Journal of Asian Concrete Federation, Vol. 6, No. 2, December 2020
51
(strength-based properties) have been studied. How-
ever, limited studies are available on durability prop-
erties of concrete. Abdulhameed et al. [2] have car-
ried out the studies on usage of bottom ash as re-
placement of fine aggregate in concrete. The coal
bottom ash was obtained from Tanjung Bin power
plant. Natural sand was partially replaced with bot-
tom ash in the range of 5, 10, 15 and 20%. Decrease
in the workability of fresh concrete in terms of slump
and compacting factor was observed with increase in
percentage of bottom ash. Reduction in compressive
strength and density of concrete was observed with
increase in percentage of bottom ash.
Ratchayut et al. [3] have carried out the studies
on usage of bottom ash as replacement of fine aggre-
gate in concrete. The study was conducted on self-
compacting concrete having w/binder ratio of 0.31.
Bottom ash was obtained from Saraburi Power Plant,
Thailand. Natural sand was replaced with bottom ash
up to 30%. Slump flow decreased continuously with
increase in bottom ash content. It was considered that
such decrease was due to increased aggregate to ag-
gregate friction from highly irregular shape and
rough texture of bottom ash particles. Mehdi et al. [4]
carried out the studies on usage of bottom ash as re-
placement of fine aggregate in concrete. Coal bottom
ash was obtained from Malaysian Power Plant. Con-
crete specimens were prepared incorporating 0, 20,
50, 75 and 100% of bottom ash replacing sand and
20% of coal fly ash by mass, as a substitute for ordi-
nary Portland cement. Workability of concrete re-
duces on increasing the percentage of bottom ash. At
the age of 28 days, no significant effect was observed
in compressive, flexural and tensile strengths of all
concrete samples. The drying-shrinkage of experi-
mental concrete mixtures containing 50%, 75% and
100% Bottom ash and 20% fly ash was lower than
the control mix.
Kim et al. [5] have carried out the studies on
chloride resistance of high-strength concrete incor-
porating bottom ash. The results showed that, alt-
hough there was no significant effect on the chloride
diffusion, bottom ash in high-strength concrete can
significantly reduce the amount of chloride diffusion
as chloride did not readily diffuse to the cement paste
in the vicinity of bottom ash. Malkit et al. [6] carried
out the studies on usage of bottom ash as replace-
ment of fine aggregate in concrete. At fixed water
cement ratio, workability and loss of water from
bleeding decreased with the use of coal bottom ash
as a replacement of river sand in concrete. Compres-
sive strength of bottom ash concrete at the curing age
of 28 days was not significantly affected. However,
after 90 days of curing age, compressive strength of
bottom ash concrete surpassed that of conventional
concrete. Splitting tensile strength of concrete im-
proved at all the curing ages. The modulus of elas-
ticity decreased with the use of coal bottom ash at all
the curing ages. Andrade et al. [7] carried out the
studies on the influence of the use of coal bottom ash
as a replacement for natural fine aggregates on the
properties of concrete in the fresh state. In the fresh
state the concretes produced with the bottom ash are
susceptible to water loss by bleeding and the higher
the percentage of bottom ash used as a natural sand
replacement the lower the deformation through plas-
tic shrinkage. Aggarwal et al. [8] carried out studies
on concrete (w/c of 0.43) by replacing up to 40% fine
aggregate (by weight) with coal bottom ash obtained
from thermal power plant in Panipat, Haryana (India)
was used in the investigation. The density of con-
crete decreased with the increase in bottom ash con-
tent due to the low specific gravity of bottom ash as
compared to fine aggregates. Mix containing 30%
and 40% bottom ash, at 90 days, attains the compres-
sive strength equivalent to 108% and 105% of com-
pressive strength of normal concrete at 28 days and
attains flexural strength in the range of 113-118% at
90 days of flexural strength of normal concrete at 28
days. Kadam et al. [9] carried out studies on concrete
(w/c of 0.45) by replacing up to 100% fine aggregate
(by weight) with coal bottom ash from Eklahare ther-
mal power plant in India. The compressive strength
for 7, 28, 56 and 112 days was increased up to 20%
replacement and after that compressive strengths
were decreased from 30% to 100% replacement. The
split tensile and flexural strength was increased at 7,
28, 56 and 112 days for 10% to 30% replacement and
after that it was decreased for remaining replacement.
Arumugam et al. [10] carried out studies on concrete
(w/c of 0.5) by replacing up to 60% fine aggregate
(by weight) with coal bottom ash study. The unit
weight of concrete gets reduced through the addition
of bottom ash as replacement of fine aggregate since
it has lesser specific gravity than fine aggregate. The
7 days, 28 days and 56 days strength shows that the
strength increases from standard concrete up to the
addition of 20% replacement of fine aggregate with
bottom ash.
Raju et al. [11] carried out studies on concrete
by replacing up to 30% fine aggregate (by weight)
with coal bottom ash obtained from Hindustan News
Print Limited, Kottayam, Kerala (India). Slump re-
duced with increase in percentage of bottom ash due
to higher water absorption of bottom ash. Compres-
sive strength, split tensile strength and flexural
strength increased up to 20% replacement of Bottom
ash. Based on the review of existing literature, it can
be inferred that there is a potential for use of bottom
ash as replacement of fine aggregate in concrete.
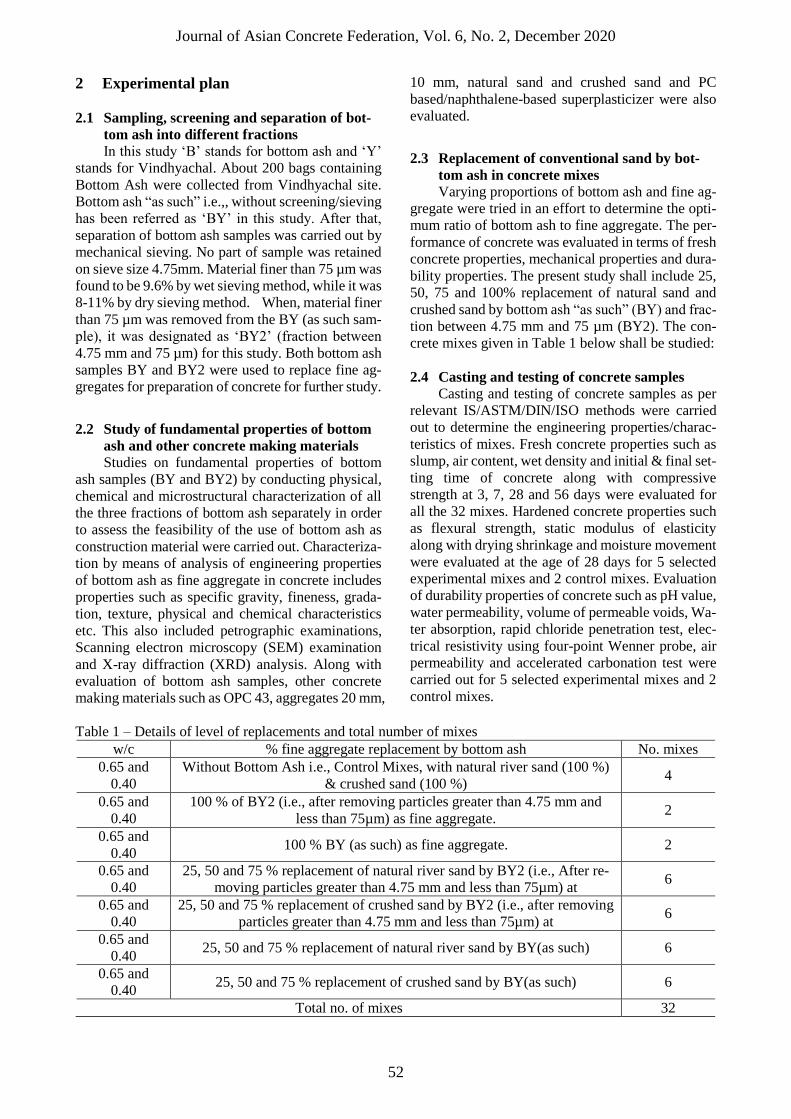
Journal of Asian Concrete Federation, Vol. 6, No. 2, December 2020
52
2 Experimental plan
2.1 Sampling, screening and separation of bot-
tom ash into different fractions
In this study ‘B’ stands for bottom ash and ‘Y’
stands for Vindhyachal. About 200 bags containing
Bottom Ash were collected from Vindhyachal site.
Bottom ash “as such” i.e.,, without screening/sieving
has been referred as ‘BY’ in this study. After that,
separation of bottom ash samples was carried out by
mechanical sieving. No part of sample was retained
on sieve size 4.75mm. Material finer than 75 µm was
found to be 9.6% by wet sieving method, while it was
8-11% by dry sieving method. When, material finer
than 75 µm was removed from the BY (as such sam-
ple), it was designated as ‘BY2’ (fraction between
4.75 mm and 75 µm) for this study. Both bottom ash
samples BY and BY2 were used to replace fine ag-
gregates for preparation of concrete for further study.
2.2 Study of fundamental properties of bottom
ash and other concrete making materials
Studies on fundamental properties of bottom
ash samples (BY and BY2) by conducting physical,
chemical and microstructural characterization of all
the three fractions of bottom ash separately in order
to assess the feasibility of the use of bottom ash as
construction material were carried out. Characteriza-
tion by means of analysis of engineering properties
of bottom ash as fine aggregate in concrete includes
properties such as specific gravity, fineness, grada-
tion, texture, physical and chemical characteristics
etc. This also included petrographic examinations,
Scanning electron microscopy (SEM) examination
and X-ray diffraction (XRD) analysis. Along with
evaluation of bottom ash samples, other concrete
making materials such as OPC 43, aggregates 20 mm,
10 mm, natural sand and crushed sand and PC
based/naphthalene-based superplasticizer were also
evaluated.
2.3 Replacement of conventional sand by bot-
tom ash in concrete mixes
Varying proportions of bottom ash and fine ag-
gregate were tried in an effort to determine the opti-
mum ratio of bottom ash to fine aggregate. The per-
formance of concrete was evaluated in terms of fresh
concrete properties, mechanical properties and dura-
bility properties. The present study shall include 25,
50, 75 and 100% replacement of natural sand and
crushed sand by bottom ash “as such” (BY) and frac-
tion between 4.75 mm and 75 µm (BY2). The con-
crete mixes given in Table 1 below shall be studied:
2.4 Casting and testing of concrete samples
Casting and testing of concrete samples as per
relevant IS/ASTM/DIN/ISO methods were carried
out to determine the engineering properties/charac-
teristics of mixes. Fresh concrete properties such as
slump, air content, wet density and initial & final set-
ting time of concrete along with compressive
strength at 3, 7, 28 and 56 days were evaluated for
all the 32 mixes. Hardened concrete properties such
as flexural strength, static modulus of elasticity
along with drying shrinkage and moisture movement
were evaluated at the age of 28 days for 5 selected
experimental mixes and 2 control mixes. Evaluation
of durability properties of concrete such as pH value,
water permeability, volume of permeable voids, Wa-
ter absorption, rapid chloride penetration test, elec-
trical resistivity using four-point Wenner probe, air
permeability and accelerated carbonation test were
carried out for 5 selected experimental mixes and 2
control mixes.
Table 1 – Details of level of replacements and total number of mixes
w/c % fine aggregate replacement by bottom ash No. mixes
0.65 and
0.40
Without Bottom Ash i.e., Control Mixes, with natural river sand (100 %)
& crushed sand (100 %) 4
0.65 and
0.40
100 % of BY2 (i.e., after removing particles greater than 4.75 mm and
less than 75µm) as fine aggregate. 2
0.65 and
0.40 100 % BY (as such) as fine aggregate. 2
0.65 and
0.40
25, 50 and 75 % replacement of natural river sand by BY2 (i.e., After re-
moving particles greater than 4.75 mm and less than 75µm) at 6
0.65 and
0.40
25, 50 and 75 % replacement of crushed sand by BY2 (i.e., after removing
particles greater than 4.75 mm and less than 75µm) at 6
0.65 and
0.40 25, 50 and 75 % replacement of natural river sand by BY(as such) 6
0.65 and
0.40 25, 50 and 75 % replacement of crushed sand by BY(as such) 6
Total no. of mixes 32

Journal of Asian Concrete Federation, Vol. 6, No. 2, December 2020
53
3 Characterization of bottom ash and
concrete making materials
Only bottom ash samples bottom ash “as such”
i.e.,, without screening/sieving (BY) and fraction be-
tween 4.75 mm and 75 µm (BY2) which were used
to replace fine aggregates for preparation of concrete
were evaluated for sieve analysis, physical and
chemical properties. BY and BY-2 samples were
also subjected to petrographic examination, X-ray
diffractometry and analyzed using scanning electron
microscope.
3.1 Sieve analysis of bottom ash fractions
Sieve analysis of Bottom Ash “as such” (i.e.,,
BY) and fraction between 4.75 mm and 75 µm (i.e.,,
BY2) was carried out as per IS 383:2016 and the re-
sults are given in Table-2 and gradation curve has
been shown in Fig. 1.
For BY (bottom ash ‘as such’) sample the per-
centage passing through sieve size 600 µm is 82%
which corresponds to Zone-IV as per IS: 383-2016.
However, the percentage passing through 300 µm &
150 µm are 58% & 29% respectively which are more
than the grading requirement of Zone-IV as per IS:
383-2016 and therefore bottom ash “as such” (i.e.,,
BY) is finer than Zone-IV. For BY2 (fraction be-
tween 4.75 mm & 75 µm) sample, the percentage
passing through sieve size 600 µm is 82% which cor-
responds to Zone-IV as per IS: 383-2016. However,
the percentage passing through 300 µm and 150 µm
are 57% & 19% respectively which are more than the
grading requirement of Zone-IV as per IS: 383-2016
and therefore bottom ash BY2 (fraction between
4.75 mm & 75 µm) is finer than Zone-IV.
3.2 Physical characterization of bottom ash
The results of physical characterization of bot-
tom ash sample BY (as such) after screening from
4.75mm and BY2 (fraction between 4.75 mm and
75µm) sieve are given in Table 3.
3.3 Chemical characterization of bottom ash
The results of chemical characterization of bot-
tom ash sample (As such) after screening from
4.75mm sieve and BY2 (fraction between 4.75 mm
and 75 µm) sieve are given in Table 4.
Table 2 – Sieve analysis of bottom ash fractions BY and BY2
IS Sieve Size Percentage Passing (%) Percentage Passing for Grading Zone
IV as per IS: 383-2016 Table 9 BY BY2
10 mm 100 100 100
4.75 mm 100 100 95 – 100
2.36 mm 96 97 95 – 100
1.18 mm 92 92 90 – 100
600 µm 82 82 80 – 100
300 µm 58 57 15 – 50
150 µm 29 19 0 – 15
Fig. 1 – Gradation curve for sieve analysis of bottom ash BY and BY2
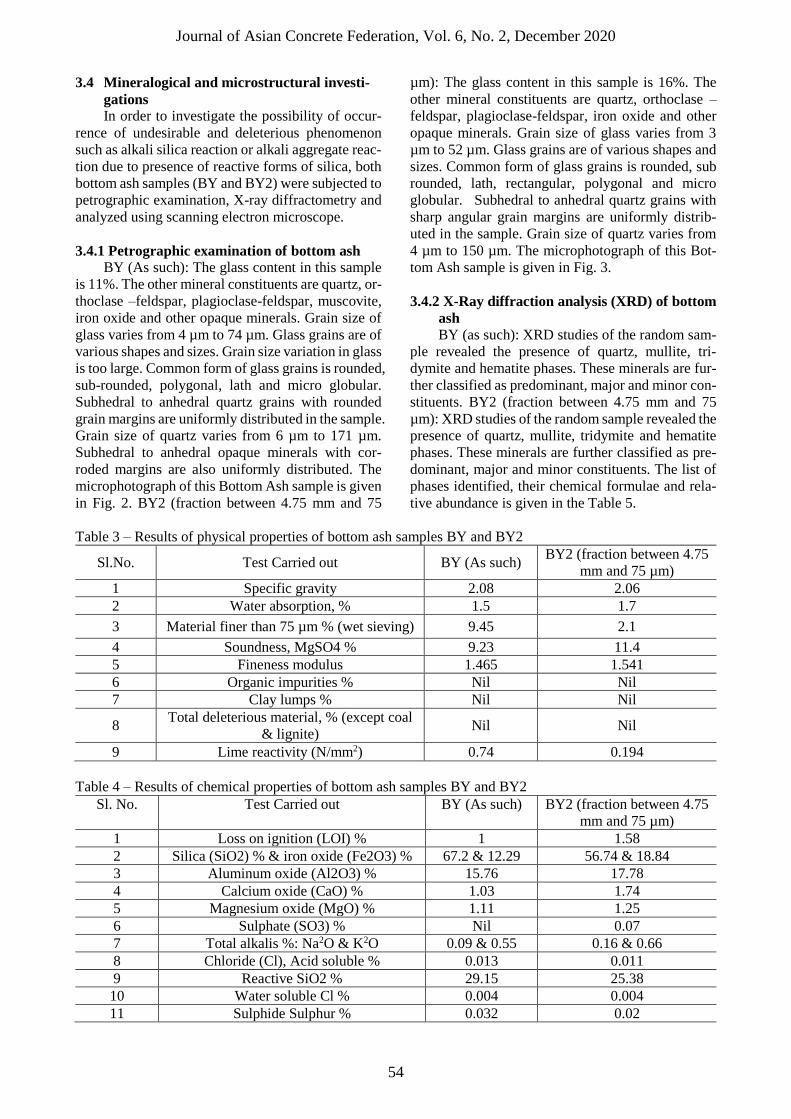
Journal of Asian Concrete Federation, Vol. 6, No. 2, December 2020
54
3.4 Mineralogical and microstructural investi-
gations
In order to investigate the possibility of occur-
rence of undesirable and deleterious phenomenon
such as alkali silica reaction or alkali aggregate reac-
tion due to presence of reactive forms of silica, both
bottom ash samples (BY and BY2) were subjected to
petrographic examination, X-ray diffractometry and
analyzed using scanning electron microscope.
3.4.1 Petrographic examination of bottom ash BY (As such): The glass content in this sample
is 11%. The other mineral constituents are quartz, or-
thoclase –feldspar, plagioclase-feldspar, muscovite,
iron oxide and other opaque minerals. Grain size of
glass varies from 4 µm to 74 µm. Glass grains are of
various shapes and sizes. Grain size variation in glass
is too large. Common form of glass grains is rounded,
sub-rounded, polygonal, lath and micro globular.
Subhedral to anhedral quartz grains with rounded
grain margins are uniformly distributed in the sample.
Grain size of quartz varies from 6 µm to 171 µm.
Subhedral to anhedral opaque minerals with cor-
roded margins are also uniformly distributed. The
microphotograph of this Bottom Ash sample is given
in Fig. 2. BY2 (fraction between 4.75 mm and 75
µm): The glass content in this sample is 16%. The
other mineral constituents are quartz, orthoclase –
feldspar, plagioclase-feldspar, iron oxide and other
opaque minerals. Grain size of glass varies from 3
µm to 52 µm. Glass grains are of various shapes and
sizes. Common form of glass grains is rounded, sub
rounded, lath, rectangular, polygonal and micro
globular. Subhedral to anhedral quartz grains with
sharp angular grain margins are uniformly distrib-
uted in the sample. Grain size of quartz varies from
4 µm to 150 µm. The microphotograph of this Bot-
tom Ash sample is given in Fig. 3.
3.4.2 X-Ray diffraction analysis (XRD) of bottom
ash
BY (as such): XRD studies of the random sam-
ple revealed the presence of quartz, mullite, tri-
dymite and hematite phases. These minerals are fur-
ther classified as predominant, major and minor con-
stituents. BY2 (fraction between 4.75 mm and 75
µm): XRD studies of the random sample revealed the
presence of quartz, mullite, tridymite and hematite
phases. These minerals are further classified as pre-
dominant, major and minor constituents. The list of
phases identified, their chemical formulae and rela-
tive abundance is given in the Table 5.
Table 3 – Results of physical properties of bottom ash samples BY and BY2
Sl.No. Test Carried out BY (As such) BY2 (fraction between 4.75
mm and 75 µm)
1 Specific gravity 2.08 2.06
2 Water absorption, % 1.5 1.7
3 Material finer than 75 µm % (wet sieving) 9.45 2.1
4 Soundness, MgSO4 % 9.23 11.4
5 Fineness modulus 1.465 1.541
6 Organic impurities % Nil Nil
7 Clay lumps % Nil Nil
8 Total deleterious material, % (except coal
& lignite) Nil Nil
9 Lime reactivity (N/mm2) 0.74 0.194
Table 4 – Results of chemical properties of bottom ash samples BY and BY2
Sl. No. Test Carried out BY (As such) BY2 (fraction between 4.75
mm and 75 µm)
1 Loss on ignition (LOI) % 1 1.58
2 Silica (SiO2) % & iron oxide (Fe2O3) % 67.2 & 12.29 56.74 & 18.84
3 Aluminum oxide (Al2O3) % 15.76 17.78
4 Calcium oxide (CaO) % 1.03 1.74
5 Magnesium oxide (MgO) % 1.11 1.25
6 Sulphate (SO3) % Nil 0.07
7 Total alkalis %: Na2O & K2O 0.09 & 0.55 0.16 & 0.66
8 Chloride (Cl), Acid soluble % 0.013 0.011
9 Reactive SiO2 % 29.15 25.38
10 Water soluble Cl % 0.004 0.004
11 Sulphide Sulphur % 0.032 0.02
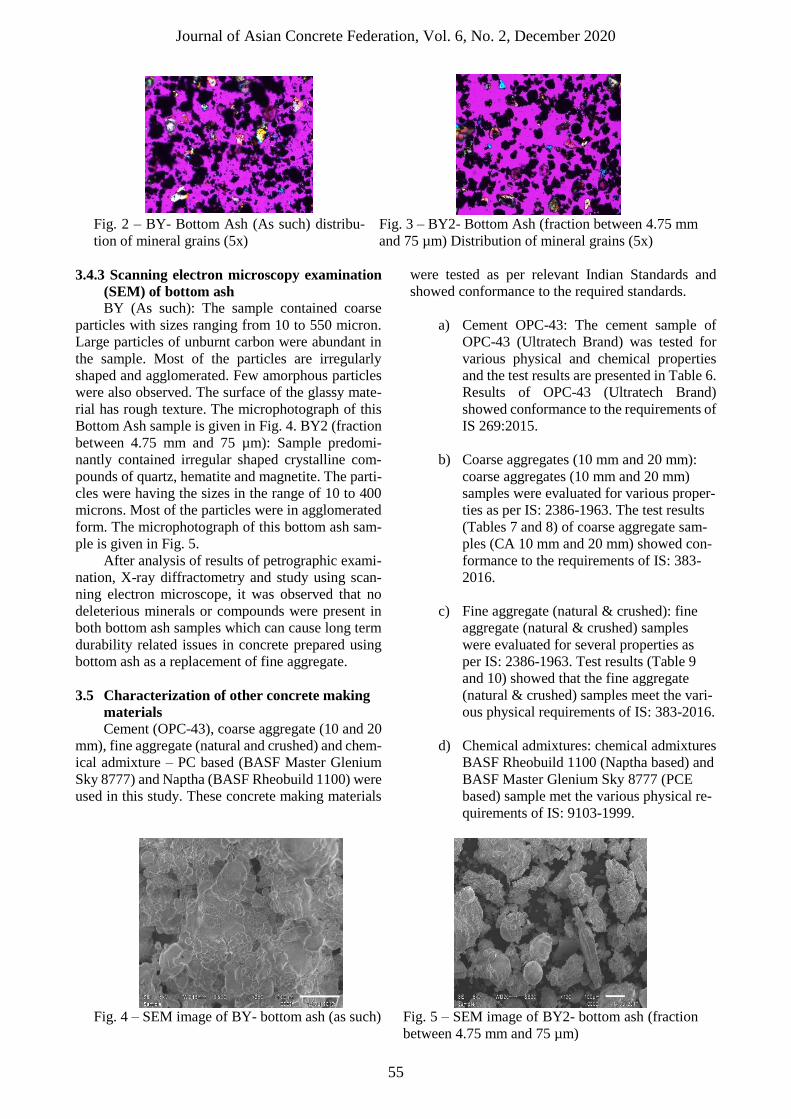
Journal of Asian Concrete Federation, Vol. 6, No. 2, December 2020
55
Fig. 2 – BY- Bottom Ash (As such) distribu-
tion of mineral grains (5x)
Fig. 3 – BY2- Bottom Ash (fraction between 4.75 mm
and 75 µm) Distribution of mineral grains (5x)
3.4.3 Scanning electron microscopy examination
(SEM) of bottom ash
BY (As such): The sample contained coarse
particles with sizes ranging from 10 to 550 micron.
Large particles of unburnt carbon were abundant in
the sample. Most of the particles are irregularly
shaped and agglomerated. Few amorphous particles
were also observed. The surface of the glassy mate-
rial has rough texture. The microphotograph of this
Bottom Ash sample is given in Fig. 4. BY2 (fraction
between 4.75 mm and 75 µm): Sample predomi-
nantly contained irregular shaped crystalline com-
pounds of quartz, hematite and magnetite. The parti-
cles were having the sizes in the range of 10 to 400
microns. Most of the particles were in agglomerated
form. The microphotograph of this bottom ash sam-
ple is given in Fig. 5.
After analysis of results of petrographic exami-
nation, X-ray diffractometry and study using scan-
ning electron microscope, it was observed that no
deleterious minerals or compounds were present in
both bottom ash samples which can cause long term
durability related issues in concrete prepared using
bottom ash as a replacement of fine aggregate.
3.5 Characterization of other concrete making
materials
Cement (OPC-43), coarse aggregate (10 and 20
mm), fine aggregate (natural and crushed) and chem-
ical admixture – PC based (BASF Master Glenium
Sky 8777) and Naptha (BASF Rheobuild 1100) were
used in this study. These concrete making materials
were tested as per relevant Indian Standards and
showed conformance to the required standards.
a) Cement OPC-43: The cement sample of
OPC-43 (Ultratech Brand) was tested for
various physical and chemical properties
and the test results are presented in Table 6.
Results of OPC-43 (Ultratech Brand)
showed conformance to the requirements of
IS 269:2015.
b) Coarse aggregates (10 mm and 20 mm):
coarse aggregates (10 mm and 20 mm)
samples were evaluated for various proper-
ties as per IS: 2386-1963. The test results
(Tables 7 and 8) of coarse aggregate sam-
ples (CA 10 mm and 20 mm) showed con-
formance to the requirements of IS: 383-
2016.
c) Fine aggregate (natural & crushed): fine
aggregate (natural & crushed) samples
were evaluated for several properties as
per IS: 2386-1963. Test results (Table 9
and 10) showed that the fine aggregate
(natural & crushed) samples meet the vari-
ous physical requirements of IS: 383-2016.
d) Chemical admixtures: chemical admixtures
BASF Rheobuild 1100 (Naptha based) and
BASF Master Glenium Sky 8777 (PCE
based) sample met the various physical re-
quirements of IS: 9103-1999.
Fig. 4 – SEM image of BY- bottom ash (as such)
Fig. 5 – SEM image of BY2- bottom ash (fraction
between 4.75 mm and 75 µm)
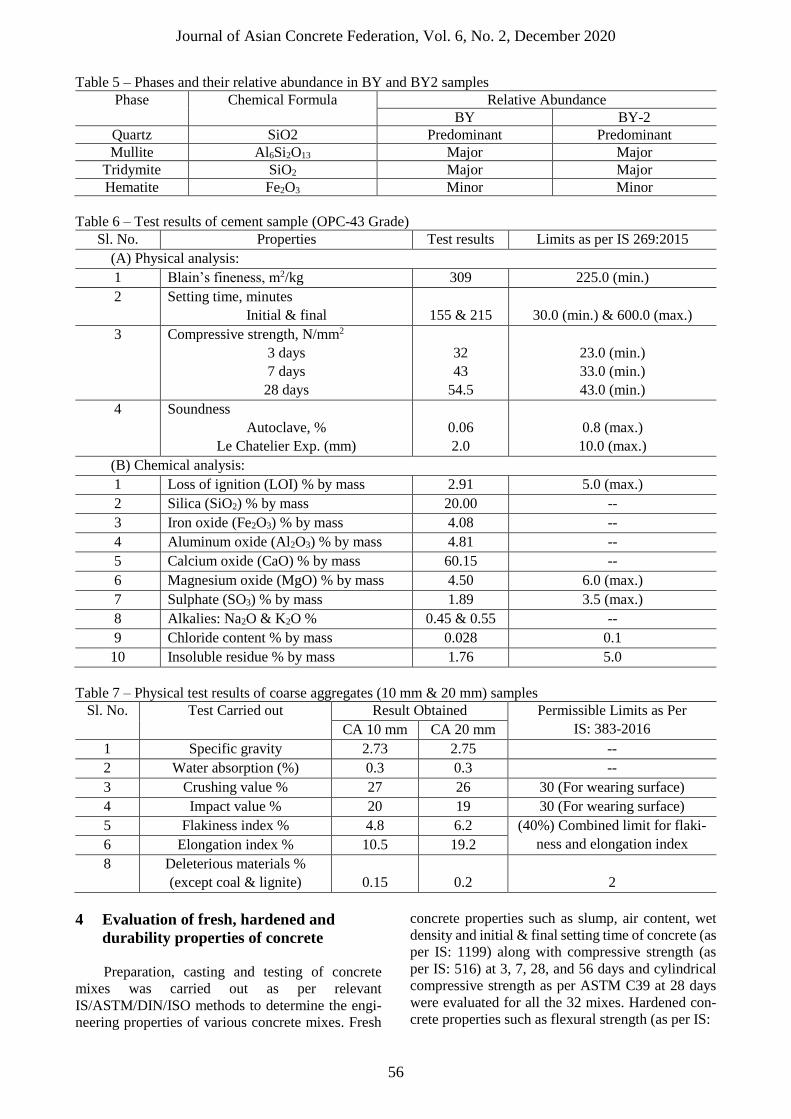
Journal of Asian Concrete Federation, Vol. 6, No. 2, December 2020
56
Table 5 – Phases and their relative abundance in BY and BY2 samples
Phase Chemical Formula Relative Abundance
BY BY-2
Quartz SiO2 Predominant Predominant
Mullite Al6Si2O13 Major Major
Tridymite SiO2 Major Major
Hematite Fe2O3 Minor Minor
Table 6 – Test results of cement sample (OPC-43 Grade)
Sl. No. Properties Test results Limits as per IS 269:2015
(A) Physical analysis:
1 Blain’s fineness, m2/kg 309 225.0 (min.)
2 Setting time, minutes
Initial & final
155 & 215
30.0 (min.) & 600.0 (max.)
3 Compressive strength, N/mm2
3 days
7 days
28 days
32
43
54.5
23.0 (min.)
33.0 (min.)
43.0 (min.)
4 Soundness
Autoclave, %
Le Chatelier Exp. (mm)
0.06
2.0
0.8 (max.)
10.0 (max.)
(B) Chemical analysis:
1 Loss of ignition (LOI) % by mass 2.91 5.0 (max.)
2 Silica (SiO2) % by mass 20.00 --
3 Iron oxide (Fe2O3) % by mass 4.08 --
4 Aluminum oxide (Al2O3) % by mass 4.81 --
5 Calcium oxide (CaO) % by mass 60.15 --
6 Magnesium oxide (MgO) % by mass 4.50 6.0 (max.)
7 Sulphate (SO3) % by mass 1.89 3.5 (max.)
8 Alkalies: Na2O & K2O % 0.45 & 0.55 --
9 Chloride content % by mass 0.028 0.1
10 Insoluble residue % by mass 1.76 5.0
Table 7 – Physical test results of coarse aggregates (10 mm & 20 mm) samples
Sl. No. Test Carried out Result Obtained Permissible Limits as Per
IS: 383-2016 CA 10 mm CA 20 mm
1 Specific gravity 2.73 2.75 --
2 Water absorption (%) 0.3 0.3 --
3 Crushing value % 27 26 30 (For wearing surface)
4 Impact value % 20 19 30 (For wearing surface)
5 Flakiness index % 4.8 6.2 (40%) Combined limit for flaki-
ness and elongation index 6 Elongation index % 10.5 19.2
8 Deleterious materials %
(except coal & lignite)
0.15
0.2
2
4 Evaluation of fresh, hardened and
durability properties of concrete
Preparation, casting and testing of concrete
mixes was carried out as per relevant
IS/ASTM/DIN/ISO methods to determine the engi-
neering properties of various concrete mixes. Fresh
concrete properties such as slump, air content, wet
density and initial & final setting time of concrete (as
per IS: 1199) along with compressive strength (as
per IS: 516) at 3, 7, 28, and 56 days and cylindrical
compressive strength as per ASTM C39 at 28 days
were evaluated for all the 32 mixes. Hardened con-
crete properties such as flexural strength (as per IS:
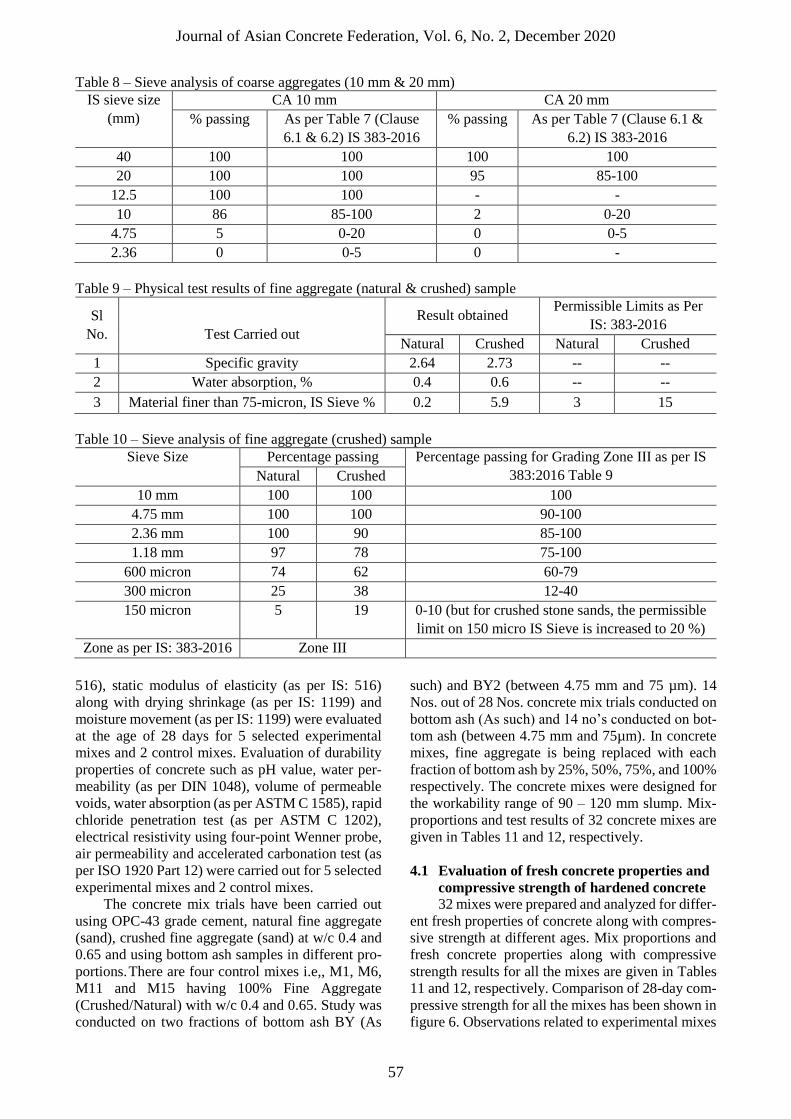
Journal of Asian Concrete Federation, Vol. 6, No. 2, December 2020
57
Table 8 – Sieve analysis of coarse aggregates (10 mm & 20 mm)
IS sieve size
(mm)
CA 10 mm CA 20 mm
% passing As per Table 7 (Clause
6.1 & 6.2) IS 383-2016
% passing As per Table 7 (Clause 6.1 &
6.2) IS 383-2016
40 100 100 100 100
20 100 100 95 85-100
12.5 100 100 - -
10 86 85-100 2 0-20
4.75 5 0-20 0 0-5
2.36 0 0-5 0 -
Table 9 – Physical test results of fine aggregate (natural & crushed) sample
Sl
No.
Test Carried out
Result obtained Permissible Limits as Per
IS: 383-2016
Natural Crushed Natural Crushed
1 Specific gravity 2.64 2.73 -- --
2 Water absorption, % 0.4 0.6 -- --
3 Material finer than 75-micron, IS Sieve % 0.2 5.9 3 15
Table 10 – Sieve analysis of fine aggregate (crushed) sample
Sieve Size Percentage passing Percentage passing for Grading Zone III as per IS
383:2016 Table 9 Natural Crushed
10 mm 100 100 100
4.75 mm 100 100 90-100
2.36 mm 100 90 85-100
1.18 mm 97 78 75-100
600 micron 74 62 60-79
300 micron 25 38 12-40
150 micron 5 19 0-10 (but for crushed stone sands, the permissible
limit on 150 micro IS Sieve is increased to 20 %)
Zone as per IS: 383-2016 Zone III
516), static modulus of elasticity (as per IS: 516)
along with drying shrinkage (as per IS: 1199) and
moisture movement (as per IS: 1199) were evaluated
at the age of 28 days for 5 selected experimental
mixes and 2 control mixes. Evaluation of durability
properties of concrete such as pH value, water per-
meability (as per DIN 1048), volume of permeable
voids, water absorption (as per ASTM C 1585), rapid
chloride penetration test (as per ASTM C 1202),
electrical resistivity using four-point Wenner probe,
air permeability and accelerated carbonation test (as
per ISO 1920 Part 12) were carried out for 5 selected
experimental mixes and 2 control mixes.
The concrete mix trials have been carried out
using OPC-43 grade cement, natural fine aggregate
(sand), crushed fine aggregate (sand) at w/c 0.4 and
0.65 and using bottom ash samples in different pro-
portions. There are four control mixes i.e,, M1, M6,
M11 and M15 having 100% Fine Aggregate
(Crushed/Natural) with w/c 0.4 and 0.65. Study was
conducted on two fractions of bottom ash BY (As
such) and BY2 (between 4.75 mm and 75 µm). 14
Nos. out of 28 Nos. concrete mix trials conducted on
bottom ash (As such) and 14 no’s conducted on bot-
tom ash (between 4.75 mm and 75µm). In concrete
mixes, fine aggregate is being replaced with each
fraction of bottom ash by 25%, 50%, 75%, and 100%
respectively. The concrete mixes were designed for
the workability range of 90 – 120 mm slump. Mix-
proportions and test results of 32 concrete mixes are
given in Tables 11 and 12, respectively.
4.1 Evaluation of fresh concrete properties and
compressive strength of hardened concrete
32 mixes were prepared and analyzed for differ-
ent fresh properties of concrete along with compres-
sive strength at different ages. Mix proportions and
fresh concrete properties along with compressive
strength results for all the mixes are given in Tables
11 and 12, respectively. Comparison of 28-day com-
pressive strength for all the mixes has been shown in
figure 6. Observations related to experimental mixes
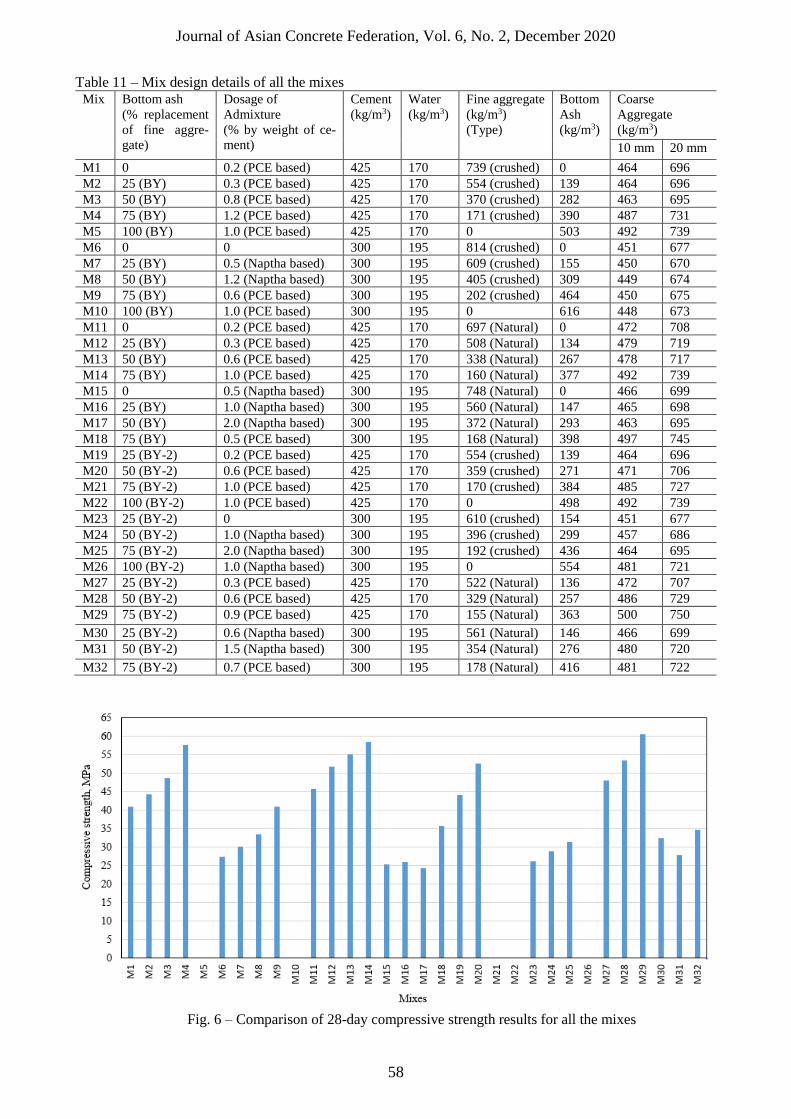
Journal of Asian Concrete Federation, Vol. 6, No. 2, December 2020
58
Table 11 – Mix design details of all the mixes Mix Bottom ash
(% replacement
of fine aggre-
gate)
Dosage of
Admixture
(% by weight of ce-
ment)
Cement
(kg/m3)
Water
(kg/m3)
Fine aggregate
(kg/m3)
(Type)
Bottom
Ash
(kg/m3)
Coarse
Aggregate
(kg/m3)
10 mm 20 mm
M1 0 0.2 (PCE based) 425 170 739 (crushed) 0 464 696
M2 25 (BY) 0.3 (PCE based) 425 170 554 (crushed) 139 464 696
M3 50 (BY) 0.8 (PCE based) 425 170 370 (crushed) 282 463 695
M4 75 (BY) 1.2 (PCE based) 425 170 171 (crushed) 390 487 731
M5 100 (BY) 1.0 (PCE based) 425 170 0 503 492 739
M6 0 0 300 195 814 (crushed) 0 451 677
M7 25 (BY) 0.5 (Naptha based) 300 195 609 (crushed) 155 450 670
M8 50 (BY) 1.2 (Naptha based) 300 195 405 (crushed) 309 449 674
M9 75 (BY) 0.6 (PCE based) 300 195 202 (crushed) 464 450 675
M10 100 (BY) 1.0 (PCE based) 300 195 0 616 448 673
M11 0 0.2 (PCE based) 425 170 697 (Natural) 0 472 708
M12 25 (BY) 0.3 (PCE based) 425 170 508 (Natural) 134 479 719
M13 50 (BY) 0.6 (PCE based) 425 170 338 (Natural) 267 478 717
M14 75 (BY) 1.0 (PCE based) 425 170 160 (Natural) 377 492 739
M15 0 0.5 (Naptha based) 300 195 748 (Natural) 0 466 699
M16 25 (BY) 1.0 (Naptha based) 300 195 560 (Natural) 147 465 698
M17 50 (BY) 2.0 (Naptha based) 300 195 372 (Natural) 293 463 695
M18 75 (BY) 0.5 (PCE based) 300 195 168 (Natural) 398 497 745
M19 25 (BY-2) 0.2 (PCE based) 425 170 554 (crushed) 139 464 696
M20 50 (BY-2) 0.6 (PCE based) 425 170 359 (crushed) 271 471 706
M21 75 (BY-2) 1.0 (PCE based) 425 170 170 (crushed) 384 485 727
M22 100 (BY-2) 1.0 (PCE based) 425 170 0 498 492 739
M23 25 (BY-2) 0 300 195 610 (crushed) 154 451 677
M24 50 (BY-2) 1.0 (Naptha based) 300 195 396 (crushed) 299 457 686
M25 75 (BY-2) 2.0 (Naptha based) 300 195 192 (crushed) 436 464 695
M26 100 (BY-2) 1.0 (Naptha based) 300 195 0 554 481 721
M27 25 (BY-2) 0.3 (PCE based) 425 170 522 (Natural) 136 472 707
M28 50 (BY-2) 0.6 (PCE based) 425 170 329 (Natural) 257 486 729
M29 75 (BY-2) 0.9 (PCE based) 425 170 155 (Natural) 363 500 750
M30 25 (BY-2) 0.6 (Naptha based) 300 195 561 (Natural) 146 466 699
M31 50 (BY-2) 1.5 (Naptha based) 300 195 354 (Natural) 276 480 720
M32 75 (BY-2) 0.7 (PCE based) 300 195 178 (Natural) 416 481 722
Fig. 6 – Comparison of 28-day compressive strength results for all the mixes
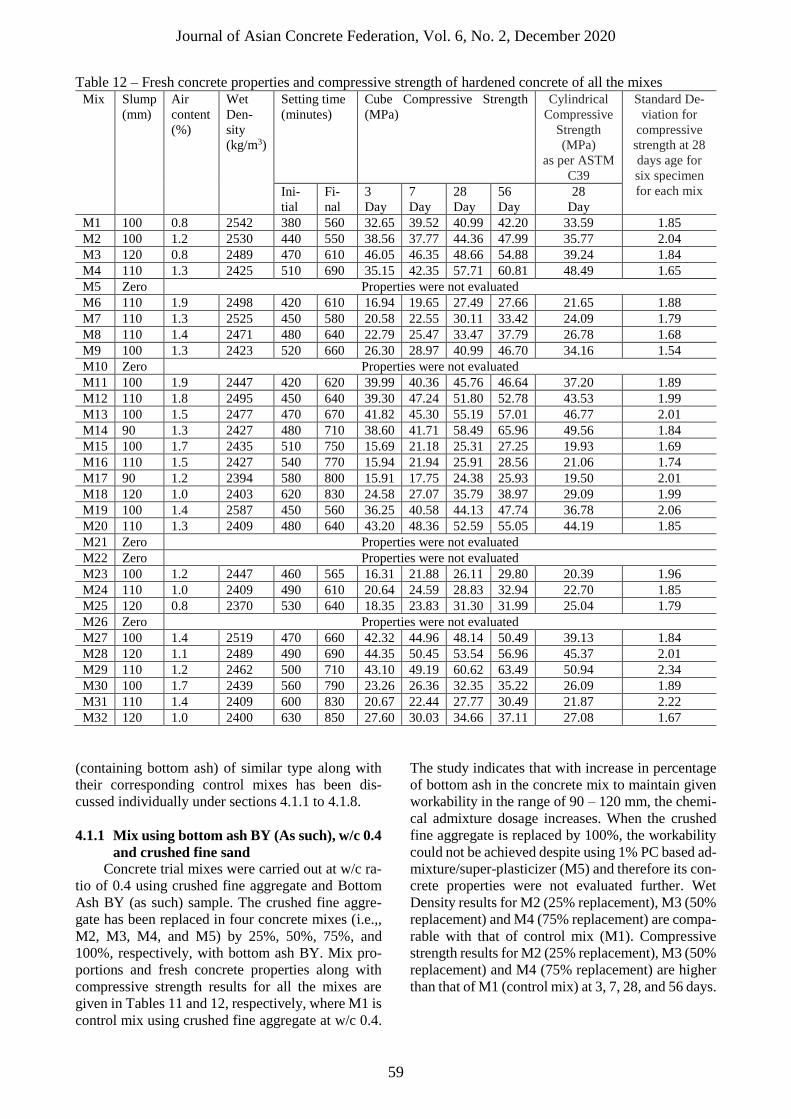
Journal of Asian Concrete Federation, Vol. 6, No. 2, December 2020
59
Table 12 – Fresh concrete properties and compressive strength of hardened concrete of all the mixes Mix Slump
(mm)
Air
content
(%)
Wet
Den-
sity
(kg/m3)
Setting time
(minutes)
Cube Compressive Strength
(MPa)
Cylindrical
Compressive
Strength
(MPa)
as per ASTM
C39
Standard De-
viation for
compressive
strength at 28
days age for
six specimen
for each mix Ini-
tial
Fi-
nal
3
Day
7
Day
28
Day
56
Day
28
Day
M1 100 0.8 2542 380 560 32.65 39.52 40.99 42.20 33.59 1.85
M2 100 1.2 2530 440 550 38.56 37.77 44.36 47.99 35.77 2.04
M3 120 0.8 2489 470 610 46.05 46.35 48.66 54.88 39.24 1.84
M4 110 1.3 2425 510 690 35.15 42.35 57.71 60.81 48.49 1.65
M5 Zero Properties were not evaluated
M6 110 1.9 2498 420 610 16.94 19.65 27.49 27.66 21.65 1.88
M7 110 1.3 2525 450 580 20.58 22.55 30.11 33.42 24.09 1.79
M8 110 1.4 2471 480 640 22.79 25.47 33.47 37.79 26.78 1.68
M9 100 1.3 2423 520 660 26.30 28.97 40.99 46.70 34.16 1.54
M10 Zero Properties were not evaluated
M11 100 1.9 2447 420 620 39.99 40.36 45.76 46.64 37.20 1.89
M12 110 1.8 2495 450 640 39.30 47.24 51.80 52.78 43.53 1.99
M13 100 1.5 2477 470 670 41.82 45.30 55.19 57.01 46.77 2.01
M14 90 1.3 2427 480 710 38.60 41.71 58.49 65.96 49.56 1.84
M15 100 1.7 2435 510 750 15.69 21.18 25.31 27.25 19.93 1.69
M16 110 1.5 2427 540 770 15.94 21.94 25.91 28.56 21.06 1.74
M17 90 1.2 2394 580 800 15.91 17.75 24.38 25.93 19.50 2.01
M18 120 1.0 2403 620 830 24.58 27.07 35.79 38.97 29.09 1.99
M19 100 1.4 2587 450 560 36.25 40.58 44.13 47.74 36.78 2.06
M20 110 1.3 2409 480 640 43.20 48.36 52.59 55.05 44.19 1.85
M21 Zero Properties were not evaluated
M22 Zero Properties were not evaluated
M23 100 1.2 2447 460 565 16.31 21.88 26.11 29.80 20.39 1.96
M24 110 1.0 2409 490 610 20.64 24.59 28.83 32.94 22.70 1.85
M25 120 0.8 2370 530 640 18.35 23.83 31.30 31.99 25.04 1.79
M26 Zero Properties were not evaluated
M27 100 1.4 2519 470 660 42.32 44.96 48.14 50.49 39.13 1.84
M28 120 1.1 2489 490 690 44.35 50.45 53.54 56.96 45.37 2.01
M29 110 1.2 2462 500 710 43.10 49.19 60.62 63.49 50.94 2.34
M30 100 1.7 2439 560 790 23.26 26.36 32.35 35.22 26.09 1.89
M31 110 1.4 2409 600 830 20.67 22.44 27.77 30.49 21.87 2.22
M32 120 1.0 2400 630 850 27.60 30.03 34.66 37.11 27.08 1.67
(containing bottom ash) of similar type along with
their corresponding control mixes has been dis-
cussed individually under sections 4.1.1 to 4.1.8.
4.1.1 Mix using bottom ash BY (As such), w/c 0.4
and crushed fine sand
Concrete trial mixes were carried out at w/c ra-
tio of 0.4 using crushed fine aggregate and Bottom
Ash BY (as such) sample. The crushed fine aggre-
gate has been replaced in four concrete mixes (i.e.,,
M2, M3, M4, and M5) by 25%, 50%, 75%, and
100%, respectively, with bottom ash BY. Mix pro-
portions and fresh concrete properties along with
compressive strength results for all the mixes are
given in Tables 11 and 12, respectively, where M1 is
control mix using crushed fine aggregate at w/c 0.4.
The study indicates that with increase in percentage
of bottom ash in the concrete mix to maintain given
workability in the range of 90 – 120 mm, the chemi-
cal admixture dosage increases. When the crushed
fine aggregate is replaced by 100%, the workability
could not be achieved despite using 1% PC based ad-
mixture/super-plasticizer (M5) and therefore its con-
crete properties were not evaluated further. Wet
Density results for M2 (25% replacement), M3 (50%
replacement) and M4 (75% replacement) are compa-
rable with that of control mix (M1). Compressive
strength results for M2 (25% replacement), M3 (50%
replacement) and M4 (75% replacement) are higher
than that of M1 (control mix) at 3, 7, 28, and 56 days.
Journal of Asian Concrete Federation, Vol. 6, No. 2, December 2020
60
4.1.2 Mix using bottom ash BY (As such), w/c
0.65 and crushed fine sand
Concrete trial mixes were carried out at w/c of
0.65 using crushed fine aggregate and bottom ash
BY (as such) sample. The crushed fine aggregate has
been replaced in four concrete mixes (i.e.,, M7, M8,
M9, and M10) by 25%, 50%, 75%, and 100%, re-
spectively, with bottom ash BY. Mix proportions and
fresh concrete properties along with compressive
strength results for all the mixes are given in Tables
11 and 12, respectively, where M6 is control mix us-
ing crushed fine aggregate at w/c 0.65. The study in-
dicates that with increase in percentage of bottom
ash in the concrete mix to maintain given workability
in the range of 90 – 120 mm, the chemical admixture
dosage increases. When the crushed fine aggregate is
replaced by 100%, the workability could not be
achieved despite using 1% PC based admixture/su-
per-plasticizer (M10) and therefore its concrete
properties were not evaluated further. Wet Density
results for M7 (25% replacement), M8 (50% replace-
ment) and M9 (75% replacement) are comparable
with that of control mix (M6). Compressive strength
results for M7 (25% replacement), M8 (50% replace-
ment) and M9 (75% replacement) are higher than
that of M6 (control mix) at 3, 7, 28, and 56 days.
4.1.3 Mix using bottom ash BY (As such), w/c
0.4 and natural fine sand
Concrete trial mixes were carried out at w/c ra-
tio of 0.40 using natural fine aggregate and bottom
ash BY (As such) sample. The natural fine aggregate
has been replaced in four concrete mixes (i.e.,, M12,
M13, M14, and M5) by 25%, 50%, 75%, and 100%,
respectively, with bottom ash. Mix proportions and
fresh concrete properties along with compressive
strength results for all the mixes are given in Tables
11 and 12, respectively, where M11 is control mix
using natural fine aggregate at w/c 0.40. The study
indicates that with increase in percentage of bottom
ash in the concrete mix to maintain given workability
in the range of 90 – 120 mm, the chemical admixture
dosage increases. When the natural fine aggregate is
replaced by 100%, the workability could not be
achieved despite using 1% PC based admixture/su-
per-plasticizer (M5) and therefore its concrete prop-
erties were not evaluated further. Wet density results
for M12 (25% replacement), M13 (50% replacement)
and M14 (75% replacement) are comparable with
that of control mix (M11). Compressive strength re-
sults for M12 (25% replacement), M13 (50% re-
placement) and M14 (75% replacement) are higher
than that of M11 (control mix) at 3, 7, 28, and 56
days.
4.1.4 Mix using bottom ash BY (As such), w/c
0.65 and natural fine sand
Concrete trial mixes were carried out at w/c of
0.65 using natural fine aggregate and bottom ash BY
(As such) sample. The natural fine aggregate has
been replaced in four concrete mixes (i.e.,, M16,
M17, M18, and M10) by 25%, 50%, 75%, and 100%,
respectively, with bottom ash. Mix proportions and
fresh concrete properties along with compressive
strength results for all the mixes are given in Tables
11 and 12, respectively, where M15 is control mix
using natural fine aggregate at w/c 0.65. The study
indicates that with increase in percentage of bottom
ash in the concrete mix to maintain given workability
in the range of 90 – 120 mm, the chemical admixture
dosage increases. When the natural fine aggregate is
replaced by 100%, the workability could not be
achieved despite using 1% PC based admixture/su-
per-plasticizer (M10) and therefore its concrete
properties were not evaluated further. Wet Density
results for M16 (25% replacement), M17 (50% re-
placement) and M18 (75% replacement) are compa-
rable with that of control mix (M15). Compressive
strength results for M16 (25% replacement), M17
(50% replacement) and M18 (75% replacement) are
higher than that of M15 (control mix) at 3,7,28 & 56
days.
4.1.5 Mix using bottom ash BY-2 (fraction be-
tween 4.75 mm and 75 µm), w/c 0.40 and
crushed fine sand
Concrete trial mixes were carried out at w/c ra-
tio of 0.40 using crushed fine aggregate and Bottom
Ash BY-2 (fraction between 4.75mm & 75µm) sam-
ple. The crushed fine aggregate has been replaced in
four mixes (i.e., M19, M20, M21 & M22) by 25%,
50%, 75% & 100% respectively with Bottom Ash.
Mix proportions and fresh concrete properties along
with compressive strength results for all the mixes
are given in Tables 11 and 12, respectively, where
M1 is Control Mix using Crushed Fine Aggregate at
w/c of 0.40. The study indicates that with increase in
percentage of Bottom Ash in the concrete mix to
maintain given workability in the range of 90-
120mm, the chemical admixture dosage increases.
When the Crushed Fine Aggregate is replaced by 75%
& 100%, the workability could not be achieved de-
spite using 1% PC based admixture/super-plasticizer
(M21 & M22) and therefore their concrete properties
were not evaluated further. Wet Density results for
M19 (25% replacement) and M20 (50% replacement)
are comparable with that of control mix (M1). Com-
pressive strength results for M19 (25% replacement)
and M20 (50% replacement) are higher than that of
M1 (control mix) at 3, 7, 28, and 56 days.
Journal of Asian Concrete Federation, Vol. 6, No. 2, December 2020
61
4.1.6 Mix using bottom ash BY-2 (fraction be-
tween 4.75mm & 75µm), w/c=0.65 and
crushed fine sand
Concrete trial mixes were carried out at w/c ra-
tio of 0.65 using crushed fine aggregate and Bottom
Ash BY-2 (fraction between 4.75mm & 75µm) sam-
ple. The crushed fine aggregate has been replaced in
four concrete mixes (i.e., M23, M24, M25, and M26)
by 25%, 50%, 75% & 100% respectively with Bot-
tom Ash. Mix proportions and fresh concrete prop-
erties along with compressive strength results for all
the mixes are given in Tables 11 and 12 respectively,
where M6 is Control Mix using Crushed Fine Aggre-
gate at W/C ratio 0.65. The study indicates that with
increase in percentage of Bottom Ash in the concrete
mix to maintain given workability in the range of 90-
120mm, the chemical admixture dosage increases.
When the Crushed Fine Aggregate is replaced by
100%, the workability could not be achieved despite
using 1% PC based admixture/super-plasticizer
(M26) and therefore its concrete properties were not
evaluated further. Wet Density results for M23 (25%
replacement), M24 (50% replacement) and M25 (75%
replacement) are comparable with that of control mix
(M6). Compressive strength results for M23 (25%
replacement), M24 (50% replacement) and M25 (75%
replacement) are higher than that of M6 (control mix)
at 3, 7, 28, and 56 days.
4.1.7 Mix using bottom ash BY-2 (fraction be-
tween 4.75 mm and 75 µm), w/c 0.40 and
natural fine sand
Concrete trial mixes were carried out at w/c ra-
tio of 0.40 using natural fine aggregate and Bottom
Ash BY-2 (fraction between 4.75mm & 75µm) sam-
ple. The natural fine aggregate has been replaced in
four concrete mixes (i.e., M27, M28, M29 & M22)
by 25%, 50%, 75% & 100% respectively with Bot-
tom Ash. Mix proportions and fresh concrete prop-
erties along with compressive strength results for all
the mixes are given in Tables 11 and 12, respectively,
where M11 is Control Mix using Natural Fine Ag-
gregate at W/C ratio 0.40. The study indicates that
with increase in percentage of Bottom Ash in the
concrete mix to maintain given workability in the
range of 90-120mm, the chemical admixture dosage
increases. When the Natural Fine Aggregate is re-
placed by 100%, the workability could not be
achieved despite using 1% PC based admixture/su-
per-plasticizer (M22) and therefore its concrete
properties were not evaluated further. Wet Density
results for M27 (25% replacement), M28 (50% re-
placement) and M29 (75% replacement) are compa-
rable with that of control mix M11. Compressive
strength results for M27 (25% replacement), M28
(50% replacement) and M29 (75% replacement) are
higher than that of M11 (control mix) at 3, 7, 28, and
56 days.
4.1.8 Mix using bottom ash BY-2 (fraction be-
tween 4.75 mm and 75 µm), w/c 0.65 and
natural fine sand
Concrete trial mixes were carried out at w/c ra-
tio of 0.65 using natural fine aggregate and Bottom
Ash BY-2 (fraction between 4.75 mm and 75 µm)
sample. The natural fine aggregate has been replaced
in four concrete mixes (i.e., M30, M31, M32 & M26)
by 25%, 50%, 75% & 100% respectively with Bot-
tom Ash. Mix proportions and fresh concrete prop-
erties along with compressive strength results for all
the mixes are given in Tables 11 and 12 respectively,
where M15 is control mix using natural fine aggre-
gate at w/c 0.65. The study indicates that with in-
crease in percentage of bottom ash in the concrete
mix to maintain given workability in the range of 90-
120mm, the chemical admixture dosage increases.
When the Natural Fine Aggregate is replaced by
100%, the workability could not be achieved despite
using 1% PC based admixture/super-plasticizer
(M26) and therefore its concrete properties were not
evaluated further. Wet Density results for M30 (25%
replacement), M31 (50% replacement) and M32 (75%
replacement) are comparable with that of control mix
M15. Compressive strength results for M30 (25% re-
placement), M31 (50% replacement) and M32 (75%
replacement) are higher than that of M15 (control
mix) at 3, 7, 28, and 56 days.
4.2 Evaluation of hardened concrete and dura-
bility properties in selected mixes
On analysis of fresh concrete properties (work-
ability, air content and wet density) and compressive
strength results for all the concrete mixes, it was ob-
served that the mixes incorporating crushed sand
showed less strength as compared to mixes having
natural sand. Also, the admixture dosage require-
ment is higher in case of crushed sand mixes than
that of mixes with natural sand.
Studies on other hardened concrete properties
and durability studies of concrete were carried out on
selected mixes. Five mixes (M3, M4, M8, M9 &
M24) incorporating bottom ash replacing crushed
sand and two control mixes (M1 & M6 with crushed
sand at w/c 0.4 and 0.65, respectively) were selected
for the same. Comparison of flexural strength, MOE,
RCPT and accelerated carbonation test results has
been shown in Figures 7 to 10.
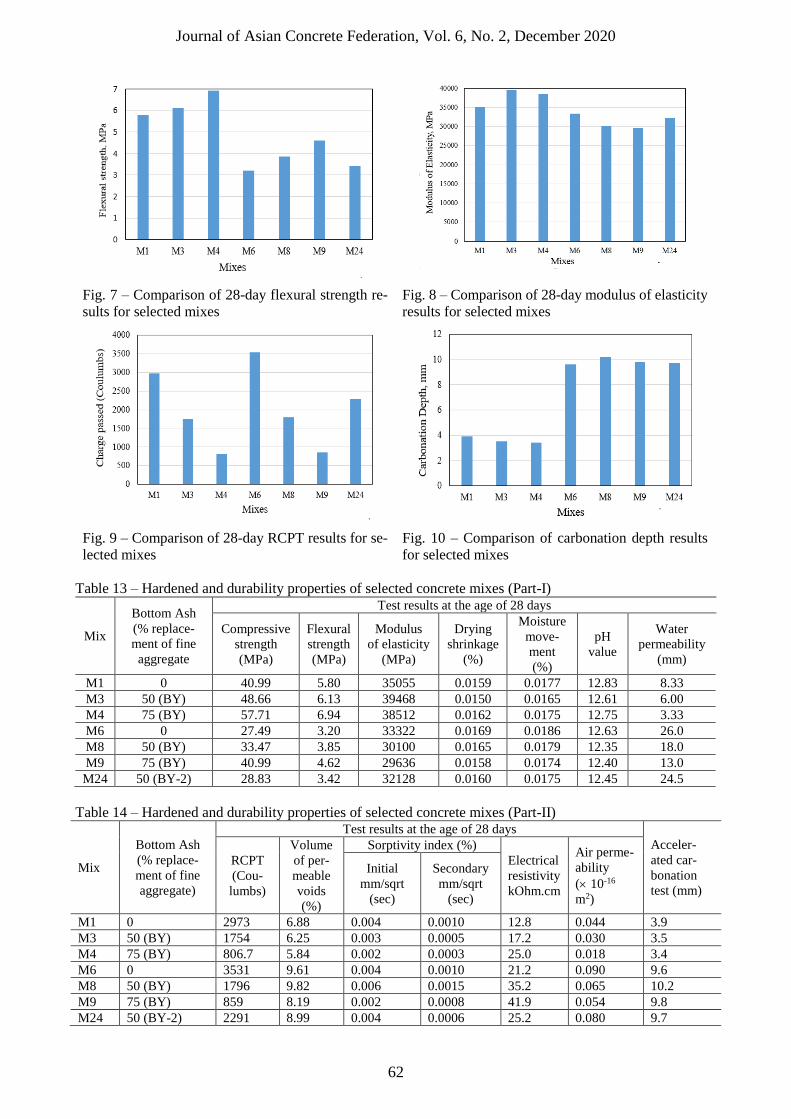
Journal of Asian Concrete Federation, Vol. 6, No. 2, December 2020
62
Fig. 7 – Comparison of 28-day flexural strength re-
sults for selected mixes
Fig. 8 – Comparison of 28-day modulus of elasticity
results for selected mixes
Fig. 9 – Comparison of 28-day RCPT results for se-
lected mixes
Fig. 10 – Comparison of carbonation depth results
for selected mixes
Table 13 – Hardened and durability properties of selected concrete mixes (Part-I)
Mix
Bottom Ash
(% replace-
ment of fine
aggregate
Test results at the age of 28 days
Compressive
strength
(MPa)
Flexural
strength
(MPa)
Modulus
of elasticity
(MPa)
Drying
shrinkage
(%)
Moisture
move-
ment
(%)
pH
value
Water
permeability
(mm)
M1 0 40.99 5.80 35055 0.0159 0.0177 12.83 8.33
M3 50 (BY) 48.66 6.13 39468 0.0150 0.0165 12.61 6.00
M4 75 (BY) 57.71 6.94 38512 0.0162 0.0175 12.75 3.33
M6 0 27.49 3.20 33322 0.0169 0.0186 12.63 26.0
M8 50 (BY) 33.47 3.85 30100 0.0165 0.0179 12.35 18.0
M9 75 (BY) 40.99 4.62 29636 0.0158 0.0174 12.40 13.0
M24 50 (BY-2) 28.83 3.42 32128 0.0160 0.0175 12.45 24.5
Table 14 – Hardened and durability properties of selected concrete mixes (Part-II)
Mix
Bottom Ash
(% replace-
ment of fine
aggregate)
Test results at the age of 28 days
Acceler-
ated car-
bonation
test (mm)
RCPT
(Cou-
lumbs)
Volume
of per-
meable
voids
(%)
Sorptivity index (%)
Electrical
resistivity
kOhm.cm
Air perme-
ability
( 10-16
m2)
Initial
mm/sqrt
(sec)
Secondary
mm/sqrt
(sec)
M1 0 2973 6.88 0.004 0.0010 12.8 0.044 3.9
M3 50 (BY) 1754 6.25 0.003 0.0005 17.2 0.030 3.5
M4 75 (BY) 806.7 5.84 0.002 0.0003 25.0 0.018 3.4
M6 0 3531 9.61 0.004 0.0010 21.2 0.090 9.6
M8 50 (BY) 1796 9.82 0.006 0.0015 35.2 0.065 10.2
M9 75 (BY) 859 8.19 0.002 0.0008 41.9 0.054 9.8
M24 50 (BY-2) 2291 8.99 0.004 0.0006 25.2 0.080 9.7

Journal of Asian Concrete Federation, Vol. 6, No. 2, December 2020
63
4.2.1 Mix using bottom ash BY (as such), w/c
0.40 and crushed fine sand
Concrete trial mixes were carried out at w/c ra-
tio of 0.40 using Crushed Fine Aggregate and Bot-
tom Ash BY (As such) sample. The crushed fine ag-
gregate was replaced by 0%, 50% & 75% of Bottom
Ash (As such) sample (M1, M3 & M4). The results
of hardened and durability properties of concrete are
given in Tables 13 and 14, where M1 is control mix
using crushed fine aggregate at w/c 0.40. The study
indicates that the test results of compressive strength,
flexural strength and static modulus of elasticity are
either comparable or higher at 50% & 75% replace-
ment of crushed sand by bottom ash in comparison
to control mix (M1). Drying shrinkage and moisture
movement test results of mixes (M3 and M4) at 50%
and 75% replacement of crushed sand by bottom ash
are comparable to that of control mix (M1). Ph value
for mixes (M3 and M4) at 50% and 75% replacement
of crushed sand by bottom ash is comparable with
that of control mix (M1). Water permeability, vol-
ume of permeable voids, air permeability, RCPT and
initial and secondary sorptivity values are lower in
case of mixes (M3 and M4) at 50% and 75% replace-
ment of crushed sand by bottom ash with that of con-
trol mix (M1). Electrical resistivity is higher in case
of mixes (M3 and M4) at 50% and 75% replacement
of crushed sand by bottom ash with that of control
mix (M1). Carbonation depth results measured by
accelerated carbonation test are lower in case of
mixes (M3 and M4) at 50% and 75% replacement of
crushed sand by bottom ash with that of control mix
(M1).
4.2.2 Mix using bottom ash BY (as such), w/c
0.65 and crushed fine sand
Concrete trial mixes were carried out at w/c ra-
tio of 0.65 using crushed fine aggregate and Bottom
Ash BY (As such) sample. The crushed fine aggre-
gate was replaced by 0%, 50%, and 75% of Bottom
Ash BY (As such) sample (M6, M8 & M9). The re-
sults of hardened and durability properties of con-
crete are given in Tables 13 and 14, where M6 is con-
trol mix using crushed fine aggregate at w/c ratio of
0.65. The study indicates that the test results of com-
pressive strength, flexural strength and static modu-
lus of elasticity are either comparable or higher for
mixes (M8 and M9) at 50% and 75% replacement of
crushed sand by bottom ash in comparison to control
mix (M6). Drying shrinkage and moisture movement
test results of mixes (M8 and M9) at 50% and 75%
replacement of crushed sand by bottom ash are com-
parable to that of control mix (M6). Ph value for
mixes (M8 and M9) at 50% and 75% replacement of
crushed sand by bottom ash is comparable with that
of control mix (M6). Water permeability, volume of
permeable voids, air permeability, RCPT and initial
and secondary sorptivity values are lower in case of
mixes (M8 and M9) at 50% and 75% replacement of
crushed sand by bottom ash with that of control mix
(M6). Electrical resistivity is higher in case of mixes
(M8 and M9) at 50% and 75% replacement of
crushed sand by bottom ash with that of control mix
(M6). Carbonation depth results measured by accel-
erated carbonation test are lower in case of mixes at
(M8 and M9) 50% and 75% replacement of crushed
sand by bottom ash with that of control mix (M6).
4.2.3 Mix using Bottom Ash BY-2 (fraction be-
tween 4.75 mm and 75 µm), w/c 0.65 and
crushed fine sand
Concrete trial mix were carried out at w/c of
0.65 using crushed fine aggregate and Bottom Ash
BY-2 (fraction between 4.75 mm and 75 µm) sample.
The crushed fine aggregate was replaced by 0% and
50% of Bottom Ash BY-2 (fraction between 4.7
5mm and 75 µm) sample (M6 and M24). The results
of hardened and durability properties of concrete are
given in Tables 13 and 14, where M6 is control mix
using crushed fine aggregate at w/c of 0.65. The
study indicates that the test results of compressive
strength, flexural strength and static modulus of elas-
ticity are higher for mix (M24) at 50% replacement
of crushed sand by bottom ash in comparison to con-
trol mix (M6). Drying shrinkage and moisture move-
ment test results of mix (M24) at 50% replacement
of crushed sand by bottom ash are comparable to that
of control mix (M6). Ph value for mix (M24) at 50%
replacement of crushed sand by bottom ash is com-
parable with that of control mix (M6). Water perme-
ability, volume of permeable voids, air permeability,
RCPT and initial and secondary sorptivity values are
either lower or comparable in case of mix (M24) at
50% replacement of crushed sand by bottom ash
with that of control mix (M6). Electrical resistivity is
higher in case of mix (M24) at 50% replacement of
crushed sand by bottom ash with that of control mix
(M6). Carbonation depth results measured by accel-
erated carbonation test are lower in case of mix (M24)
at 50% replacement of crushed sand by bottom ash
with that of control mix (M6).
5 Conclusions
Based on the test results and discussion of char-
acterization of bottom ash, fresh concrete, hardened
concrete and durability properties of concrete mixes
following are the conclusions:
(1) With addition of Bottom Ash, there is increase
in admixture dosage in concrete mixes for main-
taining the same workability as compared to
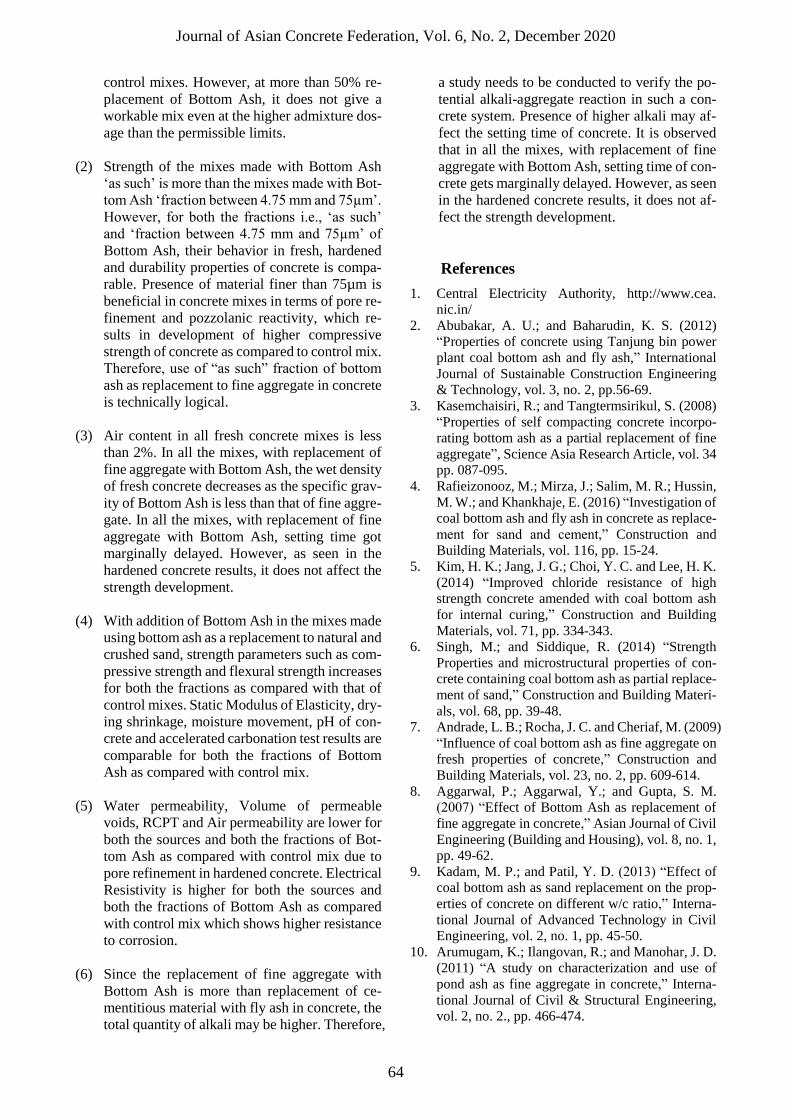
Journal of Asian Concrete Federation, Vol. 6, No. 2, December 2020
64
control mixes. However, at more than 50% re-
placement of Bottom Ash, it does not give a
workable mix even at the higher admixture dos-
age than the permissible limits.
(2) Strength of the mixes made with Bottom Ash
‘as such’ is more than the mixes made with Bot-
tom Ash ‘fraction between 4.75 mm and 75µm’.
However, for both the fractions i.e., ‘as such’
and ‘fraction between 4.75 mm and 75µm’ of
Bottom Ash, their behavior in fresh, hardened
and durability properties of concrete is compa-
rable. Presence of material finer than 75µm is
beneficial in concrete mixes in terms of pore re-
finement and pozzolanic reactivity, which re-
sults in development of higher compressive
strength of concrete as compared to control mix.
Therefore, use of “as such” fraction of bottom
ash as replacement to fine aggregate in concrete
is technically logical.
(3) Air content in all fresh concrete mixes is less
than 2%. In all the mixes, with replacement of
fine aggregate with Bottom Ash, the wet density
of fresh concrete decreases as the specific grav-
ity of Bottom Ash is less than that of fine aggre-
gate. In all the mixes, with replacement of fine
aggregate with Bottom Ash, setting time got
marginally delayed. However, as seen in the
hardened concrete results, it does not affect the
strength development.
(4) With addition of Bottom Ash in the mixes made
using bottom ash as a replacement to natural and
crushed sand, strength parameters such as com-
pressive strength and flexural strength increases
for both the fractions as compared with that of
control mixes. Static Modulus of Elasticity, dry-
ing shrinkage, moisture movement, pH of con-
crete and accelerated carbonation test results are
comparable for both the fractions of Bottom
Ash as compared with control mix.
(5) Water permeability, Volume of permeable
voids, RCPT and Air permeability are lower for
both the sources and both the fractions of Bot-
tom Ash as compared with control mix due to
pore refinement in hardened concrete. Electrical
Resistivity is higher for both the sources and
both the fractions of Bottom Ash as compared
with control mix which shows higher resistance
to corrosion.
(6) Since the replacement of fine aggregate with
Bottom Ash is more than replacement of ce-
mentitious material with fly ash in concrete, the
total quantity of alkali may be higher. Therefore,
a study needs to be conducted to verify the po-
tential alkali-aggregate reaction in such a con-
crete system. Presence of higher alkali may af-
fect the setting time of concrete. It is observed
that in all the mixes, with replacement of fine
aggregate with Bottom Ash, setting time of con-
crete gets marginally delayed. However, as seen
in the hardened concrete results, it does not af-
fect the strength development.
References
1. Central Electricity Authority, http://www.cea.
nic.in/
2. Abubakar, A. U.; and Baharudin, K. S. (2012)
“Properties of concrete using Tanjung bin power
plant coal bottom ash and fly ash,” International
Journal of Sustainable Construction Engineering
& Technology, vol. 3, no. 2, pp.56-69.
3. Kasemchaisiri, R.; and Tangtermsirikul, S. (2008)
“Properties of self compacting concrete incorpo-
rating bottom ash as a partial replacement of fine
aggregate”, Science Asia Research Article, vol. 34
pp. 087-095.
4. Rafieizonooz, M.; Mirza, J.; Salim, M. R.; Hussin,
M. W.; and Khankhaje, E. (2016) “Investigation of
coal bottom ash and fly ash in concrete as replace-
ment for sand and cement,” Construction and
Building Materials, vol. 116, pp. 15-24.
5. Kim, H. K.; Jang, J. G.; Choi, Y. C. and Lee, H. K.
(2014) “Improved chloride resistance of high
strength concrete amended with coal bottom ash
for internal curing,” Construction and Building
Materials, vol. 71, pp. 334-343.
6. Singh, M.; and Siddique, R. (2014) “Strength
Properties and microstructural properties of con-
crete containing coal bottom ash as partial replace-
ment of sand,” Construction and Building Materi-
als, vol. 68, pp. 39-48.
7. Andrade, L. B.; Rocha, J. C. and Cheriaf, M. (2009)
“Influence of coal bottom ash as fine aggregate on
fresh properties of concrete,” Construction and
Building Materials, vol. 23, no. 2, pp. 609-614.
8. Aggarwal, P.; Aggarwal, Y.; and Gupta, S. M.
(2007) “Effect of Bottom Ash as replacement of
fine aggregate in concrete,” Asian Journal of Civil
Engineering (Building and Housing), vol. 8, no. 1,
pp. 49-62.
9. Kadam, M. P.; and Patil, Y. D. (2013) “Effect of
coal bottom ash as sand replacement on the prop-
erties of concrete on different w/c ratio,” Interna-
tional Journal of Advanced Technology in Civil
Engineering, vol. 2, no. 1, pp. 45-50.
10. Arumugam, K.; Ilangovan, R.; and Manohar, J. D.
(2011) “A study on characterization and use of
pond ash as fine aggregate in concrete,” Interna-
tional Journal of Civil & Structural Engineering,
vol. 2, no. 2., pp. 466-474.
Journal of Asian Concrete Federation, Vol. 6, No. 2, December 2020
65
11. Raju R.; Paul M. M.; and Abubaker K. A. (2014)
“Strength Performance of concrete using Bottom
Ash as fine aggregate,” International Journal of
Research in Engineering and Technology, vol. 2,
no. 9, pp. 111-122.
Related Documents


![Synthesis and characterization of aramid-honeycomb ... Rößler_1final.pdf · aerogels down to 0.01 W/mK [10,22,24] are promising for countless new insulation applications in aeronautics,](https://static.cupdf.com/doc/110x72/5d4f7ebe88c99338098b6ed6/synthesis-and-characterization-of-aramid-honeycomb-roessler-aerogels-down.jpg)