Mechanical Characteristics of Elastomeric Hockey Pucks under Practice and Game Conditions A Major Qualifying Project Report Submitted to the Faculty of the WORCESTER POLYTECHNIC INSTITUTE in partial fulfillment of the requirements for the Degree of Bachelor of Science in Mechanical Engineering by Steven J. Deane-Shinbrot and Jonathan A. Rapp Date: 4/18/2013 Approved: Prof. S. Shivkumar, Major Advisor Keywords 1. Materials Science 2. Vulcanized Rubber 3. Hockey Puck

Welcome message from author
This document is posted to help you gain knowledge. Please leave a comment to let me know what you think about it! Share it to your friends and learn new things together.
Transcript

Mechanical Characteristics of Elastomeric Hockey Pucks under Practice and Game Conditions
A Major Qualifying Project Report
Submitted to the Faculty
of the
WORCESTER POLYTECHNIC INSTITUTE
in partial fulfillment of the requirements for the
Degree of Bachelor of Science
in Mechanical Engineering
by
Steven J. Deane-Shinbrot and Jonathan A. Rapp
Date: 4/18/2013
Approved:
Prof. S. Shivkumar, Major Advisor
Keywords
1. Materials Science
2. Vulcanized Rubber
3. Hockey Puck

1
Abstract Currently loose standards exist concerning preparation of hockey pucks prior to
gameplay. This research developed an understanding of the effect of temperature, pressure, and
surface roughness on pucks during gameplay. The mechanical properties for various commercial
pucks were measured. The surface temperature increased by 25°C after 20 minutes of play and
surface pressure during strike was measured to be about (0.2MPa). Freezing conditions can
affect impact toughness and performance of the puck.

2
Table of Contents
Contents Abstract ........................................................................................................................................................ 1
Introduction ................................................................................................................................................. 3
Objectives..................................................................................................................................................... 4
Procedure ..................................................................................................................................................... 5
Technical Papers ......................................................................................................................................... 6
Temperature, Pressure Characterization, and Surface Analysis of Elastomeric Hockey Pucks ........ 7
Abstract .................................................................................................................................................... 7
Introduction ............................................................................................................................................. 8
Statement of Theory and Definitions .................................................................................................... 9
Methodology ............................................................................................................................................ 9
Results and Discussion .......................................................................................................................... 11
Conclusions ............................................................................................................................................ 16
References .............................................................................................................................................. 17
Mechanical Characteristics of Elastomeric Hockey Pucks under Practice and Game Conditions ... 19
Abstract .................................................................................................................................................. 19
Introduction ........................................................................................................................................... 20
Materials and Methodology ................................................................................................................. 22
Results and Discussion .......................................................................................................................... 25
Conclusions ............................................................................................................................................ 30
References .............................................................................................................................................. 31
List of Figures ........................................................................................................................................ 32
List of Tables ......................................................................................................................................... 34
Overall MQP Conclusions ........................................................................................................................ 47
References .................................................................................................................................................. 48

3
Introduction The sport of Hockey has been a long standing American pastime. As the pastime has
evolved so too has the demand for consistent gameplay. In order to achieve this sort of play, a
necessary feature is consistent puck performance on the ice. Currently, there is a lack of accurate
and specific regulations for puck preparation prior to game play. Additionally, little research has
been performed on the mechanical properties of pucks and the influence of factors such as puck
surface temperature before or during gameplay. The bounce of the puck during play is another
important factor for controllability of the puck while stick handling or while a goalie tries to
make a save. The bounce can be affected by properties which can be regulated such as surface
roughness of the puck, the surface temperature of the puck and also factors like rough ice which
cannot be fixed during a period of play. The lack of information on puck performance means that
in any given rink, a professional hockey player may experience different feelings of control
while using a standard puck.
Professional teams use different types of pucks for practice and game situations, both of
which differ from those which can be purchased by the general public. However, each puck is
made through a similar process: the puck is made of vulcanized polyisoprene with a molecular
weight of 100,000 to 1 million g/mol, and a level of crosslinking with sulfur to be between 30
and 40%, along with a mix of additives [1]. This allows for opportunities for differences in game
play as each puck has been reported to play differently. Along with this, refrigeration systems
used by teams are not accurate or controlled by a league standard. The temperature of the puck
has a significant impact on the mechanical properties of polyisoprene, usually causing them to
decrease with temperature [2]. Additionally, as the temperature of the puck changes so too will
the interactions the puck has with the ice, mainly the effect of friction on the puck. The project
team chose to focus research and testing on factors that control puck consistency in order to
develop practical finding which may be of use to clubs. In doing this, the team performed
mechanical tests on the pucks, such as tensile tests, charpy impact tests as well as surface
analysis to examine the surface roughness of pucks. The aim of the testing was to examine ways
to control the performance of the puck and determine which properties affected this the most.

4
Objectives The overall goal of this research was to develop an understanding of the effect of
temperature, pressure, and surface roughness on pucks during gameplay.
• Evaluate differences in puck mechanical properties for multiple manufactures.
• Obtain an understanding of the effect of puck surface temperature variation on
gameplay.
• Examine the pressure distribution between the puck and ice and the resulting
effect on gameplay.
• Determine the impact toughness of pucks under different conditions.
• Use the data to potentially improve puck performance.

5
Procedure All the pertinent details of the procedure are presented in the two technical papers.
Certain features are briefly summarized in this section. In determining factors which influence
hockey puck performance the following tests were conducted on three types of hockey pucks
(practice, game and generic): surface roughness analysis, surface temperature study, coefficient
of restitution test, pressure distribution analysis, tensile tests and charpy impact tests. A laser
confocal microscope was used to measure the surface roughness of the pucks. The pucks were
measured in unused states and used states in increments of 5, 10, 15 and 20 minutes. Samples
were at 5X magnification on a 600 µm x 600 µm scale. The pucks’ surface temperatures were
measured using Cole-Palmer thermal indicating strips. The strips were adhered to the top
surface of the pucks before being placed in a freezer at -30 °C for 24 hr. After that, pucks were
dropped directly into a bucket of ice and measurements were taken from the strips. The
measurements were used to develop an understanding of how quickly the pucks can increase in
temperature. This analysis was also performed at ambient room temperature to develop baseline
data for comparison. The coefficient of restitution was calculated following ASTM F2117-10.
Before the test began, pucks were frozen and moved to an ice bucket. To find the coefficient of
restitution pucks were dropped from a height of 1803 mm and the times of the first two impacts
with the ground were recorded. This test was done in increments of 0, 5, 10, 15 and 20 minutes
to simulate potential game use durations. Additionally, Fuji Prescale pressure indicating film
was used to determine the pressure distribution between the puck and the ice during the striking
of a puck. The film contained microcapsules which released die when pressure was applied. The
variety of tests were intended to compare the three types of pucks at ambient conditions, over
different temperature ranges, and while a force is applied through a shot by a player. Tensile tests
(ASTM D412) and Charpy Impact (ASTM E-23) tests were conducted to determine the impact
toughness of the pucks. Tensile testing was performed by the breaking of pucks through tensile
forces using an Instron machine. The test was used to compare the force and time data to create
a stress-strain curve for each puck type. Impact testing consisted of machining the pucks to a
specified set of dimensions and striking them with a hammer to determine the breaking force
needed to fracture the sample.

6
Technical Papers
This work was developed into two technical papers as follows: 1. Steven J. Deane-Shinbrot, Jonathan A. Rapp and Satya Shivkumar, “Temperature,
Pressure Characterization, and Surface Analysis of Elastomeric Hockey Pucks”.
Accepted for publication in ANTEC 2013 proceedings. Accepted for presentation
in the Polymer Analysis Division as the part of the Annual Society of Plastics
Engineers Conference Cincinnati, OH, April 22-24, 2013.
2. Steven J. Deane-Shinbrot, Jonathan A. Rapp and Satya Shivkumar, “Mechanical
Characteristics of Elastomeric Hockey Pucks under Practice and Game
Conditions”. Submitted for Publication to the Journal of Material Science (2013).
This MQP report is presented in the form of the two publications listed above.
The publications are attached in the following pages.
7
Paper #1 Steven J. Deane-Shinbrot, Jonathan A. Rapp and Satya Shivkumar, “Temperature, Pressure
Characterization, and Surface Analysis of Elastomeric Hockey Pucks”. Accepted for
publication in ANTEC 2013 proceedings. Accepted for presentation in the Polymer Analysis
Division as the part of the Annual Society of Plastics Engineers Conference Cincinnati, OH,
April 22-24, 2013.
Temperature, Pressure Characterization, and Surface Analysis of Elastomeric Hockey Pucks
Steven J. Deane-Shinbrot, Jonathan A. Rapp and Satya Shivkumar
Department of Mechanical Engineering,
Worcester Polytechnic Institute, Worcester, MA 01609
Abstract The mechanical and material properties of two different forms of elastomeric hockey
pucks were found. In order to determine the cause in performance variation, an analysis of
temperature variations, surface roughness and pressure distributions was performed. The surface
roughness and pressure distributions varied from puck to puck, indicating a possible cause for
altered game play. After removing the pucks from a freezer and storing them in an ice bucket for
the duration of game play, game and practice pucks increased in temperature at similar rates.
Controlling the rate of heating could provide a consistent vertical bounce for both types of puck
and standardized for league play. The data demonstrated that the quality of pucks differs from
each individual manufacturer, while batch to batch variations from the same manufacturer were
negligible. Due to constant changes in temperature of the elastomeric hockey pucks, the thermal
expansion and, the resulting oscillating stresses can affect puck performance. Controlling the
temperature would make the pucks would become more predictable based on their elastomeric
makeups.

8
Introduction The primary material composition of hockey pucks comes from vulcanized rubber with a mix
of additives. Carbon black is the primary additive used in the pucks, which gives the puck its
color and reduces the number of crosslinking bonds, thus slightly reducing the tensile strength
and making the pucks more rubbery [7]. The rubber is made mainly from the elastomer,
polyisoprene. Unvulcanized rubber is made up of long polymeric molecules, each with a degree
of polymerization of a thousand or more of the structural unit C5H8 [8]. Beginning as an elastic
polymer rubber, it is vulcanized by adding extreme heat with sulfur to the rubber causing the
rubber to become impervious to hot and cold temperatures [1]. This method is used for its ability
to improve the mechanical properties of the puck through the addition of crosslinking polymers,
which increased the tensile strength of the elastomer. As a result, one can expect an increase in
the mechanical properties of the hockey puck, such as a higher tensile strength, as well as an
increase in elasticity, tear resistance, and the glass transition temperature.
During game play the following mechanical properties of the puck are most influential;
coefficient of restitution, surface roughness and the rate of heating. The influence of these
conditions defines the game play and can affect the overall performance of players. Prior to
game play hockey pucks are kept inside freezers to reduce the amount of bounce on the ice [4].
In addition, pucks are frozen to reduce the amount of friction between the puck and the ice
allowing for a smoother transition over the ice’s surface. The standards for a National Hockey
League (NHL) game dictate pucks to be frozen for ten days prior to game play [6]. The
American Hockey League (AHL) team, the Worcester Sharks, indicates that the pucks are
maintained in a freezer at -8 °C. Further investigation into these loose standards suggests that the
refrigeration units used for freezing the pucks are small house-hold refrigeration units with only
somewhat accurate temperature controls. In addition, the variation of pucks used for practice
and game situations based on the surface roughness have not been taken into account nor
investigated.
The purpose of this project is to characterize the effects of temperature and pressure on the
pucks while developing an understanding of the influences each mechanical property has during
different game-like situations. Finally this project will recognize how the pucks react to changes
in temperature and the effect of this on the performance in game-like situations. The issues

9
previously defined have prompted a study into the effects of temperature and the different
environments hockey pucks are used in.
Statement of Theory and Definitions
The geometric dimensions of the puck are as follows; 25.4 mm thick, 76.2 mm diameter, and
a weight of 155.9 to 170.0 grams. To produce a puck, the rubber is mixed and fed through giant
rollers until the rubber is at a state where it will harden at the appropriate temperature. After
that, it is fed into an extruder which produces logs which are then cut into rough puck sized
molds. Next, the molds are heated for roughly 18 minutes at 148.9°C causing a diamond crossed
pattern to form on the edges of the grip. Finally, the pucks sit for a 24 hour cooling period after
which they are cleaned with a trimmer [2].
The actions of a hockey puck in this circumstance first needs to be examined for its
interaction with ice. The puck is primarily in contact with ice throughout a game while only
making short duration contact with hockey sticks and the boards. The main factor during this
interaction is the friction between the ice and the puck. The coefficient of friction between a
puck and ice, 𝜇, is roughly less than 0.15 [1]. Considering this number is so small it is clear why
the pucks glide easily over the ice during play. The surface roughness of the puck will affect the
interaction between it and the ice by adding to, or reducing, the friction between surfaces. As
demonstrated by Bowden in the 1950’s, the frictional force lowers with increasing velocity while
skiing or sledding [1]. The same principle can be applied to pucks which provide a constant
force on the ice during sliding.
Methodology Hockey pucks were obtained from various sources in order to replicate different game-like
situations possible for testing. These included AHL game pucks produced by Sherwood of
Sherbrooke, QC, Canada, AHL practice pucks produced by In Glas Co. of Slovakia, and
Commercial off the Shelf (COTS) shelf pucks made in the Czech Republic. This collection of
pucks allowed for comparisons between game and practice puck quality to compare them to
pucks the average person would obtain.
The surface roughness of the Sherwood and In Glas Co. pucks were examined and compared
using an Olympus LEXT OLS4000 laser confocal microscope with OLS4000 software package.

10
This machine provided the images necessary to transfer into the Mountains Map Premium and
Sfrax 2008 software. This software was used to determine the roughness of each specimen.
Samples were studied using the 5X magnification setting and analyzed on a micrometer scale
(600 x 600). In order to simulate game-like situations, a sample of each brand of puck was
played with for 5, 10, 15, and 20 minutes. This time frame selection was based on the time of a
single period of play. In addition, a comparison was performed for the two manufacturers,
showing varying performances during use, according to players and coaches.
In order to compare the effects of different use temperatures on the bounce of the pucks a
vertical rebound characteristic test (ASTM F2117-10) was performed at room temperature. In the
lab the pucks were frozen and then placed in a bucket of ice before being dropped in front of a
yard stick as shown in Figure 1, A. The pucks were frozen at -30 °C for 24 hours and allowed to
heat up in a bucket of ice (standard way of storing pucks during games) for periods of 0, 5, 10,
15, and 20 minutes. Next they were dropped from a height of 1803.4 mm. The time of the first
(t1) and second (t2) impacts of the puck on the surface were recorded and used to approximate the
rebound height using the following equation, where ∆𝑡(𝑠) is the difference in time between the
impacts:
∆𝑡(𝑠) = 𝑡2 − 𝑡1 (1)
This time was calculated five times for each duration and then averaged to get a final time
difference for each section. These were then put into the following equation to obtain the
rebound heights (H(I, j)) for each sample:
𝐻(I,j) = 1.23(∆𝑡 − 𝐾𝑟)2 (2)
Kr is the resting time constant for select sports balls (ASTM F-2117-10), which is provided in the
standard to be 0.038 for hockey balls, the closest option to pucks. The data from this testing was
used to calculate the coefficient of restitution for each trial (Table 1).

11
Figure 1- Experimental setup: Equipment for the vertical rebound test (A); The temperature and
pressure measurement are shown in (B).
Temperature testing was conducted to determine how quickly the elastomeric pucks
increased once removed from an ice bucket, as they are stored in game situations. Cole-Parmer
thermal temperature strips, with a range of 0 to 30 °C were adhered to the pucks (Figure 1, B)
and then stored in a freezer at -30 °C. Pucks were then placed in the ice bath for increments of 5,
10, 15, and 20 minutes and their temperatures were recorded. This was repeated without putting
the pucks into the ice bath by just leaving them at ambient temperature (23 °C) to compare the
rates of heating (see Figure 3 below).
To determine the pressure distribution or loads applied to the polymer structure of the pucks
during game play, Fuji Prescale was applied to the lower surface of the puck, which made
contact with the ice. The Prescale was put in a plastic locking bag in order to keep moisture out
and then super glued to the base of the puck. Four different pressure sensitive films were tested:
0.05 to 0.2 MPa, 0.2 to 0.6 MPa, 0.5 to 2.5 MPa, and 2.5 to 10 MPa, allowing measurement
comparisons to be made based on different impact pressures caused by interfacial forces on the
elastomer. The distributions were read based on a chart provided by Fuji and converted to
pressures after the pucks were hit by a single skater for consistency.
Results and Discussion Discussions with the equipment managers of multiple local professional hockey clubs have
shown that the rubber hockey pucks used for game play do not perform the same as pucks of
another brand used for practice. Although the manufacturing processes for different
manufacturers remains proprietary information, the known method of producing pucks involves
the mixing of vulcanized rubber with multiple additives. This process is assumed to be similar
12
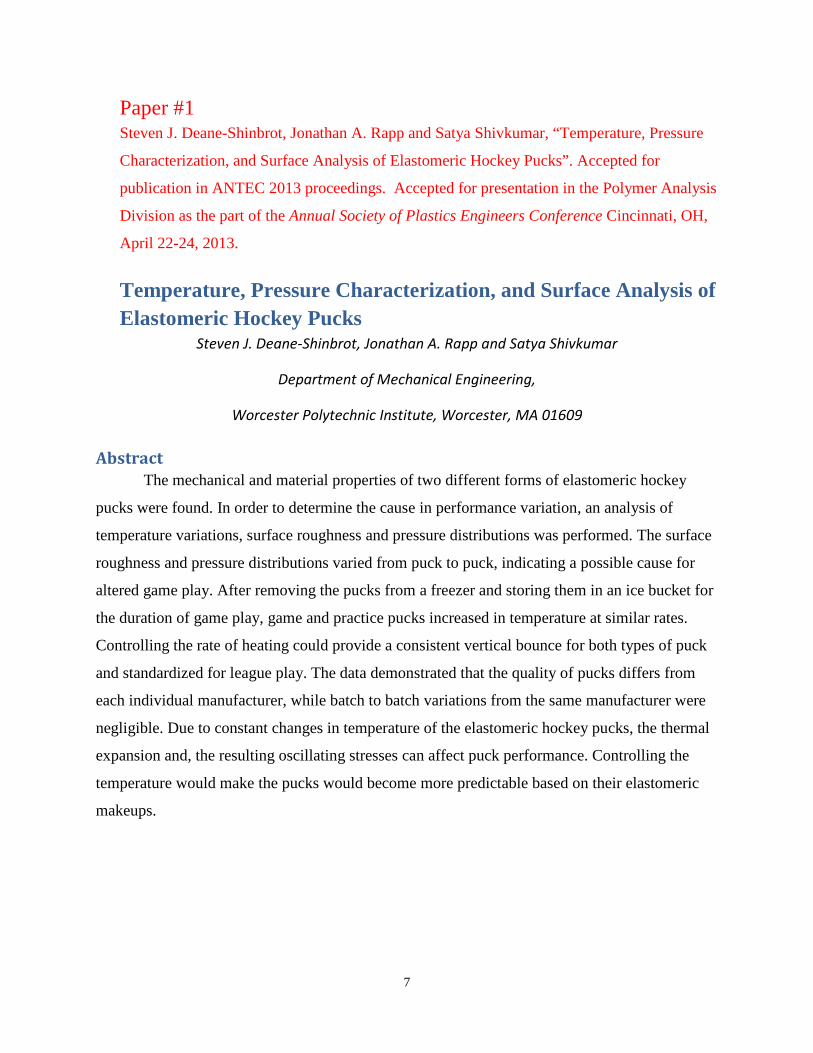
amongst manufacturers, yet the pucks behave differently. Microscopy testing results (Figure 2)
displayed a significant difference in surface structure between different pucks, the likely cause
being a slight difference in the manufacturing. The Sherwood game pucks had a raw average
roughness of 16.8 µm while the practice pucks from In Glas Co., had an average roughness of
13.9 µm. For comparison the surface roughness of smooth steel piping is 20 µm, concrete
(smooth) is 300 µm, and glass is 0.1 µm [12]. This difference in roughness is observed in the
imagery produced by the microscope.
Figure 2-Surface roughness of game versus practice pucks (marker shows 100µm x 100µm scale).
After use on the ice, the pucks from both manufacturers showed an overall decrease in
roughness from the unused state, however, it appeared to change based on the amount of use
experienced by the pucks (Figure 2). For example, after 20 minutes of game play the game pucks
had a roughness of 13.1 µm and the practice pucks 8.5 µm. This decrease in roughness may be
caused by the ice becoming rougher as it is used through the course of the period causing layers
of the puck to wear down and smooth out. Another explanation for the decrease in roughness due
to continuous hitting would be that the strain rate is operating under extreme conditions. This
would lead to small fractures in the rubber or even cause chipping on the surface making the
faces smoother. This drop in surface roughness from the typical roughness shows a correlation to
different gameplay with the puck and effects properties such as friction between the puck and the
ice.
The elastic properties of the vulcanized rubber were tested on hockey pucks following
ASTM F2117-10. These tests were performed in order to characterize their vertical rebound
after being frozen and allowed to warm up over different time spans. The elastic vertical rebound

13
height and the coefficient of restitution were calculated using the raw data. A peak in rebound
height of 63.4 mm was observed after five minutes of warming up in the ice bucket, while the
lowest height was recorded after 20 minutes of warming at 40.3 mm, which was less than the
unheated height of 54.2 mm. The pucks which were in the ice for 20 minutes reached a final
temperature of -4 °C, shown in Figure 3. This demonstrates a large variation in the potential
temperature of a puck during the period which will change the properties of the pucks being used
as the game goes on. Although the bounce height of the puck decreased as the pucks began to
increase in temperature, so too did the duration of time between bounces meaning they will more
frequently jump, just not as high. This will affect a player’s ability to control the puck and make
it more difficult to predict how it will react on the ice.
Figure 3-Variation of temperature with time (A. is game and B. is practice puck).
These temperature readings were also compared to pucks taken from a freezer at -30 °C and
allowed to warm up at ambient temperature to see the rate of heating of the pucks. Both the game
and practice pucks increased in temperature at the same rate; however it took 17 more minutes
for the pucks in the ice bucket to reach 0 °C than those sitting at ambient temperature (23°C).
Using the data from the ambient testing estimates the pucks reaching room temperature of 25 °C
after a 20 minute wait period. This shows that although the pucks will warm up as the game goes
on; the ice bucket has a significant impact on controlling the temperature of the pucks. In
addition, the ice bucket will preserve the consistency of the mechanical properties. Along with
this, the pucks will always remain above the glass transition temperature of their main
component, polyisoprene, which is -72.2 °C. As a result of this the pucks will always have very

14
rubbery properties, especially after 20 minutes of warming. Also, these studies have shown the
mechanical properties of polyisoprene, such as Young’s modulus, tensile strength, and
toughness, to decrease with increasing temperature [5]. This can be related to the chipping of
pucks reported by local clubs. The most likely cause is using pucks which are not cold enough
being used.
Data from the temperature testing was used to approximate the expansion of the rubber (𝛥𝐿)
due to exposure to temperature changes. The coefficient of expansion (α) has been reported to be
670x10-6 per K [11]. This value was used with the following equation, where ΔT is the change in
temperature and L is the diameter of the puck, to show a slight increase in puck size (diameter)
the longer it is left in an ice bucket (Table 2):
𝛥𝐿 = 𝛼 ∗ 𝛥𝑇 ∗ 𝐿 (3)
As one can see from the table the maximum theoretical expansion the puck can undergo is about
1.3 mm if allowed to warm for 20 minutes. This change could dramatically affect the feel of the
puck on the stick and influence thermal stresses by expanding the polymers in the puck.
The thermal stresses (σ) being applied to the puck due to the temperature change were also
calculated and tabulated in Table 2 using the Young’s Modulus (E) of 1.3x10⁶ Pa for vulcanized
polyisoprene:
σ=E* 𝛼 ∗ 𝛥𝑇 (4)
If allowed to warm for 20 minutes, over 22 KPa of thermal stresses may be acting on the puck
when compared to a frozen one. This increase in puck size due to thermal expansion may affect
the way the puck plays on the ice. Along with this, the increasing stress as the puck warms up
will enable failures in the rubber, causing fractures and chipping which renders an undesirable
puck performance.
Fuji Prescale was used to develop pressure distribution patterns for the pucks. Prescale is a
litmus paper with a thin polyester film containing a layer of microcapsules. When certain
pressures are applied to the film these burst leaving permanent patterns which show the
distribution of pressure based on the color intensity [9]. Pressure readings were measured from
0.05 MPa to 10 MPa from a single slap shot taken on the puck while on ice and distribution

15
differences were observed between practice and game pucks. Few samples had an even
distribution of pressure from the impact on the puck (Figure 4). A possible outcome could be that
the pucks are not completely flat which will cause variation in player’s shots depending on
which puck they hit, but more than likely could be attributed to inconsistencies between shots
taken. The deepness of the color when compared to the density of the distribution, did
demonstrate a noticeable difference in impact pressures. The practice pucks left a darker
distribution than the games pucks in all tests indicating higher pressure readings. This variation
may be attributed to the practice pucks being smoother than the game pucks and having more
area to come in contact with the ice.
Figure 4-Pressure pattern comparing game (A.) and practice (B.) pucks.
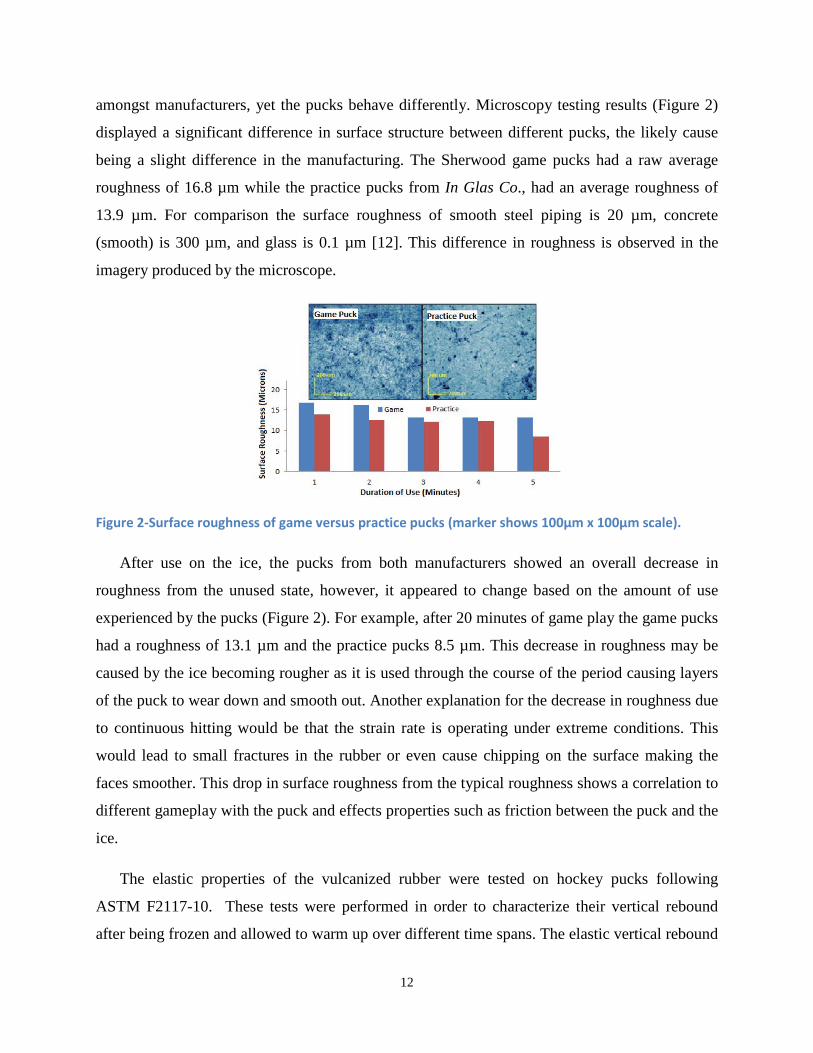
A comparative analysis was performed between practice pucks taken from a freezer and
placed in an ice bath as done with temperature readings (Figure 5). Pucks which had been in the
ice bath longer warmed up more and left lower pressure readings on the films than those that
were colder. Data from the vertical drop test combined with known information about
polyisoprene suggests that the material becomes more rubbery as it heats up (well above the
glass transition temperature) which may be translating to less contact with the ice when an
impact force is applied to it. Table 3 shows the approximate pressures for each scenario. The
difference in pressure drop from the frozen puck to one that had been heated for 20 minutes
shows a decrease of 0.5 MPa with a 26 °C temperature increase. Along with this the puck may
have undergone an expansion of 1.3 mm due to the increasing temperature as well as have
increased thermal stresses acting on it (Table 2). This data is showing that as the puck increases

16
temperature the rubbery properties take over and the interfacial forces weaken between the
rubber and the ice.
An example of another application in which Fuji Prescale was used surrounded joint testing
for knees. In this test interfacial forces were applied and measured with loads of 1000 N at
different approach angles. The Prescale was able to give pressure patterns which in turn were
used to record and display data for each situation [10]. Prescale was also used to test the contact
area of a cylinder head where the gasket would be placed. The results from this test were
compared to and validated those of finite element analysis software examining the same pieces.
The examination showed the Prescale to be accurate for its purposes [9]. These testing show the
reliability and quality of the Fuji Prescale film and that our results are likely an accurate
portrayal of the behavioral characteristics of the puck and ice interfacial forces. The information
gained from this test allows one to analyze the differences in pressure distributions between
practice and game pucks as well as frozen versus warmer pucks.
Figure 5-Pressure pattern for practice pucks with increasing time in ice bucket (A. is no time, B. is 20
minutes in the ice bath).
Conclusions Hockey is a popular and growing sport in North America and the use of standardized
elastomeric pucks is common throughout the continent. However, having multiple manufacturers
has led to inconsistent puck performance. Mechanical properties of polyisoprene have been
shown to decrease as a result of an increase in temperature, making the pucks more likely to fail

17
during game play, the longer they are kept out of a freezer. The pressure distributions and surface
roughness before and after play were significantly different between the two manufacturers,
while the rates of heating were very similar. The practice pucks were less rough and created
larger pressure values during a normal shot than the game pucks. The mechanical properties of
the puck can be affected by the temperature changes resulting from improper storage during
practice and game conditions. Developing a set of standards regarding the storage temperatures
of the pucks would allow more control in attaining expected behavior from pucks and lead to
more uniform gameplay.
References 1. A. Haché, The Physics of Hockey, Johns Hopkins UP, Baltimore, (2002).
2. How It's Made (2007).
3. J. Crabtree and A. R. Kemp, Industrial & Engineering Chemistry, 18, 278-296 (1946).
4. J. Mason, What Could Be Simpler than Making a Small Rubber Disk?, ( 1990).
5. M. Baboo, M. Dixit, K. Sharma and N. S. Saxena, AIP Conference Proceedings, 1249, 87-90 (2010).
6. NHL, Official Rules, (2012).
7. P. Boochathum and S. Chiewnawin, European Polymer Journal, 37, 429-434 (2001).
8. P. J. Flory, Chemical Reviews, 35, 51-75, (1944).
9. P. J. Jorwelar, Y. V. Birari and M. M. Nadgouda. Bolted Joint.(2012).
10. R. Allaire, M. Muriuki, L. Gilbertson and C. D. Harner, The Journal of Bone and Joint Surgery, 1922-931 (2008).
11. R. Zhang, Polymer Data Handbook, 607-619 (1999).
12. Typical Surface Roughness, (2012).

18
Table 1-Coefficient of Restitution for pucks after samples were removed from the -30 °C freezer and left out for times indicated.
*Note that this data has an error of 1.6%.
Table 2-Linear expansion and thermal stresses of elastomeric hockey pucks compared to duration of freezing.
Table 3-Pressure readings with respect to time allowed warming in ice bucket for practice pucks.
Duration of Freezing
(min)Temperature
(°C)
Average Rebound Time
(sec)
Coefficient of
Restitution0 -30 0.248 0.0305 -25 0.265 0.03510 -15 0.256 0.03215 -5 0.228 0.02520 -4 0.219 0.022
Duration of Freezing (min)
Temperature Change (°C)
Linear Expansion (mm)
Thermal Stresses (Pa)
0 0 0 05 5 0.255 4355
10 15 0.766 1306515 25 1.276 2177520 26 1.327 22646
Duration of Warming (min) Pressure Reading (MPa)0 0.2005 0.18010 0.17515 0.16020 0.150

19
Paper # 2 Steven J. Deane-Shinbrot, Jonathan A. Rapp and Satya Shivkumar, “Mechanical
Characteristics of Elastomeric Hockey Pucks under Practice and Game Conditions”.
Submitted for Publication to the Journal of Material Science (2013).
Mechanical Characteristics of Elastomeric Hockey Pucks under Practice and Game Conditions
Steven J. Deane-Shinbrot, Jonathan A. Rapp and Satya Shivkumar
Department of Mechanical Engineering,
Worcester Polytechnic Institute, Worcester, MA 01609
Abstract Currently loose standards exist concerning preparation of hockey pucks prior to
gameplay. Hockey clubs typically use different manufacturers for the pucks used during practice
and game situations. This has led to inconsistencies in the game play and performance of pucks.
A lack of studies performed to determine conditions for optimal performance, or differences
between manufacturers has led to this research. The surface temperature, pressure and tensile
properties surface roughness for various commercial pucks were measured. The surface
temperature increased by 25°C after 20 minutes of play and surface pressure during strike was
measured to be about (0.2MPa). Freezing conditions can affect impact toughness and
performance of the puck, along with other mechanical properties. Controlling these puck
properties will allow for improved puck performance during game play.
Key Words: Hockey puck, polyisoprene, elastomer

20
Introduction When hockey pucks were first developed their intended purpose pertained to their use in
the Irish game of hurley. At this point the pucks were balls with bottoms and tops cut off to stop
them from rolling on ice [1]. Today, hockey pucks have evolved into black disks 25.4 mm thick,
76.2 mm in diameter, with a weight of 155.9 to 170.0 grams [2]. Roughly 48 of these black disks
are prepared for each National Hockey League (NHL) game. Thus a total of over 60,000 pucks
are used in each NHL season. A similar quantity can be expected to be used in other minor and
recreational leagues.
Hockey pucks are made of vulcanized polyisoprene with a molecular weight of 100,000
to 1 million g/mol, and a level of crosslinking with sulfur to be between 30 and 40%, along with
a mix of additives [3]. Vulcanization can improve properties such as tensile strength, stiffness,
wear resistance and glass transition temperature [4]. The primary additive in hockey pucks, used
as a filler, is carbon black (95-120 phr) [5]. This filler imparts the puck its dark color and reduces
the aggregate number of crosslinks [6]. This reduction in crosslinking leads to a slight decrease
in the tensile strength. A proper control of the crosslinking and additive concentration is vital in
optimizing the interaction of the puck with the skating surface, boards, and sticks of players. In
addition, these variables can also determine the overall useful life of the puck with the ice,
boards, and sticks of players.
The transit of the puck during play is determined by its interaction with the surface ice.
The ice is maintained at approximately -10°C by running brine (water and salt mixture) under the
ice [4]. As the puck travels on the ice surface, frictional effects become significant and may lead
to localized melting. A thin layer of water (8 nm thick) may form on top of the ice leading to the
slipperiness that allows the puck to slide. As the puck rests on the ice surface, the pressure
exerted on it will enable more melting. At the same time, untouched ice re-freezes, which leads
to regulation of the temperature of the surface. The pressure exerted on the puck is caused by
dynamic forces applied to the puck. These forces vary by player and shot, as players’ ability to
strike the puck widely varies throughout different positions. There has been no analysis
performed evaluating the variation of puck temperatures and their effect on gameplay. The same
can be said about the effect of the variation of quality among multiple manufacturers.

21
The way the puck bounces on the ice plays an important role in the game play of hockey,
since it affects how the puck can be shot, handled and saved. The Coefficient of Restitution
(COR) provides a way to measure the bounce that occurs during the interaction between the puck
and the ice. When a puck bounces on the ice it maintains between 45-55% of its original velocity
[4]. Anderson and Smith studied the effects of different striking speeds on the coefficient of
restitution for two different brands of pucks at room temperature (22 °C) and a frozen
temperature of -4 °C [7]. The study found that the COR varied between the two brands and
temperatures of pucks, however was focused on the speed of the pucks during testing. Their
experiments did not take into account the alternate range of temperatures a puck may experience
before use and the effects on the bounce due to this range. This is the only pertinent research that
has already been conducted at the university level relating to hockey pucks.
Prior to game play, pucks are stored inside a freezer. This pre-game method is done for
two main reasons. Primarily, it is to reduce the amount of bounce on ice but also to decrease the
friction between the puck and ice [8]. Current National Hockey League standards dictate the
pucks be frozen for ten days prior to game play [9]. In general, professional hockey teams
maintain the puck at approximately -8°C. Quite often, significant variations in temperatures can
be observed during storage because pucks are typically stored in household refrigeration units
with modest temperature control. The lack of regulation of storage on the puck will produce
different game-play in each arena and even amongst players on a single team. Additionally,
different pucks are used for practices and games at the professional level, leading to reports that
these pucks play differently.
The purpose of this research is to characterize the effects of temperature, surface
roughness, and other mechanical properties on hockey puck during game-play. Furthermore, the
performance between pucks produced by different manufacturers will be compared.
Additionally, laboratory test data, such as pressure distribution and the change in coefficient of
restitution will be used to make conclusions on the performance of the pucks. These results can
be used to gauge the conditions for consistent play during game and practice use.

22
Materials and Methodology Hockey pucks were obtained from various sources in order to replicate different game-
like situations for testing. These included; American Hockey League (AHL) game pucks
produced by Sherwood of Sherbrooke, QC, Canada, AHL practice pucks produced by In Glas
Co. of Slovakia, and generic pucks made in the Czech Republic. This collection of samples
provided the opportunity for a comparison of the quality of game, practice and generic pucks.
The surface roughness of the game, practice and generic puck were examined using an
Olympus LEXT OLS4000 laser confocal microscope with OLS4000 software package. This
machine provided visual images of each puck’s surface, which was analyzed by Mountains Map
Premium and Sfrax 2008 software. This software was used to determine the roughness of each
specimen. Samples were studied at a magnification of 5X and analyzed on a micrometer scale
(600 µm x 600 µm). In order to examine the surface variations during play, each brand of puck
was examined after 5, 10, 15 and 20 min of regular play. It should be noted that pucks are
typically used for a maximum of 20 min before they are discarded.
In order to compare the effects of varying puck temperatures during play on the bounce of
the pucks, a vertical rebound characteristic test was performed at room temperature according to
ASTM F2117-10. Initially, pucks were stored at -30 °C for 24 hr and then placed in a bucket of
ice. The pucks were then removed from the ice bucket after various times (5, 10, 15, and 20 min)
and then dropped in front of a yard stick from a height of 1803 mm as shown in Figure 1 (A).
The time of the first (t1) and second (t2) impacts of the puck on the ground surface were recorded
and used to approximate the rebound height using the following equation:
∆𝑡(𝑠) = 𝑡2 − 𝑡1 (1)
Here ∆𝑡(𝑠) is the difference in time between the impacts. This time difference was calculated
for each of the times (5, 10, 15 and 20 min) in the ice bucket. At least five experiments were
conducted under each condition and an average value of Δ(t) was calculated. This difference was
used to obtain the rebound heights (h(i)) for each sample in the following equation:
ℎ(i) = 1.23(∆𝑡 − 𝐾𝑟)2 (2)

23
Kr is the resting time constant for select sports balls (ASTM F-2117-10). Kr is unknown
for hockey pucks; however, it has been measured for hockey balls and has been reported to be
0.038. This value was used to calculate the rebound height in equation (2). The data obtained
from this test were used to calculate the coefficient of restitution for each trial, and thus the
bounciness of the pucks under each condition. Here, h(i) is the rebound height for each point and
hrelease is the height the pucks were dropped from, as seen in equation (3):
𝐶𝑂𝑅 = ℎ(i)
ℎrelease (3)
During game conditions, hockey pucks may be taken out of the ice bucket and stored under
ambient conditions before being used for play. As a result, the temperature of the puck may
increase, which may affect the performance of the puck. The increase in temperature of the puck
after removal from the ice bucket was estimated using Cole-Parmer thermal temperature strips
(EW-90316-00 & EW-90308-20), with a range of -30 °C to 13 °C. The strips were attached to
the upper surface of the pucks (Figure 1 B), which were then stored in a freezer at -30 °C. The
pucks were then placed in an ice bath for 5, 10, 15, and 20 min while their temperatures were
recorded (Figure 2). In addition, some pucks were directly transported from the freezer (-30 °C)
to ambient conditions (i.e. no ice bucket storage). Thus, the effect of ice bucket storage on
temperature variation on the surface of the puck could be elucidated.
The pressure distribution on the surface of the puck during a strike was measured using, Fuji
Prescale. This pressure indicating film displays a color pattern based on the applied pressure.
Prescale is a litmus paper with a thin polyester film containing a layer of microcapsules. When
pressures are applied to the film the microcapsules burst leaving permanent patterns which show
the distribution of pressure based on the color intensity [10]. These testing strips were applied to
the lower surface of the pucks that make contact with the ice. The dimensions of the Prescale
film were 100 mm by 120 mm, making the film larger than the diameter of the puck (seen in
Figures 5-8). This difference in size, along with the sensitivity of the film, led to marking on the
film outside of the area where the puck was struck from handling the film. The film was handled
carefully to prevent these marks from appearing where the puck was struck and should be
disregarded. The Prescale was put in a zip lock bag in order to keep moisture out and then super
glued to the base of the puck. Pressure sensitive films with the ability to be accurate under

24
different ranges were used: 0.05 to 0.2 MPa, 0.2 to 0.6 MPa, 0.5 to 2.5 MPa, and 2.5 to 10 MPa.
This method allowed for measurement comparisons to be made based on different striking forces
on the elastomer. The pressure at a given point on the puck was estimated based on a color chart
provided by Fuji. During the pressure measurement, a single player was used to strike the puck
for most of the tests in order to maintain consistency. In some tests semi-professional players
from local divisional hockey leagues skating at different positions (forward and defensemen)
were also used. In this case, the effect of varying strike ability of the players at different
positions on the puck pressure distribution was compared. The pressure distribution patterns
were measured with game, practice and generic pucks. Practice pucks, were more likely to be
used at varying temperatures, and were also tested after being kept in the ice bucket (and
removed to ambient conditions then struck immediately) for 5, 10, 15 and 20 min to determine
the effects of warming on pressure distribution.
In order to compare measured effects of interfacial forces between the puck and ice with
a numerical technique, finite element analysis conducted by Travis Mikjaniec (2012) was used.
A puck was produced using the simulated rubber material in order to be as close to the
vulcanized rubber hockey pucks as possible. The material was then impacted at a 100 mph to
simulate high end strain rate applied to a puck by a professional athlete. The results of the
impacts provided simulated information about where the pucks experience the most force and
how those forces change with different speeds of strikes.
Notched bar impact testing, ASTM E-23, was conducted on the elastomeric specimen in
order to quantify applications of loading due to impact at various temperatures and high strain
rates. The pucks were machined down 55 x 10 x 10 mm rectangles with a centered slot and notch
(Type B). Twenty four specimen were put through the impact testing (3 of each group as
follows); game used by a professional, game pucks not used, practice, game and generic pucks at
3 different temperatures (-20, -10 and 0 °C), and practice, game and generic pucks each used for
5, 10 and 15 mins. Each specimen was taken from its storage location and set in the specimen
supports where it is then impacted by a charpy impact machine within 5 s. Data from the
breaking of the material was then analyzed to determine what kinds of strain rates and stresses
the pucks undergo. These values were compared between the use situations above to try and
identify effects of factors such as temperature and wear.

25
The constant impact forces exhibited on hockey pucks during game play causes the pucks to
experience compressive stresses at high rates. Due to this tension testing (ASTM D412) was
conducted to see how the rubber would react when under a constant load. This information can
be correlated to the constant loading and unloading of a puck in a game and be used with impact
testing to evaluate puck performance. Samples were produced with dimensions of 75 mm by 1.5
mm. The specimens were then placed in an Instron machine and forces were applied to produce
a deflection rate of 0.0083 m/sec. This was repeated multiple times and the required forces were
recorded in order to calculate the percent deflection of the rubber.
Results and Discussion The data shown in Figure 3 indicate that most pucks generally exhibit a relatively rough
surface with undulations and pores. The surface roughness is typically on the order of 5-15 µm.
Significant differences were observed between the generic, game and practice pucks. The game
pucks were covered in small craters and looked rough. The practice pucks were smooth looking
with minor holes and large scratches on their surface. The generic pucks appeared to have a high
porosity with pores of varying size on the surface. The average surface roughness was measured
to be on the order of 9.9±3.1 µm, 13.9±3.1 µm and 16.8±3.1 µm for the generic, practice and
game pucks respectfully. By comparison, the surface roughness of smooth steel piping is about
20 µm, concrete (smooth) is 300 µm, and smooth glass is 0.1 µm [11]. This difference in
roughness is observed in the imagery produced by the microscope. Variations in the surface
roughness of unused pucks will lead to differences in play out of the box. Since some pucks are
smoother than others they will be easier to slide on the ice and thus outperform the other brands,
making the feel of a practice or generic puck different than the one used in a game situation.
After use on the ice, the pucks from all manufacturers showed an overall decrease in surface
roughness compared to the unused state; however, the change was based on the amount of use
experienced by the pucks (Figure 3). For example, after 20 min of game play the surface
roughness was measured to be 6.6±3.1 µm, 6.5±3.1 µm and 8.9±3.1 µm for game, practice and
generic pucks respectfully. This decrease in roughness may be caused by the ice becoming
rougher as it is used through the course of the period causing layers of the puck to wear down
and smooth out. Another possible explanation for the decrease in roughness may be due to
continuous striking. The viscoelastic properties of the puck can also enable a higher level of
friction between the puck and the ice. Both of these factors will increase the surface temperature

26
of the puck as it is used (Figure 4). It can be seen that this increase in temperature is similar for
game, practice and generic pucks. After almost 30 min of play, the surface temperature can
increase by almost 30 °C. However, it took 17 more min for the pucks in the ice bucket to reach
0 °C than those sitting at ambient temperature (23 °C), showing the importance of ice bucket
storage for maintaining low puck temperature during use. The pucks also will remain above the
glass transition temperature of their main component, polyisoprene, which is -72.2 °C [12].
Being above the glass transition temperature will preserve the consistency of the mechanical
properties, such as Young’s modulus, tensile strength, and toughness, which have been shown to
decrease with increasing temperature [13]. The increase in temperature of the pucks once
removed from the freezer could lead to small fractures in the rubber, possibly even chipping on
the surface making the faces smoother, thus affecting puck performance.
The elastic vertical rebound height and the coefficient of restitution were calculated using the
data from the vertical drop test. The results show a general increase in the coefficient of
restitution, as well as peak rebound height corresponding to an increase in temperature for game
and practice pucks while the generic pucks remained fairly stable. Pucks that were tested
immediately after removal from the freezer generally had a low rebound height (Table 1). There
was a significant difference in rebound height between generic (54.24 mm), game (2.8 mm) and
practice (14.9 mm) pucks. When the frozen pucks were transferred to the ice bucket and
removed after various times, both the game and practice pucks exhibited a maximum rebound
height after 20 min when the surface temperature was about -4 °C. By comparison, generic pucks
exhibited the maximum rebound height after 5 min (63.4 mm) when the surface temperature was
~ -25 °C. The lowest rebound height (40.3 mm) was recorded after 20 min in the ice bucket
(temperature ~ -4 °C). These results demonstrate that professional grade pucks bounce higher but
less frequently as the surface temperature increases and the generic pucks bounce lower but more
frequently under the same conditions. The rebound data (Table 2) indicate that the coefficient of
restitution can also change with temperature. The results show COR increasing with temperature
for game and practice pucks. Generic pucks, however, show a slight reduction in COR with
increasing surface temperature. The change in COR with increasing time in the ice bucket leads
to variations in bounce and wear pattern of the puck. This variation can influence a player’s
ability to control the puck and affect reaction time.

27
The measured surface temperatures were used to estimate approximate expansion of the
rubber (𝛥𝐷) due to temperature changes. The coefficient of expansion (α) has been reported to
be 670x10-6 °K-1 for polyisoprene [12]. This value was used along with ΔT (change in
temperature) and D (diameter of the puck) to determine the approximate change in diameter as a
function of time in the ice bucket (Table 3):
𝛥𝐷 = 𝛼 ∗ 𝛥𝑇 ∗ 𝐷 (4)
The maximum theoretical expansion a puck can undergo is about 1.3 mm if allowed to warm
for 20 min. This change could dramatically affect the feel of the puck on the stick and influence
thermal stresses by expanding the polymers in the puck.
The pressure distribution on the puck (struck by an amateur player) as measured by the Fuji
Prescale film is shown in Figure 5. The pressure can range between 0.005 to 10 MPa at the
bottom surface of the puck. The pressure values varied with location and the type of puck.
Inconsistencies in the player’s strike may lead to variations in the pressure distribution and
hence, several tests were conducted under identical conditions. General representative behaviors
are shown in Figure 5. Game pucks generally show higher pressures at the strike end and on the
edges of the opposite side of the puck. In this case, the pressure at these locations was on the
order of 0.18 MPa. The central portions of the puck experience much lower pressure. Practice
pucks experienced higher stresses (0.2 MPa) and over a larger area. The lowest pressures (0.15
MPa) and smallest areas were seen in generic pucks (Figure 5 C). This behavior correlates well
with the roughness of the puck. Both game and practice pucks had a much higher surface
roughness and thus experience significant pressures. The generic pucks had the lower roughness
and thus could develop fewer interactions with the rough ice. As a result, the pressure developed
on the puck can be much smaller. Note that the lines running in the direction of the strike in
some for some of the experiments. This is most likely caused by the energy waves transferring
from the stick to the puck during striking; they should not be regarded as part of the patterns.
Figure 5 (D) shows a game puck which was struck on a higher level Fuji Prescale film, with a
wider range of sensitivity (0.2 to 0.6 MPa). This was used to evaluate any changes in pressure in
this larger range. It was able to pick up pressures as larger as 0.5 MPa. The drawback to using
this film is the lower level of sensitivity. Due to this, the film with the higher sensitivity (0.05 to
0.2 MPa) was used for the other experiments.

28
Since the practice pucks left the strongest pressure distributions at ambient temperatures, a
comparative analysis was performed between practice pucks taken from a freezer and placed in
an ice bath (20 min) (Figure 6). Pucks which had been in the ice bath longer warmed more and
left lower pressure readings and smaller areas on the films than those that were colder. Data from
the vertical drop test combined with known information about polyisoprene suggest that the
material becomes more rubbery as temperature increases (well above the glass transition
temperature) translating to less contact or sticking between the puck and ice when an impact
force is applied. Table 3 shows the approximate peak pressures for each case. Note that the peak
pressure between samples tested immediately after freezing and after 20 min in the ice bucket
can differ as much as 0.05 MPa. These data may result from the increase in temperature observed
for two cases (-30 °C after freezing and ~ -5 °C after 20 min in ice bucket). Since the higher
pressures were observed in samples tested immediately after freezing, it would be desirable to
use the pucks taken straight from the freezer for best performance. In other words, the time pucks
are in the ice bucket should be eliminated or minimized for optimal performance and reliability.
When comparing hockey players’ shots there can be many differences amongst players of the
same position, let alone players of different positions. In order to examine this difference, a semi-
professional forward and a defenseman (divisional league) were each asked to strike the puck
using their typical slap shot on the puck with Fuji Prescale (Figure 7). Both players’ shots
produced pressure distributions along the edge of the puck where the stick made contact with it.
The forward’s shot produced a smaller distribution with a stronger force (0.2 MPa) than that of
the defensemen (0.175 MPa). This may be credited towards a quicker strike versus the stronger
shot of a defenseman, whose shot produced twice the distribution size. The larger distribution
may also be cause for the impact to have spread throughout the puck, making it appear weaker.
The pressure distribution on the puck when it is struck plays an important role in the overall
game. In this contribution, the surface pressure distribution was measured. Mikjaniec [14] has
estimated the affects of a 100 mph slap shot on the puck itself to show the forces applied to the
body of the puck and the overall distribution force. This study was done numerically using a
finite element analysis. Mikjaniec found that the highest forces were exerted on the puck directly
where it was struck (on the range of 0.1025 MPa). The forces travel through the puck in a pattern
similar to a ripple effect and weaken as the reach the opposite edge of the puck (0.0999 MPa).

29
This gradual decrease in force applied to the body of the puck the farther from the contact point
enhances the reasoning for the pressure distributions to lack an even distribution under the puck.
Translating this finding to the bottom surface of the puck would explain why the patterns are
usually focused on either the back or the front (if it is accidentally lifted) off the puck. The
theoretical values are slightly less than some of the recorded pressure values between the bottom
of the puck and the ice. This difference in pressure values may show an influence on the angle of
strike translating to stronger downward forces as the puck is pressed into the ice. When analyzed
with the findings from the surface roughness test, this shows how different puck types which
have different surface roughness values will all feel very different when struck by a player. Since
the values from both experiments are on the same order, the results help to solidify the accuracy
of the Fuji Prescale data from the testing.
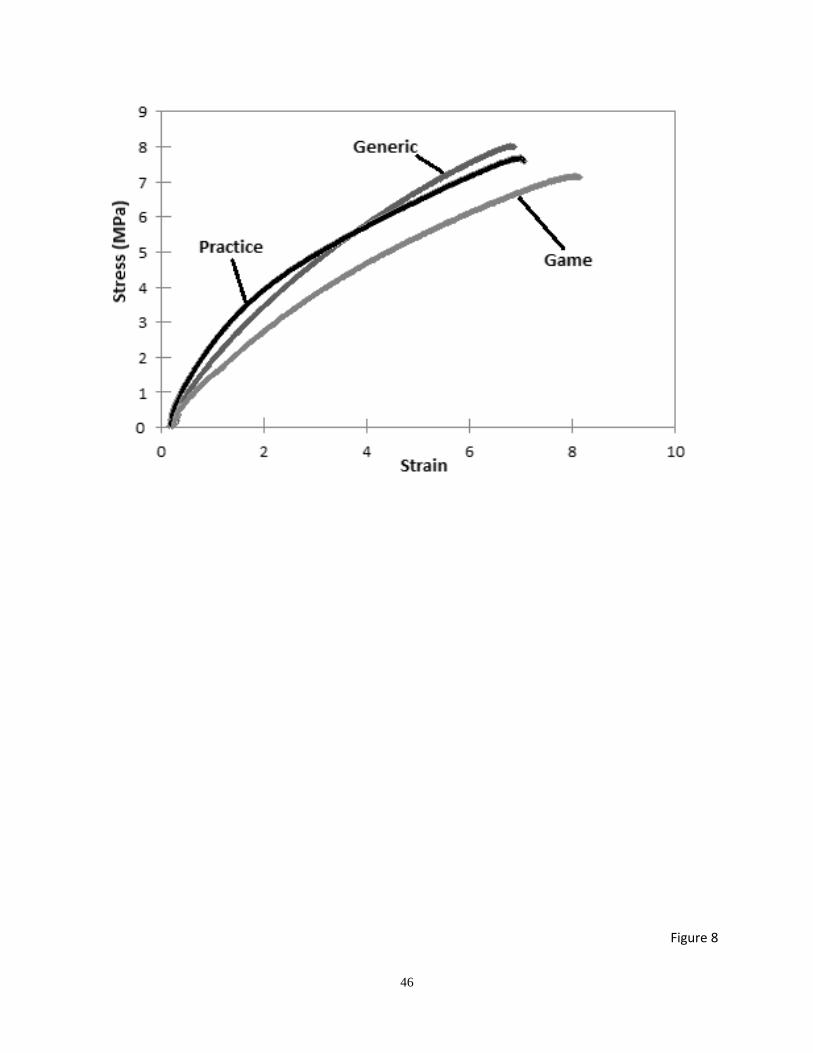
The toughness of the puck can be a major factor in determining the wear that occurs during use.
A simple estimate of toughness can be obtained from a tensile stress-strain curve (Figure 9). Toughness is
directly proportional to percent ductility which was obtained from the stress-strain models. The percent
ductility was measured to be 687, 814 and 707 for generic, practice and game pucks respectively. This
can be correlated to the game pucks being the toughest and the generic pucks having the lower toughness.
The tensile strength was very similar among the pucks, ranging from 7.13-8 MPa. Additionally, the
elastic modulus was calculated to be 3x10⁶ for practice and generic pucks and 4x10⁶ for game pucks
summarized in Table 4). These results show a strong difference in the elastic properties and the
toughness of each type of puck. Since toughness plays a large role in the wear caused on a puck,
these results indicate a potentially large variation in failure rates which may be seen among the
pucks.
Charpy impact testing was used to determine the impact energies of the hockey pucks,
which can be correlated to the toughness of the pucks. The impact energy was measured on the
order of 0.68-1.35 J. Typically; generic pucks (1.35 J) exhibited slightly higher impact energies
than either of the practice or game pucks (0.68 J). As received pucks produced impact energies
on the order of 0.95 J. Compared with other materials such as steel (200 J [15]) hockey pucks are
much lower. The data indicate that there was a decrease in toughness with a decrease in
temperature. Additionally, toughness decreased with use for all of the puck types. This is most
likely due to the small cracks and wearing developed by the pucks after being used (seen in
microscope data-Figure 3).

30
Conclusions Hockey is a popular and growing sport in North America and the use of standardized
elastomeric pucks is common throughout the continent. Having multiple manufacturers has led
to inconsistent puck performance in the professional and amateur levels. Measurements of the
surface roughness of pucks revealed an overall decrease in surface roughness with use. This is an
important point to note since pucks which are not cycled out of games may experience too much
wear and fail during use, primarily through chipping. Different puck types were also compared
as received and had large variations of unused roughness. This difference could potentially affect
the way players handle the puck since different types are used at practices and games. Using
pressure indicating film for the first time between a hockey puck and the ice it is used on,
differences in how much pressure is exerted by different types of players and pucks were
recorded. Game, practice and generic pucks all had different unused pressure distributions,
which may correlate to their differences in roughness. Semi-professional forwards hit the pucks
with higher pressures but defensemen produced larger areas of pressure. The increase of storage
temperature of the pucks was also measured in order to determine the effectiveness of the current
storage standard for pucks, which starts them in a freezer before games where they are then
stored in an ice bucket. The bucket proved to be effective in maintaining a lower temperature
than if the pucks were moved directly to ambient conditions but still allowed for a 26 °C increase
in temperature over a 20 min period (length of a regulation period). Additionally all of the puck
types underwent impact toughness testing in two forms: tensile testing and charpy impact testing.
These data showed generic pucks being the toughest of the three types, but more importantly
displayed a decrease in toughness with temperature and wear on the pucks. This means that the
longer pucks are used the less effective they become making failures more common. Overall
investigation into hockey pucks has revealed that the temperature they are used at could be a
controlling factor in the performance of the pucks. If clubs and local players alike minimize the
time pucks are kept from freezer-like conditions the performance of the puck will be at its peak,
translating to more consistent game play and a lower change of physical failure.

31
References 1. B. Sorensen, The History of Hockey Puck0, (2011).
2. How It's Made (2007).
3. J. Gwynne, Chemistry in Its Element: Compounds, Royal Society of Chemistry, (2013).
4. A. Haché, The Physics of Hockey, Johns Hopkins UP, Baltimore, (2002).
5. N. Douglas, Rubber Compound for Hockey Pucks (Patent 5330184), (1994).
6. P. Boochathum and S. Chiewnawin, European Polymer Journal, 37, 429-434 (2001).
7. R. Anderson, L. Smith, Experimental Characterization of Ice Hockey Sticks and Pucks, Washington State University, (2008).
8. J. Mason, What Could Be Simpler than Making a Small Rubber Disk?, ( 1990).
9. NHL, Official Rules, (2012).
10. P. J. Jorwelar, Y. V. Birari and M. M. Nadgouda. Bolted Joint.(2012).
11. Typical Surface Roughness, (2012).
12. R. Zhang, Polymer Data Handbook, 607-619 (1999).
13. M. Baboo, M. Dixit, K. Sharma and N. S. Saxena, AIP Conference Proceedings, 1249, 87-90 (2010).
14. T. Mikjaniec, Hockey Puck Aerodynamics, (2012).
15. E. Branders, G. Brook, Smithell’s Metals Reference Book, 7, (1992).

32
List of Figures Figure 1-Experimental setup (A): Equipment for the vertical rebound test (ASTM F-2117-10) including:
stand (1), pucks dropped from 1803.4 mm (2), yard stick (3), pucks bouncing off of ground (4), ice
bucket (5), and freezer (6). Part (B) shows temperature strips (2) applied to top surface of pucks and
pressure indicating film (3) applied to bottom surface of pucks (2).
Figure 2-Process for recording variations in surface temperature for pucks.
Figure 3-Surface roughness of game, practice, and generic pucks are shown with respect to duration of use.
Also displayed are laser confocal microscope images showing the differences between each of the
unused puck’s surfaces. Note the following on the microscope images: craters (A), scratches (B) and
pores (C).
Figure 4-Variation of surface temperature with time for game, practice and generic pucks after being stored
in a freezer at -30 °C. The puck (1) insert shows how the temperature strips (2) were adhered to the
surface for temperature readings.
Figure 5-Pressure distribution measured through the attachment of a Fuji Prescale pressure indicating film
on the bottom surface of the puck. The pressures were measured during a typical strike (arrow
indicates direction) on the puck and can be seen in the intensity of the gradation. The black ring
represents the puck, and the gradation within this ring is the pressure distribution from the strike.
The rectangle around the black ring is the indicating film and marks on this are only from handling.
The following pucks; Game (A), Practice (B), and Generic (C) can were struck at ambient
temperature (25°C). Additionally another game puck (D) reading was take using a different Prescale
with a larger range (0.2-0.6 MPa) for comparison. The scale as provided by data from the
manufacturer.
Figure 6-Pressure distribution measured through the attachment of a Fuji Prescale pressure indicating film
on the bottom surface of the puck. The pressures were measured during a typical strike (arrow
indicates direction) on the puck and can be seen in the intensity of the gradation. The black ring
represents the puck, and the gradation within this ring is the pressure distribution from the strike.
The rectangle around the black ring is the indicating film and marks on this are only from handling.
The following pucks were tested; (A) Practice puck at ambient temperature (25°C), and (B) Practice
puck which was struck after experiencing 20 min in an ice bath. The scale as provided by data from
the manufacturer.
Figure 7-Pressure distribution measured through the attachment of a Fuji Prescale pressure indicating film
on the bottom surface of the puck. The pressures were measured during a typical strike (arrow
indicates direction) on the puck and can be seen in the intensity of the gradation. The black ring
represents the puck, and the gradation within this ring is the pressure distribution from the strike.

33
The rectangle around the black ring is the indicating film and marks on this are only from handling.
This figure shows a semi-professional hockey player slap shot pressure distribution for a forward (A)
and a defenseman (B). The scale as provided by data from the manufacturer. For comparative
purposes an interpretation of Travis Mikjaniec’s finite element analysis on a hockey puck struck at
100 mph (professional speed) is shown to compare internal puck forces from a shot to what pressures
these forces create on the ice.
Figure 8-Calculated stress-strain curves of practice, game and generic hockey pucks from data acquired by
conducting a tensile test (ASTM D412) using an Instron machine.

34
List of Tables Table 1- Rebound height of pucks dropped from 1803 mm (ASTM F-2117-10) for different
puck brands. Data from several experiments are displayed to estimate the rebound height under each condition. The pucks were frozen at -30 °C for 24 hr, transformed to an ice bucket and removed after the times indicated (t) before testing. Data for 3 different types of puck are shown.
Table 2-Coefficient of Restitution (COR) measured according to ASTM F-2117-10 for Game, Practice and Generic Pucks. The pucks were removed after 24 hr in the freezer which was at -30 °C. Subsequently, they were placed in an ice bucket and removed for testing after the indicated times (t1). The measured temperature on the surface immediately from the ice bucket (T1) is also shown.
Table 3- Estimated change in diameter (ΔD) of the puck. The measured surface pressure of practice pucks is shown for various conditions using Fuji Prescale.
Table 4- Tensile properties of hockey pucks estimated from the data shown in Figure (8). The data were measured at room temperature from as-received pucks at a strain rate of 0.0083 m/sec.

35
Table 1- Rebound height of pucks dropped from 1803 mm (ASTM F-2117-10) for different puck brands. Data from several experiments are displayed to estimate the rebound height under each condition. The pucks were frozen at -30 °C for 24 hr, transformed to an ice bucket and removed after the times indicated (t) before testing. Data for 3 different types of puck are shown.
t (min)Rebound
Height (mm)0 2.8±0.055 17.1±0.0510 11.8±0.0515 113.7±0.0520 353.4±0.050 14.9±0.015 16±0.0110 2±0.0115 15.4±0.0120 56.3±0.010 54.2±0.015 63.8±0.0110 58.5±0.0115 44.4±0.0120 40.3±0.01
Game
Practice
Generic

36
Table 2- Coefficient of Restitution (COR) measured according to ASTM F-2117-10 for Game, Practice and Generic Pucks. The pucks were removed after 24 hr in the freezer which was at -30 °C. Subsequently, they were placed in an ice bucket and removed for testing after the indicated times (t). The measured temperature on the surface immediately from the ice bucket (T) is also shown.
t (min) T (°C) Generic Game Practice0 0 0.030 ±0.01 0.002±0.05 0.008±0.015 5 0.035±0.01 0.009±0.05 0.009±0.01
10 15 0.032±0.01 0.007±0.05 0.001±0.0115 25 0.025±0.01 0.063±0.05 0.009±0.0120 26 0.022±0.01 0.196±0.05 0.031±0.01
Coefficent of Restitution

37
Table 3- Estimated change in diameter (ΔD) of the puck. The measured surface pressure of practice pucks is shown for various conditions using Fuji Prescale.
t (min) T (°C) ΔD (mm)PeakPressure
(MPa)0 0 0 0.2005 5 0.26 0.180
10 15 0.77 0.17515 25 1.28 0.16020 26 1.33 0.150

38
Table 4- Tensile properties of hockey pucks estimated from the data shown in Figure (8). The data were measured at room temperature from as-received pucks at a strain rate of 0.0083 m/sec.
Puck Type Elastic Modulus Tensile Strength (MPa) % DuctilityGame 4.00E+06 7.58 707
Practice 3.00E+06 7.13 814Generic 3.00E+06 7.99 687

39
Figure 1

40
Figure 2

41
Figure 3

42
Figure 4
43
Figure 5

44
Figure 6

45
Figure 7
46
Figure 8

47
Overall MQP Conclusions
Hockey is a popular growing sport in North America and the use of standardized
elastomeric pucks is common throughout the continent. However, having multiple manufacturers
has led to inconsistent puck performance. The lack of consistent hardware or standards for puck
storage also has a great effect on the performance of pucks used by different clubs. Along with
determining a definite difference in surface roughness (16.9 µm, 13.9 µm and 9.87 µm for game,
practice and generic respectively) of used and unused pucks from different manufacturers, a new
way to determine the differences in pressure distributions between the pucks was developed.
This was useful in finding that practice pucks left the strongest distribution (0.2 MPa) and that
temperature and surface roughness greatly influenced the interactions between the puck and the
ice (decreased both area and strength). Preliminary charpy impact testing of hockey pucks under
different storage and use conditions was also conducted to determine the effect of these variables
on the toughness of the pucks. Generic pucks (1.35 J) proved to be the toughest of the three
types, producing toughness readings on the order of 0.5-1.35 J. Additionally, the toughness was
found to decrease with a decrease in temperature and increase in use. The surface temperature of
the puck, which proved to be the most influential property as far as affecting the other tests,
increased by 25 ºC after 20 min of use (simulating the length of a hockey period). This drastic
change in temperature demonstrates how important it is to use an ice bucket to keep the pucks
cooler during use. It was found to improve puck performance, pucks should be used directly out
of a freezer or minimal time in an ice bucket. Also if teams just use one puck type they will
observe more consistent; bounce, pressure distributions and surface roughness. , All of these
properties can affect the way players control the puck. The findings show that controlling factors
such as surface temperature and duration of use, will produce pucks which perform more
consistently and will not physically fail during use.

48
References 1. J. Gwynne, Chemistry in Its Element: Compounds, Royal Society of Chemistry, (2013).
2. M. Baboo, M. Dixit, K. Sharma and N. S. Saxena, AIP Conference Proceedings, 1249, 87-90 (2010).
Related Documents