This article appeared in a journal published by Elsevier. The attached copy is furnished to the author for internal non-commercial research and education use, including for instruction at the authors institution and sharing with colleagues. Other uses, including reproduction and distribution, or selling or licensing copies, or posting to personal, institutional or third party websites are prohibited. In most cases authors are permitted to post their version of the article (e.g. in Word or Tex form) to their personal website or institutional repository. Authors requiring further information regarding Elsevier’s archiving and manuscript policies are encouraged to visit: http://www.elsevier.com/copyright

Welcome message from author
This document is posted to help you gain knowledge. Please leave a comment to let me know what you think about it! Share it to your friends and learn new things together.
Transcript
This article appeared in a journal published by Elsevier. The attachedcopy is furnished to the author for internal non-commercial researchand education use, including for instruction at the authors institution
and sharing with colleagues.
Other uses, including reproduction and distribution, or selling orlicensing copies, or posting to personal, institutional or third party
websites are prohibited.
In most cases authors are permitted to post their version of thearticle (e.g. in Word or Tex form) to their personal website orinstitutional repository. Authors requiring further information
regarding Elsevier’s archiving and manuscript policies areencouraged to visit:
http://www.elsevier.com/copyright
Author's personal copy
Mechanical characterisation of the fouled ballast in ancient railwaytrack substructure by large-scale triaxial tests
Viet Nam Trinha,b, Anh Minh Tanga, Yu-Jun Cuia,n, Jean-Claude Duplaa, Jean Canoua,Nicolas Calonb, Lucie Lambertb, Alain Robinetb, Olivier Schoenc
aEcole des Ponts ParisTech, Laboratoire Navier/CERMES, FrancebDirection of Engineering—SNCF, France
cRFF, France
Available online 8 June 2012
Abstract
In the track substructure of ancient railways in France, a fouled ballast layer has often been created with time. The mechanical
behaviour of this coarse soil was studied in the laboratory using a large-scale triaxial cell. The soil taken from the fouled ballast layer of
an ancient railway was re-compacted to a dry density of 2.01 Mg/m3 at three water contents (4, 6, and 12%) corresponding to three
values of the initial degree of saturation (32, 48, and 100% respectively). Both monotonic and cyclic triaxial tests were performed under
constant water content conditions. The experimental results gave the following evidence of the significant effect of the water content on
the soil mechanical behaviour: (i) the lower the compaction water content, the higher the shear strength; (ii) a permanent axial strain of
0.4% was found after a large number of cycles at a water content of 4%, while it was 1.4% at the higher water content of 6%. For the
saturated soil specimen, failure was even observed after a limited number of cycles. Based on the results obtained, a constitutive model
for permanent deformation was elaborated, that accounts for the stress level, the number of cycles and the soil water content.
& 2012 The Japanese Geotechnical Society. Production and hosting by Elsevier B.V. All rights reserved.
Keywords: Fouled ballast; Railway track substructure; Large-scale triaxial test; Cyclic behaviour; Water content effects; Constitutive modelling
1. Introduction
A fouled ballast layer refers to a layer within the railwaytrack substructure, located in between the ballast and thesubgrade soil (UIC, 2003). For the new high-speed lines inFrance, a sub-ballast layer or capping layer has been
designed and constructed according to the technical speci-fications of the French National Railway Company(SNCF, 2006). By contrast, in the substructure of ancientrailway tracks, there is no such sub-layer and a fouledballast layer was created naturally. After Fortunato et al.(2010), the formation of this layer can be attributed tovarious mechanisms, for example, grain size modificationin ballast particles due to cracking, weathering or crushing,the infiltration of materials from the surface, the infiltra-tion of materials from an underlying layer, and theweathering of the sleepers. In order to respect the newrequirements corresponding to the increase in load and thespeed of trains, numerous ancient railway lines have beenmodernised, repaired or rehabilitated in France. Prelimin-ary investigations conducted at different sites show thatpoor drainage was the major cause of track deterioration.
The Japanese Geotechnical Society
www.sciencedirect.comjournal homepage: www.elsevier.com/locate/sandf
Soils and Foundations
0038-0806 & 2012 The Japanese Geotechnical Society. Production and hosting by Elsevier B.V. All rights reserved.
http://dx.doi.org/10.1016/j.sandf.2012.05.009
nCorrespondence to: Ecole des Ponts—ParisTech, Laboratoire Navier/
CERMES, 6-8 Avenue Blaise Pascal, Cite Descartes, Champs-sur-Marne,
77455 Marne-La-Vallee, France. Tel.: þ33 1 64 15 35 50;
fax: þ33 1 64 15 35 62.
E-mail address: [email protected] (Y.-J. Cui).
Peer review under responsibility of The Japanese Geotechnical Society.
Soils and Foundations 2012;52(3):511–523
Author's personal copy
For this reason, a drainage system has been installedsystematically (SNCF, 2006) in spite of the extra costs.On the other hand, it has been observed that somesubstructures of ancient railways in excavation zoneswithout drainage systems do not show any stabilityproblems, indicating the necessity of optimising the designof drainage systems. Actually, the railway platform stabi-lity is closely related to the mechanical sensibility of thefouled ballast to variations in the water content; thus, it isobviously necessary to better understand its hydro-mechanical behaviour.
Large-scale triaxial tests are usually carried out to studythe mechanical behaviour of ballast-based materials understatic and cyclic loading. Most works have been performedon ballast (Raymond and Williams, 1978; Stewart, 1986;Raymond and Bathurst, 1994; Indraratna et al., 1998;Suiker et al., 2005; Lackenby et al., 2007; William andPeter, 2008), while a few works have been carried out onsub-ballast (Suiker et al., 2005). The test results show thatunder cyclic loading, these materials tend to compact. Thiscompaction behaviour generally causes an increase in themechanical strength and stiffness. Generally, after a largenumber of loading cycles, the resilient behaviour stabilizes,but the permanent strain increases (Kalcheff and Hicks,1973; Brown, 1974; Li and Selig, 1994; Selig and Water,1994; Gidel et al., 2001; Malla and Joshi, 2008; Ekblad,2008). According to Selig and Water (1994), failureinduced by the accumulation of plastic strain underrepeated loads takes place when the material becomessaturated or when the drainage capacity is insufficient.This shows the significant effects of the water content andthe drainage conditions on the mechanical behaviour.
The influence of the water content on the permanentdeformation of Unbound Granular Materials (UGM) wasstudied by Gidel et al. (2002), Ekblad (2006), andWerkmeister et al. (2003). The results show that the watercontent strongly affects the resilient modulus and the
permanent deformation under cyclic loading; increasingthe water content causes a reduction in the resilient modulusand an increase in the permanent deformation. These kindsof studies on the hydro-mechanical behaviour of coarse-grained materials for railway application remain rare.In constitutive modelling, the permanent deformation is
usually predicted by accounting for the stress level(Shenton, 1974; Lekarp and Dawson, 1998) or the numberof cycles (Barksdale, 1972; Paute et al., 1988; Sweere, 1990;Hornych et al., 1993; Wolff and Visser, 1994). Gidel et al.(2001) proposed a model to predict the permanent defor-mation of UGM as a function of both the stress level andthe number of loading cycles based on the results oftriaxial tests with a multi-stage loading procedure. Perezet al. (2006) also proposed a model accounting for theeffects of both the stress level and the number of cycles,but the experimental data considered for the modelcalibration were from the cyclic triaxial tests following astandard procedure, i.e., single-loading stage procedure.In the present paper, the effects of the water content of
the fouled ballast on its shear strength parameters andpermanent deformation were investigated by carrying outboth monotonic and cyclic triaxial tests. Based on theresults obtained and the model presented by Gidel et al.(2001), a constitutive model was elaborated, allowing thedetermination of permanent strain by taking into accountthe stress level, the number of load cycles, and the watercontent.
2. Soil studied
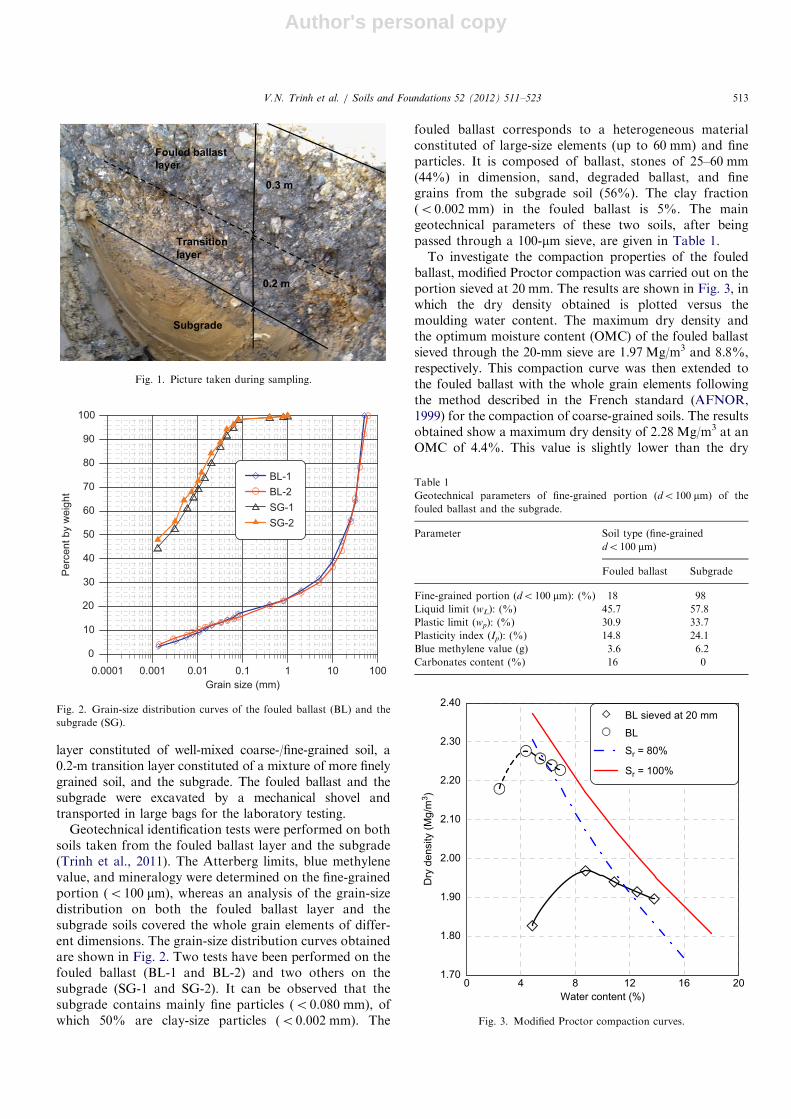
The soil studied was taken from Senissiat (North-West ofLyon, France), located along an ancient line from Bourg-en-Bresse to Bellegarde. At the moment of sampling, the linewas being rehabilitated; the ballast layer had been removedfor this purpose. Fig. 1 presents a picture taken during thesampling. A visual examination shows a 0.3-m fouled ballast
Nomenclature
Cu coefficient of uniformityc apparent cohesionD diameter of specimend diameter of graindmax maximum diameter of graindx diameter of grain defined by x% passing
grain sizeN number of cyclesq deviator stressqmax maximum deviator stressDq amplitude of cyclic deviator stressDqmax maximum amplitude of cyclic deviator stressp mean stressDp amplitude of cyclic mean stressDpmax maximum amplitude of cyclic mean stress
Sr degree of saturationSri initial degree of saturationw water contentOMC optimal moisture contente1 axial straine1
p permanent axial straine1
r reversible axial straine1
p(N) permanent axial strain at N cyclese1
pn(N) permanent axial strain from 100 cycles toN cycles
ev volumetric strainevmax maximum volumetric strainev
p permanent volumetric strainj friction angleu Poisson’s ratios3 confining pressure
V.N. Trinh et al. / Soils and Foundations 52 (2012) 511–523512
Author's personal copy
layer constituted of well-mixed coarse-/fine-grained soil, a0.2-m transition layer constituted of a mixture of more finelygrained soil, and the subgrade. The fouled ballast and thesubgrade were excavated by a mechanical shovel andtransported in large bags for the laboratory testing.
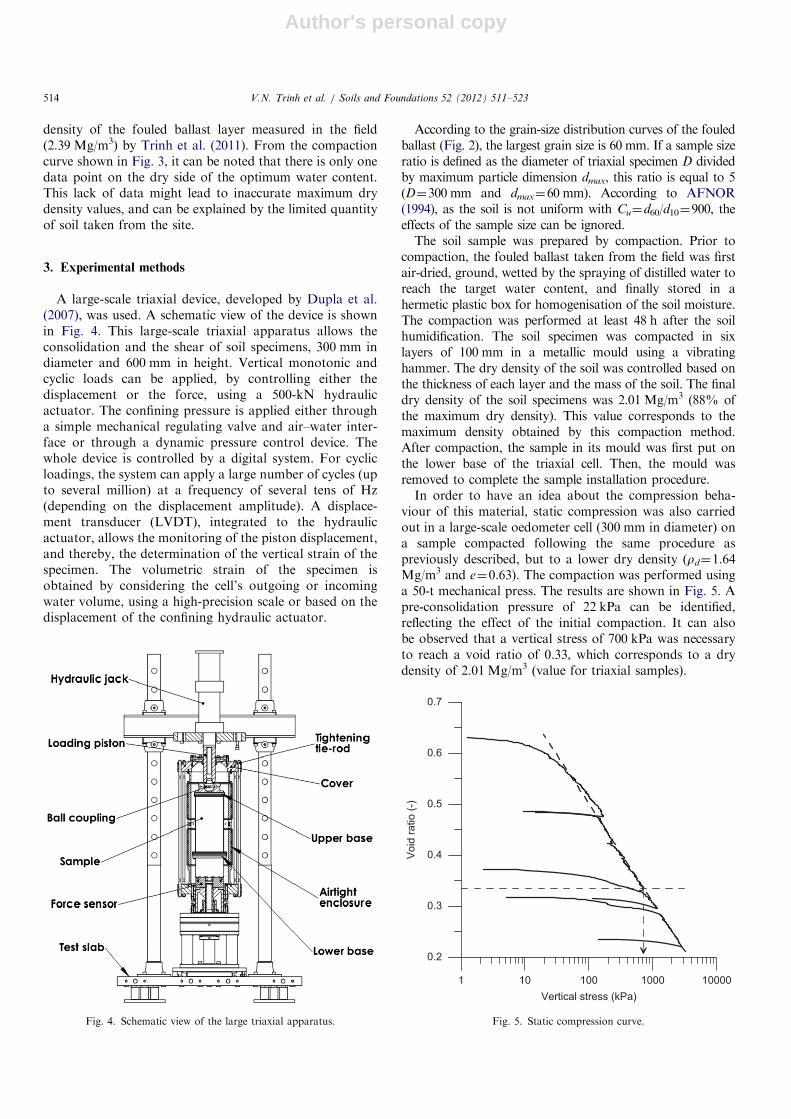
Geotechnical identification tests were performed on bothsoils taken from the fouled ballast layer and the subgrade(Trinh et al., 2011). The Atterberg limits, blue methylenevalue, and mineralogy were determined on the fine-grainedportion (o100 mm), whereas an analysis of the grain-sizedistribution on both the fouled ballast layer and thesubgrade soils covered the whole grain elements of differ-ent dimensions. The grain-size distribution curves obtainedare shown in Fig. 2. Two tests have been performed on thefouled ballast (BL-1 and BL-2) and two others on thesubgrade (SG-1 and SG-2). It can be observed that thesubgrade contains mainly fine particles (o0.080 mm), ofwhich 50% are clay-size particles (o0.002 mm). The
fouled ballast corresponds to a heterogeneous materialconstituted of large-size elements (up to 60 mm) and fineparticles. It is composed of ballast, stones of 25–60 mm(44%) in dimension, sand, degraded ballast, and finegrains from the subgrade soil (56%). The clay fraction(o0.002 mm) in the fouled ballast is 5%. The maingeotechnical parameters of these two soils, after beingpassed through a 100-mm sieve, are given in Table 1.To investigate the compaction properties of the fouled
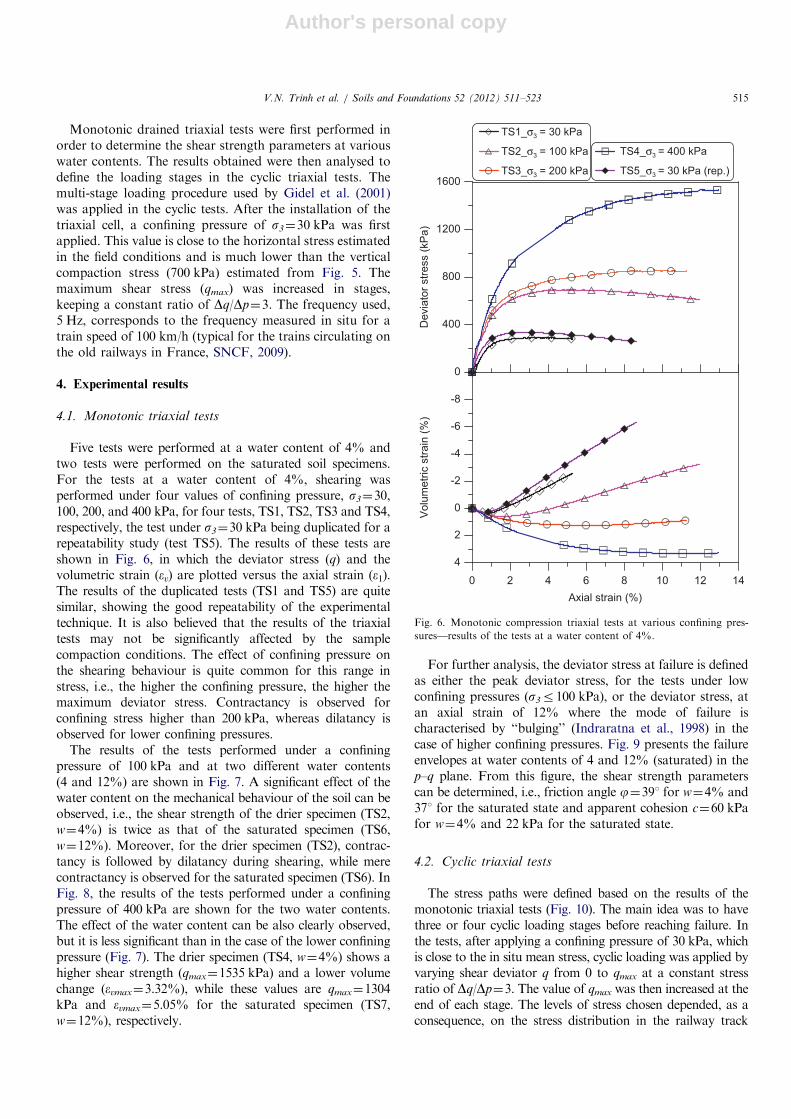
ballast, modified Proctor compaction was carried out on theportion sieved at 20 mm. The results are shown in Fig. 3, inwhich the dry density obtained is plotted versus themoulding water content. The maximum dry density andthe optimum moisture content (OMC) of the fouled ballastsieved through the 20-mm sieve are 1.97 Mg/m3 and 8.8%,respectively. This compaction curve was then extended tothe fouled ballast with the whole grain elements followingthe method described in the French standard (AFNOR,1999) for the compaction of coarse-grained soils. The resultsobtained show a maximum dry density of 2.28 Mg/m3 at anOMC of 4.4%. This value is slightly lower than the dry
Subgrade
Transitionlayer
0.3 m
0.2 m
Fouled ballastlayer
Fig. 1. Picture taken during sampling.
0.0001 0.001 0.01 0.1 1 10 100Grain size (mm)
0
10
20
30
40
50
60
70
80
90
100
Per
cent
by
wei
ght
BL-1BL-2SG-1SG-2
Fig. 2. Grain-size distribution curves of the fouled ballast (BL) and the
subgrade (SG).
Table 1
Geotechnical parameters of fine-grained portion (do100 mm) of the
fouled ballast and the subgrade.
Parameter Soil type (fine-grained
do100 mm)
Fouled ballast Subgrade
Fine-grained portion (do100 mm): (%) 18 98
Liquid limit (wL): (%) 45.7 57.8
Plastic limit (wp): (%) 30.9 33.7
Plasticity index (Ip): (%) 14.8 24.1
Blue methylene value (g) 3.6 6.2
Carbonates content (%) 16 0
40 8 12 16 20Water content (%)
1.70
1.80
1.90
2.00
2.10
2.20
2.30
2.40
Dry
den
sity
(Mg/
m3 )
BL sieved at 20 mm
BL
Sr = 80%
Sr = 100%
Fig. 3. Modified Proctor compaction curves.
V.N. Trinh et al. / Soils and Foundations 52 (2012) 511–523 513
Author's personal copy
density of the fouled ballast layer measured in the field(2.39 Mg/m3) by Trinh et al. (2011). From the compactioncurve shown in Fig. 3, it can be noted that there is only onedata point on the dry side of the optimum water content.This lack of data might lead to inaccurate maximum drydensity values, and can be explained by the limited quantityof soil taken from the site.
3. Experimental methods
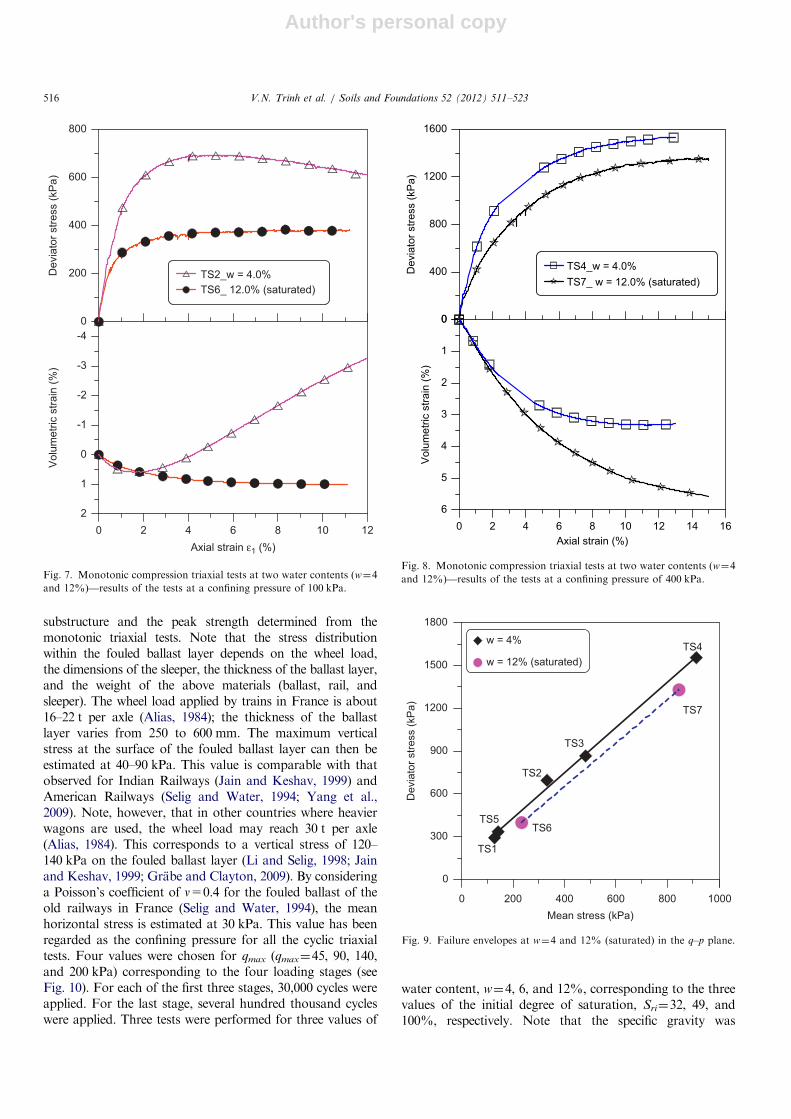
A large-scale triaxial device, developed by Dupla et al.(2007), was used. A schematic view of the device is shownin Fig. 4. This large-scale triaxial apparatus allows theconsolidation and the shear of soil specimens, 300 mm indiameter and 600 mm in height. Vertical monotonic andcyclic loads can be applied, by controlling either thedisplacement or the force, using a 500-kN hydraulicactuator. The confining pressure is applied either througha simple mechanical regulating valve and air–water inter-face or through a dynamic pressure control device. Thewhole device is controlled by a digital system. For cyclicloadings, the system can apply a large number of cycles (upto several million) at a frequency of several tens of Hz(depending on the displacement amplitude). A displace-ment transducer (LVDT), integrated to the hydraulicactuator, allows the monitoring of the piston displacement,and thereby, the determination of the vertical strain of thespecimen. The volumetric strain of the specimen isobtained by considering the cell’s outgoing or incomingwater volume, using a high-precision scale or based on thedisplacement of the confining hydraulic actuator.
According to the grain-size distribution curves of the fouledballast (Fig. 2), the largest grain size is 60 mm. If a sample sizeratio is defined as the diameter of triaxial specimen D dividedby maximum particle dimension dmax, this ratio is equal to 5(D¼300 mm and dmax¼60 mm). According to AFNOR(1994), as the soil is not uniform with Cu¼d60/d10¼900, theeffects of the sample size can be ignored.The soil sample was prepared by compaction. Prior to
compaction, the fouled ballast taken from the field was firstair-dried, ground, wetted by the spraying of distilled water toreach the target water content, and finally stored in ahermetic plastic box for homogenisation of the soil moisture.The compaction was performed at least 48 h after the soilhumidification. The soil specimen was compacted in sixlayers of 100 mm in a metallic mould using a vibratinghammer. The dry density of the soil was controlled based onthe thickness of each layer and the mass of the soil. The finaldry density of the soil specimens was 2.01 Mg/m3 (88% ofthe maximum dry density). This value corresponds to themaximum density obtained by this compaction method.After compaction, the sample in its mould was first put onthe lower base of the triaxial cell. Then, the mould wasremoved to complete the sample installation procedure.In order to have an idea about the compression beha-
viour of this material, static compression was also carriedout in a large-scale oedometer cell (300 mm in diameter) ona sample compacted following the same procedure aspreviously described, but to a lower dry density (rd¼1.64Mg/m3 and e¼0.63). The compaction was performed usinga 50-t mechanical press. The results are shown in Fig. 5. Apre-consolidation pressure of 22 kPa can be identified,reflecting the effect of the initial compaction. It can alsobe observed that a vertical stress of 700 kPa was necessaryto reach a void ratio of 0.33, which corresponds to a drydensity of 2.01 Mg/m3 (value for triaxial samples).
Fig. 4. Schematic view of the large triaxial apparatus.
1 10 100 1000 10000Vertical stress (kPa)
0.2
0.3
0.4
0.5
0.6
0.7
Voi
d ra
tio (-
)
Fig. 5. Static compression curve.
V.N. Trinh et al. / Soils and Foundations 52 (2012) 511–523514
Author's personal copy
Monotonic drained triaxial tests were first performed inorder to determine the shear strength parameters at variouswater contents. The results obtained were then analysed todefine the loading stages in the cyclic triaxial tests. Themulti-stage loading procedure used by Gidel et al. (2001)was applied in the cyclic tests. After the installation of thetriaxial cell, a confining pressure of s3¼30 kPa was firstapplied. This value is close to the horizontal stress estimatedin the field conditions and is much lower than the verticalcompaction stress (700 kPa) estimated from Fig. 5. Themaximum shear stress (qmax) was increased in stages,keeping a constant ratio of Dq/Dp¼3. The frequency used,5 Hz, corresponds to the frequency measured in situ for atrain speed of 100 km/h (typical for the trains circulating onthe old railways in France, SNCF, 2009).
4. Experimental results
4.1. Monotonic triaxial tests
Five tests were performed at a water content of 4% andtwo tests were performed on the saturated soil specimens.For the tests at a water content of 4%, shearing wasperformed under four values of confining pressure, s3¼30,100, 200, and 400 kPa, for four tests, TS1, TS2, TS3 and TS4,respectively, the test under s3¼30 kPa being duplicated for arepeatability study (test TS5). The results of these tests areshown in Fig. 6, in which the deviator stress (q) and thevolumetric strain (ev) are plotted versus the axial strain (e1).The results of the duplicated tests (TS1 and TS5) are quitesimilar, showing the good repeatability of the experimentaltechnique. It is also believed that the results of the triaxialtests may not be significantly affected by the samplecompaction conditions. The effect of confining pressure onthe shearing behaviour is quite common for this range instress, i.e., the higher the confining pressure, the higher themaximum deviator stress. Contractancy is observed forconfining stress higher than 200 kPa, whereas dilatancy isobserved for lower confining pressures.
The results of the tests performed under a confiningpressure of 100 kPa and at two different water contents(4 and 12%) are shown in Fig. 7. A significant effect of thewater content on the mechanical behaviour of the soil can beobserved, i.e., the shear strength of the drier specimen (TS2,w¼4%) is twice as that of the saturated specimen (TS6,w¼12%). Moreover, for the drier specimen (TS2), contrac-tancy is followed by dilatancy during shearing, while merecontractancy is observed for the saturated specimen (TS6). InFig. 8, the results of the tests performed under a confiningpressure of 400 kPa are shown for the two water contents.The effect of the water content can be also clearly observed,but it is less significant than in the case of the lower confiningpressure (Fig. 7). The drier specimen (TS4, w¼4%) shows ahigher shear strength (qmax¼1535 kPa) and a lower volumechange (evmax¼3.32%), while these values are qmax¼1304kPa and evmax¼5.05% for the saturated specimen (TS7,w¼12%), respectively.
For further analysis, the deviator stress at failure is definedas either the peak deviator stress, for the tests under lowconfining pressures (s3r100 kPa), or the deviator stress, atan axial strain of 12% where the mode of failure ischaracterised by ‘‘bulging’’ (Indraratna et al., 1998) in thecase of higher confining pressures. Fig. 9 presents the failureenvelopes at water contents of 4 and 12% (saturated) in thep–q plane. From this figure, the shear strength parameterscan be determined, i.e., friction angle j¼391 for w¼4% and371 for the saturated state and apparent cohesion c¼60 kPafor w¼4% and 22 kPa for the saturated state.
4.2. Cyclic triaxial tests
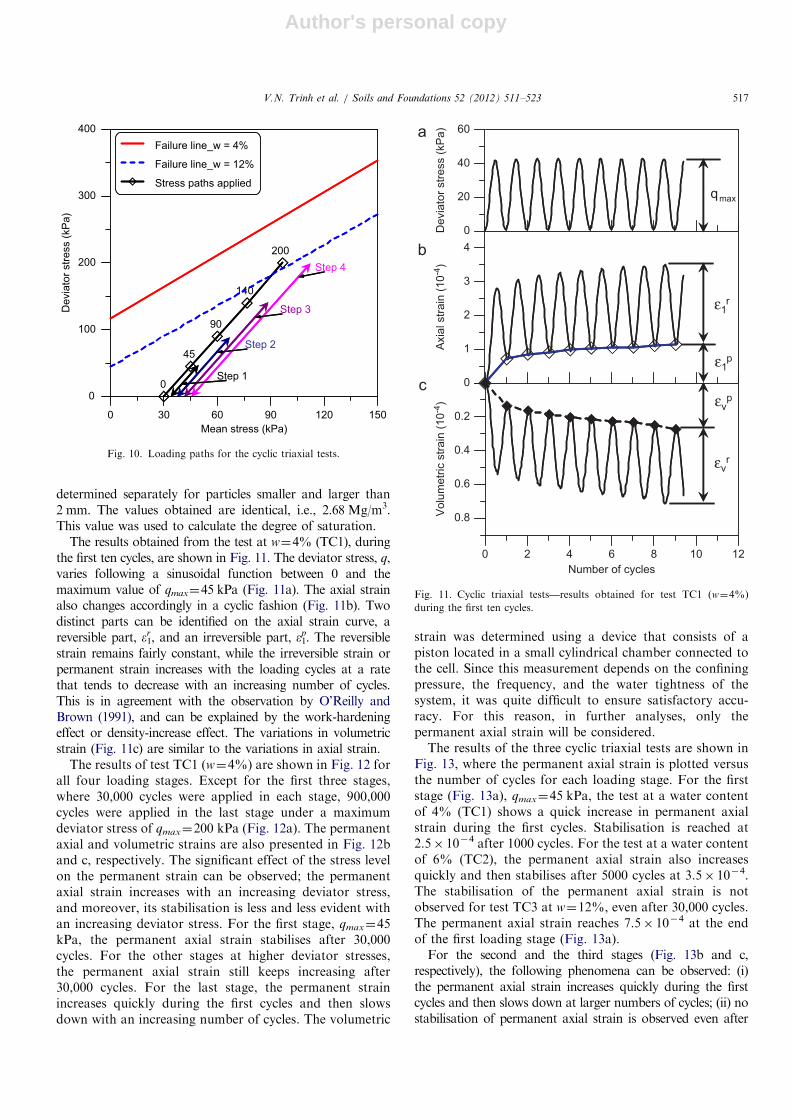
The stress paths were defined based on the results of themonotonic triaxial tests (Fig. 10). The main idea was to havethree or four cyclic loading stages before reaching failure. Inthe tests, after applying a confining pressure of 30 kPa, whichis close to the in situ mean stress, cyclic loading was applied byvarying shear deviator q from 0 to qmax at a constant stressratio of Dq/Dp¼3. The value of qmax was then increased at theend of each stage. The levels of stress chosen depended, as aconsequence, on the stress distribution in the railway track
0
400
800
1200
1600
Dev
iato
r stre
ss (k
Pa)
TS4_σ3 = 400 kPa
TS5_σ3 = 30 kPa (rep.)
4
2
0
-2
-4
-6
-8
Vol
umet
ric s
train
(%)
0 2 4 6 8 10 12 14Axial strain (%)
TS1_σ3 = 30 kPa
TS2_σ3 = 100 kPa
TS3_σ3 = 200 kPa
Fig. 6. Monotonic compression triaxial tests at various confining pres-
sures—results of the tests at a water content of 4%.
V.N. Trinh et al. / Soils and Foundations 52 (2012) 511–523 515
Author's personal copy
substructure and the peak strength determined from themonotonic triaxial tests. Note that the stress distributionwithin the fouled ballast layer depends on the wheel load,the dimensions of the sleeper, the thickness of the ballast layer,and the weight of the above materials (ballast, rail, andsleeper). The wheel load applied by trains in France is about16–22 t per axle (Alias, 1984); the thickness of the ballastlayer varies from 250 to 600 mm. The maximum verticalstress at the surface of the fouled ballast layer can then beestimated at 40–90 kPa. This value is comparable with thatobserved for Indian Railways (Jain and Keshav, 1999) andAmerican Railways (Selig and Water, 1994; Yang et al.,2009). Note, however, that in other countries where heavierwagons are used, the wheel load may reach 30 t per axle(Alias, 1984). This corresponds to a vertical stress of 120–140 kPa on the fouled ballast layer (Li and Selig, 1998; Jainand Keshav, 1999; Grabe and Clayton, 2009). By consideringa Poisson’s coefficient of n=0.4 for the fouled ballast of theold railways in France (Selig and Water, 1994), the meanhorizontal stress is estimated at 30 kPa. This value has beenregarded as the confining pressure for all the cyclic triaxialtests. Four values were chosen for qmax (qmax¼45, 90, 140,and 200 kPa) corresponding to the four loading stages (seeFig. 10). For each of the first three stages, 30,000 cycles wereapplied. For the last stage, several hundred thousand cycleswere applied. Three tests were performed for three values of
water content, w¼4, 6, and 12%, corresponding to the threevalues of the initial degree of saturation, Sri¼32, 49, and100%, respectively. Note that the specific gravity was
0
200
400
600
800
Dev
iato
r stre
ss (k
Pa)
TS2_w = 4.0%TS6_ 12.0% (saturated)
2
1
0
-1
-2
-3
-4
Vol
umet
ric s
train
(%)
0 2 4 6 8 10 12Axial strain ε1 (%)
Fig. 7. Monotonic compression triaxial tests at two water contents (w¼4
and 12%)—results of the tests at a confining pressure of 100 kPa.
0
400
800
1200
1600
Dev
iato
r stre
ss (k
Pa)
TS4_w = 4.0%TS7_ w = 12.0% (saturated)
6
5
4
3
2
1
0
Vol
umet
ric s
train
(%)
0 2 4 6 8 10 12 14 16Axial strain (%)
Fig. 8. Monotonic compression triaxial tests at two water contents (w¼4
and 12%)—results of the tests at a confining pressure of 400 kPa.
Mean stress (kPa)0 200 400 600 800 1000
0
300
600
900
1200
1500
1800
Dev
iato
r stre
ss (k
Pa)
w = 4%
w = 12% (saturated)
TS3
TS1
TS2
TS5
TS4
TS7
TS6
Fig. 9. Failure envelopes at w¼4 and 12% (saturated) in the q–p plane.
V.N. Trinh et al. / Soils and Foundations 52 (2012) 511–523516
Author's personal copy
determined separately for particles smaller and larger than2 mm. The values obtained are identical, i.e., 2.68 Mg/m3.This value was used to calculate the degree of saturation.
The results obtained from the test at w¼4% (TC1), duringthe first ten cycles, are shown in Fig. 11. The deviator stress, q,varies following a sinusoidal function between 0 and themaximum value of qmax¼45 kPa (Fig. 11a). The axial strainalso changes accordingly in a cyclic fashion (Fig. 11b). Twodistinct parts can be identified on the axial strain curve, areversible part, e1
r, and an irreversible part, e1p. The reversible
strain remains fairly constant, while the irreversible strain orpermanent strain increases with the loading cycles at a ratethat tends to decrease with an increasing number of cycles.This is in agreement with the observation by O’Reilly andBrown (1991), and can be explained by the work-hardeningeffect or density-increase effect. The variations in volumetricstrain (Fig. 11c) are similar to the variations in axial strain.
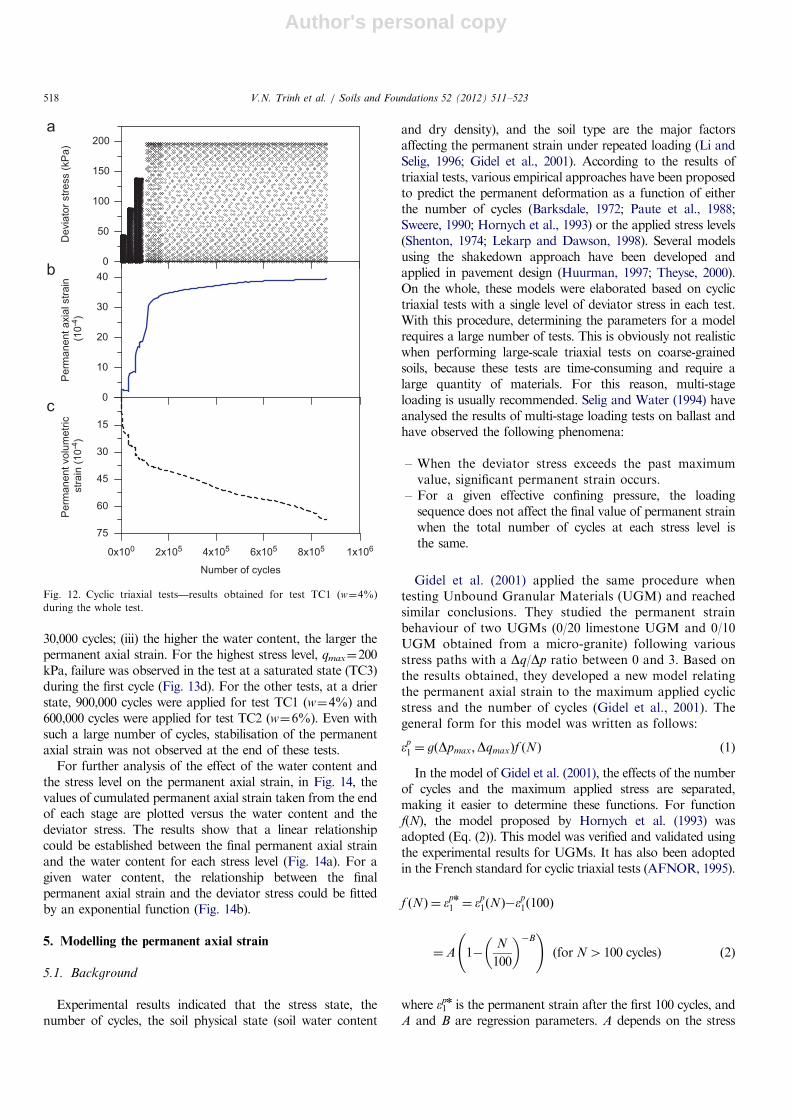
The results of test TC1 (w¼4%) are shown in Fig. 12 forall four loading stages. Except for the first three stages,where 30,000 cycles were applied in each stage, 900,000cycles were applied in the last stage under a maximumdeviator stress of qmax¼200 kPa (Fig. 12a). The permanentaxial and volumetric strains are also presented in Fig. 12band c, respectively. The significant effect of the stress levelon the permanent strain can be observed; the permanentaxial strain increases with an increasing deviator stress,and moreover, its stabilisation is less and less evident withan increasing deviator stress. For the first stage, qmax¼45kPa, the permanent axial strain stabilises after 30,000cycles. For the other stages at higher deviator stresses,the permanent axial strain still keeps increasing after30,000 cycles. For the last stage, the permanent strainincreases quickly during the first cycles and then slowsdown with an increasing number of cycles. The volumetric
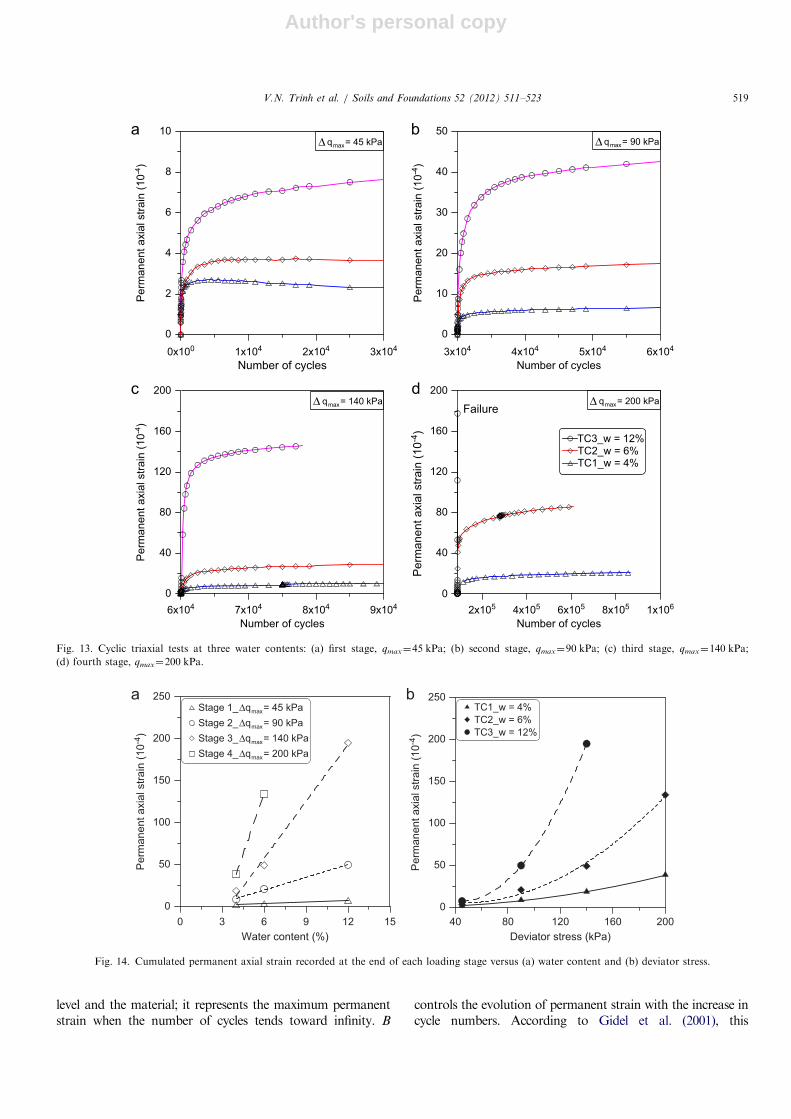
strain was determined using a device that consists of apiston located in a small cylindrical chamber connected tothe cell. Since this measurement depends on the confiningpressure, the frequency, and the water tightness of thesystem, it was quite difficult to ensure satisfactory accu-racy. For this reason, in further analyses, only thepermanent axial strain will be considered.The results of the three cyclic triaxial tests are shown in
Fig. 13, where the permanent axial strain is plotted versusthe number of cycles for each loading stage. For the firststage (Fig. 13a), qmax¼45 kPa, the test at a water contentof 4% (TC1) shows a quick increase in permanent axialstrain during the first cycles. Stabilisation is reached at2.5� 10�4 after 1000 cycles. For the test at a water contentof 6% (TC2), the permanent axial strain also increasesquickly and then stabilises after 5000 cycles at 3.5� 10�4.The stabilisation of the permanent axial strain is notobserved for test TC3 at w¼12%, even after 30,000 cycles.The permanent axial strain reaches 7.5� 10�4 at the endof the first loading stage (Fig. 13a).For the second and the third stages (Fig. 13b and c,
respectively), the following phenomena can be observed: (i)the permanent axial strain increases quickly during the firstcycles and then slows down at larger numbers of cycles; (ii) nostabilisation of permanent axial strain is observed even after
Mean stress (kPa)
Step 4
Step 1
Step 2
Step 3
0 30 60 90 120 150
0
100
200
300
400
Dev
iato
r stre
ss (k
Pa)
0
45
90
140
200
Failure line_w = 4%
Failure line_w = 12%
Stress paths applied
Fig. 10. Loading paths for the cyclic triaxial tests.
qmax
ε1r
ε1p
0
20
40
60
Dev
iato
r stre
ss (k
Pa)
0
1
2
3
4
Axi
al s
train
(10-4
)
0 2 4 6 8 10 12Number of cycles
0.8
0.6
0.4
0.2
Vol
umet
ric s
train
(10-4
) εvp
εvr
Fig. 11. Cyclic triaxial tests—results obtained for test TC1 (w¼4%)
during the first ten cycles.
V.N. Trinh et al. / Soils and Foundations 52 (2012) 511–523 517
Author's personal copy
30,000 cycles; (iii) the higher the water content, the larger thepermanent axial strain. For the highest stress level, qmax¼200kPa, failure was observed in the test at a saturated state (TC3)during the first cycle (Fig. 13d). For the other tests, at a drierstate, 900,000 cycles were applied for test TC1 (w¼4%) and600,000 cycles were applied for test TC2 (w¼6%). Even withsuch a large number of cycles, stabilisation of the permanentaxial strain was not observed at the end of these tests.
For further analysis of the effect of the water content andthe stress level on the permanent axial strain, in Fig. 14, thevalues of cumulated permanent axial strain taken from the endof each stage are plotted versus the water content and thedeviator stress. The results show that a linear relationshipcould be established between the final permanent axial strainand the water content for each stress level (Fig. 14a). For agiven water content, the relationship between the finalpermanent axial strain and the deviator stress could be fittedby an exponential function (Fig. 14b).
5. Modelling the permanent axial strain
5.1. Background
Experimental results indicated that the stress state, thenumber of cycles, the soil physical state (soil water content
and dry density), and the soil type are the major factorsaffecting the permanent strain under repeated loading (Li andSelig, 1996; Gidel et al., 2001). According to the results oftriaxial tests, various empirical approaches have been proposedto predict the permanent deformation as a function of eitherthe number of cycles (Barksdale, 1972; Paute et al., 1988;Sweere, 1990; Hornych et al., 1993) or the applied stress levels(Shenton, 1974; Lekarp and Dawson, 1998). Several modelsusing the shakedown approach have been developed andapplied in pavement design (Huurman, 1997; Theyse, 2000).On the whole, these models were elaborated based on cyclictriaxial tests with a single level of deviator stress in each test.With this procedure, determining the parameters for a modelrequires a large number of tests. This is obviously not realisticwhen performing large-scale triaxial tests on coarse-grainedsoils, because these tests are time-consuming and require alarge quantity of materials. For this reason, multi-stageloading is usually recommended. Selig and Water (1994) haveanalysed the results of multi-stage loading tests on ballast andhave observed the following phenomena:
– When the deviator stress exceeds the past maximumvalue, significant permanent strain occurs.
– For a given effective confining pressure, the loadingsequence does not affect the final value of permanent strainwhen the total number of cycles at each stress level isthe same.
Gidel et al. (2001) applied the same procedure whentesting Unbound Granular Materials (UGM) and reachedsimilar conclusions. They studied the permanent strainbehaviour of two UGMs (0/20 limestone UGM and 0/10UGM obtained from a micro-granite) following variousstress paths with a Dq/Dp ratio between 0 and 3. Based onthe results obtained, they developed a new model relatingthe permanent axial strain to the maximum applied cyclicstress and the number of cycles (Gidel et al., 2001). Thegeneral form for this model was written as follows:
ep1 ¼ gðDpmax;DqmaxÞf ðNÞ ð1Þ
In the model of Gidel et al. (2001), the effects of the numberof cycles and the maximum applied stress are separated,making it easier to determine these functions. For functionf(N), the model proposed by Hornych et al. (1993) wasadopted (Eq. (2)). This model was verified and validated usingthe experimental results for UGMs. It has also been adoptedin the French standard for cyclic triaxial tests (AFNOR, 1995).
f ðNÞ ¼ epn1 ¼ ep
1ðNÞ�ep1ð100Þ
¼A 1�N
100
� ��B !
ðfor N4100 cyclesÞ ð2Þ
where e1pn is the permanent strain after the first 100 cycles, and
A and B are regression parameters. A depends on the stress
0
50
100
150
200
Dev
iato
r stre
ss (k
Pa)
0
10
20
30
40
Per
man
ent a
xial
stra
in (1
0-4)
0x100 2x10⁵ 4x10⁵ 6x10⁵ 8x10⁵ 1x10⁶
Number of cycles
75
60
45
30
15
Per
man
ent v
olum
etric
st
rain
(10-4
)
Fig. 12. Cyclic triaxial tests—results obtained for test TC1 (w¼4%)
during the whole test.
V.N. Trinh et al. / Soils and Foundations 52 (2012) 511–523518
Author's personal copy
level and the material; it represents the maximum permanentstrain when the number of cycles tends toward infinity. B
controls the evolution of permanent strain with the increase incycle numbers. According to Gidel et al. (2001), this
0x100 1x10⁴ 2x10⁴ 3x10⁴
Number of cycles
0
2
4
6
8
10P
erm
anen
t axi
al s
train
(10-4
)
3x10⁴ 4x10⁴ 5x10⁴ 6x10⁴
Number of cycles
0
10
20
30
40
50
Per
man
ent a
xial
stra
in (1
0-4)
Δ qmax = 90 kPaΔ qmax = 45 kPa
6x10⁴ 7x10⁴ 8x10⁴ 9x10⁴
Number of cycles
0
40
80
120
160
200
Per
man
ent a
xial
stra
in (1
0-4)
Δ qmax = 140 kPa
2x10⁵ 4x10⁵ 6x10⁵ 8x10⁵ 1x10⁶
Number of cycles
0
40
80
120
160
200
Per
man
ent a
xial
stra
in (1
0-4)
TC3_w = 12%TC2_w = 6%TC1_w = 4%
Δ qmax = 200 kPaFailure
Fig. 13. Cyclic triaxial tests at three water contents: (a) first stage, qmax¼45 kPa; (b) second stage, qmax¼90 kPa; (c) third stage, qmax¼140 kPa;
(d) fourth stage, qmax¼200 kPa.
Water content (%)
0
50
100
150
200
250
Per
man
ent a
xial
stra
in (1
0-4)
ΔStage 1_ qmax = 45 kPaStage 2_Δqmax = 90 kPaStage 3_Δqmax = 140 kPaStage 4_Δqmax = 200 kPa
0 3 6 9 12 15 40 80 120 160 200Deviator stress (kPa)
0
50
100
150
200
250
Per
man
ent a
xial
stra
in (1
0-4)
TC1_w = 4%TC2_w = 6%TC3_w = 12%
Fig. 14. Cumulated permanent axial strain recorded at the end of each loading stage versus (a) water content and (b) deviator stress.
V.N. Trinh et al. / Soils and Foundations 52 (2012) 511–523 519
Author's personal copy
relationship is valid only for N4100 cycles, because the firstone hundred loading cycles correspond to the bedding downof the material.
For function g(Dpmax, Dqmax), Gidel et al. (2001) showedthat the permanent axial strain increases with the increasein mean stress p and that this increase in axial strain ishighly dependent on the stress path defined by Dqmax/Dpmax. The relationship between the permanent axial strainand the maximum applied stress in the case of q40 isgiven below
gðDpmax;DqmaxÞ ¼ ep01
lmax
pa
� �n1
mþ sDpmax�
Dqmax
Dpmax
� � ð3Þ
where e1p0, m, n, and s are parameters, lmax ¼ffiffiffiffiffiffiffiffiffiffiffiffiffiffiffiffiffiffiffiffiffiffiffiffiffiffiffiffiffi
Dp2maxþDq2
max
p, and pa¼100 kPa.
The influence of the water content on the mechanicalbehaviour of granular materials under cyclic loading hasbeen observed experimentally in several studies (Selig andWater, 1994; Gidel et al., 2002; Ekblad, 2006; Werkmeisteret al., 2003). The results obtained in the present work onthe fouled ballast have been found to be in agreement withthese works. Nevertheless, to the authors’ knowledge, theeffect of the soil water content on the permanent strain hasnot been considered in the modelling. In the present study,the model proposed by Gidel et al. (2001) is modified inorder to consider the effect of the water content.
According to the results shown in Fig. 14, a functionrelating the permanent axial strain to the water contentand the applied deviator stress, t(w, Dqmax), can beestablished as follows:
tðw;DqmaxÞ ¼ ep01 � ðwþaÞ �
Dqmax
pa
� �a
ð4Þ
where e1p0, a, and a are parameters, and pa¼100 kPa.
A comparison between Eqs. (3) and (4) shows that termDpmax in Eq. (3) disappears in Eq. (4). This is because whenthe loading starts at q¼0 and the stress paths followed areDq/Dp¼3, Dpmax is a function of Dpmax. In other words,Eq. (4) is only valid for the particular stress pathconsidered. Further studies with more stress paths areneeded to generalise this equation. In order to account forthe stress level, the number of cycles, and the water contentof the soil, Eq. (4) is extended as follows:
ep1 ¼ tðw;DqmaxÞ � f ðNÞ ð5Þ
where f(N) is calculated using Eq. (2) and t(w,Dqmax) iscalculated using Eq. (4).
In this study, the measured data from tests TC1 (w¼4%)and TC2 (w¼6%) are used for determining the modelparameters. These parameters are then used to simulate testTC3 (saturated state) in order to evaluate the performanceof the proposed model. The parameters of the proposedmodel are determined by the following two steps:
– Step 1: Determine parameters e1p0, a, and a by fitting
Eq. (4) to the permanent axial strain at the end of each
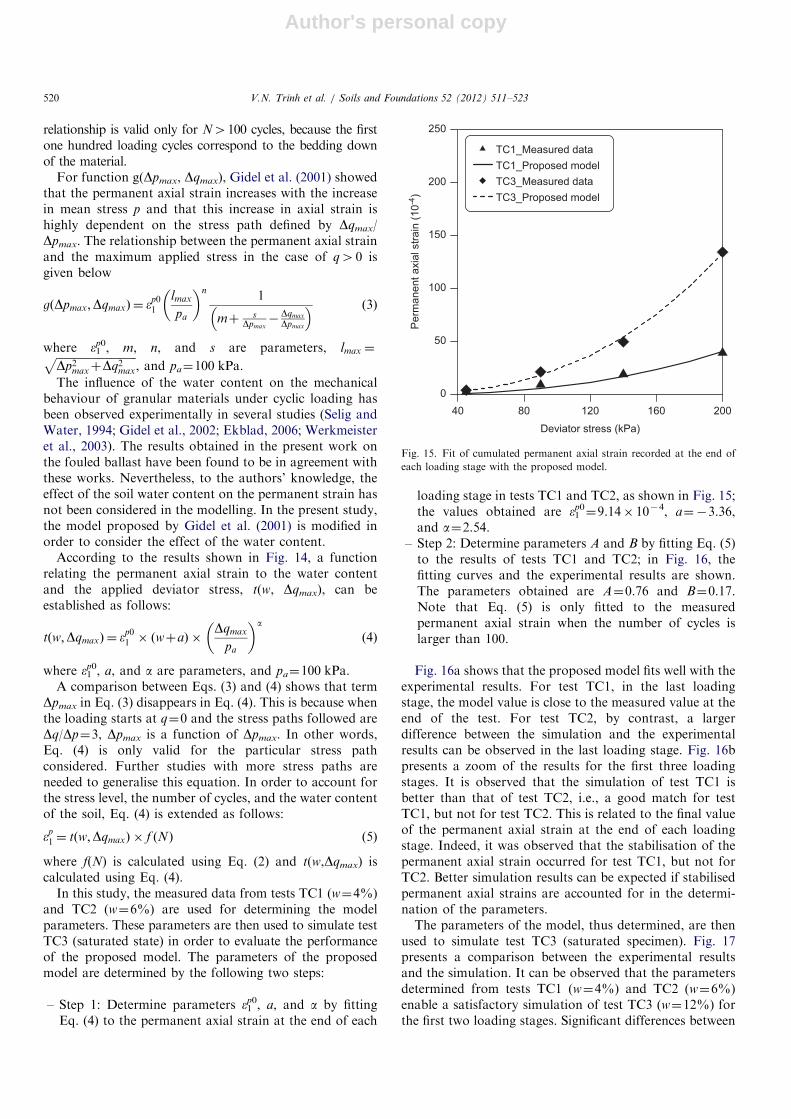
loading stage in tests TC1 and TC2, as shown in Fig. 15;the values obtained are e1
p0¼9.14� 10�4, a¼�3.36,
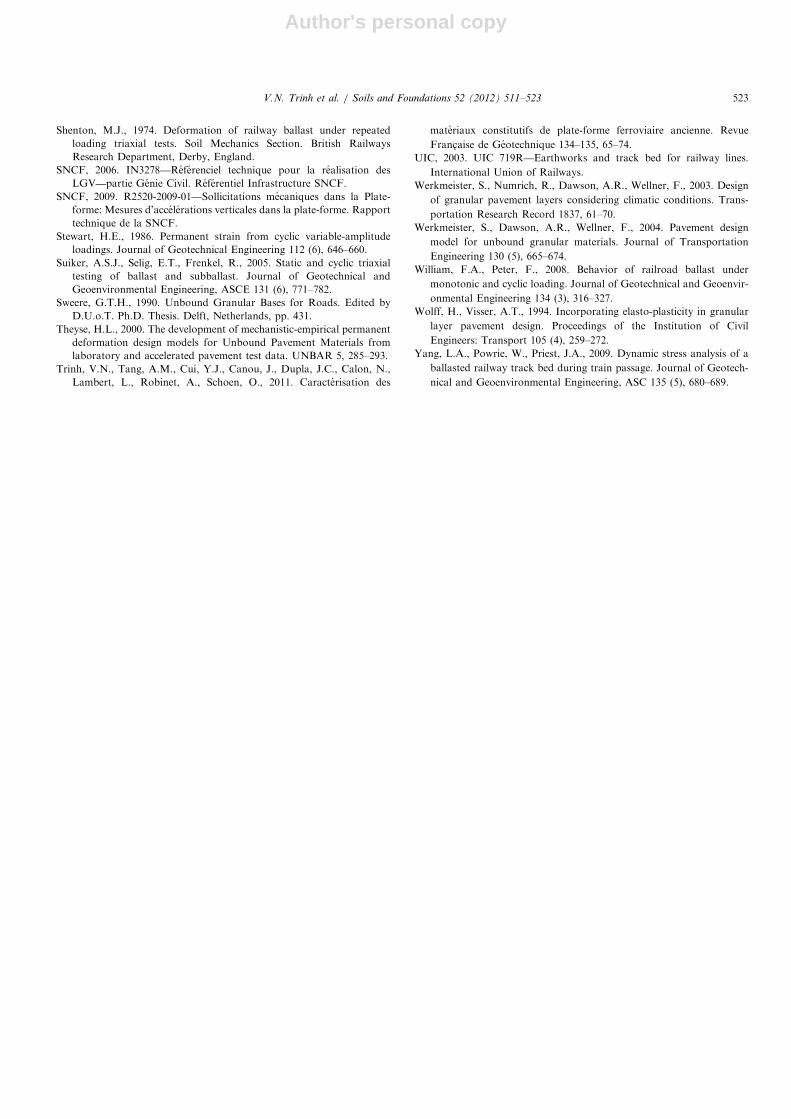
and a¼2.54.– Step 2: Determine parameters A and B by fitting Eq. (5)to the results of tests TC1 and TC2; in Fig. 16, thefitting curves and the experimental results are shown.The parameters obtained are A¼0.76 and B¼0.17.Note that Eq. (5) is only fitted to the measuredpermanent axial strain when the number of cycles islarger than 100.
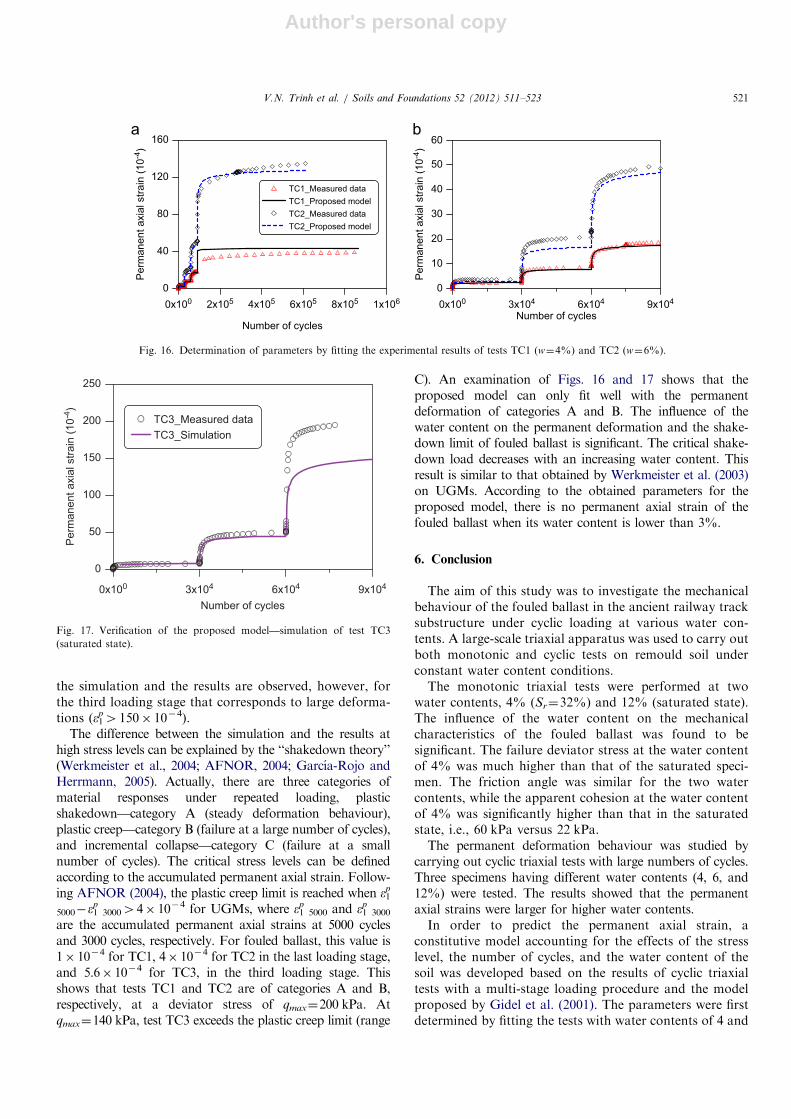
Fig. 16a shows that the proposed model fits well with theexperimental results. For test TC1, in the last loadingstage, the model value is close to the measured value at theend of the test. For test TC2, by contrast, a largerdifference between the simulation and the experimentalresults can be observed in the last loading stage. Fig. 16bpresents a zoom of the results for the first three loadingstages. It is observed that the simulation of test TC1 isbetter than that of test TC2, i.e., a good match for testTC1, but not for test TC2. This is related to the final valueof the permanent axial strain at the end of each loadingstage. Indeed, it was observed that the stabilisation of thepermanent axial strain occurred for test TC1, but not forTC2. Better simulation results can be expected if stabilisedpermanent axial strains are accounted for in the determi-nation of the parameters.The parameters of the model, thus determined, are then
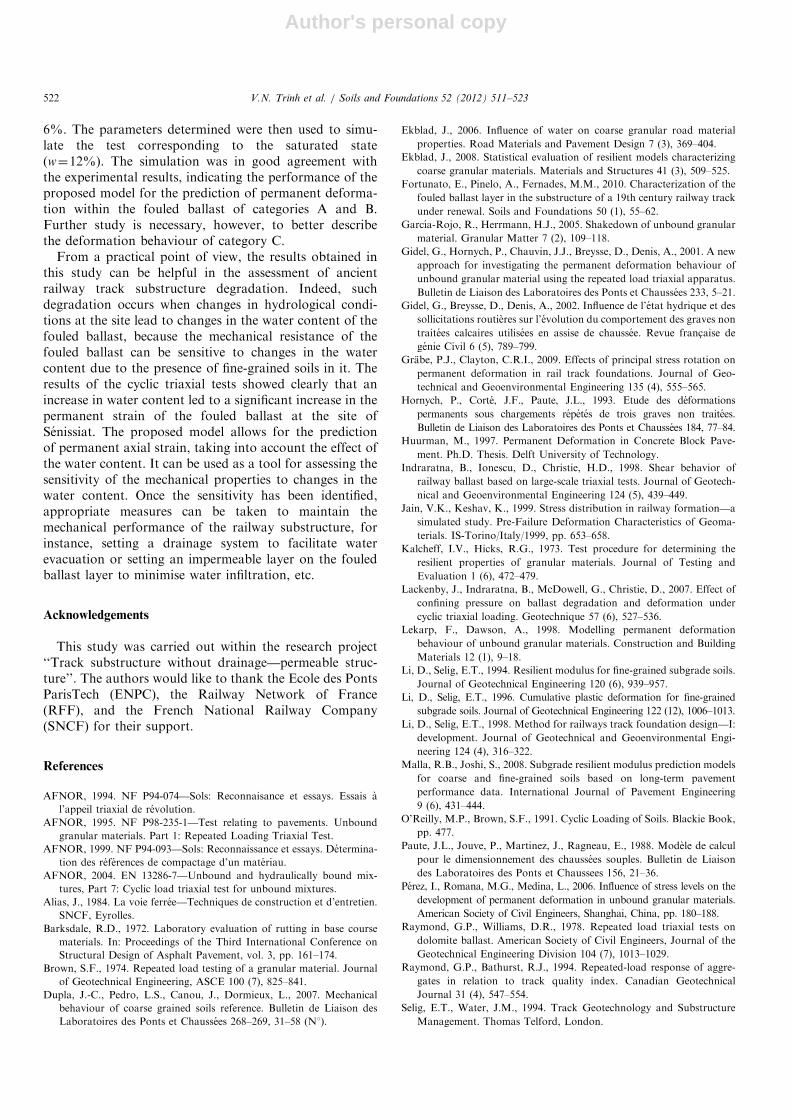
used to simulate test TC3 (saturated specimen). Fig. 17presents a comparison between the experimental resultsand the simulation. It can be observed that the parametersdetermined from tests TC1 (w¼4%) and TC2 (w¼6%)enable a satisfactory simulation of test TC3 (w¼12%) forthe first two loading stages. Significant differences between
40 80 120 160 200
Deviator stress (kPa)
0
50
100
150
200
250
Per
man
ent a
xial
stra
in (1
0-4)
TC1_Measured dataTC1_Proposed modelTC3_Measured dataTC3_Proposed model
Fig. 15. Fit of cumulated permanent axial strain recorded at the end of
each loading stage with the proposed model.
V.N. Trinh et al. / Soils and Foundations 52 (2012) 511–523520
Author's personal copy
the simulation and the results are observed, however, forthe third loading stage that corresponds to large deforma-tions (e1
p4150� 10�4).The difference between the simulation and the results at
high stress levels can be explained by the ‘‘shakedown theory’’(Werkmeister et al., 2004; AFNOR, 2004; Garcıa-Rojo andHerrmann, 2005). Actually, there are three categories ofmaterial responses under repeated loading, plasticshakedown—category A (steady deformation behaviour),plastic creep—category B (failure at a large number of cycles),and incremental collapse—category C (failure at a smallnumber of cycles). The critical stress levels can be definedaccording to the accumulated permanent axial strain. Follow-ing AFNOR (2004), the plastic creep limit is reached when e1
p
5000�e1p300044� 10�4 for UGMs, where e1
p5000 and e1
p3000
are the accumulated permanent axial strains at 5000 cyclesand 3000 cycles, respectively. For fouled ballast, this value is1� 10�4 for TC1, 4� 10�4 for TC2 in the last loading stage,and 5.6� 10�4 for TC3, in the third loading stage. Thisshows that tests TC1 and TC2 are of categories A and B,respectively, at a deviator stress of qmax¼200 kPa. Atqmax¼140 kPa, test TC3 exceeds the plastic creep limit (range
C). An examination of Figs. 16 and 17 shows that theproposed model can only fit well with the permanentdeformation of categories A and B. The influence of thewater content on the permanent deformation and the shake-down limit of fouled ballast is significant. The critical shake-down load decreases with an increasing water content. Thisresult is similar to that obtained by Werkmeister et al. (2003)on UGMs. According to the obtained parameters for theproposed model, there is no permanent axial strain of thefouled ballast when its water content is lower than 3%.
6. Conclusion
The aim of this study was to investigate the mechanicalbehaviour of the fouled ballast in the ancient railway tracksubstructure under cyclic loading at various water con-tents. A large-scale triaxial apparatus was used to carry outboth monotonic and cyclic tests on remould soil underconstant water content conditions.The monotonic triaxial tests were performed at two
water contents, 4% (Sr¼32%) and 12% (saturated state).The influence of the water content on the mechanicalcharacteristics of the fouled ballast was found to besignificant. The failure deviator stress at the water contentof 4% was much higher than that of the saturated speci-men. The friction angle was similar for the two watercontents, while the apparent cohesion at the water contentof 4% was significantly higher than that in the saturatedstate, i.e., 60 kPa versus 22 kPa.The permanent deformation behaviour was studied by
carrying out cyclic triaxial tests with large numbers of cycles.Three specimens having different water contents (4, 6, and12%) were tested. The results showed that the permanentaxial strains were larger for higher water contents.In order to predict the permanent axial strain, a
constitutive model accounting for the effects of the stresslevel, the number of cycles, and the water content of thesoil was developed based on the results of cyclic triaxialtests with a multi-stage loading procedure and the modelproposed by Gidel et al. (2001). The parameters were firstdetermined by fitting the tests with water contents of 4 and
0x100 2x10⁵ 4x10⁵ 6x10⁵ 8x10⁵ 1x10⁶
Number of cycles
0
40
80
120
160P
erm
anen
t axi
al s
train
(10-4
)
TC1_Measured dataTC1_Proposed modelTC2_Measured dataTC2_Proposed model
0x100 3x10⁴ 6x10⁴ 9x10⁴
Number of cycles
0
10
20
30
40
50
60
Per
man
ent a
xial
stra
in (1
0-4)
Fig. 16. Determination of parameters by fitting the experimental results of tests TC1 (w¼4%) and TC2 (w¼6%).
0x100 3x10⁴ 6x10⁴ 9x10⁴
Number of cycles
0
50
100
150
200
250
Per
man
ent a
xial
stra
in (1
0-4)
TC3_Measured dataTC3_Simulation
Fig. 17. Verification of the proposed model—simulation of test TC3
(saturated state).
V.N. Trinh et al. / Soils and Foundations 52 (2012) 511–523 521
Author's personal copy
6%. The parameters determined were then used to simu-late the test corresponding to the saturated state(w¼12%). The simulation was in good agreement withthe experimental results, indicating the performance of theproposed model for the prediction of permanent deforma-tion within the fouled ballast of categories A and B.Further study is necessary, however, to better describethe deformation behaviour of category C.
From a practical point of view, the results obtained inthis study can be helpful in the assessment of ancientrailway track substructure degradation. Indeed, suchdegradation occurs when changes in hydrological condi-tions at the site lead to changes in the water content of thefouled ballast, because the mechanical resistance of thefouled ballast can be sensitive to changes in the watercontent due to the presence of fine-grained soils in it. Theresults of the cyclic triaxial tests showed clearly that anincrease in water content led to a significant increase in thepermanent strain of the fouled ballast at the site ofSenissiat. The proposed model allows for the predictionof permanent axial strain, taking into account the effect ofthe water content. It can be used as a tool for assessing thesensitivity of the mechanical properties to changes in thewater content. Once the sensitivity has been identified,appropriate measures can be taken to maintain themechanical performance of the railway substructure, forinstance, setting a drainage system to facilitate waterevacuation or setting an impermeable layer on the fouledballast layer to minimise water infiltration, etc.
Acknowledgements
This study was carried out within the research project‘‘Track substructure without drainage—permeable struc-ture’’. The authors would like to thank the Ecole des PontsParisTech (ENPC), the Railway Network of France(RFF), and the French National Railway Company(SNCF) for their support.
References
AFNOR, 1994. NF P94-074—Sols: Reconnaisance et essays. Essais �al’appeil triaxial de revolution.
AFNOR, 1995. NF P98-235-1—Test relating to pavements. Unbound
granular materials. Part 1: Repeated Loading Triaxial Test.
AFNOR, 1999. NF P94-093—Sols: Reconnaissance et essays. Determina-
tion des references de compactage d’un materiau.
AFNOR, 2004. EN 13286-7—Unbound and hydraulically bound mix-
tures, Part 7: Cyclic load triaxial test for unbound mixtures.
Alias, J., 1984. La voie ferree—Techniques de construction et d’entretien.
SNCF, Eyrolles.
Barksdale, R.D., 1972. Laboratory evaluation of rutting in base course
materials. In: Proceedings of the Third International Conference on
Structural Design of Asphalt Pavement, vol. 3, pp. 161–174.
Brown, S.F., 1974. Repeated load testing of a granular material. Journal
of Geotechnical Engineering, ASCE 100 (7), 825–841.
Dupla, J.-C., Pedro, L.S., Canou, J., Dormieux, L., 2007. Mechanical
behaviour of coarse grained soils reference. Bulletin de Liaison des
Laboratoires des Ponts et Chaussees 268–269, 31–58 (N1).
Ekblad, J., 2006. Influence of water on coarse granular road material
properties. Road Materials and Pavement Design 7 (3), 369–404.
Ekblad, J., 2008. Statistical evaluation of resilient models characterizing
coarse granular materials. Materials and Structures 41 (3), 509–525.
Fortunato, E., Pinelo, A., Fernades, M.M., 2010. Characterization of the
fouled ballast layer in the substructure of a 19th century railway track
under renewal. Soils and Foundations 50 (1), 55–62.
Garcıa-Rojo, R., Herrmann, H.J., 2005. Shakedown of unbound granular
material. Granular Matter 7 (2), 109–118.
Gidel, G., Hornych, P., Chauvin, J.J., Breysse, D., Denis, A., 2001. A new
approach for investigating the permanent deformation behaviour of
unbound granular material using the repeated load triaxial apparatus.
Bulletin de Liaison des Laboratoires des Ponts et Chaussees 233, 5–21.
Gidel, G., Breysse, D., Denis, A., 2002. Influence de l’etat hydrique et des
sollicitations routi�eres sur l’evolution du comportement des graves non
traitees calcaires utilisees en assise de chaussee. Revue franc-aise de
genie Civil 6 (5), 789–799.
Grabe, P.J., Clayton, C.R.I., 2009. Effects of principal stress rotation on
permanent deformation in rail track foundations. Journal of Geo-
technical and Geoenvironmental Engineering 135 (4), 555–565.
Hornych, P., Corte, J.F., Paute, J.L., 1993. Etude des deformations
permanents sous chargements repetes de trois graves non traitees.
Bulletin de Liaison des Laboratoires des Ponts et Chaussees 184, 77–84.
Huurman, M., 1997. Permanent Deformation in Concrete Block Pave-
ment. Ph.D. Thesis. Delft University of Technology.
Indraratna, B., Ionescu, D., Christie, H.D., 1998. Shear behavior of
railway ballast based on large-scale triaxial tests. Journal of Geotech-
nical and Geoenvironmental Engineering 124 (5), 439–449.
Jain, V.K., Keshav, K., 1999. Stress distribution in railway formation—a
simulated study. Pre-Failure Deformation Characteristics of Geoma-
terials. IS-Torino/Italy/1999, pp. 653–658.
Kalcheff, I.V., Hicks, R.G., 1973. Test procedure for determining the
resilient properties of granular materials. Journal of Testing and
Evaluation 1 (6), 472–479.
Lackenby, J., Indraratna, B., McDowell, G., Christie, D., 2007. Effect of
confining pressure on ballast degradation and deformation under
cyclic triaxial loading. Geotechnique 57 (6), 527–536.
Lekarp, F., Dawson, A., 1998. Modelling permanent deformation
behaviour of unbound granular materials. Construction and Building
Materials 12 (1), 9–18.
Li, D., Selig, E.T., 1994. Resilient modulus for fine-grained subgrade soils.
Journal of Geotechnical Engineering 120 (6), 939–957.
Li, D., Selig, E.T., 1996. Cumulative plastic deformation for fine-grained
subgrade soils. Journal of Geotechnical Engineering 122 (12), 1006–1013.
Li, D., Selig, E.T., 1998. Method for railways track foundation design—I:
development. Journal of Geotechnical and Geoenvironmental Engi-
neering 124 (4), 316–322.
Malla, R.B., Joshi, S., 2008. Subgrade resilient modulus prediction models
for coarse and fine-grained soils based on long-term pavement
performance data. International Journal of Pavement Engineering
9 (6), 431–444.
O’Reilly, M.P., Brown, S.F., 1991. Cyclic Loading of Soils. Blackie Book,
pp. 477.
Paute, J.L., Jouve, P., Martinez, J., Ragneau, E., 1988. Mod�ele de calcul
pour le dimensionnement des chaussees souples. Bulletin de Liaison
des Laboratoires des Ponts et Chaussees 156, 21–36.
Perez, I., Romana, M.G., Medina, L., 2006. Influence of stress levels on the
development of permanent deformation in unbound granular materials.
American Society of Civil Engineers, Shanghai, China, pp. 180–188.
Raymond, G.P., Williams, D.R., 1978. Repeated load triaxial tests on
dolomite ballast. American Society of Civil Engineers, Journal of the
Geotechnical Engineering Division 104 (7), 1013–1029.
Raymond, G.P., Bathurst, R.J., 1994. Repeated-load response of aggre-
gates in relation to track quality index. Canadian Geotechnical
Journal 31 (4), 547–554.
Selig, E.T., Water, J.M., 1994. Track Geotechnology and Substructure
Management. Thomas Telford, London.
V.N. Trinh et al. / Soils and Foundations 52 (2012) 511–523522
Author's personal copy
Shenton, M.J., 1974. Deformation of railway ballast under repeated
loading triaxial tests. Soil Mechanics Section. British Railways
Research Department, Derby, England.
SNCF, 2006. IN3278—Referenciel technique pour la realisation des
LGV—partie Genie Civil. Referentiel Infrastructure SNCF.
SNCF, 2009. R2520-2009-01—Sollicitations mecaniques dans la Plate-
forme: Mesures d’accelerations verticales dans la plate-forme. Rapport
technique de la SNCF.
Stewart, H.E., 1986. Permanent strain from cyclic variable-amplitude
loadings. Journal of Geotechnical Engineering 112 (6), 646–660.
Suiker, A.S.J., Selig, E.T., Frenkel, R., 2005. Static and cyclic triaxial
testing of ballast and subballast. Journal of Geotechnical and
Geoenvironmental Engineering, ASCE 131 (6), 771–782.
Sweere, G.T.H., 1990. Unbound Granular Bases for Roads. Edited by
D.U.o.T. Ph.D. Thesis. Delft, Netherlands, pp. 431.
Theyse, H.L., 2000. The development of mechanistic-empirical permanent
deformation design models for Unbound Pavement Materials from
laboratory and accelerated pavement test data. UNBAR 5, 285–293.
Trinh, V.N., Tang, A.M., Cui, Y.J., Canou, J., Dupla, J.C., Calon, N.,
Lambert, L., Robinet, A., Schoen, O., 2011. Caracterisation des
materiaux constitutifs de plate-forme ferroviaire ancienne. Revue
Franc-aise de Geotechnique 134–135, 65–74.
UIC, 2003. UIC 719R—Earthworks and track bed for railway lines.
International Union of Railways.
Werkmeister, S., Numrich, R., Dawson, A.R., Wellner, F., 2003. Design
of granular pavement layers considering climatic conditions. Trans-
portation Research Record 1837, 61–70.
Werkmeister, S., Dawson, A.R., Wellner, F., 2004. Pavement design
model for unbound granular materials. Journal of Transportation
Engineering 130 (5), 665–674.
William, F.A., Peter, F., 2008. Behavior of railroad ballast under
monotonic and cyclic loading. Journal of Geotechnical and Geoenvir-
onmental Engineering 134 (3), 316–327.
Wolff, H., Visser, A.T., 1994. Incorporating elasto-plasticity in granular
layer pavement design. Proceedings of the Institution of Civil
Engineers: Transport 105 (4), 259–272.
Yang, L.A., Powrie, W., Priest, J.A., 2009. Dynamic stress analysis of a
ballasted railway track bed during train passage. Journal of Geotech-
nical and Geoenvironmental Engineering, ASC 135 (5), 680–689.
V.N. Trinh et al. / Soils and Foundations 52 (2012) 511–523 523
Related Documents