MEASURING THE SUCCESS OF LATEST TWO-WHEELERS IN INDIAN AUTOMOBILE INDUSTRY A Project report Submitted in partial fulfillment of the Requirements for the award of the Degree of Integrated Dual Degree Program In Master of Business Administration By G. Guna Sekhar (Roll.No. 10011U0304) Under the Guidance of Dr. N. Venkatesh, Lecturer in Management Studies, Department of Humanities and Social Sciences.

Welcome message from author
This document is posted to help you gain knowledge. Please leave a comment to let me know what you think about it! Share it to your friends and learn new things together.
Transcript
MEASURING THE SUCCESS OF LATEST TWO-WHEELERS
IN
INDIAN AUTOMOBILE INDUSTRY
AProject report
Submitted in partial fulfillment of theRequirements for the award of the Degree of
Integrated Dual Degree ProgramIn
Master of Business Administration
ByG. Guna Sekhar
(Roll.No. 10011U0304)
Under the Guidance of Dr. N. Venkatesh,Lecturer in Management Studies,
Department of Humanities and Social Sciences.
Department of Humanities and Social Sciences,JNTUH College of Engineering, Kukatpally,
JNTU, Hyderabad-500085.May-2015
Department of Humanities and Social Sciences,JNTUH College of Engineering, Kukatpally,
JNTU, Hyderabad-500 085
CERTIFICATE FROM THE HEAD OF THE
DEPARTMENT
This is to certify that project work entitled “Measuring the
success of latest two-wheelers in Indian automobile industry”
being submitted by G.Guna Sekhar bearing Roll.No.10011U0304, in
partial fulfillment of the requirements for the award of the
degree of Integrated Dual Degree Program in Master of Business
Administrationis a record of bonafide work carried by her.
The results of investigations enclosed in this report have
been verified and found satisfactory. The results embodied
in this project report have not been submitted to any other
University or Institute for the award of any degree or
diploma.
Dr. N. V. S. N. Lakshmi
Assistant Professor (English) and Head Dept. of Humanities and Social SciencesJNTUH College of Engineering Hyderabad
Kukatpally,Hyderabad-500 085
Department of Humanities and Social Sciences,JNTUH College of Engineering, Kukatpally,
JNTU, Hyderabad-500 085
CERTIFICATE
FROM SUPERVISOR

This is to certify that project work entitled “Measuring the
success of latest two-wheelers in Indian automobile
industry” being submitted by bearing Roll.No.10011U0304, in
partial fulfillment of the requirements for the award of the
degree of Integrated Dual Degree Program in Master of
Business Administration is a record of bonafide work carried
by her.
The results of investigations enclosed in this report have
been verified and found satisfactory. The results embodied
in this project report have not been submitted to any other
University or Institute for the award of any degree or
diploma.
Mr. N. VenkateshLecturer in Management Studies
Dept. of Humanities and Social SciencesJNTUH College of Engineering Hyderabad
Kukatpally, Hyderabad-500 085
Department of Humanities and Social Sciences,
JNTUH College of Engineering, Kukatpally,JNTU, Hyderabad-500 085

DECLARATION BY THE CANDIDATE
I, G.Guna Sekhar (Roll.No.10011U0304), hereby declare that
the project report entitled “Measuring the success of latest
two-wheelers in Indian automobile industry”, carried out by
me under the guidance of Mr. N. Venkatesh, lecturer in
Management Studies, Department of Humanities and Social
Sciences, is submitted in partial fulfillment of the
requirements for the award of the Degree of Integrated Dual
Degree Program in Master of Business Administration.
This is a record of bonafide work carried out by me and the
results embodied in this project have not been reproduced or
copied from any source. The results embodied in this project
report have not been submitted to any other University or
Institute for the award of any other degree or diploma.
G.Guna sekharRoll.No. 10011U304

B.Tech+MBA(Marketing)Department of Humanities and Social Sciences
JNTUH College of Engineering HyderabadKukatpally, Hyderabad-500 085
ACKNOWLEDGEMENTS
I take this opportunity to express gratitude to Dr. N.V.S.N.Lakshmi, Assistant Professor (English) and Head of the Department of Humanities and Social Sciences, JNTU College of Engineering, Hyderabad for her guidance and encouragement.
I express my heartfelt thanks to my project guide Mr. N. VENKATESH, lecturer in Management Studies, Dept. of Humanities and Social Sciences, JNTU College of Engineering,who has been an excellent guide and also a great source of inspiration to my work.
I would like to thank all the other staff members, both teaching and non-teaching members of Department of Humanities and Social Sciences, JNTU College of Engineering,Hyderabad, who have extended their timely help and eased my task.
My sincere thanks to all my respondents, without whom the project wouldn’t have been successful. I would also extend my thanks to my family and friends for their constant encouragement and support.
G.Guna Sekhar
(Roll.No. 10011U0304)
ABSTRACT
The project “MEASURING THE SUCCESS OF LATEST TWO WHEELER IN
INDIAN AUTOMOBILE MARKET” deals with a critical analysis of
Indian automobile industry and its growth it has shown in past
years. Even though industry has been showing good growth in
numbers it is more important to see whether it is really moving
up the ladder. The growth it shows should be in terms of success
of new product launches. So this project is to analyze the
success rate of new product launches and to see whether the
growth shown in Indian automobile industry is really due to new
product launches and their success.
Indian automobile industry is the second largest two wheeler
manufacturer country in the world. India is also the fifth
largest commercial vehicle manufacturer. Bikes captured 81.5%
market share in India in two wheeler market. Now the project
deals with measuring success of new bikes launched in the past
years. Further, short listing of some bike models have been done
to make the study more specific and effective.
TABLE OF CONTENTS
CHAPTER NO PARTICULARS PAGE NO
1.0 INTRODUCTION 1
1.1 INTRODUCTION 2
1.2 OBJECTIVES OF THE STUDY 4
1.3 INDUSTRY PROFILE 5
1.4 COMPANY PROFILE 10
1.5 PRODUCT PROFILE 11

2.0 LITERATURE REVIEW 16
2.1 CONCEPTUAL DEFINITIONS 17
2.2 LITERATURE REVIEW 22
3.0 RESEARCH METHODOLOGY 24
3.1 RESEARCH DESIGN 25 3.2. SAMPLING DESIGN
26
3.3 DATA COLLECTION DESIGN 26
3.4 ANALYSIS DESIGN 27
4.0 ANALYSIS AND INTERPRETATION 29
5.0 FINDINGS,CONCLUSIONS ANDSUGGESTIONS
5.1 FINDINGS
5.2 CONCLUSIONS
5.3 SUGGESTIONS
6.0 BIBLIOGRAPHY
7.0 APPENDICIES
LIST OF TABLES
TABLE NO TITLE PAGE NO
4.1 DISTRIBUTION OF RETAILERS ON THE BASIS OF AGE 31
4.2 STORAGE MODE OF COCA COLA PRODUCTS 32
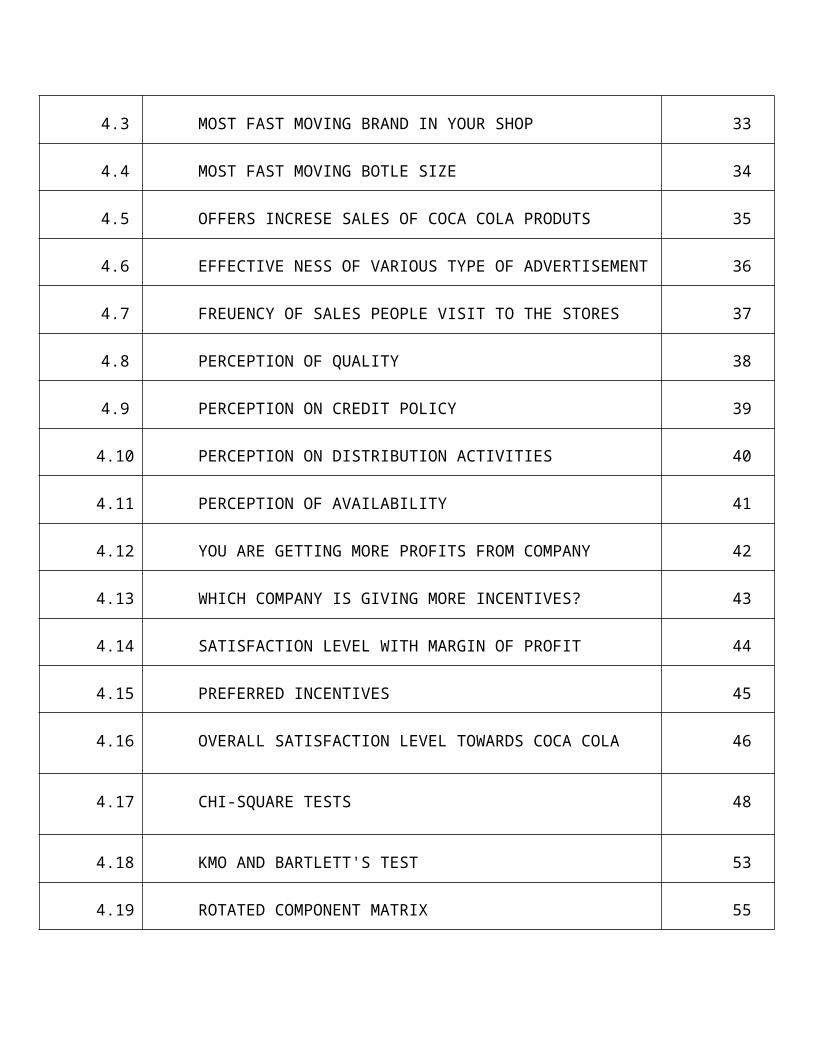
4.3 MOST FAST MOVING BRAND IN YOUR SHOP 33
4.4 MOST FAST MOVING BOTLE SIZE 34
4.5 OFFERS INCRESE SALES OF COCA COLA PRODUTS 35
4.6 EFFECTIVE NESS OF VARIOUS TYPE OF ADVERTISEMENT 36
4.7 FREUENCY OF SALES PEOPLE VISIT TO THE STORES 37
4.8 PERCEPTION OF QUALITY 38
4.9 PERCEPTION ON CREDIT POLICY 39
4.10 PERCEPTION ON DISTRIBUTION ACTIVITIES 40
4.11 PERCEPTION OF AVAILABILITY 41
4.12 YOU ARE GETTING MORE PROFITS FROM COMPANY 42
4.13 WHICH COMPANY IS GIVING MORE INCENTIVES? 43
4.14 SATISFACTION LEVEL WITH MARGIN OF PROFIT 44
4.15 PREFERRED INCENTIVES 45
4.16 OVERALL SATISFACTION LEVEL TOWARDS COCA COLA 46
4.17 CHI-SQUARE TESTS 48
4.18 KMO AND BARTLETT'S TEST 53
4.19 ROTATED COMPONENT MATRIX 55

4.20 MODEL SUMMERY 56
4.21 ANOAVA TEST 56
4.22 CORRELATION COEFFICIENTS 57
LIST OF CHARTS

CHART NO TITLE PAGE NO
4.1 DISTRIBUTION OF RETAILERS ON THE BASIS OF AGE 31
4.2 STORAGE MODE OF COCA COLA PRODUCTS 32
4.3 MOST FAST MOVING BRAND IN YOUR SHOP 33
4.4 MOST FAST MOVING BOTLE SIZE 34
4.5 OFFERS INCRESE SALES OF COCA COLA PRODUTS 35
4.6 EFFECTIVE NESS OF VARIOUS TYPE OF ADVERTISEMENT 36
4.7 FREUENCY OF SALES PEOPLE VISIT TO THE STORES 37
4.8 PERCEPTION OF QUALITY 38
4.9 PERCEPTION ON CREDIT POLICY 39
4.10 PERCEPTION ON DISTRIBUTION ACTIVITIES 40
4.11 PERCEPTION OF AVAILABILITY 41
4.12 YOU ARE GETTING MORE PROFITS FROM COMPANY 42
4.13 WHICH COMPANY IS GIVING MORE INCENTIVES? 43
4.14 SATISFACTION LEVEL WITH MARGIN OF PROFIT 44
4.15 PREFERRED INCENTIVES 45
4.16 OVERALL SATISFACTION LEVEL TOWARDS COCA COLA 46
4.17 CHI-SQUARE TESTS 48
CHAPTER-1
INTRODUCTION

1.1 Indian Automobile Industry
The Indian auto industry is one of the largest in the world
with an annual production of 23.48 million vehicles in FY 2014-
15. The automobile industry accounts for 22 per cent of the
country's manufacturing gross domestic product (GDP). An
expanding middle class, a young population, and an increasing
interest of the companies in exploring the rural markets have
made the two wheelers segment (with 80 per cent market share) the
leader of the Indian automobile market. The overall passenger
vehicle segment has 14 per cent market share.
India is also a substantial auto exporter, with solid export
growth expectations for the near future. Various initiatives by
the Government of India and the major automobile players in the
Indian market is expected to make India a leader in the Two
Wheeler and Four Wheeler market in the world by 2020. Indian
domestic automobile companies like Tata Motors, Maruti Suzuki
expanded their production and export operations in and across the
country and since then the industry has only shown signs of
growth.

The automobile industry comprises of heavy vehicles (trucks,
buses, tempos and tractors), passenger cars, and two-wheelers.
The automobile sector today is one of the key sectors of the
country contributing majorly to the economy of India. It directly
and indirectly provides employment to over 10 million people in
the country.
The Indian automobile industry has a well established name
globally being the second largest two wheeler market in the
world, fourth largest commercial vehicle market in the world, and
eleventh largest passenger car market in the world .
The growth of the Indian middleclass along with the growth of the
economy over the last few years has resulted in a host of global
auto giants setting their foot inside the Indian Territory.
Moreover India also provides trained manpower at competitive
costs making the country a manufacturing hub for many foreign
automobile companies. India proves to be a potential market as
compared to most of the other countries which are witnessing
stagnation as far as automobile industry growth is concerned. The
auto sector is one of the biggest job creators, both directly and
indirectly. It is estimated that every job created in an auto
company leads to three to five indirect ancillary jobs.
Market share of Indian automobile industry by volume:
Two wheelers dominate production volumes; in FY14, the
segment accounted for 77 per cent of the total automotive
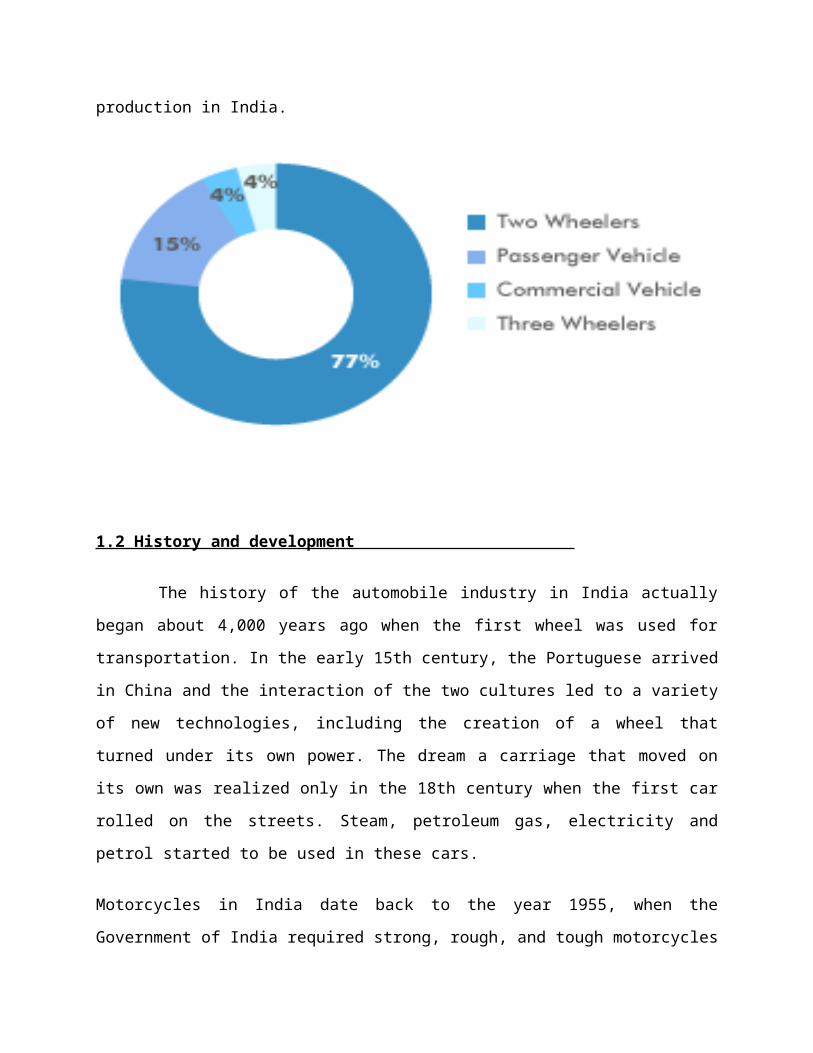
production in India.
1.2 History and development
The history of the automobile industry in India actually
began about 4,000 years ago when the first wheel was used for
transportation. In the early 15th century, the Portuguese arrived
in China and the interaction of the two cultures led to a variety
of new technologies, including the creation of a wheel that
turned under its own power. The dream a carriage that moved on
its own was realized only in the 18th century when the first car
rolled on the streets. Steam, petroleum gas, electricity and
petrol started to be used in these cars.
Motorcycles in India date back to the year 1955, when the
Government of India required strong, rough, and tough motorcycles

for the Indian Army and the police force in the western part of
the country which had a rough and craggy terrain. The 350cc
'Bullet' manufactured by the Royal Enfield Company of United
Kingdom was the first batch of motorcycles in India. This was the
beginning for the Indian two-wheelers industry. The motorcycles
in India cater to a variety of needs of the consumers. It has
become one most popular modes of transportation, and is preferred
by the daily commuters.
The segment of motorcycles went through a tremendous change in
the 90s and the two wheeler market, especially the motorcycle
market was filled with option. The main cause of the growth in
the segment was the fuel efficient 4 stroke engine. In the
present scenario, the motorcycles in India constitute for 81.5%
of the total Indian two-wheeler market.
The companies manufacturing motorcycles in India are making
necessary innovations to make them safer, more comfortable, user-
friendly and ergonomic. Very high fuel economy equivalents are
often derived by electric motorcycles.
Technological advancements made in other automotive sectors, such
as the car industry, are being applied to two-wheelers. So
technology transfer and adaptation are major foci.

Thus, the motorcycling scenario today in India is critically
poised, wherein the battles of the next decade will be fought
keenly and fiercely. A fine example is competition between Hero
Moto Corp and Honda Motor Company in the Indian market.
PM Narendra Modi launched ‘Make In India’ initiative which was
aimed at encouraging domestic production of services and products
in order to make India the world’s manufacturing hub. The focus
was also to enhance skill development and create jobs within the
country. With the Union Budget, basic rate of Corporate Tax was
reduced from 30% to 25% in next 4 years; accompanied by reducing
exemptions.
FM Arun Jaitley had also announced an annual flow of Rs 20,000
crore for National Investment and Infrastructure Fund. One of the

sectors believed to be leading Make In India initiative from the
front is the automotive industry. Two-wheeler manufacturer Honda
Motor has stated it wants India to be its largest two-wheeler
operation globally. GM aims to make India its new global
manufacturing and export powerhouse in the coming years.
I
The factors for the growth of Indian motorcycles:
The Gross Domestic Product has grown to 8%
The average family income has increased
The finance have become easier to access
The reduction in taxes and duties
Introduction of international standards in India
The teenager and the youth using more and more motorcycles.

1.3 Various Two-wheeler companies:
In the automobile industry there are a many players as the Hero
moto corporation limited, Bajaj auto limited, TVS motor company
limited. The other players of the two wheeler industry as the
kinetic motor company limited, kinetic engineering
limited,LML,YamahamotorsIndialimited,MajesticAuto limited, Royal
Enfield and Honda motorcycle and scooter private limited.
Hero MotoCorp: Going forward, although competition for Hero
MotoCorp is likely to intensify, we do not expect its market
leadership status in the 100cc segment to come under threat any
time soon. The target segment for 100cc bikes are largely
commuters and families, with the purchase meant to address the
consumers’ basic transportation needs at high fuel economy and
low operating costs. Despite being amongst the oldest 2W brands
in India, Hero MotoCorp’s CD Dawn/ Deluxe, Splendor and Passion
models continue to enjoy strong brand equity in both rural as
well as urban markets, supported by regular product upgrades even
as the fundamental platform of these models has remained largely
unchanged. The Splendor brand alone has sold some 17 million
units since its launch in 1994; a testimony that familiarity
breeds consumer confidence, not contempt.
Bajaj Auto: Bajaj Auto had lowered its focus on the lower cc
motorcycle segment in 2008-09 to focus more on the Pulsar brand
in the higher cc performance bike segment. However, the exit from
the 100cc segment lasted only for a brief while as the company
staged a comeback soon thereafter through the launch of
Discover100 realizing that the market for lower-priced commuter
bikes was unlikely to fade away at the pace envisaged. Although
the Discover100 is now amongst the top three selling bikes in
India, Bajaj Auto remains a distant second ranker in the 100cc
bikes segment.
The company has recently initiated a fresh marketing campaign
positioning the Discover100 as a superior product to challenge
the leadership of Hero MotoCorp; however, its ability to grow
market share and sustain it thereafter remains to be seen in the
backdrop of its past record of strategy flip-flop and multiple
product portfolio realignments. Adopting a clear product and
brand strategy is all the more imperative for Bajaj Auto now
given that it may be difficult for it to compete with the likes
of Hero MotoCorp and Honda on the basis of other factors such as
product strength, distribution network strength or lower price.
If it could do so, Bajaj Auto would enhance its ability to remain
a relevant competitor in the 100cc segment.
Honda: When Honda had launched the Twister (110 cc) in December
2009, it was expected to redefine the 100cc segment of
motorcycles on the back of its aggressive styling, higher horse
power, better power-to-weight ratio and competitive pricing.
However, the target consumer segment (lower-middle to middle
income group) perhaps preferred to attach greater preference to

conventional looks, lower overall cost of ownership and higher
resale value than the attributes which the Twister stood for.
Honda seems to have drawn on these consumer insights to have
launched a second bike in the commuter segment, Dream Yuga – a
model that has plane looks but is priced Rs. 2,500 higher than
the entry level Splendor NXG. While it remains to be seen to what
extent this new model from Honda’s stable grows its volumes, the
biggest challenge for Honda would be to strengthen its
distribution network, brand and mind share, particularly in the
rural market which is expected to be the primary growth driver
for 100cc bikes over the medium term.
Yamaha: Despite having a presence of over 25 years in the Indian
market, Yamaha, the second largest two-wheeler manufacturer in
the world, continues to have a low single-digit market share in
the domestic motorcycles segment. This has been partly due to the
company’s relatively lower focus on the Indian market in the past
and partly due its frequent model churn. Having discontinued
several brands in the past such as Alba, G5 and Gladiator,
Yamaha’s quest for achieving a balanced product portfolio
continues to evolve. Although the domestic scale of Yamaha is
small in relation to the size of the Indian 2W industry, the
company remains a full-range player with products offered across
segments, exposing it to the risk of having spread itself too
thin.

Yet, Yamaha remains amongst the fastest growing
motorcycle companies in India, albeit on a smaller base, with
growth driven in particular by its 150cc segment bikes (i) SZ-X
and SZ-R for the price conscious commuters seeking to have a
higher cc bike; (ii) FZ-16, FZ-S and Fazer as sporty 150cc
models; and (iii) R-15 as the super sports bike. In our view,
Yamaha’s biggest challenge for sustaining its volume growth in
India is going to be its ability to win over its own past which
implies restoring the confidence of vendors, dealers and other
stakeholders that may have suffered earlier due to the company’s
lower focus on the Indian market. The company, however, has
announced fresh capital investments in India towards setting-up a
new plant in Tamil Nadu with an investment of Rs. 1,500 Crore
(proposed to be incurred over the next five years), a pointer to
the now rising commitment of Yamaha towards the Indian market.
TVS: Based on industry volumes in 2011-12, TVS was the second
largest player in the domestic scooters segment with a market
share of 19.4%. However, the company’s market share has been
sliding sharply since February 2012, being below 15% in each of
the last three months.
TVS has the widest portfolio of products in the scooters segment
including the 60cc Scooty Teenz, the 88cc Scooty Streak and
Scooty Pep+ models and the 110cc Wego model. However, the trend
in demand for sub-100cc scooters has been softening over the last
several years, reflected in the reduction in proportion of sub-

100cc scooters in the overall scooters market from 28% in 2006-07
to 15% in 2011-12. To sustain its market share in this growing
segment, the company plans to launch two new products in 2012/
2013 – (a) a new 125cc scooter to compete with the likes of
Suzuki Access125 and Mahindra Duro125; and (b) a new 100cc hybrid
two-wheeler whose test marketing is proposed to be initiated from
June 2012 onwards before its launch in 2013.
Suzuki: In terms of value proposition, Suzuki’s scooter Access125
scores well over competition given that it is a higher powered,
higher engine capacity scooter that also comes along with a
penetrative price tag. When other scooters offered by competition
were either sub-100cc or 100cc, Suzuki, through the launch of the
Access125 in September 2007, endeavoured to create a new segment
of power scooters. Since the first year of its launch, Suzuki’s
market share has increased from 2.3% in 2007-08 to 11.3% in 2011-
12, registering a volume CAGR of 86% (on a low base). In February
2012, Suzuki launched a new brand Swish125 that is similar to the
Access125 in terms of platform, features and engine
specifications; except that it comes with an improved styling and
lower weight (115 kgs Vs 110 kgs) that should improve fuel
efficiency. Since the target segment for both Access125 as well
as Swish125 remain the same, we believe the brands are more
likely to cannibalize into each others’ volumes rather than
increase the addressable market for Suzuki.

CHAPTER-2
REVIEW OF LITERATURE

2. 1 Conceptual Definition:
Measuring the success of particular product is defined as the
amount of acceptance by the customers. A review of relevant
literature indicates greater simplicity in the process of
critical success factors' identification.
The following parameters have been selected to measure the
success of new products in Indian automobile industry:
Market share Awareness
Repeat purchase and advocacy
Customer Satisfaction
The measure of success for an automobile is very
difficult. Different organizations define it in their own
way. Time horizon has big say in measuring of the new
product success. The time over which you want to evaluate
your product success changes the volume or amount you are
expecting.
For different markets different conditions have to be
taken into account . It‘s important to look at the business
from the customer‘s and market‘s perspective. People are
buying from you. The more you understand your customer‘s
needs and wants the more you can satisfy them. And the more
you understand how they buy — that is, their buying
decision process — the greater the likelihood your sales
and marketing efforts will be successful. The measure of
success for an automobile is very difficult.
2.2 Literature Review:
Dr.N.Chandrasekaran investigated the wants of the customer are
carefully studied by conducting surveys on consumer behavior.
The study also helps to know various marketing variables such as
price and product features. This study will help gain knowledge
about the influence of consumer to prefer a particular brand and
the problems faced by them using such brands.
Rachel Dardis, Horacio Soberon-Ferrer investigated the consumer
decision making is multinational, that is consumer choices are
not base on a single product attributes, instead consumers view
products as bundles of attributes. Product
attributes(automobile ) as well as household characteristics.
According to Lewis &Boom service quality is considered as a
measure of how well the service delivered matches customers
expectations on providing a better service than the customer
expect organizational brand promotional strategies should be

based on developing innovative offers &products, developing
costs.
2.3 Gaps in the existing literature:
Measuring the success rate of automobiles is not an easy task.
Various problems are not properly considered. They are:
Few models are only considered in this project.
Few factors that affect the success are taken into
account.
Most precision analysis are not performed because of
less sample size.

CHAPTER-3
RESEARCH METHODOLOGY
3. Research Methodology: The preparation of the report included extensive study of the organization and market research, which was the primary source ofthe report. I have collected information from retailers by preparing questionnaire.
3.1 Objectives of the study: To study the success of new products launched in Indian
automobile industry. To understand various factors that affect preference of
consumers while purchasing two-wheelers. Critical factors responsible for the success of new product
in Indian automobile.
3.2 Research design:
Descriptive research design:

Researcher is carried out the study with descriptive research. The descriptive research is concerned with describing the characteristics of a particular individual to find factors influencing customer preferences towards purchasing of two-wheeler.
Research Questions
To study the factors influencing factors influencing customer preferences towards purchasing of two-wheeler in Hyderabad.
To find out whether success of new products help in industrysuccess.
Research Design Descriptive researchResearch Method Survey methodResearch Instrument Structured questionnaireSample size 50Sample area HyderabadSampling method Convenience SamplingContact method Personal contactAnalytical tool Percentage analysis
Pilot study
Sixteen questionnaires were distributed for the purpose of pre-testing the questionnaire's contents a complete questionnaire was developed based on the comments collected during the pre-testing period.
Statistical tools
The researcher analyzed the data by using the percentage analysis.

3.2Sampling Design:
Sample denotes only a part of the universe/ population. The sample represents the population and is having the same characterizing as the population.
Sampling method:
This type of sampling technique gives no assurance that every element has some specific change of being included. It is clear that for the non-probability samples, there is no way of calculating the margin of error and the confidence level.
3.3 Scope of the Study:
1. To know the change in demand pattern of the customer
2. It would help us understanding the changes in the requirements & preferences.
3. Study of measuring success act as a ladder to develop newproduct.
3.4 Data collection design:
A marketing researcher has to make a plan for collecting data which may be primary data, secondary data or both.
Primary data:
Primary data has collected through questionnaire administered toretailers, Questionnaires were used to find out ― factors influencing customer preferences towards purchasing of two-

wheeler in Hyderabad city with the help of the questionnaire, filled by 50 customers, the result was analyzed. The sample data was collected through interview from dealers around various showrooms. The following type of questions, were asked in the questionnaire
1. Rank questions.
2. Multiple choice questions.
Secondary data:
The secondary data are collected through various sources like
1. Secondary data are collected through internet related to
company, competitors etc.
2. Review of articles being published on the topic in various
magazines and newspapers
Questionnaire:
The best way to collect data is to personally administer the questionnaires. The advantage of this method is, the data can be collected from the respondent within short period of time. Any doubts that the respondent might have on any questions could be clarified on the spot.
3.4 Analysis design:
The study has various satisfied tools for the analysis of data. They are percentage analysis and cross tabulation.
Percentage analysis:
Percentage analysis is used for the purpose of study which is most suitable for questionnaire based on the objective. Percentage analysis is often used in data presentation for them simply numbers, reducing all of them 0 to 100 ranges. The data are reduced in the standard form with base equal to 100 which fact facilitates relative comparison. The formula used here is
Number of responses
Percentage analysis= ------------------------------------------ * 100
Total no. of respondents
Mean:
Mean in which each item being averaged is multiplied by a number (weight) based on the item’s relative importance. The result is summed and the total is divided by the sum of the weights. Weighted averages are used extensively in descriptive statisticalanalysis such as index numbers.
w1x1+w2x2+-----+wnxn
Weighted average mean = -----------------------------------
N

CHAPTER-4
ANALYSIS AND INTERPRETATION

4. Analysis and Interpretation:
Analysis:
Analysis means a critical examination of the assembled and grouped data for studying the characteristics of the object understudy and it refers to methodical classification of the data givein the tables.
Interpretation:
The term interpretation means explaining the meaning and significance of the arranged data. It is the study of relationship between the various factors. It is being consideredas a basic component of research process because of the followingreasons.
It is through interpretation that the researcher can well understand the abstract principle that works beneath his/her findings, through this he/she can link up the same abstract with those of other studies, having the same abstract principles and thereby can predict about the concrete world of experts, fresh inquiries can test their predictions later on, this way the continuing in research can be maintained.
Interpretation leads to the establishment of explanatory conceptsthat can serve as a guide for future research studies, it opens new avenues of intellectual adventure and stimulates the quest for some knowledge.
Researcher can better appreciate only through interpretation whathis/her findings are, why they are and not make other to understand the real significance of his/her research findings.

1. Do you own a two-wheeler?
Yes80%
No20%
Percentage
Yes No
80 20
Interpretation:
This graph shows that, among the sample I collected, 80% of the
sample were own the Two-wheeler and 20% don’t.
4.2 Most preferable type of two-wheeler?
Bike Scooty scooter010203040506070
Column1
Interpretation is the above graph shows that the 60% of the
sample prefer bikes, 30% prefer scooty, 10% scooters.
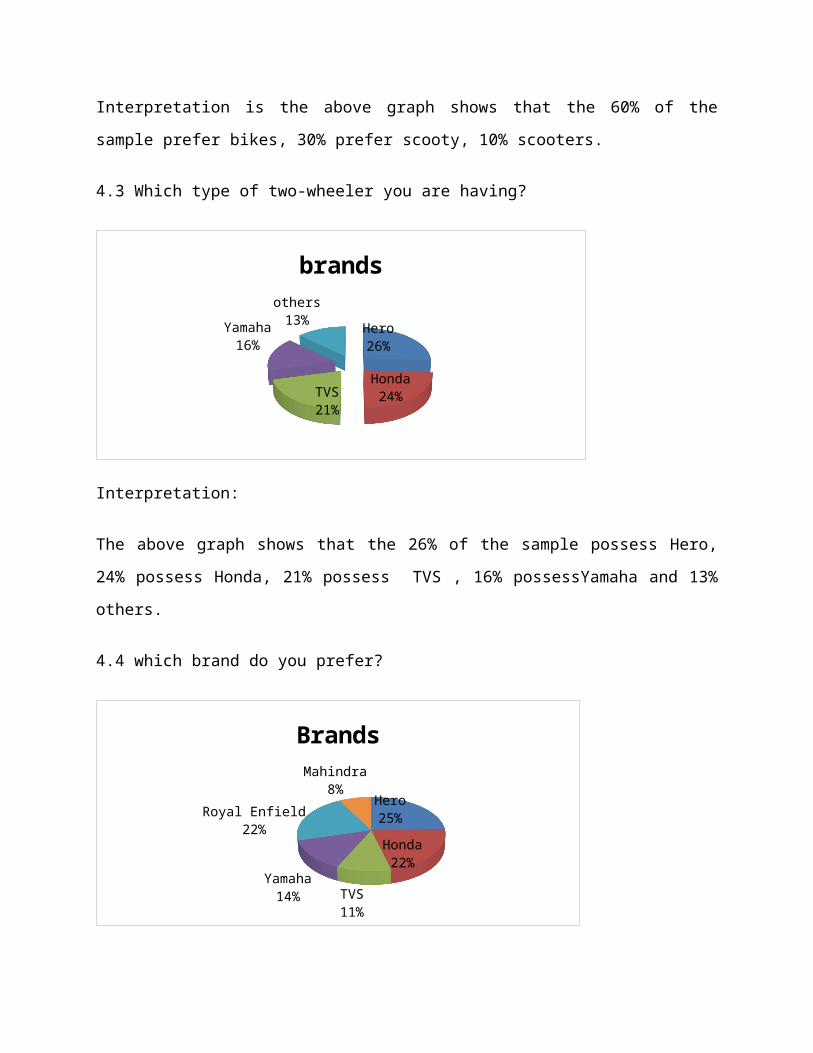
4.3 Which type of two-wheeler you are having?
Hero26%
Honda24%TVS
21%
Yamaha16%
others13%
brands
Interpretation:
The above graph shows that the 26% of the sample possess Hero,
24% possess Honda, 21% possess TVS , 16% possessYamaha and 13%
others.
4.4 which brand do you prefer?
Hero25%Honda22%
TVS11%
Yamaha14%
Royal Enfield22%
Mahindra8%
Brands
Interpretation is the above graph shows that the 24% of the
sample prefers Hero, 21% prefers Honda, 22% prefers Royal
enfield, 11% prefers TVS , 14% prefers Yamaha and 8% prefers
Mahindra.
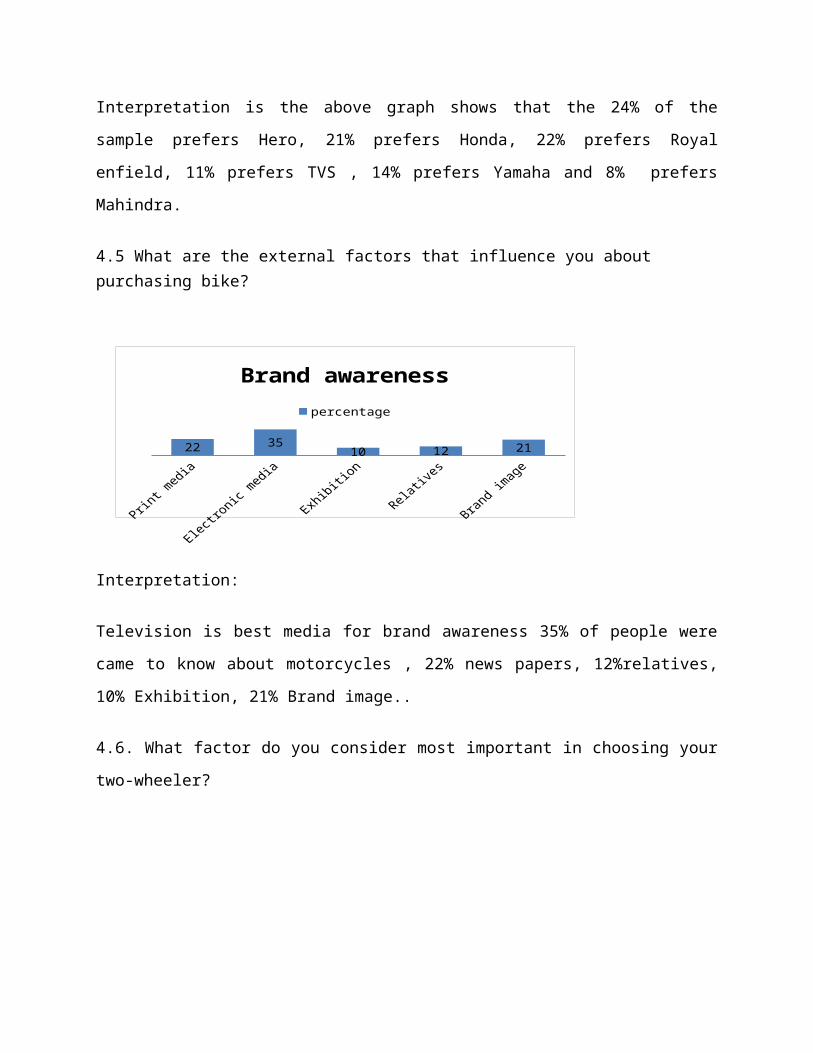
4.5 What are the external factors that influence you about purchasing bike?
22 3510 12 21
Brand awarenesspercentage
Interpretation:
Television is best media for brand awareness 35% of people were
came to know about motorcycles , 22% news papers, 12%relatives,
10% Exhibition, 21% Brand image..
4.6. What factor do you consider most important in choosing your
two-wheeler?

0510152025303540
Features
Ratin
gs
Design/
Look/Style
Pri
ce
Power &
Pickup
Low
Maintenance
Milea
ge35 10 26 15 14
Interpretation:
The above graph shows that, 35% of the sample ranked 1st
Design/Look/Style, 10% to Price, 26% Power/Pick-up, 15% to low
maintenance and 14% with Mileage.
4.7. Specify the color you prefer most?

0510152025303540
green red black blue othersColours
Preferen
ces
The above graph shows that,6% of the sample preferred two-wheeler
with green color, 33 with red, 35% with black, 20% with blue, and
6% with other colors like, silver & so on.,
4.8. What is your preferable budget range for two-wheeler?
40-50,00015%
50-60,00032%
60-70,00019%
70-80,00014%
Above 80,00012%
No range9%
Budgets

Interpretation is The graph shows that, 15% of the sample
preferred the budget range between 40-50000, 31% with 50-60000,
19% with 60-70000,14% with 70-80,000, 12% with above 80000, and
9% with No budget range
4.9. What is the source you prefer to purchase the two-wheeler?
Full cash EMI Bank loan020406080
Purchase
Purchase
Interpretation is 60% prefer Bank loan, 25% prefer full cash, 15%prefer EMI.
4.10. Rate the following according to your preference of purchase
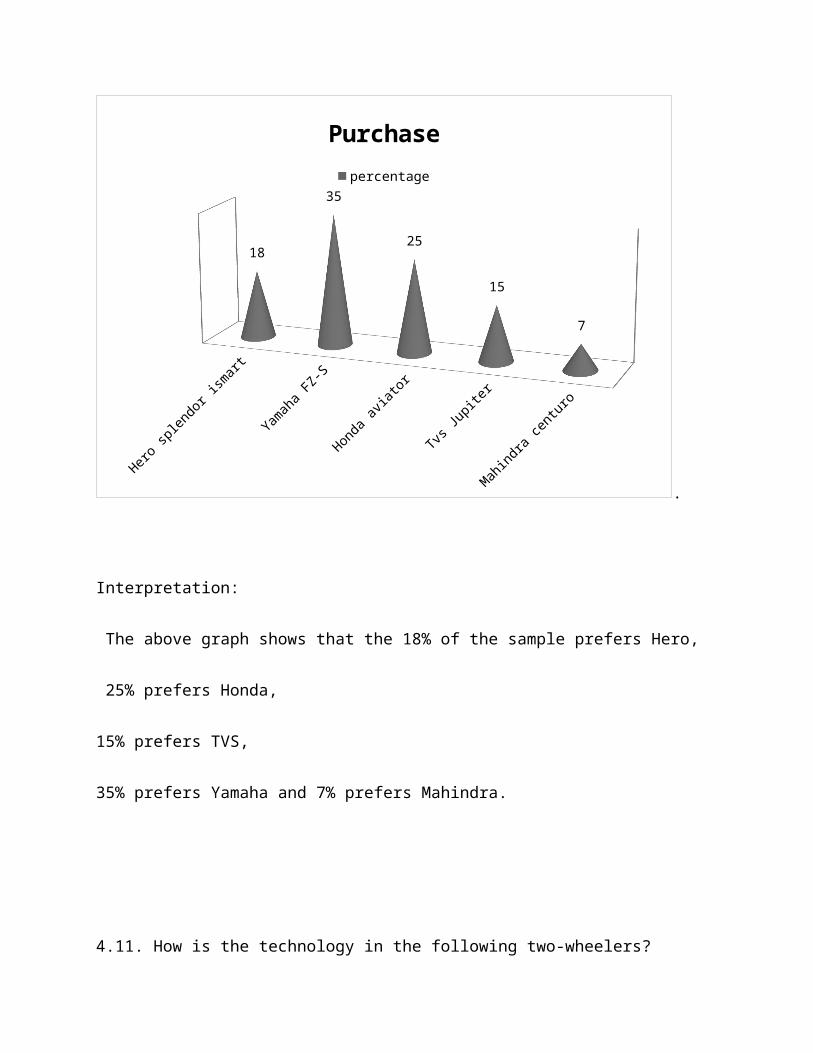
Hero splendor ismart
Yamaha FZ-S
Honda aviator
Tvs Jupiter
Mahindra centuro
18
35
25
15
7
Purchasepercentage
.
Interpretation:
The above graph shows that the 18% of the sample prefers Hero,
25% prefers Honda,
15% prefers TVS,
35% prefers Yamaha and 7% prefers Mahindra.
4.11. How is the technology in the following two-wheelers?

Hero splendor ismart
Honda Aviator
Yamaha FZ-S
TVS Jupiter
Mahindra Centuro
7050 60 50 40
2030 25
25 40
10 20 15 25 20
TechnologyExcellent GOOD POOR
Interpretation: From the above
70% suggest technology of Hero is Excellent, 20% as good and 10% as poor.
50% suggest technology of Honda is Excellent, 30% as good, 20% aspoor.
50% suggest technology of TVS is Excellent, 25% as good, 25% as poor.
60% suggest technology of Yamaha is Excellent, 25% as good, 15% as poor.
40% suggest technology of Mahindra is Excellent, 40% as good, 20%as poor.

12. How is the Fuel efficiency in the following two-wheelers?
Hero splendor ismart
Honda Aviator
Yamaha FZ-S TVS Jupiter Mahindra Centuro
70 68 60 65 55
20 2225 25
30
10 10 15 10 15
Fuel efficiencyExcellent GOOD POOR
Interpretation: From the above
70% suggest fuel efficiency of Hero is Excellent, 20% as good and10% as poor.
68% suggest fuel efficiency of Honda is Excellent, 22% as good, 10% as poor.
65% suggest fuel efficiency of TVS is Excellent, 25% as good, 10%as poor.
60% suggest fuel efficiency of Yamaha is Excellent, 25% as good,15% as poor.
55% suggest fuel efficiency of Mahindra is Excellent, 30% as good, 15% as poor.

13. How effective is the Brand image in purchase of following
two-wheelers?
Hero splendor ismart
Honda Aviator
Yamaha FZ-S TVS Jupiter Mahindra Centuro
70 8065 60 55
20 1025 25 30
10 10 10 15 15
Brand imageHigh Moderate Low
Interpretation: From the above
70% suggest Brand image of Hero is High, 20% as Moderate and 10% as Low.
80% suggest Brand image of Honda is High, 30% as Moderate, 20% asLow .
60% suggest Brand image of TVS is High, 25% as Moderate, 15% as Low.
65% suggest Brand image of Yamaha is High, 25% as Moderate, 10% as Low.

55% suggest Brand image of Mahindra is High, 30% as Moderate, 15%as Low.
14. How is the Out-look in the following two-wheelers?
Hero splendor ismart
Honda Aviator
Yamaha FZ-S
TVS Jupiter
Mahindra Centuro
7050 60 50 40
2030 25
25 40
10 20 15 25 20
OutlookExcellent GOOD POOR
Interpretation: From the above
70% suggest outlook of Hero is Excellent, 20% as good and 10% as poor.
50% suggest outlook of Honda is Excellent, 30% as good, 20% as poor.
50% suggest outlook of TVS is Excellent, 25% as good, 25% as poor.
60% suggest outlook of Yamaha is Excellent, 25% as good, 15% as poor.
40% suggest outlook of Mahindra is Excellent, 40% as good, 20% aspoor.
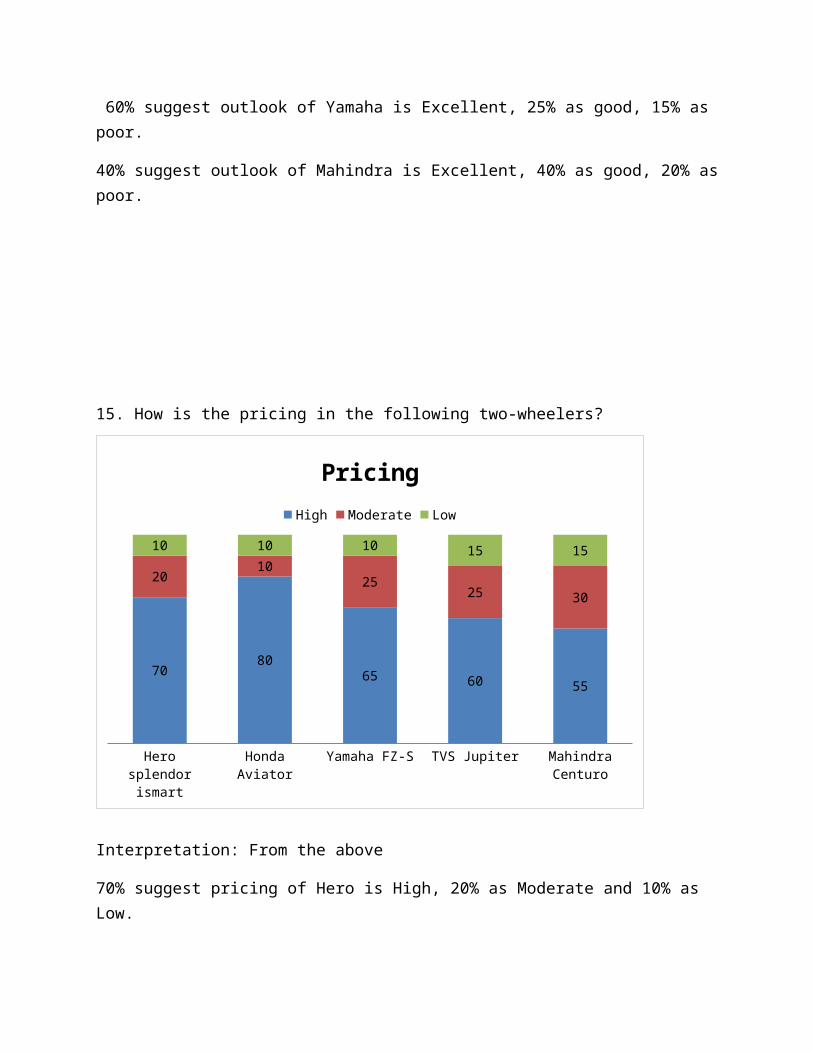
15. How is the pricing in the following two-wheelers?
Hero splendor ismart
Honda Aviator
Yamaha FZ-S TVS Jupiter Mahindra Centuro
70 8065 60 55
20 1025 25 30
10 10 10 15 15
PricingHigh Moderate Low
Interpretation: From the above
70% suggest pricing of Hero is High, 20% as Moderate and 10% as Low.

80% suggest pricing of Honda is High, 30% as Moderate, 20% as Low.
60% suggest pricing of TVS is High, 25% as Moderate, 15% as Low.
65% suggest pricing of Yamaha is High, 25% as Moderate, 10% as Low.
55% suggest pricing of Mahindra is High, 30% as Moderate, 15% as Low.

CHAPTER-5
FINDINGS, CONCLUSIONS AND
SUGGESTIONS
5.1 FINDINGS:
1. All the respondents were aware about these companies.
2. 60%of customers to know the advertisement through media, 12%
of customers were through friends and 28% of customers are
through dealers.
3. 90 percent of the customers were completely satisfied with the
mileage and performance of the bikes, 10 percent of the customers
are dissatisfied with the mileage.

4. 73% of respondents are satisfied with pick-up and 27% of the
customers are dissatisfied.
5. 56% of the respondents are attracted by the quality of the
service to choose the bike, 20% of the respondents are like less
price and 24% of the respondents were like brand image.
6. 50% of the respondents are satisfied with the design, 40% of
the respondents said that average and 10% of the respondents feel
that design is poor.
7. 54% of the respondents considered the price as higher where as
only 8% considered as economical and 38% of the respondent said
it as reasonable.
8. 60 % of the respondents felt the explanation to be
“excellent”. And 35% of them “very good” and rest of 5% felt to
be “poor”.

5.2 Suggestions:
1. The most important media for consumer durables is television.
So, they should go for television advertisements rather going for
newspaper, the television advertisements influences more on the
people. They should spend some expenditure for T.V.
advertisements.
2. Being the price of the bikes are high they should try to
reduce prices because there are many other competitors which can
be selling at lower cost. If not, the sales may decrease. 3. More
features should be added to the bikes according to the needs of
the customer, because their competitors are coming with new
models. According to the competitors these people should change
the models or change the technology.4. Companies should give some
incentives to the dealers for promoting the products their
brands. They should not neglect dealers. They should select good
dealers, which they can give customer satisfaction.5. Company
should setup service centers at dealer level itself. They should
train some personnel for exclusive maintenance of these two
wheelers. They should provide home service to the customers. The
personnel should be appointed by company to the dealers. The
service should be accurate.

5.3 Conclusion:
A study was useful in understanding the customer relationship
management of various bikes among a various customers launching
new formulations can make Two-wheelers as leading one in
automobile industry. About 70% of customers are aware of these
companies.
Most of the customers agree that Honda is best quality with
reasonable price the attitude 50% of customers towards price of
Honda Bikes is reasonable. But 10% of the customers are asking
for improvement in the quality.
Most of the customers agree that Hero is best quality with
reasonable price the attitude 60% of customers towards price of
Bikes is reasonable. But 20% of the customers are asking for
improvement in the quality.
Most of the customers agree that TVS is best quality with
reasonable price the attitude 50% of customers towards price of
Bikes is reasonable. But 10% of the customers are asking for
improvement in the quality.
Most of the customers agree Yamaha is best quality with
reasonable price the attitude 50% of customers towards price of
Bikes is reasonable. But 10% of the customers are asking for
improvement in the quality.
Most of the customers agree Mahindra is best quality with
reasonable price the attitude 50% of customers towards price of
Bikes is reasonable. But 10% of the customers are asking for
improvement in the quality.
References:
Philip Kotler and Kevin Keller, Marketing Management,
Pearson Education, 14th edition (2012).
Virupaxi Bagodi, Biswajit Mahanty, (2008) "Two-wheeler
service sector in India: factors of importance for
sustainable growth", Journal of Advances in Management
Research, Vol. 5, Iss: 1, pp.21 – 27.
Jackson, T, A report to the Consumer Behavior Research,
(2005).
Dr. Satya Sundaram.I, (2006) ‘Two-wheelers: Power, Style and
Mileage’, Facts For You, January, Vol. 26, Issue: 4, pp. 17
– 20.
K. Narasimhan, (2003) "Quality from Customer Needs to
Customer Satisfaction", The TQM Magazine, Vol. 15, Iss: 6,
pp.430 – 431.
Subhadip Roy, (2006) ‘Consumer Choice of Motorbike
Attributes: An Application of Conjoint Analysis’, The ICFAI
Journal of Marketing Management, February, Vol. 5, Issue: 1,
pp. 48 – 56.
Jay.D.Lindqist and Joseph Sirgy.M, (2003) ‘Shopper, Buyer
and Consumer Behaviour’, Bistantra Publishers (P). Ltd.,
Second Edition, pp. 34 – 37.
Prof. Suresh.A.M and Mr. Raja.K.G, (2005) ‘Measuring
Customer Satisfaction for Two-wheelers – An Empirical
Study’, Indian Journal of Marketing, February, Vol. 26,
Issue: 2, pp. 3 – 8.

Leon G Schiffman, Leslin Lazer Kenuk, Consumer Behavior-
Prentice Hall of India Pvt Ltd (6th Edition), pp. 111-150
Nov 2001 .
King, S. (1991), " Brand-building in the 1990s", Journal of
Consumer Marketing, Vol. 8 No.4, pp.43-52
Websites:
www.heromotocorp.com
www.bikeportal.com
www.zigwheels.com

CHAPTER-6
APENDICIES
SAMPLE QUESTIONNAIRE
I am student of MBA conducting a survey as a part of curriculum and would be grateful if you could spare some of your precious time and please fill this questionnaire
Personal profile
Name :
Age :
Gender :

1. Do you own a two-wheeler?
(a) Yes (b) No
2. Which type of two-wheeler you prefer most?
(a) Motor Bike (b) Scooty (c) Scooter
3. What brand right now you are having?
(a) Hero (b) Honda (c) TVS
(d) Yamaha (e) others
4. According to you which company you like most?
(Mention the name if the option is not there)
(a) Hero (b) Honda (c) TVS
(d) Yamaha (e) Royal Enfield (f) Mahindra
5. What are the external factors that influence you about purchasing bike?
(a) Print media (b) Electronic media (c) Exhibition (d) Relatives
(e) Brand image
6. What is your preference in choosing a two-wheeler?
(a) Mileage (b) Power and pickup (c) Price
(d) Stylish look (e) Low maintenance
7. What is your preferable budget range for two-wheeler?
(a) 40-50,000 (b) 50-60,000 (c) 60-70,000
(d) 70-80,000 (e) Above 80,000(f) No range
8. What is the source you prefer to purchase the two-wheeler?
(a) Full cash (b) EMI (c) Bank loan
9. Which color of vehicle do you prefer?
10. Rate the following according to your preference of purchase.
(a) Hero splendor ismart (b) Honda Aviator (c) TVS Jupiter
(d) Yamaha FZ-S (e) Mahindra Centuro

11. How is the technology in the following two-wheelers?
(Tick the category of your preference)
Excellent Good Poor
Hero splendor ismart ___ ___ ___
Yamaha FZ-S ___ ___ ___
Mahindra Centuro ___ ___ ___
Honda Aviator ___ ___ ___
TVS Jupiter ___ ___ ___
12. How is the Fuel efficiency in the following two-wheelers?
(Tick the category of your preference)
Excellent Good Poor
Hero splendor ismart ___ ___ ___
Yamaha FZ-S ___ ___ ___

Mahindra Centuro ___ ___ ___
Honda Aviator ___ ___ ___
TVS Jupiter ___ ___ ___
13. How effective is the Brand image in purchase of following two-wheelers?
High Moderate Low
Hero splendor ismart ___ ___ ___
Yamaha FZ-S ___ ___ ___
Mahindra Centuro ___ ___ ___
Honda Aviator ___ ___ ___
TVS Jupiter ___ ___ ___
14. How is the Out-look in the following two-wheelers?
(Tick the category of your preference)
Excellent Good Poor
Hero splendor ismart ___ ___ ___
Yamaha FZ-S ___ ___ ___
Mahindra Centuro ___ ___ ___
Honda Aviator ___ ___ ___
TVS Jupiter ___ ___ ___
15. How is the pricing in the following two-wheelers?
(Tick the category of your choice)
High Moderate Low
Hero splendor ismart ___ ___ ___
Yamaha FZ-S ___ ___ ___
Mahindra Centuro ___ ___ ___
Honda Aviator ___ ___ ___
TVS Jupiter ___ ___ ___ 1
16. Please give suggestions to improve new brands.

_________________________________________________
Related Documents