MEASURING THE QUALITY OF THE PEDESTRIAN ENVIRONMENT: TOWARDS AN APPROPRIATE ASSESSMENT METHODOLOGY Prepared by Andrew Devlin MA Candidate Presented to Dr. Lawrence Frank PLAN 548Q School of Community and Regional Planning 7 March 2008 The University of British Columbia

Welcome message from author
This document is posted to help you gain knowledge. Please leave a comment to let me know what you think about it! Share it to your friends and learn new things together.
Transcript

MEASURING THE QUALITY OF THE PEDESTRIAN ENVIRONMENT:TOWARDS AN APPROPRIATE ASSESSMENT METHODOLOGY
Prepared byAndrew DevlinMA Candidate
Presented toDr. Lawrence FrankPLAN 548QSchool of Community and Regional Planning
7 March 2008The University of British Columbia

A. Devlin
Page 2
ABSTRACT
In order to plan for more walkable environments, methods are required that allow
planners and decision-makers to effectively identify and assess the elements of the
built environment that support or detract from walking. The existing pedestrian level-
of-service methodology is critiqued and demonstrated to be an inappropriate tool
to assess the pedestrian environment. A more accurate and sensitive tool would
incorporate and account for the various micro-scale environmental factors that
define the walking environment. To improve existing assessment processes,
municipalities will be required to identify what elements need to be measured, how
to measure these elements and, finally, incorporating them into an appropriate
assessment framework. The literature and progressive practical examples like the For
Collins pedestrian LOS methodology provide a framework for how to develop an
appropriate tool.

A. Devlin
Page 3
TABLE OF CONTENTS
INTRODUCTION 4
DEFINING AND DISSECTING THE PEDESTRIAN ENVIRONMENT 4
MEASURING THE PEDESTRIAN ENVIRONMENT 6
Existing Approach 6
Strengths and Weaknesses of Existing Approach 7
ARTICULATING A NEW DIRECTION 8
What Needs To Be Measured? 9
How Should These Elements Be Measured? 9
What Should A New Methodology Look Like? 10
CASE STUDY 11
Fort Collins, Colorado – A Progressive Pedestrian LOS 11
CONCLUSIONS 12
REFERENCES 12

A. Devlin
Page 4
INTRODUCTION
With the explosion of Smart Growth, New Urbanism and neo-Traditional urban design
ideologies during the past decade, it has become common for many municipal
governments and planning agencies to cite their commitment towards planning for
the pedestrian and nonmotorized traveler (Benfield, 2003). In order to appropriately
plan for more walkable environments, methods are required that allow planners and
decision-makers to effectively identify and assess the elements of the built
environment that support or detract from walking. (Muraleetharan and Hagiwara,
2007). The quality of the pedestrian environment has been measured for many years
throughout North American and Europe using the Level-of-Service (LOS) approach.
Debate exists, however, over the appropriateness of existing LOS methods to
capture the numerous factors that contribute to how walkable a streetscape may
be perceived to be (Clifton et al., 2007). As a result, there is concern that
inappropriate policy and investment initiatives will be directed at the pedestrian
environment (Landis et al., 2001). Recognizing this situation, the goal of this paper is
to summarize the dialogue and debate on pedestrian level of service measurements
and lend ideas on how the process can be improved. The paper begins with a
discussion on the myriad of factors and elements that may contribute to a walkable
environment. It then draws on these to assess and critique the existing
methodologies that measure the quality of the pedestrian environment. The last
section will focus on identifying shortcomings of the existing tools and measures and
ways to improve the process will be discussed and recommended.
DEFINING AND DISSECTING THE PEDESTRIAN ENVIRONMENT
The literature on what elements come together to define a walkable urban
environment is quite extensive. A majority of this research limit measures of interest to
more macro-scale elements such as land use mix, density, and street patterns (Frank
and Engelke, 2001; Greenwald and Boarnet, 2001; Handy et al., 2002; Saelens et al.,
2003). This body of work has generally found that areas with higher residential and
commercial densities, higher intersection densities, and a functional mixing of land
uses in close proximity to where people live and work are associated with higher
levels of walking and cycling (Frank and Pivo, 1994; Frank et al., 2005). What these
A. Devlin
Page 5
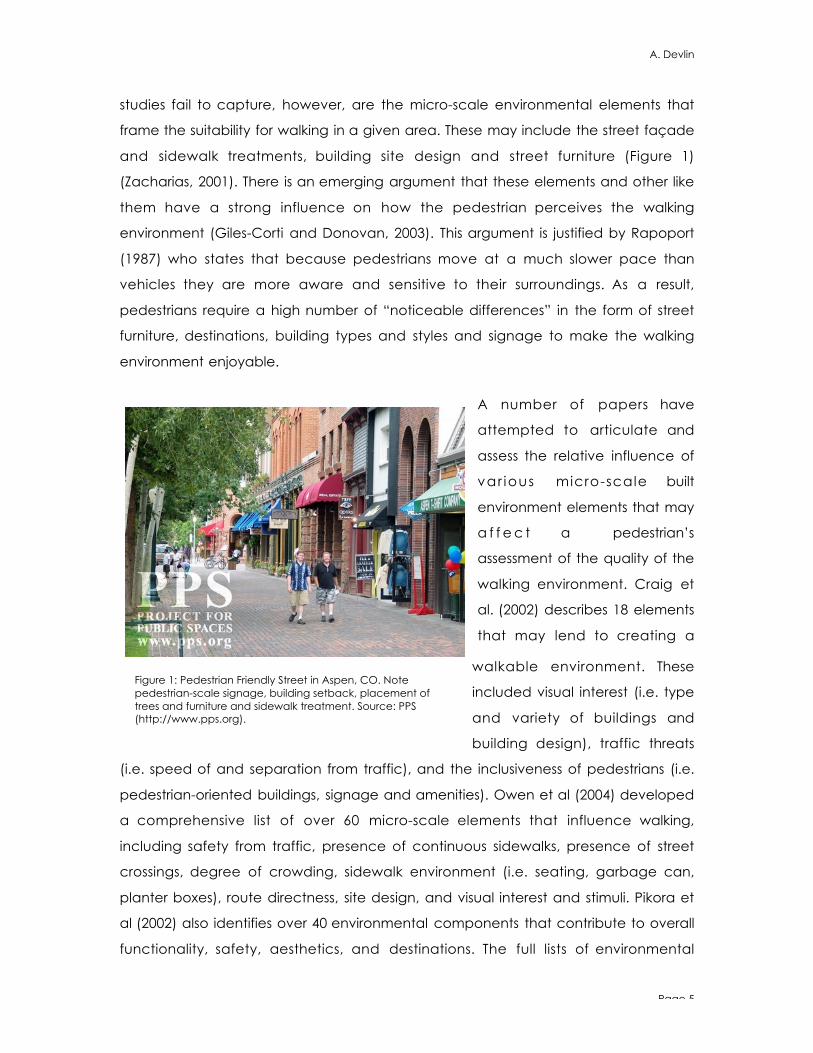
studies fail to capture, however, are the micro-scale environmental elements that
frame the suitability for walking in a given area. These may include the street façade
and sidewalk treatments, building site design and street furniture (Figure 1)
(Zacharias, 2001). There is an emerging argument that these elements and other like
them have a strong influence on how the pedestrian perceives the walking
environment (Giles-Corti and Donovan, 2003). This argument is justified by Rapoport
(1987) who states that because pedestrians move at a much slower pace than
vehicles they are more aware and sensitive to their surroundings. As a result,
pedestrians require a high number of “noticeable differences” in the form of street
furniture, destinations, building types and styles and signage to make the walking
environment enjoyable.
A number of papers have
attempted to articulate and
assess the relative influence of
var ious micro-scale built
environment elements that may
a f f e c t a pedestrian’s
assessment of the quality of the
walking environment. Craig et
al. (2002) describes 18 elements
that may lend to creating a
walkable environment. These
included visual interest (i.e. type
and variety of buildings and
building design), traffic threats
(i.e. speed of and separation from traffic), and the inclusiveness of pedestrians (i.e.
pedestrian-oriented buildings, signage and amenities). Owen et al (2004) developed
a comprehensive list of over 60 micro-scale elements that influence walking,
including safety from traffic, presence of continuous sidewalks, presence of street
crossings, degree of crowding, sidewalk environment (i.e. seating, garbage can,
planter boxes), route directness, site design, and visual interest and stimuli. Pikora et
al (2002) also identifies over 40 environmental components that contribute to overall
functionality, safety, aesthetics, and destinations. The full lists of environmental
Figure 1: Pedestrian Friendly Street in Aspen, CO. Notepedestrian-scale signage, building setback, placement oftrees and furniture and sidewalk treatment. Source: PPS(http://www.pps.org).
A. Devlin
Page 6
elements and components identified by Craig et al. (2002) and Owen et al. (2004)
are found in Appendix A.
Studies have been conducted that offer empirical evidence of the influence of
micro-scale environmental elements on defining the quality of the pedestrian
environment. Research by Humpel et al. (2002), Giles-Corti and Donovan (2003), and
Saelens et al. (2003) found highly walkable environments are positively correlated
with strong aesthetic qualities, higher perceptions of pedestrian safety and access to
appropriate facilities. Brownson et al. (2004) surveyed residents in the San Diego area
and demonstrated that characteristics like a pedestrian-oriented walking
environment, stimulating neighbourhood aesthetics and neighbourhood safety
contributed to a more enjoyable walking environment. These studies and other like
them support the idea that what defines the quality of the pedestrian environment is
complex. The presence and quality of these types of features needs to be assessed
in order to better plan for successful pedestrian environments.
MEASURING THE PEDESTRIAN ENVIRONMENT
Existing Approach
The most widely used method to assess the quality of the pedestrian environment is
the pedestrian Level-of-Service (LOS) measurement (Kerridge et al., 2001). This
method employs a letter scale from “A” to “F” to measure and describe the overall
walking conditions of the pedestrian environment. An LOS “A” is considered an ideal
environment while LOS “F” would be the worst or most unfitting for a pedestrian
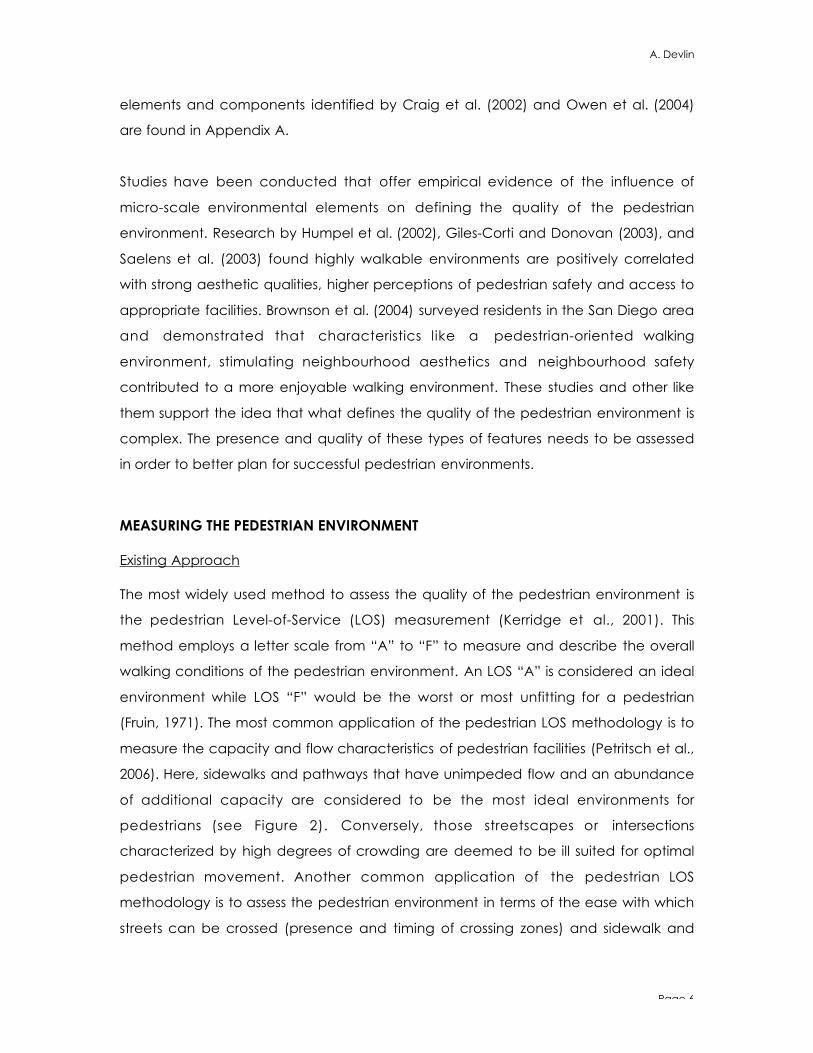
(Fruin, 1971). The most common application of the pedestrian LOS methodology is to
measure the capacity and flow characteristics of pedestrian facilities (Petritsch et al.,
2006). Here, sidewalks and pathways that have unimpeded flow and an abundance
of additional capacity are considered to be the most ideal environments for
pedestrians (see Figure 2). Conversely, those streetscapes or intersections
characterized by high degrees of crowding are deemed to be ill suited for optimal
pedestrian movement. Another common application of the pedestrian LOS
methodology is to assess the pedestrian environment in terms of the ease with which
streets can be crossed (presence and timing of crossing zones) and sidewalk and
A. Devlin
Page 7
pathway continuity (Dixon, 1996). Where more of these features exist, the better the
environment is deemed to be pedestrian-friendly. These methods of assessing the
built environment in terms of flow, movement and
capacity have been normalized in the Highway
Capacity Manual (HCM), the industry standard
guidelines for evaluating the pedestrian
environment (TRB, 2000). Indeed, many major
United States metropolitan areas including New
York City and Baltimore have adopted this
methodology into their practical planning practice
to assess and better plan for the pedestrian
environment (Baltimore Metropolitan Council, 2004;
NYC DCP, 2006).
Strengths and Weaknesses of Existing Approach
The more common pedestrian LOS applications
outlined above have several advantages which
makes their appealing to many municipalities and
planning agencies. First, these methodologies are
rather simple. It is relatively easy, for instance, to
collect and assess data on sidewalk continuity,
location of crosswalks and general flow
characteristics (Petritsch et al., 2006). Second, the
standardization of the pedestrian LOS that assesses
flow, movement and capacity characteristics in the HCM allows planners and
decision-makers to utilize pre-developed ways of assessing data and allows for easy
comparison of LOS ratings from a certain place and time and other location (NYC
DCP, 2006).
Numerous deficiencies and criticisms of the existing assessment approach have
been identified. Research by Khisty (1994), Jaskiewicz (1999), Phillips and Guttenplan
(2003), and Muraleetharan and Hagiwara (2007) points out that the existing
pedestrian LOS methodologies used in many North American jurisdictions are
Figure 2: Images of pedestrianLOS standards contained in theHighway Capacity Manual. LOSA is defined as the bestcondition. LOS F is consideredthe worst. Source: HCM, 2000.
A. Devlin
Page 8
inaccurate in that they do not reflect and incorporate other important elements that
aid in defining how walkable an environment is from the pedestrians perspective.
These include the myriad of factors discussed in the previous section and found in
Appendix A. By not incorporating and assessing these additional measures, it can be
argued that the existing, more common pedestrian LOS framework being used may
actually reinforce the perpetuation of plans, policies and initiatives that do not
favour walking and nonmotorized transportation. For instance, using these measures,
more traditional suburban streets and arterials can be developed with a continuous
sidewalk or pathway system and a large number of strategically placed crosswalks
can register a high level of service rating although walking may actually be quite
impractical and unexciting due to wide road widths, homogenous and uninteresting
site design, and the lack of pedestrian amenities and signage that characterize
many traditional suburban developments (Landis et al., 2001). Under current
methods, street furniture like benches, signage and planter boxes are actually
considered barriers that impede pedestrian flow and therefore contribute negatively
to a successful pedestrian environment (NYC DCP, 2006). It would appear, then, that
a complete shift in thinking about the pedestrian environment is required on the part
of municipalities and planning agencies to develop and use more accurate and
appropriate LOS measurements.
ARTICULATING A NEW DIRECTION
Despite the abundance of criticism, much of the work directed at improving the
pedestrian LOS methodology is focused on strengthening the current applications of
assessing pedestrian flow and the availability of pedestrian facilities and
infrastructure (Baltes and Chu, 2002). Although important in certain respects, this
work does little to push assessment methodologies towards a more comprehensive
framework like that called for by Rapoport (1987). Where research has been
directed at explicitly articulating a more appropriate way for assessing the quality of
the pedestrian environment, it is scattered throughout the literature (Gallin, 2001).
This section will draw on this body of work to bring together and articulate the various
ideas for improving the pedestrian LOS measurement.
A. Devlin
Page 9
What Needs To Be Measured?
There are a number of objective and subjective elements that contribute to defining
the pedestrian environment (see Appendix A). It is impossible to measure, let alone
know, every factor that is most important to residents who walk or cycle. Although
there are currently no standard or common ways of establishing what these factors
(Handy and Clifton, 2001), the literature points to several ways of collecting this
information. Surveys, interviews and focus groups, for instance, can be used
determine what certain streetscape elements are the most important (or not) for
walking environments (Pikora et al., 2003). Surveys can be developed to ask people
to consider aspects of the built environment that might support or impede walking in
their neighbourhood and how the design of these and other places may be
improved to facilitate walking (Day et al., 2006). Surveys, however, may take a
substantial amount of time and money to undertake, something many municipalities
may not have (Day et al., 2006). In their place, municipalities and agencies may turn
to the literature. This paper has demonstrated that many studies have looked at
which elements lend the most influence to defining walkable environments. These
could be used as a foundation for what a municipality or agency may want to
assess. The relatively low cost of this option may make it more appealing for many
municipalities.
How Should These Elements Be Measured?
Many of the elements identified by pedestrians that define the quality of the walking
environment can be difficult to quantify or measure (Khisty, 1994). For instance, issues
may arise in how to effectively assess the visual stimulus or aesthetical qualities of a
streetscape. The literature provides an established body of work that offers numerous
ways to quantify or measure these subjective qualities. For instance, pedestrian
safety may be measured in terms of amount of quality of pedestrian-scale lighting,
the presence of clear sightlines, or the amount of street parking separating
pedestrians from traffic (Hess et al., 1999; Landis et al., 2001; Chu et al., 2004). Visual
and aesthetic quality may be measured by the presence of historical buildings and
unique architecture, public art and street furniture and the building setback from the
sidewalk/street (Gallin, 2001). Field surveys undertaken by municipal or agency staff
or pedestrians themselves may be used to identify and record the pertinent built

A. Devlin
Page 10
environment characteristics (Day et al., 2006). It is also possible that many
municipalities or agencies will already have information on many of these elements
scattered throughout various departments (Handy and Clifton, 2001). In this case, it
would be a matter of collecting all of the pertinent data and standardizing it into a
format that will allow for a meaningful analysis. Geographic Information Systems
(GIS) can be used to efficiently map and analyze the distribution of key elements like
street furniture, historical buildings, crosswalks and sidewalks, and areas of on-street
parking an create databases of the features (Aultman-Hall et al., 1997). Lee and
Moudon (2006) used GIS to capture and map various environmental elements
including the location of trees and street furniture, crosswalks and topography in a
study that explored the correlates of walking and cycling. Combining different map
layers of various features in a GIS enables the planner or decision-maker to produce
a visual representation of where environments are more conducive to pedestrian
activity and those that are not and require more immediate attention.
What Should A New Methodology Look Like?
The potential exists to identify and measure additional elements and factors that
contribute to the quality of the pedestrian environment in a pedestrian LOS
assessment tool. Recent work, however, has explore the relevance of the traditional
LOS scale of measurement to effectively and accurate assess the myriad of factors
that may define the pedestrian environment. Phillips and Guttenplan (2003), for
instance, lament that agencies should not focus efforts to utilize the broad LOS “A-F”
categorization. These categories often aggregate and combine various elements
that contribute to a certain theme or major characteristics like “safety” or “visual
aesthetics” and apply a letter grade to each one. The authors note that a variety of
factors that influence the quality of the pedestrian environment may not readily lend
themselves to such an aggregated and rigid scale of measurement and therefore
call for tools that assess the overall quality of the pedestrian environment.
Environmental audit instruments offer a potentially more comprehensive and flexible
alternative. These tools allow the user to rate and evaluate individual elements of the
built environment that are defined as influencing the quality of the streetscape.
(Clifton et al., 2007). In this sense, they allow planners and decision-makers to
pinpoint those exact elements that contribute to or detract from a walkable

A. Devlin
Page 11
streetscape. Audit instruments have been developed and implemented in Australia
(Pikora et al., 2002) and in the United States (Day et al., 2006; Clifton et al., 2007) that
allow the user to evaluate various elements of the built environment. The testing of
these instruments has revealed these instruments to be relatively consistent, reliable
and easy to use (Moudon and Lee, 2003). Given their potential to include countless
variables that may be evaluated these instruments may result in more detailed
characterization of the environment. As a result, however, they may require more
time, resources and commitment to develop and administer (Clifton et al., 2007). An
example of an environmental audit instrument developed by Clifton et al. (2007) is
found in Appendix B.
CASE STUDY
Fort Collins, Colorado – A Progressive Pedestrian LOS
The pedestrian LOS developed for Fort Collins, Colorado embodies many of the
elements discussed in the previous section and serves as a practical example of the
potential for developing and implementing progressive tools to assess the quality
and performance of the pedestrian environment. In 1996, the City of Fort Collins
developed a comprehensive pedestrian plan that effectively placed the needs of
the pedestrian as a primary planning goal for the City. A new pedestrian LOS was
seen as a key tool that would aid the City in analyzing existing pedestrian conditions
and proposed public and private improvement projects (City of Fort Collins, 1996).
The LOS was developed through extensive consultation work. Pedestrian focus
groups, Fort Collins Transportation Board officials, Street Standards Committee, and
those in attendance at numerous local workshops and outreach initiatives were
allowed to actively contribute in the planning and development process. The final
product assesses pedestrian conditions based on directness (measurement of
walking trip length), continuity (measurement of completeness of sidewalk and
pathway system), street crossings (measurement of pedestrian safety in crossing a
street), visual interest and amenities (measurement of the pedestrian system
attractiveness and features) and security (measurement of the pedestrian’s sense of
security). A variety of variables like number and location of crosswalks, building
setbacks, street furniture and pedestrian lighting are included under each category.

A. Devlin
Page 12
The city also established threshold values for each category of measurement. These
thresholds define the minimum acceptable standard for each element. They also
have strong policies that require new public and private developments as well as
major street improvements and redevelopment should adhere to the pedestrian LOS
standards and attempt to attain the required threshold values. The Fort Collins
Pedestrian LOS included in this paper in Appendix C.
CONCLUSIONS
Existing pedestrian LOS methodologies are entrenched in an ideology based on
ease of movement and efficiency of the pedestrian system. These initiatives neglect
to account for other subjective factors that are proving to be influential in defining
the quality of the walking environment and, as a result, may lend to the perpetual
(re) development of truly unwalkable spaces. This paper has demonstrated that
potential exists to develop an appropriate quality of service assessment
methodology for the pedestrian environment. To do so, three key aspects must be
overcome. These are identifying what elements need to be measured, how to assess
the elements and incorporating these into an appropriate assessment framework.
The literature and progressive practical examples like the For Collins pedestrian LOS
methodology provide a framework for how to develop an appropriate tool. It should
be acknowledged, however, that substantial efforts would be required on the part
of municipalities and planning agencies to initiate and undertake these projects. If
municipalities wish to strive towards creating more walkable spaces, the complexity
and challenge of developing an appropriate assessment framework should not
deter them.
REFERENCES
Aultman-Hall, L., Roorda, M., & Baetz, B. W. (1997). Using GIS for evaluation ofneighborhood pedestrian accessibility. Journal of Urban Planning andDevelopment, 123(1), 10-17.
Baltes, M. R., & Chu, X. (2002). Pedestrian level of service for midblock streetcrossings. Transportation Research Record, 1818, 125-133.

A. Devlin
Page 13
Baltimore Metropolitan Council. (2004). Bicycle level of service update & pedestrianlevel of service evaluation. Accessed February 2008 from the World WideWeb: http://www.baltometro.org/reports/BikePedLOS.pdf
Benfield, F. K. (2003). Solving sprawl: Models of smart growth in communities acrossAmerica. Washington, D.C.: Island Press.
Brownson, R. C., Chang, J. J., Eyler, A. A., & Ainsworth, B. E. (2004). Measuring theenvironment for friendliness toward physical activity: A comparison of thereliability of 3 questionnaires. American Journal of Public Health, 94(3), 473-483.
Chu, X., Guttenplan, M., & Baltes, M. R. (2004). Why people cross where they do: Therole of the street environment. Transportation Research Record, 1878, 3-10.
City of Fort Collins. (1996). Pedestrian Level of Service 1996. Accessed February 2008from the World Wide Web:http://fcgov.com/transportationplanning/pdf/levelofservice.pdf
Clifton, K., Livismith, A., & Rodriguez, D. (2007). The development and testing of anaudit for the pedestrian environment. Landscape and Urban Planning, 80(1-2), 95-110.
Craig, C. L., Brownson, R. C., Cragg, S. E., & Dunn, A. L. (2002). Exploring the effect ofthe environment on physical activity: A study examining walking to work.American Journal of Preventive Medicine, 23(2S), 36-43.
Day, K., Boarnet, M. G., Alfonzo, M., & Forsyth, A. (2006). The Irvine–Minnesotainventory to measure built environments development. American Journal ofPreventive Medicine, 30(2), 144-152.
Dixon, L. B. (1996). Bicycle and pedestrian level-of-service performance measuresand standards for congestion management systems. Transportation ResearchRecord, 1538, 1-9.
Frank, L., & Engelke, P. (2001). The built environment and human activity: Exploringthe impacts of urban form on public health. Journal of Planning Literature,16(2), 202-218.
Frank, L., Schmid, T., Sallis, J., Chapman, J., & Saelens, B. (2005). Linking objectivelymeasured physical activity with objectively measured urban form: Findingsfrom SMARTRAQ. American Journal of Preventive Medicine, 28(2), 117-125.
Frank, L. D., & Pivo, G. (1994). Impacts of mixed use and density on utilization of threemodes of travel: single-occupant vehicle, transit, and walking. TransportationResearch Record, 1466, 44-52.
Fruin, J. (1971). Pedestrian Planning and Design. New York: Metropolitan Associationof Urban Designers and Environmental Planners, Inc.
A. Devlin
Page 14
Gallin, N. (2001). Quantifying pedestrian friendliness: Guidelines for assessingpedestrian level of service. Proceedings from Australia: Walking the 21stCentury Conference.
Giles-Corti, B., & Donovan, R. J. (2003). Relative influence of individual, socialenvironmental, and physical environmental correlates of walking. AmericanJournal of Public Health, 93(9), 1583-1589.
Greenwald, M. J., & Boarnet, M. G. (2001). The built environment as a determinant ofwalking behavior: Analyzing non-work pedestrian travel Portland, Oregon.Transportation Research Record, 1780, 33-41.
Handy, S., & Clifton, K. (2001). Evaluating neighborhood accessibility: possibilities andpracticalities. Journal of Transportation and Statistics, 4(2-3), 67-78.
Handy, S. L., Boarnet, M. G., Ewing, R., & Killingsworth, R. E. (2002). How the builtenvironment affects physical activity: Views from urban planning. AmericanJournal of Preventive Medicine, 23(2S), 64-73.
Hess, P. M., Moudon, A. V., Snyder, M. C., & Stanilov, K. (1999). Site design andpedestrian travel. Transportation Research Record, 1674, 9-19.
Humpel, N., Owen, N., & Leslie, E. (2002). Environmental factors associated withadults' participation in physical activity: A review. American Journal ofPreventive Medicine, 22 (3). 188-199.
Jaskiewicz, F. (2001). Pedestrian level of service based on trip quality. Proceedingsfrom Urban Street Symposium Conference.
Kerridge, J., Hine, J., & Wigan, M. (2001). Agent-based modelling of pedestrianmovements: The questions that need to be asked and answered.Environment and Planning B: Planning and Design, 28(3), 327-341.
Khisty, C. (1994). Evaluation of pedestrian facilities: Beyond the level-of-serviceconcept. Transportation Research Board, 1438, 45-50.
Landis, B. W., Vattikuti, V. R., Ottenberg, R. M., & McLeod, D. S. (2001). Modeling theroadside walking environment: Pedestrian level of service. TransportationResearch Record, 1773, 82-88.
Lee, C., & Moudon, A. V. (2006). Correlates of walking for transportation or recreationpurposes. Journal of Physical Activity and Health, 3(1), 77-98.
Moudon, A. V., & Lee, C. (2003). Walking and bicycling: An evaluation ofenvironmental audit instruments. American Journal of Health Promotion,18(1), 21-37.

A. Devlin
Page 15
Muraleetharan, T., & Hagiwara, T. (2007). Overall level of servce of urban walkingenvironment and its influence on pedestrian route chice behavior: Analysis ofpedestrian travel in Sapporo, Japan. Transportation Research Record, 2002, 7-17.
New York City Department of City Planning (NYC DCP). (2006). NYC Pedestrian Levelof Service STudy - Phase I, 2006. Accessed February 2008 from the World WideWeb: www.nyc.gov/html/dcp/html/transportation/td_ped_level_serv.shtml
Owen, N., Humpel, N., Leslie, E., Bauman, A., & Sallis, J. (2004). Understandingenvironmental influences on walking: Review and research agenda.American Journal of Preventive Medicine, 27(1), 67-76.
Petritsch, T. A., Landis, B. W., McLeod, P. S., & Huang, H. F. (2006). Pedestrian level-of-service model for urban arterial facilities with sidewalks. TransportationResearch Record, 1982, 84-89.
Phillips, R., & Guttenplan, M. (2003). A review of approaches for assessing multimodalquality of service. Journal of Public Transportation, 6(4), 19.
Pikora, T. (2003). Developing a framework for assessment of the environmentaldeterminants of walking and cycling. Social Science & Medicine, 56(8), 1693-1703.
Pikora, T., Bull, F. C. L., Jamrozik, K., & Knuiman, M. (2002). Developing a reliable auditinstrument to measure the physical environment for physical activity.American Journal of Preventive Medicine, 23(3), 187-194.
Rapoport, A. (1987). Pedestrian Street use: Culture and perception. In Anne Moudon(ed) Public Streets for Public Use. New York: Van Nostrand Reinhold.
Saelens, B., Sallis, J., Black, J. B., & Chen, D. (2003). Neighborhood-based differencesin physical activity: An environment scale evaluation. American Journal ofPublic Health, 93(9), 1552-1558.
Saelens, B., Sallis, J., & Frank, L. (2003). Environmental correlates of walking andcycling: Findings from the transportation, urban design, and planningliterature. Annals of Behavioral Medicine, 25(2), 80-91.
Transportation Research Board (TRB). (2000). Highway Capacity Manual.Washington, DC: Transportation Research Board, National Research Council.
Zacharias, J. (2001). Pedestrian behavior pedestrian behavior and perception inurban walking environments. Journal of Planning Literature, 16(1), 3-18.

A. Devlin
Page 16
APPENDIX A
BUILT ENVIRONMENT CHARACTERISTICS

A. Devlin
Page 17
Source: Craig et al. (2002).

A. Devlin
Page 18
Source: Owen et al. (2004).

A. Devlin
Page 19
APPENDIX B
SAMPLE ENVIRONMENTAL AUDIT INSTRUMENT

A. Devlin
Page 20
Source: Clifton et al. (2007).

A. Devlin
Page 21
APPENDIX C
FORT COLLINS, CO PEDESTRIAN LOS

A. Devlin
Page 22
Related Documents