Measuring the psychological impact of work related stress and related occupational factors in the Australian infrastructure construction industry Study Outcomes Prepared by: Associate Professor Luke Downey & Professor Con Stough (Swinburne University)

Welcome message from author
This document is posted to help you gain knowledge. Please leave a comment to let me know what you think about it! Share it to your friends and learn new things together.
Transcript
Measuring the psychological impact of work related stress and related occupational factors in the Australian infrastructure construction industry
Study Outcomes
Prepared by: Associate Professor Luke Downey & Professor Con Stough
(Swinburne University)
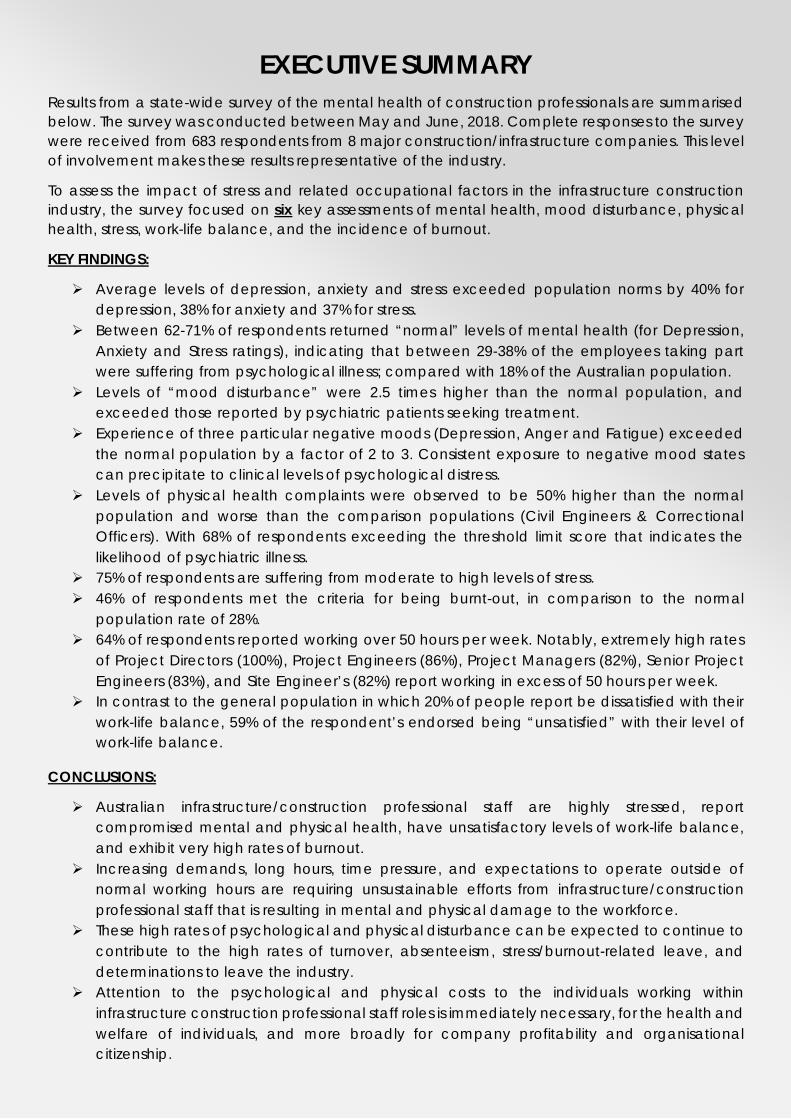
EXECUTIVE SUMMARY Results from a state-wide survey of the mental health of construction professionals are summarised below. The survey was conducted between May and June, 2018. Complete responses to the survey were received from 683 respondents from 8 major construction/infrastructure companies. This level of involvement makes these results representative of the industry.
To assess the impact of stress and related occupational factors in the infrastructure construction industry, the survey focused on six key assessments of mental health, mood disturbance, physical health, stress, work-life balance, and the incidence of burnout.
KEY FINDINGS:
Average levels of depression, anxiety and stress exceeded population norms by 40% for depression, 38% for anxiety and 37% for stress.
Between 62-71% of respondents returned “normal” levels of mental health (for Depression, Anxiety and Stress ratings), indicating that between 29-38% of the employees taking part were suffering from psychological illness; compared with 18% of the Australian population.
Levels of “mood disturbance” were 2.5 times higher than the normal population, and exceeded those reported by psychiatric patients seeking treatment.
Experience of three particular negative moods (Depression, Anger and Fatigue) exceeded the normal population by a factor of 2 to 3. Consistent exposure to negative mood states can precipitate to clinical levels of psychological distress.
Levels of physical health complaints were observed to be 50% higher than the normal population and worse than the comparison populations (Civil Engineers & Correctional Officers). With 68% of respondents exceeding the threshold limit score that indicates the likelihood of psychiatric illness.
75% of respondents are suffering from moderate to high levels of stress. 46% of respondents met the criteria for being burnt-out, in comparison to the normal
population rate of 28%. 64% of respondents reported working over 50 hours per week. Notably, extremely high rates
of Project Directors (100%), Project Engineers (86%), Project Managers (82%), Senior Project Engineers (83%), and Site Engineer’s (82%) report working in excess of 50 hours per week.
In contrast to the general population in which 20% of people report be dissatisfied with their work-life balance, 59% of the respondent’s endorsed being “unsatisfied” with their level of work-life balance.
CONCLUSIONS:
Australian infrastructure/construction professional staff are highly stressed, report compromised mental and physical health, have unsatisfactory levels of work-life balance, and exhibit very high rates of burnout.
Increasing demands, long hours, time pressure, and expectations to operate outside of normal working hours are requiring unsustainable efforts from infrastructure/construction professional staff that is resulting in mental and physical damage to the workforce.
These high rates of psychological and physical disturbance can be expected to continue to contribute to the high rates of turnover, absenteeism, stress/burnout-related leave, and determinations to leave the industry.
Attention to the psychological and physical costs to the individuals working within infrastructure construction professional staff roles is immediately necessary, for the health and welfare of individuals, and more broadly for company profitability and organisational citizenship.

The brief: A group of concerned senior staff employed at several infrastructure construction companies have been meeting to discuss the extent of the workplace stress program amid observed high employee stress, burn-out and other stress related medical and mental health conditions of their colleagues. This group asked A/Prof Downey and Prof Stough to assist in better understanding the problem and in developing some strategies to reduce stress and to be proactive in assisting at-risk staff. It was agreed that such an intervention could be organized I terms of three specific Phases: (Phase 1) the measurement of the problem across the industry. This would be a comprehensive assessment of the degree of stress, mental and physical health, and other workplace variables known to contribute to reduced mental health; (Phase 2) an assessment of how the workplace and workplace processes could be improved to reduce stress and; (Phase 3) the development and implementation of individual worker strategies to reduce stress.
The aim of this first phase of research was to scientifically measure occupational stress in this industry as well as a wide range of variables that are related to occupational stress including mental health, physical health, perceived stress, working hours, and work-life balance. Collection of this data will allow us to benchmark each validated assessment, and to identify mental health issues.
Background to the problem.
Work-Related Stress costs the Australian economy an estimated $14.81 billion every year. Stress has been steadily increasing in the Australian workplace over the past decade and can be observed in terms of increased: (1) Compensation claims; (2) Absenteeism; and (3) Loss of productivity at work (presenteeism); (4) Higher turnover of skilled and potentially irreplaceable staff; health related conditions and perhaps most importantly; (5) Individual and family well-being. Although the financial cost of stress-related claims is enormous, there are other important consequences associated with high levels of stress in the workplace. One of the contributors to these high statistics are that Australians work longer hours than workers in most Western countries, averaging 44-45 hours per week. In a longitudinal study of 8,000 Australian workers in 2008, over one third of workers felt they had no control over how much work they had and when it had to be done. This is particularly relevant now for the Australian infrastructure construction industry with a large number of government-funded projects having short timelines for completion increasing pressure on all involved workers. These mental health issues are particularly prevalent in employees of Australian Engineering/Construction companies who work within large infrastructure projects. The growing incidence of these issues has wide-ranging personal and organisational ramifications, with turnover attributable to mental health issues estimated to be approximately 30%. Understanding the extent to which work stress is leading to problems in this industry is a necessary first step in a proactive strategy to better manage workplace stress and to improve outcomes for individuals, companies working in this industry, the government and ultimately the community who rely on these large infrastructure projects.
The annual economic cost of mental illness is at least £105 billion in England, $317 billion in the US, $51 billion in Canada, and $20 billion in Australia, only a small number of studies in male dominated industries (construction, mining, and utilities) have been conducted worldwide. A recent review of these studies observed that the majority of studies found higher levels of depression among workers in male dominated workforce groups. They concluded that there is a need to address the mental health of workers in male-dominated groups, as the workplace can provide an important but often overlooked setting to develop tailored strategies for vulnerable groups.

To address this clear issue in Australian infrastructure construction industry, we utilised the assessments detailed below to characterise the mental health of employees of the Australian infrastructure construction industry, and compare these to benchmarks of each validated assessment, and to groups at-risk of mental health issues. The lifetime prevalence for depression in Australia is 16.6%, and within the male dominated industries (construction, mining, and utilities) mentioned earlier, these rates have been observed to be upwards of 25%. These studies also highlighted that psychosocial working conditions accounted for much of the variation in rates of depression. This suggests that employees work hours, level of physical activity, income, time pressure, job demands, job security, job discretion, effort-reward imbalance, role conflict, job value, emotional demands, social support, and job status directly impact the increased rates of poorer mental health observed in these industries.
The process.
Following the initial meeting between the team members, the Swinburne members have identified a practical selection of measures that can be used to assess important aspects of mental health within the target population (detailed below). These measures were collated and administered via an online portal provided by an independent company (www.TALY.com.au). Additional to the validated questionnaires of mood, stress and health will be the assessment of key organisational outcomes (e.g., Work-Life Balance and degree of Burnout), which will provide an indication of how the mental health of employees is determining these outcomes.
Methodology
Sample: Each company was requested to identify a senior member of staff within their company to distribute an invite to complete the survey. The first survey was distributed in the first week of May, 2018, and the survey officially closed in the second week of June, 2018. In total, there were eight actively participating companies, with their invites attracting over 1000 sign-ups to TALY website. Almost 700 employees completed the survey (total completed = 683), making this endeavour one of the largest in this industry.

Assessments
1. Depression, Anxiety, Stress Survey (DASS)
The DASS-21 (Lovibond & Lovibond, 1995) is a short-form of the DASS in which each of the three subscales contain seven (rather than 14) items. The DASS-21 has high reliability, has a factor structure that is consistent with the allocation of the items to subscales, and exhibits high convergent validity with other measures of anxiety and depression (Henry & Crawford, 2005). The Depression scale includes items that measure symptoms typically associated with dysphoric mood (e.g., sadness or worthlessness). The Anxiety scale, includes items that are primarily related to symptoms of physical arousal, panic attacks, and fear (e.g., trembling or faintness). Finally, the Stress scale includes items that measure symptoms such as tension, irritability, and a tendency to overreact to stressful events.
2. Profile of Mood States (POMS)
Important pre-cursors to clinically diagnosed levels of mental illness are alterations in one’s prevailing mood. Alterations in levels of anxiety, depression, and anger are commonly observed in stressed workers, and represent important indices of mental health. The POMS (McNair, Lorr & Droppleman, 1971) is a self-report questionnaire designed to measure six dimensions of mood: tension-anxiety; depression-dejection; anger-hostility; vigour-activity; fatigue-inertia; and confusion-bewilderment. The POMS consists of 65 adjectives describing feeling and mood which is answered on a five-point Likert-type scale ranging from ‘not at all’ to ‘extremely’.
3. Perceived Stress Scale
How people experience stress differs across industries and within people who work in the same environment. What is important is how they perceive the level of stress they are experiencing. The Perceived Stress scale is a subjective measure of stress and assesses the degree to which life events are perceived as stressful. This questionnaire has 10 items and participants are asked to score on a scale of 0-5 how often they have felt a particular way over the past month, ranging from 0 (never), to 5 (very often). Higher scores indicating a greater degree of perceived stress and lower scores indicating effective coping (Cohen, Kamarck & Mermelstein, 1983).
4. General Health Questionnaire (GHQ)
Stress can also manifest through physical symptoms, and affect one’s general levels of health. The GHQ comprises 12 items and assesses changes in the ability to carry out normal daily functions, or the appearance of new symptoms including somatic symptoms and insomnia, or feelings that may indicate psychological disorder such as anxious or depressed feelings.
5. Work-Life Balance
A single item was used to assess the respondent’s satisfaction with their work-life balance: How successful do you feel in balancing your paid work and family life? Responses on this item ranged from 1) Not at all satisfied, to 5) Very Satisfied.
6. Burnout
Burnout among physicians was measured using a two-item version of the Maslach Burnout Inventory (MBI), a validated questionnaire considered the criterion standard tool for measuring burnout. Consistent with convention, we considered a high score on the depersonalization and/or emotional exhaustion subscales of the MBI as having at least 1 manifestation of professional burnout per week or greater (Shanafelt, et al., 2015).

7. Demographics
Details concerning the age, gender, company, and ratings of job security, company support, job demands, job status, and job rewards were also collected.
Comparison Groups
To aid in interpretation of the results for each of the scales or measurements, comparison group scores were sourced from published materials. Every effort has been made to source comparable groups to the current sample, and to further compare the results from the current sample to established normative values from the assessment’s authors.
Given the novelty of the undertaking detailed in this report, no previous study has been conducted utilising all the measures administered in a directly comparable sample. As such, the comparison data comes from variable sources, with every effort being made to make the groups as logically comparable as possible. The nature of each sample is detailed below.
1. DASS Comparison
The DASS manual provides data that can be used to benchmark scores against the “average” scores for people in the normal population (termed “Normative Data” in the tables) and range scores that are divided into; Normal, Mild, Moderate, Severe and Extremely Severe, which can be used to identify individuals (or a percentage of the group) that fit these criteria. The data for the averages for the “Normative data” comes from (Crawford et al, 2011) an Australian sample of healthy people (N = 497, average age, 41.14 years, with 11.13 years of education). Further comparison groups of Construction Workers (Sunindijo & Kamardeen, 2017: Australian construction industry professionals; N = 277 participants, 60.3% male) and Office workers (Thorsteinsson et al, 2014) from a wide range of office based organisations (N = 201, average age, 35.29, 58% hold a University qualification) were sourced from peer-reviewed publications for additional comparisons.
It was only possible to compare the range scores to the reference sample (Crawford et al, 2011) and a sample of Australian Truck Drivers (Hilton et al, 2009) who completed the same measures and had their data (1324 drivers; only 23 females; average working hours 62 per week) presented in the full range of score descriptors. The “Construction Workers” comparison came from the same sample detailed above (Sunindijo & Kamardeen, 2017), but was limited to comparisons with the combined categories presented in the published paper (Severe and Extremely Severe criterion, and the Mild and Moderate criterion being combined).
2. POMS Comparison
The POMS scores generated were compared to normative data from healthy individuals and those seeking psychiatric help (POMS manual: McNair, Droppleman, and Lorr (1971), and a sample of medical doctors working the same average hours as the current sample (Krasner et al., 2009). In the manual, the psychiatric patient data (average age = 26) comes form 1000 psychiatric outpatients (seeking psychiatric help). About 70% of these people had diagnoses that would be classified as anxiety disorders, non-major depressions or as a personality disorder. Prior psychiatric treatment had been received by 46% of the group. The healthy normal adult sample data comes from 400 adults with no history of mental illness (average age = 44, average years of education = 14.3 years).
A further comparison sample (Medical Doctors) was sourced, as they represent a highly demanding profession, with a resulting high degree of stress and burnout (Krasner et al., 2009). Data for this comparison comes from 70 primary care physicians (54% male) from a high proportion (96%) of urban/suburban practises in the USA.
3. PSS Comparison
The PSS manual provides data that can be used to benchmark “average” scores and ranges for low, moderate and high levels of stress. As such, this report makes comparisons to the normative data (PSS manual: Cohen, 1983) and additionally, to two sets of USA worker (Cohen & Janicki-Deverts, 2012) samples. The normative sample comes from 2387 USA residents, who were free of any psychological/psychiatric issues (926 males). The USA worker data is sourced from a nationally representative sample (N = 2000; 968 males), and divided into Employees earning over $75,000 USD and Employees earning under $25,000, as perceived stress is nominally linked to earning categories. With higher earning workers generally perceiving their lives to be less stressful than lower earning workers.
4. GHQ Comparison
The GHQ manual scores being able to be compared to previous published normative data (from the test makers manual), and additionally the assessment has been used in comparable populations such as Male Civil Engineers (Francis, 2004), and Correctional Officers (Dollard et al., 1995).
5. Work-life balance & Burnout Comparison
Medical Physician’s (N = 5313, 62.2% male) and a USA population (N = 5932, 54.4% male) sample were sourced from a study concerning the prevalence of burnout and work-life balance in physicians and professional workers (e.g., Business/financial, management, computer/mathematical, architecture/engineering, lawyer/judge, life/physical/social sciences, community/ social services, teacher non-university, and teacher college/university (Shanafelt, et al., 2015).

RESULTS
The Sample
The number of completed surveys totalled 683. Making this survey one of the largest successfully completed mental health initiatives attempted in this industry. Table 1 summarises the number of respondents, divided into their nominated roles.
TABLE 1: Respondent Demographics
Role Number of Respondents
Commercial Management 52
Design Management 47
Graduate Engineer 37
Project Director 15
Project Engineer 89
Project Manager 84
Project Support Services 157
Safety, Quality or Environment Management 84
Senior Project Engineer 60
Site Engineer 56
With regard to the gender division of respondent’s, 190 females and 493 males completed the survey. This gender imbalance is broadly consistent with the nature of the industry.
To assess pertinent psychosocial aspects of employment, nine questions concerning the respondents feelings about the nature of their job were presented, asking how (ranging from Strongly Disagree – Strongly Agree) they felt about the demands, pressure, status and compensation related to their positions. Table 2 summarise the percentage (%) endorsement of the ratings with regard to each of the nine questions.
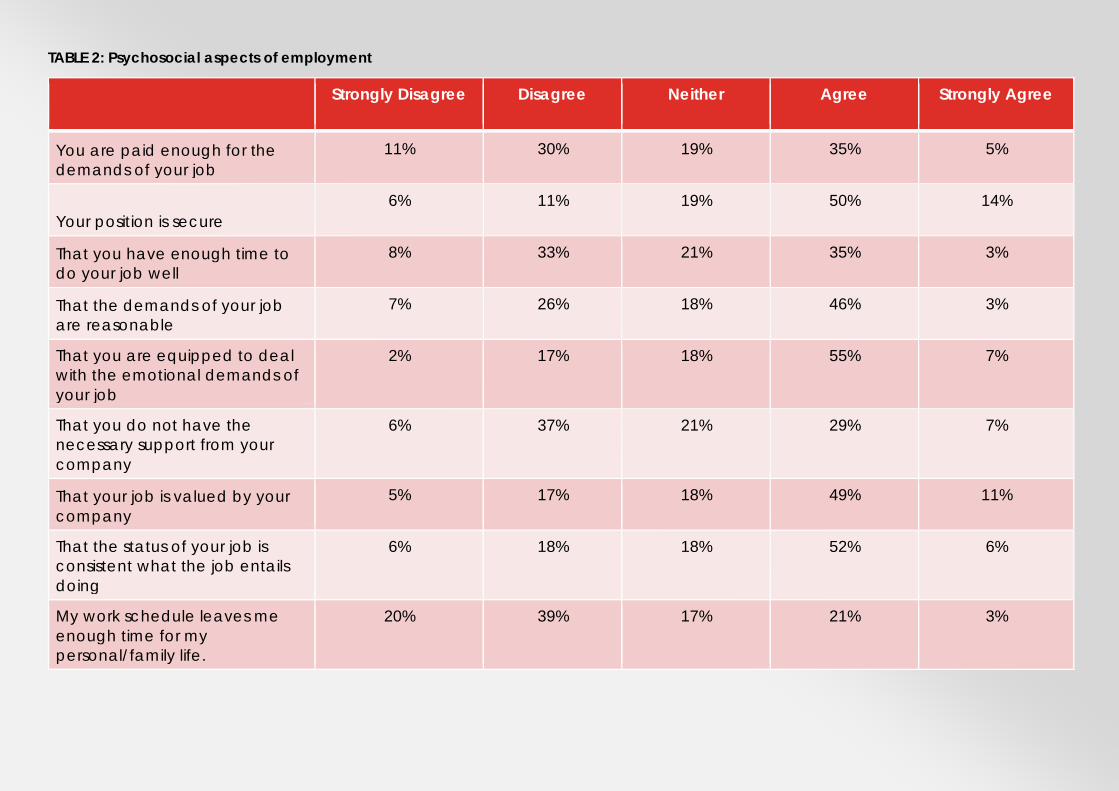
TABLE 2: Psychosocial aspects of employment
Strongly Disagree Disagree Neither Agree Strongly Agree
You are paid enough for the demands of your job
11% 30% 19% 35% 5%
Your position is secure 6% 11% 19% 50% 14%
That you have enough time to do your job well
8% 33% 21% 35% 3%
That the demands of your job are reasonable
7% 26% 18% 46% 3%
That you are equipped to deal with the emotional demands of your job
2% 17% 18% 55% 7%
That you do not have the necessary support from your company
6% 37% 21% 29% 7%
That your job is valued by your company
5% 17% 18% 49% 11%
That the status of your job is consistent what the job entails doing
6% 18% 18% 52% 6%
My work schedule leaves me enough time for my personal/family life.
20% 39% 17% 21% 3%
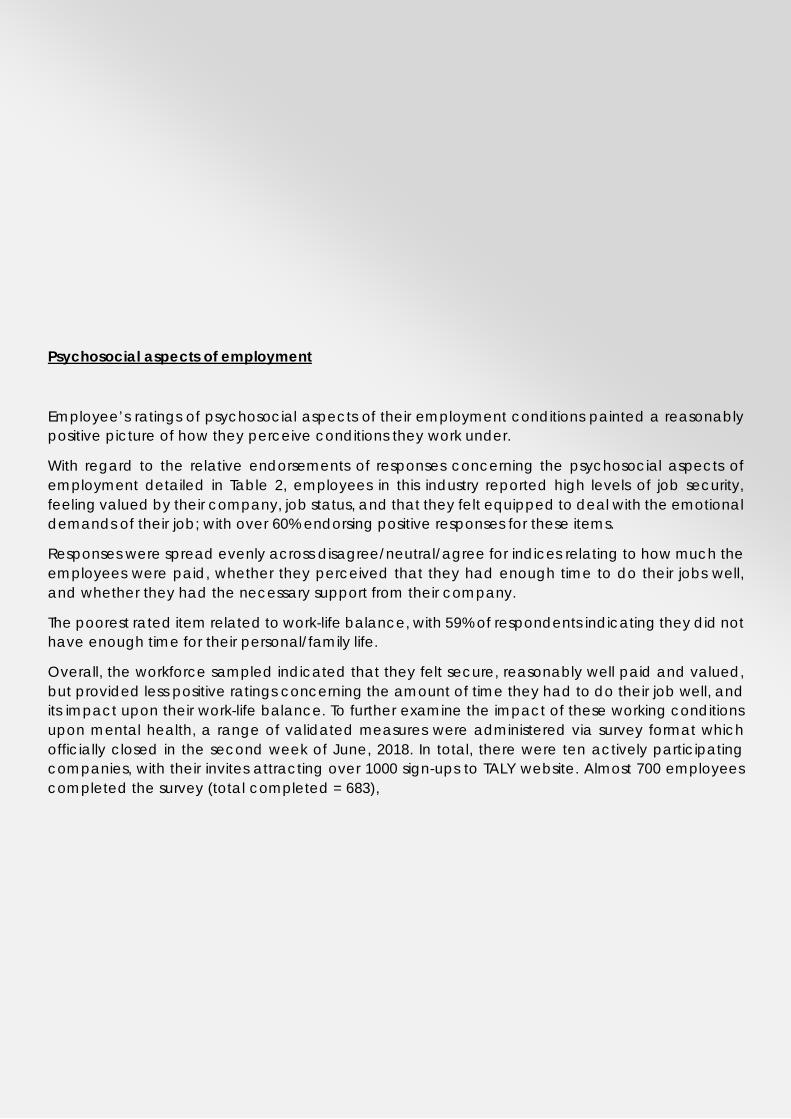
Psychosocial aspects of employment
Employee’s ratings of psychosocial aspects of their employment conditions painted a reasonably positive picture of how they perceive conditions they work under.
With regard to the relative endorsements of responses concerning the psychosocial aspects of employment detailed in Table 2, employees in this industry reported high levels of job security, feeling valued by their company, job status, and that they felt equipped to deal with the emotional demands of their job; with over 60% endorsing positive responses for these items.
Responses were spread evenly across disagree/neutral/agree for indices relating to how much the employees were paid, whether they perceived that they had enough time to do their jobs well, and whether they had the necessary support from their company.
The poorest rated item related to work-life balance, with 59% of respondents indicating they did not have enough time for their personal/family life.
Overall, the workforce sampled indicated that they felt secure, reasonably well paid and valued, but provided less positive ratings concerning the amount of time they had to do their job well, and its impact upon their work-life balance. To further examine the impact of these working conditions upon mental health, a range of validated measures were administered via survey format which officially closed in the second week of June, 2018. In total, there were ten actively participating companies, with their invites attracting over 1000 sign-ups to TALY website. Almost 700 employees completed the survey (total completed = 683),
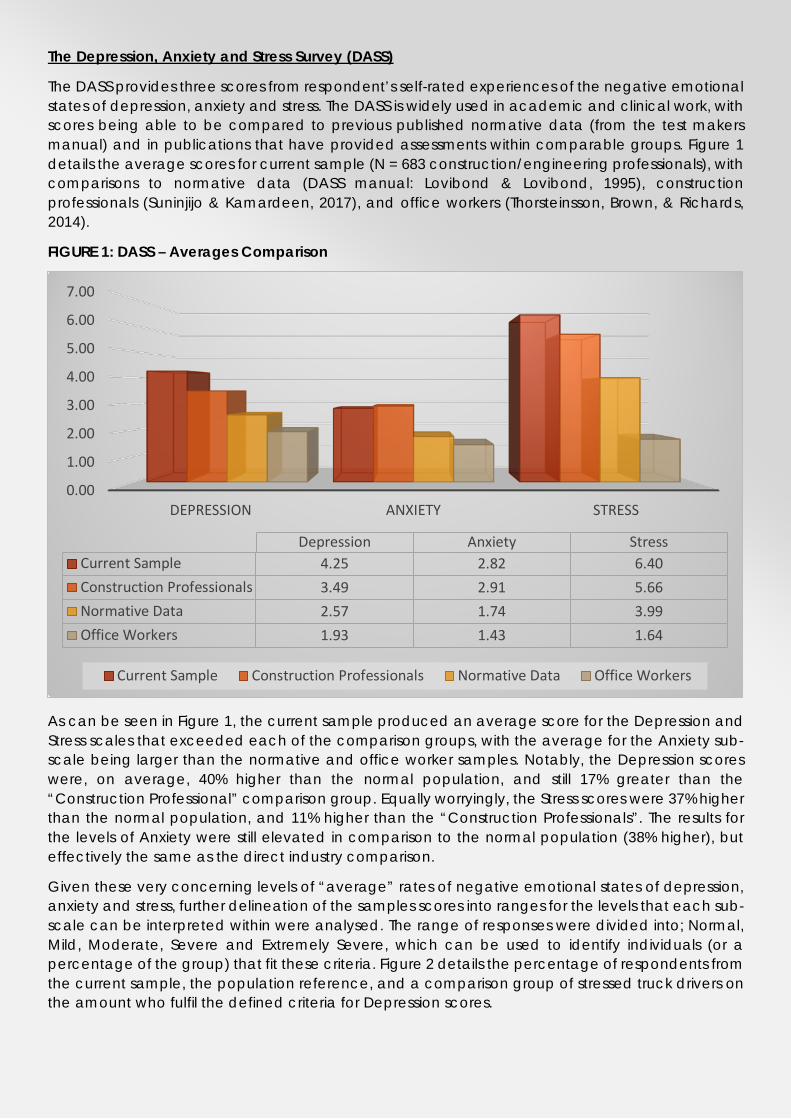
The Depression, Anxiety and Stress Survey (DASS)
The DASS provides three scores from respondent’s self-rated experiences of the negative emotional states of depression, anxiety and stress. The DASS is widely used in academic and clinical work, with scores being able to be compared to previous published normative data (from the test makers manual) and in publications that have provided assessments within comparable groups. Figure 1 details the average scores for current sample (N = 683 construction/engineering professionals), with comparisons to normative data (DASS manual: Lovibond & Lovibond, 1995), construction professionals (Suninjijo & Kamardeen, 2017), and office workers (Thorsteinsson, Brown, & Richards, 2014).
FIGURE 1: DASS – Averages Comparison
As can be seen in Figure 1, the current sample produced an average score for the Depression and Stress scales that exceeded each of the comparison groups, with the average for the Anxiety sub-scale being larger than the normative and office worker samples. Notably, the Depression scores were, on average, 40% higher than the normal population, and still 17% greater than the “Construction Professional” comparison group. Equally worryingly, the Stress scores were 37% higher than the normal population, and 11% higher than the “Construction Professionals”. The results for the levels of Anxiety were still elevated in comparison to the normal population (38% higher), but effectively the same as the direct industry comparison.
Given these very concerning levels of “average” rates of negative emotional states of depression, anxiety and stress, further delineation of the samples scores into ranges for the levels that each sub-scale can be interpreted within were analysed. The range of responses were divided into; Normal, Mild, Moderate, Severe and Extremely Severe, which can be used to identify individuals (or a percentage of the group) that fit these criteria. Figure 2 details the percentage of respondents from the current sample, the population reference, and a comparison group of stressed truck drivers on the amount who fulfil the defined criteria for Depression scores.
0.00
1.00
2.00
3.00
4.00
5.00
6.00
7.00
DEPRESSION ANXIETY STRESS
Depression Anxiety StressCurrent Sample 4.25 2.82 6.40Construction Professionals 3.49 2.91 5.66Normative Data 2.57 1.74 3.99Office Workers 1.93 1.43 1.64
Current Sample Construction Professionals Normative Data Office Workers
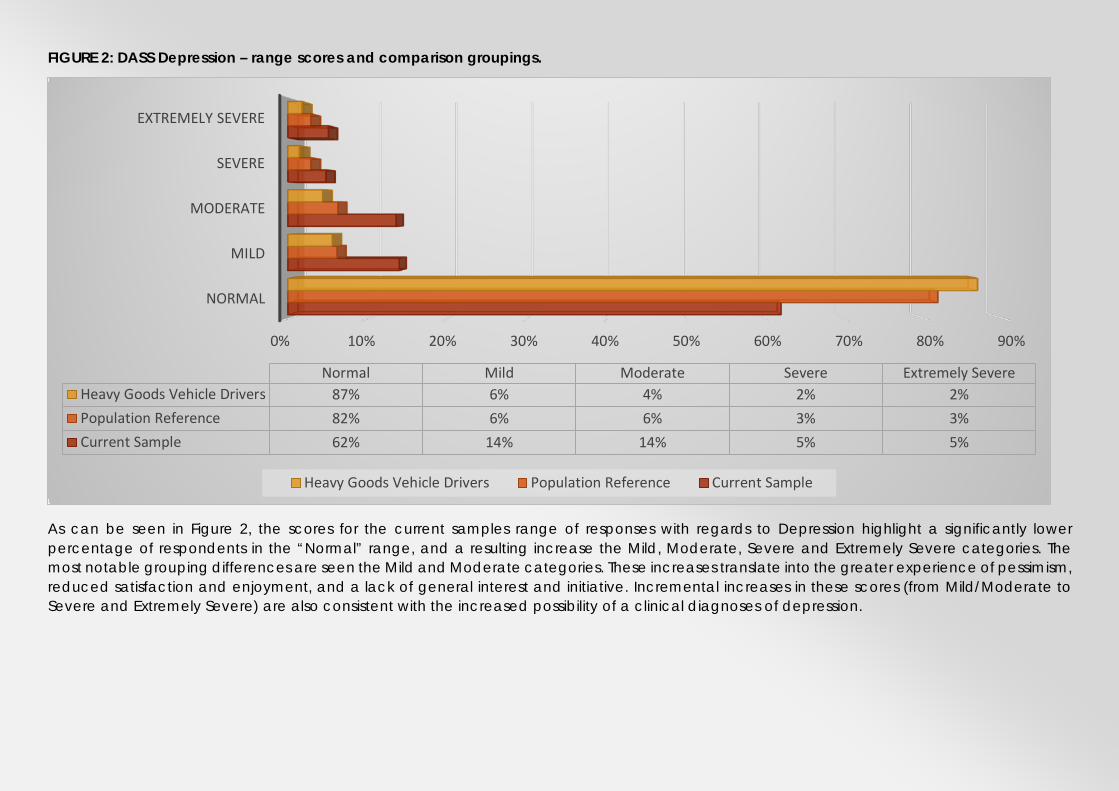
FIGURE 2: DASS Depression – range scores and comparison groupings.
As can be seen in Figure 2, the scores for the current samples range of responses with regards to Depression highlight a significantly lower percentage of respondents in the “Normal” range, and a resulting increase the Mild, Moderate, Severe and Extremely Severe categories. The most notable grouping differences are seen the Mild and Moderate categories. These increases translate into the greater experience of pessimism, reduced satisfaction and enjoyment, and a lack of general interest and initiative. Incremental increases in these scores (from Mild/Moderate to Severe and Extremely Severe) are also consistent with the increased possibility of a clinical diagnoses of depression.
0% 10% 20% 30% 40% 50% 60% 70% 80% 90%
NORMAL
MILD
MODERATE
SEVERE
EXTREMELY SEVERE
Normal Mild Moderate Severe Extremely SevereHeavy Goods Vehicle Drivers 87% 6% 4% 2% 2%Population Reference 82% 6% 6% 3% 3%Current Sample 62% 14% 14% 5% 5%
Heavy Goods Vehicle Drivers Population Reference Current Sample

FIGURE 3: DASS Anxiety– range scores and comparison groupings.
As can be seen in Figure 3, the scores for the current samples range of responses with regards to Anxiety highlight a significantly lower percentage of respondents in the “Normal” range, and a resulting increase in the other categories. The most notable grouping differences are seen in the Mild and Severe categories, but of most concern is the higher rate of “Extremely Severe” scores. These increases translate into the greater experience apprehension, panic, worry about control and increased awareness of the physical symptoms of anxiousness (e.g., tremors or heart palpitations). Incremental increases in these scores are also consistent with the increased possibility of a clinical diagnoses of Anxiety.
0% 10% 20% 30% 40% 50% 60% 70% 80% 90% 100%
NORMAL
MILD
MODERATE
SEVERE
EXTREMELY SEVERE
Normal Mild Moderate Severe Extremely SevereHeavy Goods Vehicle Drivers 92% 2% 4% 1% 1%Population Reference 89% 2% 4% 2% 3%Current Sample 71% 12% 6% 5% 6%
Heavy Goods Vehicle Drivers Population Reference Current Sample
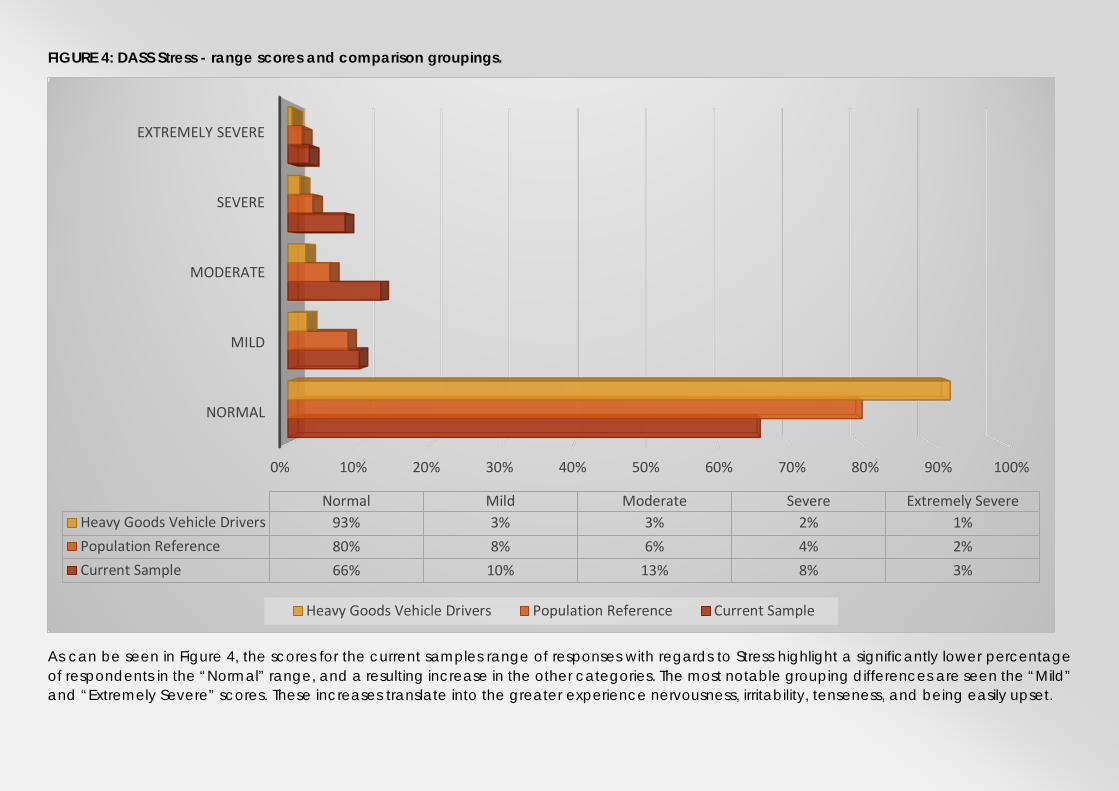
FIGURE 4: DASS Stress - range scores and comparison groupings.
As can be seen in Figure 4, the scores for the current samples range of responses with regards to Stress highlight a significantly lower percentage of respondents in the “Normal” range, and a resulting increase in the other categories. The most notable grouping differences are seen the “Mild” and “Extremely Severe” scores. These increases translate into the greater experience nervousness, irritability, tenseness, and being easily upset.
0% 10% 20% 30% 40% 50% 60% 70% 80% 90% 100%
NORMAL
MILD
MODERATE
SEVERE
EXTREMELY SEVERE
Normal Mild Moderate Severe Extremely SevereHeavy Goods Vehicle Drivers 93% 3% 3% 2% 1%Population Reference 80% 8% 6% 4% 2%Current Sample 66% 10% 13% 8% 3%
Heavy Goods Vehicle Drivers Population Reference Current Sample
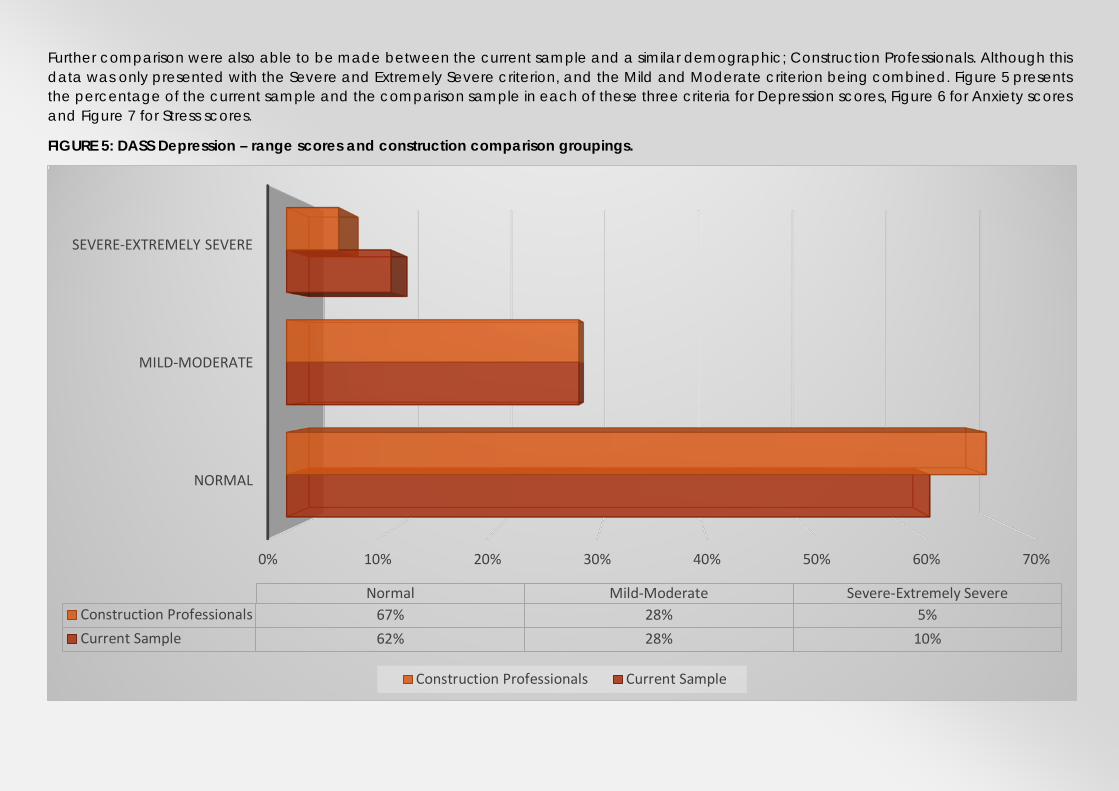
Further comparison were also able to be made between the current sample and a similar demographic; Construction Professionals. Although this data was only presented with the Severe and Extremely Severe criterion, and the Mild and Moderate criterion being combined. Figure 5 presents the percentage of the current sample and the comparison sample in each of these three criteria for Depression scores, Figure 6 for Anxiety scores and Figure 7 for Stress scores.
FIGURE 5: DASS Depression – range scores and construction comparison groupings.
0% 10% 20% 30% 40% 50% 60% 70%
NORMAL
MILD-MODERATE
SEVERE-EXTREMELY SEVERE
Normal Mild-Moderate Severe-Extremely SevereConstruction Professionals 67% 28% 5%Current Sample 62% 28% 10%
Construction Professionals Current Sample
With regard to the direct comparison between the current sample and that of the “Construction Professionals” who occupy the same role types as the sample, there was a degree of consistency, within the lesser amounts of respondents being “normal” and elevated amounts of respondents being classified as “Mild-Moderate” and “Severe-Extremely Severe”. Highlighting a clear “industry specific problem that has generated compromised mental health in these independent groups.
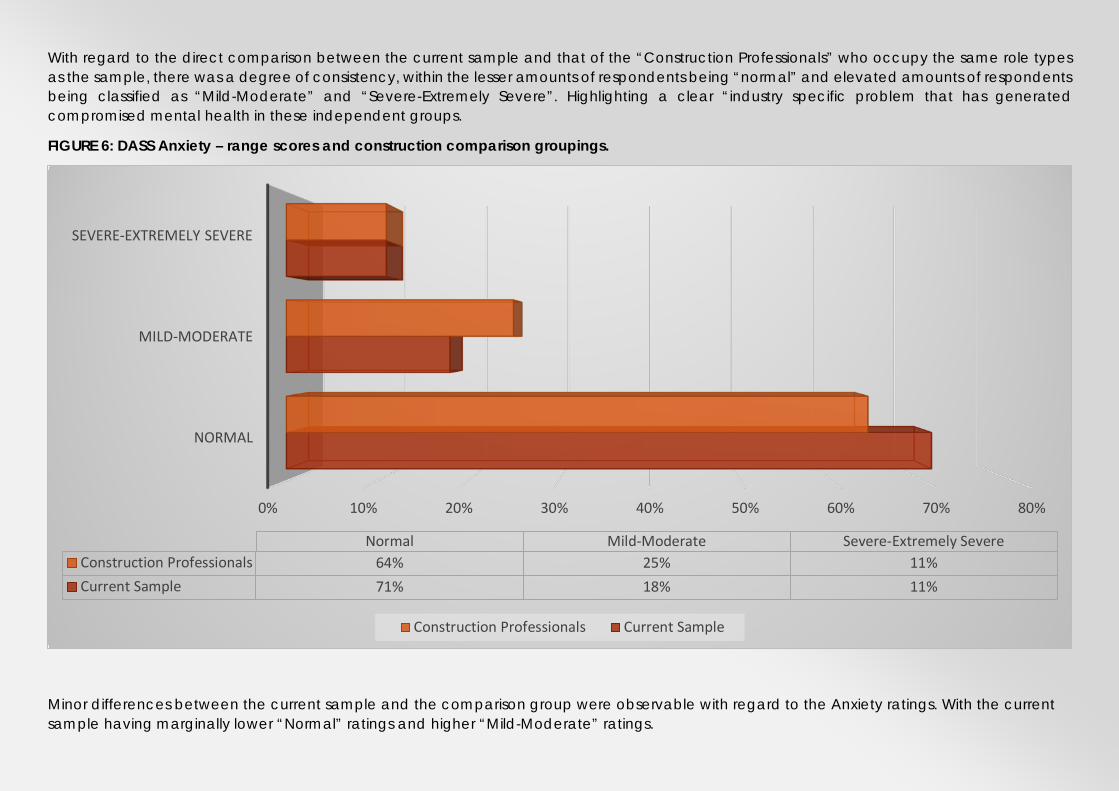
FIGURE 6: DASS Anxiety – range scores and construction comparison groupings.
Minor differences between the current sample and the comparison group were observable with regard to the Anxiety ratings. With the current sample having marginally lower “Normal” ratings and higher “Mild-Moderate” ratings.
0% 10% 20% 30% 40% 50% 60% 70% 80%
NORMAL
MILD-MODERATE
SEVERE-EXTREMELY SEVERE
Normal Mild-Moderate Severe-Extremely SevereConstruction Professionals 64% 25% 11%Current Sample 71% 18% 11%
Construction Professionals Current Sample
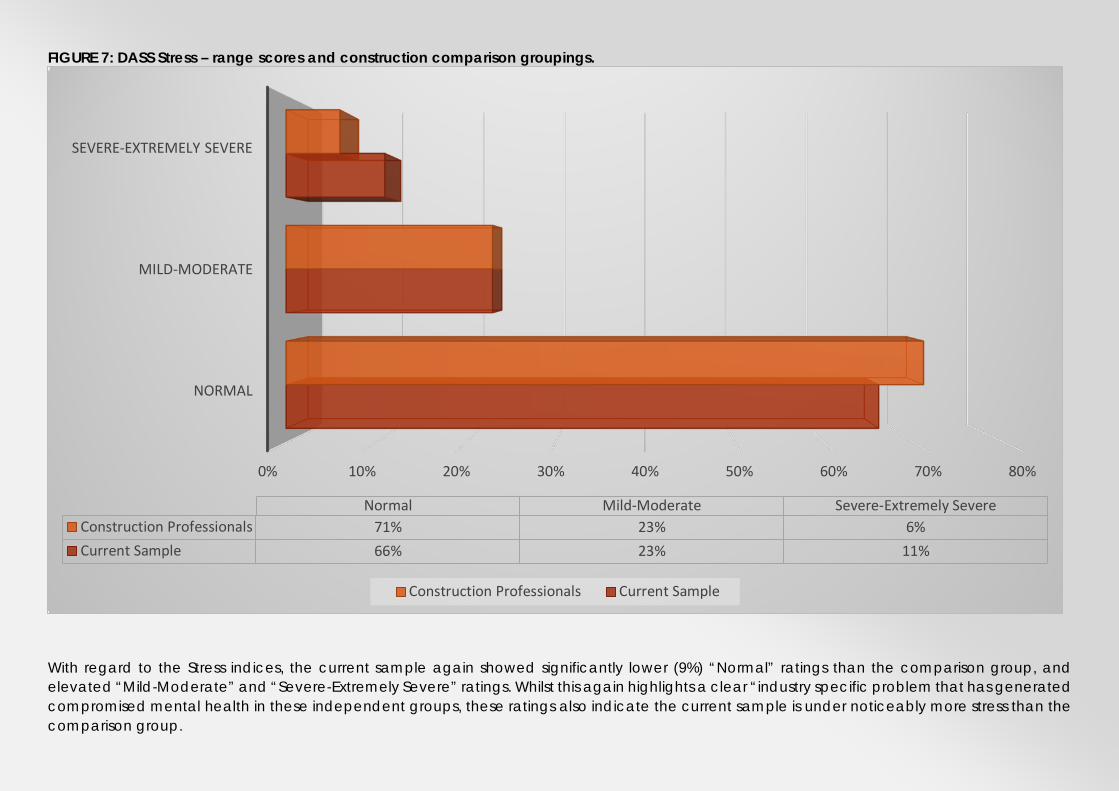
FIGURE 7: DASS Stress – range scores and construction comparison groupings.
With regard to the Stress indices, the current sample again showed significantly lower (9%) “Normal” ratings than the comparison group, and elevated “Mild-Moderate” and “Severe-Extremely Severe” ratings. Whilst this again highlights a clear “industry specific problem that has generated compromised mental health in these independent groups, these ratings also indicate the current sample is under noticeably more stress than the comparison group.
0% 10% 20% 30% 40% 50% 60% 70% 80%
NORMAL
MILD-MODERATE
SEVERE-EXTREMELY SEVERE
Normal Mild-Moderate Severe-Extremely SevereConstruction Professionals 71% 23% 6%Current Sample 66% 23% 11%
Construction Professionals Current Sample
The Profile of Mood States (POMS) Results
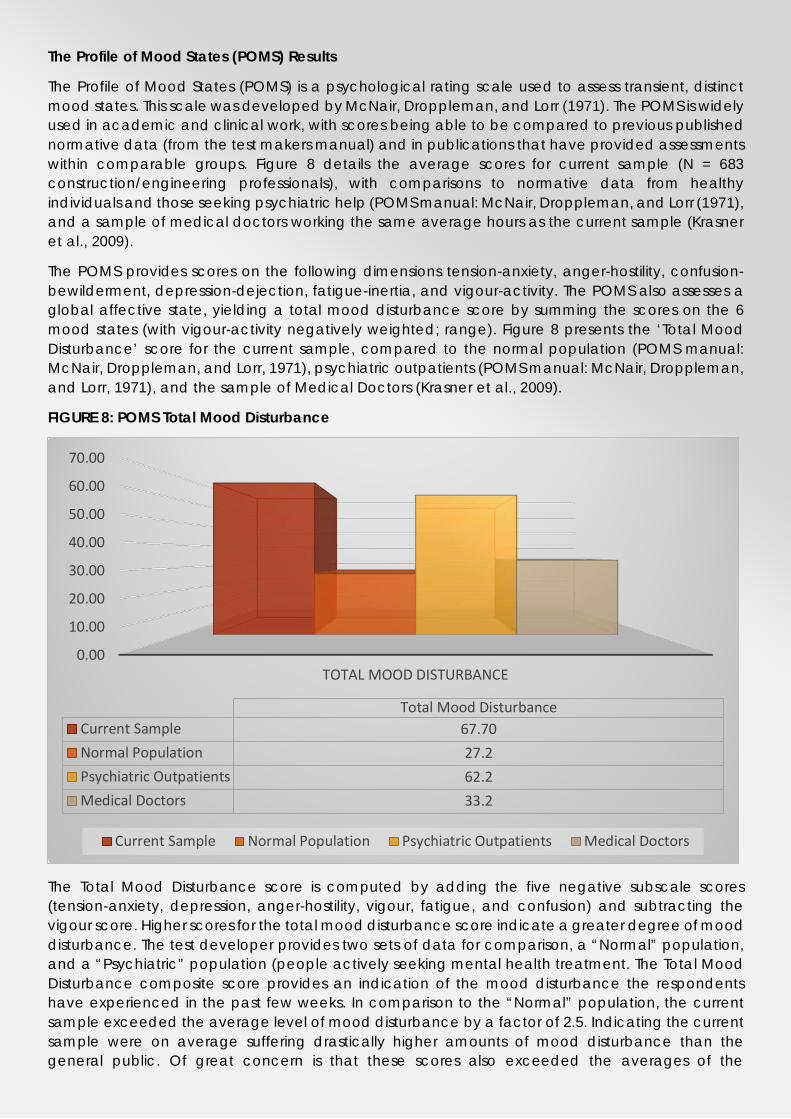
The Profile of Mood States (POMS) is a psychological rating scale used to assess transient, distinct mood states. This scale was developed by McNair, Droppleman, and Lorr (1971). The POMS is widely used in academic and clinical work, with scores being able to be compared to previous published normative data (from the test makers manual) and in publications that have provided assessments within comparable groups. Figure 8 details the average scores for current sample (N = 683 construction/engineering professionals), with comparisons to normative data from healthy individuals and those seeking psychiatric help (POMS manual: McNair, Droppleman, and Lorr (1971), and a sample of medical doctors working the same average hours as the current sample (Krasner et al., 2009).
The POMS provides scores on the following dimensions tension-anxiety, anger-hostility, confusion-bewilderment, depression-dejection, fatigue-inertia, and vigour-activity. The POMS also assesses a global affective state, yielding a total mood disturbance score by summing the scores on the 6 mood states (with vigour-activity negatively weighted; range). Figure 8 presents the ‘Total Mood Disturbance’ score for the current sample, compared to the normal population (POMS manual: McNair, Droppleman, and Lorr, 1971), psychiatric outpatients (POMS manual: McNair, Droppleman, and Lorr, 1971), and the sample of Medical Doctors (Krasner et al., 2009).
FIGURE 8: POMS Total Mood Disturbance
The Total Mood Disturbance score is computed by adding the five negative subscale scores (tension-anxiety, depression, anger-hostility, vigour, fatigue, and confusion) and subtracting the vigour score. Higher scores for the total mood disturbance score indicate a greater degree of mood disturbance. The test developer provides two sets of data for comparison, a “Normal” population, and a “Psychiatric” population (people actively seeking mental health treatment. The Total Mood Disturbance composite score provides an indication of the mood disturbance the respondents have experienced in the past few weeks. In comparison to the “Normal” population, the current sample exceeded the average level of mood disturbance by a factor of 2.5. Indicating the current sample were on average suffering drastically higher amounts of mood disturbance than the general public. Of great concern is that these scores also exceeded the averages of the
0.00
10.00
20.00
30.00
40.00
50.00
60.00
70.00
TOTAL MOOD DISTURBANCE
Total Mood DisturbanceCurrent Sample 67.70Normal Population 27.2Psychiatric Outpatients 62.2Medical Doctors 33.2
Current Sample Normal Population Psychiatric Outpatients Medical Doctors

“Psychiatric” sample, who were actively seeking treatment for mental health issues. Suggesting these levels of disturbance, on average, reflect clinically concerning levels of disturbance. The current sample’s average scores were over double that of the medical professional’s sampled. These Doctors also reported that with higher levels of mood disturbance is accompanied by increased levels of burnout. This suggests, that an increased experience of negative moods (greater Total Mood Disturbance) produces an “additive” effect upon people, and these repeated disturbances can develop into more concerning outcomes (e.g., clinical depression or anxiety and burnout).
The POMS also provides sub-scale scores for a range of mood groups. These scores can be used to identify specific mood disruptions that may be need to be paid attention to in the workplace or be amenable to treatment and education.
FIGURE 9: POMS SUB-SCALES (Depression, Anger & Fatigue)
The pattern of data for these three mood outcomes (Depression, Anger and Fatigue) are very similar. With the current sample providing higher ratings for the incidence of depressive moods, anger, and feelings of fatigue that exceed the normal population by a factor of 2 to 3. They also again report higher levels than the psychiatric patients and medical doctors.
0.00
5.00
10.00
15.00
20.00
25.00
DEPRESSION-DEJECTION
ANGER-HOSTILITY FATIGUE-INERTIA
Depression-Dejection Anger-Hostility Fatigue-InertiaCurrent Sample 22.17 19.28 13.47Normal Population 8.3 9.2 7Psychiatric Outpatients 19.9 16.2 12.3Medical Doctors 9.1 6.6 8.4
Current Sample Normal Population Psychiatric Outpatients Medical Doctors

FIGURE 10: POMS SUB-SCALES (Anxiety, Vigour & Confusion)
The three remaining sub-scales of the POMS detail a somewhat more promising profile, although all scale scores were still observed to be less favourable in the direct comparison with the “Normal” population. The level of Tension-Anxiety for the current sample was 25% higher than the normal population, but below the level of the psychiatric patients and approximately equal to the medical doctor population. This is, however, a highly elevated level of reporting of feeling nervous, restless and not feeling relaxed for this type of sample. Interestingly, the level of “Vigour” reported by the current sample was below all the comparison populations; meaning this group felt less active, alert, energetic and lively than the comparison groups. The final sub-scale, Confusion-Bewilderment, again demonstrated elevated levels of the experience of feeling confused, forgetful and uncertain about things for an otherwise healthy group of workers.
Taken together, these mood findings highlight notably elevated levels of the experience of negative mood states that on average, are exceeding levels that accompany clinical levels of psychological distress, and those that are highly related to increased rates of burnout.
0.002.004.006.008.00
10.0012.0014.0016.0018.00
Tension-Anxiety Vigour-Activity Confusion-Bewilderment
Current Sample 15.19 12.95 10.58Normal Population 12.3 16.3 6.7Psychiatric Outpatients 16.2 13.9 11.5Medical Doctors 15.1 14.6 8.7
Current Sample Normal Population Psychiatric Outpatients Medical Doctors

Perceived Stress: Results
The perceived stress scale measures individual’s perceptions of their experience of stress. Higher scores indicate a greater degree of perceived stress and lower scores indicate the more effective coping with “stressful” events. As such, the Perceived Stress scale (PSS) is a subjective measure of stress and assesses the degree to which life events are perceived as stressful. The PSS is widely used internationally, with scores being able to be compared to previous published normative data (from the test makers manual) and in publications that have provided assessments within comparable groups. Figure 11 details the average scores for current sample (N = 683 construction/engineering professionals), with comparisons to normative data (PSS manual: Cohen, 1983) and two sets of USA workers (Cohen & Janicki-Deverts, 2012).
Figure 11: Perceived Stress: average scores and comparison groups.
As can be seen in Figure 11, the levels of perceived stress in the current sample exceed all of the comparison groups. It is worth noting that the “Normal Population” average is exceeded by 50%. Given these very concerning rates of “average” rates of perceived stress, further delineation of the current samples scores into ranges that the scores can be interpreted within were analysed. The range of responses were divided into; Low Stress, Moderate Stress and High Stress, which can be used to identify individuals (or a percentage of the group) that fit these criteria. Figure 12 details the percentage of respondents from the current sample.
0.00
2.00
4.00
6.00
8.00
10.00
12.00
14.00
16.00
18.00
Perceived StressCurrent Sample 18.00Normal Population 12.00Employees Earning > $75000USD 14.74Employees Earning < $25000USD 17.77
Current Sample Normal Population
Employees Earning > $75000USD Employees Earning < $25000USD
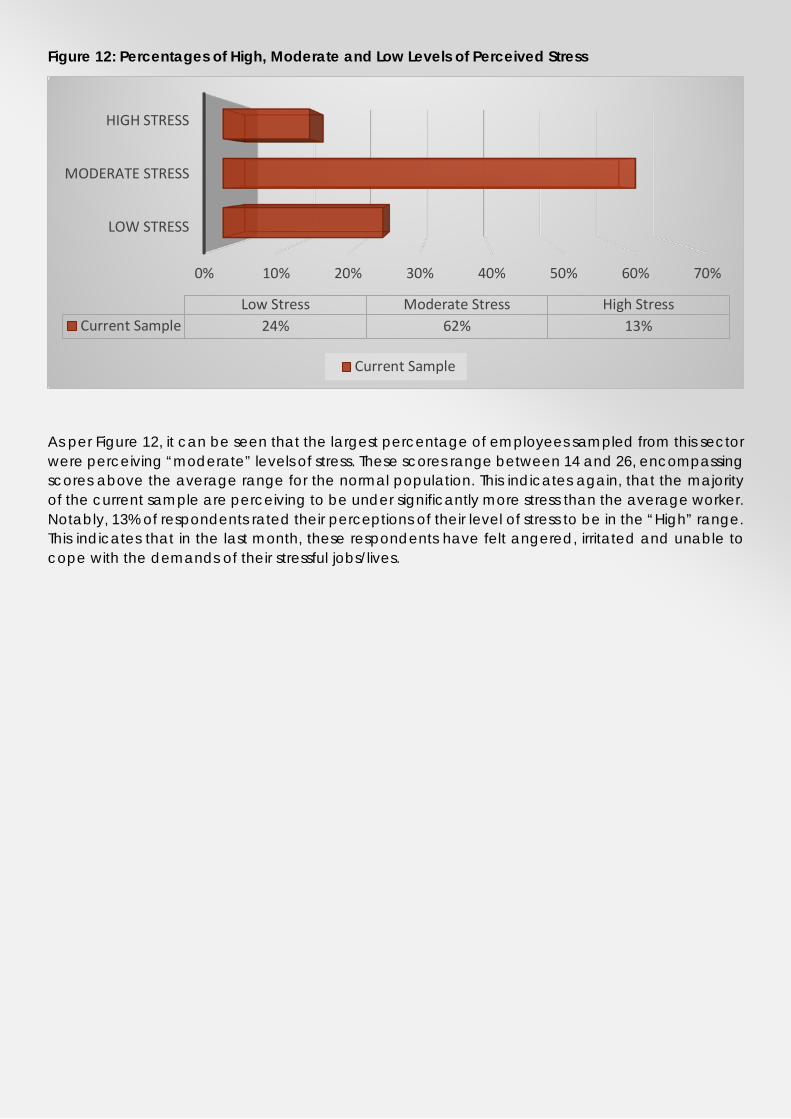
Figure 12: Percentages of High, Moderate and Low Levels of Perceived Stress
As per Figure 12, it can be seen that the largest percentage of employees sampled from this sector were perceiving “moderate” levels of stress. These scores range between 14 and 26, encompassing scores above the average range for the normal population. This indicates again, that the majority of the current sample are perceiving to be under significantly more stress than the average worker. Notably, 13% of respondents rated their perceptions of their level of stress to be in the “High” range. This indicates that in the last month, these respondents have felt angered, irritated and unable to cope with the demands of their stressful jobs/lives.
0% 10% 20% 30% 40% 50% 60% 70%
LOW STRESS
MODERATE STRESS
HIGH STRESS
Low Stress Moderate Stress High StressCurrent Sample 24% 62% 13%
Current Sample
Physical Health: Results
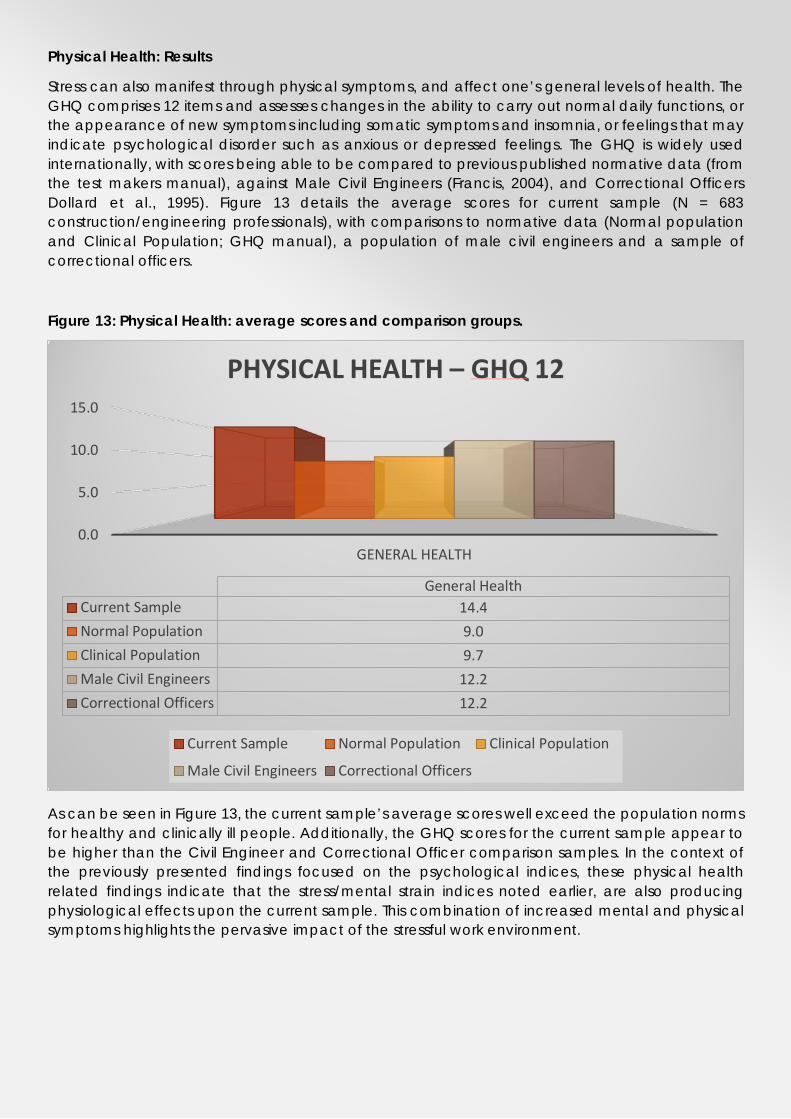
Stress can also manifest through physical symptoms, and affect one’s general levels of health. The GHQ comprises 12 items and assesses changes in the ability to carry out normal daily functions, or the appearance of new symptoms including somatic symptoms and insomnia, or feelings that may indicate psychological disorder such as anxious or depressed feelings. The GHQ is widely used internationally, with scores being able to be compared to previous published normative data (from the test makers manual), against Male Civil Engineers (Francis, 2004), and Correctional Officers Dollard et al., 1995). Figure 13 details the average scores for current sample (N = 683 construction/engineering professionals), with comparisons to normative data (Normal population and Clinical Population; GHQ manual), a population of male civil engineers and a sample of correctional officers.
Figure 13: Physical Health: average scores and comparison groups.
As can be seen in Figure 13, the current sample’s average scores well exceed the population norms for healthy and clinically ill people. Additionally, the GHQ scores for the current sample appear to be higher than the Civil Engineer and Correctional Officer comparison samples. In the context of the previously presented findings focused on the psychological indices, these physical health related findings indicate that the stress/mental strain indices noted earlier, are also producing physiological effects upon the current sample. This combination of increased mental and physical symptoms highlights the pervasive impact of the stressful work environment.
0.0
5.0
10.0
15.0
GENERAL HEALTH
General HealthCurrent Sample 14.4Normal Population 9.0Clinical Population 9.7Male Civil Engineers 12.2Correctional Officers 12.2
PHYSICAL HEALTH – GHQ 12
Current Sample Normal Population Clinical Population
Male Civil Engineers Correctional Officers
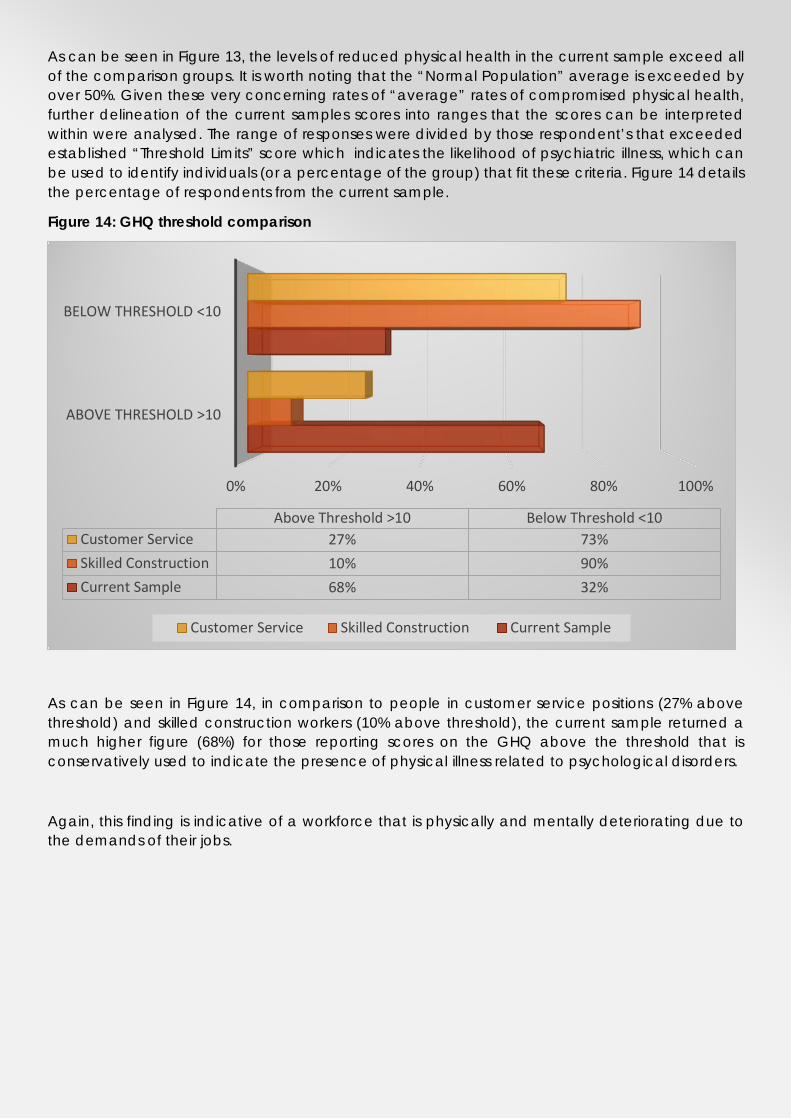
As can be seen in Figure 13, the levels of reduced physical health in the current sample exceed all of the comparison groups. It is worth noting that the “Normal Population” average is exceeded by over 50%. Given these very concerning rates of “average” rates of compromised physical health, further delineation of the current samples scores into ranges that the scores can be interpreted within were analysed. The range of responses were divided by those respondent’s that exceeded established “Threshold Limits” score which indicates the likelihood of psychiatric illness, which can be used to identify individuals (or a percentage of the group) that fit these criteria. Figure 14 details the percentage of respondents from the current sample.
Figure 14: GHQ threshold comparison
As can be seen in Figure 14, in comparison to people in customer service positions (27% above threshold) and skilled construction workers (10% above threshold), the current sample returned a much higher figure (68%) for those reporting scores on the GHQ above the threshold that is conservatively used to indicate the presence of physical illness related to psychological disorders.
Again, this finding is indicative of a workforce that is physically and mentally deteriorating due to the demands of their jobs.
0% 20% 40% 60% 80% 100%
ABOVE THRESHOLD >10
BELOW THRESHOLD <10
Above Threshold >10 Below Threshold <10Customer Service 27% 73%Skilled Construction 10% 90%Current Sample 68% 32%
Customer Service Skilled Construction Current Sample
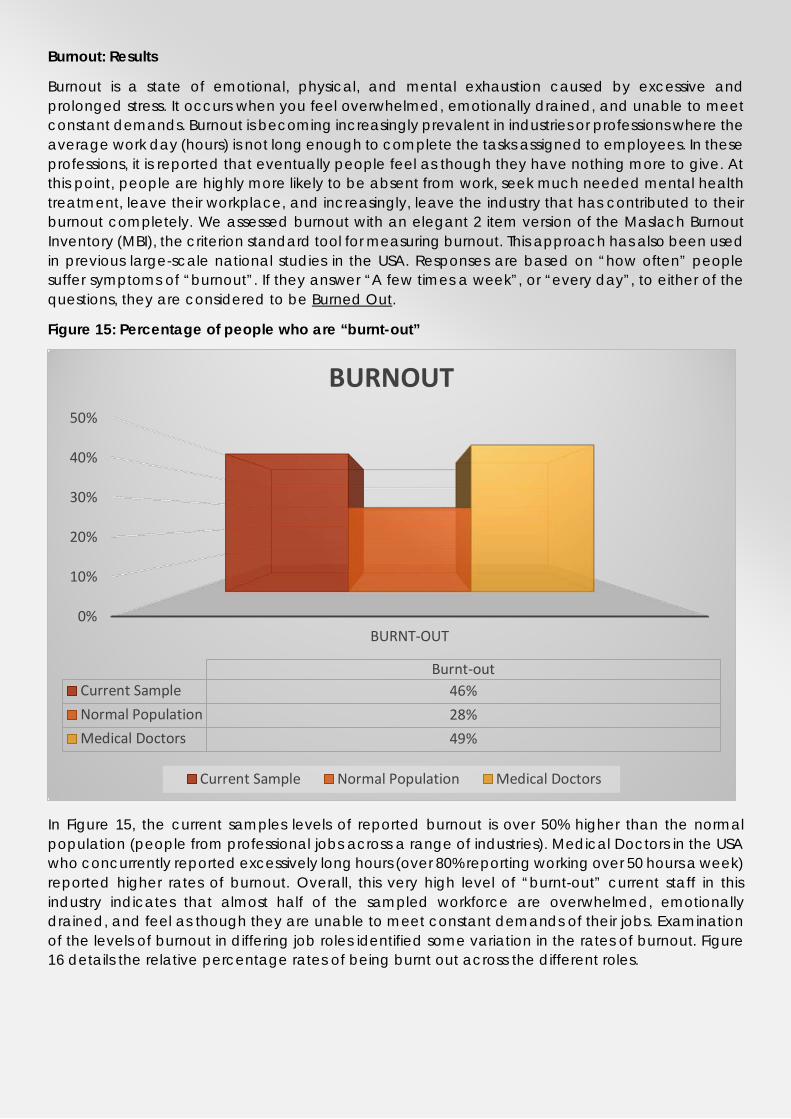
Burnout: Results
Burnout is a state of emotional, physical, and mental exhaustion caused by excessive and prolonged stress. It occurs when you feel overwhelmed, emotionally drained, and unable to meet constant demands. Burnout is becoming increasingly prevalent in industries or professions where the average work day (hours) is not long enough to complete the tasks assigned to employees. In these professions, it is reported that eventually people feel as though they have nothing more to give. At this point, people are highly more likely to be absent from work, seek much needed mental health treatment, leave their workplace, and increasingly, leave the industry that has contributed to their burnout completely. We assessed burnout with an elegant 2 item version of the Maslach Burnout Inventory (MBI), the criterion standard tool for measuring burnout. This approach has also been used in previous large-scale national studies in the USA. Responses are based on “how often” people suffer symptoms of “burnout”. If they answer “A few times a week”, or “every day”, to either of the questions, they are considered to be Burned Out.
Figure 15: Percentage of people who are “burnt-out”
In Figure 15, the current samples levels of reported burnout is over 50% higher than the normal population (people from professional jobs across a range of industries). Medical Doctors in the USA who concurrently reported excessively long hours (over 80% reporting working over 50 hours a week) reported higher rates of burnout. Overall, this very high level of “burnt-out” current staff in this industry indicates that almost half of the sampled workforce are overwhelmed, emotionally drained, and feel as though they are unable to meet constant demands of their jobs. Examination of the levels of burnout in differing job roles identified some variation in the rates of burnout. Figure 16 details the relative percentage rates of being burnt out across the different roles.
0%
10%
20%
30%
40%
50%
BURNT-OUT
Burnt-outCurrent Sample 46%Normal Population 28%Medical Doctors 49%
BURNOUT
Current Sample Normal Population Medical Doctors

0%
20%
40%
60%
80%
BURNT-OUTBurnt-out
Commercial Management 49%Design Management 51%Graduate Engineer 55%Project Director 29%Project Engineer 54%Project Manager 41%Project Support Services 33%Safety, Quality or Environment Management 40%Senior Project Engineer 48%Site Engineer 78%
FIGURE 16: BURNOUT BY JOB ROLE

Within Figure 16 it becomes evident that a higher percentage of Site Engineers (78%), Graduate Engineers (55%) and Project Engineers (54%) are meeting the criteria for being burnt out. The roles these employees fulfil are integral to the success (current and future) of the major infrastructure projects they are currently employed within. These employees represent an immediate threat to the quality and quantity of the workforce within this industry. It should also be noted that, all, job designations in the survey exceeded the “Normal” population rate of being “burnt-out”. As such, industry wide measures need to be undertaken to rehabilitate currently burnt-out employees, and to somewhat inoculate current or future employees that may be exposed to stressors that could precede symptoms of burn-out.
Hours worked: Results
A well-established contributor to workplace stress and mental illness is the average hour’s people work every week. The current sample were asked to report how many hour’s they work on average per week. As can be seen in Figure 16 below, when looking at the sample as a whole, 47% of respondents reported working 50-60 hours per week.
Figure 16: Work hours
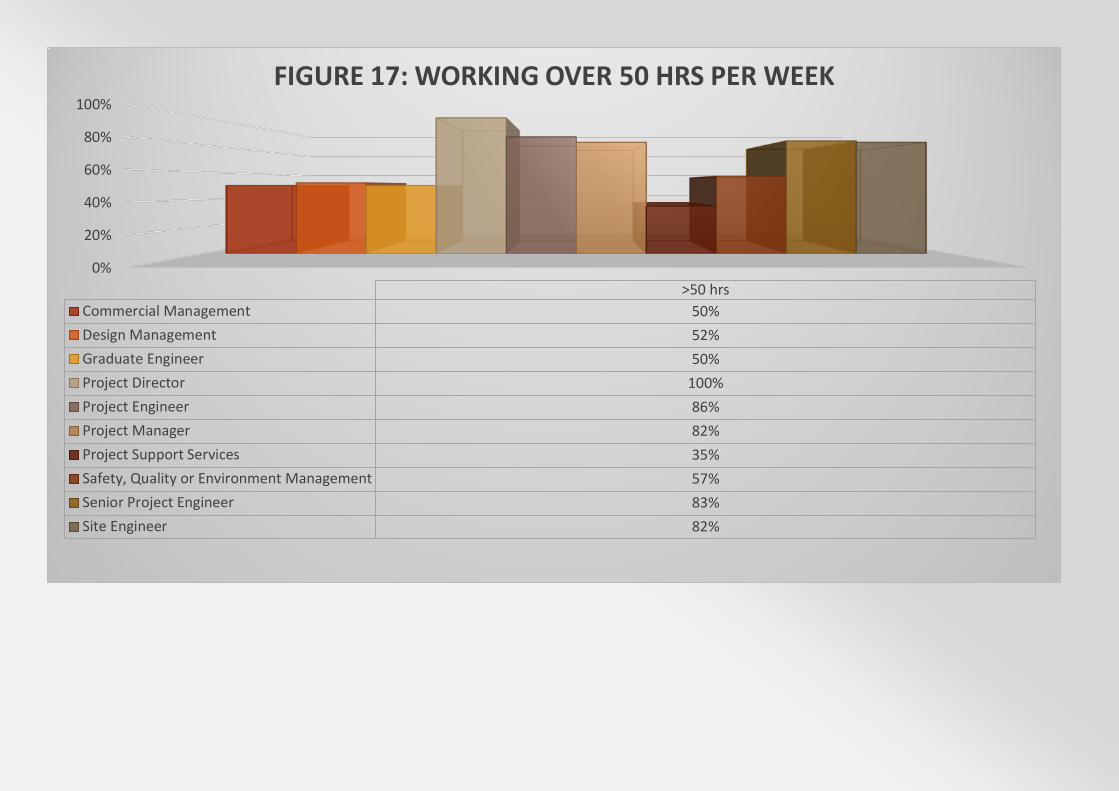
A further 17% of respondents reported working greater than 60 hours per week on average, again highlighting the demands of this industry. Given the role work hours plays in predicting levels of burnout, and the range of percentage of burnout symptoms that was observed across the differing job roles in this industry; Figure 17 details the percentage of employees in each job role reporting working over 50 hours per week.
Examination of Figure 17 highlights some very high percentages of certain roles exceeding 50 hours per week of work. The high proportion of Project Directors (100%), Project Engineer (86%), Project Manager (82%), Senior Project Engineer (83%), and Site Engineer’s (82%) working in excess of 50 hours per week highlights the unsustainable demands upon these types of staff specifically.
2% 6%
28%
47%
17%
Hours worked per week
< 30
30-40
40-50
50-60
> 60
0%
20%
40%
60%
80%
100%
>50 hrsCommercial Management 50%Design Management 52%Graduate Engineer 50%Project Director 100%Project Engineer 86%Project Manager 82%Project Support Services 35%Safety, Quality or Environment Management 57%Senior Project Engineer 83%Site Engineer 82%
FIGURE 17: WORKING OVER 50 HRS PER WEEK
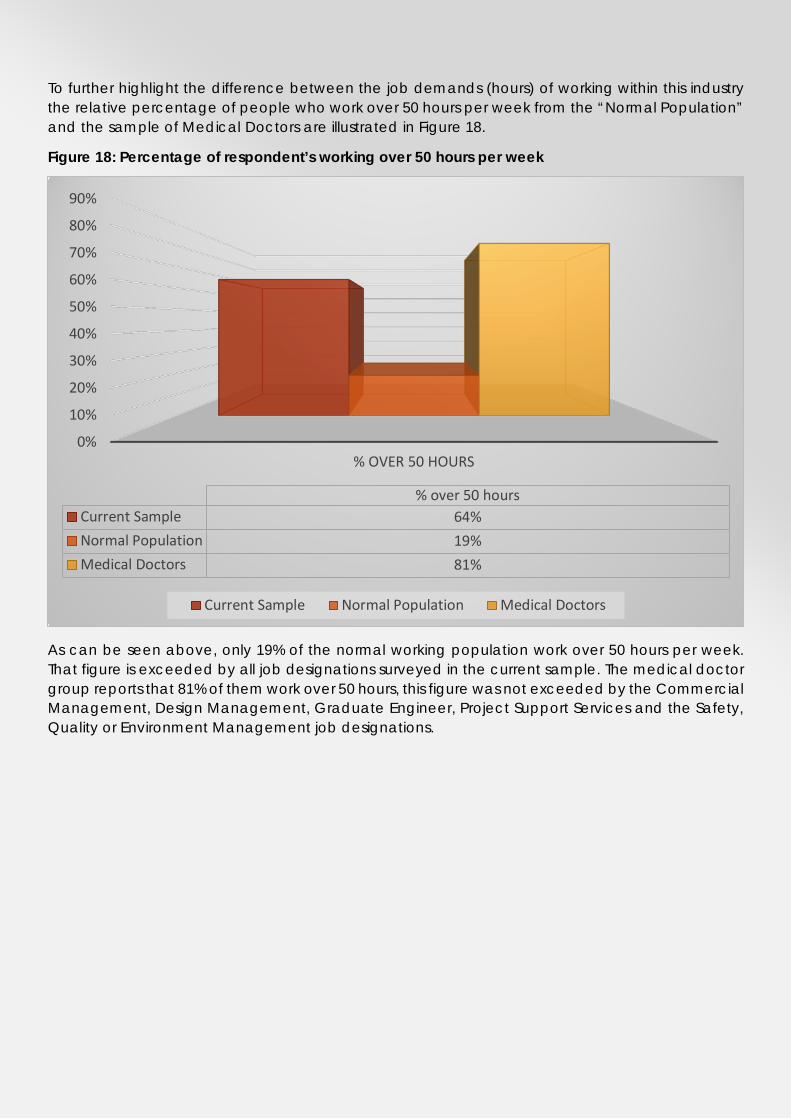
To further highlight the difference between the job demands (hours) of working within this industry the relative percentage of people who work over 50 hours per week from the “Normal Population” and the sample of Medical Doctors are illustrated in Figure 18.
Figure 18: Percentage of respondent’s working over 50 hours per week
As can be seen above, only 19% of the normal working population work over 50 hours per week. That figure is exceeded by all job designations surveyed in the current sample. The medical doctor group reports that 81% of them work over 50 hours, this figure was not exceeded by the Commercial Management, Design Management, Graduate Engineer, Project Support Services and the Safety, Quality or Environment Management job designations.
0%
10%
20%
30%
40%
50%
60%
70%
80%
90%
% OVER 50 HOURS
% over 50 hoursCurrent Sample 64%Normal Population 19%Medical Doctors 81%
Current Sample Normal Population Medical Doctors
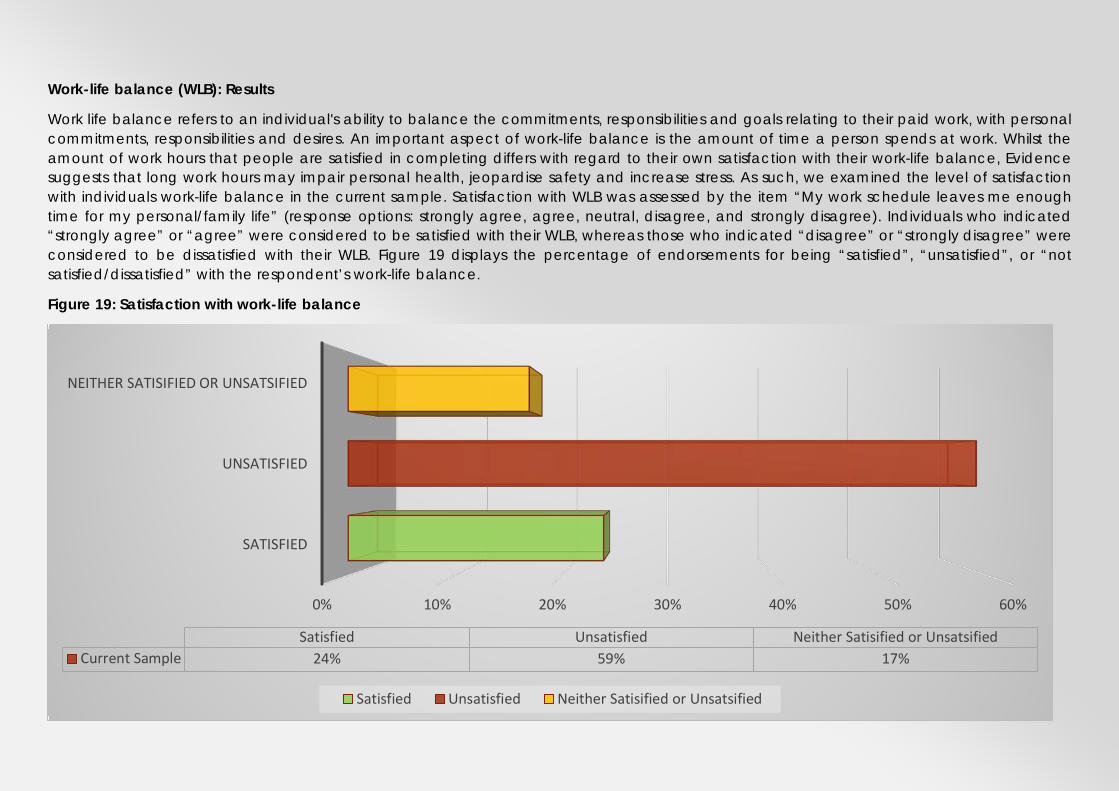
Work-life balance (WLB): Results
Work life balance refers to an individual's ability to balance the commitments, responsibilities and goals relating to their paid work, with personal commitments, responsibilities and desires. An important aspect of work-life balance is the amount of time a person spends at work. Whilst the amount of work hours that people are satisfied in completing differs with regard to their own satisfaction with their work-life balance, Evidence suggests that long work hours may impair personal health, jeopardise safety and increase stress. As such, we examined the level of satisfaction with individuals work-life balance in the current sample. Satisfaction with WLB was assessed by the item “My work schedule leaves me enough time for my personal/family life” (response options: strongly agree, agree, neutral, disagree, and strongly disagree). Individuals who indicated “strongly agree” or “agree” were considered to be satisfied with their WLB, whereas those who indicated “disagree” or “strongly disagree” were considered to be dissatisfied with their WLB. Figure 19 displays the percentage of endorsements for being “satisfied”, “unsatisfied”, or “not satisfied/dissatisfied” with the respondent’s work-life balance.
Figure 19: Satisfaction with work-life balance
0% 10% 20% 30% 40% 50% 60%
SATISFIED
UNSATISFIED
NEITHER SATISIFIED OR UNSATSIFIED
Satisfied Unsatisfied Neither Satisified or UnsatsifiedCurrent Sample 24% 59% 17%
Satisfied Unsatisfied Neither Satisified or Unsatsified

Overall, 59% of the respondent’s endorsed being “unsatisfied” with their level of work-life balance. As can be seen below (Figure 20), this level of dissatisfaction exceeds normative values by 39%, and appears 10% higher than the medical doctor comparison population.
Figure 20: Percentages of “dissatisfaction” with work-life balance
DISCUSSION This report details the findings of the largest survey undertaken concerning the mental health and well-being of a representative sample of construction professionals in Australia. The results detailed concern the responses from 683 construction professionals from 8 major construction/infrastructure companies. They illustrate significantly poor responses on six key assessments of mental health, mood disturbance, physical health, stress, work-life balance, and the incidence of burnout. The results demonstrate that the increasing demands, long hours, time pressure, and expectations to operate outside of normal working hours are requiring unsustainable efforts from infrastructure/construction professional staff that is resulting in mental and physical damage to the workforce. Amongst many possible recommendations aimed at addressing these issues, are that the results of this survey need to be communicated to the staff who were surveyed in acknowledgment that the demands of their industry are having significant adverse effects upon their mental and physical health. Additionally, these gravity of these results need to be communicated to upper management, seeking a commitment from them, and their company more broadly, to act, monitor and change workplace practises that are contributing to these decrements in the health and well-being of their workforce.
0%
10%
20%
30%
40%
50%
60%
WORK-LIFE BALANCE
Work-life balanceCurrent Sample 59%Normal Population 20%Medical Doctors 49%
Current Sample Normal Population Medical Doctors
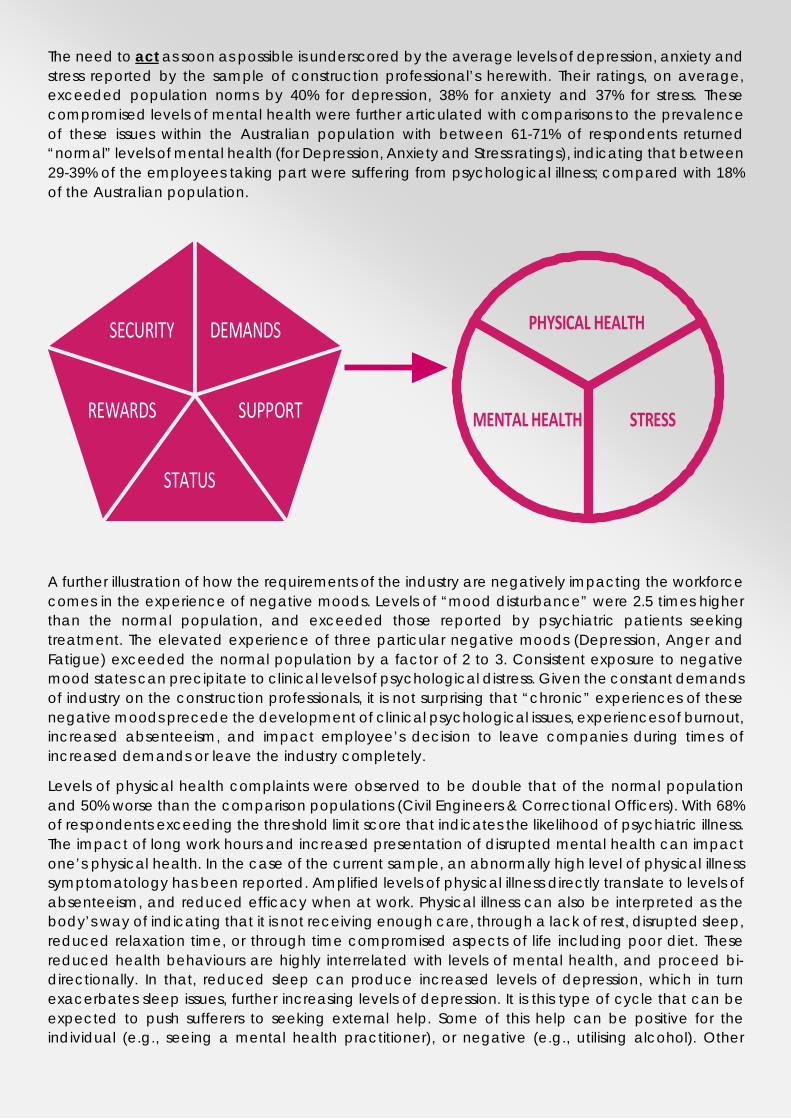
The need to act as soon as possible is underscored by the average levels of depression, anxiety and stress reported by the sample of construction professional’s herewith. Their ratings, on average, exceeded population norms by 40% for depression, 38% for anxiety and 37% for stress. These compromised levels of mental health were further articulated with comparisons to the prevalence of these issues within the Australian population with between 61-71% of respondents returned “normal” levels of mental health (for Depression, Anxiety and Stress ratings), indicating that between 29-39% of the employees taking part were suffering from psychological illness; compared with 18% of the Australian population.
A further illustration of how the requirements of the industry are negatively impacting the workforce comes in the experience of negative moods. Levels of “mood disturbance” were 2.5 times higher than the normal population, and exceeded those reported by psychiatric patients seeking treatment. The elevated experience of three particular negative moods (Depression, Anger and Fatigue) exceeded the normal population by a factor of 2 to 3. Consistent exposure to negative mood states can precipitate to clinical levels of psychological distress. Given the constant demands of industry on the construction professionals, it is not surprising that “chronic” experiences of these negative moods precede the development of clinical psychological issues, experiences of burnout, increased absenteeism, and impact employee’s decision to leave companies during times of increased demands or leave the industry completely.
Levels of physical health complaints were observed to be double that of the normal population and 50% worse than the comparison populations (Civil Engineers & Correctional Officers). With 68% of respondents exceeding the threshold limit score that indicates the likelihood of psychiatric illness. The impact of long work hours and increased presentation of disrupted mental health can impact one’s physical health. In the case of the current sample, an abnormally high level of physical illness symptomatology has been reported. Amplified levels of physical illness directly translate to levels of absenteeism, and reduced efficacy when at work. Physical illness can also be interpreted as the body’s way of indicating that it is not receiving enough care, through a lack of rest, disrupted sleep, reduced relaxation time, or through time compromised aspects of life including poor diet. These reduced health behaviours are highly interrelated with levels of mental health, and proceed bi-directionally. In that, reduced sleep can produce increased levels of depression, which in turn exacerbates sleep issues, further increasing levels of depression. It is this type of cycle that can be expected to push sufferers to seeking external help. Some of this help can be positive for the individual (e.g., seeing a mental health practitioner), or negative (e.g., utilising alcohol). Other
PHYSICAL HEALTH
MENTAL HEALTH STRESS
SECURITY DEMANDS
SUPPORTREWARDS
STATUS
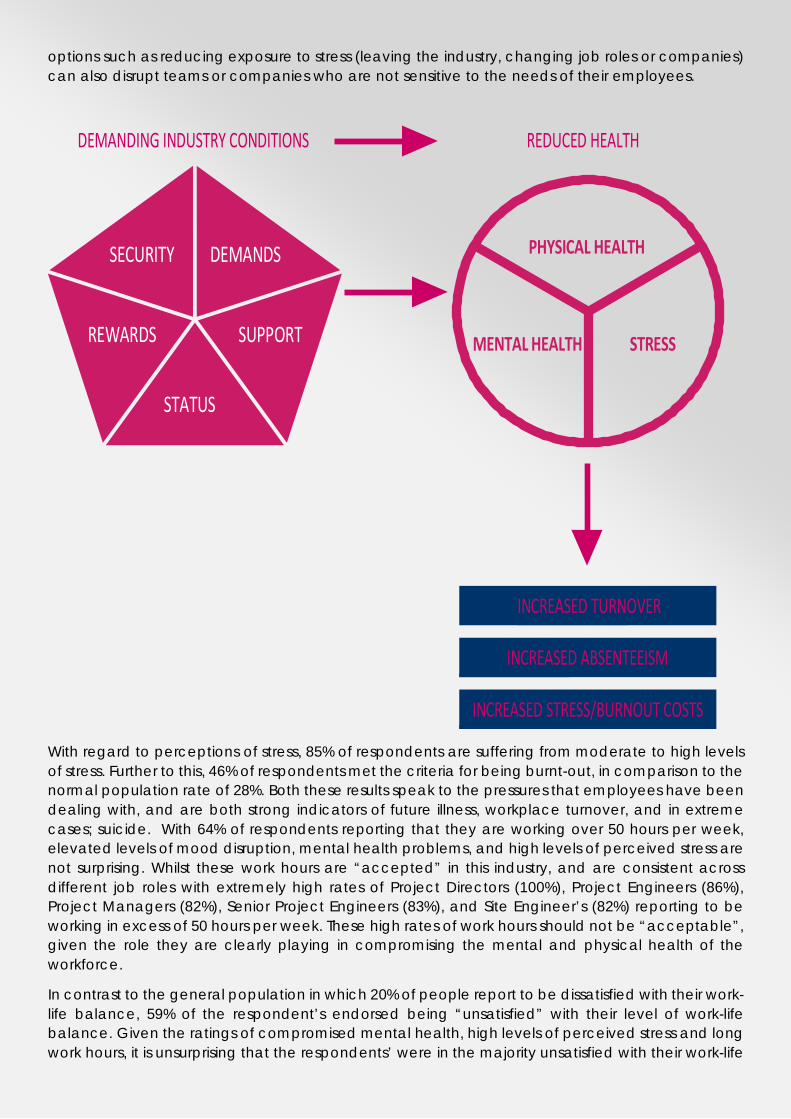
options such as reducing exposure to stress (leaving the industry, changing job roles or companies) can also disrupt teams or companies who are not sensitive to the needs of their employees.
DEMANDING INDUSTRY CONDITIONS REDUCED HEALTH
With regard to perceptions of stress, 85% of respondents are suffering from moderate to high levels of stress. Further to this, 46% of respondents met the criteria for being burnt-out, in comparison to the normal population rate of 28%. Both these results speak to the pressures that employees have been dealing with, and are both strong indicators of future illness, workplace turnover, and in extreme cases; suicide. With 64% of respondents reporting that they are working over 50 hours per week, elevated levels of mood disruption, mental health problems, and high levels of perceived stress are not surprising. Whilst these work hours are “accepted” in this industry, and are consistent across different job roles with extremely high rates of Project Directors (100%), Project Engineers (86%), Project Managers (82%), Senior Project Engineers (83%), and Site Engineer’s (82%) reporting to be working in excess of 50 hours per week. These high rates of work hours should not be “acceptable”, given the role they are clearly playing in compromising the mental and physical health of the workforce.
In contrast to the general population in which 20% of people report to be dissatisfied with their work-life balance, 59% of the respondent’s endorsed being “unsatisfied” with their level of work-life balance. Given the ratings of compromised mental health, high levels of perceived stress and long work hours, it is unsurprising that the respondents’ were in the majority unsatisfied with their work-life
INCREASED TURNOVER
INCREASED ABSENTEEISM
INCREASED STRESS/BURNOUT COSTS
PHYSICAL HEALTH
MENTAL HEALTH STRESS
SECURITY DEMANDS
SUPPORTREWARDS
STATUS
balance. This result is in contrast to the mostly positive ratings of the experience of “psychosocial aspects of employment” detailed on pages 10-11. Engineering professionals are engaged in a highly technical and intellectually demanding industry, and are well compensated for their work. But as detailed in this report, they work long hours, at the expense of their physical and mental health. The cumulative effect of these forces creates a unique set of circumstances, where these employees are satisfied with their jobs, but suffer from professional burnout and dissatisfaction with work-life balance. The experience of these negative outcomes such as burnout, where people lose meaning in their work, and feel ineffective, may force them to address this imbalance through seeking help, taking leave, or quitting the industry. Any attempt in addressing the high rates of psychological and physical disturbance in this need to consider these downstream outcomes (work-life balance) that inform rates of turnover, absenteeism, stress/burnout-related leave, and determinations to leave the industry. Additionally, the impact of any changes designed to address these issues needs to be monitored, completed repeatedly, in order to ascertain if any interventions, changes in culture, or changes in the industry affect mental health.
CONCLUSIONS
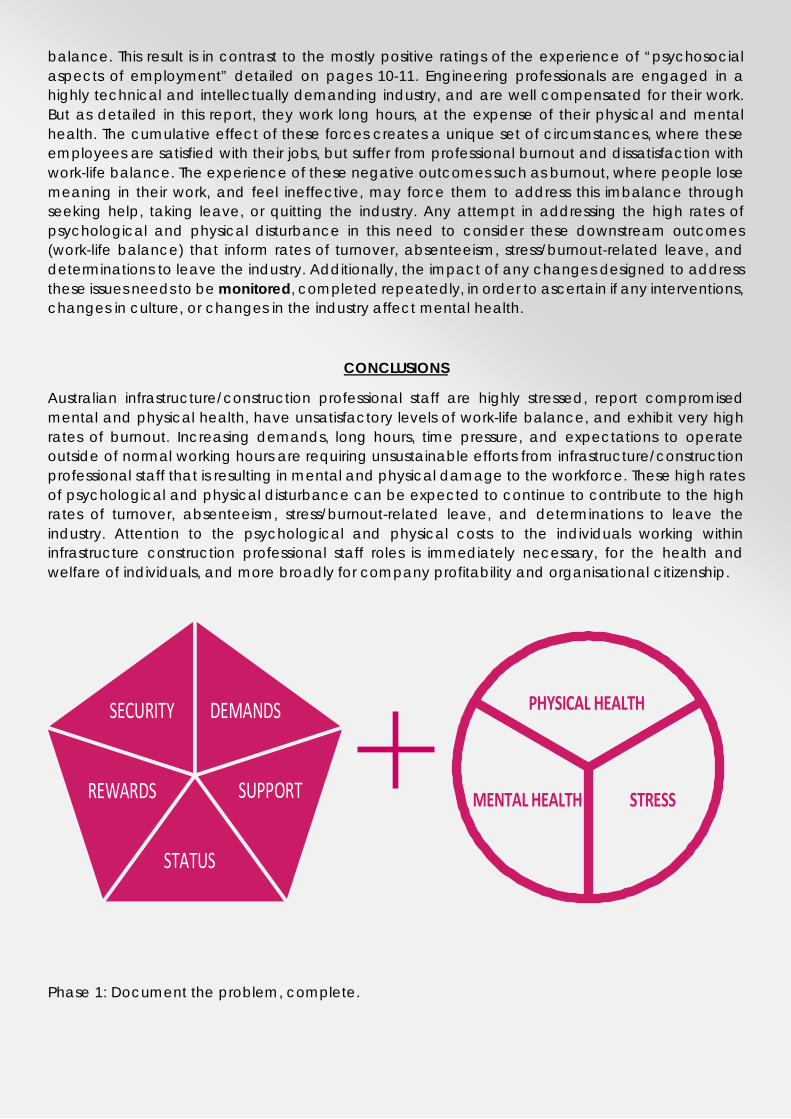
Australian infrastructure/construction professional staff are highly stressed, report compromised mental and physical health, have unsatisfactory levels of work-life balance, and exhibit very high rates of burnout. Increasing demands, long hours, time pressure, and expectations to operate outside of normal working hours are requiring unsustainable efforts from infrastructure/construction professional staff that is resulting in mental and physical damage to the workforce. These high rates of psychological and physical disturbance can be expected to continue to contribute to the high rates of turnover, absenteeism, stress/burnout-related leave, and determinations to leave the industry. Attention to the psychological and physical costs to the individuals working within infrastructure construction professional staff roles is immediately necessary, for the health and welfare of individuals, and more broadly for company profitability and organisational citizenship.
Phase 1: Document the problem, complete.
PHYSICAL HEALTH
MENTAL HEALTH STRESS
SECURITY DEMANDS
SUPPORTREWARDS
STATUS

To achieve this, we recommend undertaking additional phases of research (Phase 2), an assessment of how the workplace and workplace processes could be improved to reduce stress (Know the problem) and; an intervention phase (Phase 3), the development and implementation of individual worker strategies to reduce stress (Intervention). Phase 2 would involve consultation with affected staff through focus groups or one-on-one interviews, to identify the true cause of these disruptions to mental and physical well-being, and what employee’s believe can and needs to be done to alleviate the identified pressures. This phase is necessary because it will build upon the “industry-specific” data presented herein, and will inform development of solutions tailored to this industry. Making the likelihood of improving the mental and physical health of this workforce achievable.
Phase 3 would build on the findings articulated in this report and from the consultation with affected staff. This would enable targeted and bespoke solutions for companies to employ, to protect and manage the mental and physical health of their employees. Teamed with repeated assessment of key indicators of well-being (e.g., work-life balance & burnout), these tailored solutions should contribute to the retention of a healthier, happier and productive workforce.
DOCUMENT THE PROBLEM
KNOW THE PROBLEM
INTERVENTION
PHASE 1
PHASE 2
PHASE 3
REFERENCES
Cohen, S. (1983). Perceived Stress Scale; Manual, Mind Garden. Cohen, S., Kamarck, T., & Mermelstein, R. (1983). A global measure of perceived stress. Journal of health and social behavior, 385-396. Cohen, S., & Janicki‐Deverts, D.E. (2012). Who's Stressed? Distributions of Psychological Stress in the United States in Probability Samples from 1983, 2006, and 2009 1. Journal of applied social psychology, 42(6), 1320-1334. Crawford, J., Cayley, C., Lovibond, P. F., Wilson, P. H., & Hartley, C. (2011). Percentile norms and accompanying interval estimates from an Australian general adult population sample for self‐report mood scales (BAI, BDI, CRSD, CES‐D, DASS, DASS‐21, STAI‐X, STAI‐Y, SRDS, and SRAS). Australian Psychologist, 46(1), 3-14. Dollard, M. F., & Winefield, A. H. (1995). Trait anxiety, work demand, social support and psychological distress in correctional officers. Anxiety, Stress & Coping, 8(1), 25-35. Francis, V. E. (2003). “Civil engineers and work-family conflict: The role of workplace support on their work and non-work satisfaction and well-being.” Proc., 2nd Int. Conf. on Construction in the 21st Century (CITC-II) Sustainability and Innovation in Management and Technology, Hong Kong. Henry, J. D., & Crawford, J. R. (2005). The short‐form version of the Depression Anxiety Stress Scales (DASS‐21): Construct validity and normative data in a large non‐clinical sample. British journal of clinical psychology, 44(2), 227-239. Krasner, M. S., Epstein, R. M., Beckman, H., Suchman, A. L., Chapman, B., Mooney, C. J., & Quill, T. E. (2009). Association of an educational program in mindful communication with burnout, empathy, and attitudes among primary care physicians. Jama, 302(12), 1284-1293. Lovibond, P. F., & Lovibond, S. H. (1995). The structure of negative emotional states: Comparison of the Depression Anxiety Stress Scales (DASS) with the Beck Depression and Anxiety Inventories. Behaviour research and therapy, 33(3), 335-343. McNair, D. M., Lorr, M., & Droppleman, L. F. (1971). Manual for the POMS. San Diego: Educational and Industrial Testing Service. Shanafelt, T. D., Hasan, O., Dyrbye, L. N., Sinsky, C., Satele, D., Sloan, J., & West, C. P. (2015, December). Changes in burnout and satisfaction with work-life balance in physicians and the general US working population between 2011 and 2014. In Mayo Clinic Proceedings (Vol. 90, No. 12, pp. 1600-1613). Elsevier. Sunindijo, R. Y., & Kamardeen, I. (2017). Work stress is a threat to gender diversity in the construction industry. Journal of Construction Engineering and Management, 143(10), 04017073. Thorsteinsson, E. B., Brown, R. F., & Richards, C. (2014). The relationship between work-stress, psychological stress and staff health and work outcomes in office workers. Psychology, 5(10), 1301.

CONTACT: Associate Professor Luke Downey [email protected] [email protected] +61 0419378988
Related Documents

![Stress Psychological Disorders Combined[1]](https://static.cupdf.com/doc/110x72/577daafc1a28ab223f8bbe82/stress-psychological-disorders-combined1.jpg)