Expert Journal of Economics. Volume 6, Issue 1, pp. 1-14, 2018 © 2018 The Author. Published by Sprint Investify. ISSN 2359-7704 Economics.ExpertJournals.com 1 Measuring the Multinational Business Value: An Indexing Approach Dr. Jorge MONGAY HURTADO * ESIC Business and Marketing School, Spain The research project aims to present a comparative analysis of countries related to the value of their MNCs in the global arena. The study works in secondary data anal- ysis using as a platform the Forbes Global 2000 list, which is maybe the best source explaining the presence of MNCs by country. This research goes beyond the infor- mation provided by the original list, offering an index and information about the number of corporations per country as well as their value (number of corporations per country, their position in the ranking and the weight obtained by each company expressed in numerical value). Also the index obtained has been adjusted to the pop- ulation of each country to determine which one should be the expected value per country from a more realistic perspective. An analysis of cultural clusters and trading zones has been applied as well. Finally, a calculation of the different sectors where MNCs operate give the index the possibility to estimate the % of penetration or im- portance of the services and financial sector in each country and in the world. Keywords: comparative analysis, Multinational Corporations, MNCs, business value, cultural clusters, global research JEL Classification: E22, L22, L10 1. Introduction This research project starts by analyzing carefully the most comprehensive list of Multinational Cor- porations (MNCs) on a worldwide basis which is published yearly by Forbes. The list contains the 2000 largest MNCs which operate globally. Also, the Forbes research ranks the companies taking into consideration 4 con- tributing variables to value which are: sales, profits, assets and market value, providing for researchers and executives a very insightful information on the evolution of MNCs. Still, and even if this research provides information about the representation of each country in terms of multinational the ranking it is possible to go beyond its information. This work identifies and creates several indexes from the original raw data expressing the contributions to the global arena of MNCs in each participating country, showing results of 61 countries in total. First, this investigation assigns a value to each company depending on its position on the original ranking, taking as good the original methodology and the 4 variables used by Forbes. Second, the MNCs represented are grouped by nationality extracting information related to their industry of operation. Third, total values of the 61 countries represented are calculated and averages are made using a total of N=1923 corporations out of the original 2000 * Corresponding Author: Dr. Jorge Mongay Hurtado, ESIC Business and Marketing School, Spain Article History: Received 9 February 2018 | Accepted 15 March 2018 | Available Online 23 March 2018 Cite Reference: Mongay Hurtado, J., 2018. Measuring the Multinational Business Value: An Indexing Approach. Expert Journal of Economics, 6(1), pp.1-14.

Welcome message from author
This document is posted to help you gain knowledge. Please leave a comment to let me know what you think about it! Share it to your friends and learn new things together.
Transcript
Expert Journal of Economics. Volume 6, Issue 1, pp. 1-14, 2018
© 2018 The Author. Published by Sprint Investify. ISSN 2359-7704 Economics.ExpertJournals.com
1
Measuring the Multinational Business Value:
An Indexing Approach
Dr. Jorge MONGAY HURTADO*
ESIC Business and Marketing School, Spain
The research project aims to present a comparative analysis of countries related to
the value of their MNCs in the global arena. The study works in secondary data anal-
ysis using as a platform the Forbes Global 2000 list, which is maybe the best source
explaining the presence of MNCs by country. This research goes beyond the infor-
mation provided by the original list, offering an index and information about the
number of corporations per country as well as their value (number of corporations
per country, their position in the ranking and the weight obtained by each company
expressed in numerical value). Also the index obtained has been adjusted to the pop-
ulation of each country to determine which one should be the expected value per
country from a more realistic perspective. An analysis of cultural clusters and trading
zones has been applied as well. Finally, a calculation of the different sectors where
MNCs operate give the index the possibility to estimate the % of penetration or im-
portance of the services and financial sector in each country and in the world.
Keywords: comparative analysis, Multinational Corporations, MNCs, business
value, cultural clusters, global research
JEL Classification: E22, L22, L10
1. Introduction
This research project starts by analyzing carefully the most comprehensive list of Multinational Cor-
porations (MNCs) on a worldwide basis which is published yearly by Forbes. The list contains the 2000 largest
MNCs which operate globally. Also, the Forbes research ranks the companies taking into consideration 4 con-
tributing variables to value which are: sales, profits, assets and market value, providing for researchers and
executives a very insightful information on the evolution of MNCs. Still, and even if this research provides
information about the representation of each country in terms of multinational the ranking it is possible to go
beyond its information.
This work identifies and creates several indexes from the original raw data expressing the contributions
to the global arena of MNCs in each participating country, showing results of 61 countries in total. First, this
investigation assigns a value to each company depending on its position on the original ranking, taking as good
the original methodology and the 4 variables used by Forbes. Second, the MNCs represented are grouped by
nationality extracting information related to their industry of operation. Third, total values of the 61 countries
represented are calculated and averages are made using a total of N=1923 corporations out of the original 2000
*Corresponding Author:
Dr. Jorge Mongay Hurtado, ESIC Business and Marketing School, Spain
Article History:
Received 9 February 2018 | Accepted 15 March 2018 | Available Online 23 March 2018
Cite Reference:
Mongay Hurtado, J., 2018. Measuring the Multinational Business Value: An Indexing Approach. Expert Journal of Economics, 6(1), pp.1-14.

Mongay Hurtado, J., 2018. Measuring the Multinational Business Value: An Indexing Approach. Expert Journal of Economics, 6(1), pp.1-14.
2
from the list. Fourth, averages are calculated out of the number of companies and value/country. Fifth, coun-
tries are grouped by cultural clusters following the Globe classification. Sixth, the countries are grouped by
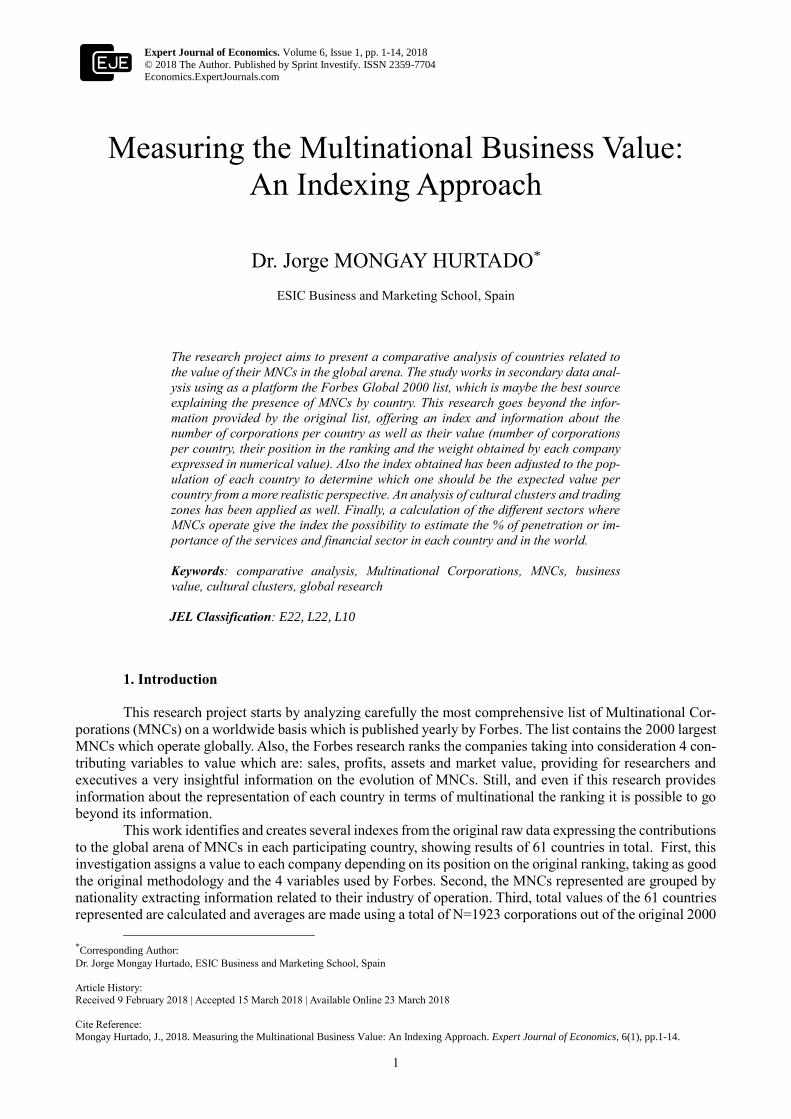
trading bloc. Seventh, The Distance to Index (DTI) indexes are calculated in terms of % of coverage of the
average index stating how close or far away from the index 100% the country is located. For example, USA is
a country which holds MNCs for a value of 18X (18 times) above the average value of the rest of the countries.
Eighth, Also the DTI index in the number of companies is calculated per country. Ninth, the former general
value of the MNCs of each country gets adjusted to its population. For example, a country like India performs
very well in the index compared with other countries but not so well when we calculate the index taking into
consideration its huge population and the opposite occurs in the case of Switzerland which is located in a very
good position but it gets better when we adjust to its population the results of the index. Tenth, also it is pre-
sented in the research the presence of the services industry (usually represented by financial corporations) per
country and its representation in value. The research has been based in a classification of MNCs during the
year 2016.
2. Literature Review on Indexes Applied to International Business Research
Taking into account that this article creates an index, the literature review process has been based in
firstly explaining the robustness of original raw data offered by the Forbes list and secondly a compilation of
the most usual indicators, indexes and rankings used in international business analysis.
Forbes Global 2000 list (Forbes, 2017) is an annual ranking of the world’s biggest public companies
along 4 major variables which are: sales, profits, assets, market value. Forbes ranking is considered by several
academic sources and authors as most popular list when evaluation multinational presence and results. In order
to create their list of the Top 2000 Multinational Companies (MNCs), Forbes sets limits for each of the four-
metrics analyzed. Corporations must meet at least one of the criterion in order to appear in the classification
of the top 2000. By doing this, the list is separated in 4 groups referring to sales, profits assets and market
value. A given MNC could meet one criterion but not another one and still appear in the list.
Forbes obtains their “raw data” from FactSet Research systems (FRS), a multinational financial data
and software company headquartered in Norwalk, Connecticut (CT), the United States that provides financial
information and analytic software for investment professionals. Forbes ranks the corporations using a compo-
site score which takes into account the former 4 variables or criterions. The list presents some limitations as
it is restricted only to public companies. Also, the calculation of the composite-scores do not contemplate
different weight in the metrics.
Forbes Global 200 list can be used as a platform for other research projects in economics or business
as stated by (Wiegand et al, 2018), (Peng et al, 2016) or (Nowotnik et al, 2015).
Indexes and rankings are widely used not only in the study of macroeconomics but also in international
trade and business in general offering easy to compare approaches. Also, indexes are widely used to help to
understand the behavior of several countries and they are perceived as a great tool to be used in comparative
economics.
Taking into consideration that this investigation wants to bring light to understanding the values of
each country in MNC a research of indexes also called indicators is mentioned here. The Market Potentiality
Index, (Cavusgill,1997) is a good example of using the indexing approach to explain the degree of potentiality
or attractiveness of a country, economy or market. This one is also a composite index made by others variables
as country size, market receptivity, market growth rate, market intensity, etc.
The Corruption Perceptions Index (Transparency International, 2017) it is a very valuable index in
order to understand how countries perform in corruption offering a ranking close to 190 nations using a clas-
sification from o to 10 points.
The Ease of Doing Business (World Bank, 2017) is an index and ranking which explains how good
and competitive governments are facilitating business on a day to day basis. It is important to state here the
concept Distance to Frontier (DTF). The distance to frontier score helps assess the absolute level of regulatory
performance over time. It measures the distance of each economy to the “frontier,” which represents the best
performance observed on each of the indicators across all economies in the Doing Business sample since 2005.
One can both see the gap between a particular economy’s performance and the best performance at any point
in time and assess the absolute change in the economy’s regulatory environment over time as measured by Do-
ing Business. An economy’s distance to frontier is reflected on a scale from 0 to 100, where 0 represents the
lowest performance and 100 represents the frontier. For example, a score of 75 in 2017 means an economy
was 25 percentage points away from the frontier constructed from the best performances across all economies
and across time. A score of 80 in 2018 would indicate the economy is improving (World Bank, 2017).

Mongay Hurtado, J., 2018. Measuring the Multinational Business Value: An Indexing Approach. Expert Journal of Economics, 6(1), pp.1-14.
3
The Global Competitiveness Report 2017-18 (World Economic Forum, 2017), states using a compo-
site index and a ranking the levels and the evolution of the concept competitiveness selecting 12 different
pillars as infrastructure, institutions or innovation among others.
In order to better understand how connected an economy or country exists the DHL Global Connect-
edness (Gheadas and Altman, 2016). This indicator provides a comprehensive idea of the global amount of
connectedness and it covers up to 140 nations. The represented nations represent up to 99% of the Global
Gross Domestic Product and 95% of it’s the worldwide population. The idea used here if that “global connect-
edness” is comprised by 4 main pillars of the index which are a) Trade flows (products and services), b) in-
vestment flows (capital), c) information flows, and d) people flows.
Culture and cultural dimensions also have been ranked through indexes by (Hofstede, 2017) helping
to researchers to understand differences among countries and how employees behave taking into consideration
6 crucial variables. The Gini index also is another example of utilization of indicators, in this particular case it
measures income distribution and wealth distribution among a population (Gini, C. 1921). The coefficient
ranges from 0 (or 0%) to 1 (or 100%), with 0 representing perfect equality and 1 representing perfect inequality.
so, relevant the Global Innovation Index (Cornell University, INSEAD, and the World Intellectual Property
Organization, 2017) provides specific metrics about the innovation performance of 127 countries and econo-
mies around the world. It is made by 81 robust indicators which offer a panoramic vision of the topic. The
Index of Economic Freedom (Heritage Foundation, 2017) measures data based on 12 quantitative and qualita-
tive factors, grouped into four broad categories, or pillars, of economic freedom: Rule of Law (property rights,
government integrity, judicial effectiveness), Government Size (government spending, tax burden, fiscal
health), Regulatory Efficiency (business freedom, labor freedom, monetary freedom) and Open Markets (trade
freedom, investment freedom, financial freedom). The Indigo score (Global Perspectives, 2017) states that in
order to measure a country’s ability to compete and grow in this new economic era, it is vital to look at a range
of broader socio–economic infrastructure such as; the levels of education, the ‘cloud’ or infrastructure for doing
business, its legal system, physical and intellectual property rights, competitive environment, political stability,
digital infrastructure, and the ecosystem of thousands of suppliers that can provide high-quality services rang-
ing from venture financing to marketing and web design. To assess a country’s future potential the indicator
provides information of a country’s socio-economic infrastructure that will shape, and influence, its economic
performance in the new Indigo Era. The score is based on five dimensions (Global Perspectives, 2017):
1) Stability & Legal Framework,
2) Creativity & Innovation,
3) Economic Diversity,
4) Digital Economy and
5) Freedom
3. Methodology and Index Dimensions
Initially, the secondary data research discards from the list of the 2000 corporations (Forbes, 2017) a
total of 77 companies due to their lack of consistency and irregularities in the raw data taking this research to
a total of 1923 companies representing 96.15% of the Forbes database.
Companies have been given a value according to their position in the original ranking so the first
company of the list was in position #1 obtaining 1923 points, #2 obtained 1922 points, etc. until the last com-
pany in the list which obtains 1 point. See equation where VM(abs) refers to the absolute value of each multi-
national company analyzed, ∑c refers to the total number of analyzed companies, in this case 1923 and #r
refers to position in the ranking.
VM(abs)= ∑c - #r
Consequently, it is possible to obtain a list of 1923 companies ordered by value according to their
position in the original ranking. See in Table 1 the top 10 companies of the research and their values.
Table 1. Top 10 MNC Globally
MNC NAME Country
ICBC China
China Construction Bank China
Agricultural Bank of China China
Berkshire Hathaway United States
JPMorgan Chase United States
Bank of China China

Mongay Hurtado, J., 2018. Measuring the Multinational Business Value: An Indexing Approach. Expert Journal of Economics, 6(1), pp.1-14.
4
Wells Fargo United States
Apple United States
ExxonMobil United States
Toyota Motor Japan
Source: Own elaboration
1.1. Secondly, the 1923 corporations analyzed have been grouped by country and information related to
the industry of each company has been extracted and organized as well.
1.2. As third step, each one of the 61 countries of the list presents a total number of companies and their
MNC value, for example Argentina has 2 companies in the classification and the value of the companies is
1173 and 140 respectively, giving a sum of 1313 in total. After adding all 61 countries we can state an average
30.236,57 weighted value per country. The equation used to calculate each country value (OV/C) is the total
number of represented companies (#c) multiplied by the value of each company (vc), see the following equa-
tion.
OV/C= #c X vc
The average of 30.236,57 will be represented by the technical index 97.87 (although in order to un-
derstand it better is converted to 100%). If we keep on using the example of Argentina which has 2 companies
with a total value of 1313 this represents 4.34% over the average 100%. The calculation is as follows: IMV(v)=
Average value of the country / total average. So, Argentina which appears in the ranking and it is represented
in value and number of companies, it covers only 4% of the average, being a 96% far away from it.
1.3. The fourth step obtains the number of companies which each country has in the list (global average is
32,62 companies). With this data, we can understand the implications of the number of companies that any
country should add to its actual number to make it to the average or the number of companies which already
exceed the average.
1.4. The fifth step consists in grouping the countries by cultural clusters in order to obtain information
about a new classification and explore future inter-dependencies. The cluster classification follows the Globe
Cluster Project due to its consistency and robustness. Clusters obtained and expressed in the index are: Cluster
#1: South Asia, Cluster #2: Latin America, Cluster #3: Nordic, Cluster #4: Anglo, Cluster #5: Germanic, Clus-
ter #6: Latin European, Cluster #7: African, Cluster #8: Eastern Europe, Cluster #9: Middle East and Cluster
#10: Confucian Asia.
1.5. The sixth step refers to the same as before but classifying the countries and their corporations according
the variable Trading Bloc (TB). In this aspect the trading blocs which appear are TB #1: NAFTA, TB#2: EU-
27, TB#3: Mercosur, TB#4: ASEAN, TB#5: Others.
1.6. The seventh step relates to the calculation of the Distance to Index (DTI) which reflects the % of
coverage of the index, for example Australia presents a value here of 1.09 (in reference to an index of 1), this
states that the country is a 9% above the average.
1.7. The eighth step refers to the DTI index. It is calculated with absolute numbers, reflecting the average
companies represented in the study and the number of companies of each country. For example, Spain shows
a DTI in number of companies (DTI#c) of -6.62, this means that taking the average of 32 companies per
country Spain is represented in the list with 26 companies, so at the moment that the country adds 6 or 7 more
companies will achieve the average in number of MNCs. The DTI(#c) is also calculated in % of coverage of
the average, for example Spain covers a total of 91.11% so it is very close to the total average of the 61 nations.
Other countries like for example Chile, with only one company represented cover only 15% of the index, so
still the country will have to walk a long way to achieve the average meaning that 85% of the way has not been
covered yet.
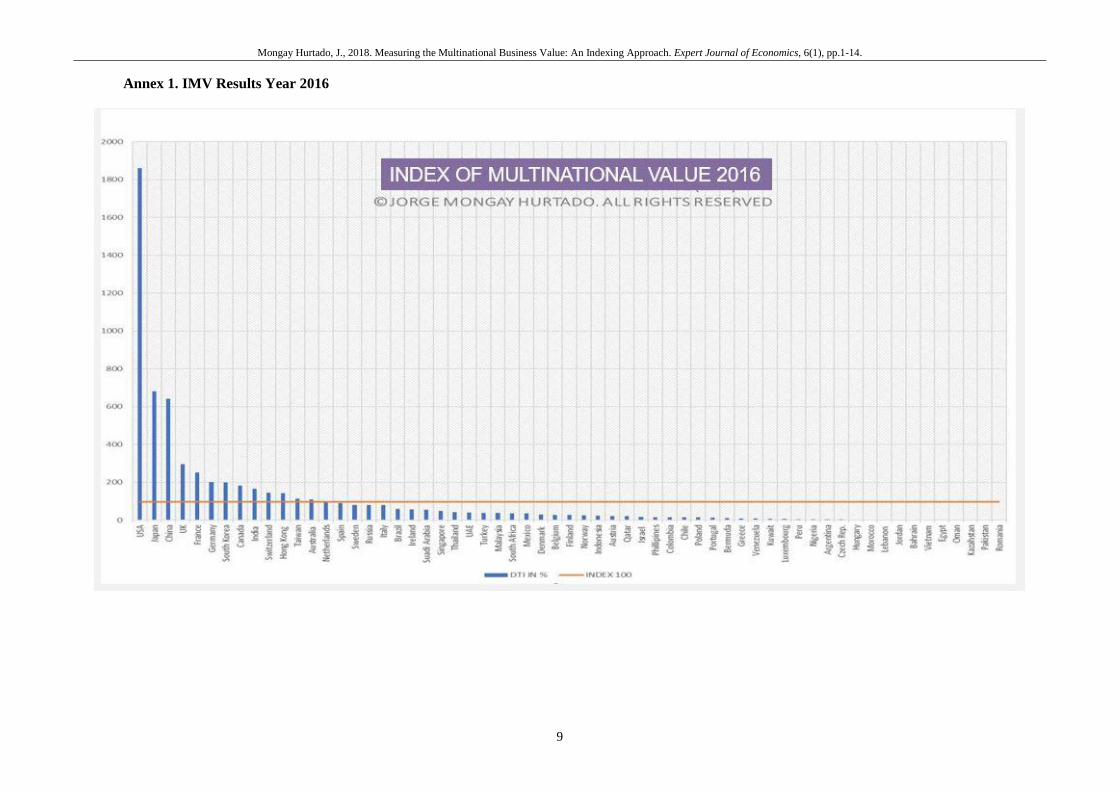
1.8. The ninth step refers to the Index of Multinational Value adjusted to population (IMV-p). We can
think that a country has more MNCs than the rest of the countries and this could be interpreted as a good sign
or as a sign of economic power but it is easy to understand that the wealth of these corporations come from a
country where population matters. So, this is a second interpretation of the index very valuable to better un-
derstand the impact of the economies in the MNCs and the global creation of wealth. If we take Switzerland
as an example we can see that its IMV general index is 142% (so the country performs above the average a
42%), this occurs because Switzerland has 11 companies more than the average number. But, when considering
population, the position of Switzerland improves a lot obtaining an Index adjusted to population (IMV-p) of
2.13, which means that the country performs a 213% above the average (which is represented here by zero (0).
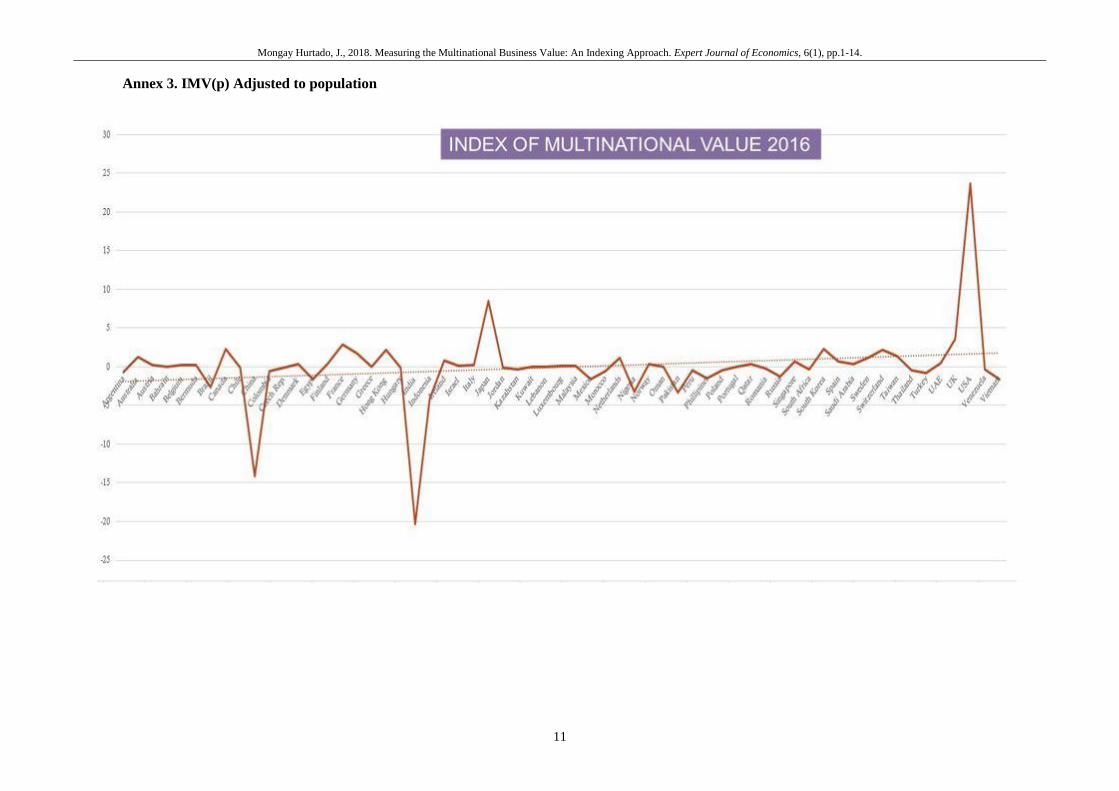
1.9. Finally, and after evaluating all industries and coding them according to the Harmonized System (HS)
codes we can state the contribution of each country of the list in terms of number of companies and value

Mongay Hurtado, J., 2018. Measuring the Multinational Business Value: An Indexing Approach. Expert Journal of Economics, 6(1), pp.1-14.
5
depending on its industry. Here, two big groups are made: Group 1: Industrial Corporations. All those corpo-
rations which operate in any industrial area manufacturing and selling products mainly, and Group
2. The Services and Financial Sector. It is used to HS code 16 to refer to “services”.
This analysis gives the possibility to understand the differences and contributions between the “productive
economy” of each country and its implications in the global arena and the “financial economy” or “services
economy”. The code 16 includes services, although most of the corporations in the list are included in the
financial industry.
4. Results of the Research and Index Values
Table 1. Results of the Index of Multinational Value
Country IMP(v)
VALUE
DTI IN
#COMP
INDEX ADJ
WITH
POPUL.
Index of penetration
% in companies in
services
Index of Penetration in
% in value of services
Argen-
tina
4.34242376 -30.623 -0.690861721 50 10.66260472
Australia 106.9268108 1.377 1.299086631 61.76470588 65.97692617
Austria 21.44092402 -24.623 0.194052254 62.5 63.45170247
Bahrain 1.987659315 -30.623 0.006295412 100 100
Belgium 28.08519617 -23.623 0.254449741 33.33333333 34.34997645
Bermuda 11.33726478 -27.623 0.180880903 80 82.3512252
Brazil 58.85257488 5.377 -2.651015786 15.78947368 40.40460804
Canada 178.5023897 69.377 2.235039191 22.54901961 50.18620421
Chile 15.10422644 -25.623 -0.067736247 57.14285714 45.28136632
China 627.7894616 158.377 -14.14155027 49.7382199 59.17491123
Colombia 15.34234869 -27.623 -0.596652783 80 73.59344686
Czech
Rep.
3.88933004 -31.623 -0.119868739 0 0
Denmark 29.24934938 -22.623 0.370880662 20 25.29398462
Egypt 1.898363472 -31.623 -1.64540332 100 100
Finland 27.50642682 -24.623 0.346522363 37.5 50.22243597
France 247.2833393 27.377 2.851621691 43.33333333 42.58392403
Germany 196.5037701 15.377 1.742382739 39.58333333 35.40628787
Greece 9.825849956 -26.623 -0.03389147 83.33333333 90.94580949
Hong
Kong
140.9352979 14.377 2.134930903 55.31914894 52.98024124
Hungary 3.707431101 -30.623 -0.107497608 50 46.83318466
India 162.7830141 24.377 -20.39455798 56.14035088 52.71840715
Indonesia 22.90603729 -26.623 -4.167686915 83.33333333 91.98671672
Ireland 57.06004352 -14.623 0.833780304 44.44444444 53.35304005
Israel 17.60781729 -23.623 0.139591886 88.88888889 68.51990984
Italy 77.80644432 -6.623 0.228835228 73.07692308 67.33826405
Japan 666.6629184 189.377 8.506869073 40.99099099 36.60802873
Jordan 2.103413185 -31.623 -0.132891229 100 100
Kazahs-
tan
0.618456392 -31.623 -0.302744081 100 100
Kuwait 7.229656009 -28.623 0.045051715 100 100
Lebanon 2.923612037 -30.623 -0.057540849 100 100
Luxem-
bourg
7.170125447 -29.623 0.114189014 33.33333333 1.706642066
Malaysia 37.47118142 -19.623 0.058025664 61.53846154 62.37422771
Mexico 36.1019785 -21.623 -1.63963548 36.36363636 40.12458776
Morocco 3.108818229 -29.623 -0.563942282 100 100
Nether-
lands
91.7498248 -10.623 1.179601075 45.45454545 41.08932305
Nigeria 5.152700852 -28.623 -3.196551781 100 100
Norway 25.06898104 -24.623 0.311191911 50 52.24274406
Oman 1.726386293 -31.623 -0.051840568 100 100
Pakistan 0.585383858 -30.623 -3.375147039 50 97.74011299

Mongay Hurtado, J., 2018. Measuring the Multinational Business Value: An Indexing Approach. Expert Journal of Economics, 6(1), pp.1-14.
6
Country IMP(v) VA-
LUE
DTI IN
#COMP
INDEX ADJ
WITH PO-
PUL.
Index of penetration
% in companies in
services
Index of Penetration in
% in value of services
Peru 5.159315359 -30.623 -0.469710172 100 100
Phillipi-
nes
15.38534298 -24.623 -1.555439837 37.5 34.35081685
Portugal 12.8982884 -27.623 0.029666243 40 17.48717949
Qatar 21.25902508 -23.623 0.295928752 88.88888889 86.37212197
Romania 0.492780762 -31.623 -0.278475919 100 100
Russia 78.07433184 -8.623 -1.22077027 20.83333333 18.850341
Singapore 48.71253585 -16.623 0.683691908 66.66666667 69.98067693
South
Africa
36.25411216 -21.623 -0.39253726 56.25 68.21237015
South
Korea
195.5876609 33.377 2.262482204 45.45454545 54.01386608
Spain 89.17016712 -6.623 0.634505363 45.45454545 36.40575593
Saudi
Arabia
53.05826686 -11.623 0.285622496 57.69230769 58.11512499
Sweden 79.0929659 -10.623 1.098834175 45.45454545 52.61969475
Switzer-
land
142.228434 11.377 2.13661059 52.27272727 51.03360074
Taiwan 110.8161409 13.377 1.372315843 41.30434783 42.47172233
Thailand 42.28323517 -17.623 -0.50744903 46.66666667 45.81149785
Turkey 38.09625232 -21.623 -0.775803444 81.81818182 75.98749891
UAE 40.35510642 -17.623 0.486028802 86.66666667 89.01819374
UK 290.0494335 55.377 3.517036286 54.54545455 49.12144673
USA 1819.105143 516.377 23.61448683 43.35154827 41.51208559
Venezuela 9.124712228 -28.623 -0.402819427 100 100
Vietnam 1.924821499 -29.623 -1.610447928 100 100
4.1. Comments of the Results
Only 13 countries out of the 61 represented are above the average, these ones are as follows: Australia,
Canada, China, France, Germany and Hong Kong, India, japan, South Korea, Switzerland, Taiwan, UK and
USA. It is important to state that the USA is the most important country in the list with 18 times (18X) the
average followed by Japan and China which have a value of 6X the average.
Also, it is important to mention a group of three countries which are in the average or very close to it
as Sweden, Netherlands and Spain. The rest 45 countries perform below the average.
1.10. Analysis of Cultural Clusters and Trading Blocs
Table 2. Results split by Trading Blocs.
Trading
Bloc
number
Trading
Bloc
Results re-
spect the in-
dex 100%
Countries represented
1 NAFTA 692.65% Canada, USA, Mexico
2 EU27 56.62% Austria, Belgium, Czech. Republic, Denmark, Finland, France, Germany,
Greece Hungary, Ireland, Italy, Luxembourg, Netherlands, Poland, Portugal,
Romania, Spain, Sweden.
3 Mercosur 32.2% Argentina, Brazil
4 ASEAN 28.72% Indonesia, Philippines, Thailand, Singapore, Malaysia, Vietnam
2. Rest of
the world
90.54% Australia, Bahrain, Bermuda, Chile, China, Colombia, Egypt, Hong Kong,
India, Israel, Japan, Jordan, Kazakhstan, Kuwait, Lebanon, Morocco, Nige-
ria, Norway, Oman, Pakistan, Peru, Qatar, Russia, South Africa, South Ko-
rea, Saudi Arabia, Switzerland, Taiwan, Turkey, UAE, UK, Venezuela.

Mongay Hurtado, J., 2018. Measuring the Multinational Business Value: An Indexing Approach. Expert Journal of Economics, 6(1), pp.1-14.
7
Table 3. Results based on cultural cluster
Cluster
number
Cluster de-
nomination
Average results of all participating countries
in the cluster respect the index 100%
Countries represented
1 South Asia 48.38% India, Indonesia, Malaysia, Philippines,
Singapore, Thailand, Vietnam
2 Latino Ameri-
can
21.02% Argentina, Brazil, Chile, Colombia, Mexico,
Peru, Venezuela.
3 Nordic 41.10% Sweden, Finland, Denmark, Norway.
4 Anglo 501% Australia , Canada, Ireland, UK, USA
5 Germanic 112.98% Austria, Germany, Netherlands, Switzerland.
6 Latino Euro-
pean
80.52% Belgium, France, Israel, Italy, Portugal
Spain.
7 African 21.15 Nigeria, South Africa.
8 Eastern Euro-
pean
26.32% Greece, Kazakhstan, Poland, Russia
9 Middle East 12.33% Bahrain, Egypt, Jordan, Kuwait, Lebanon,
Morocco, Oman, Qatar, Turkey, UAE
10 Confucian
Asia
355.93% China, Hong Kong, Japan, South Korea, Tai-
wan
5. Limitations of the index
The index is limited to the Forbes 2000 Global list of MNCs. It does not take into account neither other
MNCs operating in the global market nor small and medium sized companies (SMEs) which operate interna-
tionally. Implicitly the “value” of the companies it is expressed in the original list taking into consideration
the 4 variables: sales, profits, market value and assets but does not take into account other potentially strategic
issues which could contribute to the idea of value, as for example, business core, source of the competitive
advantage or evolution of markets.
6. Conclusions
The study reveals some interesting issues as:
1st: Only, only 61 countries out of the 198 nations-state in the world have presence in the analyzed list
of the largest MNCs meaning this just a 30% of the total countries in the world.
2nd, According to the distribution of the trading zones, NAFTA presents results in value 7 times higher
value than the average, while the group of countries (pushed by the USA mainly), “Rest of the World category”
represented by a total of 32 countries covers 90% of the index, while the 18 countries of the EU covers only
56%, so less participation than expected of the EU-27, which questions today´s hegemony of the EU as one of
the Top 3 top territories of GDP ( together with USA and China). It will be important to follow its evolution
longitudinally in the future.
3rd, Two cultural clusters dominate the multinational value and the index. The “Anglo” cluster, repre-
sented by only 5 nations is five times higher than the average and the “Confucian Asian” cluster which is 3.5
times higher with also only 5 countries. Two other clusters are significant but at a lower level, these are the
Latino-European (90% of the index) and Germanic (112%).
3rd, The Global index of value obtained is dominated by only 11nations which perform significantly
above the average 4 of them are in the European Space (Germany, France, Switzerland and UK), 2 of them are
in North America ( USA and Canada) , and others in Asia (China, India, Japan and South Korea) and Australia.
4th, If we analyze the same index adjusted to population some the values change significantly, for
example we can see that India and China disappear from the list and Sweden goes to the top, suggesting that
still there is a lot of potentiality for improvement in countries with high population and that population does
not always contribute to the development and sustainability of the value of MNCs. The scores of small nations
as Switzerland or Singapore explain that MNCs, their value and number is still important in the international
arena questioning the growth of the highly populated countries.
5th) According to the results related to the penetration of services and financial corporations we have
to state that 61.80% of the total MNCs operate in this sector.

Mongay Hurtado, J., 2018. Measuring the Multinational Business Value: An Indexing Approach. Expert Journal of Economics, 6(1), pp.1-14.
8
References
Cavusgill, S.T., 1997. Measuring the potential of emerging markets: An indexing approach. Business Horizons.
Volume 40, Issue 1, pp.87-91.
Cornell University, INSEAD and the World Intellectual Property Organization, 2017. The Global Innovation
Index. [online] Available at: https://www.globalinnovationindex.org/ [Retrieved in December 12th,
2017].
Fitch ratings, 2017. Retrieved in December 6th, 2017 from the website https://www.fitchratings.com/site/home
Ghemawat, P. and Altman S.A., 2016. The DHL Global Connectedness Index 2016. [online] Available at:
http://www.dhl.com/content/dam/downloads/g0/about_us/logistics_in-
sights/gci_2016/DHL_GCI_2016_full_study.pdf [Retrieved in December 10th, 2017].
Gini, C., 1921. Measurement of Inequality of Incomes. The Economic Journal, 31(121), pp.124-126.
Hofstede, G., 2017. The &-D model of national culture. [online] Available at: http://geerthofstede.com/culture-
geert-hofstede-gert-jan-hofstede/6d-model-of-national-culture/ [Retrieved in December 6th 2017].
LetterOne Investments, 2017. Global Perspectives. Indigo Score. [online] Available at: http://global-perspec-
tives.org.uk/indigo-score/map/ [Retrieved in December 7th, 2017].
Nowotnik, D. and Razniak, P., 2015. Pozycja gospodarcza miast Europy Środkowo-Wschodniej na tle świata
/ The Economic Position of Central-Eastern European Cities Against the Background of the World.
International Economics, issue 9, pp. 23-39.
OECD, 2016. OECD Ratings 2016. [online] Available at: http://www.oecd.org/tad/xcred/crc.htm [Retrieved
in December 6th, 2017].
OECD, 2017. The FDI Regulatory Restrictiveness Index (FDI Index) [online] Available at:
http://www.oecd.org/investment/fdiindex.htm [Retrieved in December 20th, 2017].
Peng, S.-S., Huang, D.-S., Yang, T.-H. and Sun, Y.-C., 2016. Who's in the Forbes Global 2000? The Role of
Home Market, Multinational Firms and Economic Development. Review of Development Economics,
20(1), pp. 101-112.
Standard and Poor´s, 2017. S&P Global Ratings. [online] Available at:
https://www.standardandpoors.com/en_US/web/guest/home [Retrieved in December 12th, 2017].
The Heritage Foundation 2017. Index of Economic Freedom. [online] Available at: https://www.herit-
age.org/index/ [Retrieved in December 15th, 2017].
The World Bank Group, 2017. Doing Business report 2017. [online] Available at: www.doingbusiness.org
[Retrieved in November 8th, 2017].
The World Economic Forum, 2017. The Global Competitiveness Report 2017-2018. [online] Available at:
https://www.weforum.org/reports/the-global-competitiveness-report-2017-2018 [Retrieved in De-
cember 15th, 2017].
Transparency International, 2017. Transparency International. [online] Available at: www.transparency.org
[Retrieved at December 10th, 2017].
United Nations, 2017. UN data, a world of information, 2017. [online] Available at: http://data.un.org/ [Re-
trieved in December 22nd, 2017].
Wiegand, M. and Nadarajah, S., 2018. New composite distributions for modeling industrial income and wealth
per employee. Physica A: Statistical Mechanics and its Applications, 492, issue C, pp. 1901-1908.
Mongay Hurtado, J., 2018. Measuring the Multinational Business Value: An Indexing Approach. Expert Journal of Economics, 6(1), pp.1-14.
9
Annex 1. IMV Results Year 2016

Mongay Hurtado, J., 2018. Measuring the Multinational Business Value: An Indexing Approach. Expert Journal of Economics, 6(1), pp.1-14.
10
Annex 2. IMV(#c) number of companies
Mongay Hurtado, J., 2018. Measuring the Multinational Business Value: An Indexing Approach. Expert Journal of Economics, 6(1), pp.1-14.
11
Annex 3. IMV(p) Adjusted to population
Mongay Hurtado, J., 2018. Measuring the Multinational Business Value: An Indexing Approach. Expert Journal of Economics, 6(1), pp.1-14.
12
Annex 4. IMV related to services
Mongay Hurtado, J., 2018. Measuring the Multinational Business Value: An Indexing Approach. Expert Journal of Economics, 6(1), pp.1-14.
13
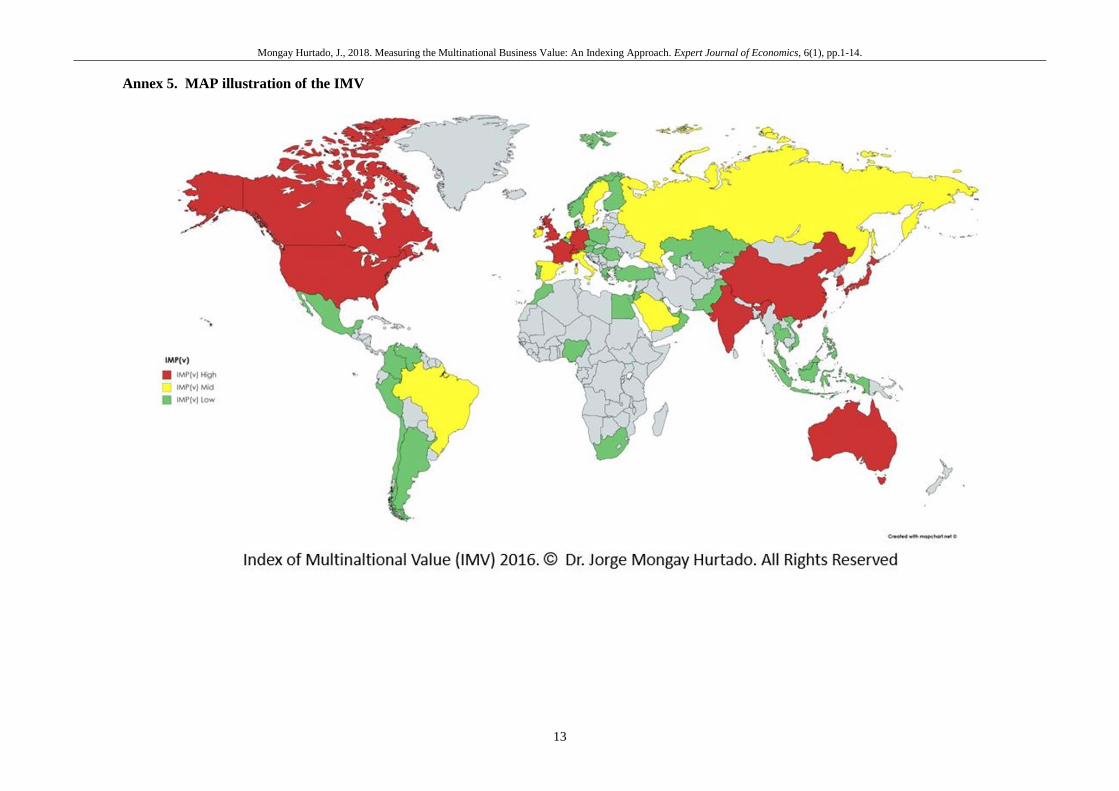
Annex 5. MAP illustration of the IMV

Mongay Hurtado, J., 2018. Measuring the Multinational Business Value: An Indexing Approach. Expert Journal of Economics, 6(1), pp.1-14.
14
Annex 6. Map illustration of the IMV (p) adjusted to population
Related Documents