Prof. Donna Kelley, Babson College United Nations Investment, Enterprise and Development Commission, Seventh Session Geneva, 22 April, 2015 Measuring the Impact of Entrepreneurship Policies

Welcome message from author
This document is posted to help you gain knowledge. Please leave a comment to let me know what you think about it! Share it to your friends and learn new things together.
Transcript

Prof. Donna Kelley, Babson College United Nations Investment, Enterprise and Development Commission, Seventh Session
Geneva, 22 April, 2015
Measuring the Impact of Entrepreneurship Policies
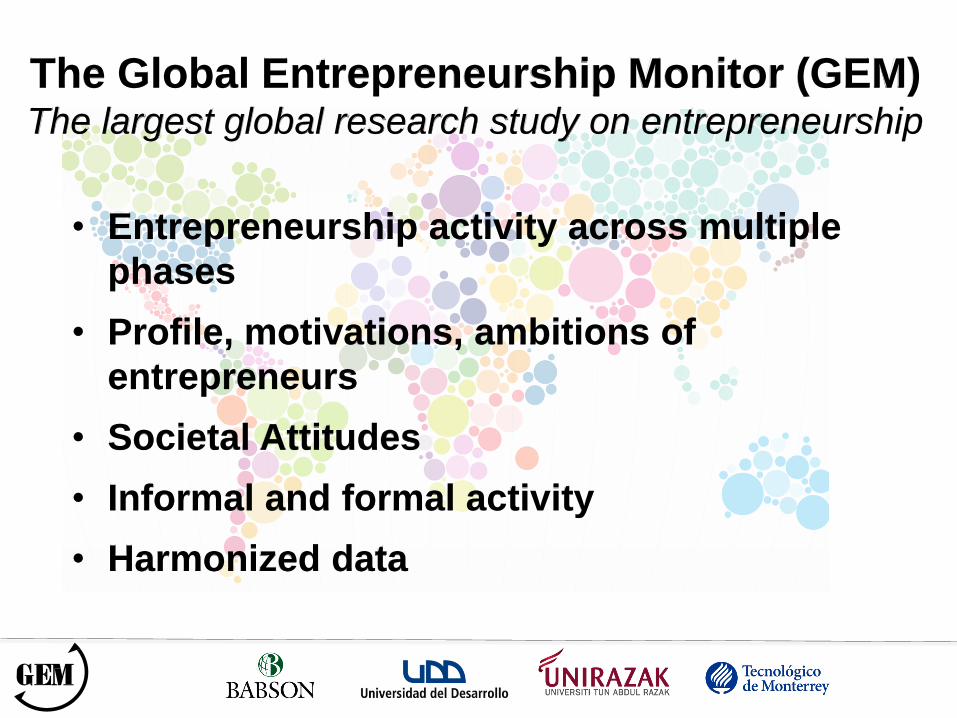
The Global Entrepreneurship Monitor (GEM) The largest global research study on entrepreneurship
• Entrepreneurship activity across multiple
phases
• Profile, motivations, ambitions of
entrepreneurs
• Societal Attitudes
• Informal and formal activity
• Harmonized data

In 2014, its 16th year, GEM surveyed 206,000 adults in 73 economies
with the collective effort of more than 500 researchers
72% of the world’s population - 90% of the world’s GDP
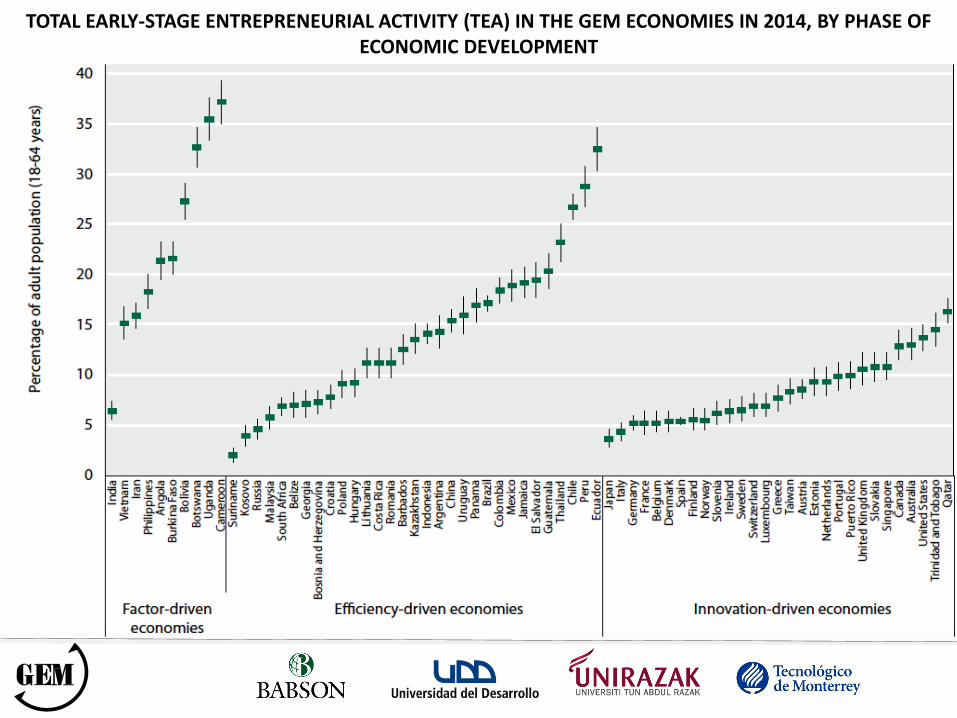
TOTAL EARLY-STAGE ENTREPRENEURIAL ACTIVITY (TEA) IN THE GEM ECONOMIES IN 2014, BY PHASE OF ECONOMIC DEVELOPMENT
While participation rates differ substantially, the quality and impact of entrepreneurship can have
marked impact on a society
Key indicators:
• Societal attitudes
• Participation across phases
• Motives
• Inclusiveness
• Potential impact

Perceptions about opportunities
0
10
20
30
40
50
60
70
80
90
Japan Singapore Slovenia Croatia Bosnia andHerzegovina
Greece Chile Cameroon Angola Sweden Uganda

Fear of Failure
0
10
20
30
40
50
60
70
Uganda Botswana Panama Suriname Trinidad &Tobago
Italy Belgium Vietnam Poland Japan Greece

Participation across phases
Intentions to start
Nascent Entrepreneurs
New Entrepreneurs
Established Entrepreneurs Discontinuance

The Entrepreneurship Pipeline
0
10
20
30
40
50
60
70
United Kingdom United States Philippines Colombia Qatar Botswana
Entrepreneurial intentions ** Nascent entrepreneur-ship rate Established business ownership rate

The Entrepreneurship Pipeline
0
10
20
30
40
50
60
70
United Kingdom United States Philippines Colombia Qatar Botswana
Entrepreneurial intentions ** Nascent entrepreneur-ship rate Established business ownership rate

The Entrepreneurship Pipeline
0
10
20
30
40
50
60
70
United Kingdom United States Philippines Colombia Qatar Botswana
Entrepreneurial intentions ** Nascent entrepreneur-ship rate Established business ownership rate

Necessity Entrepreneurship (% TEA)
0
10
20
30
40
50
60
Norway Suriname Denmark Sweden Guatemala Croatia Georgia Bosnia andHerzegovina

Female Participation (TEA)
0%
5%
10%
15%
20%
25%
30%
35%
40%
Sweden Hungary Romania Iran Vietnam El Salvador Philippines Uganda
MALE TEA (% of adult male population) FEMALE TEA (% of adult female population)

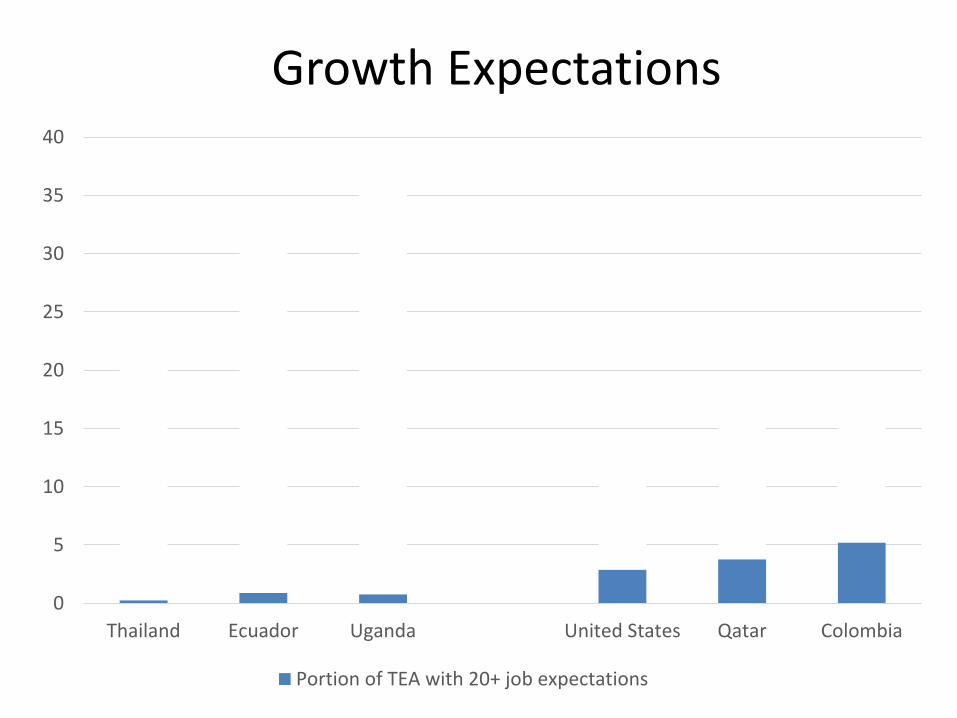
Growth Expectations
0
5
10
15
20
25
30
35
40
Thailand Ecuador Uganda United States Qatar Colombia
Portion of TEA with 20+ job expectations
Growth Expectations
0
5
10
15
20
25
30
35
40
Thailand Ecuador Uganda United States Qatar Colombia
Portion of TEA with 20+ job expectations

Implications for National Entrepreneurship Policy
• Acknowledge the multidimensional nature of entrepreneurship as the true vehicle for economic development and advancing societal wellbeing
• Mobilize societal wide proactive energy for entrepreneurship, which includes participation in multiple phases of the process and societal support
• Look more deeply into indicators of high quality entrepreneurship
• Explore further the link between the range of GEM indicators and policies and other influencing factors
• Ensure policies can lead to entrepreneurship that benefits all and that all can participate
• Make entrepreneurship education a lifelong competence

Related Documents