National Institute fr Public Health and the Environment Ministr of Health, Welfare and Sport Measuring the effect of Sustainable Public Procurement RIVM Report 2018-0069 M.C. Zijp | L. Kok | E. de Valk

Welcome message from author
This document is posted to help you gain knowledge. Please leave a comment to let me know what you think about it! Share it to your friends and learn new things together.
Transcript

National Institute for Public Health
and the Environment
Ministry of Health, Welfare and Sport
Measuring the effect of Sustainable Public Procurement
RIVM Report 2018-0069 M.C. Zijp | L. Kok | E. de Valk


Measuring the effect of Sustainable Public Procurement
RIVM Report 2018-0069
RIVM Report 2018-0069
Page 2 of 91
Colofon
© RIVM 2018 Parts of this publication may be reproduced, provided acknowledgement is given to: the National Institute for Public Health and the Environment (RIVM), along with the title of the publication and year of publication. DOI 10.21945/RIVM-2018-0069
M.C. Zijp (author), RIVM L. Kok (author), RIVM E. de Valk (author), RIVM Contact: Michiel C. Zijp (PhD) Sustainability, the Environment and Health [email protected] This study was commissioned by the Ministry of Infrastructure and Water Management, for the purposes of the SPP Action Plan 2015-2020 and within the Circular Economy Programme
This is a publication by: National Institute for Public Health and the Environment PO Box 1 3720 BA Bilthoven Netherlands www.rivm.nl/en

RIVM Report 2018-0069
Page 3 of 91
Synopsis
Measuring the effect of Sustainable Public Procurement Many purchasing services of the Dutch local and central governments, aim to include the effects of products and services on human health and the environment in the procurement process. Sustainable procurement (SP) encompasses more than just price and quality considerations. SP can result, for example, in reduced greenhouse emissions and more reuse and recycling (circular economy). RIVM presents a method to calculate the effect of SP. The method is tested and illustrated by application to eight product groups: company cars, business trips, contract transport (e.g. for scholars), transport services (e.g. taxis), occupational clothing, electricity, solar panels and gas. Analyses of the procurement activities of the government in 2015 and 2016 concerning these product groups showed that SP had a positive effect. For example, it resulted in a reduction in greenhouse gas emission of more than 4.9 megaton CO2 during the contract period of the supplied products and services. This is equivalent to the average annual emissions from transport and energy of more than 600,000 households. Other benefits due to SP were reduction in the emission of toxic substances, more recycling and job opportunities for people with a distance to the labour market. At the same time, the RIVM analysis shows that SP is not always applied. Furthermore, the ambition with which SP is applied differs strongly between tenders. Applying SP does not guarantee effect because minimum demands are not always more stringent than what is available on average on the market. Furthermore, these demands and criteria are not always included in the final contracts. The analyses show that calculation of the effect of SP is already possible with basic data (such as driven distance and type of car) but often this is data is not currently available. Governments who would like more insight into the effect of their efforts to purchase in a sustainable way are recommended to administrate this data along the procurement process. Furthermore, for different product groups a database with generic information on the impact of products and materials over their entire life cycle is required. This way, possible trade-offs in the supply and consumption chain can be included. Keywords: sustainable procurement, Green Public Procurement, circularity, biobased, Social Return, social international, climate change, impact assessment, circular economy

RIVM Report 2018-0069
Page 4 of 91
RIVM Report 2018-0069
Page 5 of 91
Publiekssamenvatting
Het effect van Maatschappelijk Verantwoord Inkopen Veel inkopers bij overheidsorganisaties doen hun best om bij de aankoop van diensten en producten rekening te houden met mogelijke effecten op mens en milieu. Met Maatschappelijk Verantwoord Inkopen (MVI) wordt dus niet alleen naar de prijs van een product gekeken. MVI kan bijvoorbeeld helpen de uitstoot van broeikasgassen te beperken en bijdragen aan meer hergebruik van materialen (circulaire economie). Het RIVM presenteert een manier om te berekenen welke effecten deze inspanningen hebben. Deze werkwijze is gebruikt om acht productgroepen te analyseren: Dienstauto’s, Buitenlandse dienstreizen, Contractvervoer (voor bijvoorbeeld leerlingen), Transportdiensten (taxi’s en post), Bedrijfskleding, Elektriciteit, Zonnepanelen en Gas. De analyse van de overheidsinkopen in 2015 en 2016 laat zien dat MVI bij de acht productgroepen een positief effect heeft. Zo wordt er in totaal minstens 4,9 megaton minder koolstofdioxide uitgestoten tijdens de contractperiodes en gebruiksduur van de diensten en producten. Ook was er winst te zien door onder andere minder uitstoot van schadelijke stoffen, recycling en werkgelegenheid voor mensen met een afstand tot de arbeidsmarkt. Tegelijkertijd laat de analyse zien dat MVI niet altijd wordt toegepast en dat de mate waarin MVI wordt toegepast varieert. Daarnaast blijkt het meenemen van MVI in een aanbesteding geen garantie voor effect. Dit komt doordat niet alle minimumeisen beter zijn dan wat er gemiddeld op de markt beschikbaar is én doordat eisen en gunningscriteria niet altijd in de uiteindelijke contracten terechtkomen. De gepresenteerde werkwijze laat zien dat al met relatief eenvoudige informatie (zoals het aantal gereden kilometers) het effect van MVI kan worden berekend, maar dat deze informatie vaak ontbreekt. Aanbestedende diensten die willen weten wat het effect is van hun MVI-inspanning, wordt daarom aanbevolen deze informatie parallel aan het inkoopproces te gaan verzamelen en administreren. Voor verschillende productgroepen is het raadzaam een database te gaan ontsluiten en gebruiken die aangeeft in welke mate een product het milieu belast in haar hele levenscyclus. Zo’n Life Cycle Assessment (LCA) maakt inzichtelijk of, en in welke mate, de last op andere onderdelen van de productie- en consumptieketen wordt afgewend. De Nederlandse versie van het rapport vindt u hier: https://rivm.nl/Documenten_en_publicaties/Wetenschappelijk/Rapporten/2018/februari/Het_effect_van_Maatschappelijk_Verantwoord_Inkopen Kernwoorden: Maatschappelijk Verantwoord Inkopen, evaluatiemethode, duurzaam, milieuvriendelijk, circulair, biobased, social return, sociaal internationaal, klimaat, inkopen, circulaire economie

RIVM Report 2018-0069
Page 6 of 91
RIVM Report 2018-0069
Page 7 of 91
Contents
Summary — 9
Glossary of terms — 11
1 Introduction — 13 1.1 Why is a report on the effect of SPP necessary? — 13 1.2 Purpose of this report — 14 1.3 Reading guide — 14
2 Introduction to Sustainable Public Procurement — 15
3 Conditions for the evaluation of the effect of SPP — 19 3.1 What has to be measured? — 19 3.2 Technical conditions — 20
4 The method — 23 4.1 A brief description — 23 4.2 Specifications per step — 24 4.2.1 Definition of the product group — 24 4.2.2 Sampling — 25 4.2.3 Examining the texts of the tenders — 25 4.2.4 Interaction with the contracting authority — 26 4.2.5 Quantification of the SPP effect — 26 4.2.6 Extrapolation — 28
5 Results per step — 29 5.1 Selection of the product group — 29 5.2 Sampling — 29 5.3 Examining the texts of the tenders — 30 5.4 Interaction with the contracting authority — 33 5.5 Quantification of the SPP effect — 34
6 Validation of results — 39
7 Using and improving the method — 41 7.1 Automate the examination of the tender texts — 41 7.2 The measurement of effect by contracting authorities — 41 7.3 Collecting data and making it readily accessible — 42 7.4 Improve sample — 43 7.5 Incorporating social effect — 43 7.6 Action plan — 44
8 Conclusions — 45 8.1 Method for measuring the effect of SPP — 45 8.2 Positive effect due to the use of SPP — 45 8.3 Using and improving the method — 46 8.4 Conclusion — 47
Acknowledgements — 49

RIVM Report 2018-0069
Page 8 of 91
References — 51
Annex 1 Bottlenecks and success factors in the public procurement process — 55
Annex 2 Step 3 score table ‘Examining the tender text’ — 57
Annex 3 Product group Business trips abroad — 58
Annex 4 Product group Official cars — 61
Annex 5 Product group Contract transport and Transport services — 66
Annex 6 Product groups Energy (Electricity, Solar panels and Gas) — 72
Annex 7 Product group Occupational clothing — 87

RIVM Report 2018-0069
Page 9 of 91
Summary
Insight into the effect of Sustainable Public Procurement (SPP) is useful for the evaluation of the government's SPP policy – at both national and organisational levels. SPP means that functionality and price are not the only criteria considered when items are procured, but that the effect of the procurement in question on humans and the environment far away, as well as in the immediate vicinity, is also examined. SPP can be divided into a number of themes. Green Public Procurement, for example, entails taking into account the use and emission of toxic substances and greenhouse gases; circular procurement takes into account the exhaustion of raw materials by promoting reuse and recycling and biobased procurement contributes to the transition to the use of renewable sources instead of finite raw materials. SPP also takes social aspects into account. It does so both internationally by, for example, preventing slave labour, and locally by, for example, creating jobs for people with a distance to the labour market. This report presents a method that can be used to measure the effect of SPP per product group. Because the analysis of all the tenders annually issued per product group is not feasible, a sample is taken from each product group. The effect of SPP will therefore first be determined for a selection of tenders and conclusions will subsequently be drawn for the entire product group. This method has been applied to eight product groups, namely: Electricity, Gas, Solar Panels, Official Cars, Transport Services, Contract Transport, Business Trips and Occupational clothing. The results illustrate that, in 2015 and 2016, the principles of SPP were applied in all eight product groups. This was the case in all the tenders in the product groups Contract Transport and Transport Services and in seven to nine out of ten tenders in other product groups. SPP played a role in a total of 80% of the tenders in question. The procuring organisations usually set minimum requirements but more stringent requirements or award criteria are applied in 39% of the tenders. The use of these criteria and requirements ultimately leads to a reduction in impact on the environment. At least 4.9 megatonnes CO2 equivalent emission is, for example, estimated to have been avoided by the application of SPP when issuing tenders in these product groups in 2015 and 2016. This is equivalent to the average annual emission through transport and energy of more than 600,000 households. The effect of circular procurement for these product groups in this period was still limited. So far, it has not been possible to quantify the effect of circularity for occupational clothing because basic data, such as the number of garments procured under the contracts in question, were frequently not available. Biobased procurement led to the avoidance of the use of 13,000 tonnes oil equivalent of fossil raw material through the use of vehicles running on biogas instead of diesel. This is equivalent to an average private car filling up with diesel 250,000 times. The SPP-themes Social Return and Social conditions in global supply chains (hereinafter referred to as 'Social International') are regularly incorporated in tenders. The effect of these two themes has not been calculated in this study. Incorporating SPP does not always guarantee an

RIVM Report 2018-0069
Page 10 of 91
effect, as was apparent in the case of occupational clothing. In this product group, Green Public Procurement had an effect in fewer than half of the cases. This is because the minimum requirements are not necessarily more environmentally friendly than what is available on the market and because requirements and award criteria are not always included in the final contracts. The variation of tenders within product groups is not known, which is why there is currently no solid basis for a statistically correct extrapolation. The results of the current extrapolation must therefore be seen as orders of magnitude. In other words, the estimate of the magnitude of the effects is not absolute, but gives an indication of the effect. The results for the first eight product groups show that SPP leads to a positive effect in all the product groups. Moreover, they provide insight into the differences between product groups and within product groups. This, in turn, yields possibilities for implementing SPP in practice: the next step in the policy cycle. The method presented can be enhanced by applying it to product groups that are expected to show other types of SPP effects, such as buildings and catering. In the building sector, for example, there will probably be adequate information available to provide insight into the effect of incorporating circularity in the tenders awarded. The method will also benefit from linkage with the SPP Self-Evaluation Tool (MVIZET). This will be launched, in phases, from December 2017 onwards and is compatible with the first three steps of the method described in this report. Finally, stipulating the provision of data in contracts or even in the minimum requirements in tenders is recommended. This is, for instance, already common practice in tenders for business trips abroad. These data are available but they are not collected in a structured way. They comprise, for example, the number of kilometres driven in a contract for transport services, or the number and weight of garments delivered under a contract for the delivery of occupational clothing.

RIVM Report 2018-0069
Page 11 of 91
Glossary of terms
Biobased procurement: Procurement of a product or service in which criteria and/or requirements relating to the replacement of fossil raw materials with renewable raw materials (= biobased raw materials) are used. Circular procurement: Procurement of a product or service in which criteria and/or requirements relating to optimal and effective (re)use of raw materials and products are incorporated. CPV (Common Procurement Vocabulary) code: The classification system for products, works, deliveries and services specifically for public procurement used in TenderNed (the Dutch government's online tendering system). Criteria documents: Documents drawn up by PIANOo that include minimum requirements, possible award criteria and other recommendations relating to SPP for various product groups. More ambitious requirements: Requirements that a procuring organisation can include in a tender in addition to the minimum requirements. Award criteria: Wishes specified by the procuring organisation that may be advantageous for tendering suppliers who take them into account. Procurement process: The process in which the need for a specific product or service is identified, the tender takes place and the procurement is realised. Social conditions in global supply chains: Conditions on (global) human rights and labour laws that can be incorporated in tenders. Sustainable Public Procurement: Procurement in which, besides the price of the products, services or works, attention is also paid to the impact of the procurement on the environment and social aspects (www.pianoo.nl; 08-12-2017). Environmental criteria documents: Documents drawn up by PIANOo that include minimum requirements, possible award criteria and other recommendations relating to SPP for various product groups. Green Public Procurement: Procurement in which attention is paid in the tender to environmental factors such as biodiversity, climate, water and nature. Minimum requirements: The minimum requirements a product, service or work must comply with.
RIVM Report 2018-0069
Page 12 of 91
SPP themes Themes that are fall under SPP, namely Social Return, Social conditions in global supply chains, Green Public Procurement, biobased procurement, circular procurement, opportunities for small and medium-sized enterprises (SMEs), Public procurement of innovation. CSR: Corporate Social Responsibility. Taking environmental and social aspects into account in business operations. PIANOo: The Dutch Public Procurement Expertise Centre, which supports public procurers in implementing SPP: www.pianoo.nl. Social Return: The creation of workplaces for people with a distance to the labour market, for instance, persons receiving unemployment benefit or young and older people with a disability). TenderNed: ‘A fully digital tendering system that leads contracting authorities and enterprises step by step through the tendering process’ (https://www.tenderned.nl/cms/over-tenderned; 08.12.2017).

RIVM Report 2018-0069
Page 13 of 91
1 Introduction
1.1 Why is a report on the effect of SPP necessary? Central and decentralised government bodies in the Netherlands jointly procure services and products worth more than 73 billion annually (Ministry of Economic Affairs, 2016). The different government organisations have agreed to incorporate sustainability in all their procurement activities as from 1 January 2015. Sustainable Public Procurement (SPP) is a policy instrument for (Rijksoverheid 2015):
• spending tax money well; • encouraging the business community to develop and deliver
sustainable products and services; • contributing to policy goals such as climate targets, the
government-wide circular economy programme and the United Nations' global Sustainable Development Goals;
• showing a good example to other contracting authorities. Insight into the effect of a policy instrument is always useful and SPP's contributions to reductions in the emission of greenhouse gases and transition to a circular economy are of particular interest. This insight can help us to determine:
a) whether the instrument has achieved its intended objectives; b) whether it is worthwhile continuing to invest in the instrument; c) or whether the instrument can be improved on.
This is why the effect of SPP will be monitored in response to the question in the SPP Action Plan 2015-2020 discussed in the Dutch House of Representatives (Rijksoverheid 2015) and as a part of the SPP manifesto, with which various contracting authorities undertake to set out their SPP ambitions in more concrete terms and measure the achievement of their goals (Manifest, 2016). Evaluations of SPP have already been carried out in the past. They primarily comprised process evaluations in the Netherlands (for example, Ecorys 2013; Telos & VNG 2016, De Groene Zaak 2015, KPMG 2011), and in other EU countries (for example, Ecoinstitut, 2015; Konkurrensverket, 2017). There are, however, also examples of studies focusing on avoided impact on the environment, such as the Sustainable transport procurement benchmark (Natuur & Milieu, 2016). This study determines the effect of tenders by municipalities for transport on the emission of greenhouse gases, NOx and particulate matter. The participating municipalities were subsequently listed in order of the magnitude of impact avoided. Another example is the policy evaluation of sustainable procurement carried out in 2012, in which the RIVM estimated the effect of the application of the then prevailing minimum requirements for SPP (RIVM, 2013). Here it was assumed that the minimum requirements that prevailed at the time were applied in all government tenders. SPP is, however, expected to yield much greater benefits in tenders that go further than the minimum requirements by making use of more stringent requirements and award criteria (Zijp and De Zwart, 2014).
RIVM Report 2018-0069
Page 14 of 91
1.2 Purpose of this report This report describes a method for evaluating the effect of SPP and illustrates its use by applying it to eight product groups. The method can be used in the policy evaluation of SPP and briefings on it to the Dutch House of Representatives. Furthermore the approach paves the way for effect assessments by contracting authorities.
1.3 Reading guide An understanding of the various phases of the procurement process and the instruments available to procurers for implementing SPP, such as the minimum requirements and award criteria, is useful for those reading this report. These phases and instruments are therefore explained in chapter 2. Readers who already have this basic knowledge can start with chapter 3. Chapter 3 discusses the preconditions for developing a successful method. Chapter 4 presents the method and describes its steps. Chapter 5 contains the results of the application of the method on eight product groups. Although the method is described before its application on the product groups is presented, the latter has contributed to its development. The details of the application of the method to each of the product groups are given in annexes 3 to 7 of this report. Chapter 6 contains the results of a few small tests carried out to validate the outcomes. Chapter 7 provides insight into possibilities for the further development of the method and its application for policy evaluation by contracting authorities at a national and local level. Chapter 8 summarises the conclusions. Finally, annex 1 contains an analysis of success and failure factors for SPP. This is not an exhaustive list, but it has been added as a by-product of the contacts that have taken place with the contracting authorities concerned.

RIVM Report 2018-0069
Page 15 of 91
2 Introduction to Sustainable Public Procurement
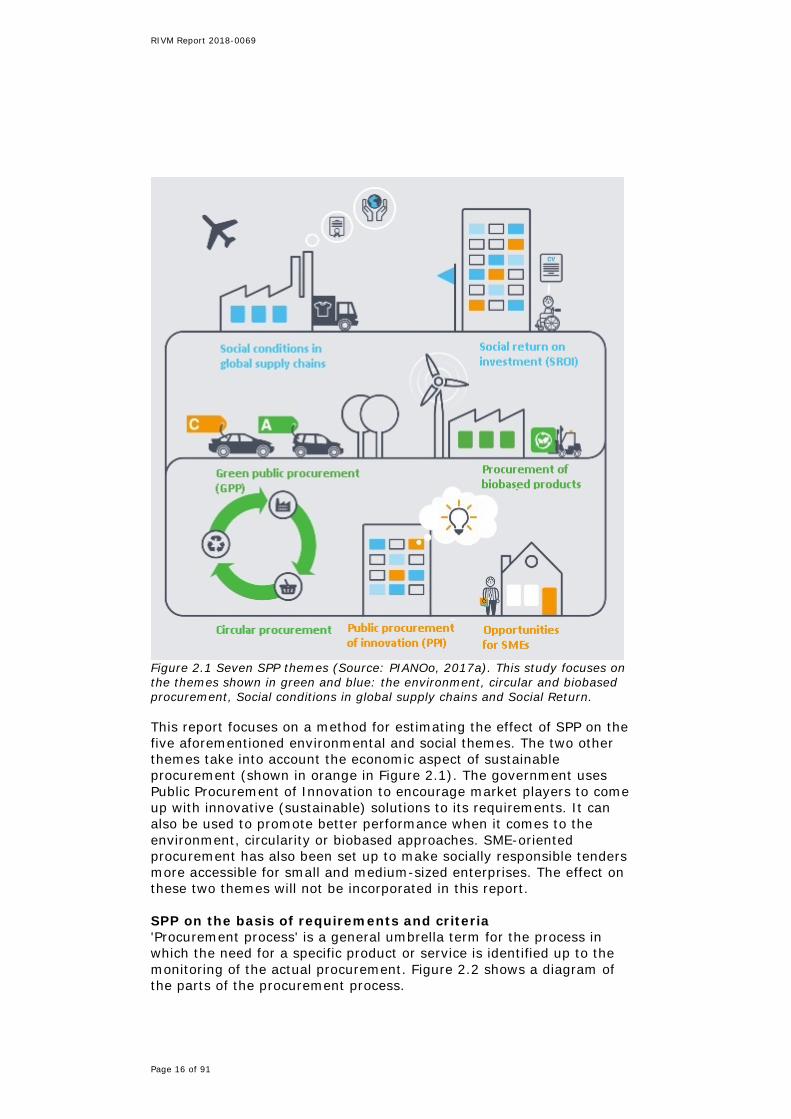
This chapter is based on chapter 2 of the report 'Tools voor Maatschappelijk Verantwoord Inkopen (Tools for Sustainable Public Procurement)' (Kok and Zijp, 2016, in Dutch). SPP: a combination of seven themes SPP is an umbrella term for policy that focuses on procurement with a broader ambition than merely financial costs. PIANOo, the Dutch Public Procurement Expertise Centre, supports public procurers in implementing SPP. The centre distinguishes between seven themes: Green Public Procurement (formerly sustainable procurement), circular procurement, biobased procurement, SME-oriented procurement, Public Procurement of Innovation, Social Return and procurement in accordance with Social conditions in global supply chains (PIANOo, 2017a). These are termed the 'SPP themes'. Green, circular and biobased procurement are all about taking the impact on the environment into account, for example in the fields of climate, raw materials, water, soil, nature and biodiversity (the themes shown in green in Figure 2.1). Circular and biobased procurement are, as it were, a specific way of Green Public Procurement. In the case of circular procurement, the emphasis is on dealing effectively with raw materials; it is characterised by the optimum reuse of products and raw materials. Biobased procurement focuses on the use of raw materials made from renewable materials and can be seen as part of the circular economy (Netherlands Enterprise Agency, n.d.). In the case of Social Return, the creation of workplaces for people with a distance to the labour market, for instance, persons receiving unemployment benefit or (young) people with a disability. This can be realised by, for example, making agreements on the number of jobs, apprenticeships and/or internships for people with a distance to the labour market. And by taking the theme of Social conditions in global supply chains into account in the procurement process, the violation of human rights and labour laws (such as forced labour and child labour) can be combatted. These two themes focus on the social component of SPP (the themes shown in blue in Figure 2.1).
RIVM Report 2018-0069
Page 16 of 91
Figure 2.1 Seven SPP themes (Source: PIANOo, 2017a). This study focuses on the themes shown in green and blue: the environment, circular and biobased procurement, Social conditions in global supply chains and Social Return. This report focuses on a method for estimating the effect of SPP on the five aforementioned environmental and social themes. The two other themes take into account the economic aspect of sustainable procurement (shown in orange in Figure 2.1). The government uses Public Procurement of Innovation to encourage market players to come up with innovative (sustainable) solutions to its requirements. It can also be used to promote better performance when it comes to the environment, circularity or biobased approaches. SME-oriented procurement has also been set up to make socially responsible tenders more accessible for small and medium-sized enterprises. The effect on these two themes will not be incorporated in this report. SPP on the basis of requirements and criteria 'Procurement process' is a general umbrella term for the process in which the need for a specific product or service is identified up to the monitoring of the actual procurement. Figure 2.2 shows a diagram of the parts of the procurement process.

RIVM Report 2018-0069
Page 17 of 91
Figure 2.2 Schematic overview of terms commonly used in the procurement process. Based on various sources, including PIANOo (2017c). In the specification phase, the procurer can apply SPP by including SPP requirements and/or criteria in the tender. These requirements and criteria relating to the various SPP themes form the starting point for the method presented in this report. This is further explained in the next chapter. PIANOo has established 'environmental criteria documents' for 46 different product groups. Products must at least comply with the minimum requirements in these documents. Currently, the minimum requirements focus primarily on Green Public Procurement. Recommendations, suggestions and award criteria may also be included in the criteria documents, depending on the product group. Award criteria are wishes specified by the procuring organisation that can be advantageous for tendering suppliers who take them into account. Points are allocated to the tenders submitted based on predetermined ambitions. Compliance with award criteria is converted into a notional reduction in the price offered and the product with the lowest corrected price is subsequently chosen (PIANOo, 2017d). A procuring organisation may also include criteria or requirements in the tender other than those described in the criteria documents (for example on circular procurement, biobased procurement or Social Return), as long as they do not conflict with the legislation.

RIVM Report 2018-0069
Page 18 of 91
RIVM Report 2018-0069
Page 19 of 91
3 Conditions for the evaluation of the effect of SPP
The method must meet a number of conditions. These are specifications concerning what must be measured (section 3.1) and technical requirements that must be met (section 3.2).
3.1 What has to be measured? Impact avoided during the contract period and lifetime The method concerns the effect of SPP on humans and the environment. For the environment, this often means a less negative impact; for example, a reduction in the emission of greenhouse gases or in the consumption of virgin materials and minerals. In other words: an avoided impact. Social International also often aims to reduce the negative impact, for example, in the field of forced labour. Social Return, however, aims at a positive impact by creating more job opportunities for people with a distance to the labour market. If less negative and more positive impacts are to be calculated, a reference is needed; in relation to what is the measurement 'more' or 'less'? The definition of a reference is therefore part of the method. The effect of SPP incorporated in a tender takes place during the contract period of the service and/or the lifetime of the product. This period and lifetime are specific to the tender in question. Contracts for electricity often last 1 to 5 years with an option to extend, whereas a solar panel lasts an average of 15 years. The effect calculated using the method is the effect brought about throughout the entire contract phase of the service and the lifetime of the product. SPP themes The method must cover the effect on various SPP themes: environmentally friendly (including climate change), biobased, circular, Social Return and Social International. This first version of the method is delineated in such a way that the quantification of the effect of the environmental themes (environmentally friendly, biobased and circular) has been elaborated in more detail than that of the social themes (Social Return and Social International). Procurement process This is all about the ultimate effect of a tender that is issued with attention for sustainability. The focus is therefore not on the business operations of a contracting authority but on the contracted services and products themselves. The method must show the overall effect of what is actually procured rather than be limited to the texts of a tender. Interviews with procurers show that the success of SPP depends on various phases in the procurement process and not solely on the texts of the tender (see annex 1). It is best to determine the actual effect of a tender in retrospect, when information, such as the precise duration of a contract, what precisely has been delivered and whether the product in question has functioned properly, is known. Measuring in retrospect is, however, frequently impractical due to the difference in the lifetime of products
RIVM Report 2018-0069
Page 20 of 91
and duration of contracts for services. A solar panel can, for instance, last 15 years and a policy evaluation covering 2015 ideally takes place earlier than 2030. Trend It must be possible to present the results at the product group level over time. Ultimately a trend will become visible in the benefits achieved through SPP over the years. If the benefits for a particular theme even out, this means that the maximum possible benefits have been achieved for this theme or that new incentives are needed. Suppose, for example, that the entire government has contracted long-term local renewable energy and that this has become widely accepted, the potential benefits for that product group for the theme of climate change have become small. The attention for this product group can then shift to other SPP themes, such as scarce raw materials. Similarly, attention for climate change can shift to other product groups with which climate benefits can still be achieved.
3.2 Technical conditions Measurable The idea behind the method is that it leads to a measurable result, so that the effect during different periods (for example, years) can be compared (see Section 3.1.4). Third parties must, moreover, also be able to implement the method. Diversity SPP takes place on a heterogeneous playing field. There are differences between:
• product groups – for example with regard to the policy themes they impact
• tenders within product groups – for example, magnitude and contract duration
• ways of tendering – for example, minimum requirements, award criteria, more stringent requirements
• contracting authorities – for example, organisational structure, purchasing strategies
The approach must be able to deal with these differences. The heterogeneity has been analysed through discussions with procurers and contract managers from various contracting authorities. The data available on the products and services procured are, furthermore, frequently limited and fragmented. Easy It must be possible to implement the method using information that is easy for contracting authorities to collect since ultimately they themselves must be able to measure effects for their own organisations. In line with existing approaches The indicators incorporated in existing SPP tools that are used in practice were examined to determine whether they are suitable for quantifying the effect of SPP. These indicators have been made accessible by Kok and Zijp (2016). The most commonly used indicators
RIVM Report 2018-0069
Page 21 of 91
have been incorporated in the method. In so far as we are aware and despite the fact that the European parliament has recently placed a great deal of emphasis on the topic, the Netherlands is the first country in Europe to develop an approach to clarify the effect of SPP1. Delineation ‘Burden’ has so far attracted little attention. If, for example, a tender focuses on the transition to a biobased economy, the contribution of the tender to the shift from fossil-based to biobased fuels is quantified, but not the potential additional pressure that this exerts on land use or eutrophication. This can be added to the approach. LCA data are necessary to this end. LCA stands for Life Cycle Assessment. They comprise data on emissions and the use of natural resources in the life cycle of products.
1 http://www.eubusiness.com/news-eu/procurement-31az; consulted on 08-12-2017

RIVM Report 2018-0069
Page 22 of 91

RIVM Report 2018-0069
Page 23 of 91
4 The method
This chapter describes the method for determining the effect of SPP. Section 4.1 outlines the method. Section 4.2 subsequently goes into it in more detail. Operational specifications are given per product group in annexes 3-7.
4.1 A brief description The method for determining the effect of SPP comprises six steps. These steps have been summarised in Figure 4.1 and are described briefly below. Section 4.2 elaborates on the details of each step. 1. Definition of the product group In this step, the product group is delineated and the period to be evaluated chosen. The result is a long list of tenders that fall within the definition and time span of the product group. 2. Taking a sample from the product group In this step, a sample is taken. It is further analysed in the following steps. 3. Examining the texts of the tenders The tenders in the sample are examined. If the text reveals that SPP has not played a role in the tender in question, it is assumed that no effect can be attributed to SPP. If SPP has played a role in the tender, or if there is any doubt about it having done so, the tender is further analysed in the next step. 4. Interaction with the contracting authorities In this step, the remaining tenders are examined, together with procurers and contract managers, to determine what has ultimately been procured and whether this is different than what would have been procured without SPP. This exchange of information can take place by means of an interview, by telephone if required, or in writing. If it becomes apparent that what has been procured is expected to score better on one of the SPP themes taken into account in the tender than an alternative procured without SPP, or if there is any doubt about this, these benefits are further quantified in the next step. If not, no effect is attributed to SPP. 5. Quantification of the effect of SPP The available information and data are used to estimate the effect of SPP per tender. This is examined per SPP theme. The proportion of tenders that have taken SPP themes into account is indicated in terms of number and euros for all the themes. For green, circular and biobased public procurement, the benefits achieved are, where possible, further quantified into, for example, avoided emissions of greenhouse gases and avoided consumption of fossil raw materials (see Table 4.1 in section 4.2). Indicators are differentiated at different levels per SPP theme, level 1 being very simple and requiring few data to quantify it but giving

RIVM Report 2018-0069
Page 24 of 91
no strong indication of the actual effect and level 3 requiring more data but also yielding more information about the effect 6. Extrapolation The results for the sample will ultimately be extrapolated to the entire product group to give an estimate of the total benefits achieved in a specific policy period due to the application of SPP.
Figure 4.1 Outline of the method
4.2 Specifications per step 4.2.1 Definition of the product group
A long list of tenders within a product group is drawn up on the basis of TenderNed. The TenderNed administrator claims to have a 70% coverage ratio of all tenders. The picture so far is that tenders for public procurement above the threshold value for the mandatory European tendering procedure are generally published on TenderNed (more than 80%2), whereas the majority of smaller tenders are more likely not to be on TenderNed. TenderNed's coverage ratio will therefore differ per product group. It will have a high coverage ratio for most larger framework contracts, such as those often concluded for catering or electricity, and a lower coverage ratio for product groups with smaller batches, such as occupational clothing. The tenders in a specific product group are retrieved from a database delivered by TenderNed using all the relevant CPV codes for this product group. The abbreviation ‘CPV’ stands for Common Procurement Vocabulary and is a classification system for tenders that has been
2 https://www.pianoo.nl/themas/elektronisch-aanbesteden; consulted on 7-11-2017

RIVM Report 2018-0069
Page 25 of 91
agreed across Europe. These CPV codes are listed in the criteria documents on Pianoo.nl. The database consists of an Excel file with a list of tenders that are linked to a CPV code relevant to the product group and information about these tenders. These Excel files cannot be publicised because of agreements made about this with PIANOo. NB: During the study, it was ascertained that CPV codes are not uniformly applied so that the database also contains tenders that fall outside the definition of the product group concerned. For example, the occupational clothing database contains tenders for Christmas gifts and VVV (Tourist information office) vouchers as well as those for occupational clothing. The list therefore had to be filtered. There are, moreover, tenders on the list that have been withdrawn and can no longer be found on the TenderNed website; these tenders will also be removed from the list.
4.2.2 Sampling A sample was taken from the cleaned-up list. Samples were opted for because, for this study, it was not feasible to examine all the tenders. There is often a wide variety of tenders within product groups. In order to obtain a good picture of this variation, a stratified sample was opted for. In a stratified sample, the product group is divided further into smaller groups (the strata) of tenders that show similarities. The subcategories described in the criteria documents were used for the stratification. Where necessary, subcategories were combined to keep the number of strata manageable. Within each product group, a total of ten tendering projects were randomly selected from each stratum in the ratio in which the strata occurred in the total population. So if a product group comprised two strata, five tenders were randomly selected from each of them. The extrapolation has been described in section 4.2.6.
4.2.3 Examining the texts of the tenders The texts of the tenders in the sample were examined using an analysis table. This table has been included in Annex 2. The following aspects were examined:
• whether SPP occurred in the tender; • what SPP themes were aimed at; • whether minimum requirements, more ambitious requirements or
award criteria were used; • from which texts these conclusions could be drawn; • where these texts were found (in which document); • the value of the tender; • who the contact person at the procuring organisation was.
Tenders that did not mention SPP counted as tenders that had no SPP effect. If necessary, the organisation in question was contacted to ascertain the total value of the tender in question. This was needed to calculate the financial indicators (4.2.5). Tenders in which SPP themes had been incorporated or in which it was unclear whether they had been incorporated, were further examined in the next step.
RIVM Report 2018-0069
Page 26 of 91
4.2.4 Interaction with the contracting authority Ideally, an interview is scheduled with the procurer and contract manager. In practice, however, this is not always feasible and written contact can suffice. Broadly speaking, the interview covers the following:
• Does the picture built up of the procurement via TenderNed correspond with the facts?
• What was the value of the procurement in euros? • What was procured? To what extent were the SPP
requirements/criteria met? • What was supplied? To what extent were the SPP
requirements/criteria in the tender complied with? • What other tenders were there and what was the variation in
sustainable ambitions? • What was the procurer's picture of the reference of the product
procured: was the product different from the other products on the market in terms of SPP?
• A request for the data needed to quantify the indicators. The importance of clear communication regarding the objectives of the interview, especially the fact that procurers were not being 'checked up on', was apparent in this approach. In the interviews, procurers shared their opinions on whether SPP had or had not gone well and what they needed to enable this.
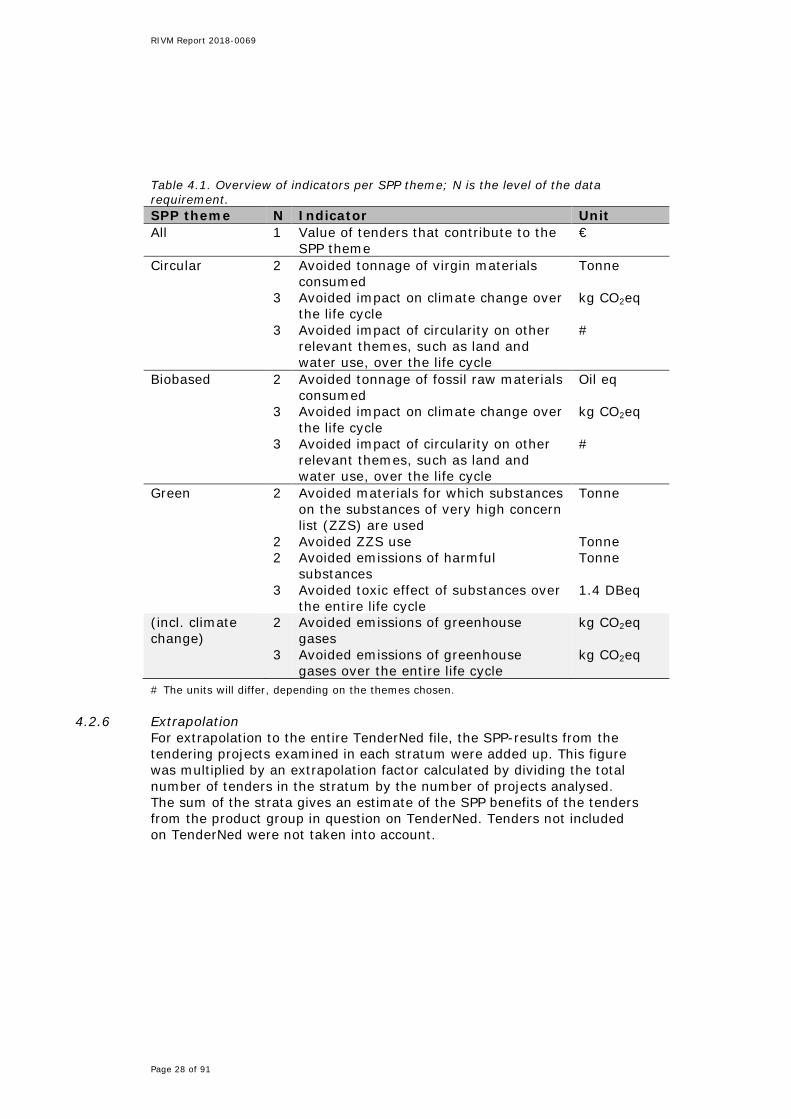
4.2.5 Quantification of the SPP effect If the above analysis shows that SPP themes were incorporated into the tender and that this may have led to a positive effect, a quantitative estimate was made of this positive effect. The extent to which benefits can be quantified depends on the available data. This is why a graduated set of indicators was opted for (see Table 4.1). Ideally, the effect of SPP, compared to the reference situation, is measured over the entire life cycle of the product. In most cases, however, a simpler indicator, such as an estimate of the change in material flows, is already challenging enough. Three levels of indicators are differentiated, each with their own data requirements:
• Level 1. This concerns the size/value of the tender in, for example, euros, GWh or m3. These are indicators for which information about the tender is the only information required. They yield insight into the use of the products procured, but do not divulge much about the actual effect of SPP.
• Level 2. These are indicators for which information about the use phase of the product or the characteristics of the service is also needed. This information enables the quantification of indicators that yield insight into the effect of SPP in terms of shifts in material flows and reduced emissions in the use phase of the product. For example, for official cars, information about the number of cars, the type of cars (for example, Euro standard for the emissions of harmful substances), the type of fuel consumed and the annual kilometres driven is needed (see annex 4). Another example is occupational clothing. For this product group, information is needed about the number of garments, the type of materials (cotton, wool, etc.), the origin of the various materials

RIVM Report 2018-0069
Page 27 of 91
(organic, recycled) and the proportions of the different materials in weight (see annex 7).
• Level 3. Finally, there are indicators for which additionalinformation is needed about the production process of a product,so that the quantity of emissions and use of natural resourcesassociated with the production of the product can beincorporated. This information might, for example, take the formof emission factors, such as those set out, after harmonising thedifferent factors used in the Netherlands, for transport andenergy in the Greendeal CO2 emission factors(www.CO2emissiefactors.nl). These factors are based on datacollected by means of life cycle assessment (LCA). There arevarious databases of LCA data that can be used to calculate othertypes of effects than climate change (CO2) and for other productgroups than transport and energy. One example is the NationalEnvironmental Database (NMD) for, among other things, theproduct group buildings.
Effects on social themes are only assessed at level 1 within this version of the method. This could be expanded in a later version of the method. The other SPP-themes – green (including climate change), circular and biobased procurement – have been elaborated at all three levels. A basic set of indicators has been created that can be expanded depending on the product group and type of tenders involved. Two sources were consulted to this end. The first was a study into how SPP methods quantify SPP (Kok and Zijp, 2016). It provides an overview of the indicators used per SPP-theme. The quantitative common denominators were selected from these existing methods. The second source consulted comprised the criteria documents for the product groups used to test the approach. The indicators were chosen such that they were basically in keeping with the minimum requirements in the criteria documents.
RIVM Report 2018-0069
Page 28 of 91
Table 4.1. Overview of indicators per SPP theme; N is the level of the data requirement. SPP theme N Indicator Unit All 1 Value of tenders that contribute to the
SPP theme €
Circular 2 Avoided tonnage of virgin materials consumed
Tonne
3 Avoided impact on climate change over the life cycle
kg CO2eq
3 Avoided impact of circularity on other relevant themes, such as land and water use, over the life cycle
#
Biobased 2 Avoided tonnage of fossil raw materials consumed
Oil eq
3 Avoided impact on climate change over the life cycle
kg CO2eq
3 Avoided impact of circularity on other relevant themes, such as land and water use, over the life cycle
#
Green 2 Avoided materials for which substances on the substances of very high concern list (ZZS) are used
Tonne
2 Avoided ZZS use Tonne 2 Avoided emissions of harmful
substances Tonne
3 Avoided toxic effect of substances over the entire life cycle
1.4 DBeq
(incl. climate change)
2 Avoided emissions of greenhouse gases
kg CO2eq
3 Avoided emissions of greenhouse gases over the entire life cycle
kg CO2eq
# The units will differ, depending on the themes chosen.
4.2.6 Extrapolation For extrapolation to the entire TenderNed file, the SPP-results from the tendering projects examined in each stratum were added up. This figure was multiplied by an extrapolation factor calculated by dividing the total number of tenders in the stratum by the number of projects analysed. The sum of the strata gives an estimate of the SPP benefits of the tenders from the product group in question on TenderNed. Tenders not included on TenderNed were not taken into account.

RIVM Report 2018-0069
Page 29 of 91
5 Results per step
The method described in chapter 4 was applied to eight product groups. This chapter contains the results of this application. The results are presented according to the steps of the method, the reason being that this is in line with the objective of the report: to examine and discuss an effective way to measure SPP. A briefing on the result of SPP in tenders for the Dutch House of Representatives, for example, will ultimately be drawn up per product group rather than per process step. Annexes 3-7 present the results in more detail and per product group.
5.1 Selection of the product group The method was applied to the product groups falling under the clusters transport, energy and occupational clothing. Tenders in the period 2015-2016 were examined, because the SPP Action Plan 2015-2020 was approved in the Dutch House of Representatives in 2015. Table 5.1 shows an overview of the product groups and the number of tenders found via TenderNed, after manual filtering Table 5.1. Number of tenders per product group on TenderNed in the period 2015-2016. Product group Number of tenders in 2015-2016 Occupational clothing 54 Electricity (and solar panels) 73 (and 65) Gas 69 Business trips abroad 18 Contract transport 90 Official cars 274 Transport services 74
5.2 Sampling All product groups were subdivided into subcategories based on the subdivision in the criteria documents. The subcategories in the criteria documents were, however, often subdivided into too many subcategories and/or overlapped one another too much for the purposes of the evaluation in this study. The subdivision for occupational clothing in the criteria document (version January 2016) is, for example, as follows:
• clothing, footwear, baggage items and accessories; • occupational clothing, special workwear and accessories; • outerwear; • garments; • special clothing and accessories; • footwear; • protective and safety clothing; • personal and supporting equipment.
With this subdivision, almost all of the tenders for occupational clothing fitted into more than one subcategory at the same time. The subdivision for occupational clothing was therefore simplified for the purposes of this study. This is shown in Table 5.2. Incidentally, the total in this example

RIVM Report 2018-0069
Page 30 of 91
does not correspond with the total number of tenders for occupational clothing in Table 5.1 because multiple lots can fall within a single tendering procedure and products from several subcategories can thus be procured within it. Table 5.2. Subcategories of the product group Occupational clothing, their occurrence on TenderNed in 2015-2016 and the distribution over the sample. Subcategories Longlist Sample Special workwear, such as protective clothing
6 1
Ordinary clothing 29 5 Footwear 10 2 Accessories, such as belts 13 2 Other, such as kit 1 0 Total 59 10 The random sample of ten tenders per product group yielded the numbers of tendering projects for the product group Occupational clothing given in Table 5.2. Comparable samples were taken for the other product groups. The product groups were not all so diverse that they had to be subdivided. This was not necessary for Gas and Electricity, for example. When the long list for electricity was examined, it was found to include a lot of tenders for solar panels. According to the PIANOo website, solar panels have not been placed in a predefined product group. Given that solar panels are an alternative to electricity from non-renewable sources, for the purposes of this study they were deemed a separate product group. This meant that it was possible to examine the use of the method for a product group without a criteria document. A total of 80 tenders were analysed, divided over 62 different contracting authorities (CAs): tenders for central services (11 CAs; ministries, police, etc.), provinces (5 CAs), municipalities (22 CAs), safety regions (6 CAs), educational institutions (12 CAs) and other (6 CAs).
5.3 Examining the texts of the tenders On the implementation of this step Examination of the texts revealed that information about whether SPP is or is not incorporated is almost always stated in the annexes and only sporadically in the publication on TenderNed itself as web text. Moreover, some of the tenders are communicated via TenderNed but implemented via other systems, such as Negometrix, Commerce-hub and CTM Solutions. The information on these tenders on TenderNed is sketchy and not accessible to third parties via the other systems. In these cases, we requested the information from the procurer and it was always provided. Results: type of SPP applied Figure 4.1 shows the score regarding the type of SPP applied per product group: minimum requirements, more ambitious requirements

RIVM Report 2018-0069
Page 31 of 91
and/or award criteria. A total of 65 of the 80 tenders examined (80%) refer to SPP in some way.
Table 5.3 Score per product group regarding the type of SPP applied: minimum requirements, more ambitious requirements and/or award criteria. A score on ‘minimum requirements’ means that one or more minimum requirement/s from the criteria documents have been taken into account or that requirements for Social Return or Social International have been included. Minimum requirements, more ambitious requirements and award criteria can be applied simultaneously in tenders. This explains why the rows add up to more than 100%.
Type of SPP
Product group
Minimum requirements
More ambitious requirements
Award criteria
No SPP
Occupational clothing 70% 20% 10% 30%
Electricity 90% 10% 30% 10% Solar panels 30% 20% 20% 30% Gas 70% 10% 30% 30% Business trips 67% 11% 33% 33% Contract transport 100% 10% 50% 0%
Official cars 80% 20% 40% 20% Transport services 100% 30% 60% 0%
Minimum requirements are incorporated into tenders relatively frequently. Minimum requirements from the criteria documents that are available on the PIANOo website were applied in 56 of the 70 tenders examined. If a tender incorporated one or more minimum requirement/s from the criteria documents and/or requirements for Social Return and/or compliance with the standards of the International Labour Organization (ILO), it fell under ‘takes minimum requirements into account’. If this was the case, the tender was included in the score.
In some product groups, such as the transport services, it seems to be standard procedure to incorporate the minimum requirements. There is, however, variation in what this means within product groups. In the product group Official cars, for example, there are tenders with a single minimum requirement (that for emissions of particulate matter and NOx (Euro standards)) whereas other tenders in this group refer to the total package of minimum requirements described in the criteria documents, including minimum requirements for CO2 emissions per kilometre, for example. The score in Table 5.3 indicates whether the tenders pay attention to SPP but does not yield any information about the ambitions laid down or the potential benefits. The application of SPP is not yet standard procedure in a number of product groups (Occupational clothing, Gas, Business trips and Official cars). In these product groups, there is no mention of SPP in around three of the ten tenders examined. No minimum requirements have been laid down for the product group Solar panels. The 30% in the table refers to the incorporation of Social International via ILO and Social Return.
RIVM Report 2018-0069
Page 32 of 91
More ambitious requirements and award criteria The results showed that 31 of the 80 tenders examined stipulated more than just the minimum requirements. Between 50 and 60% of the tenders for contract transport, official cars and transport services and around 30% of the tenders for occupational clothing, solar panels, gas and business trips had more ambitious requirements. Only one tender for electricity stipulated more than the minimum requirements. This may have been because the minimum requirements themselves are already ambitious: 100% renewable energy.
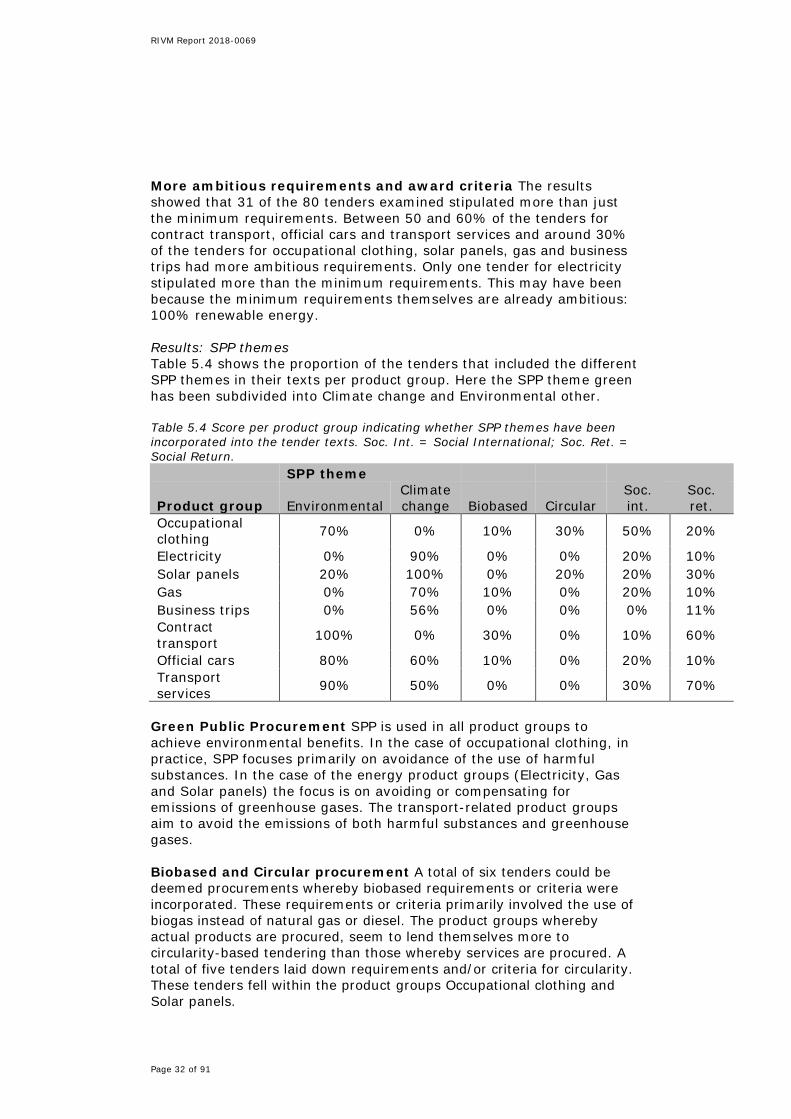
Results: SPP themes Table 5.4 shows the proportion of the tenders that included the different SPP themes in their texts per product group. Here the SPP theme green has been subdivided into Climate change and Environmental other.
Table 5.4 Score per product group indicating whether SPP themes have been incorporated into the tender texts. Soc. Int. = Social International; Soc. Ret. = Social Return.
SPP theme
Product group Environmental Climate change Biobased Circular
Soc. int.
Soc. ret.
Occupational clothing 70% 0% 10% 30% 50% 20%
Electricity 0% 90% 0% 0% 20% 10% Solar panels 20% 100% 0% 20% 20% 30% Gas 0% 70% 10% 0% 20% 10% Business trips 0% 56% 0% 0% 0% 11% Contract transport 100% 0% 30% 0% 10% 60%
Official cars 80% 60% 10% 0% 20% 10% Transport services 90% 50% 0% 0% 30% 70%
Green Public Procurement SPP is used in all product groups to achieve environmental benefits. In the case of occupational clothing, in practice, SPP focuses primarily on avoidance of the use of harmful substances. In the case of the energy product groups (Electricity, Gas and Solar panels) the focus is on avoiding or compensating for emissions of greenhouse gases. The transport-related product groups aim to avoid the emissions of both harmful substances and greenhouse gases.
Biobased and Circular procurement A total of six tenders could be deemed procurements whereby biobased requirements or criteria were incorporated. These requirements or criteria primarily involved the use of biogas instead of natural gas or diesel. The product groups whereby actual products are procured, seem to lend themselves more to circularity-based tendering than those whereby services are procured. A total of five tenders laid down requirements and/or criteria for circularity. These tenders fell within the product groups Occupational clothing and Solar panels.
RIVM Report 2018-0069
Page 33 of 91
Social International and Social Return The theme Social International is not just as relevant for every product group. It looks as though the incorporation of this theme is becoming standard for occupational clothing but not for other product groups. This is expected to change for product groups that may be dependent on, for example, conflict minerals, a relevant theme in the transition to sustainable supplies of energy and transport. Social Return requirements are becoming standard features of tenders due to the Government-wide agreement that obliges procurers to incorporate them in tenders exceeding 25,000 euros (see Rijksoverheid 2011). Social Return is the only theme that is regularly mentioned, along with an explanation of why it is not incorporated into the tender. This applies to smaller tenders or tenders in which there is no room for Social Return in the business operations, such as in the product groups Gas and Electricity.
5.4 Interaction with the contracting authority A basic list of questions was drawn up per product group for the contracting authorities. These questions are about what was ultimately procured, the verification of the data obtained via TenderNed and the data needed to quantify the SPP effect. Questions are only asked about the SPP themes reflected in the tenders.
The first challenge in this step was to find the right contact person. It was often the case that:
• the contact persons announced along with the tenders onTenderNed were not actually responsible for managing thecontract;
• the contact persons no longer worked for the contractingauthority;
• tenders were issued via consulting firms;• there were only general [email protected] addresses available as
contact information.
The second challenge was to obtain the cooperation of the contact persons. In most cases, this was not a problem but:
• a few procurers said that they were not allowed to spend time onthis. These were the tenders that ran via consulting firms, inparticular;
• one contracting authority indicated that the information wasavailable but was unwilling to share it.
The third challenge was the collection of the data: • The whole service or product had often not yet been delivered. In
these cases, an estimate was made based on the details thatwere available. The effect over the contract period of three yearswas, for example, determined on the basis of the effect in thefirst year. Or, the effect of a solar park still under constructionwas determined on the basis of what had been incorporated intothe contracts.
• For some product groups, the data needed to calculate the effectwas not immediately available, such as the estimate of howmany tonnes of organic cotton or recycled polyester wasdelivered within a contract for occupational clothing. This meant

RIVM Report 2018-0069
Page 34 of 91
that it was not always possible to calculate effects. In some cases, a proxy could be used, for example, for the annual kilometres driven by official cars (annex 4). In time, the problem of the non-availability of data can be solved by stipulating that it be submitted in tender and contract requirements. This is, for instance, already common practice in tenders for business trips abroad. The annexes give the minimum data needed per product group to calculate the SPP effect.
• The data needed, such as the quantities of clothing delivered orkilometres driven, were frequently difficult to retrieve and findingthem in retrospect was sometimes too much work for the contactpersons.
Besides insight into what is ultimately delivered and the data needed to calculate its effect, this step also yielded a great deal of qualitative information on the operational context of the product groups in question. For example, various occupational clothing procurers mentioned that suppliers always indicate that the requirements concerning the use of harmful substances and those laid down by the International Labour Organisation (ILO) are complied with but that this is extremely difficult to verify. The complexity of international supply chains means that suppliers themselves are seldom sure precisely what substances are or are not in clothing or are used in its production. A few tenders overcame this by requesting an Öko-tex standard 100 certificate in accordance with the minimum criteria document. On payment of a fee, this certificate is granted to products that comply with the list of restrictions, including those on hazardous substances. This list is more far-reaching than existing legislation and regulations. Assuming that this label is valid, this requirement can be expected to yield an effect. These lessons about the context of a product group have been described per product group in the annexes.
Procurers often had difficulty in giving an estimate of the number of kilometres driven and vehicle characteristics for the product groups Contract transport and Transport services. These basic data were finally arrived at for five of the ten tenders for contract transport examined and three of the ten tenders for transport services examined. Because the basic data for these product groups overlap as regards types of vehicle and requirements, they were combined for the next steps, those of quantification and extrapolation.
5.5 Quantification of the SPP effect This section gives the final quantitative effects of SPP in the product groups Occupational clothing, Electricity, Solar panels, Gas, Business trips, Official cars and the combined product group Transport services/Contract transport, that is, including the extrapolation.
The size/value (for example, in euros) of a tender is the first simple indicator that can be used to quantify the SPP effect that can be expected (see 4.5, level 1). Table 5.5 shows an overview of this indicator per product group. This indicator is based on the value, in numbers of euros, of tenders in which SPP actually plays a role. It therefore gives a more specific picture than Table 5.4, because a

RIVM Report 2018-0069
Page 35 of 91
correction has been made for the value of the tenders. This indicator is, furthermore, based on what has actually been contracted and not just on what has been requested in the tender concerned. The sums contracted for (tender amounts) were in most cases delivered by the contracting authorities or were obtained from the tender documents available. Table 5.5 Percentage of the size/value (in GWh for electricity, in m3 for gas and in euros for the other product groups) of the sample that was used for SPP per SPP theme. The product groups Contract transport and Transport services were combined (see section 5.4). SPP theme
Product group Environmental Climate change Biobased Circular
Soc. int.
Soc. ret.
Occupational clothing 31% 0% 0% 24% ? 12%
Electricity 0% 100% 0% 0% ? ? Solar panels 0% 100% 0% 0% ? 72% Gas 0% 73% 2% 0% ? ? Business trips 0% 44% 0% 0% ? ? Official cars 88% 78% 7% 0% ? 14% Contract transport/transport services
100% 82% 41% 0% ? 87%
Green – other The SPP theme green entails the emissions of greenhouse gases and all kinds of other emissions to the environment. The effect on greenhouse gases is described on the following page. In tenders in the product group Occupational clothing, requirements are set on the use of harmful substances in the production of clothing to reduce emissions of other substances. In the product groups Contract transport, Official cars and Transport services, requirements are set on the emissions of particulate matter and NOx. For occupational clothing, data on the quantities of materials with fewer harmful substances were not available in the case of most tenders, which meant that quantification could not be implemented beyond level 1, the financial parameter. It was, however, possible to arrive at a good estimate of the avoided emissions of NOx and particulate matter for transport. The benefits of the Euro VI standard (European emission standard) compared to the Euro V standard were taken as the reference for new procurements (Official cars), based on the assumption that the Euro V standard is the minimum currently delivered. The Euro IV standard was taken as reference for the use of existing vehicles (Contract transport/Transport services). The details of the calculations and assumptions made are given in the annexes. The joint total avoided emissions of NOx for these product groups was estimated at 28,000 kg and for particulate matter 1,700 kg compared to the reference situation in which vehicles with lower euro standards were delivered.

RIVM Report 2018-0069
Page 36 of 91
Green – climate change Avoided emissions of greenhouse gases was incorporated into all product groups. The following were examined:
• the effect of efficiency in the use phase, such as with fuel-efficient cars;
• the effect of the type of energy source; NB: for electricity, onlythe effect of renewable energy from the Netherlands wascalculated in accordance with the agreement in the ‘GreendealCO2 emission factors’;
• the effect of switching to green alternatives, such as organiccotton instead of regular cotton.
Table 5.6 Estimate of avoided and compensated emissions of greenhouse gases, particulate matter and NOx per product group. These are the avoided or compensated emissions throughout the duration of the contract and/or lifetime of products laid down.
Product group
NOx (kg)
avoided
Particulate matter (kg)
avoided
CO2eq (tonne) avoided
CO2eq (tonne)
compensation Occupational clothing - - - - Electricity - - 3,800,000 - Solar panels - - 1,100,000 - Gas - - - 1,360,000 Business trips - - - 33,000 Contract transport / Transport services 20,000 1,700 17,000 170 Official cars 8,000 - 6,000 - Total 28,000 1,700 4,923,000 1,393,000
The CO2 emission factors agreed in the Greendeal CO2 emission factors (available on http://www.CO2emissiefactoren.nl) were used for these estimates. The first two effects can be estimated using these factors. These factors take into account CO2-emissions during the life cycle of the production of the energy and fuel (therefore level 3, see 4.2.5). Emission factors of this kind, however, are not available in the same way for the last effect – the switch to green alternatives, such as organic cotton instead of regular cotton. 'Translation tables' will have to be developed per product group on the basis of the available LCA data (see also chapter 7).
Tenders for the product groups Electricity, Solar panels, Contract transport/Transport services and Official cars in the years 2015 and 2016 have led to total avoided emissions of greenhouse gases of 4.9 megatonnes CO2eq. Moreover, 1.4 megatonnes CO2eq was compensated for by the procurement of certificates that guarantee the planting of forests or other measures (Table 5.6). The avoided and compensated emissions of greenhouse gases calculated per product group are given in Table 5.6. This is the sum of greenhouse gases not emitted because SPP took place instead of regular procurement. This sum covers the avoided emissions throughout the entire duration of the contract (in the case of a service) and/or use phase (in the case of a product).
RIVM Report 2018-0069
Page 37 of 91
Biobased Five tenders incorporated biobased criteria, one in the product group Official cars, one in the product group Gas and three in the product group Contract transport. All stipulated the use of biogas instead of diesel (for transport) or regular gas. The effect in terms of avoided fossil raw material consumption was expressed in oil equivalents (oil eq) in accordance with the ReCiPe method (Huijbregts et al., 2016). Extrapolated to all the product groups, attention to biobased aspects in SPP in 2015 and 2016 is estimated to have led to an avoided fossil raw material consumption of 13,000 tonnes oil eq. The tender with biogas from the product group Gas was not included here because the proportion of gas ultimately used that was biogas was not clear. Circular The tonnage of recycled materials and the reuse after use laid down for occupational clothing could not be quantified any further than level 1 (Table 5.5) because basic data on the total tonnage of clothing procured was not available. In the product group Solar panels, circularity was incorporated by means of a reference to the PV Cycle3 and the collection of the solar panels by the supplier after use. However, because no further stipulations had been laid down on the actual reuse and proportion of recycled material in a product, this has yet to have any effect. Social International It was not clear whether the services and products delivered actually complied with the Social conditions in global supply chains (Social International). The procurers and contract managers interviewed indicated that they had no insight into this. Suppliers often have to indicate on the tendering form that they comply with the general Social conditions in global supply chains (for example, those laid down by the ILO). The procurers and contract managers interviewed indicated that they do not verify this. This is why there are question marks on Table 5.5 by this theme: it is not clear whether SPP has had any effect on this theme. Social Return In tenders in which services or business operations play a small role compared with the actual physical delivery or ‘trading volume’, the Social Return is also relatively low. An example calculation: in the case of a tender for energy, the sum, without trading volume, over which Social Return could be incorporated was € 45,000 annually. If the guideline of 5% Social Return was adhered to, this would come to € 2,250 annually. The effect on Social Return is therefore not expected to be high with this type of tenders. This applies to the product groups Electricity, Gas and Business trips, for example, which is why there is a question mark by these product groups in Table 5.5. The quantification of the effect of Social Return was not included in this study, but it could be added in the future. It could, for example, be expressed in the number of working hours created for people with a distance to the labour market.
3 http://www.pvcycle.org/netherlands/, consulted on 08-12-2017

RIVM Report 2018-0069
Page 38 of 91
RIVM Report 2018-0069
Page 39 of 91
6 Validation of results
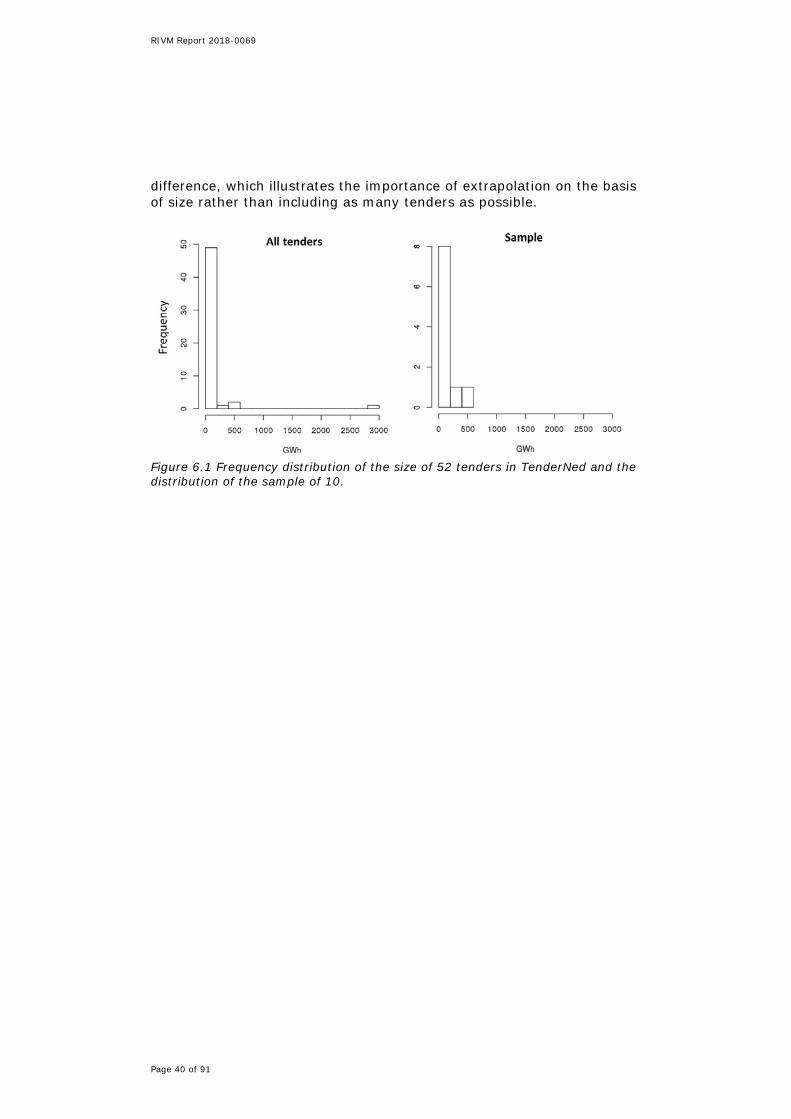
Every step of the method entails some uncertainty. When the long list is being drawn up, tenders can be missed, tender texts can be incorrectly interpreted and the data delivered can be incomplete; moreover, the processing of data into effect entails uncertainties due to the assumptions that have to be made and the key figures used (see annexes 3-7). Finally, the extrapolation step is also subject to uncertainties. As discussed in section 4.2.2, this is because it is not possible to show whether the scale of the tenders in the sample is representative. Three small tests were carried out to validate the outcomes. These tests are described below. Take a new sample A completely new sample taken after re-examining the tender texts for occupational clothing led to the same picture for the SSP themes environment, climate change, biobased and Social International. It did, however, lead to a single additional tender that took the SPP themes circular and Social Return into account. Whether the large overlap between the two samples is reason to conclude that the approach is reliable can only really be confirmed when there is insight into the whole population. Compare the results with other research Natuur & Milieu's Sustainable transport procurement benchmark (Natuur & Milieu, 2016) showed that, in the same period but during a shorter time span (June 2015 - June 2016, that is, one year instead of two), 52% of a larger sample of tenders for procurement of vehicle fleet by municipalities incorporated a CO2 requirement. In the product group Official cars, the number of tenders with a CO2 requirement in the sample in this study was 60%. The product groups Transport of pupils and WMO in N&M's study can be compared with contract transport and transport services (namely ad hoc transport, see Annex 5) in this study. N&M arrived at 20-35% of the tenders with a CO2 requirement; the sample in this study resulted in a percentage of 25% of the tenders with a CO2 requirement. Another study with a larger sample from a smaller target group and shorter period of time thus arrives at a comparable conclusion regarding the implementation of the minimum requirements concerning CO2 emissions. Obtain insight into the entire product group For the product group Electricity, the quantity of energy involved is mentioned relatively frequently in the texts and annexes of the tenders on TenderNed. All 73 tenders from 2015 and 2016 were examined for this and the size in GWh (Gigawatt hour) was available for 52 of them. A total of 7,300 GWh was involved in these tenders, taking the entire contract period into account. The extrapolation of the 10 tenders in this study to 52 tenders resulted in 6,500 GWh, indicating that extrapolation yields to underestimation of the actual benefits. Figure 6.1 shows the frequency distribution of the size of the 52 tenders and the distribution of the sample. The sample appeared to be a cross-section of both larger and smaller tenders. There is one tender that stands out as regards size; whether this tender is or is not included in the sample makes a big
RIVM Report 2018-0069
Page 40 of 91
difference, which illustrates the importance of extrapolation on the basis of size rather than including as many tenders as possible.
Figure 6.1 Frequency distribution of the size of 52 tenders in TenderNed and the distribution of the sample of 10.
RIVM Report 2018-0069
Page 41 of 91
7 Using and improving the method
The method presented can be used to measure the effect of SPP to support briefings on SPP for the Dutch House of Representatives. The approach can also contribute to the local measurement of SPP effect by contracting authorities. At the same time, however, there are a number of developments that can be used to improve the method. This chapter discusses these developments and makes recommendations for the use and improvement of the method.
7.1 Automate the examination of the tender texts PIANOo is working on automating the evaluation of the extent to which each contracting authority applies SPP. The efforts made will be evaluated rather than the effect. The SPP Self-Evaluation Tool (MVIZET) gives government bodies insight into the extent to which they realise the SPP ambitions they have laid down. Besides self-reflection, this offers the bodies concerned the opportunity to learn from one another and to sketch a picture of the SPP efforts being made on a national basis (monitoring). MVIZET also utilises information from TenderNed. It contains a script that indicates whether or not SPP has been applied in tenders based on keywords used in the tenders. The study in this report has contributed to this by delivering keywords found when screening tender documents. The results of the MVIZET have been made accessible in an online module with reporting functionalities. The quality of the results can be improved by additions or corrections by the procurer. Questions can also be asked about the contract and realisation phase via the online module. Information from other tender platforms (including Negometrix, Commercehub and CTM solutions) can also be added. If MVIZET works well, it covers the first three steps of the method described in this report: from the definition of the product group to the examination of the tender texts (Figure 7.1). A condition for this is that the tenders are categorised in the right product groups.
7.2 The measurement of effect by contracting authorities More and more government bodies are laying down ambitions in the field of SPP, including via the signing of the SPP manifesto (Manifest, 2016) and by complying with the new ISO 20400 for SPP (ISO, 2017). The measurement of the progress in achieving the goals and the effect of SPP is an important element in both cases. Increasing numbers of contracting authorities are increasingly expected to want to measure the effect of their SPP efforts themselves. It is therefore likely that a need will arise for an accessible system for measuring this effect. The harmonisation of individual measurements with one another could form the basis of effect measurement at the national level. Steps four and five of this approach – interaction with the contracting authority and effect measurement – could therefore, in time, be carried out by contracting authorities themselves. They would be supported by a harmonised approach to the collection of the right information and conversion of this information into SPP effect (Figure 7.1).

RIVM Report 2018-0069
Page 42 of 91
Contracting authorities have the advantage that they are able to measure the effect at different points in the procurement process, that is, at the invitation to tender, at the award of the tender, at the award of the contract, during the contract period and on completion. By measuring the effect at different points in time, an analysis can be made of where in the procurement process maximum benefits can be achieved.
Figure 7.1 Some steps of the method can, in time, be carried out by the contracting authorities using the SPP Self-Evaluation Tool (MVIZET).
7.3 Collecting data and making it readily accessible Foreground data: what has been delivered? An important condition for determining the effect of SPP is that contracting authorities collect and administer the requisite data, such as the number of kilometres driven in the case of contract transport and the number and weight of garments delivered in the case of occupational clothing. The data required to determine the SPP effect could be incorporated in the criteria documents per product group. The delivery of this information in the services or on delivery of the product can, for example, be incorporated as a minimum requirement with the tender. This is, for instance, already common practice in tenders for business trips abroad, which stipulate the delivery of an annual report on the procured CO2 compensation. Investing in this during tendering leads to time and quality gains in measuring the SPP effect because less time has to be spent searching for information and making estimates afterwards than is currently sometimes the case.
RIVM Report 2018-0069
Page 43 of 91
Background data: conversion tables Generic databases that can serve as conversion tables for procurement and the related effects are required for a number of indicators. CO2 emission factors are, for example, available for transport and electricity. There is also a database of this kind (the National Environmental Database) available for the construction sector. The situation is more complex for other product groups. There is, for instance, a database for textiles but it is not yet freely accessible4. A similar database is being developed for the product group Catering (De Valk et al, 2016; Akkermans, 2017). SPP monitoring can benefit from the opening up and maintenance of these databases but it can also contribute to them. We recommend that the government support contracting authorities in the monitoring of the effect of SPP, including for the benefit of its own policy evaluation, by having generic LCA data made available for product groups.
7.4 Improve sample This report describes a practical way of extrapolating information about a selection of tenders to information about the entire product group. The analysis of the product group Electricity in chapter 6 shows that this method can be improved if knowledge is available about the size of the total product group and the variation within it. The MVIZET is expected to yield the required insight in variation. An estimate of the size of a tender could, moreover, be taken down along with the notification of the award of the contract in question on TenderNed. Extrapolation based on these data increases the accuracy of the effect measurement. This raises the question of whether TenderNed is representative of the 30% of the tenders that are not in TenderNed. Probably not, given the fact that it is primarily the larger tenders that are on TenderNed. The choice is then either to accept the effect of tenders in TenderNed or to examine how representative the tenders in it are per product group. If TenderNed is not representative, a way to supplement the long list (step 1) with smaller tenders is required. MVIZET might be able to provide this option. In this system, contracting authorities can themselves also upload smaller tenders. This means that they can build up an overall picture for their own reports and, if multiple contracting authorities do so, ultimately for the monitor too.
7.5 Incorporating social effect The SPP themes Social Return and Social International have not been quantified in this report. There are possibilities for doing so for Social Return, for example, by expressing the effect as the number of working hours created for people with a distance to the labour market. Things are more complicated for Social International, because the production chains to which this theme applies are currently seldom transparent enough to be able to examine each case specifically. This has to be examined further.
4 http://modint.nl/ecotool/; consulted on 12-12-2017
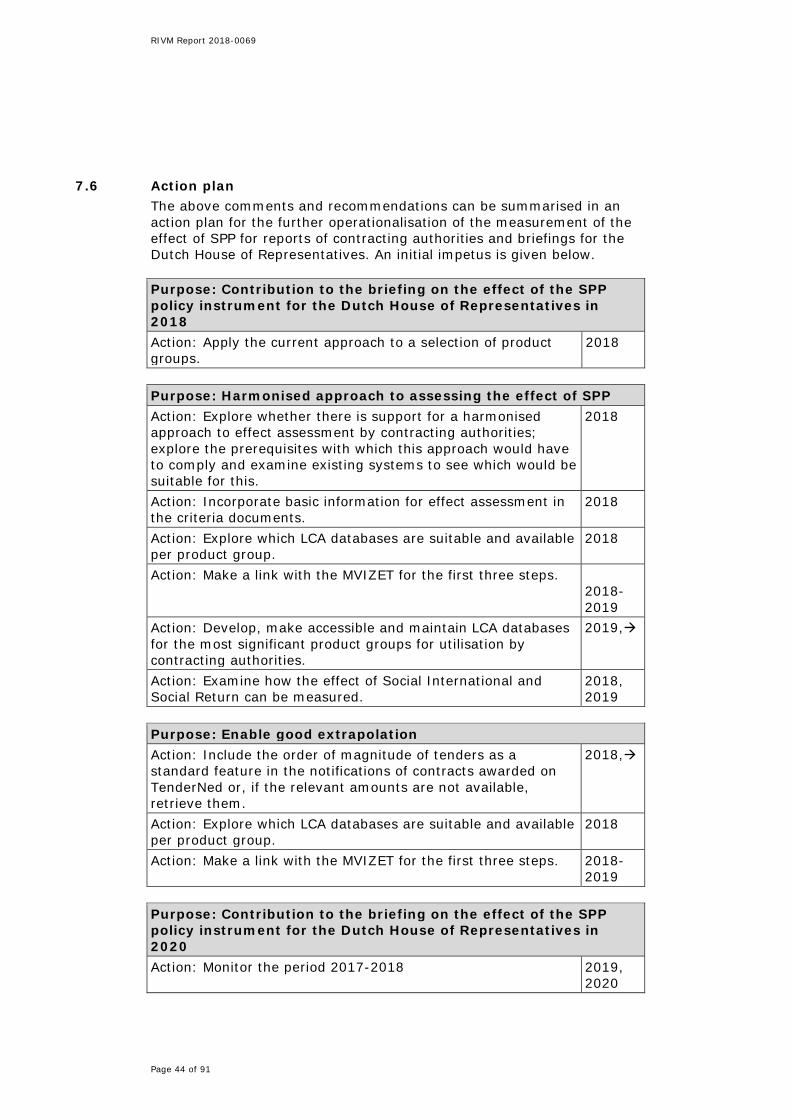
RIVM Report 2018-0069
Page 44 of 91
7.6 Action plan The above comments and recommendations can be summarised in an action plan for the further operationalisation of the measurement of the effect of SPP for reports of contracting authorities and briefings for the Dutch House of Representatives. An initial impetus is given below. Purpose: Contribution to the briefing on the effect of the SPP policy instrument for the Dutch House of Representatives in 2018 Action: Apply the current approach to a selection of product groups.
2018
Purpose: Harmonised approach to assessing the effect of SPP Action: Explore whether there is support for a harmonised approach to effect assessment by contracting authorities; explore the prerequisites with which this approach would have to comply and examine existing systems to see which would be suitable for this.
2018
Action: Incorporate basic information for effect assessment in the criteria documents.
2018
Action: Explore which LCA databases are suitable and available per product group.
2018
Action: Make a link with the MVIZET for the first three steps. 2018-2019
Action: Develop, make accessible and maintain LCA databases for the most significant product groups for utilisation by contracting authorities.
2019,
Action: Examine how the effect of Social International and Social Return can be measured.
2018, 2019
Purpose: Enable good extrapolation Action: Include the order of magnitude of tenders as a standard feature in the notifications of contracts awarded on TenderNed or, if the relevant amounts are not available, retrieve them.
2018,
Action: Explore which LCA databases are suitable and available per product group.
2018
Action: Make a link with the MVIZET for the first three steps. 2018-2019
Purpose: Contribution to the briefing on the effect of the SPP policy instrument for the Dutch House of Representatives in 2020 Action: Monitor the period 2017-2018 2019,
2020

RIVM Report 2018-0069
Page 45 of 91
8 Conclusions
Insight into the effect of SPP on society, that is, humans and the environment, is useful for the evaluation of the government's SPP policy. On the one hand, evaluation is necessary to be able to validate the use of SPP as an instrument and, on the other, to be able to improve it.
8.1 Method for measuring the effect of SPP The application of SPP is highly case specific. This report presents a method for measuring the effect of SPP that takes into account the uniqueness of tenders. Insight is obtained into the effect of the entire product group based on a sample from each product group. Every step of the method entails choices and assumptions, such as what tenders do or do not belong in the product group and what should be used for a reference. The results must be seen as orders of magnitude rather than exact figures. They give an indication of whether an effect can be expected, the difference between tenders within product groups and the difference between product groups. The results of the samples are comparable with those of two other studies (Natuur & Milieu, 2016; Zijp and De Zwart, 2013). The application of the method presented on eight product groups shows that it is possible to make an estimate of the effect of SPP using basic data. In general, procurers and contract managers were willing to cooperate. For some product groups, there was insufficient basic data available for a good effect measurement. This was, for example, the case for the product group Occupational clothing and concerned data on the number and weight of garments procured. Besides a quantitative estimate of the effect of SPP, the method also yields qualitative insight into procurement practices. Furthermore, communications with contracting authorities yield information about the context of the product group and reasons why an effect is or is not realised. These may be organisational reasons (for example, whether or not to separate procurement and contract management), market-related reasons (for example, complex supply chains that are difficult to check up on and change) and practical reasons (for example, the sustainable alternative does not meet the user's expectations).
8.2 Positive effect due to the use of SPP The results of the effect measurement show that, for all eight product groups, SPP contributed to the procurement of services or products that are better for humans or the environment than average services or products. At the same time, more benefits can still be achieved for all product groups by incorporating more ambitious requirements. Minimum requirements were not always applied in 2015 and 2016 and more ambitious requirements or award criteria were only applied in a limited number of tenders. The evaluation covering 2017 and 2018 will show whether or not there is a growing trend in the effective application of SPP. In 2015 and 2016, SPP focused primarily on reducing the emissions of greenhouse gases and harmful substances such as particulate matter.

RIVM Report 2018-0069
Page 46 of 91
In this same period, biobased and circular procurement were applied in 0 to 30% of the tenders, depending on the product group. Social Return was applied in 10 to 70% of the tenders and Social International in 0 to 50% of the tenders. The tenders in 2015 and 2016 for the eight product groups jointly lead to an estimate of at least 4.9 megatonnes avoided emissions of greenhouse gases. These are the avoided emissions throughout the duration of the entire contract periods and lifetime of products. These avoided emissions of greenhouse gases (CO2eq) can primarily be attributed to the product groups Electricity and Solar panels. The analysis also shows that CO2 benefits have been achieved (and can be achieved) by incorporating requirements when procuring official cars and transport. The actual avoided emission is probably in excess of 4.9 megatonnes. This is because the effect of occupational clothing could not be included and because the size of the tenders in the sample for electricity was proportionally smaller than the total population within the product group. A further 1.4 megatonnes CO2 emissions were compensated for by the purchase of certificates. Biobased procurement led to the avoidance of the use of 13,000 tonnes oil equivalents.
8.3 Using and improving the method The method presented can be used in conjunction with other developments. The first three steps, in which tenders are selected and their texts examined, can be combined with the MVIZET, which is currently being developed. This is expected to lead to more insight into the size of, and variation within, product groups. The quantification of the effect per tender can subsequently be carried out by contracting authorities if so required, for their own annual reports within the organisation, for example. To this end, they will need the basic information of what is delivered for the respective tenders and a tool that converts this information into effect. This tool can be maintained centrally and used locally. For policy evaluation of SPP, the effects calculated with the tool can subsequently be extrapolated to total effects per product group. Until the link has been made with MVIZET and, if necessary, an effect tool has also been implemented, the method can be used as described in the examples in this report. In the first instance, this can be implemented for a number of product groups that are completely different, in terms of SPP, from energy, transport and occupational clothing, such as buildings and catering. At the same time, it is advisable to incorporate agreements on the delivery of the data required to assess the effect of tenders, such as the number of kilometres driven, in contracts with suppliers or even the delivery of these data during the contract, as a minimum requirement in tenders. This is already common practice in, for example, the product group Business trips.
RIVM Report 2018-0069
Page 47 of 91
8.4 Conclusion The use of the MVIZET and the further professionalization of SPP are expected to lead to possibilities for basing evaluations on samples that are more statistically sound. However, this does not detract from the conclusions that can already be drawn on the basis of the information that was available. The results for the first eight product groups show that environmental benefits have been achieved with SPP and that there is plenty of potential for more. Moreover, they provide insight into the differences between product groups and within product groups. This, in turn, yields possibilities for implementing SPP in practice: the next step in the policy cycle.

RIVM Report 2018-0069
Page 48 of 91

RIVM Report 2018-0069
Page 49 of 91
Acknowledgements
We would like to thank the procurers and contract managers of more than 62 contracting authorities for their constructive contributions to this study. We are also grateful to employees at CE Delft, the PBL Netherlands Environmental Assessment Agency (Planbureau voor de Leefomgeving), the Netherlands Organization for Applied Scientific Research (TNO), Directorate-General for Public Works and Water Management (RWS) and the Netherlands Enterprise Agency - Public Procurement Expertise Centre (RvO-PIANOo) for their input and inspiration. The Ministries of Infrastructure and Water Management and of Economic Affairs and the EnvironmentClimate Policy have read and commented on the draft versions of this report.

RIVM Report 2018-0069
Page 50 of 91

RIVM Report 2018-0069
Page 51 of 91
References
Akkermans (2017). Voorstel voor herziening criteria maatschappelijk verantwoord inkopen catering rijksoverheid (Proposal for revision of criteria for sustainable public procurement for catering for the Government of the Netherlands). Available via http://oliithe.nl/wp-content/uploads/2017/06/Rapport-Criteria-Catering-6.pdf
De Groene Zaak (2015). Quickscan: Duurzaam Inkopen bij provincies en gemeenten (Quick scan: Sustainable procurement by provinces and municipalities). Available on 2 November 2017 via http://degroenezaak.com/wp-content/uploads/2015/01/Rapport_DGZ_Duurzaam_Procurement.pdf.
De Valk et al. (2016). Milieubelasting van de voedselconsumptie in Nederland (The environmental burden of the food consumed in the Netherlands). RIVM report number 2016-0074, Bilthoven. Available on 2 November 2017 via http://degroenezaak.com/wp-content/uploads/2015/01/Rapport_DGZ_Duurzaam_Procurement.pdf.
Ecoinstitut (2015). Monitoring Sustainable Public Procurement Implementation Recommendations and Case Studies. Work Group 2A on ‘Monitoring SPP Implementation’ of the United Nations 10-Year Framework of Programmes on Sustainable Consumption and Production, Sustainable Public Procurement Programme April 2015 (provisional edition).
Huijbregts et al. (2016). ReCiPe 2016: A harmonized life cycle impact assessment method at midpoint and endpoint level Report I: Characterization RIVM report number 2016-0104, Bilthoven. Available on 2 November 2017 via http://www.rivm.nl/Documenten_en_publicaties/Wetenschappelijk/Rapporten/2016/december/ReCiPe_2016_A_harmonized_life_cycle_impact_assessment_method_at_midpoint_and_endpoint_level_Report_I_Characterization.
ISO (2017).ISO 20400 Sustainable Procurement, Guidance. Available on 1 December 2017 via https://www.iso.org/standard/63026.html.
Kok L., & Zijp, M. (2017) Tools voor Maatschappelijk Verantwoord Procurement Inkopen (Tools for sustainable public procurement). RIVM report number 2016-0204, Bilthoven. Available on 07 December 2017 via http://www.rivm.nl/Documenten_en_publicaties/Wetenschappelijk/Rapporten/2017/januari/Tools_voor_Maatschappelijk_Verantwoord_Inkopen.
PIANOo (2017a). SPP themes. Available on 5 April 2018 via https://www.pianoo.nl/public-procurement-in-the-netherlands/sustainable-public-procurement-spp/spp-themes.
PIANOo (2017b). Gewijzigde Aanbestedingswet 2012 (amended Public Procurement Act 2012). Available on 7 December 2017 via https://www.PIANOo.nl/regelgeving/aanbestedingswet-2012/dossier-wijziging-aanbestedingswet-2012.
PIANOo (2017c). Procurement process. Available on 7 December 2017 via https://www.PIANOo.nl/inkoopproces.

RIVM Report 2018-0069
Page 52 of 91
PIANOo (2017d). Wat is het onderscheid tussen geschiktheidseisen, uitsluitingsgronden and selectie- en gunningscriteria (What is the distinction between eligibility requirements, grounds for exclusion and selection and award criteria). Available on 7 December 2017 via https://www.PIANOo.nl/metrokaart/wat-is-onderscheid-tussen-geschiktheidseisen-uitsluitingsgronden-selectie-gunningcriteria.
Konkurrensverket (2017). Långsiktiga effekter av miljöanpassad upphandling. Uppdragsforskningsrapport 2017:5. ISSN-no. 1652-8089
KPMG (2011). Monitor duurzaam inkopen (Sustainable public procurement monitor) 2010. Available on 2 November 2017 via https://www.pianoo.nl/sites/default/files/documents/documents/eindrapportmonitorduurzaaminkopen.pdf.
Manifest, 2016 (Manifesto, 2016). Manifest Maatschappelijk Verantwoord Inkopen (Sustainable public procurement agreementmanifesto)
2016 - 2020 (Manifest MVI [SPP AgreementManifesto]). Available via https://www.pianoo.nl/themas/maatschappelijk-verantwoord-inkopen-mvi-duurzaam-inkopen/ontwikkelingen-mvi/manifest-maatschappelijk-verantwoord-inkopen.
Ministry of Economic Affairs (2016). Het inkoopvolume van de Nederlandse overheid (The Dutch government's procurement volumes). Available on 1 November 2017 via https://www.pianoo.nl/sites/default/files/documents/documents/inkoopvolume-van-nederlandse-overheid-september2016.pdf.
Natuur & Milieu (2015). Goed (aan)besteed? (Well tendered and spent?)? Available on 2 November 2017 via https://www.natuurenmilieu.nl/nieuwsberichten/gemeentes-leven-duurzaam-inkoopbeleid-niet-na/ .
Natuur & Milieu (2016). Benchmark: Duurzaam Inkopen van vervoer (Sustainable public procurement of transport). Available on 2 November 2017 via https://www.natuurenmilieu.nl/wp-content/uploads/2017/02/NM-Benchmark-Duurz-Ink-Vervoer-261016-4-ia.pdf .
Netherlands Enterprise Agency (Rijksdienst voor Ondernemend Nederland, RVO) (n.d.). Biobased economy. Available on 7 December 2017 via http://www.rvo.nl/onderwerpen/duurzaam-ondernemen/groene-economie/biobased-economy
Rijksoverheid (Government of the Netherlands) (2011). Social Return bij de overheid (The government and social return). Available on 2 November 2017 via https://www.rijksoverheid.nl/documenten/brochures/2011/07/01/social-return-bij-het-rijk-informatie-voor-bedrijven.
Rijksoverheid (Government of the Netherlands) (2015). Plan van Aanpak maatschappelijk verantwoord inkopen 2015-2020 (Sustainable public procurement action plan 2015-2020). Available on 1 November 2017 via https://www.rijksoverheid.nl/documenten/kamerstukken/2015/09/11/plan-van-aanpak-maatschappelijk-verantwoord-inkopen-2015-2020.
Telos & VNG Internationaal (2016). Hoe ambitieus zetten gemeenten duurzaam inkopen in (How ambitious are municipalities in their sustainable public procurement)? Available on 2 November 2017 via https://www.rijksoverheid.nl/documenten/rapporten/2016/02/29/ra
https://www.pianoo.nl/sites/default/files/documents/documents/eindrapportmonitorduurzaaminkopen.pdf.
RIVM Report 2018-0069
Page 53 of 91
pport-telos-hoe-ambitionus-zetten-gemeenten-duurzaam-inkopen-in.
Zijp, M., & De Zwart, D. (2013). Milieuwinst van Duurzaam Inkopen (Environmental benefits of sustainable public procurement): Een quickscan van de minimumeisen (A quick scan of the minimum requirements). RIVM report number 250005001, Bilthoven. Available on 2 November 2017 via http://www.rivm.nl/Documenten_en_publicaties/Wetenschappelijk/Rapporten/2014/februari/Milieuwinst_van_duurzaam_inkopen_Een_quick_scan_van_de_minimumeisen

RIVM Report 2018-0069
Page 54 of 91

RIVM Report 2018-0069
Page 55 of 91
Annex 1 Bottlenecks and success factors in the public procurement process
This annex describes the different phases of the public procurement process and some of the elements in each phase that determine how successful the SPP effect is. These issues can be used to evaluate the process. Initiation phase The public procurement process starts with the definition of the procurement needs. The user properties the service or product must comply with are specified. The methods used to award tenders are defined and the related award criteria are drawn up. Suppliers are identified on the basis of the award criteria. Elements that help determine the success of the SPP process: Preparation for procurement
• Is there administrative support for SPP in the organisation? • Has an SPP policy that translates sustainability ambitions and
goals been drawn up for your organisation? • Do the current procurement rules and procedures support SPP? • Does the organisation have the budget and time for SPP? • Do the organisation's personnel have sufficient knowledge and
adequate instruments to apply SPP? • Has the necessity of the service or product to be procured been
examined? Specification:
• Did the market exploration include looking at possibilities for green, circular or biobased procurement on the market?
• Were the organisation's SPP wishes discussed with potential suppliers in advance?
• Does what is available on the market comply with the requirements of the tender?
• Were SPP award criteria drawn up? • Were requirements drawn up that were more ambitious than the
minimum requirements for SPP? • Did the requirements and/or the award criteria reflect the
organisation's ambitions? • Was the assessment methodology for the award decision checked
(dry run)? • Was the initiation phase reviewed?
Tendering phase In the tendering phase, a contract is put out for tender in the market in accordance with a certain procedure. Multiple market parties can submit a tender. The contract is awarded to the supplier that scores best, given the award criteria laid down. Elements that help determine the success of the SPP process:

RIVM Report 2018-0069
Page 56 of 91
Selection • Is it apparent from the tenders submitted that suppliers have
understood the award criteria? • Has the way the SPP information delivered is to be verified been
determined in advance? • To what extent have the suppliers taken the award criteria into
account? • To what extent has the selected supplier taken the award criteria
into account? • To what extent does the selected tender comply with the SPP
ambitions drawn up? Contracting
• Have the SPP ambitions been safeguarded in the contract provisions?
• Has the way the SPP performance of the procurement is safeguarded been determined?
• Has the way compliance and evaluation of the intended SPP performance are to take place been laid down?
• Has the contract administrator been involved in the contracting? Implementation phase The implementation of the contract takes place in the last phase of the public procurement process. Services or products are ordered and will be delivered at a specific time. A check is carried out on whether the delivery actually takes place and whether it complies with the specifications laid down. After the invoice has been settled, the procurement file is updated and, in theory, the service or product procured is, in time, evaluated. In this phase, an analysis can actually be made of how green, circular and biobased the service or product delivered is. Monitoring
• Does the service or product procured comply with the SPP requirements and award criteria laid down in the contract?
• Have instructions or a handover file been supplied? • Have moments of evaluation with the supplier taken place?
Follow-up
• Has the procurement process been evaluated with the supplier? • Has the procurement process been evaluated in the organisation? • Are services and products procured by means of SPP
procurement used and handled in the intended manner? • Has the service or product procured led to environmental benefits
(compared with services or products based on minimum requirements)?
• Have these environmental benefits been calculated?

RIVM Report 2018-0069
Page 57 of 91
Annex 2 Step 3 score table ‘Examining the tender text’
Reference Scoring Reference of the tender
ID Unique sample number TenderNed ID TenderNed number
Type of tender Product group Description Product group subcategory Description Tender Description Are there indications that SPP was applied?
Yes/No
What SPP criteria/requirements were applied?
Minimum requirements from criteria documents, Social Return and/or ILO?
Yes/No
More ambitious requirements
Yes/No
Award criteria Yes/No Policy themes Green Yes/No
Biobased Yes/No Circular Yes/No Social International Yes/No Social Return Yes/No CSR general Yes/No
Size/value Size/value of tender Euro What texts are evidence of SPP?
Keywords that indicate SPP Open question Where are these keywords? Open question
Sources Name of annex Open question Link to TenderNed Web link to tender
Contact details Contracting authority Description Contact person At the contracting authority E-Mail Open question Telephone Open question
Particulars Comments Open question

RIVM Report 2018-0069
Page 58 of 91
Annex 3 Product group Business trips abroad
Step 1: Longlist A longlist of 18 tenders was drawn up. This longlist was based on a selection from the TenderNed database printout for this product group for the years 2015 and 2016, which was subsequently filtered manually. Step 2: Sample The longlist was subdivided into subcategories manually. The subdivision in the minimum criteria document (version dated March 2017) is as follows:
• travel agency services and suchlike; • supporting and supplementary transport services, travel agency
services; • travel services; • organising business trips.
With this subdivision, almost all of the tenders for business trips abroad fitted into more than one subcategory at the same time, which was not workable. The subdivision in this case was therefore limited to: Table B3.1 Subcategories of the product group Business trips abroad. Subcategories Longlist Sample Travel agency services 16 9 Other travel services 2 1 Step 3: Tender text For many of the tenders in TenderNed, references were made to Negometrix, Commercehub or CTM solutions, which implemented the tenders. These platforms do not enable access to the tender annexes. The annexes therefore had to be requested via the procurers for the purposes of this study. One of the ten tenders in the sample had not yet been put out to tender. The texts and documents of the other tenders were examined and scored for SPP by two researchers. Each tender was therefore examined twice. This resulted in the following picture: 1 2 3 4 5 6 7 8 9 10
Environmental Circular
Biobased Social Return
Social International Figure B3.1 Score on SPP for the product group Business trips.
• Six of the nine tenders apply SPP in some way. • Five of the nine tenders lay down minimum requirements in the
environmental field. This involves climate change compensation and offering train journeys instead of flights.
• One tender asks for initiatives in the field of Social Return.

RIVM Report 2018-0069
Page 59 of 91
Step 4: Interaction with the procurers and contract managers Contact was sought with the procurers and contract managers of the tenders that incorporated SPP. The data required for this product group is as follows:
• What is the CO2 compensation realised annually? • How many kilometres have been travelled by train to other
countries? • Have sustainability benefits been achieved in any other way via
this tender? • What was the ultimate value of this tender?
A number of observations were made in response to the interaction with the procurers and contract managers:
• The data was available for most of the tenders. • For two of the parties, the tender had just gone into effect and
there was not yet any insight into the CO2 compensation. For these two tenders, the extrapolation was made on the basis of earlier contracts, assuming that the average number of trips per year does not change.
• One party did not wish to share any data. This tender was not included in the calculation of the CO2 compensation. The value of the tenders in the sample varied from € 6 hundred thousand to € 9 million.
Step 5: Quantification In this product group, multi-year contracts are awarded. These contracts vary from one to five years. The SPP agreements in these contracts apply for the duration of the contract. The contract determines the environmental and social benefits achieved over the entire contract period. This is why Table B3.2 shows the benefits for the sample, taking into account the various contract periods; the benefits in the contract period so far have been extrapolated to the entire period. The effect for Social Return is unclear. This is because the requirement for Social Return is not laid down for the product itself but for the operational part of the tender, which is only a small part of the total expenditure for this product group. The question is therefore what the effect of these requirements in these types of tenders on Social Return is. This has not been further examined. More information about this can be found in section 5.5.6 and annex 6 Product groups Energy. Table B3.2 Quantification of benefits due to SPP for the sample over the entire contract periods. SPP theme Subtheme Unit Result Climate change Euros spent on procurement in
which investments are also made in environmental benefits
€ 9,800,000 (44% of total)
Social Return Euros spent on procurement in which investments are also made in social return
€ ?
Climate change Total compensated emissions of greenhouse gases
tonne CO2 eq
17,000

RIVM Report 2018-0069
Page 60 of 91
In this product group, the following variation was found in avoided emissions per euro spent:
• Climate change: 0-3.7 kg CO2 eq
Context The procurers interviewed for the study had the following comments about the procurement practice:
• CO2 compensation is in fact already considered a standard requirement in tenders.
• Most benefits are to be achieved by holding online rather than face-to-face meetings and by going by train instead of flying but, in practice, this is not really actively promoted.
• In order to determine whether these measures are taken, a trend analysis can be carried out to compare the number of journeys taken per fte per type of transport for a number of successive years.
Step 6: Extrapolation Extrapolation on the basis of numbers results in an order of magnitude of: 38,000 tonnes avoided CO2 emissions. This is therefore the avoided effect due to the incorporation of SPP in tenders in the years 2015 and 2016 of contracts for arranging business trips abroad. The tenders took place in 2015 and 2016 so the effect itself takes place in subsequent years, of course.

RIVM Report 2018-0069
Page 61 of 91
Annex 4 Product group Official cars
Step 1: Longlist A longlist of 274 tenders was drawn up. This longlist was based on a selection from the TenderNed database printout for this product group for the years 2015 and 2016, which was subsequently filtered manually. Step 2: Sample The longlist was subdivided into subcategories manually. The subdivision in the minimum criteria document (version dated March 2017) is as follows:
• Passenger cars; • Cars: estate cars and saloons; • Estate cars; • Saloons; • Vehicles with four-wheel drive; • Jeeps; • All-terrain vehicles; • Off-road vehicles; • Special vehicles; • Minibuses; • Other passenger cars; • Motor vehicles for the transport of fewer than ten people; • Vans; • Light vans; • Company cars; • Electric vehicles; • Repair and maintenance of motor vehicles and related
equipment; • Management, repair and maintenance of vehicle fleet; • Repair and maintenance of cars; • Car wash and related services; • Cleaning of transport equipment.
This subdivision is too extensive for the purposes of this study and has therefore been abbreviated as follows: Table B4.1 Subcategories of the product group Official cars. Subcategories Longlist Sample
Procurement of vehicles for use in the country
198 7
Leasing and vehicle fleet 47 2
Maintenance and delivery of parts 29 1
Step 3: Tender text Many of the tenders were implemented via Negometrix, Commercehub or CTM solutions with a reference in TenderNed to these platforms. These platforms do not enable access to the tender annexes. The annexes therefore had to be requested via the procurers for the purposes of this study. The texts and documents of the tenders were

RIVM Report 2018-0069
Page 62 of 91
examined and scored for SPP by two researchers. Each tender was therefore examined twice. This resulted in the following picture: 1 2 3 4 5 6 7 8 9 10
Environmental
Circular
Biobased
Social Return
Social International Figure B4.1 Score on SPP for the product group Official cars.
• Eight of the ten tenders apply SPP in some way. • Eight of the ten tenders laid down minimum requirements in the
environmental field, two tenders supplemented these with more ambitious requirements and four tenders also used SPP award criteria.
• Requirements relating to biobased and Social Return were incorporated in two different tenders.
• Requirements relating to Social conditions in global supply chains in tenders (hereinafter referred to as 'Social International') were incorporated in two tenders.
Step 4: Interaction with the procurers and contract managers Contact was sought with the procurers and contract managers of the tenders that incorporated SPP. The basic data required for this tender were:
• What was ultimately delivered (the number of cars, type of fuel, Euro standards they complied with)?
• What was the consumption or what were the emissions in g CO2 per kilometre per car delivered (manufacturer's specifications)?
• Can you estimate the number of kilometres driven annually per car delivered?
• What was the ultimate value of the tender? • In the case of a vehicle that runs on biogas: is biogas actually
used in practice? A number of sustainability requirements were disregarded from this step onwards because the effect is very small compared to the emissions in the use phase:
• type of lubricating oils; • water-saving car washing.
And/or because it is seen as business-as-usual and use cannot be checked in practice:
• presence of tyre pressure meters, cruise control, etc.; • water-saving car washing.
Ultimately no data were delivered for one tender. The quantification step for this tender was based on the data laid down in the tender texts.

RIVM Report 2018-0069
Page 63 of 91
Step 5: Quantification In this product group, multi-year contracts are awarded in the subcategory Leasing and Vehicle fleet. These contracts vary from one to five years. The SPP agreements in these contracts apply for the duration of the contract. The contract determines the environmental and social benefits achieved over the entire contract period. This is why Table B5.2 shows the benefits for the sample, taking into account the various contract periods. For tenders in which vehicles are actually purchased, the benefits are calculated over the period that the organisation in question expects to use the vehicle. If the vehicle is used intensively, a depreciation period of three years is observed. The annual kilometres driven and the expected duration of use are reflected in the tender specifications. These figures are verified by the procurers. If there is any uncertainty regarding the annual kilometres driven, 23,000 km per year is assumed for official cars, 13,000 km per year for vans, chassis and off-road vehicles, and 1,500 km per year for road sweeping vehicles. These numbers are calculated from averages from 20125 and the annual kilometres driven from tenders in the sample for which this was known. The reference for calculating the avoided impact for this product group was a diesel vehicle with a Euro 5 standard. The CO2 emission figures used for this reference originate from CO2emissiefactoren.nl (Table B5.3). The difference between the manufacturer's specifications and the diesel reference gives the avoided emissions during use (Tank-to-Wheel). These emissions are subsequently corrected for the emissions during production and transport of the fuels (Well-to-Tank) by adding the difference between the emissions of the fuel chosen and the reference to this figure. In the case of Bio compressed natural gas (CNG), the avoided impact is therefore smaller and, in the case of natural gas and electric, the avoided impact by incorporating Well-to-Tank larger. Table B4.3 Emission factors used in calculating the avoided emissions of greenhouse gases for the references and in the absence of manufacturer's specifications. Source: CO2emissiefactoren.nl (consulted on 17 November 2017). CO2 emission figures (Kg CO2 per km) Tank-to-
Wheel Well-to-
Tank Natural gas/CNG (<1100) 0,122 0,027 Natural gas/CNG (1100-1500) 0,154 0,035 Natural gas/CNG (>1500) 0,174 0,039 Bio CNG (average) 0,006 0,070 Petrol (<1350) 0,186 0,038 Petrol (>1350) 0,210 0,043 Petrol (hybrid) 0,142 0,029 Diesel (>1450 kg) 0,193 0,047 Diesel 1050-1450 0,171 0,042
5https://www.cbs.nl/nl-nl/achtergrond/2012/14/nieuwste-bestelauto-s-maken-meeste-kilometers and https://www.cbs.nl/nl-nl/nieuws/2012/10/personenauto-s-rijden-gemiddeld-37-kilometer-per-dag

RIVM Report 2018-0069
Page 64 of 91
CO2 emission figures (Kg CO2 per km) Tank-to-Wheel
Well-to-Tank
Diesel <1050 0,135 0,033 Diesel (hybrid) 0,126 0,031 Electric (electricity from non-renewable sources)
0 0,017
Small lorries (<10 tonnes) 0,336 0,096 Environmental The benefits for the environment primarily comprise a reduction in emissions of greenhouse gases (see under the heading 'climate change') and of substances that are detrimental to air quality. The latter are incorporated by stipulating Euro 6 standard vehicles. The main difference between the Euro 5 and the Euro 6 standards for diesel vehicles comprises the more stringent requirement for the emissions of NOx. This is why the benefits due to reduced emissions of NOx have been included in this analysis. Ultimately, emissions amounting to 286 kg NOx were avoided by applying SPP in this sample. Biobased One of the ten tenders referred to the transition to a biobased economy and stipulated a biogas-powered van. This type of van was delivered, which resulted in a contribution to avoided fossil fuel consumption of 240 avoided tonnes oil equivalents in the sample. Climate change The requirements concerning CO2 emissions per kilometre and tendering for non-fossil fuel powered vehicles resulted in more than 200 tonnes avoided emissions of greenhouse gases in the sample. Social International It is considered standard to incorporate and endorse Social International in tenders but this is not enforced. It is difficult to say whether it has any effect and a question mark has therefore been inserted in the result column in Table B4.4. Table B4.4 Quantification of SPP benefits for the sample over the entire contract periods and periods of depreciation. SPP theme Subtheme Unit Result Environmental Euros spent on procurement in
which investments are also made in environmental benefits
€ 2,400,000 (88% of
total) Biobased Euros spent on procurement in
which investments are also made in the transition to a biobased economy
€ 180,000 (7% of total)
Social return Euros spent on procurement in which investments are also made in social return
€ 380,000 (14% of
total) Social intern. Euros spent on procurement in € ?
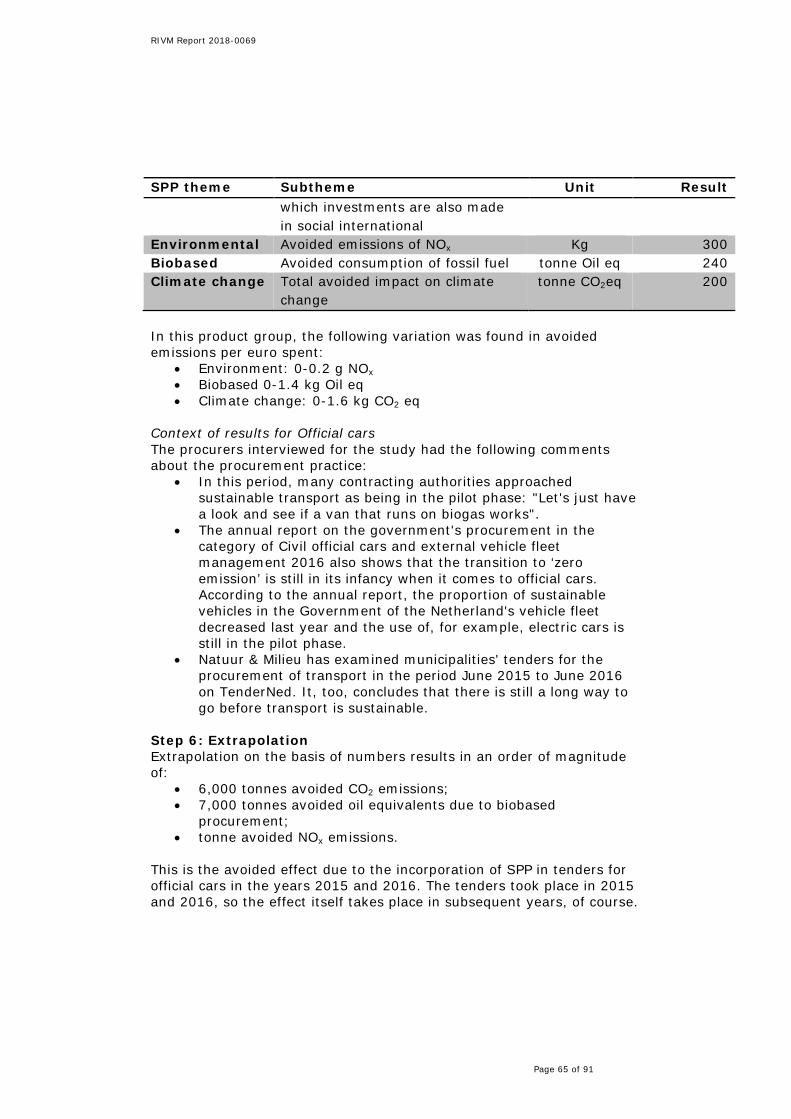
RIVM Report 2018-0069
Page 65 of 91
SPP theme Subtheme Unit Result which investments are also made in social international
Environmental Avoided emissions of NOx Kg 300 Biobased Avoided consumption of fossil fuel tonne Oil eq 240 Climate change Total avoided impact on climate
change tonne CO2eq 200
In this product group, the following variation was found in avoided emissions per euro spent:
• Environment: 0-0.2 g NOx• Biobased 0-1.4 kg Oil eq• Climate change: 0-1.6 kg CO2 eq
Context of results for Official cars The procurers interviewed for the study had the following comments about the procurement practice:
• In this period, many contracting authorities approachedsustainable transport as being in the pilot phase: "Let's just havea look and see if a van that runs on biogas works".
• The annual report on the government's procurement in thecategory of Civil official cars and external vehicle fleetmanagement 2016 also shows that the transition to ‘zeroemission’ is still in its infancy when it comes to official cars.According to the annual report, the proportion of sustainablevehicles in the Government of the Netherland's vehicle fleetdecreased last year and the use of, for example, electric cars isstill in the pilot phase.
• Natuur & Milieu has examined municipalities' tenders for theprocurement of transport in the period June 2015 to June 2016on TenderNed. It, too, concludes that there is still a long way togo before transport is sustainable.
Step 6: Extrapolation Extrapolation on the basis of numbers results in an order of magnitude of:
• 6,000 tonnes avoided CO2 emissions;• 7,000 tonnes avoided oil equivalents due to biobased
procurement;• tonne avoided NOx emissions.
This is the avoided effect due to the incorporation of SPP in tenders for official cars in the years 2015 and 2016. The tenders took place in 2015 and 2016, so the effect itself takes place in subsequent years, of course.

RIVM Report 2018-0069
Page 66 of 91
Annex 5 Product group Contract transport and Transport services
The step-by-step plan was gone through separately for these two product groups. Step 4 showed that there was sufficient data available for half of the samples for both product groups. Moreover, the product groups were similar to one another as regards service and type of requirements, so they were combined from the quantification step (step 5).
Step 1: Longlist A longlist of 164 tenders was drawn up. This longlist was based on a selection from the TenderNed database printout for the product group Transport services for the years 2015 and 2016, which was subsequently filtered manually.
Step 2: Sample The longlist included tenders concerning Transport on Demand, school transport and transport to and from gym or swimming pool, postal services and transport services. The first three fall within the product group Contract transport and are described in the environmental criteria document for Contract transport. The latter two are described in the environmental criteria document for Transport services (version dated March 2017).
Initially, a further subdivision was made into the product groups Contract transport (90 tenders) and Transport services (74 tenders), as can be seen in the table below, for the taking of the sample. Afterwards, the decision was made to combine these product groups from step 4, that is, in steps 5 and 6. The reason for this was that there was not sufficient information available for each separate product group for the quantification and extrapolation of the SPP benefits and that tenders in these two product groups were comparable.
Table B5.1 Samples of product groups Contract transport and Transport services Subcategories Longlist Sample Contract transport (Transport on Demand, School transport and transport to and from gym or swimming pool)
90 10
Transport services (Transport services and Postal services) 74 10
Step 3: Tender text The texts and documents of the ten tenders in the sample for Contract transport and Transport services were examined and scored for SPP by two researchers. Each tender was therefore examined twice. This resulted in the following picture:
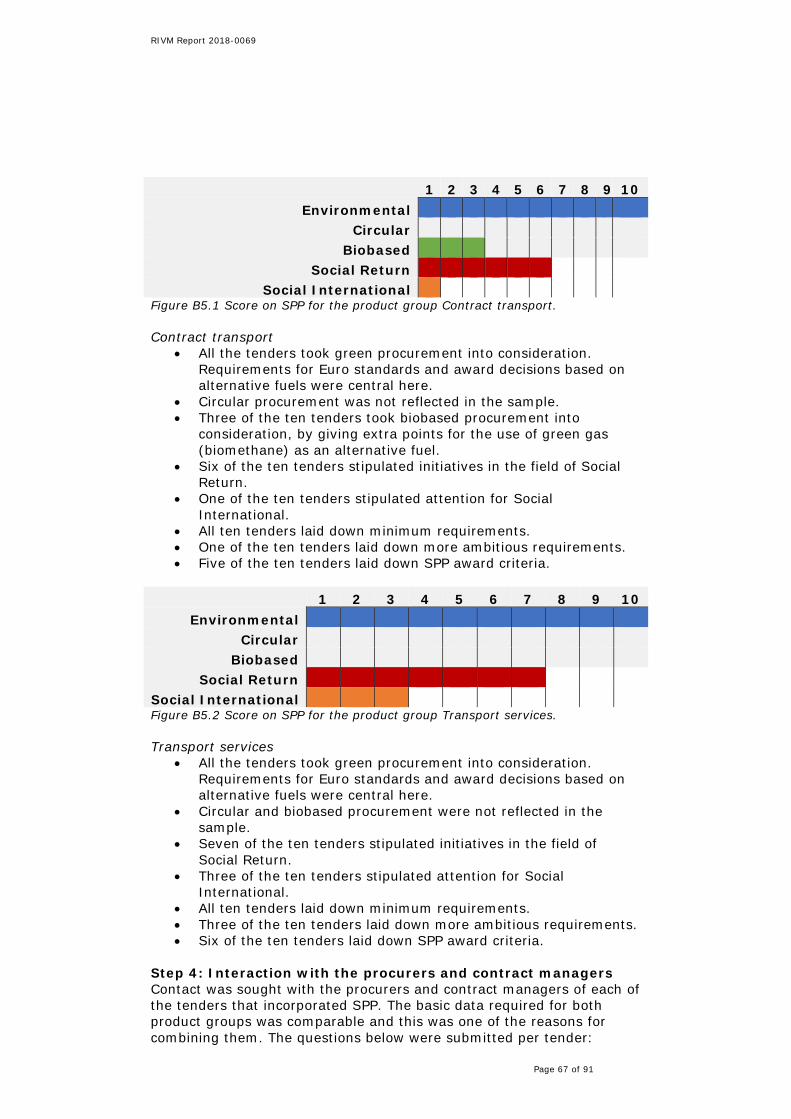
RIVM Report 2018-0069
Page 67 of 91
1 2 3 4 5 6 7 8 9 10 Environmental 1 1 1 1 1 1 1 1 1 1
Circular Biobased 1 1 1
Social Return 1 1 1 1 1 1 Social International 1
Figure B5.1 Score on SPP for the product group Contract transport.
Contract transport • All the tenders took green procurement into consideration.
Requirements for Euro standards and award decisions based onalternative fuels were central here.
• Circular procurement was not reflected in the sample.• Three of the ten tenders took biobased procurement into
consideration, by giving extra points for the use of green gas(biomethane) as an alternative fuel.
• Six of the ten tenders stipulated initiatives in the field of SocialReturn.
• One of the ten tenders stipulated attention for SocialInternational.
• All ten tenders laid down minimum requirements.• One of the ten tenders laid down more ambitious requirements.• Five of the ten tenders laid down SPP award criteria.
1 2 3 4 5 6 7 8 9 10 Environmental 1 1 1 1 1 1 1 1 1 1
Circular Biobased
Social Return 1 1 1 1 1 1 1 Social International 1 1 1 Figure B5.2 Score on SPP for the product group Transport services.
Transport services • All the tenders took green procurement into consideration.
Requirements for Euro standards and award decisions based onalternative fuels were central here.
• Circular and biobased procurement were not reflected in thesample.
• Seven of the ten tenders stipulated initiatives in the field ofSocial Return.
• Three of the ten tenders stipulated attention for SocialInternational.
• All ten tenders laid down minimum requirements.• Three of the ten tenders laid down more ambitious requirements.• Six of the ten tenders laid down SPP award criteria.
Step 4: Interaction with the procurers and contract managers Contact was sought with the procurers and contract managers of each of the tenders that incorporated SPP. The basic data required for both product groups was comparable and this was one of the reasons for combining them. The questions below were submitted per tender:
RIVM Report 2018-0069
Page 68 of 91
• What types of vehicles were used and what were their characteristics (model, fuel, alternative propulsion systems and Euro standards)?
• What was the number of kilometres driven per type of vehicle used?
• What were the CO2 emissions in g/kilometre per type of vehicle used?
• What was the CO2 compensation realised annually? • Were sustainability benefits achieved in any other way via this
tender? • What was the ultimate value of this tender?
A number of observations were made in response to the interaction with the procurers and contract managers:
• It was not possible to obtain the information required for around half of the tenders. In most cases, the contact persons were not able to tackle the questions because they were too busy. For strategic reasons, it was not practical to approach the administrators of two of the tenders for information.
• It was apparent in retrospect that one tender did not incorporate any environmental conditions whereas this had been expected.
• The journeys are not all registered in terms of 'loaded kilometres travelled'. In a few cases, 'loaded travel minutes' were invoiced.
• External consultants were regularly included as contact persons in the tenders but they do not manage the required information. In most cases it was possible to get into contact with the contract manager through them.
Step 5: Quantification In this product group, multi-year contracts are awarded. These contracts vary from one to five years. The SPP agreements in these contracts apply for the duration of the contract. The contract determines the environmental and social benefits achieved over the entire contract period. This is why Table B5.2 shows the benefits for the sample, taking into account the various contract periods; the benefits in the contract period so far have been extrapolated to the entire period. The SPP benefits included in Table B5.2 were calculated on the basis of nine of the ten tenders and the number of euros invested in SPP on the basis of eight of the ten tenders. It was not possible to collect the required data for all the tenders. A Euro 4 standard diesel vehicle was therefore opted for as reference for quantifying the SPP benefits in this product group. In the criteria documents (version dated April 2015) the Euro 5 standard is stipulated as a minimum requirement. The way in which the SPP benefits were quantified is described briefly below:
• Harmful substances – The difference between the standard NOx- and particulate matter (PM) emission factors for the Euro standards. For electric drive, a comparison is made with the emissions from the diesel reference.
• Climate change – The difference between the CO2 emission factor reported (often via RDW) and the Tank-to-Wheel (TTW) emission factors. For biofuels and electric drive, the difference between the TTW emission factors and those of the diesel reference is key.

RIVM Report 2018-0069
Page 69 of 91
• Biobased – The use of biofuels is converted to avoided consumption of oil equivalents.
The CO2 emission figures used for this reference originate from CO2emissiefactoren.nl (Table B5.3). The difference between the manufacturer's specifications and the diesel reference indicates the avoided emissions during use (Tank-to-Wheel). These emissions are subsequently corrected for the emissions during production and transport of the fuels (Well-to-Tank) by adding the difference between the emissions of the fuel chosen and the reference to this figure. In the case of Bio CNG, the avoided impact is therefore smaller and, in the case of ordinary natural gas and electric, the avoided impact by incorporating Well-to-Tank larger. Table B5.3 Emission factors used in calculating the avoided emissions of greenhouse gases for the references and in the absence of manufacturer's specifications. Source: CO2emissiefactoren.nl (consulted on 17 November 2017) CO2 emission figures (Kg CO2 per km)
Tank-to-Wheel
Well-to-Tank
Natural gas/CNG (<1100) 0,122 0,027 Natural gas/CNG (1100-1500) 0,154 0,035 Natural gas/CNG (>1500) 0,174 0,039 Bio CNG (average) 0,006 0.07 Petrol (<1350) 0,186 0,038 Petrol (>1350) 0.21 0,043 Petrol (hybrid) 0,142 0,029 Diesel (>1450 kg) 0,193 0,047 Diesel 1050-1450 0,171 0,042 Diesel <1050 0,135 0,033 Diesel (hybrid) 0,126 0,031 Electric (electricity from non-renewable sources)
0 0,017
Small lorries (<10 tonnes) 0,336 0,096 Environmental The benefits for the environment primarily comprise a reduction in emissions of greenhouse gases (see under the heading 'climate change') and of substances that are detrimental to air quality. The latter are incorporated by stipulating Euro 5 and 6 standard vehicles. The main difference between the Euro 4 and 5 standards and the Euro 6 standard for diesel vehicles comprises the more stringent requirement for the emissions of NOx. This is why the benefits due to reduced emissions of NOx have been included in this analysis. Ultimately, emissions amounting to 1100 kg NOx were avoided by applying SPP in this sample. Biobased One of the ten tenders stipulated alternative fuels by means of award criteria. The vehicles delivered use green gas, which contributes to avoided fossil fuel consumption of 330,000 kg oil equivalents.
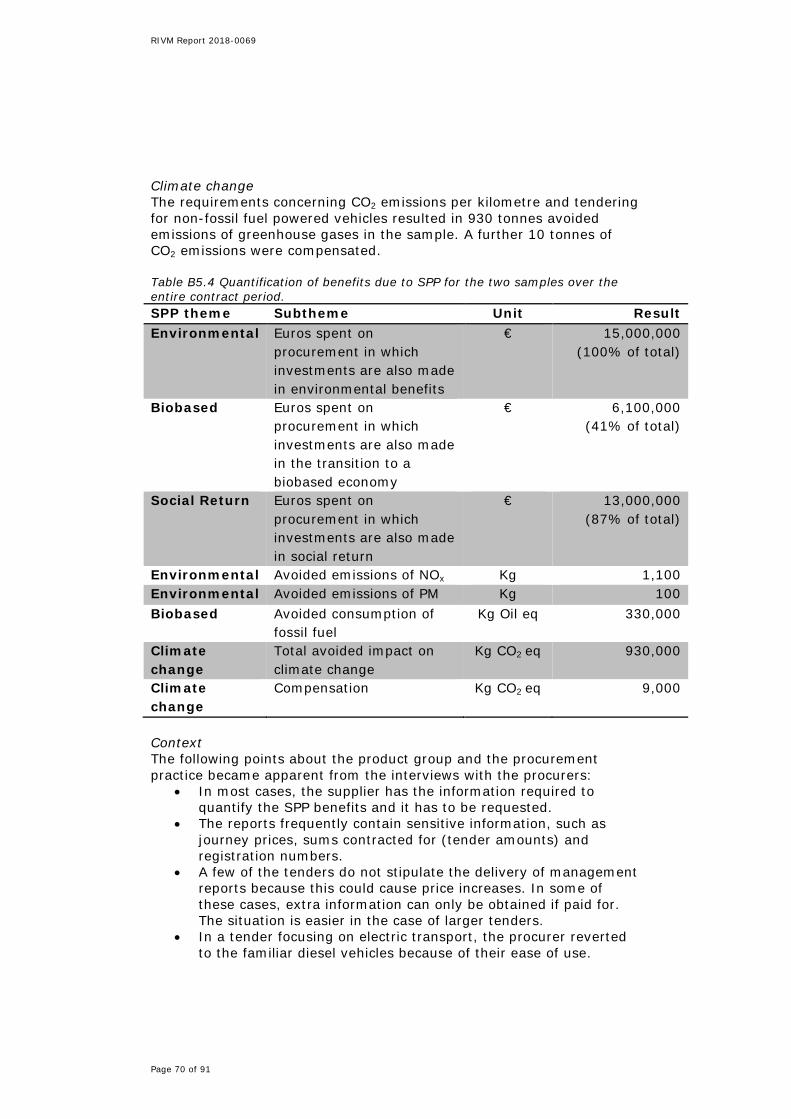
RIVM Report 2018-0069
Page 70 of 91
Climate change The requirements concerning CO2 emissions per kilometre and tendering for non-fossil fuel powered vehicles resulted in 930 tonnes avoided emissions of greenhouse gases in the sample. A further 10 tonnes of CO2 emissions were compensated. Table B5.4 Quantification of benefits due to SPP for the two samples over the entire contract period. SPP theme Subtheme Unit Result Environmental Euros spent on
procurement in which investments are also made in environmental benefits
€ 15,000,000 (100% of total)
Biobased Euros spent on procurement in which investments are also made in the transition to a biobased economy
€ 6,100,000 (41% of total)
Social Return Euros spent on procurement in which investments are also made in social return
€ 13,000,000 (87% of total)
Environmental Avoided emissions of NOx Kg 1,100 Environmental Avoided emissions of PM Kg 100 Biobased Avoided consumption of
fossil fuel Kg Oil eq 330,000
Climate change
Total avoided impact on climate change
Kg CO2 eq 930,000
Climate change
Compensation Kg CO2 eq 9,000
Context The following points about the product group and the procurement practice became apparent from the interviews with the procurers:
• In most cases, the supplier has the information required to quantify the SPP benefits and it has to be requested.
• The reports frequently contain sensitive information, such as journey prices, sums contracted for (tender amounts) and registration numbers.
• A few of the tenders do not stipulate the delivery of management reports because this could cause price increases. In some of these cases, extra information can only be obtained if paid for. The situation is easier in the case of larger tenders.
• In a tender focusing on electric transport, the procurer reverted to the familiar diesel vehicles because of their ease of use.

RIVM Report 2018-0069
Page 71 of 91
Step 6: Extrapolation Extrapolation on the basis of numbers resulted in the order of magnitude of SPP benefits given below. This extrapolation was based on nine of the ten tenders:
• 20 tonnes avoided NOx emissions; • 2 tonnes avoided PM emissions; • 6,000 tonnes avoided oil equivalents due to biobased
procurement; • 17,000 tonnes avoided CO2 emissions; • 170 tonnes compensated CO2 emissions.
This is the avoided effect due to the incorporation of SPP in tenders for transport services in the years 2015 and 2016. The tenders took place in 2015 and 2016 so the effect itself takes place in subsequent years, of course.

RIVM Report 2018-0069
Page 72 of 91
Annex 6 Product groups Energy (Electricity, Solar panels and Gas)
Step 1: Selection of product groups There are two criteria documents available for energy: one for tenders for electricity and one for tenders for gas. In the TenderNed database, 326 tenders from the period 2015-2016 fell within the CPV category ‘petroleum products, fuel, electricity and other energy sources’ (on the basis of the CPV code). As the name implies, besides the procurement of gas and electricity, these tenders also involved other types of energy. A distinction can be made between:
• fuels for vehicles (lubricants, fuel passes, ferry fuels, ship fuelsand aircraft fuels);
• energy production infrastructure (grid losses, emergency andregulating power, energy infrastructure maintenance activities);
• materials for infrastructure (electricity, gas, heat and coldstorage)
• solar panels for own electricity generation;• electricity supply;• gas supply.
There are no SPP-criteria documents available for the first four of these types of tenders. Elsewhere in the annex an estimate was made of the SPP benefits for electricity and gas. Tenders concerning solar panels were also included because solar panels can be deemed elements of sustainable electricity. These three subcategories cover around 66% of the tenders: electricity supplies (N=81), gas supplies (N=69) and solar panels (N=65) leading to a total of 215 tenders. A sample was taken and an estimate made per subcategory (as described in Table B6.1).
Table B6.1 Product groups for energy. Subcategories Longlist (N) Sample (n) Electricity 81 10 Solar panels 65 10 Gas 69 10 Total 215 30
B6.1 Product group Electricity
Step 1: Selection of product group Electricity There is a separate criteria document for the procurement of electricity. It stipulates a single minimum requirement: the electricity procured must originate from 100% renewable energy sources. Renewable sources may comprise: wind, solar energy, geothermal heat, wave energy, tidal energy, hydropower, biomass, landfill gas, sewage treatment plant gas and biogas. The document also makes a few suggestions regarding other award criteria and attention points6.
6 www.pianoo.nl/sites/default/files/documents/documents/milieucriteriaelektriciteit-maart2017.pdf
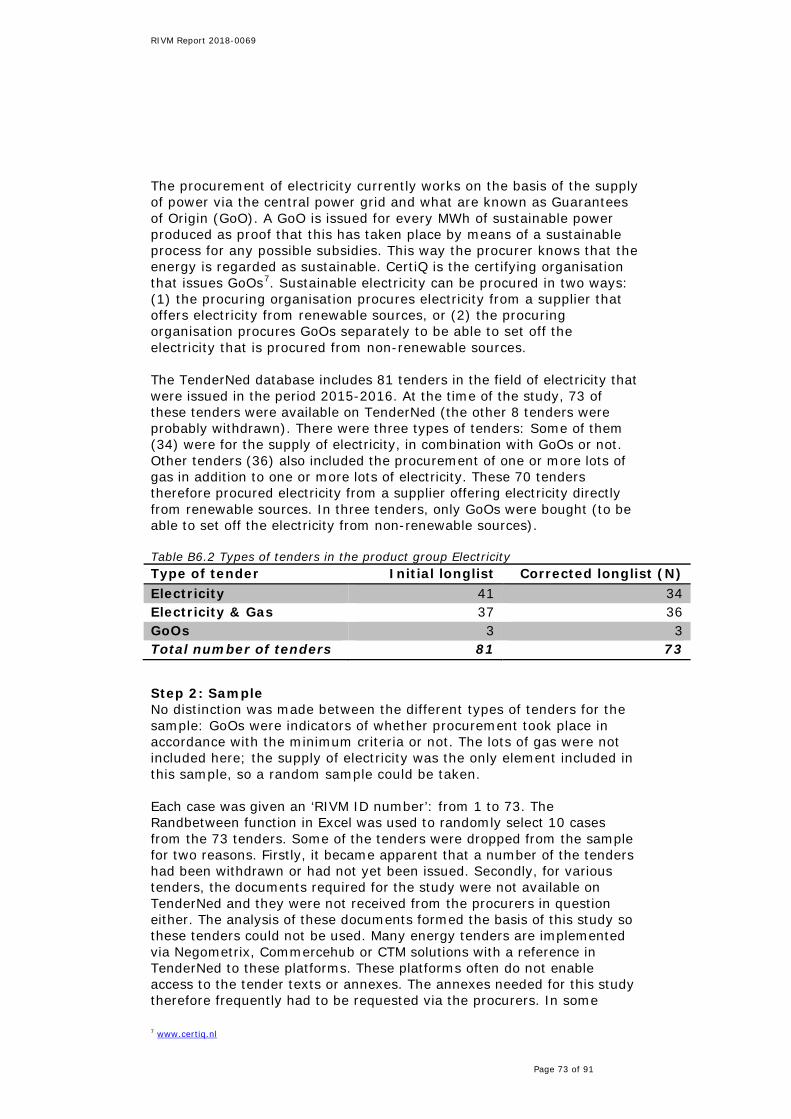
RIVM Report 2018-0069
Page 73 of 91
The procurement of electricity currently works on the basis of the supply of power via the central power grid and what are known as Guarantees of Origin (GoO). A GoO is issued for every MWh of sustainable power produced as proof that this has taken place by means of a sustainable process for any possible subsidies. This way the procurer knows that the energy is regarded as sustainable. CertiQ is the certifying organisation that issues GoOs7. Sustainable electricity can be procured in two ways: (1) the procuring organisation procures electricity from a supplier that offers electricity from renewable sources, or (2) the procuring organisation procures GoOs separately to be able to set off the electricity that is procured from non-renewable sources. The TenderNed database includes 81 tenders in the field of electricity that were issued in the period 2015-2016. At the time of the study, 73 of these tenders were available on TenderNed (the other 8 tenders were probably withdrawn). There were three types of tenders: Some of them (34) were for the supply of electricity, in combination with GoOs or not. Other tenders (36) also included the procurement of one or more lots of gas in addition to one or more lots of electricity. These 70 tenders therefore procured electricity from a supplier offering electricity directly from renewable sources. In three tenders, only GoOs were bought (to be able to set off the electricity from non-renewable sources). Table B6.2 Types of tenders in the product group Electricity Type of tender Initial longlist Corrected longlist (N) Electricity 41 34 Electricity & Gas 37 36 GoOs 3 3 Total number of tenders 81 73
Step 2: Sample No distinction was made between the different types of tenders for the sample: GoOs were indicators of whether procurement took place in accordance with the minimum criteria or not. The lots of gas were not included here; the supply of electricity was the only element included in this sample, so a random sample could be taken. Each case was given an ‘RIVM ID number’: from 1 to 73. The Randbetween function in Excel was used to randomly select 10 cases from the 73 tenders. Some of the tenders were dropped from the sample for two reasons. Firstly, it became apparent that a number of the tenders had been withdrawn or had not yet been issued. Secondly, for various tenders, the documents required for the study were not available on TenderNed and they were not received from the procurers in question either. The analysis of these documents formed the basis of this study so these tenders could not be used. Many energy tenders are implemented via Negometrix, Commercehub or CTM solutions with a reference in TenderNed to these platforms. These platforms often do not enable access to the tender texts or annexes. The annexes needed for this study therefore frequently had to be requested via the procurers. In some 7 www.certiq.nl

RIVM Report 2018-0069
Page 74 of 91
cases, these data were not obtained, which meant that multiple sampling rounds were necessary to arrive at a selection of ten cases.
Step 3: Tender text The texts and documents of ten tenders were examined and scored for SPP by two researchers. Each tender was therefore examined twice. This resulted in the following picture: environmental requirements or criteria had been incorporated in nine of the ten tenders. Social Return was mentioned in three tenders and Social International in two tenders.
1 2 3 4 5 6 7 8 9 10 Environment & Climate change
Circular Biobased
Social Return Social International
Figure B6.1 SPP themes in tender texts.
In three tenders, award criteria were incorporated in the tender in addition to the minimum requirements. One tender of the three also had more ambitious environmental requirements.
1 2 3 4 5 6 7 8 9 10 Minimum requirements
More ambitious requirements Award criteria
Figure B6.2 Minimum requirements, more ambitious requirements and award criteria regarding SPP.
Most tenders were framework contracts for several years; 2 years (n=4), 3 years (n=2), 4 years (n=1), 5 years (n=1). Two tenders mentioned a contract of one year. Many tenders mentioned an option to extend the contract by one to two years. In one case, an extension of four years was possible and, in another, an extension of 15 years. The contracts/supply started at the beginning of 2016 (n=4), 2017 (n=5) and 2018 (n=1).
Step 4: Interaction with the procurers and contract managers The procurers and contract managers of all the selected tenders were contacted for additional information or to check the information found. The following questions were asked, depending on whether they were relevant for the tender in question:
• How much electricity was supplied per year (or is expected to besupplied if this is to take place in the future)?
• How was this electricity generated?• From what country or region did the electricity originate?• What was the value of the tender?• To what extent did Social Return play a role?• To what extent did Social International play a role?• Did other sustainability aspects play a role in the tender?
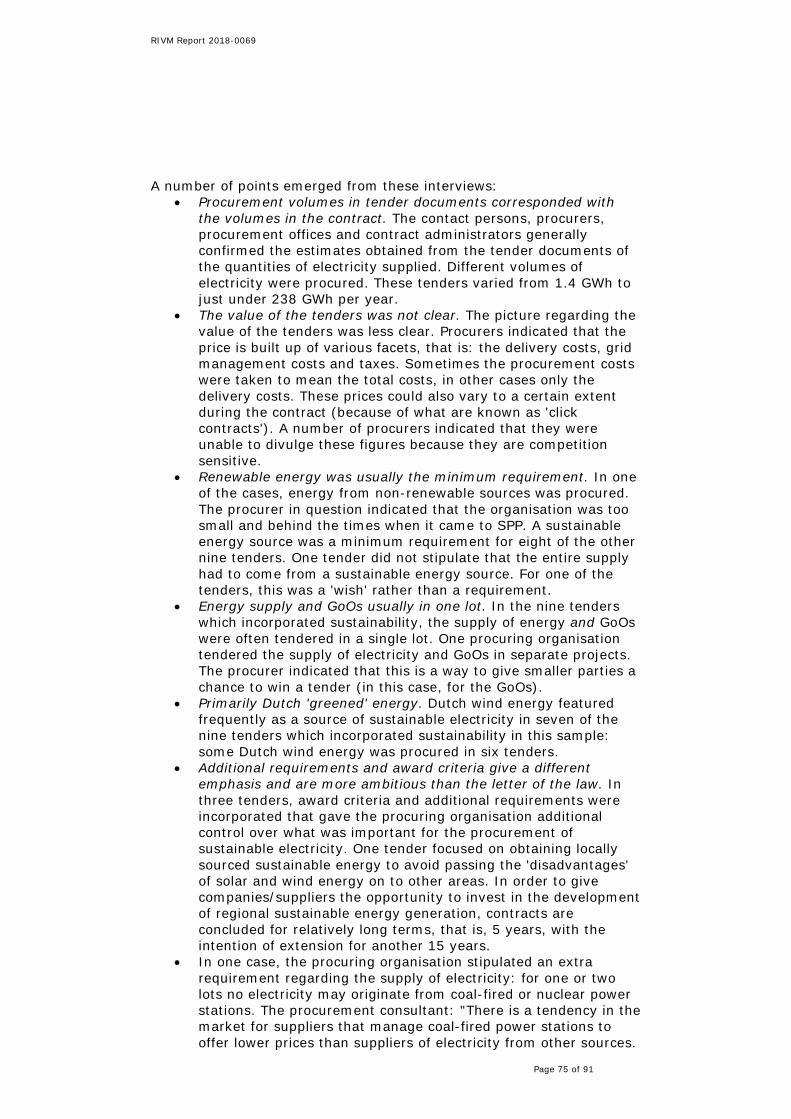
RIVM Report 2018-0069
Page 75 of 91
A number of points emerged from these interviews: • Procurement volumes in tender documents corresponded with
the volumes in the contract. The contact persons, procurers,procurement offices and contract administrators generallyconfirmed the estimates obtained from the tender documents ofthe quantities of electricity supplied. Different volumes ofelectricity were procured. These tenders varied from 1.4 GWh tojust under 238 GWh per year.
• The value of the tenders was not clear. The picture regarding thevalue of the tenders was less clear. Procurers indicated that theprice is built up of various facets, that is: the delivery costs, gridmanagement costs and taxes. Sometimes the procurement costswere taken to mean the total costs, in other cases only thedelivery costs. These prices could also vary to a certain extentduring the contract (because of what are known as 'clickcontracts'). A number of procurers indicated that they wereunable to divulge these figures because they are competitionsensitive.
• Renewable energy was usually the minimum requirement. In oneof the cases, energy from non-renewable sources was procured.The procurer in question indicated that the organisation was toosmall and behind the times when it came to SPP. A sustainableenergy source was a minimum requirement for eight of the othernine tenders. One tender did not stipulate that the entire supplyhad to come from a sustainable energy source. For one of thetenders, this was a 'wish' rather than a requirement.
• Energy supply and GoOs usually in one lot. In the nine tenderswhich incorporated sustainability, the supply of energy and GoOswere often tendered in a single lot. One procuring organisationtendered the supply of electricity and GoOs in separate projects.The procurer indicated that this is a way to give smaller parties achance to win a tender (in this case, for the GoOs).
• Primarily Dutch 'greened' energy. Dutch wind energy featuredfrequently as a source of sustainable electricity in seven of thenine tenders which incorporated sustainability in this sample:some Dutch wind energy was procured in six tenders.
• Additional requirements and award criteria give a differentemphasis and are more ambitious than the letter of the law. Inthree tenders, award criteria and additional requirements wereincorporated that gave the procuring organisation additionalcontrol over what was important for the procurement ofsustainable electricity. One tender focused on obtaining locallysourced sustainable energy to avoid passing the 'disadvantages'of solar and wind energy on to other areas. In order to givecompanies/suppliers the opportunity to invest in the developmentof regional sustainable energy generation, contracts areconcluded for relatively long terms, that is, 5 years, with theintention of extension for another 15 years.
• In one case, the procuring organisation stipulated an extrarequirement regarding the supply of electricity: for one or twolots no electricity may originate from coal-fired or nuclear powerstations. The procurement consultant: "There is a tendency in themarket for suppliers that manage coal-fired power stations tooffer lower prices than suppliers of electricity from other sources.

RIVM Report 2018-0069
Page 76 of 91
Offering electricity that has been partially generated by coal with Electricity GoOs, creates a product that complies with the letter of the law, but is not in keeping with the spirit of what the organisation in question hopes to achieve by procuring 'sustainable electricity'. By way of illustration: in the previous tender without these additional requirements, a supplier was selected for the supply of 100% sustainable wind energy, but with 30% coal in the fuel mix." The organisation indicated that, with this extra requirement, it had tested the limits of the procurement law and that it had received a lot of questions as a result.
• Social Return and Social International play a small role in the procurement of electricity. The procurers of the three cases that indicated in the TenderNed documents that they incorporated Social Return, declared in an interview that this ultimately played a small financial role in the tender. This was because Social Return is calculated over the services, business operations or ‘added value’, and not over the actual delivery or ‘trading volume’. Because these were relatively small amounts, the Social Return was also relatively small. An example calculation: in the case of one tender, the sum, without trading volume, over which Social Return could be incorporated was € 45,000 annually. If the guideline of 5% Social Return had been adhered to, this would have come to € 2250 annually. It is not worthwhile for the supplier to incorporate such small amounts for Social Return because this entails a disproportionately high administrative burden.
• As regards Social International, one procuring organisation incorporates them as standard conditions in every tendering procedure; this was the case in two of the tenders examined. The extent of the role they play and how these conditions are checked is not clear. According to one of the procurers involved, these conditions are not very relevant for the procurement of electricity because the energy is generated either in the Netherlands or elsewhere in Europe.
Step 5: Quantification Climate emissions are an important indicator of the sustainability of electricity. Since the financial data were not very clear-cut or transparent, emissions were estimated on the basis of the (estimated) electricity consumption, using CO2 emission factors (CO2emissiefactoren.nl). These emission factors include the production of solar panels, wind turbines and installations for generating energy. Table B6.3 shows that the emission factor for solar, wind and biomass is many times lower than that for electricity from non-renewable sources.

RIVM Report 2018-0069
Page 77 of 91
Table B6.3 CO2 equivalent emission factors in kg per GWh. (Source: CO2emissiefactoren.nl) Type of electricity Emission factor (kg/GWh) NL solar* 70,000 NL wind* 12,000 NL biomass* 189,000 NL water* 4,000 Electricity from non-renewable sources* 526,000 *Including the emissions during the production process (e.g. solar panels, wind turbinesand energy installations).
This step comprises the estimation of the CO2 emissions per year and the CO2 emissions for the entire contract period. The following aspects must be noted:
• The calculations were based on the estimated amounts ofelectricity procured per year from each tender. In one case, theelectricity actually consumed in the year 2016 was used.
• An estimate of the electricity consumption over multiple yearswas given in several cases. In these cases, the average electricityconsumption per year was used for the calculation.
• Only sustainable electricity generated in the Netherlands wasincluded in the calculations. Sustainable electricity produced onDutch soil contributes to the 'greening' and reduction of CO2emitted by electricity production processes in the Netherlands. Itis not clear whether imported sustainable electricity has actuallycontributed to the 'greening' of the production process in thecountry of origin.
• In three of the ten tenders, the figures were not verified by theprocuring organisation and it is therefore not possible to say forcertain what types of energy (Dutch wind, water, etc.) wasprocured. An estimate can, however, be made of the types ofenergy sources of one of these three on the basis of the tenderdocuments. In this case, this is the ‘minimum’ scenario; it ispossible that, in reality, a larger proportion originates fromDutch, and sustainable, energy sources. For the other twotenders, it is clear that the energy sources are sustainable butthere are no indications of the types of energy sources involved.It is possible that this electricity is 'greened' by means of GoOsoutside the Netherlands. For these reasons, these two tenderswere not included in the calculations of CO2 emissions: theestimate was made on the basis of eight of the ten tenders.
• One of these eight tenders had a longer introductory procedureand the different projects for the different types of sustainableelectricity are not yet completely clear. It is, however, clear thatall the energy is generated in the Netherlands and that it willoriginate largely from solar and wind energy and a smallproportion from hydropower. A sensitivity analysis shows thatthis does not make much difference to the amount of avoidedCO2 emissions. If all the electricity were to be generated fromhydropower (the energy source with the lowest CO2 emissionfactor per kWh) the amount of CO2 saved would be 4.70*107 kg.If all the electricity were to be wind generated (the energy source
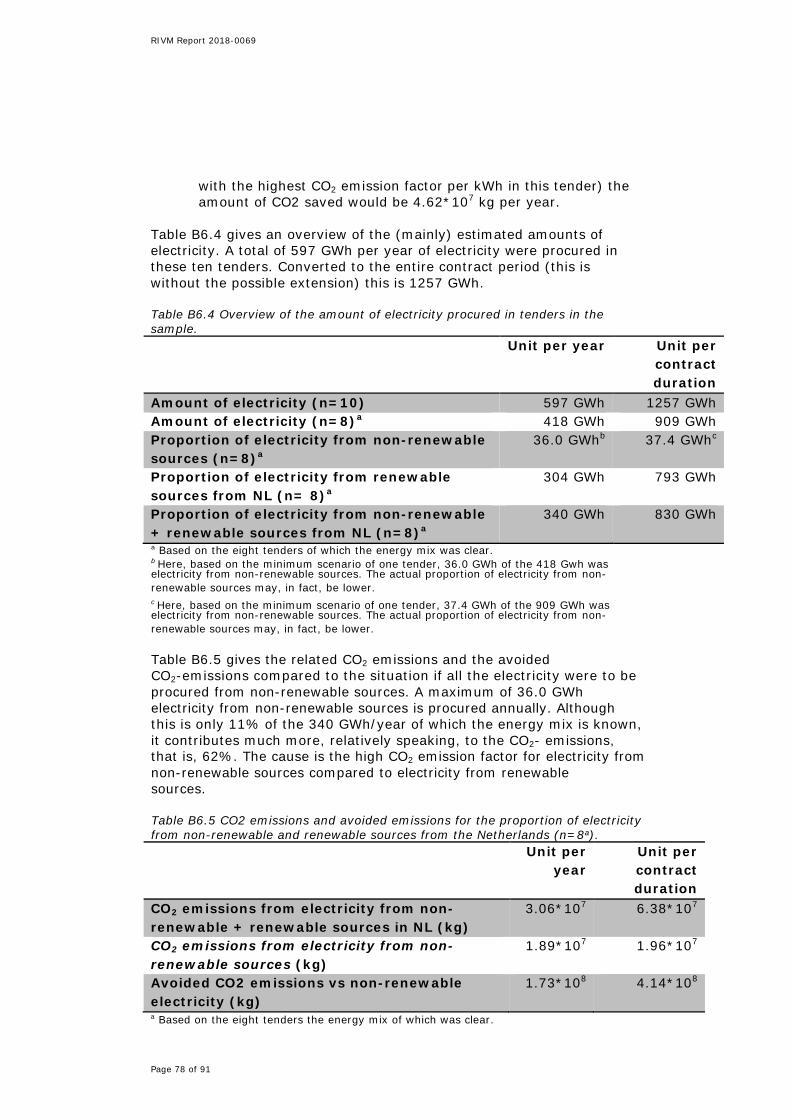
RIVM Report 2018-0069
Page 78 of 91
with the highest CO2 emission factor per kWh in this tender) the amount of CO2 saved would be 4.62*107 kg per year.
Table B6.4 gives an overview of the (mainly) estimated amounts of electricity. A total of 597 GWh per year of electricity were procured in these ten tenders. Converted to the entire contract period (this is without the possible extension) this is 1257 GWh.
Table B6.4 Overview of the amount of electricity procured in tenders in the sample.
Unit per year Unit per contract duration
Amount of electricity (n=10) 597 GWh 1257 GWhAmount of electricity (n=8)a 418 GWh 909 GWh Proportion of electricity from non-renewable sources (n=8)a
36.0 GWhb 37.4 GWhc
Proportion of electricity from renewable sources from NL (n= 8)a
304 GWh 793 GWh
Proportion of electricity from non-renewable + renewable sources from NL (n=8)a
340 GWh 830 GWh
a Based on the eight tenders of which the energy mix was clear. b Here, based on the minimum scenario of one tender, 36.0 GWh of the 418 Gwh was electricity from non-renewable sources. The actual proportion of electricity from non-renewable sources may, in fact, be lower. c Here, based on the minimum scenario of one tender, 37.4 GWh of the 909 GWh was electricity from non-renewable sources. The actual proportion of electricity from non-renewable sources may, in fact, be lower.
Table B6.5 gives the related CO2 emissions and the avoided CO2-emissions compared to the situation if all the electricity were to be procured from non-renewable sources. A maximum of 36.0 GWh electricity from non-renewable sources is procured annually. Although this is only 11% of the 340 GWh/year of which the energy mix is known, it contributes much more, relatively speaking, to the CO2- emissions, that is, 62%. The cause is the high CO2 emission factor for electricity from non-renewable sources compared to electricity from renewable sources.
Table B6.5 CO2 emissions and avoided emissions for the proportion of electricity from non-renewable and renewable sources from the Netherlands (n=8a).
Unit per year
Unit per contract duration
CO2 emissions from electricity from non-renewable + renewable sources in NL (kg)
3.06*107 6.38*107
CO2 emissions from electricity from non-renewable sources (kg)
1.89*107 1.96*107
Avoided CO2 emissions vs non-renewable electricity (kg)
1.73*108 4.14*108
a Based on the eight tenders the energy mix of which was clear.
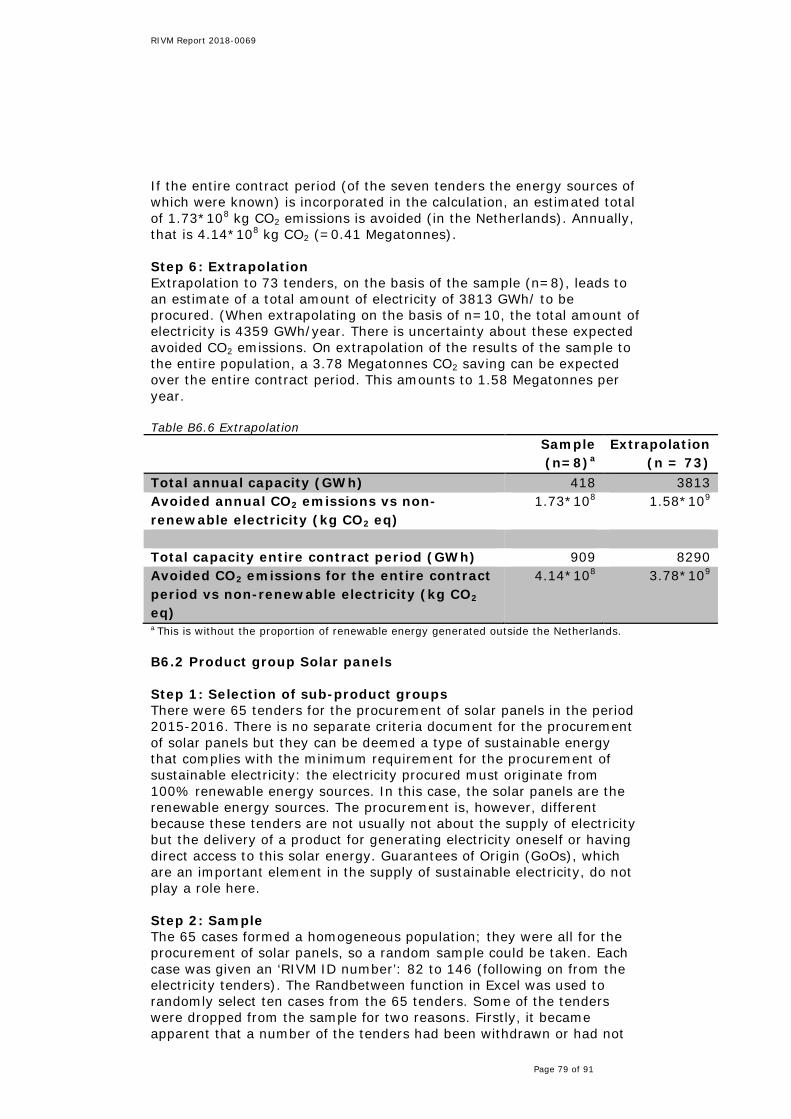
RIVM Report 2018-0069
Page 79 of 91
If the entire contract period (of the seven tenders the energy sources of which were known) is incorporated in the calculation, an estimated total of 1.73*108 kg CO2 emissions is avoided (in the Netherlands). Annually, that is 4.14*108 kg CO2 (=0.41 Megatonnes).
Step 6: Extrapolation Extrapolation to 73 tenders, on the basis of the sample (n=8), leads to an estimate of a total amount of electricity of 3813 GWh/ to be procured. (When extrapolating on the basis of n=10, the total amount of electricity is 4359 GWh/year. There is uncertainty about these expected avoided CO2 emissions. On extrapolation of the results of the sample to the entire population, a 3.78 Megatonnes CO2 saving can be expected over the entire contract period. This amounts to 1.58 Megatonnes per year.
Table B6.6 Extrapolation Sample (n=8)a
Extrapolation (n = 73)
Total annual capacity (GWh) 418 3813 Avoided annual CO2 emissions vs non-renewable electricity (kg CO2 eq)
1.73*108 1.58*109
Total capacity entire contract period (GWh) 909 8290 Avoided CO2 emissions for the entire contract period vs non-renewable electricity (kg CO2 eq)
4.14*108 3.78*109
a This is without the proportion of renewable energy generated outside the Netherlands.
B6.2 Product group Solar panels
Step 1: Selection of sub-product groups There were 65 tenders for the procurement of solar panels in the period 2015-2016. There is no separate criteria document for the procurement of solar panels but they can be deemed a type of sustainable energy that complies with the minimum requirement for the procurement of sustainable electricity: the electricity procured must originate from 100% renewable energy sources. In this case, the solar panels are the renewable energy sources. The procurement is, however, different because these tenders are not usually not about the supply of electricity but the delivery of a product for generating electricity oneself or having direct access to this solar energy. Guarantees of Origin (GoOs), which are an important element in the supply of sustainable electricity, do not play a role here.
Step 2: Sample The 65 cases formed a homogeneous population; they were all for the procurement of solar panels, so a random sample could be taken. Each case was given an ‘RIVM ID number’: 82 to 146 (following on from the electricity tenders). The Randbetween function in Excel was used to randomly select ten cases from the 65 tenders. Some of the tenders were dropped from the sample for two reasons. Firstly, it became apparent that a number of the tenders had been withdrawn or had not
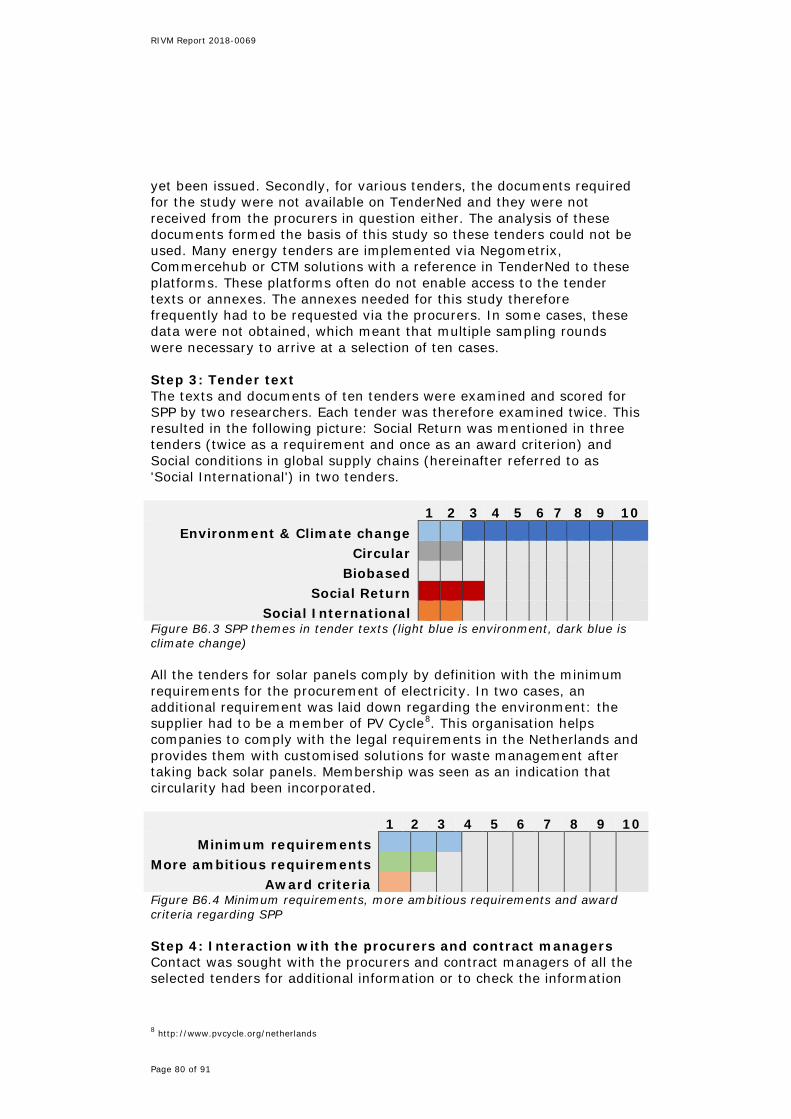
RIVM Report 2018-0069
Page 80 of 91
yet been issued. Secondly, for various tenders, the documents required for the study were not available on TenderNed and they were not received from the procurers in question either. The analysis of these documents formed the basis of this study so these tenders could not be used. Many energy tenders are implemented via Negometrix, Commercehub or CTM solutions with a reference in TenderNed to these platforms. These platforms often do not enable access to the tender texts or annexes. The annexes needed for this study therefore frequently had to be requested via the procurers. In some cases, these data were not obtained, which meant that multiple sampling rounds were necessary to arrive at a selection of ten cases.
Step 3: Tender text The texts and documents of ten tenders were examined and scored for SPP by two researchers. Each tender was therefore examined twice. This resulted in the following picture: Social Return was mentioned in three tenders (twice as a requirement and once as an award criterion) and Social conditions in global supply chains (hereinafter referred to as 'Social International') in two tenders.
1 2 3 4 5 6 7 8 9 10 Environment & Climate change
Circular Biobased
Social Return Social International
Figure B6.3 SPP themes in tender texts (light blue is environment, dark blue is climate change)
All the tenders for solar panels comply by definition with the minimum requirements for the procurement of electricity. In two cases, an additional requirement was laid down regarding the environment: the supplier had to be a member of PV Cycle8. This organisation helps companies to comply with the legal requirements in the Netherlands and provides them with customised solutions for waste management after taking back solar panels. Membership was seen as an indication that circularity had been incorporated.
1 2 3 4 5 6 7 8 9 10 Minimum requirements
More ambitious requirements Award criteria
Figure B6.4 Minimum requirements, more ambitious requirements and award criteria regarding SPP
Step 4: Interaction with the procurers and contract managers Contact was sought with the procurers and contract managers of all the selected tenders for additional information or to check the information
8 http://www.pvcycle.org/netherlands

RIVM Report 2018-0069
Page 81 of 91
found. The following types of questions were asked, depending on the information available:
• How much electricity do the solar panels yield annually (anestimate if necessary)?
• What is the minimum length of time these solar panels continueto operate?
• What was the value of the tender?• To what extent did Social Return play a role?• To what extent did Social International play a role?• What was the procuring organisation's own estimate of the CO2
reduction?• Did other sustainability aspects play a role in the tender?• Is there a recycling programme; what agreements have been
made for the reuse and recycling of the solar panels?
A number of points emerged from these interviews: • Variation in the amount of electricity. The capacity or stipulated
capacity of the solar panels of seven tenders is clear. This isbetween 79,715 kWh/year and 7,952,600 kWh/year, whichcorresponds with 0.08 GWh/year to 7.9 GWh/year. The amountof energy procured per tender via solar panels thus appearslower than the procurement of electricity supplies; that is, 1.4GWh to just under 238 GWh/year.
• Long-term investments. Most procurers indicated that the solarpanels had to function adequately for at least 15 years. Manystipulated 15 years and possibly more.
• The value of the tenders was not clear. The picture regarding thevalue of the tenders was not clear. A number of procurersindicated that they were unable to divulge these figures becausethey are competition sensitive.
• Two own estimates of CO2 savings made by the procuringorganisations themselves. In two tendering procedures, theprocuring organisations made their own estimates of thereduction of CO2 emissions. These corresponded roughly with thecalculations of the CO2 emissions using the CO2 emission factors(see step 5).
• Contribution to circular economy of PV Cycle and take-back ofsolar panels is not clear. Two tenders stipulated that suppliershad to be members of PV Cycle. One of the procurers indicatedthat the tenderers had to declare whether they comply with thisrequirement but that they did not check this. When questioned,the procurers were unable to say what happened to the solarpanels after take-back. This means that it is not clear whetherthe solar panels are actually reused or that materials arerecycled, so it is not possible to estimate whether this contributesto the circular economy either.
• Social Return. Social Return primarily plays a role in therealisation and exploitation of the solar panels (but not in theirproduction).
Step 5: Quantification Climate emissions are an important indicator of the sustainability of electricity. Since the financial data were not very clear-cut or transparent, emissions were estimated on the basis of the (estimated)

RIVM Report 2018-0069
Page 82 of 91
electricity consumption, using CO2 emission factors (CO2emissiefactoren.nl).
Table B6.7 CO2 equivalent emission factors in kg per KWh (Source: CO2emissiefactoren.nl) Type of electricity Emission factor (kg/kWh) NL solar* 0.070 Electricity from non-renewable sources* 0.526 *Including the emissions during the production process (e.g. solar panels, wind turbinesand energy installations).
This step comprises the estimation of the CO2 emissions per year and the CO2 emissions for 15 years. The following aspects must be noted:
• The calculations were based on the estimated amounts ofelectricity procured per year from each tender.
• Because almost all procuring organisations stipulated solar panelsthat function for at least 15 years, this lifetime was used tocalculate the total amount of CO2 emissions saved.
• In three of the ten tenders, the amount of electricity the solarpanels are expected to yield is not known.
An estimate of the electricity consumption for multiple years is often given. In these cases, calculations are made with the average electricity consumption. Table B6.8 gives an overview of the electricity consumption, the type of energy source, the CO2 emissions relating to that consumption and the avoided CO2 emissions per year and for 15 years compared to the situation if all the electricity was to be procured from non-renewable sources.
Table B6.8 Overview of the amount of electricity, CO2 emissions and avoided emission of the sample (n=7)a.
Unit per year Unit per 15 years Amount of electricity (KWh) 1.72*107 2.58*108
CO2 emissions (kg CO2 eq) 1.20*106 1.80*107 Avoided CO2 emissions vs non-renewable electricity (kg CO2 eq)
7.83*106 1.17*108
a Based on the seven tenders with clear estimated amounts of electricity.
In this sample, Social Return is incorporated in 72% of every KWh tendered (see Table B6.9). This is primarily because one of the three tenders is relatively large; it covers almost 50% of the total power tendered.
Table B6.9 Overview of number of kWh in which Social Return plays a role. Unit per year Unit per 15 years
Size (n=7)a 1.72*107 KWh 2.58*108 KWh Proportion of Social Return
1.24*107 KWh (=72%) 1.85*108 KWh (=72%)
# tenders SR 3 3

RIVM Report 2018-0069
Page 83 of 91
Step 6: Extrapolation On extrapolation of the results of the sample to the entire population, a 117.4 kilotonnes CO2 saving can be expected per year and 1.2 Megatonnes over a period of 15 years (this is the minimum lifetime of the solar panels).
Table B6.10 Extrapolation (expectation for N=65 on the basis of n=7). Extrapolation per
year Extrapolation per 15
years Total kWh 1.59*108 KWh 2.39*109 KWh Avoided CO2 emissions renewable electricity vs non-renewable electricity
7.27*107 kg 1.09*109 kg
Proportion of Social Return (in KWh)
1.15*108 KWh 1.72*109 KWh
Social Return in number of tenders
20 20
B 6.3 Product group Gas
Step 1: Selection of sub-product groups In the Netherlands, gas is usually supplied via the natural gas grid. The gas supplied to the end user via this grid is a mixture of gas from various sources. It originates from natural gas production in the Netherlands (mainly from the gas field in the province of Groningen), natural gas from other countries or via LNG (liquefied natural gas) and sometimes biogas9. There is a separate criteria document for the procurement of gas. It contains a single minimum requirement: for the procurement of fossil gas, the greenhouse gases released must be fully (100%) compensated. There are also several suggestions for other award criteria and attention points in the document10.
There were 69 tenders issued via TenderNed for the supply of gas in the period 2015-2016. It was not necessary to subdivide this product group into sub-product groups; the tenders all concerned the supply of natural or other gas, with or without green certificates, so a random sample could be taken.
Step 2: Sample Each case was given an ‘RIVM ID number’: 1 to 69. The Randbetween function in Excel was used to randomly select 10 cases from the 69 tenders. Some of the tenders were dropped from the sample for two reasons. Firstly, it became apparent that a number of the tenders had been withdrawn or had not yet been issued. Secondly, for various tenders, the documents required for the study were not available on TenderNed and they were not received from the procurers in question
9 www.aardgas-in-nederland.nl 10 www.pianoo.nl/sites/default/files/documents/documents/milieucriteriagas-maart2017.pdf
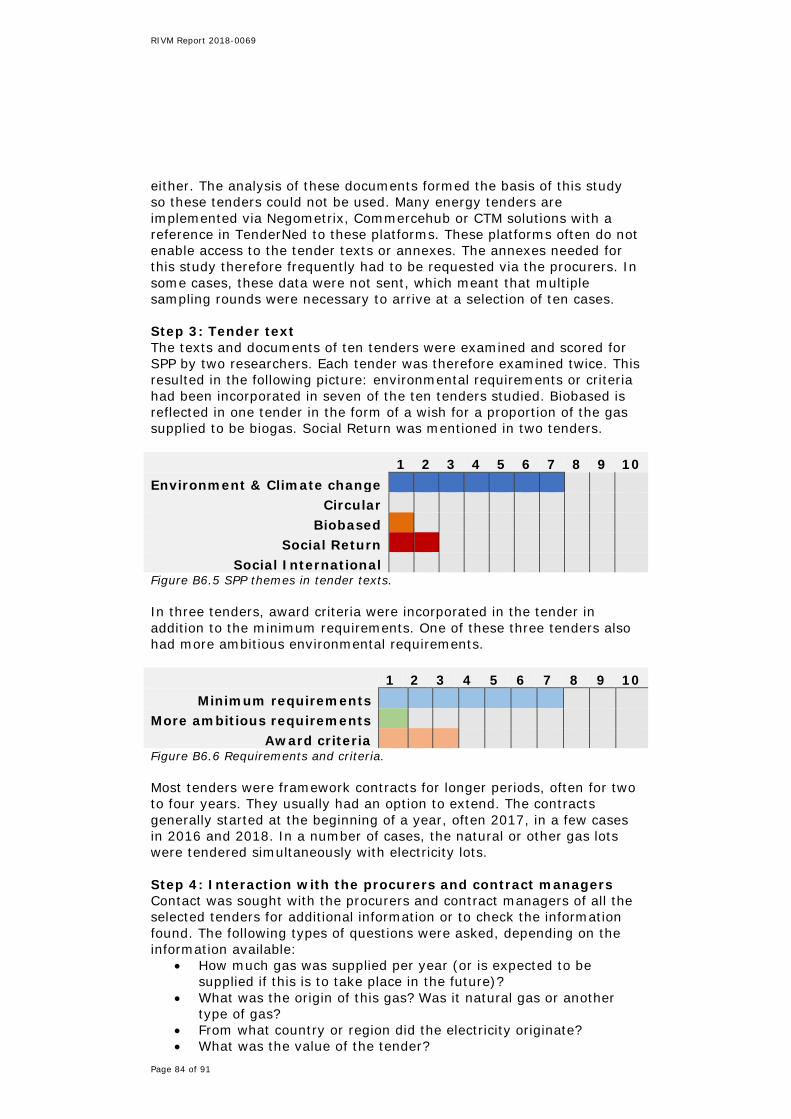
RIVM Report 2018-0069
Page 84 of 91
either. The analysis of these documents formed the basis of this study so these tenders could not be used. Many energy tenders are implemented via Negometrix, Commercehub or CTM solutions with a reference in TenderNed to these platforms. These platforms often do not enable access to the tender texts or annexes. The annexes needed for this study therefore frequently had to be requested via the procurers. In some cases, these data were not sent, which meant that multiple sampling rounds were necessary to arrive at a selection of ten cases. Step 3: Tender text The texts and documents of ten tenders were examined and scored for SPP by two researchers. Each tender was therefore examined twice. This resulted in the following picture: environmental requirements or criteria had been incorporated in seven of the ten tenders studied. Biobased is reflected in one tender in the form of a wish for a proportion of the gas supplied to be biogas. Social Return was mentioned in two tenders. 1 2 3 4 5 6 7 8 9 10 Environment & Climate change
Circular Biobased
Social Return Social International
Figure B6.5 SPP themes in tender texts. In three tenders, award criteria were incorporated in the tender in addition to the minimum requirements. One of these three tenders also had more ambitious environmental requirements. 1 2 3 4 5 6 7 8 9 10
Minimum requirements More ambitious requirements
Award criteria Figure B6.6 Requirements and criteria. Most tenders were framework contracts for longer periods, often for two to four years. They usually had an option to extend. The contracts generally started at the beginning of a year, often 2017, in a few cases in 2016 and 2018. In a number of cases, the natural or other gas lots were tendered simultaneously with electricity lots. Step 4: Interaction with the procurers and contract managers Contact was sought with the procurers and contract managers of all the selected tenders for additional information or to check the information found. The following types of questions were asked, depending on the information available:
• How much gas was supplied per year (or is expected to be supplied if this is to take place in the future)?
• What was the origin of this gas? Was it natural gas or another type of gas?
• From what country or region did the electricity originate? • What was the value of the tender?

RIVM Report 2018-0069
Page 85 of 91
• To what extent did Social Return play a role? • To what extent did Social International play a role? • Did other sustainability aspects play a role in the tender?
A number of points emerged from these interviews:
• Procurement volumes in tender documents corresponded with the volumes in the contract. The contact persons, procurers, procurement offices and contract administrators generally confirmed the estimates obtained from the tender documents of the volumes of natural gas supplied. Different volumes of gas were procured. In these tenders, the volumes varied from 165,000 nm3 to 16,500,000 nm3 per year. Nm3 stands for 'normal cubic metre'. This is a customary unit for gas: it is the volume (in cubic metre) that gas occupies at 0 ˚C at a pressure of 1.01325 bar.
• The value of the tenders was not clear. The picture regarding the value of the tenders was not clear. A number of procurers indicated that they were unable to divulge these figures because they are competition sensitive.
• No compensation but green anyway? One procuring organisation indicated that it deliberately did not invest in green certificates but in 'greening' its buildings and reducing its natural gas requirements.
Step 5: Quantification Climate emissions are an important indicator of the sustainability of gas. Since the financial data are not very clear-cut or transparent, emissions were estimated on the basis of the (estimated) gas volumes using CO2 emission factors (CO2emissiefactoren.nl). Table B6.11 shows the emission factors for natural gas and biogas. This step comprises the estimation of the CO2 emissions per year and the CO2 emissions for the entire contract period. The following aspects must be noted:
• The calculations were based on the estimated amounts procured per year from each tender.
• The option to extend was not taken into consideration in the conversion to the total contract period.
• In the tender that discussed biogas, the amount in question was not clear. According to the procurer, it was a small fraction. The possible proportion of biogas was therefore disregarded in this calculation and the calculation was made using only the emission factor for natural gas.
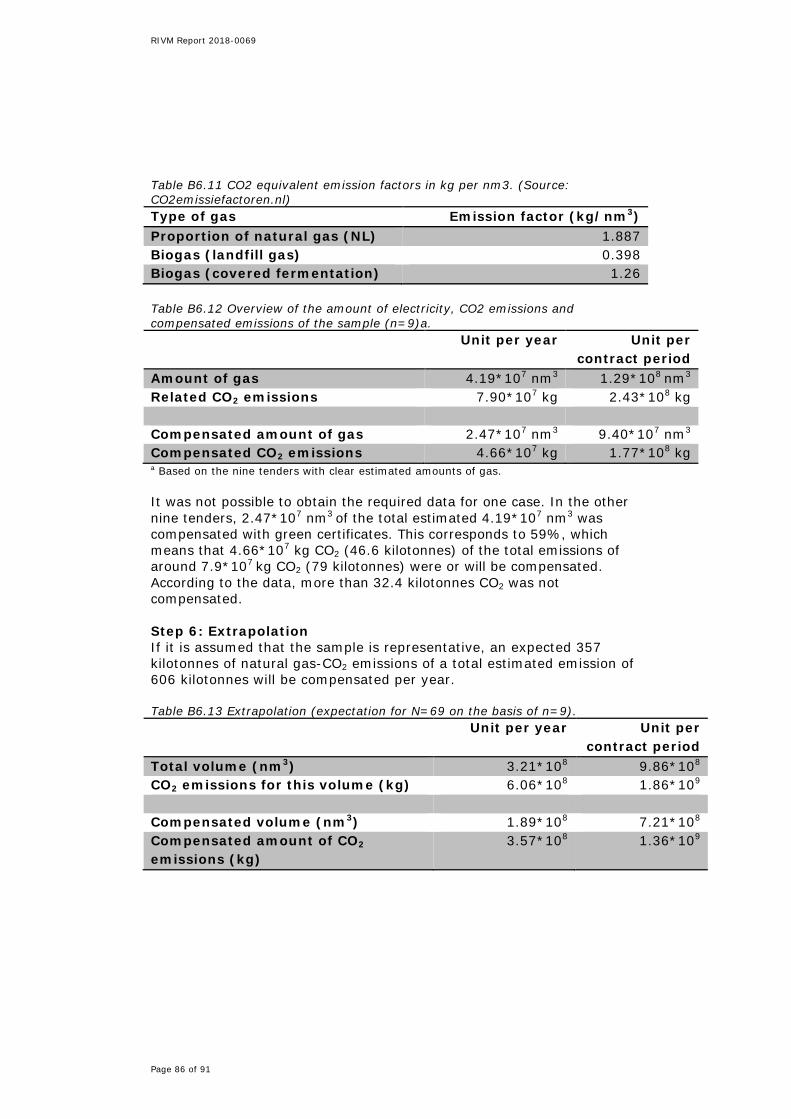
RIVM Report 2018-0069
Page 86 of 91
Table B6.11 CO2 equivalent emission factors in kg per nm3. (Source: CO2emissiefactoren.nl) Type of gas Emission factor (kg/nm3) Proportion of natural gas (NL) 1.887 Biogas (landfill gas) 0.398 Biogas (covered fermentation) 1.26 Table B6.12 Overview of the amount of electricity, CO2 emissions and compensated emissions of the sample (n=9)a. Unit per year Unit per
contract period Amount of gas 4.19*107 nm3 1.29*108 nm3
Related CO2 emissions 7.90*107 kg 2.43*108 kg
Compensated amount of gas 2.47*107 nm3 9.40*107 nm3
Compensated CO2 emissions 4.66*107 kg 1.77*108 kg a Based on the nine tenders with clear estimated amounts of gas. It was not possible to obtain the required data for one case. In the other nine tenders, 2.47*107 nm3 of the total estimated 4.19*107 nm3 was compensated with green certificates. This corresponds to 59%, which means that 4.66*107 kg CO2 (46.6 kilotonnes) of the total emissions of around 7.9*107 kg CO2 (79 kilotonnes) were or will be compensated. According to the data, more than 32.4 kilotonnes CO2 was not compensated. Step 6: Extrapolation If it is assumed that the sample is representative, an expected 357 kilotonnes of natural gas-CO2 emissions of a total estimated emission of 606 kilotonnes will be compensated per year. Table B6.13 Extrapolation (expectation for N=69 on the basis of n=9). Unit per year Unit per
contract period Total volume (nm3) 3.21*108 9.86*108 CO2 emissions for this volume (kg) 6.06*108 1.86*109
Compensated volume (nm3) 1.89*108 7.21*108 Compensated amount of CO2 emissions (kg)
3.57*108 1.36*109

RIVM Report 2018-0069
Page 87 of 91
Annex 7 Product group Occupational clothing
Step 1: Longlist A longlist of 54 tenders was drawn up. This longlist was based on a selection from the TenderNed database printout for this product group for the years 2015 and 2016, which was subsequently filtered manually. Step 2: Sample The longlist was subdivided into subcategories manually. The subdivision in the minimum criteria document (version dated January 2016) is as follows:
• Clothing, footwear, baggage items and accessories • Occupational clothing, special workwear and accessories • Outerwear • Garments • Special clothing and accessories • Footwear • Protective and safety clothing • Personal and supporting equipment
For the purposes of this protocol, the subdivision for occupational clothing was therefore simplified as follows: Table B7.1 Subcategories of the product group Occupational clothing. Subcategories Longlist Sample Special workwear, such as protective and safety clothing
6 1
Ordinary clothing 29 5 Footwear 10 2 Accessories, such as belts 13 2 Other, such as kit 1 0 The longlist adds up to more than 54 because some tenders stipulated articles from different subcategories. Step 3: Tender text The texts and documents of the ten tenders in the sample were examined and scored for SPP by two researchers. Each tender was therefore examined twice. This resulted in the following picture: 1 2 3 4 5 6 7 8 9 10
Environmental Circular
Biobased Social Return
Social International Figure B7.1 SPP themes in tender texts.
RIVM Report 2018-0069
Page 88 of 91
• Three of the ten tenders did not incorporate SPP in any way. • Four of the ten tenders laid down minimum requirements. • The other three tenders laid down more ambitious requirements
and/or SPP award criteria. • What is more, all tenders that incorporated SPP took green
procurement into consideration. This unanimously included the use of harmful substances.
• Two tenders laid down requirements concerning the recycled content of the clothing or the packaging.
• One tender looked into biobased procurement. • Two tenders stipulated initiatives in the field of Social Return • and six of the ten tenders stipulated attention for Social
International. Step 4: Interaction with the procurers and contract managers Contact was sought with the procurers and contract managers of the tenders that incorporated SPP. The basic information requested was as follows:
• What was ultimately procured (what clothing, what tonnage, what materials?)
• Were the labels requested (for example, Öko-tex) actually present?
• In the case of circular: what was the proportion of recycled or reused material in the product?
• In the case of circular: what were the agreements regarding reuse after use of the product?
• Optional in the case of organic cotton: what was the country of origin of the cotton?
• In the case of green: was there insight into the harmful substances that were used in production?
A number of points emerged from these interviews:
• Sufficient information was collected for three of the tenders. In fact, the interviews indicated that no environmental benefits were achieved (see the explanation below).
• In three of the tenders, those involved were unable to deliver the basic information, the numbers and tonnages of procured clothing required for the study.
• The basic information for one tender was delivered. Based on the interviews, it can be concluded that:
• As regards hazardous substances, it cannot be said that incorporating SPP criteria leads to benefits: o Most tenders refer to lists of prohibitions and restrictions that
already apply for production in Europe. o The procurers reported unanimously that suppliers always
indicate that the requirements concerning the use of harmful substances are complied with
o but that this is not enforced and very difficult to enforce. o Other projects on substances of very high concern in textiles
have shown that suppliers also indicate that they are not sure what substances are or are not in clothing, let alone what substances are used in production. This applies particularly to international chains (and most chains are international).
RIVM Report 2018-0069
Page 89 of 91
Production chains largely situated in Europe (as is the case for some wool products) are an exception to this. Another problem is that suppliers do not know or recognise the names of the substances in question. Consequently, they indicate that certain substances are not in a particular product whereas it is quite possible that they are.
o Two tenders stipulate an Öko-tex standard 100 table certificate in compliance with the minimum criteria document. On payment of a fee, this certificate is granted to products that comply with a list of restrictions on hazardous substances. This list is more far-reaching than existing legislation and regulations. Assuming that the label is valid, this requirement can be expected to yield an effect compared to the textiles available on the market.
• As regards circularity, the three tenders that incorporated this did actually result in products with a 'recycling element': o A requirement in one tender concerned recycled content in the
product delivered. Whether the products delivered did actually contain anything recycled was not checked.
o As regards the other tender, the products delivered will be taken back by the supplier for recycling. Moreover, 84% of the packaging materials comprised recycled and renewable materials. The latter is common practice in the Netherlands. Cardboard produced in the Netherlands is made largely from recycled materials (83 to 90%).
• As regards biobased requirements, when questioned, the procurers said that these concerned organic cotton. The benefits achieved are therefore more likely to be environmental benefits (use of pesticides, etc.) than biobased benefits (ordinary cotton is also biobased). This requirement was guaranteed by means of the Global Organic Textile Standard (GOTS) certificate, which stands for 100% organic cotton.
• As regards Social Return, what is stipulated is what is promised in the contract.
• As regards Social International, the tender texts are always agreed by all suppliers. In the interviews, procurers said that "Everyone always puts a tick in the box and it is never checked". Furthermore, the effect of incorporating these requirements cannot yet be properly ascertained although this may change with the new due diligence approach.
Step 5: Quantification Basic information, such as the tonnages of clothing procured, is not available for this product group. The SPP benefits have therefore not been further quantified than the percentage of the budget that is used to promote the various SPP themes.

RIVM Report 2018-0069
Page 90 of 91
Table B7.2 Quantification of SPP benefits for the sample over the entire contract periods and periods of depreciation. SPP theme Subtheme Unit Result Environmental Euros spent on procurement in
which investments are also made in environmental benefits
€ 2,900,000 38% of total
Circular Euros spent on procurement in which investments are also made in the transition to a circular economy
€ 1,800,000 24% of total
Social Return Euros spent on procurement in which investments are also made in social return
€ 840,000 11% of total
Social International
Euros spent on procurement in which investments are also made in social international
€ ?
If the data is available, the use of used and organic raw materials instead of new raw materials can be converted into avoided impact in terms of climate change, water consumption and land use by means of conversion factors derived from existing life cycle inventory databases, such as those available in Modint's ecotool11. Context The procurers interviewed for the study had the following comments about the context of the product group and the procurement practice:
• The product group is diverse. Not only is every procurement different but the alternative materials available to choose from differ in how and where they affect the environment. The question for SPP is therefore 'what to focus on?' Cotton, for example, has a large impact on water consumption and pesticide use, whereas polyester has more effect on fossil fuel consumption and wool on animal welfare.
• Large suppliers still have few options for textile-textile circularity. This is due to the large differences in quality of the clothing that is collected. There is a small-scale solution to this: closed loop circulation. This is, however, not yet an attractive proposition for large market players. They work with enormous volumes and do not modify their production for a single batch of clothing with recycled content. The large manufacturers are, moreover, so cheap that sustainable alternatives, even if awarded a discount on winning the contract, cannot compete with them.
• In many cases, the procurer is one and the same person as the contract manager, which is good for continuity. The drawback, however, is that in practice he/she spends so much time on the procurement that the contract management is neglected.
• It is practically impossible to keep a check on production chains that extend beyond the borders of Europe (that is, most of them).
11 http://modint.nl/ecotool/

RIVM Report 2018-0069
Page 91 of 91
• As one of the procurers put it, in the case of most sustainability agreements. One procurer said that, in the case of most sustainability agreements, they just had to believe that the manufacturers were telling the truth. "We just have to believe that they are telling the truth".
• The avoided effects that can be realised with the sustainable procurement of occupational clothing are quite considerable. For example, CE Delft estimates that an SPP tender issued by the fire brigade stipulating organic cotton and recycled PET can lead to an avoided CO2 eq emissions of 160 tonnes (CE Delft, 2017). A study carried out by Rijkswaterstaat (the Directorate-General for Public Works and Water Management (RWS) on the role of SPP in making textiles and occupational clothing more sustainable also indicates that enormous benefits can be achieved in terms of energy and water consumption, among other things (RWS, 2016).
References CE Delft, 2017. Milieuwinst van de inkoop van textiel t.b.v. de
brandweer in kaart (Mapping the environmental benefits of the procurement of textiles for the fire brigade). Publication number: 17.2L33.66. Available via: https://www.ifv.nl/inkoopenmaterieel/Documents/201704-CE-Delft-Milieuwinst-inkoop-textiel-brandweer.pdf
RWS, 2016. ECAP European Textiles & Workwear Market The role of Public Procurement in making textiles circular. Available via: https://www.pianoo.nl/sites/default/files/documents/documents/ecapworkwearreport-maart2017.pdf

RIVM Committed to health and sustainability
Related Documents