Loughborough University Institutional Repository Measuring the changes to leader brand associations during the 2010 election campaign This item was submitted to Loughborough University’s Institutional Repository by the/an author. Citation: SMITH, G. and FRENCH, A., 2011. Measuring the changes to leader brand associations during the 2010 election campaign. Journal of Marketing Management, 27 (7-8), pp. 721 - 738 Additional Information: • Author Posting c Westburn Publishers Ltd, 2012. This is a post-peer- review, pre-copy-edit version of an article which has been published in its definitive form in the Journal of Marketing Management, and has been posted by permission of Westburn Publishers Ltd for personal use, not for redistribution. The article was published in Journal of Marketing Man- agement, 27, 2011, 7-8, pp. 718-735, doi: 10.1080/0267257X.2011.587825, http://dx.doi.org/10.1080/0267257X.2011.587825 Metadata Record: https://dspace.lboro.ac.uk/2134/14789 Version: Accepted for publication Publisher: Taylor and Francis / c Westburn Publishers Ltd Please cite the published version.

Welcome message from author
This document is posted to help you gain knowledge. Please leave a comment to let me know what you think about it! Share it to your friends and learn new things together.
Transcript

Loughborough UniversityInstitutional Repository
Measuring the changes toleader brand associationsduring the 2010 election
campaign
This item was submitted to Loughborough University’s Institutional Repositoryby the/an author.
Citation: SMITH, G. and FRENCH, A., 2011. Measuring the changes to leaderbrand associations during the 2010 election campaign. Journal of MarketingManagement, 27 (7-8), pp. 721 - 738
Additional Information:
• Author Posting c© Westburn Publishers Ltd, 2012. This is a post-peer-review, pre-copy-edit version of an article which has been published in itsdefinitive form in the Journal of Marketing Management, and has beenposted by permission of Westburn Publishers Ltd for personal use, not forredistribution. The article was published in Journal of Marketing Man-agement, 27, 2011, 7-8, pp. 718-735, doi: 10.1080/0267257X.2011.587825,http://dx.doi.org/10.1080/0267257X.2011.587825
Metadata Record: https://dspace.lboro.ac.uk/2134/14789
Version: Accepted for publication
Publisher: Taylor and Francis / c© Westburn Publishers Ltd
Please cite the published version.
This item was submitted to Loughborough’s Institutional Repository (https://dspace.lboro.ac.uk/) by the author and is made available under the
following Creative Commons Licence conditions.
For the full text of this licence, please go to: http://creativecommons.org/licenses/by-nc-nd/2.5/

1
Measuring the Changes to Leader Brand Associations During the 2010 Election
Campaign.
Gareth Smith*† and Alan French**
*Oxford Brookes University, UK.
**Loughborough University, UK.
†Corresponding author:
Dr Gareth Smith, Professor of Marketing, Oxford Brookes University, Oxford, Oxfordshire OX33 1HX.
Tel: +44 (0)1865 485858, fax: +44 (0)1865 485830; email: [email protected]

2
Measuring the Changes to Leader Brand Associations During the 2010 Election
Campaign.
Abstract
The 2010 UK General Election was unique in that for the first time televised leaders’ debates
took place. The impact of these plus paid for advertising and uncontrolled events are
considered and their likely affect on the image of Brown, Cameron and Clegg, the three main
party leaders, discussed. Then, using a brand mapping approach, we analyse changes to
consumer perceptions of the leader brands from just prior to the first debate through to the
election day itself, Thursday May 6th.
Specifically, we consider whether, over the campaign, the number of leader associations
increases, which policies were associated with which leader and the favourability of the
leaders associations. We then use a measure of brand image strength to chart overall changes
to the leaders. Finally we consider how Brown’s image was affected by the so called ‘Duffy’
affair.
Keywords: Brand Image Strength, Brand Concept Mapping, Politics, General Election.
Gareth Smith is a Professor in Marketing at Oxford Brookes University, UK. His research in
branding covers brand personality, brand extension effects and branding in political markets.
He has published on branding in the Journal of Marketing Management, European Journal of
Marketing, Marketing Theory and Journal of Political Marketing.
Alan French is a Lecturer in Management Science at Loughborough University, UK. He
studied for his first degree and PhD at the University of East Anglia. His research focuses on
the application of Management Science techniques in business and he has published in the
European Journal of Marketing, Journal of the Operational Research Society and Computers
and Operations Research.
3
Measuring the Changes to Leader Brand Associations During the 2010 Election
Campaign.
Introduction: Consumer Learning of Political Brands
There has been a steady stream of papers that have accepted UK political parties and or
politicians as brands (Kavanagh, 1995; Harris & Lock, 2001; Smith, 2001; White & de
Chernatony, 2002; Needham, 2005, 2006; Scammell, 2007). More recently, a consumer
oriented approach to political branding has developed (Schneider, 2004; Smith & French,
2009; French & Smith, 2010). This approach accepts that voters are involved in the same
cognitive and affective processes that they use and apply when choosing what are
traditionally thought of as brands.
The majority of the consumer-oriented research on brands (see Keller, 2002 for an overview)
uses cognitive psychology and the human associative memory (HAM) model to
conceptualise how consumers learn about brands (Teichert & Schöntag, 2010). Brand
learning is stored in memory as individual pieces of information or nodes which are linked
together in memory to form a more complex associative network (Anderson, 1983).
Importantly, a brand node may be activated from memory when one association stimulates
the recall of another, linked node of information (de Groot, 1989). So, for example, the name
Gordon Brown may activate associations such as Labour, Prime Minister, Chancellor, the
economy and so on. It is this spreading activation process from a brand name to brand
associations which produces a mental map in voters’ memory (Dobni & Zinkman, 1990).
Using the extant literature as a guide, we propose several learning effects that are predicted to
occur from the campaign. We then use primary research for evidence to support/negate these
propositions. Specifically, we measured the associative brand networks of party leaders by
using a brand mapping method; this was to reveal how the associations held of party leaders
evolved during the 2010 Election Campaign. As voter maps are networks of associations
about a party leader, we use network analysis to analyse them. This allows us to measure the
leader image at the beginning and end of the campaign. We asked respondents with a
preference for a leader to map that leader. This was necessary because maps have been seen
to vary depending on the respondent’s attitude to the brand (van Rekom, Verlegh & Slokkers,
2009). Combining maps of those with positive and negative attitudes to a leader would
confound the overall results.
4
Thus the paper seeks to contribute to our knowledge of how a political campaign affects voter
learning, the things that are learned and also how strong this learning was. From this
perspective, we are able to comment on the effectiveness of the leaders’ campaigns in 2010.
The Leader and Party Brand at the 2010 General Election.
In studying branding in politics, it is apparent that there are clearly three distinct elements: a
trinity with the party as the brand; the politician as its tangible characteristics; and policy as
core service offerings (O’Shaughnessy & Henneberg, 2007). We know that the party as a
brand has been seen to have inherent strength because it can produce customer signals that
are simple, credible, salient and continuous over long periods of time (Tomz & Sniderman,
2005). For example Labour’s long-standing core brand values are, among others, the
reduction of inequality and the promotion of social justice; for the Conservatives it is the
championing of the individual and lower personal taxation, etc.
The party leader has always been a significant if not overbearing component of the overall
political brand. One reason for this is the ability of the leader to ‘personify’ meaning
symbolically (e.g. by the leader’s looks, age, gender, dress sense, accent and general
demeanour). From this, it has been shown that political leaders are like brands in that they
have coherent and consistent personalities and wider meaning in the minds of voters
(Schneider, 2004; Guzmán & Sierra, 2009). As more voters have a low involvement with,
and are disinclined to learn about, party politics and policies, the leader offers the ability to
convey complex meaning that voters can easily assimilate. Thus the leader acts as an
important heuristic device that voters use as a short-cut to arrive at decisions at election time
based on limited knowledge of parties and policies (Lau & Redlawsk, 2001).
Academic research about the relative importance of the leader and the party is scant. Davies
and Mian (2010) have investigated the link between the two and conclude that, as expected,
there is a close relationship between them. However, despite being highly correlated, the two
are statistically distinct entities. They also conclude that the leader’s reputation influences
attitude towards the party more than vice versa. Supporting this, a longitudinal Ipsos MORI
poll confirmed that, just prior to the 2010 election and for the first time since 1987, leaders
had become as important as policies in attracting voters to a party, with the party itself a long
way behind (Mortimore, 2010). As such, we consider the leader and party as being separate,
5
highly interlinked brands but with the leader as the senior, ‘flagship’ brand (John, Loken &
Joiner, 1998) during the 2010 UK General Election.
The 2010 Election Campaign.
Having argued for leaders as separate, important political brands in their own right, we now
consider how, if at all, the brand image of the leaders changed during the last UK General
Election Campaign. Brand image is defined as the sum of all associations that consumers
have of a brand (Keller, 1993). We focus on the period from just before the election was
announced to the election itself with our primary research matching these dates closely.
To contextualise the campaign, the three leaders began it with markedly different political
fortunes. The incumbent, Gordon Brown, had been New Labour’s Chancellor of the
Exchequer since 1997 and Prime Minister since 2007. However, Labour’s popularity was
low in 2010, fuelled by such ‘events’ as the Iraq war and, more recently, the MPs expenses
debacle. Also, Brown’s handling of the global banking crisis, initially receiving popular
support, was superseded by criticism of lack of government regulation of the financial sector.
At the same time, stories of Brown’s ‘bullying’ behaviour towards subordinates became
prominent in the media. As such the campaign started with Brown leading an unpopular third
term government, widely expected to lose the election. The poll of polls at the start of the
official campaign (6th April, 2010) had the Conservatives, Labour and Liberal Democrats on
39%, 31% and 19% respectively.
David Cameron was elected to Parliament in 2001 and rose rapidly to the opposition front
bench by 2003. After the third demoralising defeat for his party, he became its leader in
2005, delivering an influential speech at the Party Conference promising to make
Conservatives feel good about themselves and appeal to a new generation of voters. In
subsequent years, he proved effective in restoring his party’s image by communicating to the
rest of the country that the Conservatives were no longer the ‘nasty party’i. This was
reinforced with well publicised and carefully planned actions; he cycled to work, had a wind
turbine fitted to his house, visited a glacier to show involvement with global warming/green
issue and so on. Physically too he was different from Brown, being younger and less dour
than the Prime Minister. Thus, at the start of the campaign, the polls suggested that Cameron

6
was the Prime Minister in waiting and perversely, the pressure was on him not to lose the
election.
Nick Clegg’s position on the 6th April was markedly different as few outside of Westminster
and Liberal Democrat supporters had a clear image of the man. He was only elected to
Parliament in 2005 and after a short period as Liberal Democrat spokesperson on Home
Affairs, became leader in 2007. He subsequently suffered from the perennial problem for the
leader of the third party in British politics, namely the struggle to get himself known and his
ideas across to a largely disinterested electorate and media. For the first time in a UK
General Election, he was allowed equal exposure during the leaders’ debates, appearing, at
first at least, fresh and different from Cameron and Brown. Critically, his party’s popularity
rose dramatically after he was perceived to have ‘won’ the first leaders’ debate, and
consequently, a ‘three horse race’ became the sub-text to the election campaign for the first
time in post–war Britain.
What follows is a detailed discussion of the likely factors that were influencing voter
associations of the three leaders of the main, national political parties in the 2010 campaign.
We concentrate on the likely impact of three key influences during the campaign, namely the
leaders’ debates, paid for advertising and uncontrollable events, with a view to analysing
their effect, if any, on the respective leader’s overall brand image. We measured leader
image at the end of March (just prior to when the election was called) and again on May 6th
(election day), 2010. As alluded to, we used brand maps as the means to record voters
associations of the leaders at the two periods mentioned.
Voter Learning of Party Leaders – The Leaders’ Debates
The effect of the campaign on an election has been traditionally viewed as small, with most
voters already making their minds up prior to the campaign (Iyengar & Simon, 2000). One
reason may be that, because of the alleged Permanent campaign waged by parties and their
leaders, voters will have well established ideas about them and these will remain largely
unaffected by the campaign itself (Sparrow & Turner, 2001). Considering voter learning it
has been noted that ‘Campaigns are information-rich events. Contrary to the prevailing
wisdom, the information they yield is multifaceted, encompassing the candidates’ chances of

7
winning, their personal traits and mannerisms, and most important, their policy and
ideological bearings’ (Iyengar & Simon, 2000, p. 156).
We did not seek to isolate the leaders’ debates impact from other potential influences but
there is clear evidence that it was a powerful factor. The three 90 minute leaders’ debates
attracted a total audience of approximately 21 million, a figure underestimating the real
impact as the debates were leveraged by intense subsequent news coverage including
televised ‘highlights’ (Zhao & Chaffee, 1996). Polling evidence reveals that 60% of
respondents thought that, prior to the debates, the latter would be important in influencing
how they voted. Subsequently, 23% acknowledged that they had either changed or
considered changing their voting intention as a result of the first debate (Mortimore, 2010).
In terms of the relative performances during the debates, the following table seeks to
summarise the evidence. It shows the average of five polls conducted immediately after each
debate into the perceived winner of each debate and the overall position (first, second and
third) of the leaders.
Table 1. Poll of Polls for Leaders Debates
Leader First Debate Second Debate Third Debate Clegg 1st (48%) 1st (34%) 2nd (32%) Cameron 2nd (26%) 2nd (33%) 1st (37%) Brown 3rd (21%) 3rd (27%) 3rd (26%)
Clegg was the clear winner in the first debate and subsequently declined from this highpoint;
Cameron performed poorly (against high expectations) in the first debate and subsequently
improved to win the last and arguably the most important debate. Brown’s poor performance
in the first debate only slightly improved in subsequent ones. However, Curtice (2010) notes
that in the last debate, 73% of Conservatives thought Cameron had won, 64% of Lib Dems
thought Clegg won and 68% of Labour supporters though Brown had won. This suggests
that over the debates, there was a positive partisan bias, suggesting that the debates positively
reinforced supporters’ image of their preferred leader.
Given that each debate had a specific core focus (domestic affairs, foreign affairs and the
economy in that order - see BBC (2010) for the sub themes that were discussed), and that

8
these were meant to reflect the ‘important’ policy issues facing the electorate, we can use our
maps to gauge if a) any of these policies were introduced into supporters maps and or b)
whether policies became stronger or weaker within the maps over the campaign. We accept
that any changes we identify may have been caused by the debates or other external
influences over the campaign, including political advertising which we consider next.
The Effect of Party Political Advertising
It has been noted that UK General Election campaigns have on balance become more
negative including the use of personal attack advertising aimed at the leaders of opposition
parties. This negativity has exacerbated the already low levels of voters trust held in parties
and their leaders (Dermody & Hanmer-Lloyd, 2005). This apparently counter-productive
strategy is explainable by the enduring belief that negative information about opponents is
more influential than positive candidate information (Pinkleton, 1997). A re-analysis of poll
data from six US presidential elections has cast doubt on this (Klein & Ahluwalia, 2005) and
concluded that candidate preference is a major moderating effect. In fact, negativity only
appeared to have a significant effect on those who already had a negative attitude to a
politician. This so called ‘motivational’ conceptualisation of negativity in politics is based on
biased processing of information through various mechanisms to avoid cognitive dissonance
such as source derogation (Ahluwalia, 2000).
To prevent compounding the negativity effect by considering maps of those with a preference
and antipathy to a leader, we asked respondents to map only their preferred leader. An
implication of this is that they are likely to already have a positive set of associations of their
preferred leader in their mental maps. Given the recent evidence on the effect of negative
campaigning we expect that such negativity will be filtered out or explained away such that
no effect will be evident in the leaders’ maps.
The Impact of the Gillian Duffy Event on Gordon Brown’s Image.
When asked what blows a government off course, MacMillan famously replied ‘Events, dear
boy, events’. During the 2010 campaign, Gordon Brown, whilst still being taped, referred to
a member of the public he had just talked with (Gillian Duffy) as a bigot. It was the most
important uncontrolled event of the campaign and generated massive negative media
coverage.ii There was, prima facie, reason to expect that voters would apportion blame to
9
him as a result. Attribution theory (Folkes, 1984), has been used previously to analyse credit
or blame apportionment from political events (Smith, 2005). In this case, Brown was the
cause of the event (its locus), had control over it and such action was not the normal state (i.e.
it’s not normal to bad-mouth electors). As such, negative attribution conditions existed
(Weiner, 1986). However, image repair discourse suggests mitigation strategies for
politicians (Benoit & McHale, 1999). Brown first used ‘defeasibility’ (incorrect information)
as a rhetorical device, arguing he had mis-heard Mrs. Duffy’s comments about immigrants.
He followed this with ‘corrective action’ by visiting Mrs. Duffy to explain himself. As the
furore mounted he finally adopted the ‘mortification’ device, apologising and saying he was
very sorry (Wintour & Curtis, 2010).
In terms of the effect of ‘Duffygate’ on Brown the literature suggests he was liable for blame
apportionment but apologia may have negated the effect. We therefore analyse Brown’s map
before and after the event to see if it had become a voter association of him and whether it
had become a negative association. There is no reason to think that any ‘event’ will be
present in the other leaders’ maps.
Leader Brand Image and Brand Equity During the Campaign
According to Keller (1993, p. 1), ‘A brand is said to have positive (negative) customer-based
brand equity when consumers react more (less) favourably to an element of the marketing
mix for the brand than they do to the same marketing mix element when it is attributed to a
fictitiously named or unnamed version of the product or service’. In politics, such equity
would mean voters viewing a leaders’ debate or Party Election Broadcast more (less)
positively because he/she already had a positive (negative) view of that party.
It has been argued that the associations that consumers have of a political brand are key to the
way that voters interpret new information and how they behave towards the brand (French &
Smith, 2010), though this has not been investigated at an election and at different stages of an
election. However, brand associations are not all of equal importance or positive and as such
affect equity differently. Thus brand association strength, favourability and uniqueness have
been identified as criteria for brand image strength and eventually brand equity (Keller,
1993). Brand image strength (henceforth BIS) is thus influenced by the number of
associations the leader brings to mind; more is better than less as this allows greater potential

10
from spreading activation to other associations (Krishnan, 1996). Clearly, it is also important
that the associations are favourable rather than negative for enhanced brand image and equity.
Lots of negative associations will lead to low or even negative brand equity. Uniqueness
relates to associations not shared with other leaders, making such associations a potential
source of differentiation. Political brands have been seen to be quite different from each
other in that they have a large number of unique associations (French & Smith, 2010). For
example, Brown is likely to be associated with Labour, the colour red, being Prime Minister,
having been Chancellor, being older – associations not shared with Cameron and Clegg. In
the leaders’ maps that follow (Figures 1, 2 and 3), no association is shared between party
leaders, reflecting their uniqueness compared to each other.
To measure leader BIS, therefore, we need to incorporate the above criteria. In addition we
compared these measures at the beginning and end of the campaign to determine if their
image (and concomitant brand equity) had increased or decreased over the campaign.
Research Propositions
The rest of the paper seeks to uncover the perceived leader brand effects that occurred during
the UK 2010 General Election. From the preceding review of the branding, voter behaviour
and campaign effects literature, we are directed towards the following research areas,
provided as propositions for testing.
Based on the work of Iyengar and Simon (2000) that campaigns do have an effect on voter
knowledge of political issues:-
P1a) There will be a significant increase in the number and strength of leader associations as
reflected in their brand maps at the start and end of the election campaign.
P1b) There will be evidence of learning about policies and particularly those which relate to
the themes of the campaign
The research of Klein and Ahluwalia (2005) suggests that the effect of negative advertising
has been exaggerated. Given that there will be positive elements of all campaigns and we are
considering respondents who are likely to be more amenable to positive/reinforcing
information and more likely to filter out negative information, we propose that there will be a
positive effect on the leaders’ maps. Hence:-

11
P2) There will be a significant improvement in perceived favourability of leaders as
measured by their brand associations over the campaign.
We have seen that brand image is determined by the overall nature of a brand’s associations
and that we expect these to grow in number and favourability over the campaign. It therefore
follows that we can also expect to see an overall improvement of the leaders’ brand image
during the campaign. As brand image is a key component of a brand’s equity, the latter
should be enhanced by the campaign too.
P 3) There will be a significant positive effect on leader brand image from the campaign,
causing enhanced leader BIS.
Given the conflicting attribution and apologia literature discussed, we propose that:-
P4a) There will be no specific evidence of the Duffy affair in Brown’s final brand map (i.e.
after the affair took place).
P4b) There will be no general dilution of Brown’s brand image from the affair.
Next we outline the nature of brand maps and the methodology for their construction.
Developing Brand Maps for the Party Leaders.
Recently, a practical means of producing mental maps of brands has emerged. The Brand
Concept Mapping approach of John, Loken, Kim and Basu Monga (2006) is a well tested
method for the efficient production of mental maps, based on the cognitive psychology/HAM
conceptualisation referred to previously. The maps are drawn by individual consumers
quickly and in enough quantity, with proven validity and reliability, to allow confidence in
the resulting map for a given brand. It is this approach that we have adopted for measuring
the mental maps of the party leaders just prior to the campaign launch and on election day
(May 6th, 2010).
We followed John et al.’s (2006) protocol for developing Brand Concept Maps (henceforth
BCMs). Rather than repeat the methodology used to create the maps in detail (see John et al.
2006 for this), we focus on showing how we a) developed BCMs of the three leaders, and b)

12
analysed the maps to address the research propositions that we have developed from the
literature.
The BCM approach uses a stimulus to trigger memory about a brand. The stimulus used in
this research was the brand name, i.e. Gordon Brown, David Cameron and Nick Clegg. The
research was based on a sample of two discrete groups of undergraduate students taught by
the authors at an English University, one for the elicitation stage (N=141) and one for the
actual mapping stage (N=169). This convenience sample, though not representative of the
wider electorate, is reflective of an important segment of the wider voting population,
namely, first time voters. Also, their educational base/intelligence allows for their
assimilation of brand knowledge prior to and during the campaign, thus leading to well
developed BCMs for subsequent analysis.
The first step in BCM research is the Elicitation phase wherein the first cohort were asked to
write down the associations (unprompted) that came to mind when they thought of their own
personal preference of leader in the forthcoming election. This produced an unprompted
listing of associations for Brown, Cameron and Clegg. This list was then reduced by
removing associations mentioned by very few respondents (4 or less).
The second, Mapping phase entailed using a different subset of the student population. They
were shown an existing brand map of the VW Beetle to instruct them on how to construct a
brand map.iii They were next asked to identify the leader of the party they were most inclined
to support at the election and were then directed to the associations of their favoured party
leader, as derived from the Elicitation stage. From these they were asked to construct their
own map for their chosen leader. Respondents were also told that could add their own
associations. Participants were asked not only to choose those associations they thought
relevant but also to link them together. When this was complete, respondents were asked to
indicate the strength of the link between associations using single, double or triple lines.
Finally, they were instructed to indicate how they viewed favourability/unfavourability by
placing either a plus or a minus sign beside each association; if they had neutral feelings, then
they were instructed to leave the association unmarked.
At the third, Aggregation stage, the individual brand maps were used to generate a single
brand consensus map for each leader, again following John et al’s (2006) mapping protocol.

13
With the three leaders’ maps, aggregation was done by a) identifying the (first and second-
order) brand associations that feature on the majority of individual maps; b) adding (first-
order) associations to the map that were linked to the party more often than not; c) adding the
remaining (second-order) associations by linking them to the already positioned first-order
associations; d) adding (tertiary) associations to the map - these are included due to high
frequency links to first and or second-order associations and e) calculating the average
“weight” for each link, based on the weights in the individual maps. This produced the
leaders’ maps that are provided as Figures 1 to 3 below. First-order associations are shown
as shaded ovals, second-order as unshaded ovals with a solid outline and tertiary as unshaded
ovals with dashed outlines.
As two maps were produced for each leader at different points in the campaign, the three
stages were replicated at the end of the campaign. For the second set of maps we used a new
but matched respondent group of students for elicitation to allow new associations to emerge
from the campaign. The new list of associations was provided to construct the second set of
maps from the same group of respondents as the first mapping exercise. They were again
asked to produce a map for the party leader they were most inclined to vote for. As such
some respondents ‘switched’ between their first and second map. We did not seek to isolate
these ‘switchers’ as we were concerned, not with individual, but group level views on the
leader they support as the campaign unfolded.
TAKE IN FIGS 1, 2 AND 3 HERE.
Prior to campaign Election day
GordonBrown
PM (+0.38)
Boring (-0.70)
Labour Party (+0.39)
Unpopular (-0.70)
Poor leader (-0.66)
Understudy to Blair(-0.18)
Red rose (+0.30)
Good Chancellor(+0.71)
Weak public speaker (-0.58)
Unelected (-0.62)
Good leader (+0.71)
Bullies his staff (-0.69)
Old (-0.52)
Poor publicimage (-0.71)
Blair was better (-0.59)
Grumpy (-0.63)
GordonBrown
PM (+0.68)
Labour Party(+0.57)
Poor leader(-1.00)
Understudy toBlair (+0.43)
Red rose(+0.33)
Experienced(+1.00)
Good Chancellor (+0.69)
MP's Expenses (-0.67)
RealisticPolicies (+1.00)
Good policies forEducation (+1.00)
Hard working (+0.88)

14
Figure 1. Brand Concept Maps of Brown by Labour Supporters.
Figure 2. Brand Concept Maps of Cameron by Conservative Supporters.
Figure 3. Brand Concept Maps of Clegg by Liberal Democrat Supporters.
Results
We will now consider each of the research propositions developed earlier.
P 1a) There will be a significant increase in the number and strength of leader associations as
reflected in their brand maps at the start and end of the election campaign.
To address this we analysed the BCMs as shown in the following Tables (2 and 3).
Number of associations
Leader First-order Second-order Tertiary Total
Prior to campaign Election day
DavidCameron
Posh(-0.21)
Intelligent(+0.66)
Conservative(+0.43)
Confident(+0.73)
Very English(+0.45)
Went toEton (+0.13)
SupportsChange (+0.61)
Charming(+0.56)
Green stance(+0.79)Well-dressed
(+0.63)
Good publicspeaker (+0.65)
Better thanBrown (+0.58)
Cyclist(+0.50)
Strong onImmigration (+0.45)
Will WinElection(+0.56)
Opposed to Labour (+0.37)
For the UpperClasses (-0.13)
Energetic(+0.63)
Blue(+0.13)
Lower Taxes(+0.62)
Supports TraditionalValues (+0.38)
DavidCameron
Posh(-0.07)
Intelligent(+0.91)
Conservative(+0.45)
Went toEton (-0.07)
Well-dressed(+0.84)
Good publicspeaker (+0.71)
Opposed to Labour (+0.55)
For the UpperClasses (+0.10)
Blue(+0.31)Lower Taxes
(+0.73)
Supports TraditionalValues (+0.52)
Very English(+0.45)
Prior to campaign Election day
NickClegg
PromotesEquality (+1.00)
Won't win(-0.67)
Liberal Democrat(+1.00)
No global politiciansknow him (-1.00)
Not highProfile (-0.83)
Poor Campaigning(-1.00)
Represents all socialclasses (+0.89)
Will give power backto people (+1.00) Nick
Clegg
New Ideas +0.68)
Good Policies(+0.78) Scrap University
Fees (+0.71)
Change from otherParties (+0.84)
Fresh/New(+0.73)
Supports GreenIssues (+0.75)
Approachable(+0.87)
Young(+0.50)
Liberal Democrat(+0.43)
Immigration(+0.13)
Pro-Europe(+0.33)
Scrap Trident(0.00)
15
Brown Pre-campaign 3 1 12 16
Post-campaign 2 0 9 11
Cameron Pre-campaign 5 7 9 21
Post-campaign 3 0 9 12
Clegg Pre-campaign 4 3 1 8
Post-campaign 2 3 7 12
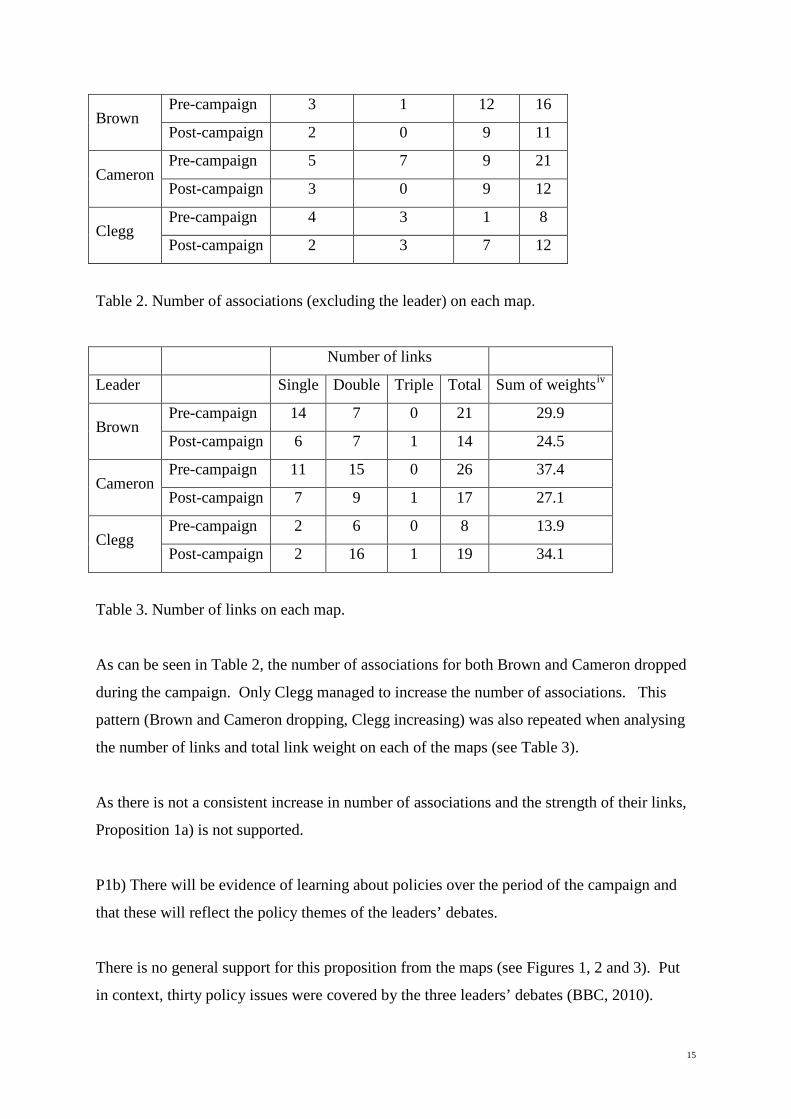
Table 2. Number of associations (excluding the leader) on each map.
Number of links
Leader Single Double Triple Total Sum of weightsiv
Brown Pre-campaign 14 7 0 21 29.9
Post-campaign 6 7 1 14 24.5
Cameron Pre-campaign 11 15 0 26 37.4
Post-campaign 7 9 1 17 27.1
Clegg Pre-campaign 2 6 0 8 13.9
Post-campaign 2 16 1 19 34.1
Table 3. Number of links on each map.
As can be seen in Table 2, the number of associations for both Brown and Cameron dropped
during the campaign. Only Clegg managed to increase the number of associations. This
pattern (Brown and Cameron dropping, Clegg increasing) was also repeated when analysing
the number of links and total link weight on each of the maps (see Table 3).
As there is not a consistent increase in number of associations and the strength of their links,
Proposition 1a) is not supported.
P1b) There will be evidence of learning about policies over the period of the campaign and
that these will reflect the policy themes of the leaders’ debates.
There is no general support for this proposition from the maps (see Figures 1, 2 and 3). Put
in context, thirty policy issues were covered by the three leaders’ debates (BBC, 2010).
16
Brown’s Election Day map reveals only one policy, ‘Good Policies for Education’, and this
is a tertiary (i.e. lower importance) association. He had no policies at all in the first map.
Cameron’s Election Day map also reveals only one policy, ‘Lower Taxes’, again at the
tertiary level. Indeed, over the campaign he lost policy associations (‘Green stance’ and
‘Strong on Immigration’ associations which were present in his first map). Only with Clegg
is there clear evidence that policies have become associated with the leader during the
campaign. In his first map, ‘Promotes Equality’ is a core association for Clegg. In his
second map, ‘Good Policies’ is a core association that links with five specific policies,
namely, ‘Scrap University Fees’, ‘Supports Green Issues’, ‘Immigration’, ‘Pro-Europe’ and
‘Scrap Trident’.
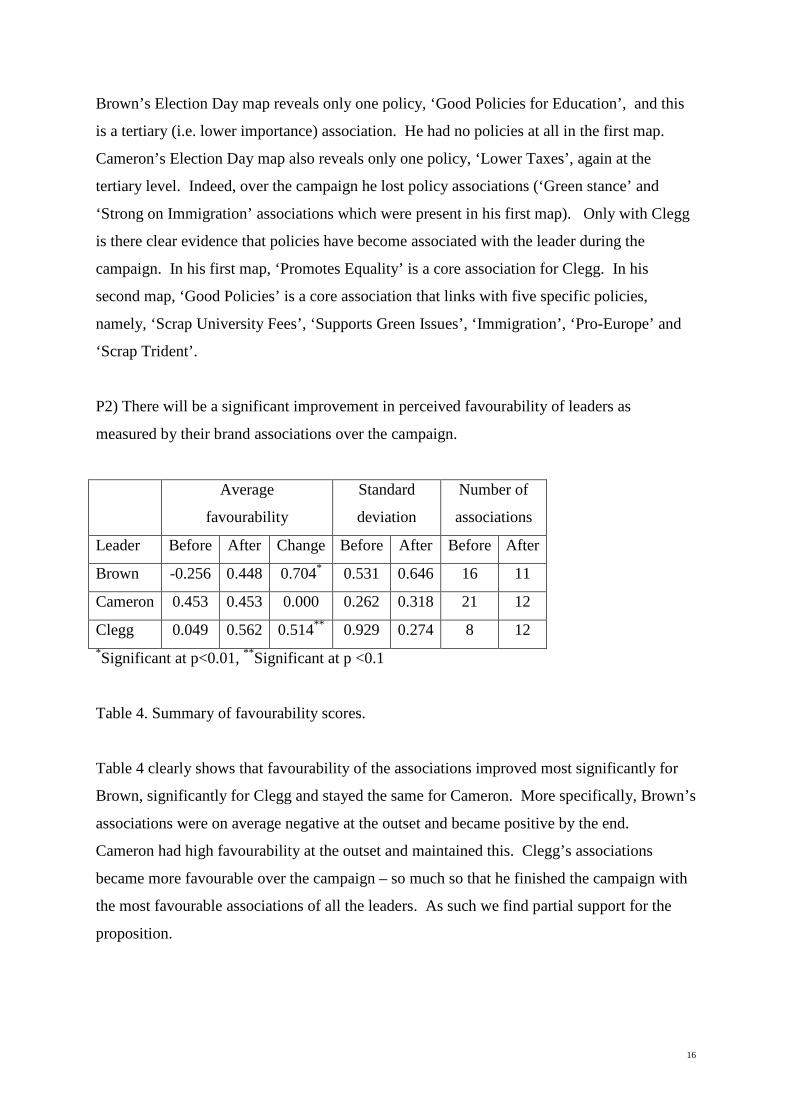
P2) There will be a significant improvement in perceived favourability of leaders as
measured by their brand associations over the campaign.
Average
favourability
Standard
deviation
Number of
associations
Leader Before After Change Before After Before After
Brown -0.256 0.448 0.704* 0.531 0.646 16 11
Cameron 0.453 0.453 0.000 0.262 0.318 21 12
Clegg 0.049 0.562 0.514** 0.929 0.274 8 12 *Significant at p<0.01, **Significant at p <0.1
Table 4. Summary of favourability scores.
Table 4 clearly shows that favourability of the associations improved most significantly for
Brown, significantly for Clegg and stayed the same for Cameron. More specifically, Brown’s
associations were on average negative at the outset and became positive by the end.
Cameron had high favourability at the outset and maintained this. Clegg’s associations
became more favourable over the campaign – so much so that he finished the campaign with
the most favourable associations of all the leaders. As such we find partial support for the
proposition.

17
P 3) There will be a significant positive effect on leader brand image from the campaign,
causing enhanced leader BIS.
As we discussed previously, brand image is a function of the number, strength of links and
favourability of the associations with the brand. We have also noted that brand associations
on the leaders’ maps are unique. As such, we accept uniqueness between leader maps and
focus on the other components that affect BIS as previously identified. By measuring brand
image thus, this approach incorporates important elements of brand equity as identified by
theory.
A measure that integrates these is identified below:-
Brand Image Strength = Normalised Association Score x Average Favourability x
Normalised Links Score
Normalised Association Score = Number of Associations / Maximum Number of
Associations over all maps
Normalised Links Score = Sum of Weight of Links / Maximum Sum of Weight of Links over
all maps
By normalising, BIS will lie somewhere between -1 (completely negative) and +1
(completely positive) and hence allow us to compare the image of leaders at a point and over
time.
Leader Ass’ns Norm.
Ass’ns
Ave.
Fav
Sum of
Links
Norm.
Links
BIS
Before Brown 16 0.76 -0.256 29.9 0.80 -0.16 Cameron 21 1.00 0.453 37.4 1.00 0.45 Clegg 8 0.38 0.049 13.9 0.37 0.01
After Brown 11 0.52 0.448 24.5 0.66 0.15 Cameron 12 0.57 0.453 27.1 0.72 0.19 Clegg 12 0.57 0.563 34.1 0.91 0.29
Table 5. Brand Image Strength measure for party leaders
18
With this measure of the brand image from BCMs (see Table 5), Brown is seen to have had a
negative image at the outset but, by the end of the campaign, negative associations had
become less important and or disappeared altogether whilst new, more positive associations
had developed. As a result, on election day he had positive brand image amongst his
supporters. Cameron started the campaign with the strongest brand image measure and
whilst still positive, this fell back by the end of the campaign. Clegg began with a neutral
image and ended with the most positive image measure of the three leaders. In terms of
overall change brought about by the campaign, Brown’s change was the most, even though
his image was the lowest of the three on election day. Given this interesting but not uniform
experience, the proposition is not supported; BIS did develop for Clegg and Brown but
declined for Cameron.
P4a) There will be no specific evidence of the Duffy affair in Brown’s final brand map (i.e.
after the affair took place).
‘Eyeballing’ the two maps for Brown (Figure 1) answers this clearly; there was no evidence
of a Duffy effect. Indeed, the ‘Bullies his staff’ association in his first map is not present in
the second as a more positive attitude towards Brown developed as the election neared. It
should be noted that the association ‘Gillian Duffy’ and ‘Bullies his staff’ were available to
respondents in the second mapping exercise.
P4b) There will be no general dilution of Brown’s brand image from the affair.
Although we are not able to isolate the Duffy affair, it is evident from the favourability and
BIS scores for Brown that his image improved as the campaign went on. Without the Duffy
affair this improvement might have been stronger of course, but the absence of any related
associations does not support this interpretation.
Taken together, proposition 4a and 4b are supported as the Duffy affair had little identifiable
negative effect on Brown amongst his supporters.
Discussion
The maps have provided us with a great deal of information about how voters’ associations of
preferred leaders changed over a campaign. However, the changes were not always as
19
expected. On reflection, our propositions tacitly assumed that voters had the same or similar
knowledge of their preferred leader and thus, learning effects would be uniform. In practice
they were not; Clegg, being less well known, had much greater potential to ‘grow’ as a brand
through the election. Cameron had a harder task as his associations were well established and
positive and he had the difficult task of holding things at this high level whilst both of his
opponents sought to attack him (most notably in the first leaders’ debate). Overall, using our
brand measures, he was successful in doing this. Brown too was not going to be affected the
same as others as he was not expected to campaign well and was unpopular at the outset even
with those who preferred him.
With regards proposition 1a, we are faced by an interesting phenomenon; the narrowing of
Brown and Cameron’s maps and the expansion of Clegg’s. The latter is easy to understand
given Clegg’s access to greater media coverage than is available to a third party leader during
a Parliament. It would appear that Lib Dem supporters were unclear about Clegg (i.e. as
reflected in his first map) and that they were filling this void by learning about him over the
campaign as new information was assimilated into memory and activated when the last map
was produced.
However, Clegg’s success should not have caused a reduction in associations and links for
the main party leaders. The narrowing of the maps for Brown and Cameron was not expected.
One explanation forwarded by the literature is that forgetting of brand associations can take
place. This can be brought about by ‘interference’ created by additional new brand
information being assimilated (Keller, Heckler & Houston, 1998). Another possibility is that
voters are acting as cognitive misers (Simon, 1957) using a few associations as ‘heuristic’
devices to act as a short-cut to decision making. As the election neared, they concentrate on a
narrower group of ideas, with other, now less important associations becoming less well
recalled.
With regards proposition 1b, it is interesting how few policy associations were evident in the
maps. Clegg added five policy associations which were part of a wider, steep learning curve
about him, a less well known brand. For Brown and Cameron policies were not evident and
these did not develop through any campaign communications (such as election broadcasts
and the leaders’ debates). As such, for the supporters of Brown and Cameron in this group of
voters at least, they could not be using the leader’s policies to inform their preference and

20
likely voter behaviour. The leader as heuristic device for policies is perhaps operating here.
Another possible explanation is that voters don’t really think that a leader will implement
policy as they promise and thus don’t bother to associate them strongly with the leader.
Clegg may have managed to overcome this barrier by his novelty and ability to position
himself as the outsider to mainstream party politics. Brown’s weakness as a leader is
reflected in that, despite having been in government for 13 years, he had failed to become
associated with any policies beyond ‘Good policies for Education’.
With regards, proposition 2, as expected, both Brown and Clegg’s associations became more
favourably perceived. Cameron’s stayed as they were and we speculate whether it is harder
to enhance already favourable associations of a popular leader than those which are
unfavourable or neutral.
The findings on BIS changes, relating to proposition 3, are particularly revealing. Cameron
began with a strong image which was diluted by the campaign. It is tempting to think that
Cameron supporters were less impressed with his performance because they had high
expectations and because Clegg apparently stole his crown as the best communicator. Clegg
had the most to gain from the campaign as for the first time he had almost parity in media
coverage with the other two leaders. The maps and BIS measures show this learning and
image building effect clearly. Conversely, we can see how Brown’s image became more
focused but more positive as the campaign progressed, indicating that he, whilst not
‘winning’ the campaign had steadied the ship as far as supporters were concerned.
Cameron’s experience was also to be expected. The leader who is expected to win and
perform the best at the leaders’ debates can only confirm that expectation or underperform.
Clegg’s first debate set the campaign alight and prevented the campaign becoming a victory
procession for the Tories. Cameron’s subsequent leader’s debates were better and culminated
in him ‘winning’ the final one. With such a campaign backdrop, a decline followed by
consolidation in his map is understandable.
Regarding propositions 4a and 4b, Brown’s experience with the Duffy affair has been seen to
not have affected his supporters maps at all; in fact the opposite. His first map included a
‘Bullies his staff’ association. This disappeared with the general improvement in the second
map and, although the association Gillian Duffy was on the elicitation list, not enough
respondents included it on a map for it to show on the aggregate map. We can speculate
21
whether his ‘apologia’ succeeded or that the respondents had ‘filtered out’ the information
but it did not have much bearing for the group of Labour supporters.
Conclusion, Limitations and Further Research
This special edition of the journal sets out, amongst other things, to evaluate perspectives on
how the use of marketing is evolving plus its prospects for future use in British General
elections. In this paper we have supplied a new perspective on how to analyse the impact of
a campaign on voters using the associations that voters hold of party leaders and from which
their voting decisions will be influenced. It has the prospect of further application as the
targeting of ‘important’ groups/segments provides focus for future mapping activity by both
academics and, given its practicality, party researchers also.
More specifically, the mapping approach provides a new avenue for positioning research by
measuring the effectiveness of brand identity building when compared with the actual image
change within voter segments – and how these change over time in relation to brand strategy.
BCM thus promises to be a practical tool for campaign managers that may be used widely or
more likely in a targeted way (at floating voters in marginal constituencies for example).
Showing how the method works in the electoral context, plus evidence on campaign
negativity, BIS measurement of leaders plus the impact of events are important contributions
and point the way for further research in political brands and campaign effects. Longitudinal
BCM analysis also allowed us to analyse the success or otherwise of a campaign on voter
learning about a leader. It has the potential therefore to be used in future campaigns to better
understand the leader and party’s brand image to shape campaign strategy and analyse
speedily the success or failure of specific tactics.
However, the preceding results and discussion section is limited by the fact that, given the
convenience nature of our sample, we are unable to generalise from these findings. The
results and discussion section also highlighted the limits of the mapping approach as a stand-
alone research tool. It is powerful in charting brand image and how this changes over time.
It is not able to explain why these changes have occurred. One way of addressing this is to
adopt a mixed approach wherein brand mapping is supplemented with parallel qualitative
research to ask voters, post hoc, to explain the influences and experiences that generated
22
changes to their maps over time. Such an approach can be used to research further those
unexpected results that we witnessed in our research.
Considering further research, we acknowledge that some explanations, forwarded in the
discussion, remain speculative of why some propositions were not supported by the findings.
Thus, the narrowing of Brown and Cameron’s maps over the campaign, the lack of policy
associations identified on maps and the role of apologia in offsetting damaging ‘events’ are
areas in themselves for further explanatory research. It is also apparent that, had we more
space, we could have focused on other interesting ways of analysing the maps. For example,
we have not really considered what the maps tell us of the relative importance of ‘brand
personality’ dimensions for the leaders in terms of their own maps and as compared to each
other. The mapping process thus offers a different means of analysing leader personality than
the a priori personality scales approach currently used in political branding research (Smith,
2009; Guzmán & Sierra, 2009).
Herein we focused on the importance of (or lack of) policies in the leaders’ maps. We could
just as easily have considered the relative importance of the ‘Party’ association within the
leaders’ maps. It is, for example, apparent that the Conservative party and Labour party are
important associations for Cameron and Brown; both parties being core associations linked to
their respective leader. By comparison, on election day, the Liberal Democrat party was only
a tertiary association for Clegg. There is thus the potential to use more sophisticated
measurement to analyse this relationship within maps.
By way of conclusion, within this paper we have analysed the effect that the 2010 Election
Campaign had on the leaders of the three main, national parties. BCMs offer great potential
for tracking voter groups (e.g. core supporters, floating voters etc.) during campaigns. It can
also be used to track changes over a Parliament or whilst important national issues are played
out (such as the Iraq war, coalition politics and electoral reform, etc.). The BCM approach
can identify clearly and quickly the mental map that voters carry for leaders and their parties.
As such, they can reveal the difference between what campaign managers want (i.e. desired
political brand identity) and what voters will let them have (actual political brand image as
reflected in brand maps). The challenge party strategists face has not changed; they still need
to develop a campaign which creates an image in the minds of ‘important’ voter groups

23
which matches their desired brand identity. The BCM approach now offers a useful tool for
tracking their success in this task.
References
Ahluwalia, R. (2000). Examination of psychological processes underlying resistance to
persuasion. Journal of Consumer Research, 27, 217-232.
Anderson, J. R. (1983). The architecture of cognition. Cambridge: Harvard University Press.
BBC, (2010, August). Prime ministerial debates – programme format. BBC Website.
Retrieved from http://www.bbc.co.uk/blogs/theeditors/pm_debates_programme_format.pdf
Benoit, W. L. and McHale, J. P. (1999). Kenneth Starr's image repair discourse viewed in
20/20. Communication Quarterly, 47, 265-280.
Curtice, J. (2010, May). Voters judged the debates based on their prejudices. The
Independent. Retrieved from http://www.independent.co.uk/opinion/commentators/john-
curtice-voters-judged-the-debates-based-on-their-prejudices-1959601.html
Davies, G. and Mian, T. (2010). The reputation of the party leader and of the party being led.
European Journal of Marketing, 44, 331-350.
de Groot, A.M.B. (1989). Representational aspects of word imageability and word frequency
as assessed through word association. Journal of Educational Psychology: Learning Memory
and Cognition, 15, 824-845.
Dermody, J. and Hanmer-Lloyd, S. (2005). Promoting distrust? A chronicle of the 2005
British General Election advertising campaigns. Journal of Marketing Management, 21,
1021-1047.
Dobni, D., & Zinkhan, G. M. (1990). In search of brand image: A foundation analysis.
Advances in Consumer Research, 17, 110–119.
24
Folkes, V. (1984). Consumer reactions to product failure: An attributional approach. Journal
of Consumer Research, 10, 398-409.
French, A.P. and Smith, I.G. (2010). Measuring political brand equity: A consumer oriented
approach. European Journal of Marketing, 44, 460-477.
Guzmán, F. and Sierra, V. (2009). A political candidate’s brand image scale: Are political
candidates brands. Brand Management, 17, 207-217.
Harris, P. and Lock, A. (2001). Establishing the Charles Kennedy brand: A strategy for an
election the result of which is a foregone conclusion. Journal of Marketing Management, 17,
943-956.
Iyengar, S. and Simon, A. F. (2000). New perspectives and evidence on political
communication and campaign effects. Annual Review of Psychology, 51, 149-169.
John, D.R., Loken, B. and Joiner, C. (1998). The negative impact of extensions: Can flagship
products be diluted? Journal of Marketing, 62, 19–32.
John, D.R., Loken, B., Kim, K. and Basu Monga, A. (2006). Brand concept maps : A
methodology for identifying brand association networks. Journal of Marketing Research,
43, 549-563.
Kavanagh, D. (1995). Election campaigning: The new marketing of politics, Oxford, UK:
Blackwell.
Keller, K.L. (1993). Conceptualizing, measuring, and managing customer-based brand
equity. Journal of Marketing, 57, 1-22.
Keller, K.L., Heckler, S.E. and Houston, M.J. (1998). The effects of brand name
suggestiveness on advertising recall. Journal of Marketing, 62, 48-57.
25
Keller, K.L. (2002). Branding and brand equity. In B. A. Weitz and R. Wensley (Eds.),
Handbook of marketing (151-178). Thousand Oaks, CA: Sage.
Klein, J. G. and Ahluwalia, R. ( 2005). Negativity in the evaluation of political candidates.
Journal of Marketing, 69, 131-142.
Krishnan, S.H. (1996). Characteristics of memory associations: A consumer-based brand
equity perspective. International Journal of Research in Marketing, 13, 389-405.
Lau, R. R. & Redlawsk, D. P. (2001). Advantages and disadvantages of cognitive heuristics
in political decision making. American Journal of Political Science, 45, 951-971.
Mortimore, R. (2010, May). That election in figures. The Coventry Conversation, Retrieved
from http://www.scribd.com/The-Election-in-Numbers-Roger-Mortimore-
MORI/d/31301507.
Needham, C. (2005). Brand leaders: Clinton, Blair and the limitations of the permanent
campaign. Political Studies, 53, 343-361.
Needham, C. (2006). Brands and political loyalty. Brand Management, 13, 178-187.
O’Shaughnessy, N. J. and Henneberg, S.C. (2007). The selling of the President 2004: A
marketing perspective. Journal of Public Affairs, 7, 249-268.
Pinkleton, B. E. (1997). The effects of negative comparative political advertising on
candidate evaluations and advertising evaluations: An exploration. Journal of Advertising,
26, 19-29.
Scammell, M. (2007). Political brands and consumer citizens: The rebranding of Tony Blair.
The ANNALS of the American Academy of Political and Social Science, 611,176 -192.
Schneider, H. (2004). Branding in politics – manifestations, relevance and identity-oriented
management. Journal of Political Marketing, 3(3), 41-67.

26
Simon, H. (1957). Models of man: Social and rational. New York: Wiley.
Smith, I.G. (2001). The 2001 General Election: Factors influencing the brand image of
political parties and their leaders. Journal of Marketing Management, 17, 1058-1073.
Smith, I.G. (2005). Politically significant events and their effect on the image of political
parties: A conceptual approach. Journal of Political Marketing, 4(2/3), 91-114.
Smith, I.G. (2005). Conceptualising and testing brand personality in British politics. Journal
of Political Marketing, 8, 209-232.
Smith, G. and French, A. (2009). The political brand : A consumer perspective. Marketing
Theory, 9, 209-226.
Sparrow, N. and Turner, J. (2001). The permanent campaign - The integration of market
research techniques in developing strategies in a more uncertain political climate. European
Journal of Marketing, 35, 984 – 1002.
Teichert, T.A. and Schöntag, K. (2010). Exploring consumer knowledge structures using
associative network analysis. Psychology & Marketing, 27, 369–398.
Tomz, M. and Sniderman, P.M. (2005). Brand names and the organisation of mass belief
systems. Retrieved from Stanford University website:
http://www.stanford.edu/~tomz/working/TomzSniderman2005.pdf
van Rekom, J., Verlegh, P.W.J. and Slokkers, R. (2009). The owner's edge: Brand ownership
influences causal maps. Journal of Business Research, 62, 339-344.
Weiner, B. (1986). An attributional theory of motivation and emotion. New York:
Springer/Verlag.
White, J. and de Chernatony, L. (2002). New Labour: A study of the creation, development
and demise of a political brand. Journal of Political Marketing, 1(2/3), 45-52.

27
White, M. and Perkins, A. (2002, October). ‘Nasty party’ warning to Tories. the guardian.
Retrieved from http://www.guardian.co.uk/politics/2002/oct/08/uk.conservatives2002
Wintour P. and Curtis, P. (2010, April). Gordon Brown 'penitent' after bigot gaffe torpedoes
election campaign. the guardian. Retrieved from
http://www.guardian.co.uk/politics/2010/apr/28/gordon-brown-penitent-bigot-gaffe-
campaign
Zhao, X. and Chaffee S.H. (1996). Campaign ads versus television news as information
sources. Public Opinion Quarterly, 59, 41–65.
i At the 2002 Conservative party conference at Bournemouth, the Chairman, Theresa May, attacked her own party as “just plain unattractive” and “the nasty party”. She highlighted the party’s “demonising” of minorities as having positioned it too narrowly and unsympathetically for large swaths of the electorate (White and Perkins 2002). ii Other uncontrolled events occurred. Cameron was widely decried for his poster that carried what looked like an airbrushed photo’ of him. Although not of the same level as the Duffy incident we did check his last brand map and confirmed that it did not appear . iii This brand map was the same as used by John et al. (2006), amended to make more relevant to the sample. iv The actual (unrounded) average weights for all links on a given map were used to increase accuracy.
Related Documents