Frontline Learning Research 2 (2013) 33-52 ISSN 2295-3159 Corresponding author: Robert Klassen, Department of Education University of York, York UK YO10 5DD, [email protected] Doi 33 | FLR Measuring Teacher Engagement: Development of the Engaged Teachers Scale (ETS) Robert M. Klassen a,b , Sündüs Yerdelen c , Tracy L. Durksen b a University of York, UK b University of Alberta, Edmonton, Canada c Middle East Technical University, Ankara, Turkey and Kafkas University, Kars, Turkey Article received 27 June 2013 / revised 10 December 2013 / accepted 10 December 2013 / available online 20 December 2013 Abstract The goal of this study was to create and validate a brief multidimensional scale of teacher engagement—the Engaged Teachers Scale (ETS)—that reflects the particular characteristics of teachers’ work in classrooms and schools. We collected data from three separate samples of teachers (total N = 810), and followed five steps in developing and validating the ETS. The result of our scale development was a 16-item, 4-factor scale of teacher engagement that shows evidence of reliability, validity, and practical usability for further research. The four factors of the ETS consist of: cognitive engagement, emotional engagement, social engagement: students, and social engagement: colleagues. The ETS was found to correlate positively with a frequently used work engagement measure (the UWES) and to be positively related to, but empirically distinct from, a measure of teachers’ self-efficacy (the TSES). Our key contribution to the measurement of teacher engagement is the novel inclusion of social engagement with students as a key component of overall engagement at work for teachers. We propose that social engagement should be considered in future iterations of work engagement measures in a range of settings. Keywords: Teachers; Engagement; Scale validation; Motivation 1. Introduction A recurring theme of recent educational debate in public and research circles is the critical importance of providing all students with access to teachers who are highly engaged in their work (Economist Intelligence Unit, 2012; Pianta, Hamre, & Allen, 2012; Rimm-Kaufman & Hamre, 2010; Staiger & Rockoff, 2010).

Welcome message from author
This document is posted to help you gain knowledge. Please leave a comment to let me know what you think about it! Share it to your friends and learn new things together.
Transcript
Frontline Learning Research 2 (2013) 33-52
ISSN 2295-3159
Corresponding author: Robert Klassen, Department of Education University of York, York UK YO10 5DD,
Doi
33 | F L R
Measuring Teacher Engagement: Development of the Engaged
Teachers Scale (ETS)
Robert M. Klassena,b
, Sündüs Yerdelenc, Tracy L. Durksen
b
aUniversity of York, UK
bUniversity of Alberta, Edmonton, Canada
cMiddle East Technical University, Ankara, Turkey and Kafkas University, Kars, Turkey
Article received 27 June 2013 / revised 10 December 2013 / accepted 10 December 2013 / available online 20 December 2013
Abstract
The goal of this study was to create and validate a brief multidimensional scale of teacher
engagement—the Engaged Teachers Scale (ETS)—that reflects the particular characteristics of
teachers’ work in classrooms and schools. We collected data from three separate samples of
teachers (total N = 810), and followed five steps in developing and validating the ETS. The
result of our scale development was a 16-item, 4-factor scale of teacher engagement that shows
evidence of reliability, validity, and practical usability for further research. The four factors of
the ETS consist of: cognitive engagement, emotional engagement, social engagement: students,
and social engagement: colleagues. The ETS was found to correlate positively with a frequently
used work engagement measure (the UWES) and to be positively related to, but empirically
distinct from, a measure of teachers’ self-efficacy (the TSES). Our key contribution to the
measurement of teacher engagement is the novel inclusion of social engagement with students
as a key component of overall engagement at work for teachers. We propose that social
engagement should be considered in future iterations of work engagement measures in a range
of settings.
Keywords: Teachers; Engagement; Scale validation; Motivation
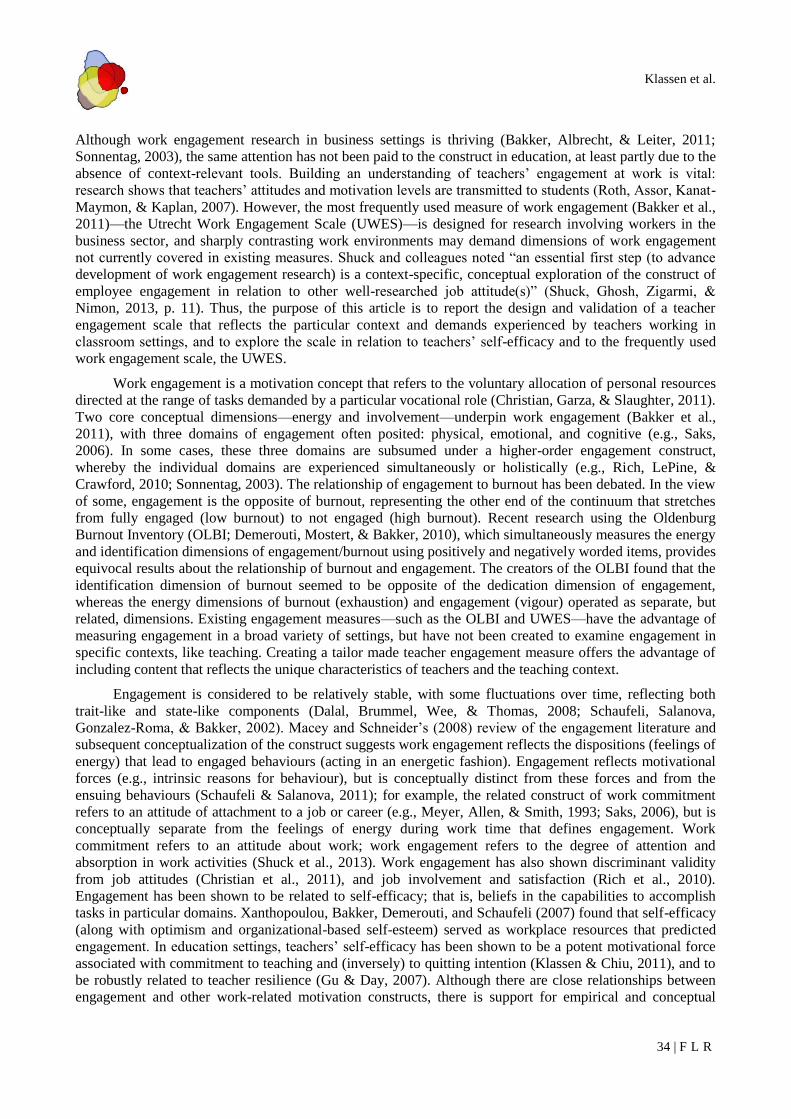
1. Introduction
A recurring theme of recent educational debate in public and research circles is the critical importance of
providing all students with access to teachers who are highly engaged in their work (Economist Intelligence
Unit, 2012; Pianta, Hamre, & Allen, 2012; Rimm-Kaufman & Hamre, 2010; Staiger & Rockoff, 2010).
Klassen et al.
34 | F L R
Although work engagement research in business settings is thriving (Bakker, Albrecht, & Leiter, 2011;
Sonnentag, 2003), the same attention has not been paid to the construct in education, at least partly due to the
absence of context-relevant tools. Building an understanding of teachers‘ engagement at work is vital:
research shows that teachers‘ attitudes and motivation levels are transmitted to students (Roth, Assor, Kanat-
Maymon, & Kaplan, 2007). However, the most frequently used measure of work engagement (Bakker et al.,
2011)—the Utrecht Work Engagement Scale (UWES)—is designed for research involving workers in the
business sector, and sharply contrasting work environments may demand dimensions of work engagement
not currently covered in existing measures. Shuck and colleagues noted ―an essential first step (to advance
development of work engagement research) is a context-specific, conceptual exploration of the construct of
employee engagement in relation to other well-researched job attitude(s)‖ (Shuck, Ghosh, Zigarmi, &
Nimon, 2013, p. 11). Thus, the purpose of this article is to report the design and validation of a teacher
engagement scale that reflects the particular context and demands experienced by teachers working in
classroom settings, and to explore the scale in relation to teachers‘ self-efficacy and to the frequently used
work engagement scale, the UWES.
Work engagement is a motivation concept that refers to the voluntary allocation of personal resources
directed at the range of tasks demanded by a particular vocational role (Christian, Garza, & Slaughter, 2011).
Two core conceptual dimensions—energy and involvement—underpin work engagement (Bakker et al.,
2011), with three domains of engagement often posited: physical, emotional, and cognitive (e.g., Saks,
2006). In some cases, these three domains are subsumed under a higher-order engagement construct,
whereby the individual domains are experienced simultaneously or holistically (e.g., Rich, LePine, &
Crawford, 2010; Sonnentag, 2003). The relationship of engagement to burnout has been debated. In the view
of some, engagement is the opposite of burnout, representing the other end of the continuum that stretches
from fully engaged (low burnout) to not engaged (high burnout). Recent research using the Oldenburg
Burnout Inventory (OLBI; Demerouti, Mostert, & Bakker, 2010), which simultaneously measures the energy
and identification dimensions of engagement/burnout using positively and negatively worded items, provides
equivocal results about the relationship of burnout and engagement. The creators of the OLBI found that the
identification dimension of burnout seemed to be opposite of the dedication dimension of engagement,
whereas the energy dimensions of burnout (exhaustion) and engagement (vigour) operated as separate, but
related, dimensions. Existing engagement measures—such as the OLBI and UWES—have the advantage of
measuring engagement in a broad variety of settings, but have not been created to examine engagement in
specific contexts, like teaching. Creating a tailor made teacher engagement measure offers the advantage of
including content that reflects the unique characteristics of teachers and the teaching context.
Engagement is considered to be relatively stable, with some fluctuations over time, reflecting both
trait-like and state-like components (Dalal, Brummel, Wee, & Thomas, 2008; Schaufeli, Salanova,
Gonzalez-Roma, & Bakker, 2002). Macey and Schneider‘s (2008) review of the engagement literature and
subsequent conceptualization of the construct suggests work engagement reflects the dispositions (feelings of
energy) that lead to engaged behaviours (acting in an energetic fashion). Engagement reflects motivational
forces (e.g., intrinsic reasons for behaviour), but is conceptually distinct from these forces and from the
ensuing behaviours (Schaufeli & Salanova, 2011); for example, the related construct of work commitment
refers to an attitude of attachment to a job or career (e.g., Meyer, Allen, & Smith, 1993; Saks, 2006), but is
conceptually separate from the feelings of energy during work time that defines engagement. Work
commitment refers to an attitude about work; work engagement refers to the degree of attention and
absorption in work activities (Shuck et al., 2013). Work engagement has also shown discriminant validity
from job attitudes (Christian et al., 2011), and job involvement and satisfaction (Rich et al., 2010).
Engagement has been shown to be related to self-efficacy; that is, beliefs in the capabilities to accomplish
tasks in particular domains. Xanthopoulou, Bakker, Demerouti, and Schaufeli (2007) found that self-efficacy
(along with optimism and organizational-based self-esteem) served as workplace resources that predicted
engagement. In education settings, teachers‘ self-efficacy has been shown to be a potent motivational force
associated with commitment to teaching and (inversely) to quitting intention (Klassen & Chiu, 2011), and to
be robustly related to teacher resilience (Gu & Day, 2007). Although there are close relationships between
engagement and other work-related motivation constructs, there is support for empirical and conceptual
Klassen et al.
35 | F L R
distinctiveness, and exploring the nomological web of relationships among key related variables results in a
more nuanced picture of how people behave in the workplace.
Schaufeli and colleagues operationalised work engagement in their creation of the UWES (e.g.,
Schaufeli, Bakker, & Salanova, 2006), and defined work engagement as an affective-cognitive state, not
targeted at any particular work event or task. However, questions remain about the robustness of its factor
structure (e.g., Klassen et al., 2012; Shimazu et al., 2008; Sonnentag, 2003), and its item content may not be
relevant for all contexts. For example, although the UWES has been used with teachers (e.g., Bakker & Bal,
2010; Hakanen, Bakker, & Schaufeli, 2006), the scale content ignores the particular conditions associated
with teachers‘ work. In particular, the UWES and other work engagement scales do not reflect the dimension
of social engagement with students, a dimension which perhaps uniquely defines the act of teaching
(Jennings & Greenberg, 2009).
The work of teaching involves a level of demand for social engagement—energy devoted to
establishing relationships—that is rarely found in other professions (e.g., Pianta et al., 2012; Roorda,
Koomen, Spilt, & Oort, 2011) and that is not included in other conceptual definitions of engagement (i.e., the
UWES). Although workers in many settings must engage socially with colleagues, teaching uniquely
emphasises energy spent on the establishment of long-term, meaningful connections with the clients of the
work environment (i.e., students) in a way that characterises the job of teaching. In fact, researchers propose
that teacher-student relationships may play the primary role in fostering student engagement and positive
student outcomes (Davis, 2003; Klassen, Perry, & Frenzel, 2012; Pianta et al., 2012; Wang, 2009). Teachers
who devote energy to forming warm and nurturing relationships with their students tend to experience higher
levels of well-being, and less emotional stress and burnout (Jennings & Greenberg, 2009). To be sure,
workers in other professions such as health (e.g., physicians, nurses, psychologists) or business (e.g., sales
representatives), may form deep and meaningful relationships with their patients or clients, but rarely do
workers in these fields spend the number of hours that most teachers spend with their students. Like workers
in other professions, teachers form social relationships with colleagues during work, but the emphasis on
social relationships with students characterises the heart of the work of teaching; in fact, the opportunity to
work closely with students is a strong motive for many teachers entering the profession (e.g., Watt &
Richardson, 2007). Measuring teachers‘ work engagement without capturing social engagement with
students ignores one of the most important aspects of teacher engagement.
Shuck‘s recent review of work engagement (2011) concludes that the construct remains in a state of
evolution, with disciplinary bridges needed between disparate communities of research. As educational
psychologists, we question the fit of business-oriented work engagement models and measures to educational
contexts, and see a clear need for a context-specific engagement measure tailored to the work performed by
teachers. In this article, we address this need by creating and testing the Engaged Teacher Scale (ETS), in
which workplace (i.e., classroom) engagement, comprising context-responsive physical, cognitive, and
emotional dimensions (e.g., Rich et al., 2010), is combined with social engagement with students and
colleagues to represent teachers‘ overall engagement.
1.1 Current study
The goal of the study was to create and validate a usable (i.e., brief) scale of teacher engagement. We
followed five steps involving three samples of teachers (total N = 810) in developing and validating the ETS.
In Step 1 we developed item content, and received critical feedback from a focus group of experts. In Steps 2
through 5 we collected data from three independent samples and conducted a series of statistical analyses
designed to reduce the item pool, explore the factor structure, and examine the construct validity of the
emerging scale. The result of our five steps is a 16-item, 4-factor scale of teacher engagement that shows
evidence of reliability, validity, and usability for future research.
Klassen et al.
36 | F L R
2. Step 1
Step 1 consisted of creation of an item pool, and generation of feedback about the content of the item
pool. To begin, our team of researchers (i.e., the three authors who represent disparate backgrounds—
psychology, education, and educational psychology—and three countries) reviewed the existing literature
and created and adapted item content through a process of generation, discussion, and revision. A
comprehensive literature search revealed a number of theory-driven work engagement measures (e.g., Rich,
2006; Saks, 2006; Schaufeli, et al., 2006; Shuck, 2010; Thomas, 2006; Wang & Qin, 2011). Theoretical
guidance from research by Rich et al. (2010), Kahn (1990, 1992), and Schaufeli et al. (2006) provided the
foundation for the dimensions of engagement (physical, cognitive, and emotional; or vigour, absorption, and
dedication for the UWES). We also drew from teacher-student relatedness research (Davis, 2003; Klassen et
al., 2012; Pianta et al., 2012; Wang, 2009) for generation of social engagement items. Item development
included adaptation of items from existing measures (e.g., At my work, I feel bursting with energy was
adapted to When teaching, I feel bursting with energy), and creation of new items guided by theory (e.g., In
class, I care about the problems of my students was an item reflecting social engagement: students).
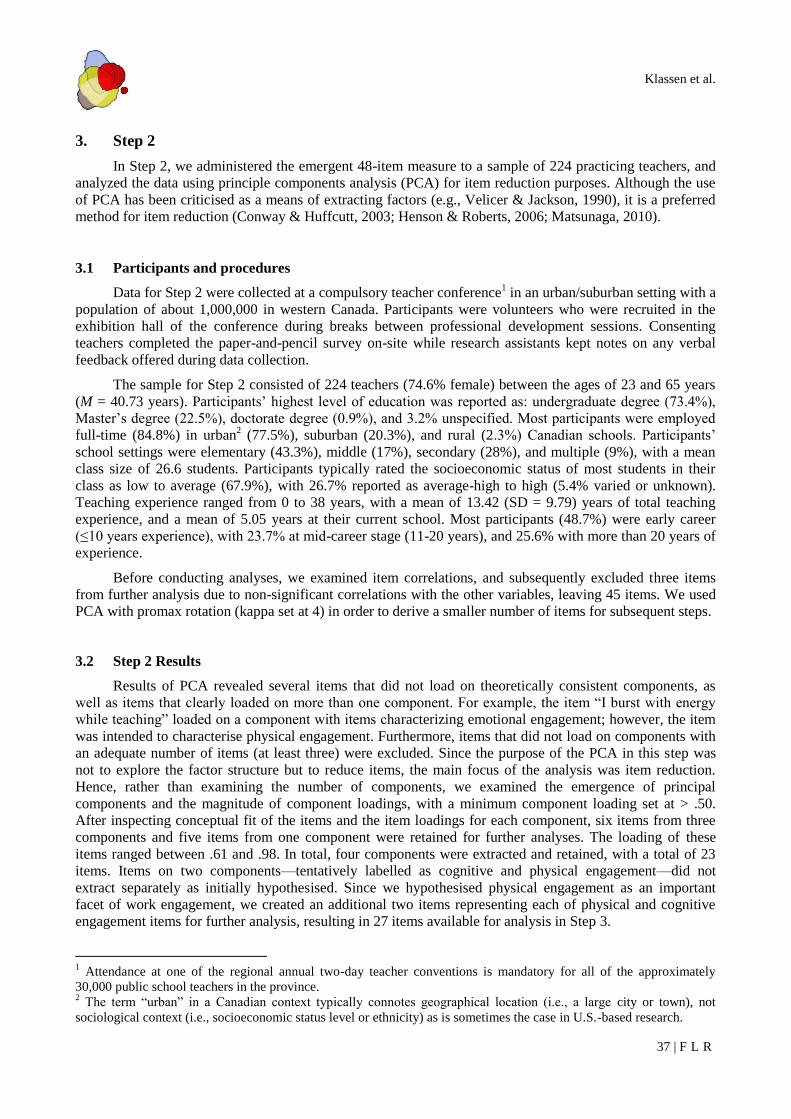
The proposed structure of the ETS is presented in Figure 1, with an over-arching engagement factor,
and five second level dimensions: physical, cognitive, emotional, social: students, and social: colleagues.
After reviewing the literature, an initial survey of 56 items was created and presented to 13 educational
psychology graduate students, nine of whom were practicing teachers, during a graduate-level seminar.
Following an introduction to the engagement literature (e.g., discussion of the UWES; Schaufeli et al.,
2006), the students were given instructions to provide feedback on the content, wording, and plausibility of
the initial item list. Small groups (2-4 students) were formed to provide feedback on one dimension after
which the students participated in a large group discussion of the item content. The items and item content
were revised based on the feedback and discussion, with the resulting survey consisting of 48 items
representing five factors. Figure 1 presents the hypothesised dimensions of the ETS, with initial number of
items for each dimension, and item examples for each of the five dimensions.
Figure 1. Hypothesised dimensions for the Engaged Teachers Scale (ETS). The number of initial items
identified with each dimension is listed in parentheses, with example items listed in the following row.
En
gag
ed
Teach
er
Scale
Physical (7)I devote a lot of energy to
teaching.
Cognitive (7)While teaching, I get absorbed in my work.
Emotional (12)I really put my heart into
teaching.
Social: students (11)I connect well with my
students.
Social: colleagues (11)I am accessible to my
colleagues.
Klassen et al.
37 | F L R
3. Step 2
In Step 2, we administered the emergent 48-item measure to a sample of 224 practicing teachers, and
analyzed the data using principle components analysis (PCA) for item reduction purposes. Although the use
of PCA has been criticised as a means of extracting factors (e.g., Velicer & Jackson, 1990), it is a preferred
method for item reduction (Conway & Huffcutt, 2003; Henson & Roberts, 2006; Matsunaga, 2010).
3.1 Participants and procedures
Data for Step 2 were collected at a compulsory teacher conference1 in an urban/suburban setting with a
population of about 1,000,000 in western Canada. Participants were volunteers who were recruited in the
exhibition hall of the conference during breaks between professional development sessions. Consenting
teachers completed the paper-and-pencil survey on-site while research assistants kept notes on any verbal
feedback offered during data collection.
The sample for Step 2 consisted of 224 teachers (74.6% female) between the ages of 23 and 65 years
(M = 40.73 years). Participants‘ highest level of education was reported as: undergraduate degree (73.4%),
Master‘s degree (22.5%), doctorate degree (0.9%), and 3.2% unspecified. Most participants were employed
full-time (84.8%) in urban2 (77.5%), suburban (20.3%), and rural (2.3%) Canadian schools. Participants‘
school settings were elementary (43.3%), middle (17%), secondary (28%), and multiple (9%), with a mean
class size of 26.6 students. Participants typically rated the socioeconomic status of most students in their
class as low to average (67.9%), with 26.7% reported as average-high to high (5.4% varied or unknown).
Teaching experience ranged from 0 to 38 years, with a mean of 13.42 (SD = 9.79) years of total teaching
experience, and a mean of 5.05 years at their current school. Most participants (48.7%) were early career
(≤10 years experience), with 23.7% at mid-career stage (11-20 years), and 25.6% with more than 20 years of
experience.
Before conducting analyses, we examined item correlations, and subsequently excluded three items
from further analysis due to non-significant correlations with the other variables, leaving 45 items. We used
PCA with promax rotation (kappa set at 4) in order to derive a smaller number of items for subsequent steps.
3.2 Step 2 Results
Results of PCA revealed several items that did not load on theoretically consistent components, as
well as items that clearly loaded on more than one component. For example, the item ―I burst with energy
while teaching‖ loaded on a component with items characterizing emotional engagement; however, the item
was intended to characterise physical engagement. Furthermore, items that did not load on components with
an adequate number of items (at least three) were excluded. Since the purpose of the PCA in this step was
not to explore the factor structure but to reduce items, the main focus of the analysis was item reduction.
Hence, rather than examining the number of components, we examined the emergence of principal
components and the magnitude of component loadings, with a minimum component loading set at > .50.
After inspecting conceptual fit of the items and the item loadings for each component, six items from three
components and five items from one component were retained for further analyses. The loading of these
items ranged between .61 and .98. In total, four components were extracted and retained, with a total of 23
items. Items on two components—tentatively labelled as cognitive and physical engagement—did not
extract separately as initially hypothesised. Since we hypothesised physical engagement as an important
facet of work engagement, we created an additional two items representing each of physical and cognitive
engagement items for further analysis, resulting in 27 items available for analysis in Step 3.
1 Attendance at one of the regional annual two-day teacher conventions is mandatory for all of the approximately
30,000 public school teachers in the province. 2 The term ―urban‖ in a Canadian context typically connotes geographical location (i.e., a large city or town), not
sociological context (i.e., socioeconomic status level or ethnicity) as is sometimes the case in U.S.-based research.
Klassen et al.
38 | F L R
4. Step 3
In Step 3 we administered the emergent 27-item version of the scale to a new sample of 265 teachers
and conducted exploratory factor analysis (EFA) to test the scale‘s factor structure.
4.1 Participants and procedures
Participants were recruited in a similar fashion to Step 2, in a multi-district compulsory teacher
conference at a different urban setting (population ~1,100,000) in the same western Canadian province. The
Step 3 sample consisted of 265 teachers (68.7% female) between the ages of 21 and 68 years (M = 40.37
years). Demographics—SES, teaching level, and teaching experience—were similar to those in Step 2, with
additional demographic information available from the authors.
4.2 Step 3 Results
The 27 items from Step 2 were analyzed using EFA with principle axis factoring and promax rotation
(kappa set at 4). Results of the EFA were first examined in terms of the appropriateness of the existing data
for factor analysis. The Kaiser-Meyer-Olkin measure of sampling adequacy was .92, suggesting that the data
were appropriate for factor analysis. Additionally, Bartlett‘s test of sphericity, 2(351) = 4402.20, p < .05,
indicated that the population correlation matrix was not an identity matrix and suitable for factor analysis
(Field, 2009).
We next followed three approaches to determine the number of factors to be retained. First, we
examined Kaiser‘s eigenvalues > 1.0 and scrutiny of the screen test. Retaining factors with eigenvalues > 1.0
resulted in five factors and yielded 66.27% of the variance in respondents‘ scores. Examination of the scree
plot suggested four or five factors. Although the eigenvalues > 1.0 rule and screen test are commonly used
methods for determining number of factors, both are criticised for lack of reliability (e.g., Ledesma &
Valero-Mora, 2007; Velicer & Jackson, 1990). Second, parallel analysis—based on statistical rather than
mechanical rules—was used as an alternative and more accurate test to determine number of factors
(Ledesma & Valero-Mora, 2007; O‘Connor, 2000; Zwick & Velicer, 1986). Results from the parallel
analysis suggested retention of four factors. Third, EFA was performed to compare 4- and 5-factor solutions.
Only the 4-factor solution yielded interpretable factors. With the 5-factor solution, one item, ―In class, I am
accessible to my students‖ created a factor by itself. In the 4-factor solution, this item loaded inappropriately
(i.e., theoretically unjustifiable) on the factor that was extracted by cognitive engagement items. Therefore,
this item was excluded from the scale and the 4-factor solution was retained. As in Step 2, cognitive and
physical engagement items did not produce separate factors; since cognitive items dominated the content, we
labelled the factor cognitive engagement.
Examining the factor pattern coefficients with the cut-off point set at .70 resulted in eight more items
eliminated from the scale. However, two borderline-case items with coefficients between .50 and .70 were
retained since the item content made the factors more representative in terms of the construct being
measured. Two items with redundant content were considered: ―At school, I value the relationships I build
with my colleagues,‖ and ―At school, I value spending time with my colleagues.‖ We excluded the latter
item due to lower factor loading (.82 versus .92 for the former item).
As a result of these procedures, the scale was reduced to 16 items with four items in each of four
factors. Table 1 lists the pattern and structure coefficients of items for the related factors. The final version of
the ETS with item content of each engagement dimension is presented in the Appendix. The EFA resulted in
four factors accounting for 71.31% of the variance in the respondents‘ scores. The first factor was named
emotional engagement (EE), accounting for 40.25% of the variance in the correlation matrix. The other three
factors were social engagement: colleagues (SEC), cognitive engagement (CE), and social engagement:
students (SES) accounting for 13.84%, 9.56%, and 7.66% of the variance, respectively. Correlations between
factors ranged from .33 to .62. Cronbach‘s alpha coefficients for the EE, SEC, CE and SES factors were .89,
.85, .85, and .84, respectively.
Klassen et al.
39 | F L R
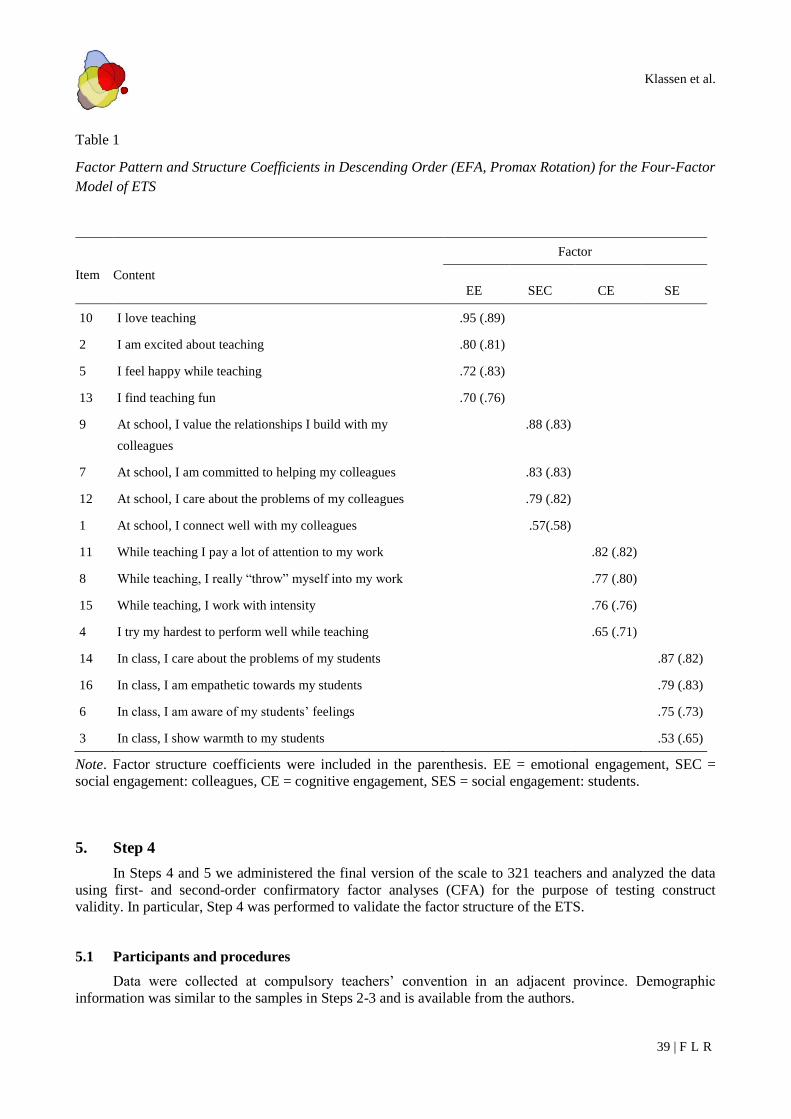
Table 1
Factor Pattern and Structure Coefficients in Descending Order (EFA, Promax Rotation) for the Four-Factor
Model of ETS
Item Content
Factor
EE SEC CE SE
10 I love teaching .95 (.89)
2 I am excited about teaching .80 (.81)
5 I feel happy while teaching .72 (.83)
13 I find teaching fun .70 (.76)
9 At school, I value the relationships I build with my
colleagues
.88 (.83)
7 At school, I am committed to helping my colleagues .83 (.83)
12 At school, I care about the problems of my colleagues .79 (.82)
1 At school, I connect well with my colleagues .57(.58)
11 While teaching I pay a lot of attention to my work .82 (.82)
8 While teaching, I really ―throw‖ myself into my work .77 (.80)
15 While teaching, I work with intensity .76 (.76)
4 I try my hardest to perform well while teaching .65 (.71)
14 In class, I care about the problems of my students .87 (.82)
16 In class, I am empathetic towards my students .79 (.83)
6 In class, I am aware of my students‘ feelings .75 (.73)
3 In class, I show warmth to my students .53 (.65)
Note. Factor structure coefficients were included in the parenthesis. EE = emotional engagement, SEC =
social engagement: colleagues, CE = cognitive engagement, SES = social engagement: students.
5. Step 4
In Steps 4 and 5 we administered the final version of the scale to 321 teachers and analyzed the data
using first- and second-order confirmatory factor analyses (CFA) for the purpose of testing construct
validity. In particular, Step 4 was performed to validate the factor structure of the ETS.
5.1 Participants and procedures
Data were collected at compulsory teachers‘ convention in an adjacent province. Demographic
information was similar to the samples in Steps 2-3 and is available from the authors.
Klassen et al.
40 | F L R
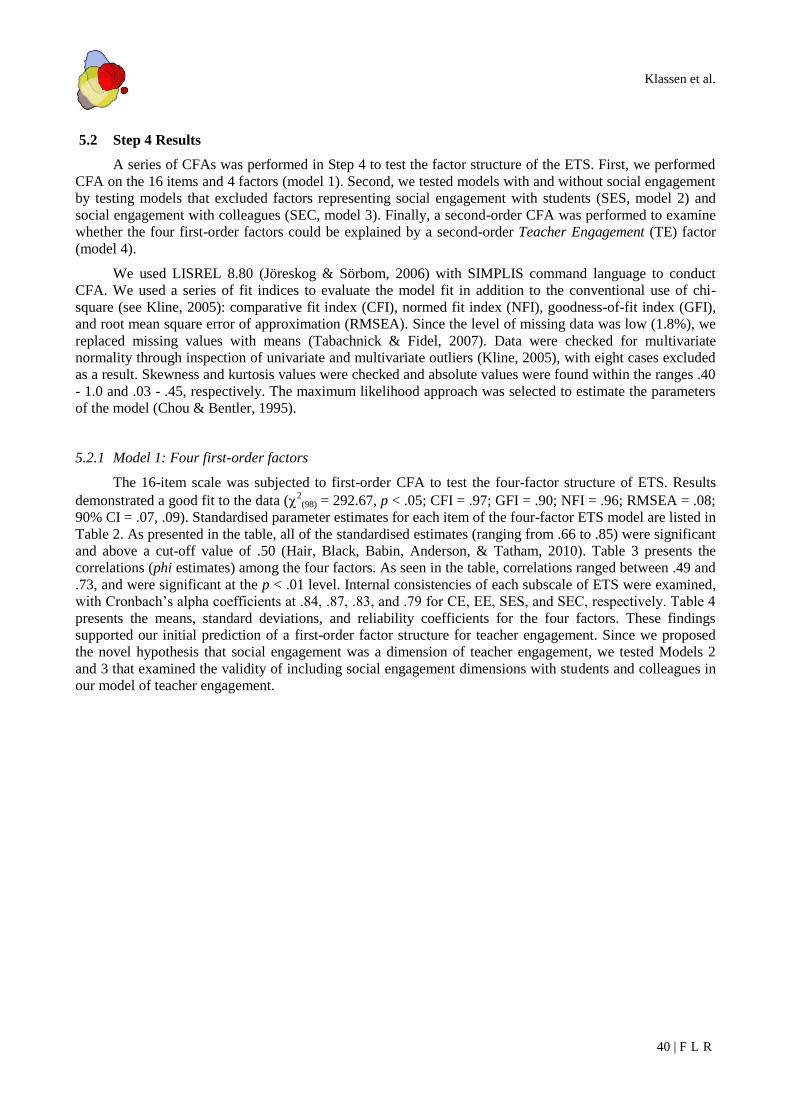
5.2 Step 4 Results
A series of CFAs was performed in Step 4 to test the factor structure of the ETS. First, we performed
CFA on the 16 items and 4 factors (model 1). Second, we tested models with and without social engagement
by testing models that excluded factors representing social engagement with students (SES, model 2) and
social engagement with colleagues (SEC, model 3). Finally, a second-order CFA was performed to examine
whether the four first-order factors could be explained by a second-order Teacher Engagement (TE) factor
(model 4).
We used LISREL 8.80 (Jöreskog & Sörbom, 2006) with SIMPLIS command language to conduct
CFA. We used a series of fit indices to evaluate the model fit in addition to the conventional use of chi-
square (see Kline, 2005): comparative fit index (CFI), normed fit index (NFI), goodness-of-fit index (GFI),
and root mean square error of approximation (RMSEA). Since the level of missing data was low (1.8%), we
replaced missing values with means (Tabachnick & Fidel, 2007). Data were checked for multivariate
normality through inspection of univariate and multivariate outliers (Kline, 2005), with eight cases excluded
as a result. Skewness and kurtosis values were checked and absolute values were found within the ranges .40
- 1.0 and .03 - .45, respectively. The maximum likelihood approach was selected to estimate the parameters
of the model (Chou & Bentler, 1995).
5.2.1 Model 1: Four first-order factors
The 16-item scale was subjected to first-order CFA to test the four-factor structure of ETS. Results
demonstrated a good fit to the data (2(98) = 292.67, p < .05; CFI = .97; GFI = .90; NFI = .96; RMSEA = .08;
90% CI = .07, .09). Standardised parameter estimates for each item of the four-factor ETS model are listed in
Table 2. As presented in the table, all of the standardised estimates (ranging from .66 to .85) were significant
and above a cut-off value of .50 (Hair, Black, Babin, Anderson, & Tatham, 2010). Table 3 presents the
correlations (phi estimates) among the four factors. As seen in the table, correlations ranged between .49 and
.73, and were significant at the p < .01 level. Internal consistencies of each subscale of ETS were examined,
with Cronbach‘s alpha coefficients at .84, .87, .83, and .79 for CE, EE, SES, and SEC, respectively. Table 4
presents the means, standard deviations, and reliability coefficients for the four factors. These findings
supported our initial prediction of a first-order factor structure for teacher engagement. Since we proposed
the novel hypothesis that social engagement was a dimension of teacher engagement, we tested Models 2
and 3 that examined the validity of including social engagement dimensions with students and colleagues in
our model of teacher engagement.
Klassen et al.
41 | F L R
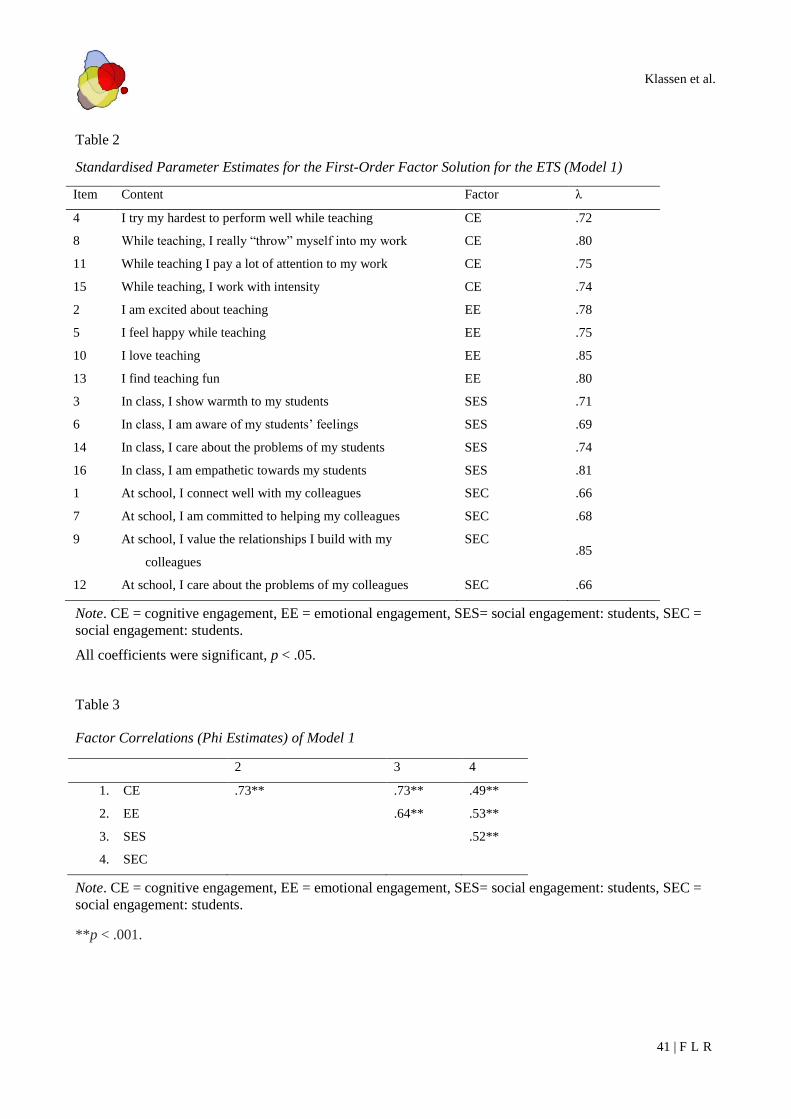
Table 2
Standardised Parameter Estimates for the First-Order Factor Solution for the ETS (Model 1)
Item Content Factor λ
4 I try my hardest to perform well while teaching CE .72
8 While teaching, I really ―throw‖ myself into my work CE .80
11 While teaching I pay a lot of attention to my work CE .75
15 While teaching, I work with intensity CE .74
2 I am excited about teaching EE .78
5 I feel happy while teaching EE .75
10 I love teaching EE .85
13 I find teaching fun EE .80
3 In class, I show warmth to my students SES .71
6 In class, I am aware of my students‘ feelings SES .69
14 In class, I care about the problems of my students SES .74
16 In class, I am empathetic towards my students SES .81
1 At school, I connect well with my colleagues SEC .66
7 At school, I am committed to helping my colleagues SEC .68
9 At school, I value the relationships I build with my
colleagues
SEC .85
12 At school, I care about the problems of my colleagues SEC .66
Note. CE = cognitive engagement, EE = emotional engagement, SES= social engagement: students, SEC =
social engagement: students.
All coefficients were significant, p < .05.
Table 3
Factor Correlations (Phi Estimates) of Model 1
2 3 4
1. CE .73** .73** .49**
2. EE .64** .53**
3. SES .52**
4. SEC
Note. CE = cognitive engagement, EE = emotional engagement, SES= social engagement: students, SEC =
social engagement: students.
**p < .001.
Klassen et al.
42 | F L R
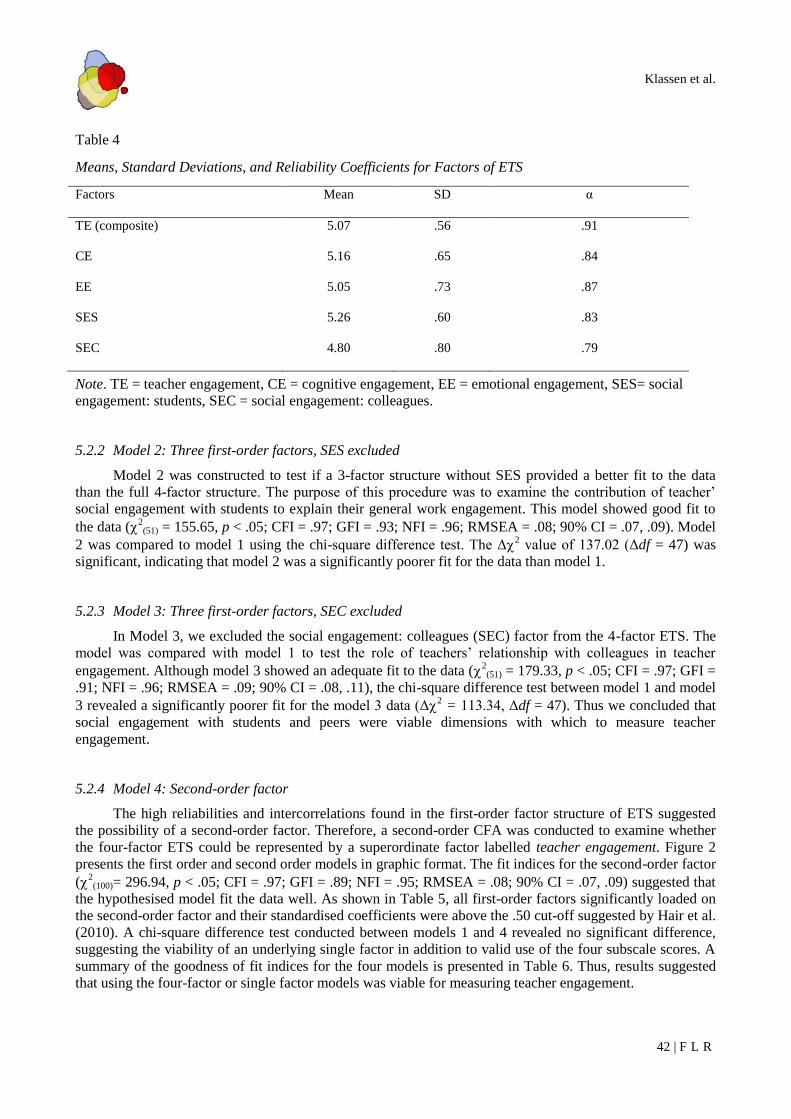
Table 4
Means, Standard Deviations, and Reliability Coefficients for Factors of ETS
Factors Mean SD α
TE (composite) 5.07 .56 .91
CE 5.16 .65 .84
EE 5.05 .73 .87
SES 5.26 .60 .83
SEC 4.80 .80 .79
Note. TE = teacher engagement, CE = cognitive engagement, EE = emotional engagement, SES= social
engagement: students, SEC = social engagement: colleagues.
5.2.2 Model 2: Three first-order factors, SES excluded
Model 2 was constructed to test if a 3-factor structure without SES provided a better fit to the data
than the full 4-factor structure. The purpose of this procedure was to examine the contribution of teacher‘
social engagement with students to explain their general work engagement. This model showed good fit to
the data (2(51) = 155.65, p < .05; CFI = .97; GFI = .93; NFI = .96; RMSEA = .08; 90% CI = .07, .09). Model
2 was compared to model 1 using the chi-square difference test. The Δ2 value of 137.02 (Δdf = 47) was
significant, indicating that model 2 was a significantly poorer fit for the data than model 1.
5.2.3 Model 3: Three first-order factors, SEC excluded
In Model 3, we excluded the social engagement: colleagues (SEC) factor from the 4-factor ETS. The
model was compared with model 1 to test the role of teachers‘ relationship with colleagues in teacher
engagement. Although model 3 showed an adequate fit to the data (2(51) = 179.33, p < .05; CFI = .97; GFI =
.91; NFI = .96; RMSEA = .09; 90% CI = .08, .11), the chi-square difference test between model 1 and model
3 revealed a significantly poorer fit for the model 3 data (Δ2 = 113.34, Δdf = 47). Thus we concluded that
social engagement with students and peers were viable dimensions with which to measure teacher
engagement.
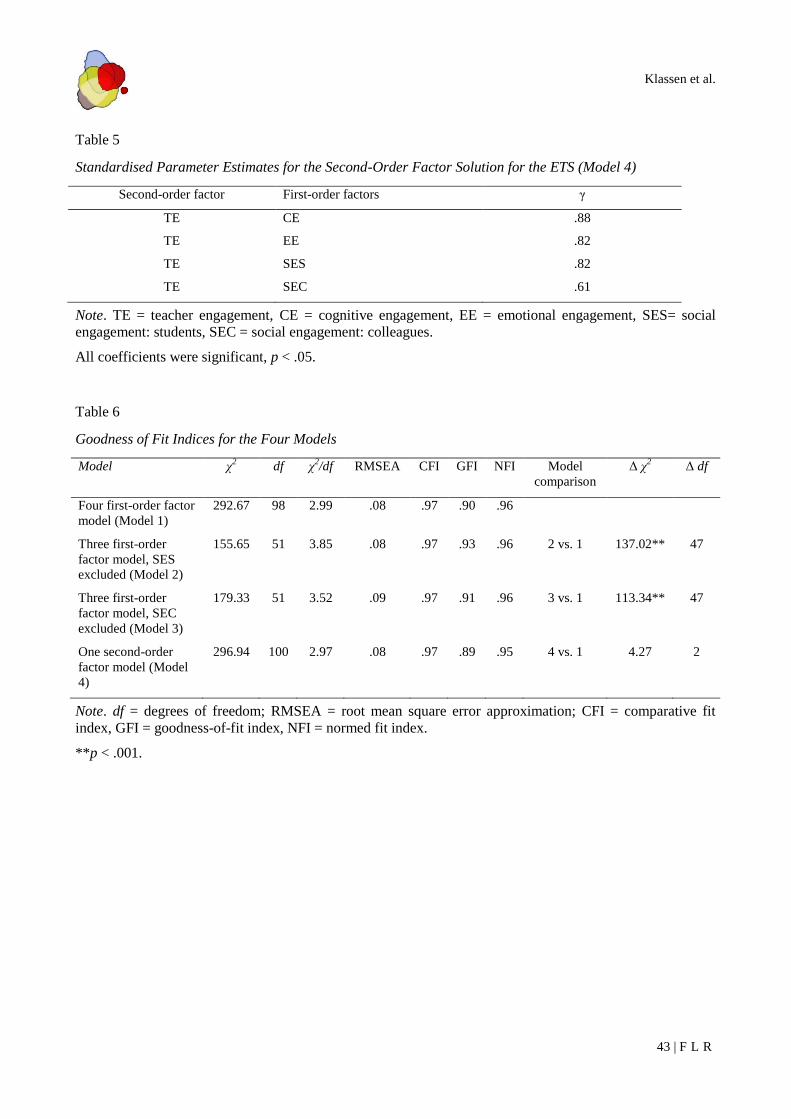
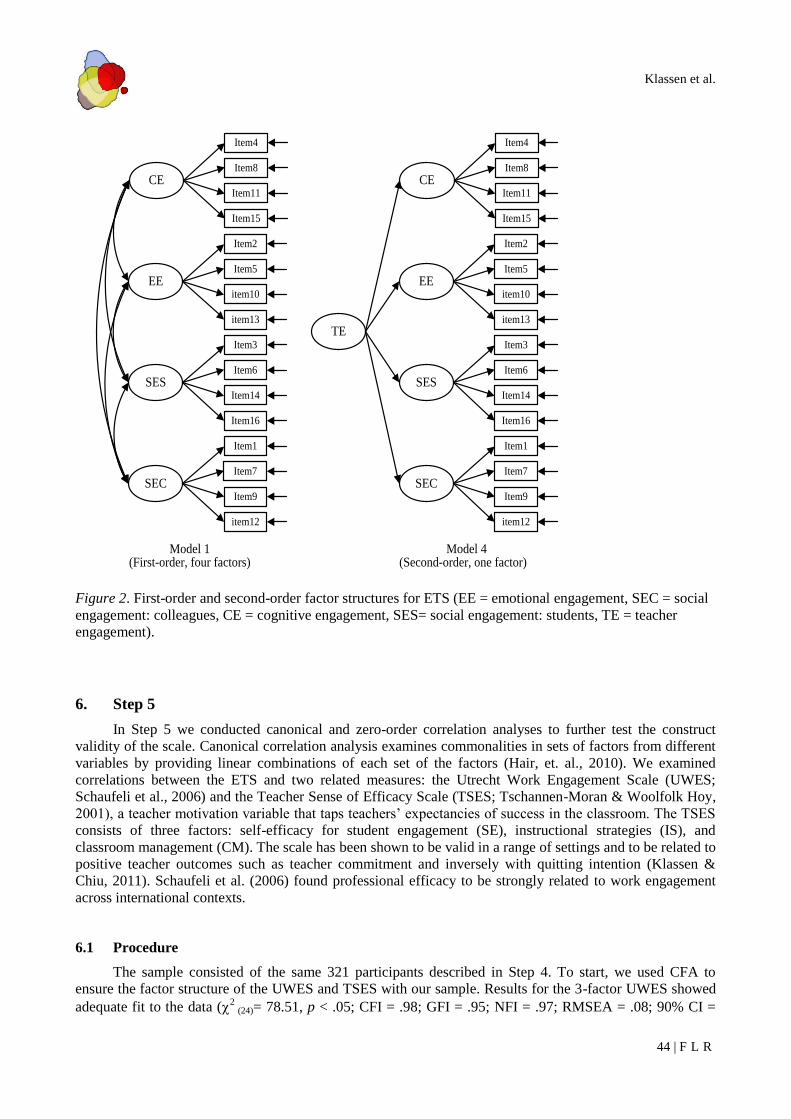
5.2.4 Model 4: Second-order factor
The high reliabilities and intercorrelations found in the first-order factor structure of ETS suggested
the possibility of a second-order factor. Therefore, a second-order CFA was conducted to examine whether
the four-factor ETS could be represented by a superordinate factor labelled teacher engagement. Figure 2
presents the first order and second order models in graphic format. The fit indices for the second-order factor
(2(100)= 296.94, p < .05; CFI = .97; GFI = .89; NFI = .95; RMSEA = .08; 90% CI = .07, .09) suggested that
the hypothesised model fit the data well. As shown in Table 5, all first-order factors significantly loaded on
the second-order factor and their standardised coefficients were above the .50 cut-off suggested by Hair et al.
(2010). A chi-square difference test conducted between models 1 and 4 revealed no significant difference,
suggesting the viability of an underlying single factor in addition to valid use of the four subscale scores. A
summary of the goodness of fit indices for the four models is presented in Table 6. Thus, results suggested
that using the four-factor or single factor models was viable for measuring teacher engagement.
Klassen et al.
43 | F L R
Table 5
Standardised Parameter Estimates for the Second-Order Factor Solution for the ETS (Model 4)
Second-order factor First-order factors γ
TE CE .88
TE EE .82
TE SES .82
TE SEC .61
Note. TE = teacher engagement, CE = cognitive engagement, EE = emotional engagement, SES= social
engagement: students, SEC = social engagement: colleagues.
All coefficients were significant, p < .05.
Table 6
Goodness of Fit Indices for the Four Models
Model χ2
df χ2/df RMSEA CFI GFI NFI Model
comparison
Δ χ2 Δ df
Four first-order factor
model (Model 1)
292.67 98 2.99 .08 .97 .90 .96
Three first-order
factor model, SES
excluded (Model 2)
155.65 51 3.85 .08 .97 .93 .96 2 vs. 1 137.02** 47
Three first-order
factor model, SEC
excluded (Model 3)
179.33 51 3.52 .09 .97 .91 .96 3 vs. 1 113.34** 47
One second-order
factor model (Model
4)
296.94 100 2.97 .08 .97 .89 .95 4 vs. 1 4.27 2
Note. df = degrees of freedom; RMSEA = root mean square error approximation; CFI = comparative fit
index, GFI = goodness-of-fit index, NFI = normed fit index.
**p < .001.
Klassen et al.
44 | F L R
Figure 2. First-order and second-order factor structures for ETS (EE = emotional engagement, SEC = social
engagement: colleagues, CE = cognitive engagement, SES= social engagement: students, TE = teacher
engagement).
6. Step 5
In Step 5 we conducted canonical and zero-order correlation analyses to further test the construct
validity of the scale. Canonical correlation analysis examines commonalities in sets of factors from different
variables by providing linear combinations of each set of the factors (Hair, et. al., 2010). We examined
correlations between the ETS and two related measures: the Utrecht Work Engagement Scale (UWES;
Schaufeli et al., 2006) and the Teacher Sense of Efficacy Scale (TSES; Tschannen-Moran & Woolfolk Hoy,
2001), a teacher motivation variable that taps teachers‘ expectancies of success in the classroom. The TSES
consists of three factors: self-efficacy for student engagement (SE), instructional strategies (IS), and
classroom management (CM). The scale has been shown to be valid in a range of settings and to be related to
positive teacher outcomes such as teacher commitment and inversely with quitting intention (Klassen &
Chiu, 2011). Schaufeli et al. (2006) found professional efficacy to be strongly related to work engagement
across international contexts.
6.1 Procedure
The sample consisted of the same 321 participants described in Step 4. To start, we used CFA to
ensure the factor structure of the UWES and TSES with our sample. Results for the 3-factor UWES showed
adequate fit to the data (2
(24)= 78.51, p < .05; CFI = .98; GFI = .95; NFI = .97; RMSEA = .08; 90% CI =
CE
Item4
Item8
Item11
Item15
EE
Item2
Item5
item10
item13
SES
Item3
Item6
Item14
Item16
SEC
Item1
Item7
Item9
item12
CE
Item4
Item8
Item11
Item15
EE
Item2
Item5
item10
item13
SES
Item3
Item6
Item14
Item16
SEC
Item1
Item7
Item9
item12
TE
Model 1(First-order, four factors)
Model 4(Second-order, one factor)
Klassen et al.
45 | F L R
.06, .10). All factor loadings were significant and internal consistencies of each subscale raged from .74 to
.78. Results for the 3-factor TSES also indicated good model fit (2 (41)= 112.90, p < .05; CFI = .98; GFI =
.94; NFI = .97; RMSEA = .07; 90% CI = .06, .09). All factor loadings were significant, with reliability
coefficients above .80.
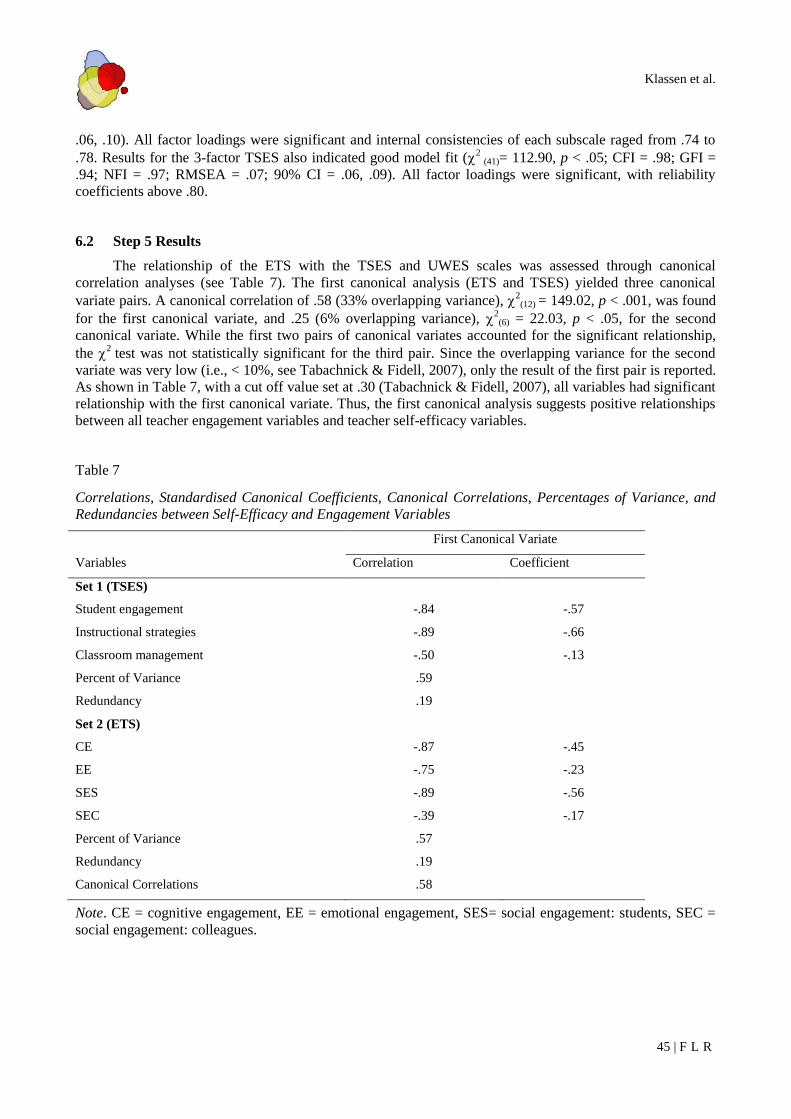
6.2 Step 5 Results
The relationship of the ETS with the TSES and UWES scales was assessed through canonical
correlation analyses (see Table 7). The first canonical analysis (ETS and TSES) yielded three canonical
variate pairs. A canonical correlation of .58 (33% overlapping variance), 2(12) = 149.02, p < .001, was found
for the first canonical variate, and .25 (6% overlapping variance), 2
(6) = 22.03, p < .05, for the second
canonical variate. While the first two pairs of canonical variates accounted for the significant relationship,
the 2
test was not statistically significant for the third pair. Since the overlapping variance for the second
variate was very low (i.e., < 10%, see Tabachnick & Fidell, 2007), only the result of the first pair is reported.
As shown in Table 7, with a cut off value set at .30 (Tabachnick & Fidell, 2007), all variables had significant
relationship with the first canonical variate. Thus, the first canonical analysis suggests positive relationships
between all teacher engagement variables and teacher self-efficacy variables.
Table 7
Correlations, Standardised Canonical Coefficients, Canonical Correlations, Percentages of Variance, and
Redundancies between Self-Efficacy and Engagement Variables
First Canonical Variate
Variables Correlation Coefficient
Set 1 (TSES)
Student engagement -.84 -.57
Instructional strategies -.89 -.66
Classroom management -.50 -.13
Percent of Variance .59
Redundancy .19
Set 2 (ETS)
CE -.87 -.45
EE -.75 -.23
SES -.89 -.56
SEC -.39 -.17
Percent of Variance .57
Redundancy .19
Canonical Correlations .58
Note. CE = cognitive engagement, EE = emotional engagement, SES= social engagement: students, SEC =
social engagement: colleagues.
Klassen et al.
46 | F L R
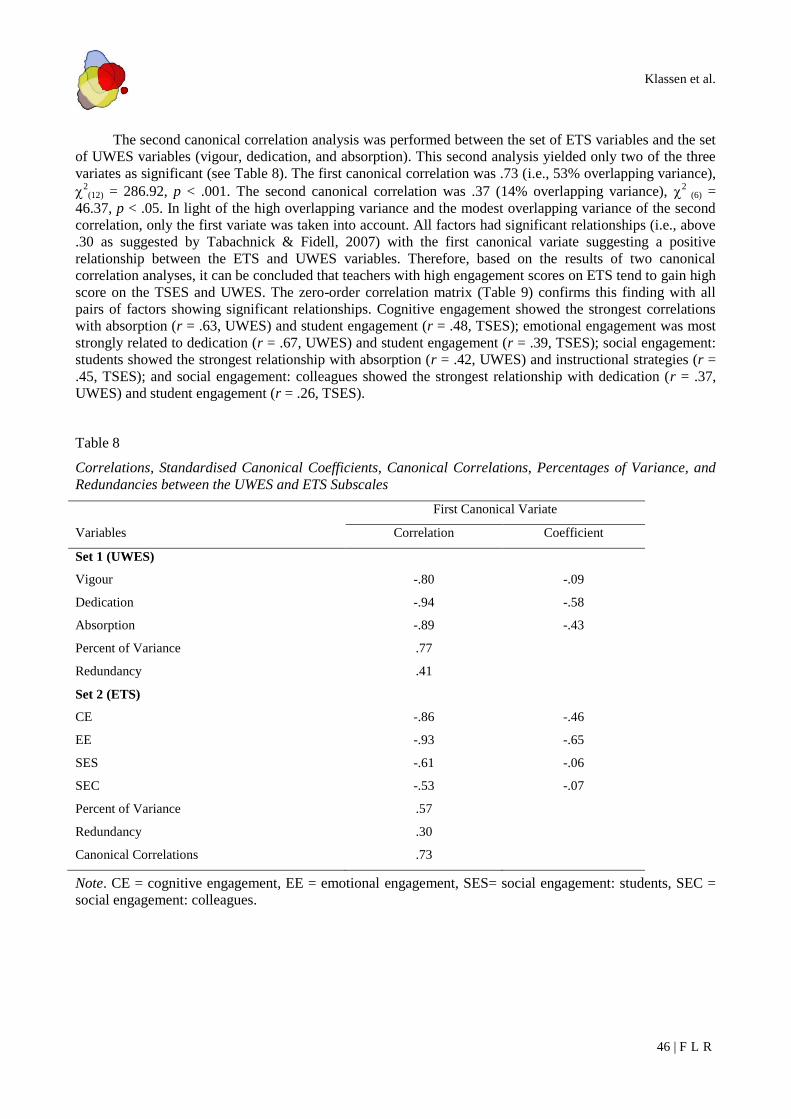
The second canonical correlation analysis was performed between the set of ETS variables and the set
of UWES variables (vigour, dedication, and absorption). This second analysis yielded only two of the three
variates as significant (see Table 8). The first canonical correlation was .73 (i.e., 53% overlapping variance),
2
(12) = 286.92, p < .001. The second canonical correlation was .37 (14% overlapping variance), 2
(6) =
46.37, p < .05. In light of the high overlapping variance and the modest overlapping variance of the second
correlation, only the first variate was taken into account. All factors had significant relationships (i.e., above
.30 as suggested by Tabachnick & Fidell, 2007) with the first canonical variate suggesting a positive
relationship between the ETS and UWES variables. Therefore, based on the results of two canonical
correlation analyses, it can be concluded that teachers with high engagement scores on ETS tend to gain high
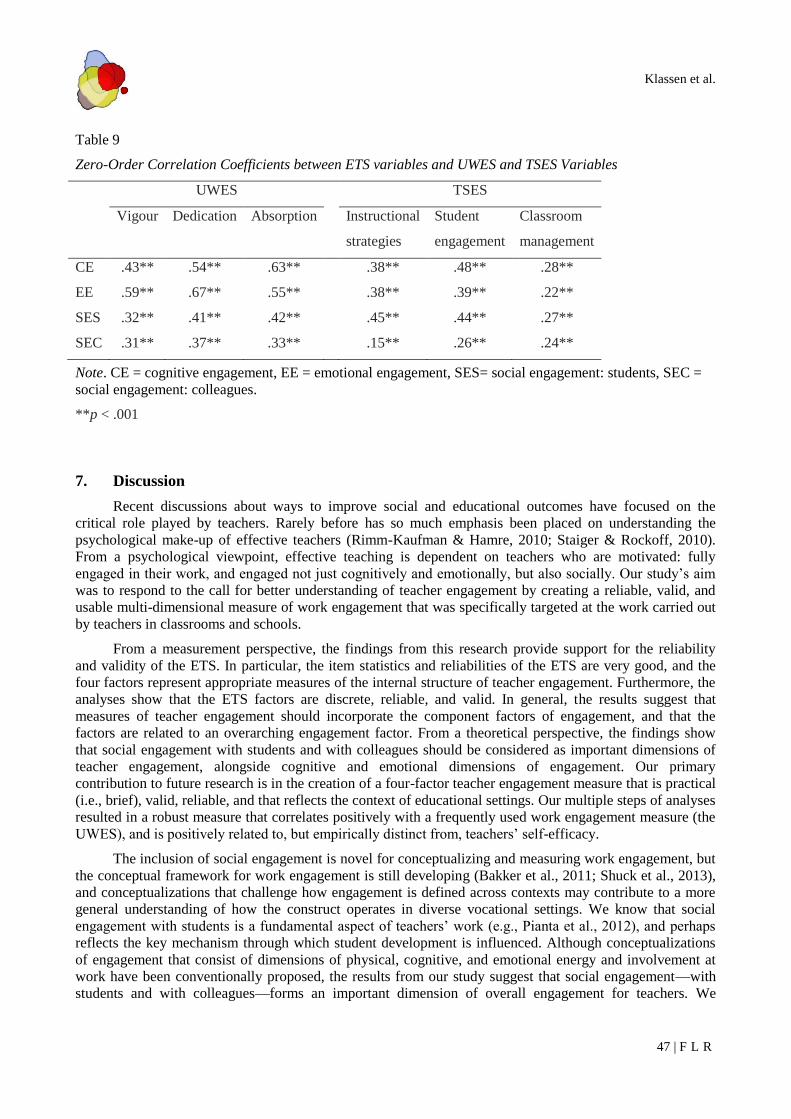
score on the TSES and UWES. The zero-order correlation matrix (Table 9) confirms this finding with all
pairs of factors showing significant relationships. Cognitive engagement showed the strongest correlations
with absorption (r = .63, UWES) and student engagement (r = .48, TSES); emotional engagement was most
strongly related to dedication (r = .67, UWES) and student engagement (r = .39, TSES); social engagement:
students showed the strongest relationship with absorption (r = .42, UWES) and instructional strategies (r =
.45, TSES); and social engagement: colleagues showed the strongest relationship with dedication (r = .37,
UWES) and student engagement (r = .26, TSES).
Table 8
Correlations, Standardised Canonical Coefficients, Canonical Correlations, Percentages of Variance, and
Redundancies between the UWES and ETS Subscales
First Canonical Variate
Variables Correlation Coefficient
Set 1 (UWES)
Vigour -.80 -.09
Dedication -.94 -.58
Absorption -.89 -.43
Percent of Variance .77
Redundancy .41
Set 2 (ETS)
CE -.86 -.46
EE -.93 -.65
SES -.61 -.06
SEC -.53 -.07
Percent of Variance .57
Redundancy .30
Canonical Correlations .73
Note. CE = cognitive engagement, EE = emotional engagement, SES= social engagement: students, SEC =
social engagement: colleagues.
Klassen et al.
47 | F L R
Table 9
Zero-Order Correlation Coefficients between ETS variables and UWES and TSES Variables
UWES TSES
Vigour Dedication Absorption Instructional
strategies
Student
engagement
Classroom
management
CE .43** .54** .63** .38** .48** .28**
EE .59** .67** .55** .38** .39** .22**
SES .32** .41** .42** .45** .44** .27**
SEC .31** .37** .33** .15** .26** .24**
Note. CE = cognitive engagement, EE = emotional engagement, SES= social engagement: students, SEC =
social engagement: colleagues.
**p < .001
7. Discussion
Recent discussions about ways to improve social and educational outcomes have focused on the
critical role played by teachers. Rarely before has so much emphasis been placed on understanding the
psychological make-up of effective teachers (Rimm-Kaufman & Hamre, 2010; Staiger & Rockoff, 2010).
From a psychological viewpoint, effective teaching is dependent on teachers who are motivated: fully
engaged in their work, and engaged not just cognitively and emotionally, but also socially. Our study‘s aim
was to respond to the call for better understanding of teacher engagement by creating a reliable, valid, and
usable multi-dimensional measure of work engagement that was specifically targeted at the work carried out
by teachers in classrooms and schools.
From a measurement perspective, the findings from this research provide support for the reliability
and validity of the ETS. In particular, the item statistics and reliabilities of the ETS are very good, and the
four factors represent appropriate measures of the internal structure of teacher engagement. Furthermore, the
analyses show that the ETS factors are discrete, reliable, and valid. In general, the results suggest that
measures of teacher engagement should incorporate the component factors of engagement, and that the
factors are related to an overarching engagement factor. From a theoretical perspective, the findings show
that social engagement with students and with colleagues should be considered as important dimensions of
teacher engagement, alongside cognitive and emotional dimensions of engagement. Our primary
contribution to future research is in the creation of a four-factor teacher engagement measure that is practical
(i.e., brief), valid, reliable, and that reflects the context of educational settings. Our multiple steps of analyses
resulted in a robust measure that correlates positively with a frequently used work engagement measure (the
UWES), and is positively related to, but empirically distinct from, teachers‘ self-efficacy.
The inclusion of social engagement is novel for conceptualizing and measuring work engagement, but
the conceptual framework for work engagement is still developing (Bakker et al., 2011; Shuck et al., 2013),
and conceptualizations that challenge how engagement is defined across contexts may contribute to a more
general understanding of how the construct operates in diverse vocational settings. We know that social
engagement with students is a fundamental aspect of teachers‘ work (e.g., Pianta et al., 2012), and perhaps
reflects the key mechanism through which student development is influenced. Although conceptualizations
of engagement that consist of dimensions of physical, cognitive, and emotional energy and involvement at
work have been conventionally proposed, the results from our study suggest that social engagement—with
students and with colleagues—forms an important dimension of overall engagement for teachers. We
Klassen et al.
48 | F L R
suggest that a dimension representing social engagement is worth considering for future iterations of work
engagement measures applied to a wide range of vocational settings.
We failed to find separate domains of physical and cognitive engagement in our samples of teachers,
and the question remains whether physical engagement is separable from cognitive, emotional, and social
dimensions of teacher engagement. Hakanen et al. (2006) proposed vigour (physical engagement) and
dedication (emotional engagement) as the core dimensions of engagement in their study of the UWES with a
group of teachers, but they did not test the hypotheses by including a cognitive dimension in their analyses.
We did not find clear support for the separation of physical and cognitive engagement dimensions, and
propose that for teachers, the line between the two is blurred. For example, we labelled ―I try my hardest to
perform well while teaching‖ and ―While teaching, I really ‗throw‘ myself into my work‖ as examples of
cognitive engagement, but the demands of individual teachers‘ classroom work may determine the relevance
of particular dimensions for teachers. A teacher of young children may need to physically interact with
students (crouching down, tying shoes, performing actions during music sessions) more often than a high
school history teacher, thus increasing the salience of the physical engagement dimension for some teachers.
Hakanen et al. describe the physical job demands and resources that can be associated with engagement, but
the level of physical demands for teachers varies as a function of the setting. Further work should focus on
teasing apart teachers‘ physical and cognitive engagement by exploring the two dimensions in a wider range
of contexts.
More work is needed to understand how engagement is fostered in teachers, and especially how the
specific dimensions—emotional, cognitive, social, and perhaps physical engagement—develop through
teacher training and into professional practice. Research from related constructs such as teacher resilience
(Gu & Day, 2007), self-efficacy (Klassen & Chiu, 2010, 2011), and commitment (Collie, Shapka, & Perry,
2011) have shown that teacher motivation constructs change in predictable ways over the course of a career.
The ETS provides a way of measuring individual facets of engagement and how the facets change over time:
for example, a teacher may exhibit high levels of social engagement at the beginning of a career but lower
levels of cognitive engagement.
We know that teacher engagement changes over even brief periods of time: recent research has shown
that global teacher engagement shows weekly within-person variability in starting teachers (Bakker & Bal,
2010; Durksen & Klassen, 2012), with commitment to the profession mirroring the pattern of change in
engagement. The job-demands resources model (JDR; e.g., Bakker, Hakanen, Demerouti, & Xanthopoulou,
2007; Hakanen et al., 2006) provides a general way of conceptualizing the drivers of engagement, but details
about how job resources in classrooms and schools—supportive climate, transformational leadership, access
to information, job control—can be targeted at fostering specific engagement dimensions have not yet been
studied. Multilevel analyses of teacher engagement may provide insight into how engagement might be
shared in a school, and how teachers working together transmit their engagement amongst themselves, and to
their students. Psychosocial research in a range of vocational contexts has shown that workers regularly
share beliefs, emotions, and motivational patterns, and that social interaction influences individual
psychology (e.g., Bandura, 1997).
7.1 Limitations
Although we found strong psychometric properties of the ETS, and collected data from three
independent samples of teachers, there are some clear limitations. The participants were all working in two
western provinces in Canada, and were largely female, and thus the samples offer only limited
representativeness to other populations. The data collected were cross-sectional, and although engagement is
said to possess state and trait characteristics (e.g., Schaufeli & Salanova, 2011), engagement fluctuates over
time (e.g., Bakker & Bal, 2010). External validity of the measure is limited by the correlational nature of the
study design, and no objective measure of teaching effectiveness or of student achievement was used as an
outcome measure, a clear direction for future research. Teacher engagement may lead to positive teacher-
student interactions, increased student engagement, and eventually to increased student achievement, but the
evidence base needs developing. It must also be considered that the relationships among teacher engagement,
Klassen et al.
49 | F L R
teacher-student interactions, student engagement, and student achievement are reciprocal: it is likely that
teacher engagement both influences, and is influenced by, positive experiences of teacher-student
interaction. Although the ETS focuses on in-classroom and in-school engagement, for some (but not all)
teachers, out-of-school activities involving parents and the community form an important component of their
social engagement. Other measures, such as the OLBI and UWES measure engagement more broadly, and
their use may be preferable for cross-professional comparisons and to capture teachers‘ non-classroom
related engagement.
7.2 Conclusions and Future Research
Understanding teacher engagement is critical to understanding the psychological processes underlying
effective teaching. Our aim was to create a measure of teacher engagement that reflects the particular
features of working in classrooms and in schools, and especially the social interactions shared by teachers
and students. An important step in understanding effective teaching is to conceptualise and measure teacher
engagement, and we hope that the ETS can be useful in this regard, but our knowledge of how teachers‘ self-
reports of engagement are reflected by behaviours in real classrooms is limited. Although data from
observation systems (e.g., the CLASS from Pianta et al., 2012) provide some insight into how engaged and
effective teachers behave, such methods still leave interpretation of teachers‘ behaviours to the presence of
external observers sitting in classes for relatively brief periods of time. Further study is needed to identify the
behavioural indicators of teacher engagement, and how these behaviours develop individually and
collectively, and change over time. Bakker and Bal‘s 2010 study on weekly fluctuations of teacher
engagement provides a useful starting point, but examining work engagement using finer-grained time spans
may provide a valuable way forward in understanding teachers and teaching. Creation of the ETS may be a
useful point of departure for better understanding teacher engagement, and by extension, student engagement
and learning.
Keypoints
We created and validated a 4-factor 16-item measure of teacher engagement: the Engaged
Teachers Scale (ETS).
The five steps of development resulted in a multidimensional measure that is practical (i.e.,
brief), valid, and reliable for use in education settings.
The four factors were cognitive engagement, emotional engagement, social engagement:
students, and social engagement: colleagues.
Acknowledgements
The authors would like to gratefully acknowledge research funding from the Social Sciences and
Humanities Research Council of Canada provided to the first author.
References
Bandura, A. (1997). Self-efficacy: The exercise of control. New York: W.H. Freeman.
Bakker, A. B., Albrecht, S. L., & Leiter, M. P. (2011). Key questions regarding work engagement. European
Journal of Work and Organizational Psychology, 20, 4-28. doi:10.1080/1359432X.2010.485352
Klassen et al.
50 | F L R
Bakker, A., & Bal, M. (2010). Weekly work engagement and performance: A study among starting teachers.
Journal Of Occupational And Organizational Psychology, 83, 189-206.
doi:10.1348/096317909X402596
Bakker, A. B., Hakanen, J. J., Demerouti, E., & Xanthopoulou, D. (2007). Job resources boost work
engagement, particularly when job demands are high. Journal of Educational Psychology, 99, 274–
284. doi: 10.1037/0022-0663.99.2.274
Christian, M. S., Garza, A. S., & Slaughter, J. E. (2011). Work engagement: A quantitative review and test of
its relations with task and contextual performance. Personnel Psychology, 64, 89-136.
doi:10.1111/j.1744-6570.2010.01203.x
Chou, C. P., & Bentler, P. M. (1995). Estimates and tests in structural equation modeling. In R. H. Hoyle
(Ed.), Structural Equation Modeling: Concepts, Issues, and Applications (pp. 37-55), Thousand Oaks,
CA: Sage.
Collie, R. J., Shapka, J. D., & Perry, N. E. (2011). Predicting teacher commitment: The impact of school
climate and social-emotional learning. Psychology in the Schools, 48, 1034-1048.
doi:10.1002/pits.20611
Conway, J. M., & Huffcutt, A. I. (2003). A review and evaluation of exploratory factor analysis practices in
organizational research. Organizational Research Methods, 6, 147-168.
doi:10.1177/1094428103251541Dalal, R. S., Brummel, B. J., Wee, S., & Thomas, L. L. (2008).
Defining employee engagement for productive research and practice. Industrial and Organizational
Psychology, 1, 52-55. doi:10.1111/j.1754-9434.2007.00008.x
Davis, H. A. (2003). Conceptualizing the role and influence of student– teacher relationships on children‘s
social and cognitive development. Educational Psychologist, 38, 207–234. doi:10.1207/
S15326985EP3804_2
Demerouti, E., Mostert, K., & Bakker, A. B. (2010). Burnout and work engagement: A thorough
investigation of the independency of both constructs. Journal of Occupational Health Psychology, 15,
207-234. doi:10.1037/a0019408
Durksen, T. L., & Klassen, R. M. (2012). Pre-service teachers‘ weekly commitment and engagement during
a final training placement: A longitudinal mixed methods study. Educational and Child Psychology,
29, 32-46.
Economist Intelligence Unit (2012). The learning curve: lessons in country performance in education.
Retrieved from: http://thelearningcurve.pearson.com/
Field, A. (2009) Discovering statistics using SPSS (3rd ed.). London: Sage.
Gu, Q., & Day, C. (2007). Teachers‘ resilience: A necessary condition for effectiveness. Teaching and
Teacher Education, 23, 1302-1316. doi:10.1016/j.tate.2006.06.006
Hair, J. F., Black, B., Babin, B., Anderson, R. E., & Tatham, R. L. (2010). Multivariate Data Analysis. (7th
ed.). Upper Saddle River, NJ: Prentice-Hall.
Hakanen, J. J., Bakker, A. B., & Schaufeli, W. B. (2006). Burnout and work engagement among teachers.
Journal of School Psychology, 43, 495-513. doi:10.1016/j.jsp.2005.11.001
Henson, R. K., & Roberts, J. K. (2006). Use of exploratory factor analysis in published research: Common
errors and some comment on improved practice. Educational and Psychological Measurement, 66,
393-416. doi: 10.1177/0013164405282485
Jennings, P. A., & Greenberg, M. T. (2009). The Prosocial Classroom: Teacher Social and Emotional
Competence in Relation to Student and Classroom Outcomes. Review Of Educational Research, 79,
491-525. doi:10.2307/40071173
Jöreskog, K. G. & Sörbom, D. (2006). LISREL 8.80 for Windows [Computer Software]. Lincolnwood, IL:
Scientific Software International, Inc.
Kahn, W. A. (1990). Psychological conditions of personal engagement and disengagement at work. Academy
Of Management Journal, 33, 692-724. doi: 10.2307/256287Kahn, W. A. (1992). To be fully there:
Psychological presence at work. Human Relations, 45, 321-349. doi: 10.1177/00187267920450040
Klassen, R. M., Al-Dhafri, S., Mansfield, C. F., Purwanto, E., Siu, A., Wong, M. W., & Woods-McConney,
A. (2012). Teachers‘ engagement at work: An international validation study. Journal of Experimental
Education, 80, 1-20. doi: 10.1080/00220973.2012.678409
Klassen et al.
51 | F L R
Klassen, R. M., Bong, M., Usher, E. L., Chong, W. H., Huan, V. S., Wong, I. Y., & Georgiou, T. (2009).
Exploring the validity of the Teachers‘ Self-Efficacy Scale in five countries. Contemporary
Educational Psychology, 34, 67-76. doi:10.1016/j.cedpsych.2008.08.001
Klassen, R. M., & Chiu, M. M. (2010). Effects on teachers‘ self-efficacy and job satisfaction: Teacher
gender, years of experience, and job stress. Journal of Educational Psychology. 102, 741-756.
doi:10.1037/a0019237
Klassen, R. M., & Chiu, M. M. (2011). The occupational commitment and intention to quit of practicing and
pre-service teachers: Influence of self-efficacy, job stress, and teaching context. Contemporary
Educational Psychology, 36, 114-129. doi:10.1016/j.cedpsych.2011.01.002
Klassen, R. M., Perry, N. E., & Frenzel, A. C. (2012). Teachers‘ relatedness with students: An
underemphasized component of teachers‘ basic psychological needs. Journal of Educational
Psychology, 104, 150-165. doi: 10.1037/a0026253
Kline, R. B. (2005). Principles and practice of structural equation modeling (2nd ed.). New York: Guilford.
Ledesma, R. D., & Valero-Mora, P. (2007). Determining the number of factors to retain in EFA: An easy-to-
use computer program for carrying out Parallel Analysis. Practical Assessment, Research &
Evaluation, 12(2), 2-11. Retrieved from http://pareonline.net/pdf/v12n2.pdf
Macey, W. H., & Schneider, B. (2008). The meaning of employee engagement. Industrial and
Organizational Psychology, 1, 3-30. doi: 10.1111/j.1754-9434.2007.0002.x
Matsunaga, M. (2010). How to factor-analyze your data right: Do‘s, don‘ts, and how-to‘s. International
Journal of Psychological Research, 3, 97-110. Retrieved from
http://www.redalyc.org/articulo.oa?id=299023509007
Meyer, J. P., Allen, N. J., & Smith, C. A. (1993). Commitment to organizations and occupations: Extension
and test of a three-component conceptualization. Journal of Applied Psychology, 78, 538–551.
doi: 10.1037/0021-9010.78.4.538
O‘Connor, B. P. (2000). SPSS and SAS programs for determining the number of components using parallel
analysis and Velicer‘s MAP test. Behavior Research Methods, Instruments, & Computers, 32, 396-
402. doi: 10.3758/BF03200807
Pianta, R. C., Hamre, B. K., & Allen, J. P. (2012). Teacher-student relationships and engagement:
Conceptualizing, measuring, and improving the capacity of classroom interactions (pp. 365-386). In S.
L. Christenson, A. L. Reschly, & C. Wylie (Eds.), Handbook of research on student engagement.
Dordrecht, Netherlands: Springer. doi:10.1007/978-1-4614-2018-7
Rich, B. L. (2006). Job engagement: Construct validation and relationships with job satisfaction, job
involvement, and intrinsic motivation (Doctoral Dissertation, University of Florida). Retrieved from
ECONIS, ProQuest UMI 3228825 Dissertation Publishing.
Rich, B. L., Lepine, J. A., & Crawford, E. R. (2010). Job engagement: Antecedents and effects on job
performance. The Academy of Management Journal, 53, 617-635. doi:10.5465/AMJ.2010.51468988
Rimm-Kaufman, S. E., & Hamre, B. K. (2010). The role of psychological and developmental science in
efforts to improve teacher quality. Teachers College Record, 112, 2988-3023. Retrieved from
http://www.tcrecord.org/library
Roorda, D. L., Koomen, H. M. Y., Spilt, J. L., & Oort, F. J. (2011). The influence of affective teacher-
student relationships on students‘ school engagement and achievement: A meta-analytic approach.
Review of Educational Research, 81, 493-529. doi:10.3102/0034654311421793
Roth, G., Assor, A., Kanat-Maymon, Y., & Kaplan, H. (2007). Autonomous motivation for teaching: How
self-determined teaching may lead to self-determined learning. Journal of Educational Psychology,
99, 761-774. doi: 10.1037/0022-0663.99.4.761
Saks, A. M. (2008). The meaning and bleeding of employee engagement: How muddy is the water?
Industrial and Organizational Psychology, 1, 40-43. doi: 10.1111/j.1754-9434.2007.00005.x
Schaufeli, W. B., Bakker, A. B., & Salanova, M. (2006). The measurement of work engagement with a short
questionnaire: A cross-national study. Educational and Psychological Measurement, 66, 701-716.
doi: 10.1177/0013164405282471
Schaufeli, W., & Salanova, M. (2011). Work engagement: On how to better catch a slippery concept.
European Journal of Work and Organizational Psychology, 20, 39-46. doi: 10.1080/1359432X.2010.515981
Klassen et al.
52 | F L R
Schaufeli, W.B., Salanova, M., Gonzalez-Roma, V., & Bakker, A. B. (2002). The measurement of
engagement and burnout: A two-sample confirmatory factor analytic approach. Journal of Happiness
Studies, 3, 71–92. doi: 10.1023/A:1015630930326
Shimazu, A., Schaufeli, W.B., Kosugi, S., Suzuki, A., Nashiwa, H., Kato, A., et al. (2008). Work
engagement in Japan: Development and validation of the Japanese version of the Utrecht Work
Engagement Scale. Applied Psychology: An International Review, 57, 510-523. doi: 10.1111/j.1464-
0597.2008.00333.x
Shuck, M. B. (2010). Employee engagement: An examination of antecedent and outcome variables (Doctoral
Dissertation, Florida International University). Retrieved from http://digitalcommons.fiu.edu/etd/235
Shuck, B. (2011). Four emerging perspectives of employee engagement: An integrative literature review.
Human Resource Development Review, 10, 304-328. doi:10.1177/1534484311410840
Shuck, B., Ghosh, R., Zigarmi, D., & Nimon, K. (2013). The jingle jangle of employee engagement: Further
exploration of the emerging construct and implications for workplace learning and performance.
Human Resource Development Review, 12, 11-35. doi:10.1177/1534484312463921
Sonnentag, S. (2003). Recovery, work engagement, and proactive behavior: A new look at the interface
between non-work and work. Journal of Applied Psychology, 88, 518-528. doi: 10.1037/0021-
9010.88.3.518
Staiger, D. O., & Rockoff, J. E. (2010). Searching for effective teachers with imperfect information. Journal
of Economic Perspectives, 24, 97-118. doi:10.1257/jep.24.3.97
Tabachnick, B. & Fidell, L. S. (2007). Using Multivariate Statistics (5th ed.). Boston: Pearson.
Thomas, C. H. (2006). Clarifying the concept of work engagement: Construct validation and an empirical
test. (Doctoral Dissertation, The University of Georgia). Retrieved from
http://hdl.handle.net/10724/9113
Tschannen-Moran, M. & Woolfolk Hoy, A. (2001). Teacher efficacy: Capturing an elusive construct.
Teaching and Teacher Education, 17, 783-805. Retrieved from
http://www.sciencedirect.com/science/article/pii/S0742051X01000361#
Velicer, W. F., & Jackson, D. N. (1990). Component analysis versus common factor analysis: Some further
observations. Multivariate Behavioral Research, 25(1), 97-114. doi: 10.1207/s15327906mbr2501_12
Wang, M.-T. (2009). School climate support for behavioral and psycho- logical adjustment: Testing the
mediating effect of social competence. School Psychology Quarterly, 24, 240–251.
doi:10.1037/a0017999
Wang, Y., & Qin, J. (2011). The structure of preschool teachers‘ work engagement survey in China.
International Conference on Social Science and Humanity, 5, 464-468. Retrieved from
http://www.ipedr.com/vol5/no2/103-H10248.pdf
Watt, H. M. G., & Richardson, R. W. (2007). Motivational factors influencing teaching as a career choice:
Development and validation of the FIT-Choice Scale. The Journal of Experimental Education, 75,
167-202. doi:10.3200/JEXE.75.3.167-202
Xanthopoulou, D., Bakker, A.B., Demerouti, E., & Schaufeli, W.B. (2007). The role of personal resources in
the job demands-resources model. International Journal of Stress Management, 14, 121-141. doi:
10.1037/1072-5245.14.2.121
Zwick, W. R., & Velicer, W. F. (1986). Comparison of five rules for determining the number of components
to retain. Psychological Bulletin, 99, 432-442. doi: 10.1037/0033-2909.99.3.432
Related Documents