MAY 2010 This publication was produced for review by the U.S. Agency for International Development. It was prepared by the USAID | DELIVER PROJECT, Task Order 1. Measuring Supply Chain Perfor Guide to Key P mance erformance Indicators for Public Health Managers

Welcome message from author
This document is posted to help you gain knowledge. Please leave a comment to let me know what you think about it! Share it to your friends and learn new things together.
Transcript

MAY 2010
This publication was produced for review by the U.S. Agency for International Development. It was prepared by the USAID | DELIVER PROJECT, Task Order 1.
Measuring Supply Chain PerforGuide to Key P
mance erformance Indicators for Public
Health Managers


Measuring Supply Chain
Guide to Key Performance Indicators for Public Health Managers
Performance
The authors' views expressed in this publication do not necessarily reflect the views of the U.S. Agency for International Development or the United States Government.

USAID | DELIVER PROJECT, Task Order 1
The USAID | DELIVER PROJECT, Task Order 1, is funded by the U.S. Agency for IntDevelopment under contract no. GPO-I-01-06-00007-00, beginning September 29, 2006. implemented by John Snow, Inc., in collaboration with PATH; Crown Agents Consultancy, Fuel Logistics Group (Pty) Ltd.; UPS Supply Chain Solutions; The Manoff Group; and 3project improves essential health commodity supply chains by strengthening logistics manasystems, streamlining distribution systems, identifying financial resources for procur
ernational Task Order 1 is
Inc.; Abt Associates; i Infotech. The gement information
ement and supply chain ancing forecasting and procurement planning. The project also encourages policymakers
e mandates.
Tien, Ethan Collins, Adriano Sommerlatte, and Linda Allain. 2010. Measuring Supply
Public health programs need supply chains they can rely on for ensuring product availability where and when needed. Implementing supply chain performance indicators or metrics is one of the simplest, least expensive
t in operations. For greater impact, it is important for the metrics to be aligned and not work at counter purposes.
USAID | DELIVER PROJECT John Snow, Inc.
1616 Fort Myer Drive, 11th Floor
Arlington, VA 22209 USA
Phone: 703-528-7474
Fax: 703-528-7480
Email: [email protected]
Internet: deliver.jsi.com
Cover photo: A logistics worker in Rwanda learns how to monitor inventor
operations, and enhand donors to support logistics as a critical factor in the overall success of their health car
Recommended Citation
Aronovich, Dana, Marie Chain Performance: Guide to Key Performance Indicators for Public Health Managers. Arlington, Va.: USAID | DELIVER PROJECT, Task Order 1.
Abstract
and least time-consuming activity that will show improvemen
y.
Contents
Foreword........................................................................................................................................................................... vii
................................1
...............................5
............................... 7 ................................7 ..............................11 ..............................13 ..............................15
..............................17
..............................17
..............................18
..............................20
..............................20
23 ..............................23 ..............................25 ..............................27 ..............................28
.............................31 ..............................31 ..............................37 ..............................39
Productivity ..................................................................................................................................................................41
..............................45
..............................45
..............................47
..............................49 Productivity ..................................................................................................................................................................51
Figures
1. Warehousing/Storage Performance Indicators .................................................................................................2 2. Supplier/Sourcing Performance Measures..........................................................................................................2 3. Characteristics of Good Measures ......................................................................................................................3 4. Meaning of Different Headings..............................................................................................................................4
Introduction ........................................................................................................................................
Supply Chain Management Performance Measures Matrix by Function ...............................
Product Selection, Forecasting, and Procurement .....................................................................Quality .............................................................................................................................................Response Time..............................................................................................................................Cost/Financial ................................................................................................................................Productivity ....................................................................................................................................
Supplier/Sourcing ...............................................................................................................................Quality .............................................................................................................................................Response Time..............................................................................................................................Cost/Financial ................................................................................................................................Productivity ....................................................................................................................................
Warehousing/Storage .....................................................................................................................................................Quality .............................................................................................................................................Response Time..............................................................................................................................Cost/Financial ................................................................................................................................Productivity ....................................................................................................................................
Inventory Management/LMIS/Customer Response ....................................................................Quality .............................................................................................................................................Response Time..............................................................................................................................Cost/Financial ................................................................................................................................
Distribution/Transport .....................................................................................................................Quality .............................................................................................................................................Response Time..............................................................................................................................Cost/Financial ................................................................................................................................
v

vi
Foreword
Measuring Supply Chain Performance: Guide to Key Performance Indicators for Public Health Mato help managers and logisticians focus on key logistics areas they want to improvthem with a tool to do so. This guide is not meant to replace the Logistics System As
nagers was written e and to provide
sessment Tool (LSAT) or the Logistics Indicators Assessment Tool (LIAT), but is meant to provide a more in-depth look at operations to identify key bottlenecks and ways to strategically improve supply chain performance.
vii

viii

Introduction
To show improvement in operations, many supply chain management specialists coimplementing supply chain performance indicators or metrics as one of the simplesand least time-consuming activities. It is a well-known fact that, “people behave based o
1
nsider t, least expensive, n the way they are
measured” . Global public health supply chains are no different; unless clear measurable indicators em; as a consequence, they
tcomes system—health
rforming. The ble at the health facility cannot be
ten depends on how well or how poorly the supply chain is ce, you must understand how it is currently
upply chain is
ance is to focus on those areas that are not only under-performing but, also, those that are aligned with the overall supply chain strategy. The Logistics Performance Gap analysis (see figures 1 and 2) can be used to compare key performance indicators with world-class, or best-in-class, indicators. In these figures, the inside blue line represents the performance of the supply chain being measured, while the red line on the outside represents the score of a similar, but highly performing, supply chain. The gaps are used to assess strengths and weaknesses, and indicate areas that require attention.
are in place, staff may not completely understand what is expected of thmay not carry out their tasks as well as they could.
Supply Chain Performance—Key to Health OuPositive health outcomes are highly dependent on how well the health delivery information, financing, personnel and supply chain (including supplies)—is peimportance of having medicines and other supplies availaoverstated, and their availability ofperforming. But, to improve supply chain performanperforming, e.g., it needs to be measured. This information will show where the sinefficient and will help determine how to address these deficiencies 2.
Choosing Where to Focus The key to successfully improving supply chain perform
1 Frazelle, Edward, 2002. Supply chain strategy: the logistics of supply chain management. New York: McGraw-Hill Companies, Inc. 2 Keebler, James S., Karl B. Manrodt, David A. Durtsche and D. Michael Ledyard, 1999. Keeping Score: Measuring the Business Value of Logistics in the Supply Chain. Oak Brook, IL: Council of Logistics Management.
1
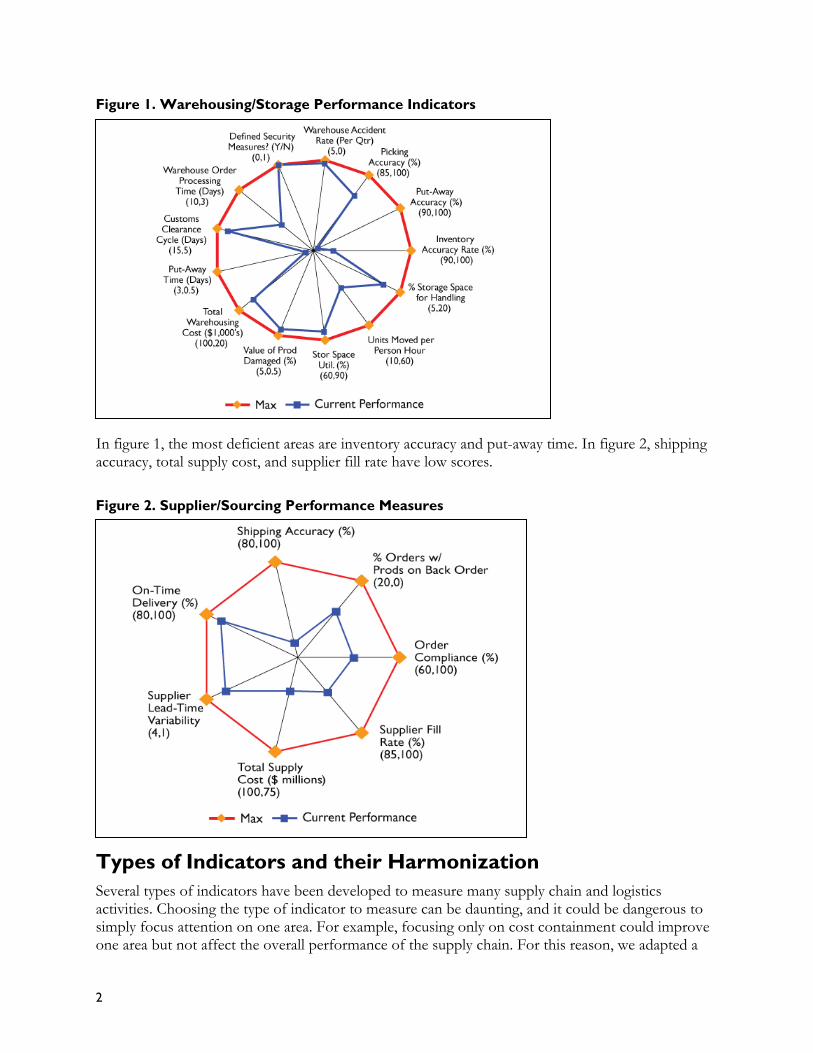
Figure 1. Warehousing/Storage Performance Indicators
In figure 1, the most deficient areas are inventory accuracy and put-away time. In figure 2, shipping accuracy, total supply cost, and supplier fill rate have low scores. Figure 2. Supplier/Sourcing Performance Measures
Types of Indicators and their Harmonization Several types of indicators have been developed to measure many supply chain and logistics activities. Choosing the type of indicator to measure can be daunting, and it could be dangerous to simply focus attention on one area. For example, focusing only on cost containment could improve one area but not affect the overall performance of the supply chain. For this reason, we adapted a
2
model developed by Edward Frazelle (2001) that is more holistic and consists of indicators: quality, time, financial, and pro
four types of ductivity. To complete the analysis, all indicator types need to
ally, they tell you his classification is
, etc. s. They show where
improve the overall supply chain performance. d help move
le, filling vehicles to improve efficiency.
e impact on distribution run only when they
are filled to capacity could cause stockouts at the next level down unless inventory policies are shipments. It is very important to view these indicators
—and to identify formance.
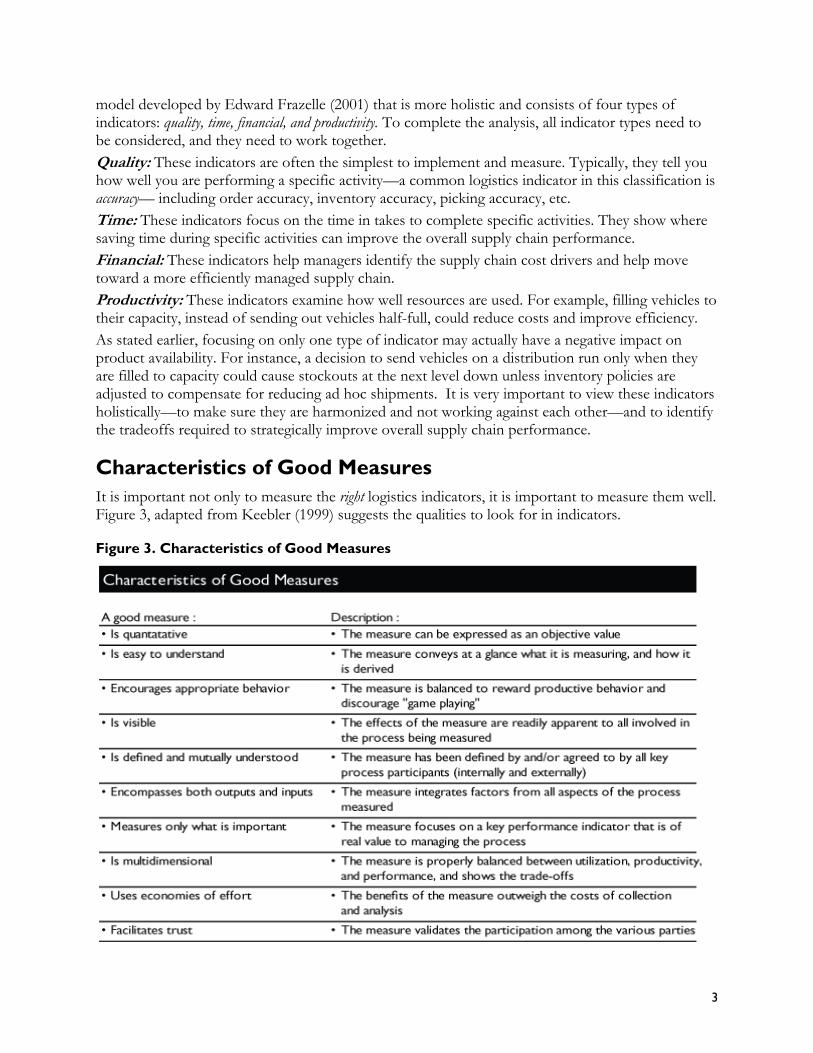
It is important not only to measure the right logistics indicators, it is important to measure them well. Figure 3, adapted from Keebler (1999) suggests the qualities to look for in indicators.
Figure 3. Characteristics of Good Measures
be considered, and they need to work together. Quality: These indicators are often the simplest to implement and measure. Typichow well you are performing a specific activity—a common logistics indicator in taccuracy— including order accuracy, inventory accuracy, picking accuracyTime: These indicators focus on the time in takes to complete specific activitiesaving time during specific activities canFinancial: These indicators help managers identify the supply chain cost drivers antoward a more efficiently managed supply chain. Productivity: These indicators examine how well resources are used. For examptheir capacity, instead of sending out vehicles half-full, could reduce costs andAs stated earlier, focusing on only one type of indicator may actually have a negativproduct availability. For instance, a decision to send vehicles on a
adjusted to compensate for reducing ad hoc holistically—to make sure they are harmonized and not working against each otherthe tradeoffs required to strategically improve overall supply chain per
Characteristics of Good Measures
3
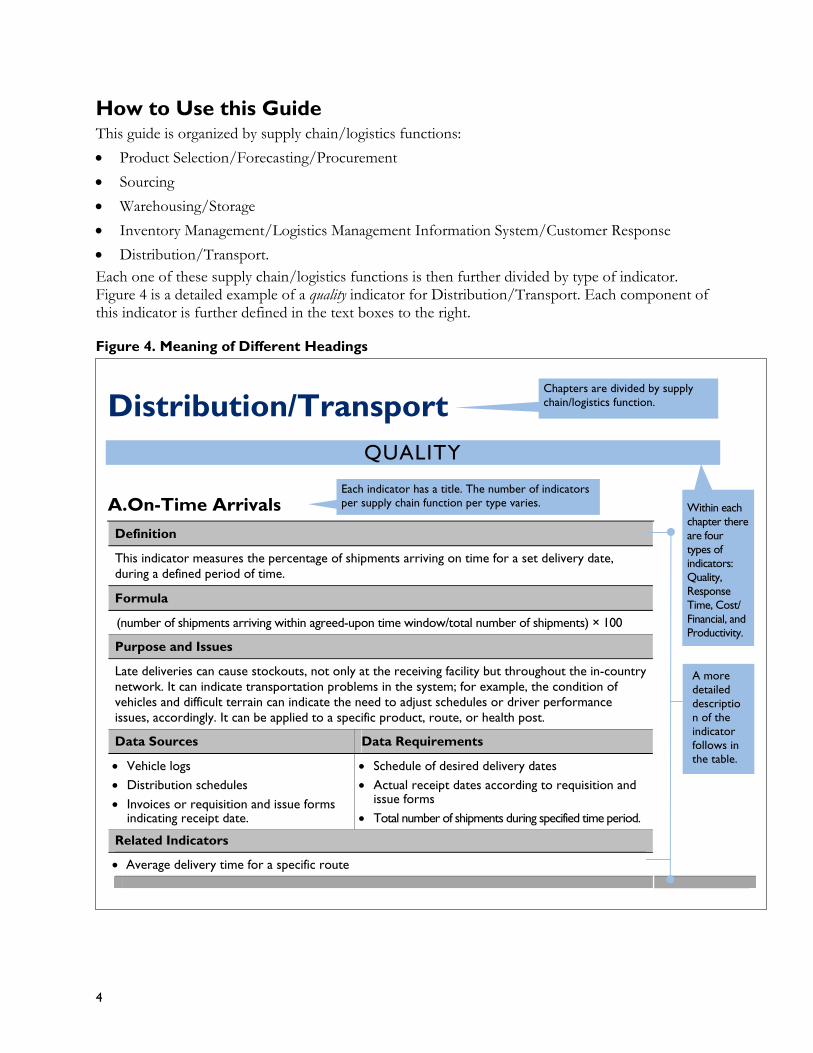
How to Use this Guide
4
/logistics functions:
ct Selection/Forecasting/Procurement
age
omer Response
Each one of these supply chain/logistics functions is then further divided by type of indicator. uality indicator for Distribution/Transport. Each component of
this indicator is further defined in the text boxes to the right.
This guide is organized by supply chain
Produ
Sourcing
Warehousing/Stor
Inventory Management/Logistics Management Information System/Cust
Distribution/Transport.
Figure 4 is a detailed example of a q
Figure 4. Meaning of Different Headings
Distribution/Transport QUALITY
A.On-Time Arrivals Definition
This indicator measures the percentage of shipments arriving on time for a set delivery date, during a defined period of time.
Formula
(number of shipments arriving withi indow/total number of shipmenn agreed-upon time w ts) × 100
Purpose and Issues
Late deliveries can cause stockouts, not only at the receiving facility but throughout the in-country network. It can indicate t e condition of ransportation problems in the system; for example, thvehicles and difficult terrain can indicate the need to adjust schedules or driver performance issues, accordingly. It can be applied to a specific product, route, or health post.
Data Sources Data Requirements
Vehicle logs Distribution schedules Invoices or requisition and issue forms
indicating receipt date.
Schedule of desired delivery dates Actual receipt dates according to requisition and
issue forms Total number of shipments during specified time period.
Related Indicators
Average delivery time for a specific route
Chapters are divided by supply chain/logistics function.
Each indicator has a title. The number of indicatper supply chain function per type varies.
ors
Within each chapter there are four types of indicators: Quality, Response Time, Cost/ Financial, and Productivity.
A more detailed description of the indicator follows in the table.
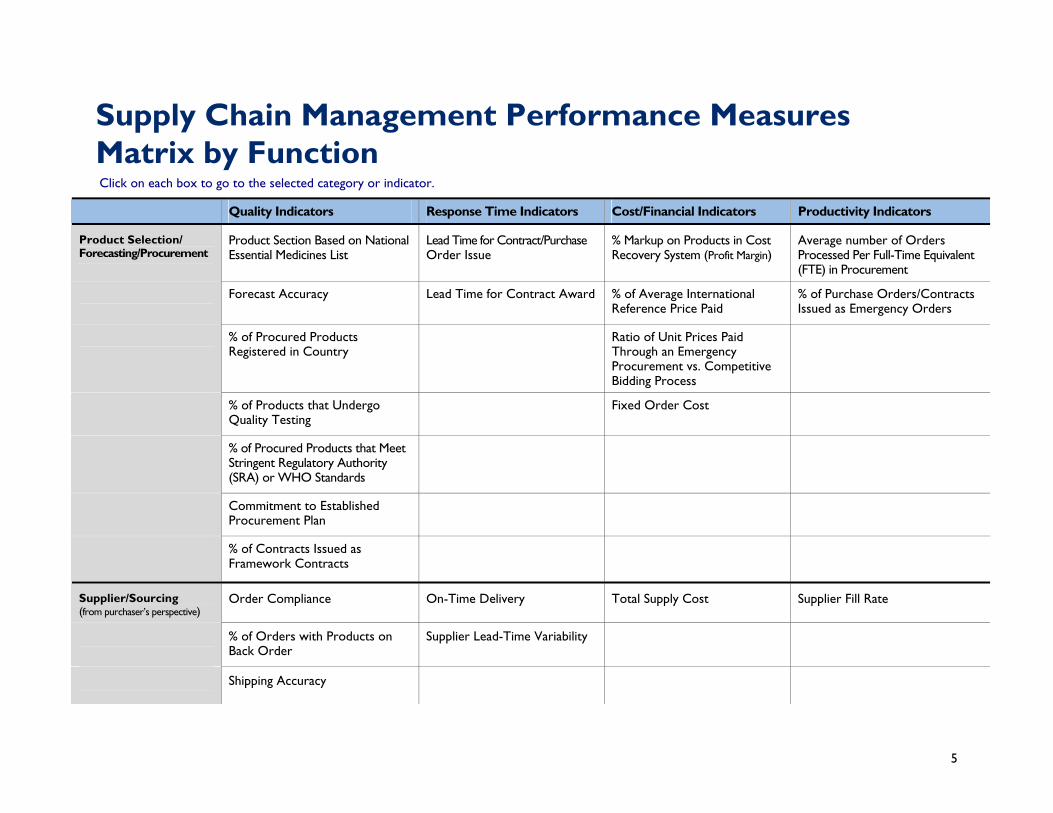
Supply Chain Management Performance MeMatrix by Function
asures
Click on each box to go to the selected category or indicator.
Quality Indicators Response Time Indicators Cost/Financial Indicators Productivity Indicators
Product Selection/ Forecasting/Procureme
Product Section Based on National dicines List
Lead Time for Contract/Purchase % Markup on P Syste
Average number of Orders Per Full-Time Equivalent ocurement
nt Essential Me Order Issue roducts in Cost
Recovery m (Profit Margin) Processed (FTE) in Pr
cy Lead Time for Con erage I ernational nce Price Paid
% of Purchase Orders/Contracts Issued as Emergency Orders
Forecast Accura tract Award % of AvRefere
nt
% of Procured Products ry
Ratio of Unit Prices Paid rough an Em rgency
Procurement vs. Competitive Bidding Process
Registered in Count Th e
er o Fixed Order C st % of Products that UndQuality Testing
g o
ucts tha Meet gulatory Authority
tandards
% of Procured ProdStringent Re
t
(SRA) or WHO S
o Established Plan
Commitment tProcurement
% of Contracts Issued as
Framework Contracts
Supplier/Sourcing (from purchaser’s perspective)
pliance On-Time Delivery Total Supply C st Supplier Fill Rate Order Com o
% of Orders with Products on Back Order
Supplier Lead-Time Variability
Shipping Accuracy
5

6
Quality Indicators Response Time Indicators Cost/Financial Indicators Productivity Indicators
Warehousing/Storage Inventory Accuracy Rate Warehouse Order Processing Total Warehousing Cost Storage Space Utilization Time
Put-Away Accuracy Customs Cleara Value of Product Damaged in the Warehous
Units Moved Per Person Hour nce Cycle e
Picking Accuracy Rate Put-Away Time % of Storage Space Dedicated for Handling
t Rate Warehouse Acciden
Defined Security Measures
Inventory Mgmt/LMIS Customer Response
Rate ime y Inventory Turnover Rate Stockout Order Entry T Inventor Holding Cost
Order Fill Rate Order Turnaround Time Value of Un ntory Velocity usable Stock Inve
racy Rate Order Lead Time Unacc % of Orders Placed Through Electronic Ordering System
Inventory Accu Value of ounted Stock
Average Respo se Cost Facility Reporting Rates Stocked According to Plan n
Adequate Shelf Life
Stock Wastage Due to Expiration or Damage
r Predictable Demand
Plan in Place foChange in
Order Entry Accuracy
Invoice Accuracy
Distribution/Transport very T po t Vehicle Use Availability On-Time Arrivals Average Deli ime Total Trans rtation Cos
e Q antity nti
Average Vehicle Loading/Unloading Time
Average TranspoKilometer/
Capacity Utilization % of Shipments WherDispatched Equals Qua
uty
Received
rtation Cost Per Volume/Weight
Container
% of Shipments Arriving in Good Condition
Vehicle Turnaround Time Ratio of Transportation Cost to Value of Product
Fleet Yield
Kilometers Between Accidents Average Number of Stops Per Route
Time Between Accidents

7
lection, Forecasting, and Procurement Product Se
QUALITY A. Product Selection Based on National Essential Medicines List
Definition
For each product that a program selects for procurement, this indicator measures the percentage of those products that are eatment guidelines (STG). listed on a National Essential Medicines List (NEML), or other approved product list, or standard tr
Formula
number of products selected for procurement that are listed on the NEML or other approv_____________________________________________________________________________________________________________________________
total number of products selected for procurement
ed list __________ *100
Purpose and Issues
This indicator can help determine whether the NEML is used for product selection and whether product selection is limited ernments regularly that are a priority in
t is not on the NEML, it may receive lower funding, or it may require a special waiver for procur alth Organization (WHO)
dex.html
to the NEML. Evaluators can also examine whether the EML is up–to-date and accurate. Typically, govupdate their NEMLs to reflect health priorities. An NEML identifies medicines or commodities providing the basic health care requirements for a country. If a producpriority and ement. The World Heprovides a model EML at— http://www.who.int/medicines/publications/essentialmedicines/en/in
are essential products. ms fees; also, the
The indicator can help evaluators establish whether products tAlso, in many instances, products on the NEML are exempt froregistration process for products on the NEML may be less cu
hat are regularly procuredm value added tax (VAT) and custo
mbersome.
Data Sources Data Requirements
Lists of procured products from government sources or programs assisting the commodities, e.g., Logistics Management Division or
ductive Health n from USAID
oftware for antiretrovirals (ARVs) idual donors procuring on behalf of the government
Most current NEML from the Ministry of Health or Procurement and
Procurement proposals to verify guidance for bidders.
List of products procured over a defined period of time
Copy of NEML or other approved product list
government in procuring similar department; PipeLine software for contraceptives; the ReproInterchange (RHI) website for contraceptive shipment informatioand other funding agencies; and Quantimed sand other products or indiv
Planning Division
National procurement policies
Key informant interviews with procurement unit to determine actual practices and whether any policies discourage procurement of commodities not on the EML
Related Indicators
Is procurement restricted to products on the EML, or are there barriers to procuring products outside the list?
Are there policies regarding generic versus branded product selection and brand (product) proliferation? Current national procurement policies and guidelines may contain restrictions or provide guidance on selecting generic products, or they may limit the number of brands of a specific product that enter the country. Procuring generic products can be more cost efficient than procuring branded products. However, policies should be in place to monitor the proliferation of brands but still allow for private sector competition.

8
ecast Accuracy B. For
Definition
For all products that the program has committed to supplying, this indicator measures the percentage of mption or issues data for that year.
Evaluators should calculate th forecast is made.
difference between forecasts previously made for a year and the actual consu
e indicator for each product for which a
Formula
1-__________________________________________________________forecasted consumption – actual consumption
_
actual consumption *100
Purpose and Issues
This indicator should be used at the level where long-term procurement decisions are made—central level—but it can also be applied
most commonly the to other levels of the system if forecasting has been decentralized and if
helps procure adequate he likelihood of
with available products.
an estimate of future demand. Other than a make-to system, forecasts are ut, certain methods that can aid in reducing the forec torical
mating future trends. Documen discrepancies paring the forecast) helps p perspective and may lead to insights
facilities determine their own order quantities.
Accurate forecasting helps countries and organizations improve financial management andquantities of each product, thereby reducing the likelihood of wastage or shortage, and increasing tmeeting customer needs
Forecasts are -order replenishment typically incorrect. Bconsumption data and esti
ast error, e.g., analyzing histing the reasons for particularly wide
ut the results into (including assumptions used in prefor improving future forecasts.
Data Sources Data Requirements
Forecasting records
Consumption/distribution records
Contraceptive Procurement Tables (CPTs) for USAID-supplied contraceptives
products that the program has committed to supplying
Forecasts, by product, for the year
Actual consumption or issues data, by product, for
ear
Recommended orders to donors for essential drugs
List of
the y
C. Percentag cts R red In-Country e of Procured Produ egiste
Definition
This indicator measures the percentage of procured products that are registered in-country, usually measured for procurements carried out over the course of one year.
Formula
PRODUCT SELECTION, FORECASTING, AND PROCUREMENT
number of products procured that are registered in country _______________________________________________________________________
total number of products procured *100
PRODUCT SELECTION, FORECASTING, AND PROCUREMENT
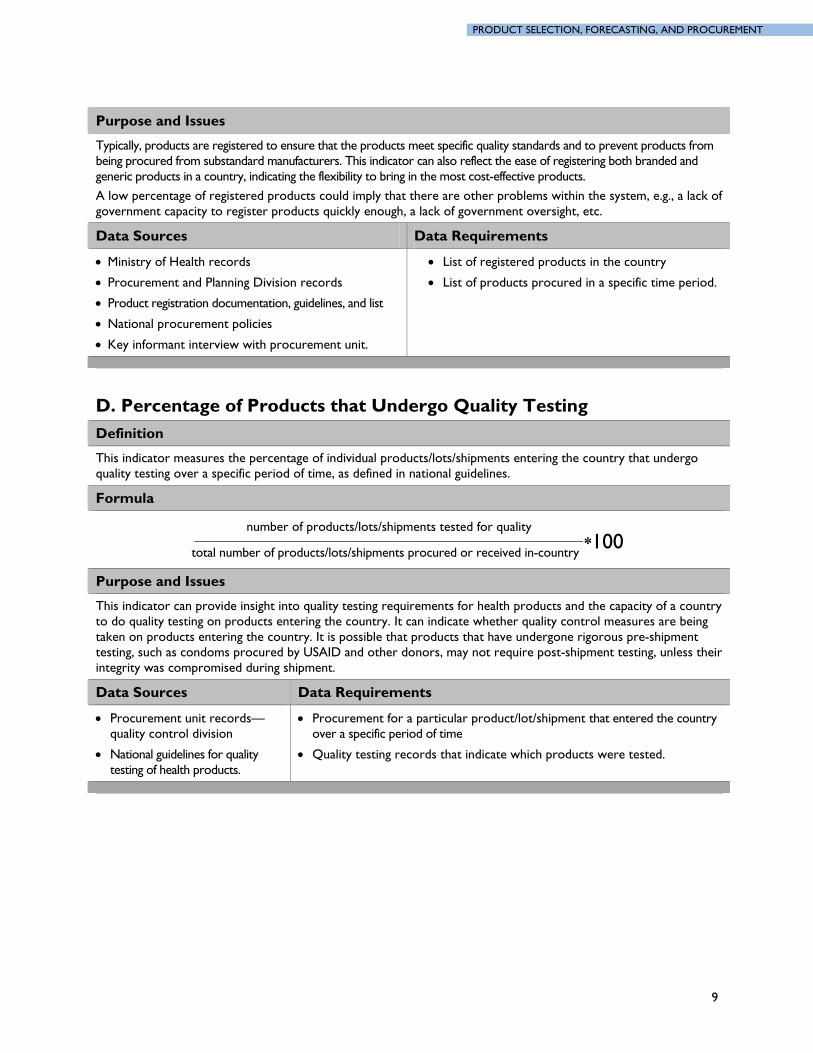
Purpose and Issues
Typically, products are registered to ensure that the products meet specific quality standards and to prevent products from oth branded and
tive products.
ntage of registered products coul ther problems within the system, e.g., a lack of o register produ ht, etc.
being procured from substandard manufacturers. This indicator can also reflect the ease of registering bgeneric products in a country, indicating the flexibility to bring in the most cost-effec
A low perce d imply that there are ogovernment capacity t cts quickly enough, a lack of government oversig
Data Sources Data Requirements
Ministry of Health records
Procurement and Planning Division records
Product registration documentation, guidelines, and list
National procurement policies
List of registered products in the country
List of products procured in a specific time period.
Key informant interview with procurement unit.
D. Percentage of Products that Undergo Quality Testing Definition
This indicat ing the country that undergo quality testing over a specific period of time, as defined in national guidelines.
or measures the percentage of individual products/lots/shipments enter
Formula
number of products/lots/shipments tested for quality __________________________________________________________total number of products/lots/shipments procured or received in-country
*100
Purpose and Issues
This indicator can provito do quality testing on prod
de insight into quality testing requirements for health products and thects entering the country.
capacity of a country It can indicate whether quality control measures are being
e rigorous pre-shipment cured by USAID and other donors, may not require post-shipment testing, unless their
integrity was compromised during shipment.
utaken on products entetesting, such as condoms pro
ring the country. It is possible that products that have undergon
Data Sources Data Requirements
Procurement unit records—quality control division
National guidelines for quality testing of health products.
Procurement for a particular product/lot/shipment that entered the country over a specific period of time
Quality testing records that indicate which products were tested.
9

10
ducts that Meet Stringent Regulatory rity (SRA) or WHO Standards
E. Percentage of Procured ProAuthoDefinition
This indicator measures the percentage of products procured that meet SRA or WHO standarpercentage within a class of product, such as contraceptives, ARVs, essential medicines, etc.; or
ds. This could measure the , as a whole, for all products
ng a specific period of time. This is usually measured for procurements carried out over one year. For example, a ts or be just a comparison of injectables. procured duri
comparison can be made among all contraceptive procuremen
Formula
number of products procured that meet SRA or WHO standards ______________________________________________________
total number of products procured *100
Purpose and Issues
This indicator determines whether products being purchased meet international quality standards, as defined by or being procured,
ese standards. WHO or another stringent regulatory auth ity. To ensure that only high-quality products are
red meet thcountries should aim to have 100% of products procu
Data Sources Data Requirements
Procurement unit records—quality control division
Quality reports from procurement unit or quality control division.
List of products procured in a specific time period.
F. Commitment to Established Procurement Plan Definition
This indicator measures whether all stakeholders are committed to carry out an established procurement plan, by andate by product; including a committed contribution of time, financial resources, or development of a m
stakeholders to develop regular, ongoing product-specific procurement plans.
Formula
Are all stakeholders committed to carrying urement plan by product? (yes/no) out an established proc
Purpose and Issues
Having commitment by all stakeholders to develop a well thought-out procurement plan is important to ensure that to ensure that adequate funds
a country. It is important to commit to a p des coordination among stakeholders’ shipping cycles; this tion, as well as establish who will be responsible for bringing in certain products.
sufficient commodities are being purchased, to identify who/what will fund the plan, andwill be available to implement the plan. This indicator helps improve commodity security in
rocurement plan that inclufor stakeholderswill avoid duplica
Data Sources Data Requirements
Interviews with stakeholders Exist Planning or procurement unit records Review of existing procurement plans Stakeholders’ financial commitments Meeting minutes Policy documents.
ing procurement plans
List of stakeholders who attend procurement plan meetings
List of products in the procurement plan
Budget/financial commitments and disbursements by stakeholders.
Related Indicators
Is a multi-year procurement plan offered for each product? (yes/no)
PRODUCT SELECTION, FORECASTING, AND PROCUREMENT

11
rcentage of Contracts Issued As Framework Contracts G. PeDefinition
This indicator measures the percentage of contracts issued as framework contracts over a specountry can try to issue a certain number of framework contr
cific period of time. A acts each year to take advantage of the benefits
by the contracts. Framework contracts are multiple-year contracts where terms, conditions, time periods, and other specifications are negotiated before the contract goes into effect. offered
Formula
number of framework contracts ___________________________total number of contracts issued
*100
Purpose and Issues
Framework contracts can save time and money by reducing lead times and by eliminating the negotiation time and e costs if country’s were to issue several also helps the suppliers anticipate
lanning and potent is indicator can help clarify negotiate framew r most efficient
procurement mechanisms.
administrativ individual contracts. It demand, leading to better pwhether there is capacity to
ially lower unit prices for the purchaser. Tho k o tracts and if governments are seeking the c n
Data Sources Data Requirements
Procureme Number of framework contracts
number of contracts issued over a defined period of time.
nt unit records.
Total
Related Indicators
number o under framework contracts ____________________________________________________
rements *100
f procurements carried out
total number of procu
RESPONSE TIME A. Lead Time for Contract/Purchase Order Issue Definition
This indicator measures the average amount of time it takes from when a decision to order is made to when the e period, but one procurement unit issues the contract or purchase order (PO). It can be measured over any tim
year is typical; usually measured in days.
Formula
sum of number of days between when each decision to order was made and when each contract or PO was issued _________________________________________________________________________
total number of contracts or POs issued during a specified period of time
Purpose and Issues
For planning, it is important to know the amount of expected lead time required to develop POs. Long lead times will extend the procurement cycle and will delay the time in issuing a PO with the supplier or manufacturer. This, in turn, will lead to delays in orders being placed and delays in shipments, potentially leading to shortages and stockouts.
This indicator measures the efficiency with which requests are processed and POs prepared. Improving the contract issue lead time will improve response times to in-country facilities that need the products.
PRODUCT SELECTION, FORECASTING, AND PROCUREMENT
PRODUCT SELECTION, FORECASTING, AND PROCUREMENT
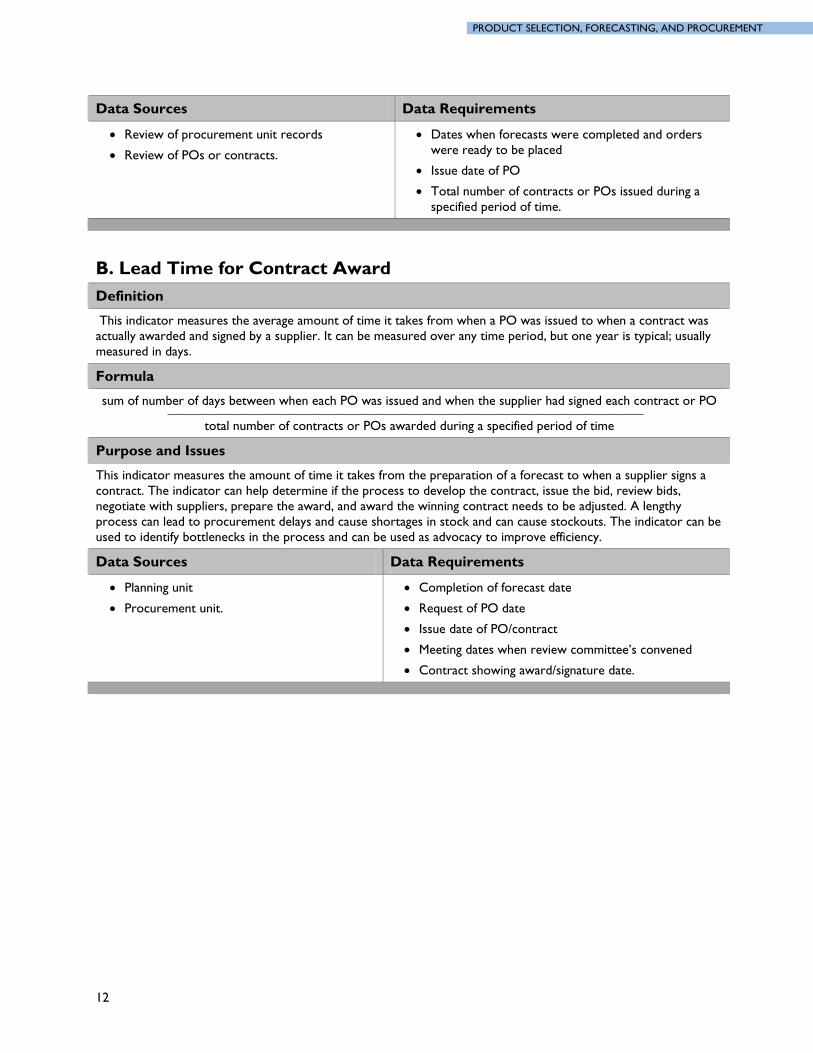
Data Sources Data Requirements
Review of procureme Dates when font unit records recasts were completed and orders were ready to be placed
Issue dat Review of POs or contracts.
e of PO Total number of contracts or POs issued during a
specified period of time.
B. Lead Time for Contract Award Definition
This indicator measures the average amount of time it takes from when a PO was issued to when a contract was ar is typical; usually
measured in dactually but one yeawarded and signed by a supplier. It can be measured over any time period,
ays.
Formula
sum of number of days between when each PO was issued and when the supplier had signed_____________________________________________________________
total number of contracts or POs awarded during a specified period o
each contract or PO __________ f time
Purpose and Issues
This indicator measures the amount of tim paration of a forecast to when a supplier signs a tor can help de contract, issue the bid, review bids,
pliers, prepare t ng contract needs to be adjusted. A lengthy process can lead to procurement delays an and can cause stockouts. The indicator can be used to identify bottlenecks in the process .
e it takes from the precontract. The indica termine if the process to develop the negotiate with sup he award, and award the winni
d cause shortages in stock and can be used as advocacy to improve efficiency
Data Sources Data Requirements
Planning unit
Procurement unit.
Completion of forecast date
Request of PO date
Issue date of PO/contract
Meeting dates when review committee’s convened
Contract showing award/signature date.
12
13
COST/FINANCIAL A. Percentage Markup on Products in Cost Recovery System (Profit Margin) Definition
For any products offered in a cost recovery system, the percentage difference between the purchase price and the actual sale price.
Formula
sale price – purchase price _________________________purchase price
*100
Purpose and Issues
In a cost recovery system, enough revenue should be generated to allow the program to recovvariety of purposes. The revenue can be used to purchase more commodities, act as an incentive for heworkers, or help pay operating costs. This is especially imp
er its costs, for a alth
ortant in countries with decentralized settings where upon cost recovery systems to gen he lower levels to purchase their own
ugh profit margin is ne whether the sale price is a factor in
ommod
facilities rely erate enough funds at tcommodities. The indicator can be used to determine being generated for the cost recovery system
if products are sold at a price where eno to function. It can also determi
discouraging clients from buying c ities if they are too expensive.
Data Sources Data Requirements
Survey of commodity sale prices at health facilities
Procurement prices of commodities
ls (where cost recovery systems are most likely d systems).
MOH established price list
Unit prices for products under review
policies.
Key informant interviews at central and regional Cost recoveryleveto take place in decentralize
B. Percentage of Average International Reference Price Paid Definition
This indicator measures tinternational unit p
he unit cost per item charged by an external supplier as a percentage of the average rice. This indicator can be calculated for any supplier that supplies products to a requesting
facility. It can be measured over any time period, but one year is standard.
Formula
average unit cost of item ________________________________ 100average international unit cost of item
*
Purpose and Issues
This indicator measures the cost of items procured relative to the average international price paid. The lower the percentage of the average international price paid, the more the cost savings. Conversely, if the indicator is greater than 100 percent, the country is paying a premium on the average international prices. Management Science for Health’s (MSH’s) International Drug Price Indicator Guide lists the most current average international prices for pharmaceuticals. This indicator can be used to measure the costs of items within a specific procurement or across many procurements. If more than one procurement is being analyzed, the average unit cost of each item across the procurements should be used.
PRODUCT SELECTION, FORECASTING, AND PROCUREMENT

PRODUCT SELECTION, FORECASTING, AND PROCUREMENT
Data Sources Data Requirements
Review of invoices at the supplier or at requesting facility (if available).
For international unit costs, the M
the Invoices from the supplier showing items purchased
SH’s International Average international unit costsDrug Price IndicaAssociation (ID
tor Guide and International Dispensary A) catalogs can be referenced.
unit prices of
for items purchased
Dates that the orders were received by the supplier ed (related indicator). and dates when they were suppli
Related Indicators
Percentage of International Reference Price Paid Including Freight and Insurance or Total Fsupplier or by product)
N.B. If freight and insurance make up a significa
reight Charges (by
nt percentage of the total cost of previous procurements, those costs need to be applied to the average unit cost of the item procured and the average international unit cost of the same item. The new indicator then becomes the average total delivered cost of the item procured over the average international total price paid for the same item.
C. Ratio of Unit Prices Paid through an Emergency Procurement vs. Competitive Bidding Process Definition
This indicator measure the chasing items as an emergency procurement versus ive bidding (CB) process, e.g., international competitive bidding (ICB).
ratio of the unit price paid when purthrough a competit
Formula
unit price of item under emergency procurement _________________________________________ unit price of ement item under ICB procur
Purpose and Issues
When emergency procurement is carried hen the procurement is done through a CB process. Emergency orders usua ch higher unit prices, using more financial resources. Emergency orders may req dditional cost. This indicator can be used to advocate for prop ad time to avoid emergency procurements.
out, the unit price paid for a product can be higher than wlly result in countries paying mu
uire commodities to be shipped by air, which is also an aer procurement planning and le
Data Sources Data Requirements
Review of invoices and POs at the supplier or at the requesting facility (if available). items purchased
Invoices from the supplier showing unit prices of
Review of contract awards showing unit prices of commodities to be purchased
Information on the unit costs of items supplied on each requisition form.
Related Indicators
Percentage difference in unit price between items bought as an emergency order versus CB:
unit cost of item paid under emergency procurement - unit cost of item paid under CB procurement ______________________________________________________________________________unit cost of item paid under CB procurement
*100
Percentage of all POs issued as emergency orders
14
15
ed Order Cost D. FixDefinition
This indicadefined
tor measures the average estimated cost of operating the entire procurement unit per order in a period of time (e.g., month, quarter, year).
Formula
sum of all costs of operating the procurement unit __________________________________________ average number of orders processed in a defined period of time
Purpose and Issues
This indicator can help managers determi e review period to the cycles in the costs. g costs to include in their calculations.
ne how efficiently the procurement unit is operating from on Each program can decide which operatinnext and to see if there are
Data Sources Data Requirements
Invoices Human resources records Procurement unit records.
All costs of operating the procurement unit (e.g., salaries, benefits, utilities, office supplies, etc.)
umber of orders processed in a defined period of time. n
PRODUCTIVITY r Full-Time Equivalent A. Average Number of Orders Processed pe
(FTE) in Procurement Definition
This indicator measures the average number of orders processed per FTE staff member working in the procurement unit. It can be measured over any time period, but one year is standard.
Formula
total cessed number of orders pro____________________________ number of FTE procurement staff
Purpose and Issues
This indicator can measure the productivity or efficiency of the procurement unit. The average number of orders or the need for additional training or skills building. processed per each FTE can indicate staff productivity
Data Sources Data Requirements
Procurement unit records Logistics management information system (LMIS)
Total number of orders processperiod of time
reports or equivalent database showing total value of commodities purchased over a certain time period.
ed during a defined
Number of FTE working in procurement
Related Indicators
Total inventory value/total number of FTE procurement staff Total cost of commodities procured/total number of FTE procurement staff
However, these indicators should be used with other data, such as volume of commodities. For example, ARVs are high in cost, but some are relatively small in volume. If only a small volume of ARVs are being purchased—with a high cost and 10 FTEs working in procurement—this would indicate low efficiency versus if a small volume of ARVs was being procured by one FTE.
PRODUCT SELECTION, FORECASTING, AND PROCUREMENT

PRODUCT SELECTION, FORECASTING, AND PROCUREMENT
16
centage of Purchase Orders/Contracts Issued As Emergency Orders B. PerDefinition
This indof one mo
icator measures the percentage of POs or contracts that are issued as emergency orders, with a lead time nth or less out of all POs or contracts placed during a defined period of time.
Formula
number of emergency orders _________________________total number of orders placed
*100
Purpose and Issues
This indicator can help determine the percentage of all POs or contracts issued over a certain temergency orders, which are usually more costly. In environments where resources are litry to avoid costly emergency orders. Advanced planning and regular management of stplace timely orders to
ime period that are mited, programs should
ock levels can help managers secure the lowest prices possible. A high percentage of emergency orders can indicate the
umber of processes: the need to ; to adjust PO lead times; to review the accuracy d procurem and to review, and possibly e procurem . This indicator can help highlight when
tion is needed.
failure of a n adjust max/min levelsof LMIS data, forecasts, anadjust, the time span of th
ent plans; to review timeliness of reporting; ent ycle among other issuesc ,
corrective ac
Data Sources Data Requirements
Review of POs or contracts
Planning unit
Procurement unit.
Request of PO date
Issue date of PO/contract
Number of emergency order requests
Total number of orders placed.

17
Supplier/Sourcing QUALITY
der Compliance A. Or
Definition
For eachreceived in the
supplier, this indicator measures the percentage of orders (e.g., POs) that meet the set criteria (e.g., correct products correct amounts, at the correct time, in the correct packaging; product arrived undamaged with adequate
shelf life r lfilled during a defined period of time. remaining; quantity shipped equals quantity received, etc.) out of all o ders fu
Formula
number of orders meeting all criteria defined in purchase orders or contract ________________________________________________________________________________________________________
total number of orders fulfilled *100
Purpose and Issues
This measure is useful for procurement personnel s to hold their suppliers accountable for meeting PO or co assess supplier performance
hen needed, to address an Logistics managers can also decide to select certain r the most impor s complying with order standards.
and warehouse managerthe requirements specified in the ntract. By monitoring order compliance, managers can and take action, w y lack of order compliance.criteria that they conside tant for measuring whether a supplier i
Data Sources Data Requirements
Ordering manifests: PO/contract Order
Shipment invoice
criteria, as described in PO/contract
Shipment details
Order receipt vouchers. Order receipt information.
B. Percenta s Back Order ge of Orders with Product onDefinition
This indicator measures the percentage of orders for which the supplier did not have sufficihad to back order products on an order, out of all orders placed during a defined period of tim
ent stock on hand and e.
Formula
number of orders with products on back order ________________________________________________________________
total number of orders placed *100
Purpose and Issues
A supplier with a high percentage of i t (e.g., frequently . In business terms, this could result in a loss of potential revenue if competitors can fill
orders. Procurement personnel and warehouse managers can use this measure to monitor their suppliers’ performance and ability to fulfill orders in a timely manner. Delays in receiving product can result in shortages and even stockouts throughout the in-country distribution network.
tems on back order may indicate poor stock managemenunderstocked/stocked out)
Data Sources Data Requirements
Ordering manifests: PO/contract
Shipment invoice
Order receipt vouchers
Correspondence from suppliers.
Total number of orders with products on back order during specified time period
Total number of orders placed during specified time period.
18
Related Indicators
Percentage of products requiring back orders (per month/quarter/year)
Frequency of back orders for specific products during a defined period of time
C. Shipping Accuracy Definition
This indictor measures the percentage of lines or stockkeeping units (SKUs) (products) that were shipped without error out of all lines or SKUs shipped during a defined period of time.
Formula
number of lines/SKUs shipped without error ______________________________________________________________
total number of lines/SKUs shipped *100
Purpose and Issues
This indicator measures the accuracy of sh tities shipped. This is another rocurement personnel and w onitor supplier performance and
rformance, if shipment is contracted separately.
ipments in terms of the products and quanmeasure that p arehouse managers can use to mshipper pe
Data Sources Data Requirements
Procurement records and orders
Shipment records
Bill of lading
Customs records
Packing slip
supplier/shipper and purchaser.
Number of lines shipped without error
Total number of lines shipped.
Correspondence between
RESPONSE TIME A. On-Time Delivery
Definition
This indicator measures the percentage of all orders delivered by the requested delivery date, as indicated in the PO/contract during a defined period of time.
Formula
number of orders delivered by requested date_____________________________________________________________
total number of orders delivered *100
Purpose and Issues
Logistics managers can use this indicator to monitor supplier response time on shipments over a specified period of time.
SUPPLIER/SOURCING
19
SUPPLIER/SOURCING
Data Sources Data Requirements
Procurement records
s
Customs records.
POs/contracts
Total number of orders delivered during specified time period.
Receipt record
Delivery dates as indicated in
Number of orders delivered by requested date
B. Supplier Lead-Time Variability
Definition
This indicator is the average of the absolute percentage differences (APD) between the supplier’s forecasted lead d the actual lead time for each order placed with the supplier. This indicator can be calculated for any
supplier that supplies products to t sting facility. It can be measured over any time period, but one year is typical; usually measured in days.
time anhe reque
Formula
∑ APD
number of orders
*100 Where APD = forecasted lead time – actual lead time
_____________________________________________________
actual lead time
Purpose and Issues
During quanprocuremen
tification exercises, it is i mate the expected lead time to determine when the next t cycle should begin time differs significantly from the actual lead time, stock
.
es not measure the total PO cycle time, which is defined en ouse. It includes time
put together the PO and the time on the back end to get the item from the port to the warehouse.
mportant to esti. If the forecasted lead
excesses or shortages may o
This indicator measures onlyas the time from wh
ccur. It is important that these two figures be as close as possible
the supplier’s lead time; however, it do the quantification of the PO begins until the products are received by the wareh
on the front end to
Data Sources Data Requirements
Review of recordsor customs or at the requesting facility (if available).
r document that shows date when the .
Customs declaration showing the date the order was received in the country.
a t the supplier Shipping invoice or other similaPO was received by the supplier
Related Indicators
Average lead time per order:
∑ (date purchase orders/contracts signed – date orders shipped) ______________________________________________________________________________________
total number of orders placed during a specified time period
20
COST/FINANCIAL tal Supply Cost A. To
Definition
This indprocureme
icator is used to calculate the country’s costs related to supply planning, supplier management, and nt execution over a defined period of time.
Formula
Cost of personnel + cost of telecommunications + cost of office space + cost of computers dedicated to procurement + other related costs over a defined period of time
Purpose and Issues
Monitoring the costs associated with th helpful for cost containment and to monitor nd cost-effectiveness of proc nnel or procurement agents.
e procurement process can be urement persothe efficiency a
Data Sources Data Requirements
Human resources records
Billing statements
Accounting reports.
Total handling costs.
Related Indicators
Total supply cost (as defined above) per PO executed, during a defined period of time.
PRODUCTIVITY A. Supplier Fill Rate
Definition
This indicator measures a su orders complet rms of items and quantity, as defined in the nite period of time. In some cases, agreements can be made between supplier and
an order into multiple shipments but still be received, in full, by a specified date, or that
pplier’s ability to fill ely in tePO/contract, during a defirecipient to divide substitutes can be made. Any such agreements should be considered.
Formula
number of o rder lines/SKUs/cases shipped in initial shipment
total quantity ordered *100
Purpose and Issues
This indicator measures the ability of the supplier to fill POs correctly. Shipments should always be checked against the shipping notice and the PO. What was shipped may not be what was ordered. Even though a supplier may supply products only a few times a year, in most cases, the supplier should be expected to fill orders completely, or almost completely, unless alternate agreements have been made, as noted above. For suppliers that are routinely noncompliant, it may be necessary to identify which items are causing the most problems and find another mechanism for obtaining those items.
SUPPLIER/SOURCING

SUPPLIER/SOURCING
Data Sources Data Requirements
Review of records at facility or supplier Number of order lishipment POs made with the supplier showing
amounts requested
Shipping invoices or ot
items and Total quantity
her such documents that nd amounts shipped (or physical
nes/SKUs/cases shipped in initial
ordered in original PO
Dates that orders were received by the supplier and dates when they were shipped. show items a
count of received shipment).
Related Indicators
Percentage of POs placed that are filled correctly by external supplier and are on time
This indicator measures the ability of the supplier to fill POs correctly in terms of items and quthat they are delivered within a specified delivery period.
antity and to ensure
Other criteria can be added to the indicator to specify that a delivery order is compliant. In some cases, as many as 10 different criteria are used to evaluate whether an order is compliant. Orders that are compliant are considered to be perfect, and what is being measured is the percentage of the perfect POs.
21

22

23
Warehousing/Storage QUALITY
entory Accuracy Rate A. Inv
Definition
This indicator measures the percentage of warehouse or storage locations that had no inventorwhen stock car
y discrepancies ds were compared to a physical inventory count out of the total number of locations under review,
defined period of time. Alternatively, this indicator can be calculated for a single facility as the percentage of months or q tal number of months or quarters in the review period (e.g
during auarters with no inventory discrepancies out of the to
annual). .,
Formula
number of storage locations with no inventory discrepancies
total number of storage locations under review *100
number of months/quarters with no inventory discrepancies
total number of months/quarters in review period *100
Purpose and Issues
The inventory accuracy rate can be used to assess overa trol performance for a group of storage l for managers to know
stock at any given point in time and to know when a new order must be placed to replenish analysis can hel ng problems with
t; the analysis can
ll inventory confacilities or for one storage facility ohow much they have in
ver a set of review periods. Inventory accuracy is critica
stock. This discrepancy p managers identify storage locations that are haviinventory managemen lead to opportunities for improvement.
Data Sources Data Requirements
Stock cards and inventory reports from rmation systems, etc.
orage location listing.
Inventory discrepancy calculations for each storage facility included in review
ocations under review
Total number of months/quarters in review period.
info
Physical inventory report Total number of storage l
St
B. Put-Away Accuracy Definition
This indicator is the percentage of items placed in the correct location or bin in a warehouse or storage area.
Formula
number of items in correct location
total number of items *100
Purpose and Issues
This indicator measures a facility’s ability to stock items in the correct location so they can be quickly and easily located. This can provide an indication of whether staff is practicing good warehousing practices and guidelines.
This indicator can be measured during a site visit or by making periodic checks at the facility over a specified length of time. For example, during a quarterly period, the number of times items were found in the wrong location.

24
Data Sources Data Requirements
Site visits for visual inspectionitems
of location of Number of items in their correct location storage area
Map or guidelocations for p
lines of intended storage roducts.
in the
Total number of items in storage area under review.
Related Indicators
number of items in correct location and also in the correct quantities
total number of items *100
C. Picking Accuracy Rate Definition
This indicator is defined as the percentage of items or lines picked accuratelythe appr
(i.e., the correct items and quantities) from storage based then placed into opriate container. on a request or packing list, and
Formula
number of items of lines picked without errors with correct items and quantities _________________________________________________________________
total number of items or lines picked *100
Purpose and Issues
This indicator measures whether items are om storage and placed into a container to be hipped to the requesting facility. It a reveal he ability of the facility to pick requests correctly in terms of
. Errors can result t the ordering facility. To collect data for this view of items just before sporting can be conducted to determine the
d items compared against an invoice or requisition form. It can be calculated for a single order or for all orders during a defined period of time.
accurately selected frs c n t
in stockouts or overstocks aquantity and itemindicator, a re they are loaded for tranaccuracy of picke
Data Sources Data Requirements
Order requests
unt.
Quantities ordered
Packing list
Physical co
Quantities picked.
se Accident Rate D. WarehouDefinition
This indicator measures the total number of accidents occurring in a warehouse or other storage facility during a defined period of time.
Formula
number of accidents occurring at the storage location per hour/day/week/month/quarter
Purpose and Issues
This indicator can reveal poor warehouse management and practices, untrained staff, unclear safety guidelines, faulty equipment, or poor conditions. It can help pinpoint areas needing improvement by determining the cause of the accidents—because of human error or other reasons. With intervention, accidents should decrease in frequency.
WAREHOUSING/STORAGE

25
Data Sources Data Requirements
Interviews with warehouse staff
ts
houses.
All accident reports over a specified period of time.
Incident repor
Visit of ware
Related Indicators
Average number of accidents per hour/day/week/month/quarter
E. Defined Security Measures Definition
This indicator measures whether there are guidelines or standard operating procedures (SOP) in place that provide instructions to prevent theft or leakage at a given storage location.
Formula
Are warehouse guidelines or standards in place that define the security measures? (yes/no)
Purpose and Issues
Implementing proper security measures at storage facil p prevent theft and leakage of products, thus increasing the availa ed and detailed
ities to follow to e ility is secure and the products protected. Evaluators should also assess the quality or thoroughness of these guidelines or SOPs and the level of adherence by the facilities.
ities will helsaving money and bility of commodities. The program should have defin
nsure that the facinstructions for facil
Data Sources Data Requirements
Security measures
Interviews with staff.
Warehouse or storage location SOPs and/or security guidelines.
RESPONSE TIME A. Warehouse Order Processing Time
Definition
This indicator measures the average amount of time (e.g., minutes, hours, days, weeks) from the moment an order is received at n be calculated for a
a specific product. the storage facility until the time the order is actually shipped to the client. The order processing time caspecific shipping facility averaged across orders or on average for orders to a specific client or for
Formula
∑ (date & time order is shipped – date & time shipping order was received) ____________________________________________________________
total number of orders processed
Purpose and Issues
This indicator helps monitor the order processing performance and the efficiency of a shipping facility. It also helps identify opportunities for improving staff performance in order management and a facility’s response time.
WAREHOUSING/STORAGE
26
Data Sources Data Requirements
Order requests
Shipping log reports.
pping order was received
Total number of orders processed.
Date and time shi
Date and time order is shipped
B. Customs Clearance Cycle Definition
This indicator measures the amount of time (e.g., minutes, hours, days, weeks) from the momein the port or airport until the moment that it clears customs, arrives at the
nt the cargo arrives warehouse, and is ready to be put
away. This indicator can be calculated by product or supplier, or the average across products or suppliers, during a d period of time. If other factors affect getting the product from the port to the warehouse, such as a lack of
equipment at the ific amount of time that the t to the customs office until the customs office cleared and released them.
specifie port facility, evaluators can scale this calculation down to the spec
products were sen
Formula
Warehouse arrival date & time – port/airport arrival date and time
Purpose and Issues
The indicator can help identify delays research, the causes involved—such paperwork, poor materia n, etc. Based on that, opportunities nt can be identified and actions taken to minimize the amount of time required for products to clear
ailable at the warehouse.
in customs clearance and, with additionalas incomplete l description, missed certificate of origifor improvemecustoms and to be made av
Data Sources Data Requirements
Packing lists, invoices, entry notice Cargo Receiving report
arrival date at the port/airport Cargo arrival date at the warehouse.
Customs reports.
Related Indicators
Average customs clearance time per month/quarter/year
Average customs clearance time for a specific product per month/quarter/year
C. Put-Away Time Definition
This indicator measures the amount of time it takes from when a product(s) has been unloadearriving at a warehouse or other storage location to when it is stored in its designated place and is ready for
d from a truck after
picking. This indicator can be calculated by product, or by shipment, or as an average across products or shipments, during a specified period of time.
Formula
Date and time product(s) unloaded – date and time product(s) stored in designated spot
Purpose and Issues
Measuring the put-away time can help improve productivity by monitoring the efficiency of the put-away processes and the staff responsible for the task. It can help managers identify work conditions or processes that need improvement, as well as the need for staff training.
WAREHOUSING/STORAGE
WAREHOUSING/STORAGE
Data Sources Data Requirements
Shipment receipt vouchers
Time sheet for put-away activity per employee
es.
Quantity of pallets or volume in cubic meters.
Number of employe
Put-away time in hours
Related Indicators
Average put-away time for all products per month/quarter/year
Average put-away time for a specific product or shipment per month/quarter/year
COST/FINANCIAL A. Total Warehousing Cost Definition
The total warehousing costs collect all costs related to warehousing, such as labor costs and warehouse rent; or mortgage ts, utility bills, equipment, material- and information-handling systems, etc. It also includes costs related to
syst ured annually.
This indicator can also be calculated as er piece/SKU/product/line by dividing the total warehousing cost by the quantity of stocked u s in cubic meters (m3), per storage area (m2), or program.
paymenems, supplies, and any other material with specific use in warehousing. This indicator is usually meas
t st pnits or by the volume of stocked item
he total warehousing co
Formula
Total warehousing cost = sum (labor, space, utilities, material, equipment, information systems, etc.)
total warehousing cost ______________________________
quantities of stocked units or m3 or m2
Purpose and Issues
Using this indicator, managers can mo ifferent components in a warehouse, as well as compare ween different warehouses ive warehouses, and can also lead to an
analysis of best practices.
Dividing total warehousing costs b ate storage usage, cost-effectiveness, etc. By dividing the warehousing costs per SKU, th ent detailed cost visibility.
nitor the costs of dcosts bet . It can help identify the most cost-effect
y units or area can also indicis indicator provides the management team with excell
Data Sources Data Requirements
Yearly accounting sheets
Payroll.
Labor cost
Warehousing space cost (per m2)
Cost of warehousing material
Equipment costs
Total inventory on hand in units (or volume m3).
Related Indicators
Average inventory cost per storage point
27
28
ue of Product Damaged in the Warehouse B. ValDefinition
This indwareho
icator calculates the value of products damaged, during a defined period of time (usually one year), in the use as a percentage of the value of all shipped products during that period.
Formula
total value of damaged products _____________________________________________
value of shipped products *100
Purpose and Issues
Inappropriate warehousing conditions or han lead to inventory damage. This indicator can help ducts damaged into help identify the causes, as well as, the
damages, inc manpower, training, etc.
dling of products can put the value of pro perspective and can be used toactions needed to avoid such luding better infrastructure,
Data Sources Data Requirements
Invoices from vendors
Inventory reports, issue vouchers
Stock records
Accident reports
Value of damaged products
Value of shipped products.
Damage reports.
PRODUCTIVITY A. Storage Space Utilization Definition
Storage space utilization indicates the percentage of the total storage space actually being used out of the total storage space available.
Formula
total storage space in use (m3) __________________________________________
3 *100
total storage space available (m )
Purpose and Issues
Based on this indicator, managers can monitor storage capacity and utilization at a warehouse. By assessing storage space utilization, managers can look for opportunities to improve storage capacity (e.g., remove expired products, dejunking, reorganizing) and maximize the use of the storage space, or request a re-evaluation of layout, material flow, shelves disposition, etc.
Data Sources Data Requirements
Inventory reports
Warehouse floor plan
Site visit.
Total in use storage area: volume of inventory in stock (m3)
Total storage space capacity (m3).
WAREHOUSING/STORAGE

WAREHOUSING/STORAGE
29
its Moved Per Person-Hour B. Un
Definition
This indicator measures the number of units (e.g., boxes, pallets) or weight moved during a defined period of time, son-hour, for each person working during that period. It can be considered both when receiving and g inventory.
per pershippin
Formula
total number of units moved (or weight) ________________________________________________________
total number of person-hours
Purpose and Issues
This indicator helps measure material handl eriod of time (hours, days, or months). It helps be a source for
ning and measur
ing productivity for a pcompare productivity levels in different working shifts or different warehousing locations. It can
ing its effectiveness. identifying needs for trai
Data Sources Data Requirements
Receiving reports, invoices, packing lists Number of units moved (receiving or shipping) during a specified time period, per person
s spent moving material during a specified time period.
Time sheets, punch cards. Total persons and hour
C. Percentage of Storage Space Dedicated to Product Handling Definition
This indicator measures the percentage of total storage area that is dedicated specifically to product handling g, packing, loading, and dispatching). (receiving, unloadin
Formula
storage area dedicated to product handling (m2) ________________________________________________________________
2 *total storage area (m )
100
Purpose and Issues
It is recommended that a certain per dicated specifically to product handling for an average volume of products. The amount of handing space needed depends on the volume of product moved through the storage area and the equipment required to move those products. This dedicated area is critical for the efficient operations of the storage facility to allow for organized and efficient receiving, unloading, packing, loading, and dispatching of products; and to protect products from the elements during receiving and packing.
centage of the storage area be de
Data Sources Data Requirements
Site visit
Storage area map/measurements.
Storage area dedicated to product handling (m2)
Total storage area (m2).

30

31
ry Management/LMIS/Customer Response Invento
QUALITY A. Stockout Rates
Definition
This indicator measures the percentage of facilities (e.g., service delivery points [SDP], warehouses) that experienced a stockout of a specific product that the site is expected to provide, at any point, within a defined
of time (e.g., the past six or 12 months). Stockout rates can be calculated for a single product across facilities or aggr or with a certain region. It can be measured over any time
period egated for all products carried by a certain type of facility, period of time but one year is typical.
Formula
number of facilities that experienced a stockout of a specific product_______________________________________________________
total number of facilities that are expected to offer that product *100
Purpose and Issues
This indicator measures product availability—or absence—over a period of time; it representswith a full range of products and services. Of c
the overall ability of gram to meet client’s needs ourse, if this indicator is
vaila tion with other use, to avoid stockouts, facilities can ration supplies.
a facility or proused, stock records must be aindicators, such as the stocked accordin
ble and maintained regularly. It should also be used in conjuncg to plan indicator, beca
Data Sources Data Requirements
Site visits (physical inventories) Number of facilities that expe
LMIS records
Supervision records, if available. that product.
rienced a stockout of a specific product during a defined period of time
Total number of facilities that are expected to offer
Related Indicators
Percentage of facilities with a stockout of a product on day of site visit/physical inventory (point in time)
Percentage of facilities fully stocked (all products) on day of site visit
Average number of products out of or in stock on day of site visit
Average number of times each product experienced a stockout in the past six or 12 months
Average duration of stockouts
32
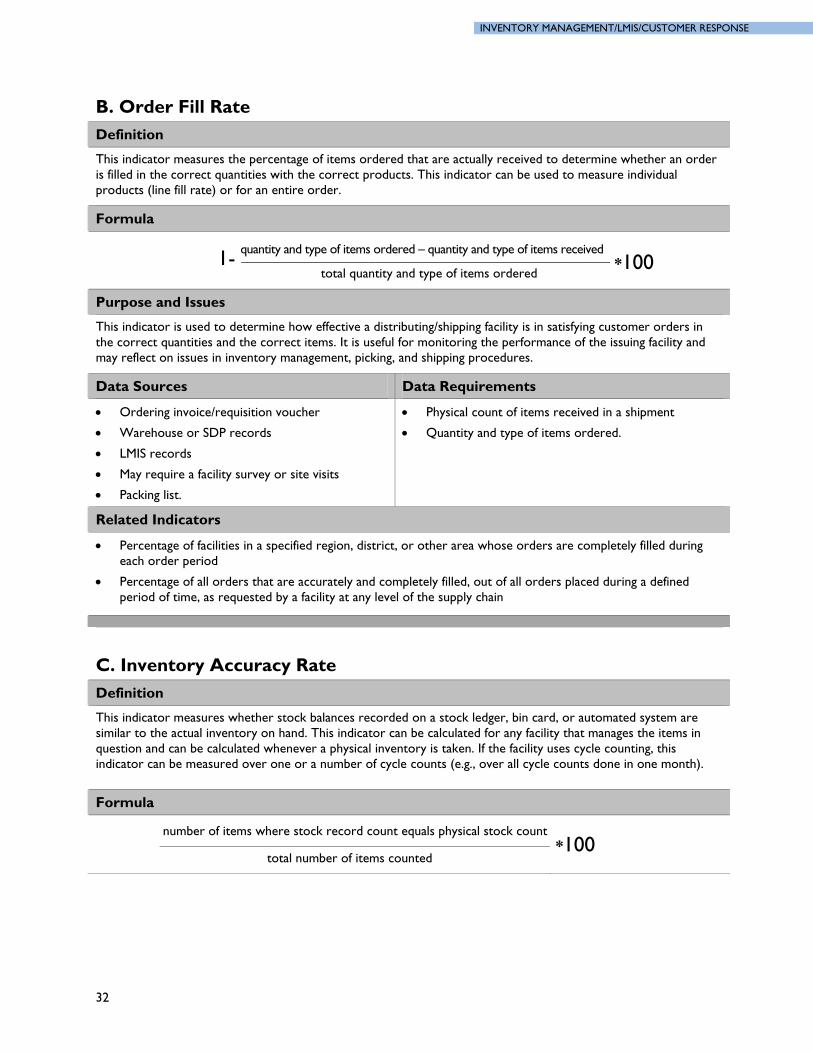
der Fill Rate B. OrDefinition
This indicator measures the percentage of items ordered that are actually received to determine whether an order the correct quantities with the correct products. This indicator can be used to measure individual
fill rate) or for an entire order. is filled inproducts (line
Formula
1- quantity and type of items ordered – quantity and type of items received ________________________________________________________total quantity and type of items ordered
*100
Purpose and Issues
This indicator is used to determine how effe ping facility is in satisfying customer orders in r of the issuing facility and
ventory .
ctive a distributing/shipthe correct quantities and the cor ect items. It is useful for monitoring the performancemay reflect on issues in in management, picking, and shipping procedures
Data Sources Data Requirements
Ordering invoice/requisition voucher
r SDP records
facility survey or site visits
Physical count of items received in a shipment
Quantity and type of items ordered. Warehouse o
LMIS records
May require a
Packing list.
Related Indicators
Percentage of facilities in a specifeach order period
ied region, district, or other area whose orders are completely filled during
entage of all orders that are accurately and completely filled, out of all orders placed during a defined Percperiod of time, as requested by a facility at any level of the supply chain
C. Inventory Accuracy Rate Definition
This indicator measures corded on a stoc , bin card, or automated system are similar to the actual inventory on hand. This indicator can be calculated for any facility that manages the items in question and can be calculated whenever a physical inventory is taken. If the facility uses cycle counting, this indicator can be measured over one or a number of cycle counts (e.g., over all cycle counts done in one month).
whether stock balances re k ledger
Formula
number of items where stock record count equals physical stock count ___________________________________________________________________________________________________
total number of items counted *100
INVENTORY MANAGEMENT/LMIS/CUSTOMER RESPONSE

33
Purpose and Issues
This indicator measures the accuracy of data on product stock levels at a facility and provides information on how tial for
done on a fixed is
ted annually). Annual th greater frequency.
record accuracy:
s received and issued (by picker if manual system, by data entry person if
Incorrect items or amounts picked by the picker
t counting of amounts received
accurately the facilities are tracking their inventories. Having accurate stock-on-hand values is essenforecasting and procurement exercises, as well as for proper picking and distribution.
This indicator is generally calculated during a physical inventory. Physical inventories can be they can be done with higher frequency so that each item schedule (e.g., all items are counted annually), or
counted according to its own schedule (e.g., aspirin is counted quarterly; Norplant is counphysical inventories are likely to reveal more items in error than counts that are done wi
The following are possible reasons for poor
Incorrect recording of amountautomated system)
Incorrec
Mathematical errors (by data entry person).
Data Sources Data Requirements
Facility survey or site viinventory management
sits to facilities being monitored and facility records
em, stock ledger, bin card, or other inventory management h stock balances are maintained
Physical counts o
Stock balances on LMIS fo
Quantities of stock on hand
Quantities recorded in the system. Automated syst
recording instrument on whic
f items in the facility
rms.
Related Indicators
Accuracy in sto
(stock record count – physical stock count)________________________________
ck recordkeeping:
____________________________
physical stock count *100
Accuracy in transferring information to the LMIS reporting form:
(LMIS record count – stock record count)___________________________________
stock record count *100
D. Stocked According To Plan Definition
This indicator measures the percentage of facilities with stock levels above the established minimum level and below the established maximum level for each full-supply method, brand, and product of interest, at a specified point in time (e.g., the day of a site visit).
For full-supply products, if stock levels are below the established minimum level, evaluators should record whether an outstanding order exists for replacement stock.
Evaluators can report the indicator at the facility level, or can aggregate it for a sample of facilities, or for the entire program. At any level, evaluators should calculate and report the indicator separately for each product of interest to ensure that each product receives an individual measure. Averaging all products for an average stock-level adequacy is not recommended because oversupply in one product can cancel out undersupply in another product, falsely implying that the average stock levels are adequate.
INVENTORY MANAGEMENT/LMIS/CUSTOMER RESPONSE
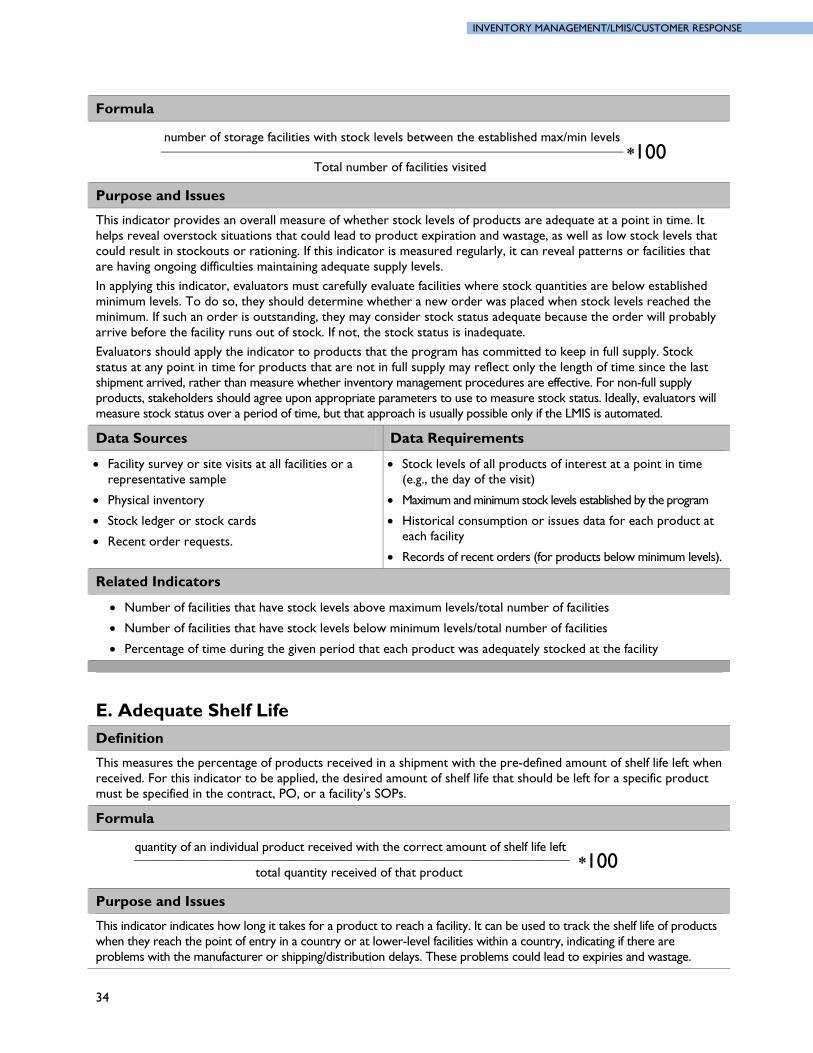
34
Formula
number of storage etween the establish in levels _____________________________________________________________________
Total number of facilities visited
*100 facilities with stock levels b ed max/m
Purpose and Issues
This indicator provides an overall measure of whether stock levels of products are adequate at a point in time. It s low stock levels that
acilities that
established k levels reached the e order will probably
keep in full supply. Stock point in time for products tha may reflect only the length of time since the last
For non-full supply . Ideally, evaluators will
atus over a perio automated.
helps reveal overstock situations that could lead to product expiration and wastage, as well acould result in stockouts or rationing. If this indicator is measured regularly, it can reveal patterns or fare having ongoing difficulties maintaining adequate supply levels.
In applying this indicator, evaluators must carefully evaluate facilities where stock quantities are below minimum levels. To do so, they should determine whether a new order was placed when stocminimum. If such an order is outstanding, they may consider stock status adequate because tharrive before the facility runs out of stock. If not, the stock status is inadequate.
Evaluators should apply the indicator to products that the program has committed to status at any t are not in full supplyshipment arrived, rather than measure wproducts, stakeholders should agree up
hether inventory management procedures are effective. on appropriate parameters to use to measure stock status
measure stock st d of time, but that approach is usually possible only if the LMIS is
Data Sources Data Requirements
Facility survey or site visits at alample
at a point in time (e.g., the day of the visit)
stock levels established by the program
n or issues data for each product at
Records of recent orders (for products below minimum levels).
l facilities or a Stock levels of all products of interest representative s
Physical inventory Maximum and minimum
Stock ledger or stock cards Historical consumptio
Recent order requests. each facility
Related Indicators
Number of facilities that have stock levels above maximum levels/total number of facilities
mber of facilities that have stock levels below minimum levels/total number of facilities
e facility
Nu
Percentage of time during the given period that each product was adequately stocked at th
E. Adequate Shelf Life Definition
This measures the percentage of products received in a shipment with the pre-defined amount of shelf life left when a specific product received. For this indicator to be applied, the desired amount of shelf life that should be left for
must be specified in the contract, PO, or a facility’s SOPs.
Formula
quantity of an individual product received with the correct amount of shelf life left _________________________________________________________________total quantity received of that product
*100
Purpose and Issues
This indicator indicates how long it takes for a product to reach a facility. It can be used to track the shelf life of products when they reach the point of entry in a country or at lower-level facilities within a country, indicating if there are problems with the manufacturer or shipping/distribution delays. These problems could lead to expiries and wastage.
INVENTORY MANAGEMENT/LMIS/CUSTOMER RESPONSE

INVENTORY MANAGEMENT/LMIS/CUSTOMER RESPONSE
Data Sources Data Requirements
Review of product expiration th
Inventory records.
lf life allowed for each product, by level
rer expiration date of product
Quantities meeting required shelf life
rough site visits Minimum amount of sheestablished by program
Manufactu
Total quantities received.
Related Indicators
Average amount of shelf life left (e.g., number of days) on received products or products shipped to lower levels
F. Stock Wastage due to Expiration or Damage Definition
This indicator is defined as the percentage of stock for a product that is unusable because of expiration or damage out of the total quantity of st product, at a defined point in time (e.g., site visit, supervisory visit, physical inventory). hat manages the products of interest. It can be measured over any w physical inventory is taken.
ock on hand of that This indicator can be calculated for any facility t
hen atime period, but is usually calculated
Formula
unusable physical stock ___________________________________________________________
total quantity of usable and unusable stock *100
Purpose and Issues
For this indicator, unusable (i.e., wasted) items are defined as those that have expired or have been damaged in such practice first-to-
t-out (FEFO) methods and properly manage commodities (i.e., without incurring damage). Reducing nly saves the organization mo ustomers receive quality products.
High expiration rates can result from sever hich depend on the product. Products with a short shelf life and the inventory
duce losses due to expiry. If losses are due to should be reviewed and corrected, if needed.
complete, picture of wastage because it does not incorporate wastage
a way that they are no longer safe to use. This indicator measures the ability of the personnel to expire, firswastage rates not o ney but also helps ensure that c
al factors, w with a longer shelf life. The length of the pipelinerequire higher turnover rates than products
policies can be adjusted to accommodate short shelf life items and redamage, then transport and storage practices
This indicator provides an important, but incaused by loss.
Data Sources Data Requirements
Facility survey site visits to facilities being studied
Physical counts of usable and unusable items
Automated system, stock ledger, bin card, or other recording instrument on which stock balances are maintained.
Quantity of product wasted due to expiry and damage
Quantity of all stock.
Related Indicators
Percentage of unusable stock that is unusable because of expiration
Percentage of unusable stock that is unusable because of damage
Value of unusable stock as a percentage of total item purchases
Ratio of usable stock to unusable stock
35
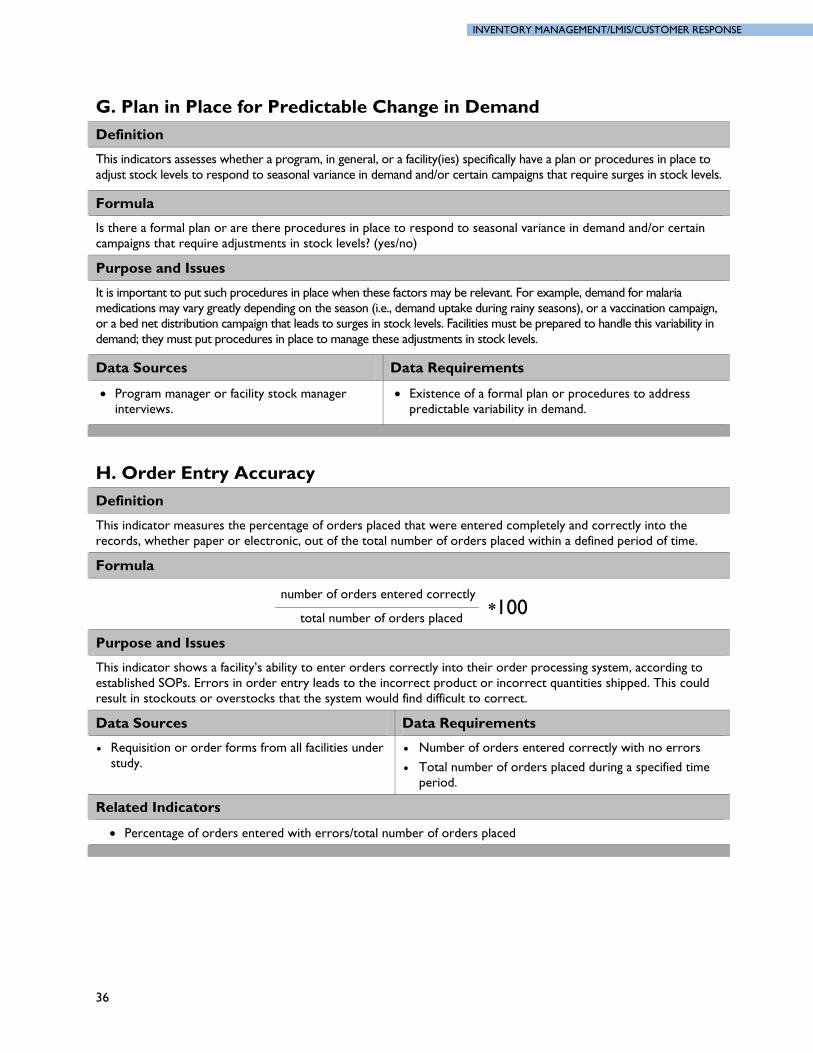
INVENTORY MANAGEMENT/LMIS/CUSTOMER RESPONSE
36
n in Place for Predictable Change in Demand G. PlaDefinition
This indicators assesses whether a program, in general, or a facility(ies) specifically have a plan or procedures in place to ock levels to respond to seasonal variance in demand and/or certain campaigns that require surges in stock levels. adjust st
Formula
Is there a formal plan or are there procedures in place to respond to seasonal variance in demand and/or certain campaigns that require adjustments in stock levels? (yes/no)
Purpose and Issues
It is important to put such procedures in place when these factors may be relevant. For example, demand for malaria ay vary greatly depending on th ptake during rainy seasons), or a vaccination campaign,
to handle this variability in medications m e season (i.e., demand uor a bed net distribution campaign that ldemand; they must put procedures in place to
eads to surges in stock levels. Facilities must be prepared manage these adjustments in stock levels.
Data Sources Data Requirements
Program manager or facility stock manager ews.
Existence of a formal plan or procedures to address predictable variability in demand. intervi
H. Order Entry Accuracy Definition
This indicator measures the perce that were entered completely and correctly into the aper or electronic, out of the total number of orders placed within a defined period of time.
ntage of orders placedrecords, whether p
Formula
number of orders entered correctly ___________________________________________________ *100
total number of orders placed
Purpose and Issues
This indicator shows a facility’s ability to en correctly into their order processing system, according to Errors in order entry leads to the incorrect product or incorrect quantities shipped. This could
icult to correct.
ter orders established SOPs.result in stockouts or overstocks that the system would find diff
Data Sources Data Requirements
Requisition or order forms from all facilities under study.
Number of orders entered correctly with no errors
Total number of orders placed during a specified time period.
Related Indicators
Percentage of orders entered with errors/total number of orders placed

INVENTORY MANAGEMENT/LMIS/CUSTOMER RESPONSE
37
ice Accuracy I. Invo
Definition
This indby supp
icator measures whether invoices accurately reflect orders placed in terms of product, quantities, and price lier, during a specified period of time.
Formula
number of invoices with perfect match of items ordered _______________________________________________
total number of invoices processed
Purpose and Issues
This indicator are consistent
reveals whether suppliers are correctly umenting, and billing for orders. If the suppliers ly providing inaccurate invoice payments or underpayments for products. It can
and, ul her examination to
preparing, docs, it may result in over
also impact budget planning timately, the procurement process. Problems will require furtidentify the root cause.
Data Sources Data Requirements
Invoices provided by the supplier
Orders made to the supplier
Packing list.
Number of invoices with perfect match of items ordered
otal number of invoices processed during a specified eriod of time.
Tp
RESPONSE TIME A. Order Entry Time Definition
The indicator measures the amount of time between when an order is received and whenor electronic system. Measurement can be performed at multiple levels of a supply chain and ca
it is entered into a paper n be monitored on
orders, during period of time. an order-by-order basis or averaged across a defined
Formula
Time and date when order was rec information system eived – time and date when order was entered into the
Purpose and Issues
The indicator measures the time it takes for pending orders to be entered into a system so the order can be executed. This measurement allows system supervisors to monitor delays in recording orders.
Data Sources Data Requirements
Time stamped order or requisition forms
System documentation.
Time and date when order was received
Time and date when order was entered into LMIS.
Related Indicators
Average order entry time across all orders placed at a specific facility during a defined period of time

INVENTORY MANAGEMENT/LMIS/CUSTOMER RESPONSE
38
der Turnaround Time B. OrDefinition
This indicator is the average amount of time it takes for a facility to fill an order, from the date each order is d by the facility until the date the order is shipped to the customer. This indicator is usually recorded in
calculated over any period of time, but is usually recorded over one year. receivedays. It can be
Formula
sum of the number of days to process all orders received ______________________________________________
total number of orders processed
Purpose and Issues
This indicator measures the efficiency with which requests are processed because it measurwhen the request was received by the distribution source and the time the order was actuallyturnaround time will improve customer satisfaction and, more important, improve produccosts for staff time. In addition to measuring the mean turnaround time, it is possible to break t
es the time between shipped. Improving
tivity and thus reduce his turnaround time
onent parts (pick time determine where most of the processing time is spent c ndicator by itself. In
easure the d small.
into its comp , loading time) and to and, thus, where resour es could be reallocated. Each of these component parts could be an icases in which the facility has estabpercentage of orders shipped
lished a turnaround time, this indicator can be adjusted to m on time. It may also be useful to group orders by size—large, medium, an
Data Sources Data Requirements
Order or requisition forms
pplying /shipping invoices
Receipt dates for each order placed during a specified time period
Issue/ship dates for each order placed during a specified time period
Total number of orders processed during that period.
Issue vouchers of the sufacility
Packing list.
C. Order Lead Time Definition
This indicator meafacility to a higher-
sures the average amount of time it takes from when an order is placed from a lower-level level facility to when the ordering facility receives its shipment during a specified period of time.
This indicator is usually recorded in days but can be calculated over any period of time.
Formula
su__
m of the number of days be re placed and when orders were received ______________________ __________________________________
d
tween when orders we__________________
total number of orders place
Purpose and Issues
This indicator measures the efficiency with which requests are processed and the efficiency of the distribution and transport systems used because it measures the time between when the request was sent to the distribution source and the time the order was actually received by the requesting facility. Knowing order lead time and reducing order lead time variability will improve a facility’s ability to manage its inventory and plan shipments with more confidence.
Data Sources Data Requirements
Order or requisition forms
Receipt of delivery.
Dates when orders were placed
Dates when orders were received
Total number of orders placed during a specified period of time.

39
COST/FINANCIAL entory Holding Cost A. Inv
Definition
This indicator measures the annual cost of carrying inventory at a specific facility. It is calculated by adding up all capital and ital costs of carrying products. Costs may include storage costs (e.g., rent, mortgage payments, and utility bills),
t (pilfered), labor, security, and administration. non-caphandling, insurance, taxes, damaged or expired products, lost produc
Formula
Annual inventory holding cost = Sum of all capital and non-capital costs
Purpose and Issues
Knowing thesupplies, to
yearly inventory holding cost e pervisor to maintain the correct quantity of better understand the costs of carrying inventory, and to budget more accurately for future planning.
ulate the ratio of ventory value (see ) to monitor how the holding costs compare to the value of inventory in stock.
nables the inventory su
Managers can also calc the inventory holding cost to the average annual inRelated Indicators
Data Sources Data Requirements
LMIS reports.
Yearly cost for each capital and non-capital costs. Yearly accounting sheets
Inventory records
Related Indicators
Ratio of annual inventory holding cost/average annual inventory value
Total annual inventory holding cost per SKU/line/product
B. Value of Unusable Stock Definition
This indicator le, due to damage or expiry, as a percentage of total items purc e value of all wasted units of a certain product in a set period and divides that number by the value of all units of the same product purchased during the same period
ercentage of total items purchased that were not used during the defined period. It can be
measures the total value of stock that was unusab takes thhased during a defined period of time. It
to determine the pmeasured over any time period but is usually calculated when a physical inventory is taken.
Formula
value of wasted units per product ________________________________________
value of total units purchased of same product *100
Purpose and Issues
This indicator can help stock managers monitor the percentage of their purchases that are lost to damage or expiry. While having no losses is preferred, some losses may occur and the percentage of these losses to the total value procured can be an indicator of deficiencies in storage or inventory policies and practices, such as a failure to practice FEFO. In addition, monitoring the percentage value of expired product will enable managers to adjust order quantities to avoid wastage of product and monetary losses. Reducing wastage rates not only saves the organization money but also helps ensure that customers receive quality products.
This indicator is an important but incomplete picture of wastage; it does not incorporate wastage caused by loss.
INVENTORY MANAGEMENT/LMIS/CUSTOMER RESPONSE

40
Data Sources Data Requirements
Inventory records
Stock ledger, bin card, or other recording during a specified time per
instrument on which stock balances are maintained
d expired products iod
Total number of units purchased during a specified time period
Facility survey site visits to facilities being studied. Cost per smallest unit.
Total number of units of damaged an
Related Indicators
Ratio of unusable physical stock count per product/usable physical stock count per same product
C. Value of Unaccounted Stock Definition
This indicator measures the value of stock that is missing or unaccounted for as a percentage of the total current inventory for each product managed. Similar to the value of wasted stock, this indicator measures the value of product that is no lon n ted losses. This indicator would typically be calculated during a phy g matching stock records to the physical count.
ger available to the client due to u accouners are sical inventory when stock mana
Formula
value of missing units ________________________________
value of total *100
units currently in stock
Purpose and Issues
This indicator is useful for estimating e of reordering sufficient supplies, as well as determining if there is a problem with inventory management (i.e., poor recordkeeping) or pilfering of supplies). It should be calculated whenever there is a physical inventory.
the losses from missing product for the purpos
Data Sources Data Requirements
Inventory records
Resupply vouchers.
Value of missing pro
Total value of product currently
duct from inventory
in stock.
D. Average Response Cost Definition
This indicator measures the costs associated with fulfilling resupply orders. Costs may include labor, fulfillment of placed
lates the total costs associated with fulfilling resupply orders divided by the total number of orders processed in the same time period, to determine an average response cost per order.
communications expenses, and space and systems used in the processing, communication, andorders. This calcu
Formula
total costs of fulfilling orders ________________________
total number of orders
Purpose and Issues
The result is an indication of the efficiency at which orders are fulfilled and, specifically, the cost-efficiency of order processing procedures.
INVENTORY MANAGEMENT/LMIS/CUSTOMER RESPONSE
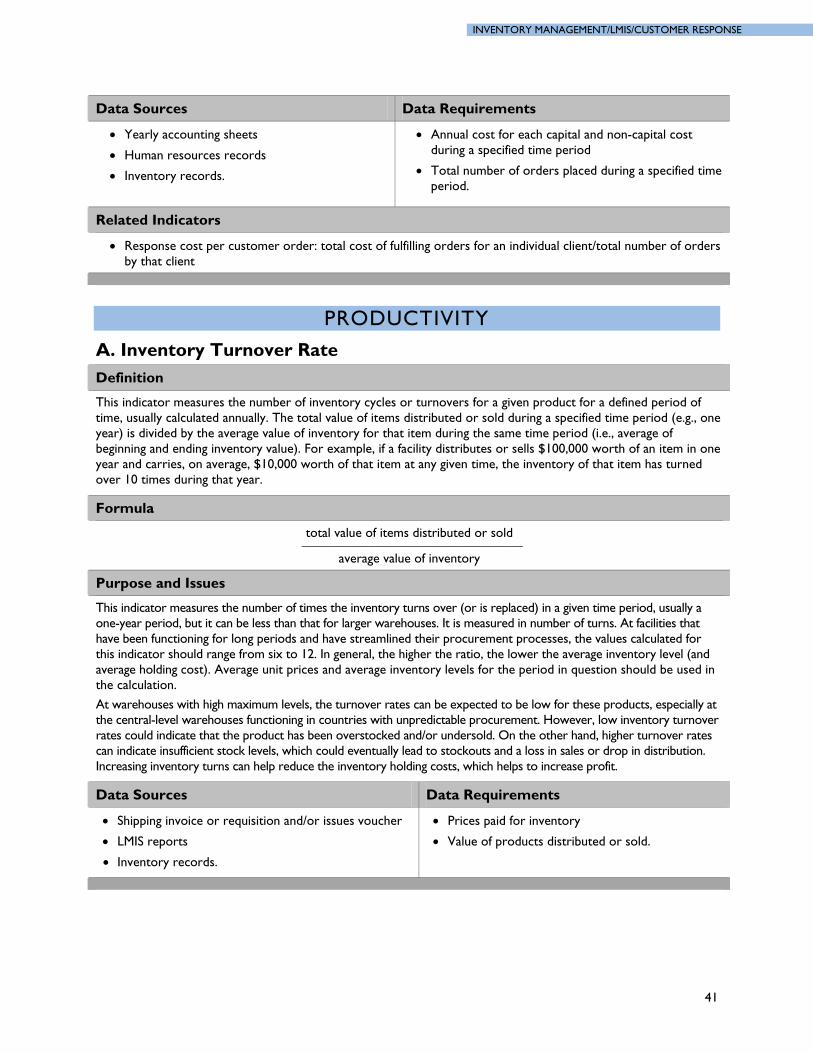
INVENTORY MANAGEMENT/LMIS/CUSTOMER RESPONSE
Data Sources Data Requirements
Yearly accounting sheets
urces records
rds.
n-capital cost
Total number of orders placed during a specified time period.
Human reso
Inventory reco
Annual cost for each capital and noduring a specified time period
Related Indicators
Response cost per customer order: total cost of fulfilling orders for an individual client/total number of orders by that client
PRODUCTIVITY
A. Inventory Turnover Rate Definition
This indicator measures the number of inventory cycles or turnovers for a given product for a defined period of ually calculated annually. The total value of items distributed or sold during a specified time period (e.g., one divided by the average value of inventory for that item during the same time period (i.e., average of
beginning and ending invento stributes or sells $100,000 worth of an item in one year and carries, on average, $10,0 t any given time, the inventory of that item has turned
ng that year.
time, usyear) is
ry value). For example, if a facility di00 worth of that item a
over 10 times duri
Formula
total value of items distributed or sold _________________________________
average value of inventory
Purpose and Issues
This indicator measures the number of times the inventory turns over (or is replaced) in a given timone-year period, but it can be less than that for larger warehouses. It is measured in number of turnhave been functioning for long periods and have streamlined their procurement pr
e period, usually a s. At facilities that
ocesses, the values calculated for this indicator should range from six to 12. In general, the higher the ratio, the lower the average inventory level (and
ing cost). Average unit prices and av for the period in question should be used in
es with high maximum levels for these products, especially at arehouses functioning in countries with unpredictable procurement. However, low inventory turnover
rates could indicate that the product has been overstocked and/or undersold. On the other hand, higher turnover rates can indicate insufficient stock levels, which could eventually lead to stockouts and a loss in sales or drop in distribution. Increasing inventory turns can help reduce the inventory holding costs, which helps to increase profit.
average hold erage inventory levels the calculation.
At warehous , the turnover rates can be expected to be lowthe central-level w
Data Sources Data Requirements
Shipping invoice or requisition and/or issues voucher
LMIS reports
Inventory records.
Prices paid for inventory
Value of products distributed or sold.
41
42
entory Velocity B. InvDefinition
Inventory velocity is the average amount of time a product remains in inventory. This indicator is mehours or days that elapse from the receipt of a product until the time it is issued
asured as the number of or dispensed to a client. Inventory velocity
ucts can be calculated by adding the total amount of elapsed time (e.g., hours, days) different batches of a product spend in inventory dividefor prod
d by the number of batches received during the specified period of time.
Formula
Sum of the amount of time different batches of a product spend In inventory ______________________________________________________________ total number of batches of that product received during the review period
Purpose and Issues
Calculating incourse of a review per
ventory velocity provides an av ong different products are kept in inventory over the iod (e.g., one year) to give managers h products turn over slowly or quickly.
with planning the ng items should be more easily s well as planning or ith budgetary planning.
erage estimate of how lan idea of whic
This may assist layout of the warehouse or storeroom (faster moviaccessible), a dering frequency and order quantities. It may also assist w
Data Sources Data Requirements
Receipt records
Stock cards or bin cards.
Amount of time products have spent in stock
during a specified Issue records
Total number of batches receivedreview period.
C. Percentage of Orders Placed through Electronic Ordering System
Definition
This indicator measures ge of facilities with the ability to do so that place their resupply orders through an electronic ordering system. The electronic system can include computer
ource or orders sent by email, phone, fax, or other electronic communication means, depending
, over a defined period of time, the percenta
printouts at thee son what system is in place.
Formula
number of orders plac system ed through electronic_______________total numb
___________________________er of orders placed *100
Purpose and Issues
What constitutes an electronic ordering system can be a source of confusion among supervisors. Using this indicator, any electronic system where the person placing an order can use technology to expedite the ordering process is usually considered acceptable for capturing.
Data Sources Data Requirements
Reports from the electronic ordering system that record how and when orders were placed.
Evidence of how ordering was completed
List of facilities
Total number of orders placed during a defined period of time.

INVENTORY MANAGEMENT/LMIS/CUSTOMER RESPONSE
43
cility Reporting Rates D. FaDefinition
This indicator measures the percentage of facilities that complete and submit reports according to tschedule. It is calculated by adding the total number of facilities submitting a report by a certain datnumber of facilities required to send a report for a specific reporting period. Alternatively, manage
he defined reporting e divided by the total rs can decide whether
ider report completeness when calculating this indicator; in other words, only reports that are completely filled out can be counted in the numerator; or any submitted report, whether complete or incomplete, can be counted. to cons
Formula
number of facilities submitting a report by a certain date _______________________________________________
total number of facilities required to report *100
Purpose and Issues
This indicatoWithout the r
r measures the timeliness mpleteness, of the reporting of key information. eliability of timely informa e the information to fulfill resupply orders
ed action for inventory of the reports can be taken into consideration when
and, potentially, the cotion, decisionmakers may not hav
or take need management. Again, the completeness and even accuracy calculating this indicator.
Data Sources Data Requirements
LMIS reports. Dates reports submitted for most recent reporting period
Reporting schedule
Total number of facilities.

44
45
Distribution/Transport QUALITY
A. On-Time Arrivals Definition
This indicat delivery date during a defined period of time. or measures the percentage of shipments arriving on time for a set
Formula
number of shipments arriving within agreed time window______________________________________________________________________________
total number of shipments *100
Purpose and Issues
Late deliveries can cause stockouts, not only at the rece hroughout the in-country network. It can indicate ion problems in the system, suc ndicating the need to adjust schedules
er performance issues t.
iving facility, but ttransportat h as condition of vehicles, difficult terrain—iaccordingly—or driv . It can be applied to a specific product, route, or health pos
Data Sources Data Requirements
Vehicle logs Distribution schedules Invoices or requisition and issue forms indicating
Schedule of desired delivery dates Actual receipt dates according to requisition and issue
forms nts during specified time period. receipt date. Total number of shipme
Related Indicators
Average delivery time for a specific route
B. Percentage of Shipments Where Quantity Dispatched Equals Quantity Received
Definition
This indicator measures the percentage of shipments where the correct items and quantity of prodwith the vehicle match the amount received during a defined period of time.
ucts dispatched
Formula
number of shipme_________________
nts where product shipped equa_______________________________
ls product received ________________________
total number of shipments
Purpose and Issues
This measures the ability of the transport system to reliably deliver products, which can affect the quantities and items reaching a facility. Large differences can reveal problems during transit, which would need further investigation. This indicator can be measured over a specified period of time, for a specific product, route, region, or health facility.
Data Sources Data Requirements
Comparison of originating and recipient requisition and issue forms
Delivery logs Visual verification of products shipped and received.
Amount of products shipped
Amount of products received
Total number of shipments during specified time period.
DISTRIBUTION/TRANSPORT
46
rcentage of Shipments Arriving in Good Condition C. PeDefinition
This indicator measures the percentage of shipments arriving in good condition without damage to the products tures to the package, crushed package; or exposure to water damage, direct sunlight, or high
atures) during a defined period of time. (e.g., punctemper
Formula
number of shipments arriving with no damaged product ______________________________________________total number of shipments received
*100
Purpose and Issues
Products arriving undamaged prevents wastage of products, saving money and also ensuring the products are ients. High rates of damaged products ca blems in the transport system, such as f products in the loading and unl adequate protection from natural elements
ly secured in the packed correctly in a conta
available to clmishandling o
n indicate prooading processes or in
(e.g., sun, rain). It can also be an indication vehicle or not
that the vehicles are at fault, e.g., product is not properiner or vehicle.
Data Sources Data Requirements
Visual inspection of products at originating and
ct with quantity and items.
Number of shipments arriving without damage to product or packaging
Total number of shipments received during specified time period.
receiving facility
Vehicle copy of requisition and issue form ofprodu
D. Kilometers between Accidents
Definition
This indicator measures the average number of kilometers between vehicle accidents by a specific driver, vehicle, or route during a defined period of time.
Formula
total kilomet__________ers driven _________ number of accidents
Purpose and Issues
This can reveal poor transportation practices or poor road conditions; it can help pinpoint areas needing nts, whether they were caused because of human error or
other reasons. improvement by determining the cause of the accide
Data Sources Data Requirements
Interviews with drivers
Accident reports.
Total kilometers driven by a specific driver, vehicle, route
Number of accidents for this driver, vehicle, or route during specified time period.
Related Indicators
Average number of accidents per route over a period of time

DISTRIBUTION/TRANSPORT
47
e Between Accidents E. TimDefinition
This indduring a
icator measures the average amount of time between vehicle accidents by a specific driver, vehicle, or route defined period of time.
Formula
total time driven _________________ number of accidents
Purpose and Issues
This can reveal poot
r transportatio e occurring in order her they are attri
n practices and it can help pinpoint where most accidents arbutable to human error or other reasons and to take action. to investigate whe
Data Sources Data Requirements
Interviews with drivers
Accident reports.
Total amount of time driven by a specific driver, vehicle, or route during specified time period
umber of accidents for this driver, vehicle, or route uring specified time period.
Nd
RESPONSE TIME A. Average Delivery Time
Definition
This indicator measures the average or days) from when a shipment leaves a facility until it ation, for a specified warehouse, distribution point, region/district, vehicle, or route during a
, usually one year.
transit time (hours arrives at its destindefined period of time
Formula
Sum of total number of hours/d ceipt at destination for all shipments ays from dispatch to re___________________________________________________________________________number of shipments
Purpose and Issues
This indicator reflects the efficiency of the transport and distribution systems. Long transit times should be considered when planning inventory levels and shipment schedules. Monitoring average transit times for a specific region, route, or facility can also help managers improve response time and efficiency and reduce wastage.
Data Sources Data Requirements
Vehicle logs
Requisition and issue vouchers/receipt vouchers.
Total number of hours/days from dispatch to receipt for all shipments during specified time period
Number of shipments during specified time period.
48
rage Vehicle Loading/Unloading Time B. AveDefinition
This indlocatio
icator measures the average amount of time it takes to load or unload a vehicle at each pickup/delivery n by driver, type of vehicle, carrier, route, or location during a defined period of time.
Formula
sum of total number of hours/days to load/unload a vehicle for all shipments _____________________________________________________________ number of shipments
Purpose and Issues
This indicator reflects the efficiency of the transport and distribution systems. The longer a vehicle is stationed for loading the less time it can spend on th and responding to orders from clients. Loading
ould be taken into accou veries and planning transportation routes for cles and produ c driver, type of
ficiency and reduce wastage.
and unloading,and unloading time sh
e road making deliveriesnt when scheduling deli
different kinds of vehi cts. Monitoring average loading and unloading times for a specifihelp managers improve response time and efvehicle, carrier, route, or location can also
Data Sources Data Requirements
Vehicle/driver logs
eipt vouchers
t observation or eye-witness accounts.
Total number of hours/days to load/unload a vehicle for all shipments during specified time period
Number of shipments during specified time period. Requisition and issue vouchers/rec
Direc
C. Vehicle Turnaround Time Definition
This indicator measures the percentage of time (hours/days) spent idle between a vehicle’s arrival at a facility and its ive of loading/unloading time, during a defined period of time (e.g., a specified day/week/month). departure, inclus
Formula
total amount of hours/days vehicle spent idle at a facility number of actual driving (or in that time period
*100 working) hours/days
Purpose and Issues
To ensure the efficient use of vehic urnaround time for a given route, region, or district. To el agers should strive
me that vehicles spend idle. Vehicles that have higher turnaround times are also reliably serving
les and resources, in general, managers can monitor vehicle timinate waste and time lost to inefficient distribution, man
to reduce the timore clients.
Data Sources Data Requirements
Vehicle logs.
Total amount of time (hours/days) vehicle spent idle at a facility in between arrival and departure during a day/week/month
Total number of actual driving (or working) hours/days in that time period.
Related Indicators
Percentage of idle time per vehicle per week or month
Percentage of active time per vehicle per week or month (time vehicle is working)
DISTRIBUTION/TRANSPORT

49
COST/FINANCIAL tal Transportation Cost A. To
Definition
This indicator measures the sum of all transportation costs related to a specific driver, type of vehicle, carrier (if , or region/district/facility during a defined period of time; including inbound and outbound
utsourced, freight bills. outsourced), routetransport, fuel, tires, maintenance, acquiring and staffing a fleet or, if o
Formula
Sum of all transportation costs (as suggested above) during a specified period of time
Purpose and Issues
Calculating total transportation costs can helpmake budgetary and operational decisions a
managers monitor these costs over time to folbout delivery schedules, use of vehicles, rout
low trends and to ing, outsourcing, etc.
Data Sources Data Requirements
Receipts, financial statements, fuel logs, maintenance Sum of all transportation cologs, travel logs, freight bills during specified time period.
sts during specified time period, as suggested above, plus any others.
Related Indicators
Average transportation cost relate , type of vehicle, carrier (if outsourced), route, or region/district/facility during a defined period of time
__________________
d to a specific driver
Average number of kilometers traveled per liter of fuel used:
total km traveled
total liters of fuel used
B. Average Transportation Cost per km/volume/weight
Definition
This indicator measur (km) or volume or weight (as te) related to a specific driver, type of vehicle, route, region/district/facility, or carrier (if a defined period of time; including inbound and outbound transport, fuel, tires, maintenance,
es the average transportation cost per kilometerrelevant/appropriaoutsourced) duringacquiring and staffing a fleet, or, if outsourced, freight bills.
Formula
sum of all transportation costs ____________________________________________ total number of km driven or m3/kg of product shipped
Purpose and Issues
Calculating average transportation cost per km/m3/kg can help managers monitor these costs, over time, to follow trends and to make budgetary and operational decisions about delivery schedules (e.g., frequency), use of vehicles, routing, outsourcing, etc.
DISTRIBUTION/TRANSPORT

DISTRIBUTION/TRANSPORT
50
Data Sources Data Requirements
Receipts, financial statements, fued freight bills dur
eled
nd issue vouchers
during specified e period, as suggested above, plus any others
Total number of km driven or m3/kg shipped during same time period.
l logs, ing a
Sum of all transportation costs timmaintenance logs, an
specified time period
Vehicle logs of km trav
Requisition a
Airway bills/shipping invoices.
Related Indicators
t, type of vehicle or carrier (if outsourced), Average transportation cost per unit shipped for a specific producroute, or region/district/facility during a defined period of time
C. Ratio of Transportation Cost to Value of Product Definition
This indicator measures the ratio of all transportation costs related to a specific driver, type of vehicle, route, region/district/facility, or carrier alue of product shipped during a defined period of time. Transportation costs includ ansport, fuel, maintenance, acquiring and staffing a fleet, or, if outsourced, freight bills.
(if outsourced) to the total ve inbound and outbound tr
Formula
Sum of all transportation costs _________________________ total value of product shipped
Purpose and Issues
Monitoring the ratio of transportation costs to uct can help managers monitor these costs, schedules (e.g.,
ing evalua product may review periods for those facilities be lengthened or that shipments to those facilities be
consolidated with shipments to other facilities.
the value of the prodover time, to follow trends and to make budgfrequency), use of vehicles, routing, outsou
etary and operational decisions about deliveryrcing, etc.
When delivery routes are besuggest that the
ted, high ratios of cost of transport compared to value of
Data Sources Data Requirements
Receipts, financial statements, fuel logs, maintenance logs, and freight bills during specified time period
Requisition and issue vouchers
Product invoices.
Sum of all transportation costs during a specified time period
Total value of product shipped during same time period.
DISTRIBUTION/TRANSPORT
PRODUCTIVITY cle Use Availability A. Vehi
Definition
This indicator measures the amount of time a vehicle was available for use during a defined period of time because it was out of service.
Formula
total number of days in period - total days unavailable__________________________________________
total number of days in period *100
Purpose and Issues
The availability of the vehicles in a fleet is an indication of the condition of the fleet overall and reflects how the being maintained and util performance. However, because
is critical, a target for t een 80–95% availability. vehicles are ized. Low availability can impact deliveryroutine maintenance his indicator can be betw
Data Sources Data Requirements
Vehicle logs
Maintenance records.
Total number of days in period
Total days unavailable
Total number of days in period.
B. Container Capacity Utilization Definition
This indicator measures the or volume.
percentage of vehicle/container capacity used out of the maximum available by weight
Formula
total kilogram 3
_____________________________________theore
*100 s or m shipped
tical maximum for each type of vehicle
Purpose and Issues
Managers can monitor container capacity utilization for a given route, region, or district to ensure the efficient use f vehicles and resources in general. Managers should strive to increase capacity utilization to eliminate waste and o
to improve service to clients.
Data Sources Data Requirements
Shipping records
Requisition and issue vouchers
Vehicle/container specifications.
Total kilograms or m3 shipped
Theoretical maximum for each type of vehicle/container.
Related Indicators
% of shipments where vehicle/container were at maximum capacity
51
DISTRIBUTION/TRANSPORT
52
et Yield C. FleDefinition
This indand/or
icator measures the average quantity of products by case or kilogram delivered per person-hour (part- full-time staff) during a defined period of time.
Formula
sum of the quantity of cases/kilograms delivered ________________________________________ person-hours for part- and/or full-time staff
Purpose and Issues
To improve efficiencies in the use of hu r time. man resources and vehicles, this indicator can be monitored ove
Data Sources Data Requirements
Warehouse and shipping records
Requisition and issue vouchers
Sum of the quantity of cases/kilograms delivered during a specified time period
Total number of person-hours for part- and/or full-time staff during the same period.
Time sheets/human resources billing records.
D. Average Number of Stops per Route Definition
This indicator measures the average n or deliveries per route in a given region/district during a ime.
umber of stops fdefined period of t
Formula
sum of number of stops for all routes ______________________________
number of routes
Purpose and Issues
To ensure the efficient use of vehicl the average number of stops n region or district. Managers should optimize the time that vehicles spend on the road to reduce
es and resources in general, managers can monitor per route in a givecosts and to eliminate waste and time lost to inefficient distribution.
Data Sources Data Requirements
Vehicle logs
Receipt vouchers.
Sum of number of stops for all routes during a specified time period
Total number of routes.
Related Indicators
Average number of stops per vehicle in a given region/district during a defined period of time
Total number of stops per route/per vehicle

For more information, please visit deliver.jsi.com.

USAID | DELIVER PROJECTJohn Snow, Inc.
1616 Fort Myer Drive, 11th Floor
Arlington, VA 22209 USA
Phone: 703-528-7474
Fax: 703-528-7480
Email: ask [email protected]
Internet: deliver.jsi.com
Related Documents