Georgia State University Georgia State University ScholarWorks @ Georgia State University ScholarWorks @ Georgia State University Psychology Faculty Publications Department of Psychology 2002 Measuring socioeconomic status: Reliability and preliminary Measuring socioeconomic status: Reliability and preliminary validity of different approaches validity of different approaches Paul Cirino Rose Sevcik Georgia State University, [email protected] Maryanne Wolf Tufts University, [email protected] Maureen Lovett University of Toronto, [email protected] Robin Morris Georgia State University, [email protected] See next page for additional authors Follow this and additional works at: https://scholarworks.gsu.edu/psych_facpub Part of the Psychology Commons Recommended Citation Recommended Citation Cirino, P.T., Chin, C.E., Sevcik, R.A., Wolf, M., Lovett, M. & Morris, R.D. (2002). Measuring socioeconomic status: Reliability and preliminary validity of different approaches. Assessment, 9(2), 145-155. This Article is brought to you for free and open access by the Department of Psychology at ScholarWorks @ Georgia State University. It has been accepted for inclusion in Psychology Faculty Publications by an authorized administrator of ScholarWorks @ Georgia State University. For more information, please contact [email protected].

Welcome message from author
This document is posted to help you gain knowledge. Please leave a comment to let me know what you think about it! Share it to your friends and learn new things together.
Transcript
Georgia State University Georgia State University
ScholarWorks @ Georgia State University ScholarWorks @ Georgia State University
Psychology Faculty Publications Department of Psychology
2002
Measuring socioeconomic status: Reliability and preliminary Measuring socioeconomic status: Reliability and preliminary
validity of different approaches validity of different approaches
Paul Cirino
Rose Sevcik Georgia State University, [email protected]
Maryanne Wolf Tufts University, [email protected]
Maureen Lovett University of Toronto, [email protected]
Robin Morris Georgia State University, [email protected]
See next page for additional authors
Follow this and additional works at: https://scholarworks.gsu.edu/psych_facpub
Part of the Psychology Commons
Recommended Citation Recommended Citation Cirino, P.T., Chin, C.E., Sevcik, R.A., Wolf, M., Lovett, M. & Morris, R.D. (2002). Measuring socioeconomic status: Reliability and preliminary validity of different approaches. Assessment, 9(2), 145-155.
This Article is brought to you for free and open access by the Department of Psychology at ScholarWorks @ Georgia State University. It has been accepted for inclusion in Psychology Faculty Publications by an authorized administrator of ScholarWorks @ Georgia State University. For more information, please contact [email protected].
Authors Authors Paul Cirino, Rose Sevcik, Maryanne Wolf, Maureen Lovett, Robin Morris, and Christopher E. Chin
This article is available at ScholarWorks @ Georgia State University: https://scholarworks.gsu.edu/psych_facpub/159

Measuring Socioeconomic Status
Reliability and Preliminary Validity for
Different Approaches
Paul T. Cirino
Christopher E. Chin
Rose A. Sevcik
Georgia State University
Maryanne Wolf Tufts University
Maureen Lovett Hospital for Sick Children/University of Toronto
Robin D. Morris Georgia State University
This study investigated issues related to commonly used socioeconomic status (SES) measures in 140
participants from three cities (Atlanta, Boston, and Toronto) in two countries (United States and
Canada). Measures of SES were two from the United States (four-factor Hollingshead scale, Nakao
and Treas scale) and one from Canada (Blishen, Carroll, and Moore scale). Reliability was examined
both within (interrater agreement) and across (intermeasure agreement) measures. Interrater reliability
and classification agreement was high for the total sample (range r = .86 to .91), as were intermeasure
correlations and classification agreement (range r = .81 to .88). The weakest agreement across measures
was found when families had one wage earner who was female. Validity data for these SES measures
with academic and intellectual measures also were obtained. Some support for a simplified approach to
measuring SES was found. Implications of these findings for the use of SES in social and behavioral
science research are discussed.
Keywords: SES, measurement, reliability, agreement, validity
Socioeconomic status (SES) is a construct related to numerous variables of interest in the social and behavioral sciences. For
example, SES has been utilized as a variable in studies of learning disabilities (Cornwall, 1992; Low et al., 1992), academic
achievement (Selden, 1990; White, 1982), adolescent sexual behavior (Alonge, 1991), HIV high-risk groups (Spalding, 1995),
and anxiety and depression (Murphy, Olivier, Monson, & Sobol, 1991). The usefulness of SES as a variable in behavioral
research ultimately is influenced by the reliability and validity of the
Support for this research was provided by the National Institute of Child Health and Human Development Grant HD30970 to RM, MW, and ML at
Georgia State University, Tufts University, and Hospital for Sick Children/University of Toronto, respectively, and from a Research Program
Enhancement Grant from Georgia State University. We thank the families of our participants for their cooperation and support. Correspondence
concerning this article should be addressed to Paul T. Cirino, Department of Psychology, Georgia State University, Atlanta, GA 30303; e-mail:
Assessment, Volume 9, No. 2, June 2002 145-155
© 2002 Sage Publications
particular method or instrument used in its measurement (White, 1982); little attention has been directed toward examining its
measurement (Mueller & Parcel, 1981) despite the widespread use of SES.
The Hollingshead (1975) four-factor index of SES has been one of the most frequently used measures of SES
(Edwards-Hewitt & Gray, 1995). The Hollingshead measure has been valuable as a predictor/covariate and/or as an outcome
measure in studies of adult dyslexia (Felton, Naylor, & Wood, 1990), premature infants (Barratt, Roach, & Leavitt, 1996), and
psychiatric disorders such as major depression (Cuffe, Waller, Cuccaro, Pumariega, & Garrison, 1995; Garrison, Waller, Cuffe,
& McKeown, 1997). However, several other measures of SES are available (e.g., Blishen, Carroll, & Moore, 1987; Entwisle &
Astone, 1994; Nakao & Treas, 1992). In addition, some scholars have raised questions regarding the use of the Hollingshead
measure (Mueller & Parcel, 1981), including the use of both education and occupation in its score, the weighting procedure
used, and the combination procedures for single and dual wage earners.
Few data are available regarding the interrater reliability of SES measures, particularly given that many such measures
rely on a rater’s subjective judgment (Edwards- Hewitt & Gray, 1995; see Gottfried, 1985, for an exception); this subjective
rating becomes evident when occupations of individuals do not correspond directly to the job titles provided by a particular
SES measure. Job titles may be outdated (e.g., the Hollingshead occupational codes are matched to those from the United
States census of 1970), and respondents may not report their jobs according to census titles. The use of subjective ratings and
the lack of interrater reliability become even more important when assessing SES across countries and cultures, as the same
job may have differential status in different countries.
Relatively little information is available regarding relationships between established measures of SES (e.g.,
Hollingshead, 1975) and more recently developed SES measures (e.g., Nakao & Treas, 1992), or relationships between the
Hollingshead measure and those SES measures developed in countries with different sociopolitical and economic systems
(e.g., Blishen et al., 1987). An exception is Gottfried (1985), who compared the Hollingshead Four Factor Index of Social
Status with the Revised Duncan Socioeconomic Index (Stevens & Featherman, 1981) and the Siegel Prestige Scale (Siegel,
1971). Gottfried found that the latter two indices, both of which utilize the 1970 census occupational codes, correlated .87 and
that the Hollingshead measure correlated .79 with the Duncan index and .73 with the Siegel scale. Hollingshead (1975) found a
significant correlation between his measure and an early prestige measure derived from the National Opinion Research Center
(NORC), but whether this correlation remains stable when the Hollingshead scale is compared to updated NORC measures,
such as the social prestige scales of 1989 (Entwisle & Astone, 1994; Nakao & Treas, 1992), is unclear.
The feasibility of simplifying the calculation of SES also should be considered; doing so may increase its use among
scientists. Although the derivation of SES varies between studies, many involve the use of such factors as family income level,
parental education, parental occupation, and the occupation’s social prestige (e.g., Edwards- Hewitt & Gray, 1995). If these
basic attributes, in isolation, are highly correlated with established and published SES measures, their individual use could
simplify the process of calculating SES scores. For example, Gottfried (1985) noted that the occupational scale of the
Hollingshead scale alone correlated higher than did the full measure with other indices (r = .85 with Duncan; r = .79 with
Siegal). However, for a more simplified approach to be useful, reliability and validity estimates should be comparable or higher
than that of the longer form. As an example of these estimates, Gottfried (1985) found significant relationships between
scores on the Hollingshead scale and those of the Bayley Mental Developmental Index or the McCarthy General Cognitive
Index (e.g., r = .41 at 24 months and r = .39 at 42 months). Significant but generally lower correlations were obtained between
these measures of development with the Siegal (e.g., r = .28 at 24 months and r = .19 at 42 months) or Duncan (e.g., r = .28 at
24 months and r = .26 at 42 months) scales. Gottfried noted that scores on the Siegal scale were based on only male workers
and that both the Siegal and Duncan scales were developed for use with the head of households.
The present study investigates the interrater reliability of three SES measures using data from two countries and
examines the consistency of SES measurements across the different means of deriving SES. In addition, the usefulness of a
more simplified approach to SES, using either the unweighted education or occupation classification of Hollingshead (1975),
was examined. Finally, relationships between these SES measures and intellectual ability and achievement also were explored.

METHOD
Participants
SES data were derived from the parents of students recruited from schools in three large metropolitan areas (Atlanta,
Boston, and Toronto). Students initially were referred by their teachers and screened for inclusion in an intervention research
study targeting young children with severe reading problems. The use of such a sample is important given the influence of SES
on reading and the frequency of reading problems. Study participants will be referred to as “children” or “individuals,”
although the SES data collected are based on their parent/guardian’s occupation and education, or occupation alone. A parent/
guardian or family member was asked to complete a questionnaire that included basic demographic information, including data
used to rate SES, as part of the screening procedure for inclusion in the intervention study. Specifically, items included in the
measurement of SES were the following: education level completed by each parent/ guardian, current work status of each
parent/guardian, work status of each parent/guardian during the past year, current or most recent occupation of each
parent/guardian, and legal custodian of the child. Individuals involved in the final coding or measurement of SES held doctoral or
master’s degrees in clinical or related fields of psychology.
SES data were available for 177 families of the children who were screened for inclusion into the reading study.
However, 37 were children whose parents/guardians were not working or participated in activities to which an SES score could
not be directly assigned (e.g., student, volunteer, or homemaker); these data were excluded because of the artificial inflation of
SES agreement scores. Therefore, the final sample consisted of the parents or guardians of 140 children (68 from Atlanta, 29
from Boston, and 43 from Toronto) whose mean age in months was 87.3 (SD = 5.6). Thirty-two percent of the children were
female, and 42% were of African heritage (the remainder were Caucasian). The mean IQ composite score on the Kaufman Brief
Intelligence Test (K-BIT) (Kaufman & Kaufman, 1990), a brief screening measure of intellectual functioning, was 95.1 (SD =
11.5). The mean total reading cluster score of the children on the Woodcock Reading Mastery Tests– Revised (WRMT-R)
(Woodcock, 1987) was 89.6 (SD = 12.5). These were administered as screening measures for the larger reading intervention
study.
Measures
SES data from all sites were derived using two scales from the United States (Hollingshead, 1975; Nakao & Treas,
1992) and one Canadian scale (Blishen et al., 1987), resulting in three different SES measures for each child’s family. The
Hollingshead scale was used because it is one of the most commonly used SES measures (Edwards- Hewitt & Gray, 1995). The
Nakao and Treas scale was used because it has been referred to as “probably the best choice at present for determining status
scores from job codes” (Entwisle & Aston, 1994, p. 1528). The Blishen et al. scale was used because a substantial proportion
(30%) of the children’s families involved in this study resided in Canada. Measures of IQ and academic achievement were also
used, with specific measures chosen (K- BIT, WRMT-R, and Wide Range Achievement Test–3 [WRAT-3]) because they are
well normed and commonly used.
United States scale: Hollingshead Four Factor Scale. Hollingshead’s four-factor SES score is derived from both education and
occupation information. Occupation codes were based on the 1970 U.S. census. Occupation and education were highly
correlated for both males (r = .84) and females (r = .85).
In the Hollingshead (1975) system, an SES score is computed in the following manner. An education score (1 through
7, with 1 equal to less than a seventh-grade education and 7 equal to graduate training) and an occupation score (1 through 9,
with 1 equal to farm laborers/menial service workers and 9 equal to higher executives, proprietors of large businesses, and
major professionals) is assigned for each parent/guardian based on information provided by them. Education and occupation
scores are then weighted to obtain a single score for each parent/ guardian (range 8 to 66) that reflects one of five social strata
(1 through 5, with 1 a reference to unskilled laborers/ menial service workers and 5 a reference to executive/ proprietors/major
professionals). For families with multiple caretakers, scores for each are averaged to obtain a single SES score. Individuals whose
primary activities are homemaking, school, or who receive state assistance do not have categorizable occupations according to
the Hollingshead system and, as mentioned earlier, did not receive SES scores in this study.

For the purposes of this study, when more than one parent/guardian was present in the home, their scores were
averaged (as per the original Hollingshead scale). However, it is possible that scores combining widely discrepant occupations
may be misleading. For example, when one parent has an occupation with a very high SES score and a second parent has an
occupation with a very low SES score, the resultant average may not be the best estimate of SES status for that family. To address
this measurement issue, the averaged results (the standard procedure) were compared to those derived using an alternative
method that corrects for the calculation of the occupation score for families with two parents working but with widely
discrepant occupations. Specifically, SES was calculated only on the individual with higher occupation score when two parents
had widely discrepant occupation scores. However, only eight families obtained different SES scores under the standard and
corrected procedures, and the alternate means of SES calculation using the correction described above did not lead to major
changes in the SES status of the children (e.g., the two sets of SES scores correlated r = .96, p < .0001). In addition, the
determination of “widely discrepant” occupations is admittedly somewhat arbitrary. Hence, the following results are based
on SES scores derived strictly following Hollingshead’s (1975) system, averaging the scores from multiple caretakers.
In addition to the continuous scores produced, SES scores for each family also were dichotomized into low or average
groups for purposes of the larger reading intervention study (e.g., design balance). Because continuous data also were available,
the loss of variance attributed to the scale reduction associated with this dichotomization could be evaluated. Participants were
placed in the low group if their overall Hollingshead (1975) SES score was in the lower two strata, corresponding to
continuous scores of 8 to 30; otherwise, participants were placed in the average group. A second dichotomy also was explored
(low group: 8 to 20; average group: 21 to 66), but the results did not change; therefore, only the results of the original
dichotomy are reported below.
Unweighted Hollingshead education and occupation scores also were dichotomized to evaluate their consistency of
measurement. For education, participants were placed in the low group if their Hollingshead education score was 4 (high
school graduate) or lower and in the average group if their score was above this level. For occupation, participants were placed in
the low group if their Hollingshead occupation score was 4 (craftsmen, skilled manual workers) or lower and in the average
group if their score was above this level.
United States scale: Nakao and Treas. SES scores were derived for the 503 job codes listed in the 1980 U.S. census and are
based on the education and income of individuals who had jobs at that time. Where data were available for only one adult (e.g.,
only one parent/guardian was working), the code for the employed individual was used. In families in which data were
available for more than one parent/guardian, their SES scores were averaged. This is the same method used in the calculation
of a total score on the Hollingshead four-factor scale. In our analysis, the obtained continuous SES value also was dichotomized
into average or low groups for the purposes associated with the larger reading study. A low classification was given if the score
was more than one half of a standard deviation below the mean score of all occupations (i.e., below the 30th percentile);
otherwise, the score was classified as average.
Canadian scale: Blishen et al. This scale provides an occupational socioeconomic index that considers the median income
for men and women and the net proportion of well-educated individuals for a given occupation. The scale was calibrated to the
Pineo and Porter (1967) metric of occupational prestige, although the authors indicate that their scale is not a measure of
prestige because only income and education are considered. An SES score was derived for each of the 514 occupational codes
from the 1981 Canadian census. In cases in which data were available for only one adult (e.g., only one parent/guardian was
working or there was a single parent/guardian providing for the child), the code for the employed individual was used. In
families in which data were available for more than one parent/guardian, their SES scores were averaged, following the same
method used in the calculation of a total score on the Hollingshead four-factor scale and the Nakao and Treas scale. As with the
Nakao and Treas scale, continuous SES values also were assigned a dichotomous label (average or low). A low classification was
assigned if a score was more than one half of a standard deviation below the mean score of all occupations; otherwise, the
score was classified as average.
WRMT-R. The total reading cluster of the WRMT-R (Woodcock, 1987) was used as a measure of reading skill. This
cluster is a composite of the subtests of individual word decoding (Word Identification) and comprehension (Passage
Comprehension); the latter subtest requires participants to supply a missing word in a short passage (cloze task). The
standardization sample for the WRMT-R consisted of 6,089 participants selected to approximate the population distribution of
the United States based on 1980 census information, and reliability estimates for the total reading cluster were high (Grade 1
split-half reliability, r = .98).
WRAT-3. The WRAT-3 (Wilkinson, 1993) includes subtests of writing letters and words to dictation (Spelling) and
mechanically solving oral and written computations (Arithmetic). A sample of 4,433 participants, stratified based on age,
regional residence, gender, ethnicity, and socioeconomic level to approximate the 1990 census data was used for
standardization. The median coefficient alpha across all three subtests using both forms ranged from .85 to .95. Rasch Pearson
separation indices were also calculated and suggested excellent reliability (.98 to .99).
K-BIT. The K-BIT (Kaufman & Kaufman, 1990) is a brief measure of verbal (vocabulary) and nonverbal abilities
(matrices) for children and adults (ages 4 through 90). The K-BIT is a well-normed instrument and has a mean split-half
reliability coefficient of .94 (Kaufman & Kaufman, 1990).
Procedure
Two raters from the Atlanta site independently derived Hollingshead SES scores for each child in the study in accord
with the scoring criteria described above. The interrater agreement for the Blishen et al. scale and the Nakao and Treas scales
proceeded somewhat differently. For them, independent groups of raters, rather than individual raters, derived SES scores.
One group was composed of persons from only the Atlanta site, whereas the second group (independent from the first) was
composed of other persons from the Atlanta site, as well as persons from either Boston or Toronto (depending on the child’s
location). This procedure was followed because these two SES measures were used to classify children for purposes related to
the reading study, and input from persons who lived in the same city as the child and their family was deemed necessary. Four
of the children who were assigned Hollingshead SES scores (where only a job category is necessary) were not assigned Nakao
and Treas and/or Blishen et al. SES scores because the specific job titles necessary for these scales were not available.
Correlation coefficients (for continuous data), T-scores derived from an r-to-z transformation (Hays, 1988) of these
correlations (to determine differences in magnitude among correlations), percent agreement, and kappa coefficients (for
dichotomous data) were used to determine the adequacy of interrater and intermeasure agreement. There were no differences in
interrater concordance as a function of cities on any of the three SES measures (e.g., for the total sample on the Hollingshead
scale, correlations of the independent raters with one another using the r-to-z transformation, Boston vs. Toronto, Atlanta vs.
Boston, and Atlanta vs. Toronto; similar comparisons were made for the other two SES scales) after correcting for multiple
comparisons (nine). There were also no differences in intermeasure concordance across the three sites (e.g., for the
participants from Atlanta, correlations of the independent groups of raters with one another using the r-to-z transformation,
Hollingshead vs. Nakao & Treas, Hollingshead vs. Blishen et al., and Nakao & Treas vs. Blishen et al.; similar comparisons
were made for the other two cities) after correction for multiple comparisons (nine). Given these results, data were combined
across the three sites for all future analyses.
RESULTS
Throughout the following sections, numerous correlation coefficients are described and compared. However,
statistical comparisons were generally performed only in the total sample and to address specific questions of inter- est.
Reasons for not computing every possible statistical comparison included the rather large number of possible comparisons
(and the associated necessity of requiring a very stringent alpha level), the small number of individuals in certain family groups
(and associated loss of power), and the fact that statistical comparisons could not be made for percent agreements or for kappa
coefficients. These is- sues were evaluated, in part, by the use of the Power Analysis and Sample Size program (Hintze, 1996). On
the other hand, qualitative differences of a minimum of 15 points in correlations or percent agreements were described as higher
or lower; terms such as similar were used when differences in correlations or percent agreements were less than 10 points for any
referred-to comparison. When describing correlations or percent agreement, the term high was used for correlations (or
percent agreements) greater than .76, the term moderate for correlations (or percent agreements) of .50 to .75, and modest for
significant correlations (or percent agreements) less than .50. In describing kappa coefficients, the labels given by Landis and
Koch (1977) were used to describe different levels of agreement (e.g., coefficients from .61 to .81 correspond to substantial
agreement). When kappa coefficients were assigned different labels, they were described as higher or lower; when the labels were
the same, terms such as similar were used. Exceptions to the above rules are noted in text.
Interrater Reliability
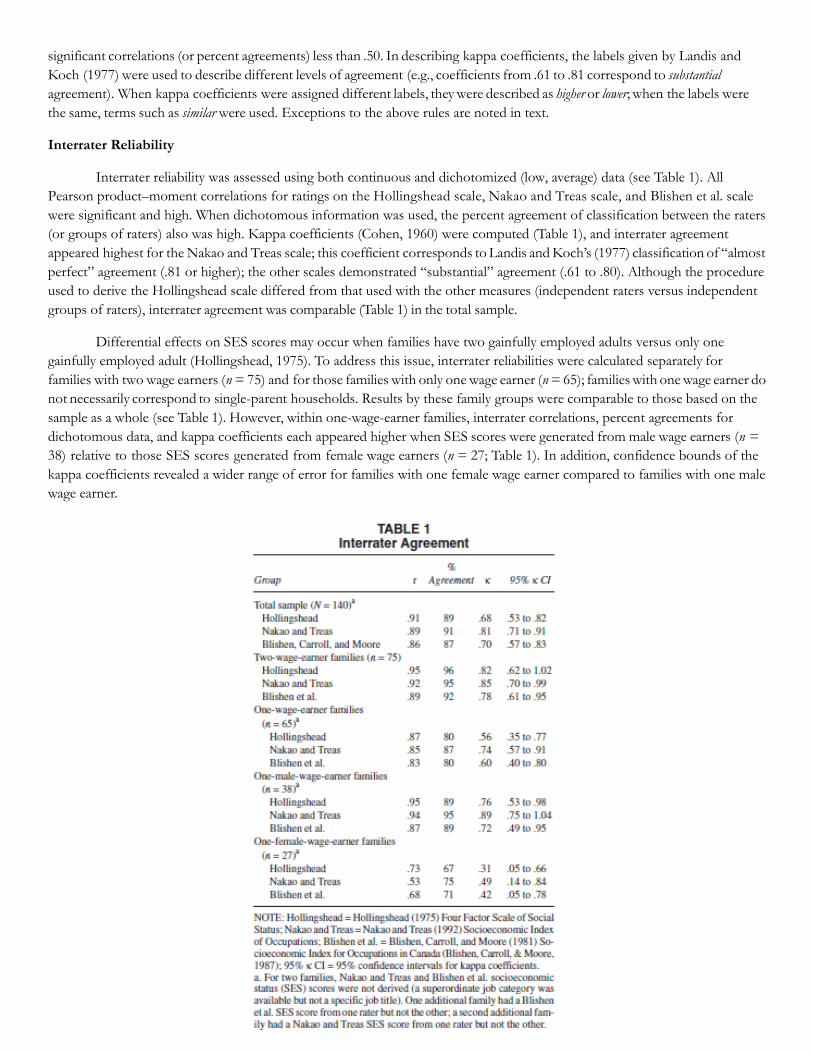
Interrater reliability was assessed using both continuous and dichotomized (low, average) data (see Table 1). All
Pearson product–moment correlations for ratings on the Hollingshead scale, Nakao and Treas scale, and Blishen et al. scale
were significant and high. When dichotomous information was used, the percent agreement of classification between the raters
(or groups of raters) also was high. Kappa coefficients (Cohen, 1960) were computed (Table 1), and interrater agreement
appeared highest for the Nakao and Treas scale; this coefficient corresponds to Landis and Koch’s (1977) classification of “almost
perfect” agreement (.81 or higher); the other scales demonstrated “substantial” agreement (.61 to .80). Although the procedure
used to derive the Hollingshead scale differed from that used with the other measures (independent raters versus independent
groups of raters), interrater agreement was comparable (Table 1) in the total sample.
Differential effects on SES scores may occur when families have two gainfully employed adults versus only one
gainfully employed adult (Hollingshead, 1975). To address this issue, interrater reliabilities were calculated separately for
families with two wage earners (n = 75) and for those families with only one wage earner (n = 65); families with one wage earner do
not necessarily correspond to single-parent households. Results by these family groups were comparable to those based on the
sample as a whole (see Table 1). However, within one-wage-earner families, interrater correlations, percent agreements for
dichotomous data, and kappa coefficients each appeared higher when SES scores were generated from male wage earners (n =
38) relative to those SES scores generated from female wage earners (n = 27; Table 1). In addition, confidence bounds of the
kappa coefficients revealed a wider range of error for families with one female wage earner compared to families with one male
wage earner.

There were no systematic patterns to the differences in agreement for one-female-wage-earner families by rater. For
example, the difference in Hollingshead scores between raters was not significantly different from zero, t(25) = 1.17, p > .05;
similar results were obtained for the other two scales as well, Nakao and Treas, t(22) = 1.00, p > .05; Blishen et al., t(22) = –0.65,
p > .05. In addition, al- though 17 (63%) of the 27 one-female-wage-earner families had differences in their dichotomous
ranking (average or low) on the SES measures, raters or rating groups differed on only one of the three measures for 13 (76%)
of these families.
Some differences occurred between raters or rating groups when continuous data were examined but not when
dichotomous data were examined; the opposite pattern was also observed. For example, one family (occupation: gate clerk)
differed in dichotomous ranking on all three SES measures; however, closer examination revealed that there were small
differences on the Hollingshead scale, Blishen et al. scale, and Nakao and Treas scale (7, 4, and 5 points, respectively). In other
cases (e.g., some nursing occupations), there were larger differences (up to 15 points) in the continuous score applied, but this
did not lead to differences in dichotomous ranking.
Only the scores from one rater were used in the remaining analyses given the high interrater agreement in the total
sample and in most family groups, as well as the lack of systematic differences between the two raters. However, because of the
differences in agreement for different family groups (dual-wage-earner families, one-female-wage- earner families, etc.),
intermeasure and validity analyses were performed by family group.
Intermeasure Concordance
Correlations between SES measures in the total sample generally were high (range r = .81 to .86; see Table 2). The
correlations between the Blishen et al. SES scale and the other two SES scales were higher than those of the other two SES
scales with one another (relations of Blishen et al./Nakao & Treas versus Hollingshead/Nakao & Treas, t(134) = 3.30, p <
.002; relations of Blishen et al./ Hollingshead versus Nakao & Treas/Hollingshead, t(134) = 2.37, p < .05). However, in
practical terms, these differ- ences were not extreme. When dichotomous information was used, the percent agreement of
classification between measures also was high (range = 82% to 85%). When kappa coefficients were computed, the Nakao and
Treas scale and the Blishen et al. scale agreed more strongly with one another (substantial agreement) than either of these
measures agreed with the Hollingshead scale, where there was only “moderate” agreement, according to Landis and Koch’s
(1977) classification (kappa coefficients between
.41 and .60).
Intermeasure reliabilities also were calculated separately for families with two wage earners (n = 75) and for those
families with only one wage earner (n = 62). For these family groups (see Table 2), results comparable to those based on the
sample as a whole were obtained. However, as was the case with interrater concordance, within one-wage-earner families
intermeasure correlations, percent agreements for dichotomous data, and kappa coefficients each appeared higher when SES
scores were generated from male wage earners (n = 37) relative to those SES scores generated from female wage earners (n =25)
(see Table 2). In addition, confidence bounds of the kappa coefficients revealed a wider range of error for families with one
female wage earner compared to families with one male wage earner. Finally, within the one-wage- earner families, female
wage earners had significantly lower scores on the Blishen et al. SES scale than male wage earners, t(60) = 2.43, p < .02. Similar
trends were observed for the Hollingshead and Nakao and Treas SES scales, although the results were not significant.

Although there was a difference in intermeasure concordance between males and females within one-wage-
earner households, this finding may result from the small sample size and particular features within that subgroup.
When the entire sample was divided into either all males (n = 111) or all females (n = 101) who had codeable jobs
regardless of their family status, interrater concordance was high and significant for all scales for both all females
(Hollingshead, r = .87; Nakao & Treas, r = .75; Blishen et al., r = .79) and all males (Hollingshead, r = .93; Nakao &
Treas, r = .93; Blishen et al., r = .87). The correlations for the all-female group were higher than the subset of
females who were the only wage earner for the Hollingshead and the Nakao and Treas SES scales (see Table 1). For
intermeasure concordance, there were only minor differences between males and females. For example, the
correlation of the Hollingshead and Nakao and Treas SES measures for all males (r = .86) was significantly higher
than that of all females (r = .75), t(205) = 2.44, p < .05; however, the concordance for all females was higher than
the subset of females who were the only wage earner (see Table 2). There were no differences between all males and
all females in the correlation of the Hollingshead and Blishen et al. SES measures, t(205) = 1.51, p > .05, or the
Nakao and Treas and Blishen et al. SES measures, t(208) = 0.76, p > .05.
A Simplified Approach
Interrater reliability and intermeasure concordance also were calculated using either (unweighted)
education or occupation classifications alone from the Hollingshead scale. These measures were expected to
correspond more closely with the full Hollingshead scale than with the other two SES scales.
Spearman correlation coefficients assessing interrater reliability were high for both education (r = .99) and
occupation (r = .88) classifications. Interrater percent agreement (education = 99%; occupation = 87%) and kappa
coefficients were substantial to almost perfect (education κ = .99; occupation κ = .69).
With regard to intermeasure concordance, correlations using occupation alone were high with all three SES
measures (see Table 3). A similar pattern was found for kappa coefficients; most demonstrated substantial
agreement. Correlations using education alone were moderate with the three measures; however, kappa coefficients
were low (all demonstrated only fair agreement). Both the correlations and kappa coefficients using education alone
were lower than those obtained using occupation alone. A similar pattern of relations was obtained for two-wage-
earner families and one-wage-earner families (higher correlations and higher kappa coefficients for occupation
relative to education; see Table 3).
Within the one-wage-earner families, education correlated equivalently (and modestly to moderately) with
the full SES measures, regardless of whether they were male or female (see Table 3). With regard to occupation,
how- ever, intermeasure correlations were higher for male wage earners than female wage earners for the Blishen et al.
and the Nakao and Treas SES scales (see Table 3); concordance between occupation alone and the full Hollingshead
scale was similar in these family groups.
For intermeasure occupational scores, the pattern of correlations in the sample as a whole, for the one- and
two- wage-earner families, and within one-wage-earner families (see Table 3) was similar to that obtained when the
full Hollingshead scale was compared to the Nakao and Treas and the Blishen et al. SES scales (see Table 2). Results
also generally were similar when dichotomous scores (kappa coefficients) were examined; where there were
differences, kappa coefficients of agreement between the Hollingshead occupation score and the Nakao and Treas
and Blishen et al. SES scales were higher than those obtained between the full Hollingshead and the other two SES
scales.
Relations to Relevant Measures
The relation between SES and intellectual functioning and academic achievement is well established.
Therefore, to provide support for the validity of the three SES measures used in the current study, we examined the
relations of the intellectual and academic achievement test scores of our sample with the three full SES scores
obtained and with the unweighted education and occupation scores from the Hollingshead scale. For the sample as a
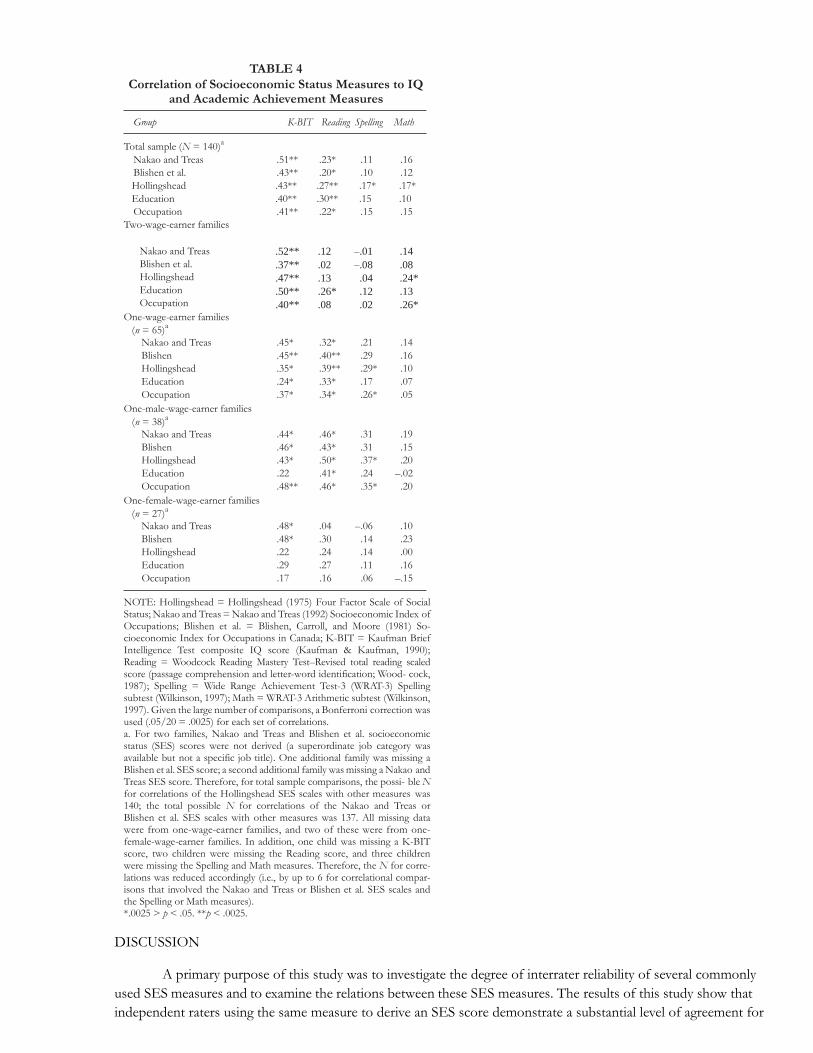
whole, all three of the measures of SES correlated significantly with IQ (range r = .43 to .51) and academic
achievement in reading (range r = .20 to .27) despite a somewhat restricted range on the reading measures; when
corrected for the number of comparisons performed, only the Hollingshead SES score correlated significantly with
WRMT-R reading performances. SES correlations with academic achievement in spelling (range r = .10 to .17), as
measured by the Spelling subtest of the WRAT-3, and in math (range r = .12 to .17), as measured by the Arithmetic
subtest of the WRAT-3, was not significant when corrected for the number of comparisons performed (see Table 4).

Correlations of SES measures with IQ and academic achievement generally were similar relative to the
sample as a whole when obtained within subgroups based on which family members were working (one versus two
wage earners and within the one-wage-earner families by the g en d e r o f t h e wa g e e a r n e r ; s e e T a b l e 4 ) .
H o wev e r , some exceptions were identified in these results; for example, the correlation of SES and IQ was not
significant when SES was measured by the Hollingshead scale within one- female-wage-earner families (r = .22, p >
.05). In addition, for SES and reading, correlations generally were modest and not significant across subgroups, with
the exception of the one-wage-earner families; these correlations appeared to be driven by the subsample of one-
wage earners who were male, even though values within this subgroup were not significant given the number of
comparisons and relatively small sample size.
Correlations between education or occupation alone with IQ and academic achievement also were
investigated (see Table 4). Education and occupation correlated significantly with IQ scores for the total sample and
for two- wage-earner families; for one-wage-earner families, and within one-wage-earner families, only occupation
correlated significantly with IQ, and only when the wage earner was male. For the correlations of education and
occupation with reading, a pattern similar to that obtained using the full SES measures was obtained; the
correlations with the highest values were obtained in the subsample of wage earners who were male, even though
these values were not significant given the number of comparisons and relatively small sample size. Education and
occupation alone did not correlate significantly with WRAT-3 Spelling or Math scores for the sample as a whole or
for any subgroup.
.52** .12 –.01 .14
.37** .02 –.08 .08
.47** .13 .04 .24*
.50** .26* .12 .13
.40** .08 .02 .26*
TABLE 4
Correlation of Socioeconomic Status Measures to IQ and Academic Achievement Measures
Group K-BIT Reading Spelling Math
Total sample (N = 140)a
Nakao and Treas .51** .23* .11 .16
Blishen et al. .43** .20* .10 .12
Hollingshead .43** .27** .17* .17*
Education .40** .30** .15 .10
Occupation .41** .22* .15 .15
Two-wage-earner families
Nakao and Treas
Blishen et al.
Hollingshead
Education
Occupation
One-wage-earner families
(n = 65)a
Nakao and Treas .45* .32* .21 .14
Blishen .45** .40** .29 .16
Hollingshead .35* .39** .29* .10
Education .24* .33* .17 .07
Occupation .37* .34* .26* .05
One-male-wage-earner families
(n = 38)a
Nakao and Treas .44* .46* .31 .19
Blishen .46* .43* .31 .15
Hollingshead .43* .50* .37* .20
Education .22 .41* .24 –.02
Occupation .48** .46* .35* .20
One-female-wage-earner families
(n = 27)a
Nakao and Treas .48* .04 –.06 .10
Blishen .48* .30 .14 .23
Hollingshead .22 .24 .14 .00
Education .29 .27 .11 .16
Occupation .17 .16 .06 –.15
NOTE: Hollingshead = Hollingshead (1975) Four Factor Scale of Social Status; Nakao and Treas = Nakao and Treas (1992) Socioeconomic Index of Occupations; Blishen et al. = Blishen, Carroll, and Moore (1981) So- cioeconomic Index for Occupations in Canada; K-BIT = Kaufman Brief Intelligence Test composite IQ score (Kaufman & Kaufman, 1990); Reading = Woodcock Reading Mastery Test–Revised total reading scaled score (passage comprehension and letter-word identification; Wood- cock, 1987); Spelling = Wide Range Achievement Test-3 (WRAT-3) Spelling subtest (Wilkinson, 1997); Math = WRAT-3 Arithmetic subtest (Wilkinson, 1997). Given the large number of comparisons, a Bonferroni correction was used (.05/20 = .0025) for each set of correlations. a. For two families, Nakao and Treas and Blishen et al. socioeconomic status (SES) scores were not derived (a superordinate job category was available but not a specific job title). One additional family was missing a Blishen et al. SES score; a second additional family was missing a Nakao and Treas SES score. Therefore, for total sample comparisons, the possi- ble N for correlations of the Hollingshead SES scales with other measures was 140; the total possible N for correlations of the Nakao and Treas or Blishen et al. SES scales with other measures was 137. All missing data were from one-wage-earner families, and two of these were from one- female-wage-earner families. In addition, one child was missing a K-BIT score, two children were missing the Reading score, and three children were missing the Spelling and Math measures. Therefore, the N for corre- lations was reduced accordingly (i.e., by up to 6 for correlational compar- isons that involved the Nakao and Treas or Blishen et al. SES scales and the Spelling or Math measures). *.0025 > p < .05. **p < .0025.
DISCUSSION
A primary purpose of this study was to investigate the degree of interrater reliability of several commonly
used SES measures and to examine the relations between these SES measures. The results of this study show that
independent raters using the same measure to derive an SES score demonstrate a substantial level of agreement for
most family groups. In contrast to some previous findings (Edwards-Hewitt & Gray, 1995), results also provide
evidence that scores derived from seemingly disparate measures yield similar results (Gottfried, 1985), again for most
family groups. Importantly, the high level of agreement across SES measures suggests that comparisons related to
the construct of SES might justifiably be made across studies that employ different SES measures. For instance,
studies using the Hollingshead scale to derive SES scores can be compared to studies using more recently developed
measures. Similarly, studies using SES measures based on the U.S. census can be compared with those using a
Canadian-based SES measure.
Another aim of this study was to investigate the utility of a more simplified approach to deriving SES.
Results suggested that when using a more simplified model to de- rive SES, occupation is a more useful single factor
than education. This result is similar to that reported by Gottfried (1985), who noted that occupation from the
Hollingshead scale was interchangeable with the other SES measures he examined. Indeed, derivation of SES based
on an individual’s occupational category alone, for some purposes, may provide scores that are comparable to those
obtained through other more involved or time-consuming approaches. Using such an approach has several
benefits, particularly because the chances for labeling and detail errors are substantially reduced. For instance, the
weighting procedure of the Hollingshead scale, whose rationale and quality are unspecified, is not required (Mueller
& Parcel, 1981). In addition, broadly categorizing occupations into one of nine levels obviates the necessity for
gathering specific information regarding job titles as required by the Nakao and Treas and Blishen et al. SES scales.
The advantage of needing only a superordinate job category to classify SES would likely assist researchers with
obtaining and using SES data in their studies.
However, the results of this study should not be taken to imply that educational attainment, specific job titles,
or other family information are unnecessary. The present study employed a range of information in determining a
job category. In addition, results may differ among dissimilar populations or in a study with a different purpose. Also,
the differences in interrater and intermeasure concordance within and across different family groups high- light the
need for individual attention to be given to each individual case, even if overall values of agreement are high. We
also used only IQ and achievement performances as validation measures hypothesized to be related to SES. We also
did not obtain direct measurements of prestige or income, and we did not take into account other factors that may
have affected SES categorization (e.g., interviews with participant families to further elucidate child support
payments, recent changes to jobs, and other sources of in- come). Finally, the higher correlations between
occupation and the full SES measures compared to those between education and the full SES measures may in part be
related to measurement issues; both the Blishen et al. and Nakao and Treas scales rate occupations/job titles
directly, but neither explicitly includes education in deriving its final score.
A final purpose of this study was to add to validity information for the measures utilized. Consistent with
previous findings, SES measures were found to be related to measures of IQ and to at least some degree to
academic achievement in reading (Cornwall, 1992; Low et al., 1992; White, 1982). The correlations, although small to
moderate, were consistent across all three of the full SES measures used, as well as with occupational or
educational category alone. The correlations with SES measures were lower for reading achievement than for IQ,
which may in part be related to relatively low scores and slightly reduced variance on the reading measure; this
pattern of performance is not surprising given that the participants were referred based on difficulty in reading.
However, issues associated with the range and level of reading performance cannot explain the difference in
correlation entirely because both IQ and reading scores were relatively normally distributed in the total sample. The
overall relation of these measures of SES to IQ was consistent with, and in most cases higher than, the relations of
SES with developmental indices reported by Gottfried (1985). Spelling and math achievement generally were
unrelated to SES, which suggests that the SES procedure to follow may vary with the object of study.
One of the more interesting findings from this study was that within families with only one wage earner,
interrater and intermeasure concordance was lower for female wage earners (κ range = .36 to .64) than male wage
earners (κ range = .58 to .72). The reduced interrater concordance does not appear to be due to systematic bias
among the raters themselves. In addition, the reduced intermeasure concordance does not appear to be due to
difficulty in classifying female occupations per se but appeared specific to one-wage-earner families. Findings of
lower concordance may also be related to sample characteristics and/or the distribution of SES scores in the female
wage earners, such as a low N, truncated ranges, outliers, nonnormal distributions, or overall level of SES (e.g.,
more male wage earners coming from two-parent house- holds in which only a single income is necessary, or the
relatively greater number of males in current high-income positions such as computer and technological sciences).
The above issues are especially relevant given the development of newer measures of SES in the context of an
increasing number of dual-wage-earner families, the developing (but certainly not complete) equity of male and
female jobs, and the growing percentage of female workers and a wider variety of jobs that women now perform
relative to when the SES scales were derived.
Future work could address some of the limitations of this study by the use of additional or alternate modes
of data collection (e.g., extended interview versus predominantly questionnaire), by the use of more recent indices of
SES, the incorporation of other related information such as income, and the measurement and utilization of SES in
different familial contexts, as well as additional measurements of validity measures, and in differing populations.
Such a direction will improve the utility of the SES construct in studies of achievement and other areas of
behavioral research.

REFERENCES
Alonge, M. F. (1991). Determinants of sexual behavior among in-school
adolescents: Implications for counseling. Nigerian Journal of Guid- ance and Counseling, 4(1-2), 79-86.
Barratt, M. S., Roach, M. A., & Leavitt, L. A. (1996). The impact of low- risk prematurity on maternal behaviour and toddler outcomes. Inter- national Journal of Behavioral Development, 19, 581-602.
Blishen, B. R., Carroll, W. K., & Moore, C. (1987). The 1981 socioeco- nomic index for occupations in Canada. Canadian Review of Sociol- ogy and Anthropology, 24, 465-488.
Cohen, J. (1960). A coefficient of agreement for nominal scales. Educa- tional and Psychological Measurement, 20, 37-46.
Cornwall, A. (1992). The relationship of phonological awareness, rapid naming, and verbal memory to severe reading and spelling disability. Journal of Learning Disabilities, 25, 532-538.
Cuffe, S. P., Waller, J. L., Cuccaro, M. L., Pumariega, A. J., & Garrison, C. Z. (1995). Race and gender differences in the treatment of psychi- atric disorders in young adolescents. Journal of the American Acad- emy of Child and Adolescent Psychiatry, 34, 1536-1543.
Edwards-Hewitt, T., & Gray, J. J. (1995). Comparison of measures of so- cioeconomic status between ethnic groups. Psychological Reports, 77, 699-702.
Entwisle, D. R., & Astone, N. M. (1994). Some practical guidelines for measuring youth’s race/ethnicity and socioeconomic status. Child Development, 65, 1521-1540.
Felton, R. H., Naylor, C. E., & Wood, F. B. (1990). Neuropsychological profile of adult dyslexics. Brain and Language, 39, 485-497.
Garrison, C. Z., Waller, J. L., Cuffe, S. P., & McKeown, R. E. (1997). In- cidence of major depressive disorder and dysthymia in young adoles- cents. Journal of the American Academy of Child and Adolescent Psychiatry, 36, 458-465.
Gottfried, A. W. (1985). Measures of socioeconomic status in child de- velopment research: Data and recommendations. Merrill-Palmer Quarterly, 31(1), 85-92.
Hays, W. L. (1988). Statistics (4th ed.). Orlando, FL: Harcourt Brace
Jovanovich.
Hintze, J. L. (1996). Power analysis and sample size for windows (PASS
6.0). Kaysville, UT: Number Cruncher Statistical Systems.
Hollingshead, A. B. (1975). Four factor index of social status. Unpub- lished manuscript, Yale University, NewHaven, CT.
Kaufman, A., & Kaufman, N. (1990). Kaufman brief intelligence test.
Circle Pines, MN: American Guidance Service.
Landis, J. R., & Koch, G. G. (1977). The measurement of observer agree- ment for categorical data. Biometrics, 33, 159-174.
Low, J. A., Handley-Derry, M. H., Burke, S. O., Peters, R. D., Pater, E. A., Killen, H. L., et al. (1992). Association of intrauterine fetal growth re- tardation and learning deficits at age 9 to 11 years. American Journal of Obstetrics and Gynecology, 167, 1499-1506.
Mueller, C. W., & Parcel, T. L. (1981). Measures of socioeconomic sta- tus: Alternatives and recommendations. Child Development, 52, 13- 30.
Murphy, J. M., Olivier, D. C., Monson, R. R., & Sobol, A. M. (1991). De- pression and anxiety in relation to social status: A prospective epidemiologic study. Archives of General Psychiatry, 48, 223-229.
Nakao, K., & Treas, J. (1992). The 1989 socioeconomic index of occupa- tions: Construction from the 1989 occupational prestige scores (Gen- eral Social Survey Methodological Report No. 74). Chicago: Univer- sity of Chicago, National Opinion Research Center.
Pineo, P. C., & Porter, J. (1967). Occupational prestige in Canada. Cana- dian Review of Sociology and Anthropology, 4, 24-40.
Selden, R. (1990). Should test results be adjusted for socioeconomic dif- ferences? School Administrator, 47(5), 14-16.
Siegel, P. M. (1971). Prestige in the American occupational structure.
Unpublished doctoral dissertation, University of Chicago.
Spalding, A. D. (1995). Racial minorities and other high-risk groups with HIV and AIDS at increased risk for psychological problems in asso- ciation with health locus of control orientation. Social Work in Health Care, 21(3), 81-114.
Stevens, G., & Featherman, D. L. (1981). A revised socioeconomic index of occupational status. Social Science Research, 10, 364-395.
White, K. R. (1982). The relation between socioeconomic status and aca- demic achievement. Psychological Bulletin, 91, 461-481.
Woodcock, R. W. (1987). Woodcock reading mastery tests–revised. Cir- cle Pines, MN: American Guidance Service.
Paul T. Cirino is a developmental neuropsychologist, associate
director of the Regents Center for Learning Disorders, and an ad-
junct instructor at Georgia State University.
Christopher E. Chin is completing a postdoctoral fellowship in
clinical child psychology at the Yale Child Study Center; subse-
quently, he will be working as a pediatric psychologist in the De-
partment of Psychology/Neuropsychology at the Children’s
Hospital of Richmond, Virginia.
Rose A. Sevcik is a developmental psychologist and associate
professor in the Department of Psychology at Georgia State
University.
Maryanne Wolf is a professor in the Eliot Pearson Department
of Child Development at Tufts University, director of the Center
for Reading and Language Research, and a research scientist in
the Department of Psychiatry at McLean Hospital, Harvard Med-
ical School.
Maureen Lovett is the director of the Learning Disabilities
Research Center, a senior scientist in the Brain and Behavior
Program at the Hospital for Sick Children, and professor in the
Departments of Pediatrics and Psychology, University of
Toronto.
Robin D. Morris is a developmental neuropsychologist and re-
gents professor of Psychology, and also holds appointments in
the Department of Educational Psychology and Special Educa-
tion. He is the associate dean of Research and Graduate Studies in
the College of Arts and Sciences at Georgia State University.
Related Documents