Measuring Service Quality in the LowCost Airline Industry Jonavan Barnes A thesis submitted to the Stirling Management School in fulfilment of the requirement for the Degree of DOCTOR OF PHILOSOPHY Stirling Management School University of Stirling January 2017

Welcome message from author
This document is posted to help you gain knowledge. Please leave a comment to let me know what you think about it! Share it to your friends and learn new things together.
Transcript
Measuring Service Quality in the Low-‐Cost Airline Industry
Jonavan Barnes
A thesis submitted to the Stirling Management School
in fulfilment of the requirement for the Degree of
DOCTOR OF PHILOSOPHY
Stirling Management School University of Stirling
January 2017

2
STATEMENT OF ORIGINALITY
This assignment was prepared by Jonavan Barnes, for submission of the Ph.D. at the
University of Stirling. This is entirely my own individual work, all resources have been
acknowledged and it has not been submitted previously for any other academic award.
Student signature: ………………………… Date: ………………………………….

3
ACKNOWLEDGEMENTS
To Leigh Sparks: Thank you for your impressive patience and taking the chance on me,
at a time when no one else would.
To Ahmed Hegazy and Alexandra Webb: My Brother and Sister, thank you for
sharing an office with me for four years. Your companionship has enlightened me in
way you cannot imagine. I am a better person because I have you as friends.
To my best friend and lovely wife Katie: Meeting you was a miracle. Without
your support, I would not have finished the Ph.D. - I only hope that somehow I enrich
your life as much as you have mine. You are my favourite person in the world.
To my Mother: Even from 4,000 miles away, you never cease to be a mother.
You have been the greatest support through any of my numerous endeavours. I have
been extremely fortunate to have your hard work and vigilance as a positive example in
my life.
To my Father: I am sure that you never completely understood what I was
doing or why I needed a Ph.D. However, I know that you wanted me to finish and I
hope that you would be proud.
4
CONTENTS
ABSTRACT ........................................................................................................................... 11
CHAPTER ONE: INTRODUCTION ........................................................................................... 12
1.1 INTRODUCTION .................................................................................................................................... 12
1.2 WHAT IS SERVICE QUALITY? ............................................................................................................... 14
1.3 SERVICE QUALITY IN CONTEXT ............................................................................................................ 15
1.4 JUSTIFICATION ...................................................................................................................................... 17
1.4.1 IMPORTANCE TO THE SERVICE QUALITY LITERATURE ...................................................................... 17
1.4.2 IMPORTANCE TO THE AIRLINE INDUSTRY ......................................................................................... 18
1.5 STRUCTURE .......................................................................................................................................... 20
1.5.1 CHAPTER TWO: THE AIRLINE INDUSTRY .......................................................................................... 20
1.5.2 CHAPTER THREE: SERVICE QUALITY IN THE AIRLINE INDUSTRY ...................................................... 20
1.5.3 CHAPTER FOUR: MEASURING SERVICE QUALITY ............................................................................ 20
1.5.4 CHAPTER FIVE: METHODOLOGY ...................................................................................................... 21
1.5.5 CHAPTER SEVEN: FINDING THE DETERMINANTS OF AIRLINE QUALITY .......................................... 21
1.5.6 CHAPTER SIX: HIQUAL ................................................................................................................... 21
1.5.7 CHAPTER EIGHT: ALSI ..................................................................................................................... 22
1.5.8 CHAPTER NINE: DISCUSSION AND CONCLUSION ............................................................................. 22
CHAPTER TWO: THE AIRLINE INDUSTRY ............................................................................... 23
2.1 INTRODUCTION .................................................................................................................................... 23
2.2 AIRLINE HISTORY ................................................................................................................................. 25
2.2.1 BEFORE 1942 .................................................................................................................................. 25
2.2.2 POST-‐WAR ....................................................................................................................................... 27
2.2.3 BILATERAL AGREEMENTS ................................................................................................................. 29
2.2.4 POST-‐DEREGULATION ...................................................................................................................... 32
2.2.5 GLOBAL ALLIANCES .......................................................................................................................... 34
5
2.2.6 THE NEW GENERATION ................................................................................................................... 35
2.3 THE TRADITIONAL BUSINESS MODEL ................................................................................................. 37
2.3.1 REGIONAL AIRLINES .......................................................................................................................... 39
2.4 THE LOW-‐COST CARRIER .................................................................................................................... 40
2.5 THE LOW-‐COST CARRIER BUSINESS MODEL ..................................................................................... 43
2.6 TYPES OF LOW-‐COST CARRIERS .......................................................................................................... 49
2.6.1 SOUTHWEST COPYCATS ................................................................................................................... 49
2.6.2 SUBSIDIARIES .................................................................................................................................... 50
2.6.3 COST CUTTERS .................................................................................................................................. 50
2.6.4 DIVERSIFIED CHARTER CARRIERS ..................................................................................................... 51
2.6.5 STATE SUBSIDISED COMPETING ON PRICE ...................................................................................... 51
2.7 CURRENT CHALLENGES FACING THE LOW-‐COST CARRIER INDUSTRY .............................................. 51
2.8 THE MODERN AIRLINE INDUSTRY ....................................................................................................... 53
2.9 CONCLUSION ........................................................................................................................................ 54
CHAPTER THREE: SERVICE QUALITY IN THE AIRLINE INDUSTRY ............................................ 57
3.1 INTRODUCTION .................................................................................................................................... 57
3.2 PHASES OF THE AIR TRAVEL EXPERIENCE ........................................................................................... 58
3.3 AIRPORT PHASE ................................................................................................................................... 59
3.3.1 TICKETING ......................................................................................................................................... 60
3.3.2 SECURITY ........................................................................................................................................... 61
3.3.3 AIRPORT RETAILING ......................................................................................................................... 62
3.3.4 AIRPORT SERVICE QUALITY .............................................................................................................. 64
3.4 THE IN-‐FLIGHT PHASE ......................................................................................................................... 65
3.5 THE AIRLINE “PRODUCT” .................................................................................................................... 66
3.5.1 SERVICE QUALITY IN THE LOW-‐COST CARRIERS .............................................................................. 67
3.5.2 IN-‐FLIGHT RETAILING ....................................................................................................................... 70
3.5.3 THE IMPORTANCE OF SERVICE QUALITY TO PROFITABILITY ............................................................ 72
6
3.6 CONCLUSION ........................................................................................................................................ 74
CHAPTER FOUR: SERVICE QUALITY ...................................................................................... 78
4.1 SERVICE ATTRIBUTES ........................................................................................................................... 78
4.1.1 CHARACTERISING SERVICES .............................................................................................................. 78
4.1.2 CLASSIFYING SERVICES ..................................................................................................................... 80
4.2 THE ROLE OF CUSTOMER SATISFACTION ........................................................................................... 82
4.3 MEASURING SERVICE OUTPUTS ......................................................................................................... 84
4.4 THE NORDIC SCHOOL IN-‐DEPTH ........................................................................................................ 87
4.5 THE AMERICAN SCHOOL IN-‐DEPTH .................................................................................................... 89
4.5.1 SERVQUAL ..................................................................................................................................... 90
4.5.2 CRITICISMS OF SERVQUAL ............................................................................................................ 93
4.5.3 SERVPERF ...................................................................................................................................... 96
4.5.4 SERVPEX ......................................................................................................................................... 99
4.5.5 BRADY AND CRONIN’S HIERARCHICAL MODEL (HIQUAL) ......................................................... 100
4.6 OTHER MODELS ................................................................................................................................. 102
4.6.1 ATTRIBUTE SERVICE QUALITY MODEL .......................................................................................... 102
4.6.2 SYNTHESISED SERVICE MODEL ..................................................................................................... 103
4.6.3 IDEAL VALUE MODEL OF SERVICE QUALITY ................................................................................. 104
4.6.4 EP FRAMEWORK AND THE NORMED QUALITY MODELS ............................................................. 105
4.6.5 IT-‐SPECIFIC MODELS ..................................................................................................................... 105
4.6.6 THE ATTRIBUTE AND OVERALL EFFECT MODELS ......................................................................... 105
4.6.7 MODEL OF SERVICE QUALITY AND SATISFACTION ....................................................................... 107
4.6.8 P-‐C-‐P MODEL OF SERVICE ATTRIBUTES ....................................................................................... 108
4.6.9 RETAIL SERVICE QUALITY AND PERCEIVED VALUE MODELS ........................................................ 109
4.6.10 SERVICE QUALITY, CUSTOMER VALUE AND CUSTOMER SATISFACTION MODEL ...................... 109
4.6.11 ANTECEDENTS AND MEDIATOR MODEL .................................................................................... 110
4.7 AN INDEXING APPROACH TO SERVICE QUALITY MEASUREMENT .................................................. 111
7
4.7.1 CUSTOMER SATISFACTION INDEXES .............................................................................................. 111
4.7.2 THE AIRLINE QUALITY RATING ...................................................................................................... 112
4.8 MEASURING SERVICE QUALITY IN THE AIRLINE INDUSTRY ............................................................. 117
4.9 CONCLUSION ...................................................................................................................................... 119
CHAPTER FIVE: METHODOLOGY ........................................................................................ 123
5.1 INTRODUCTION .................................................................................................................................. 123
5.2 RESEARCH AIM AND OBJECTIVES ...................................................................................................... 124
5.3 RESEARCH PARADIGM ....................................................................................................................... 126
5.4 ACHIEVING THE OBJECTIVES ............................................................................................................. 129
5.5 THE SUBJECTS .................................................................................................................................... 135
5.5.1 RYANAIR ........................................................................................................................................ 135
5.5.2 EASYJET ......................................................................................................................................... 137
5.5.3 JET2.COM ...................................................................................................................................... 139
5.5.4 BMIBABY ........................................................................................................................................ 140
5.5.5 FLYBE ............................................................................................................................................. 140
5.6 CONCLUSION ...................................................................................................................................... 140
CHAPTER SIX: A QUANTITATIVE MEASUREMENT ............................................................... 142
6.1 INTRODUCTION .................................................................................................................................. 142
6.2 HIQUAL FRAMEWORK ..................................................................................................................... 144
6.2.1 INTERACTION QUALITY .................................................................................................................. 144
6.2.2 SERVICE ENVIRONMENT QUALITY ................................................................................................. 145
6.2.3 OUTCOME QUALITY ...................................................................................................................... 148
6.3 SURVEY CONSTRUCTION ................................................................................................................... 150
6.3.1 INITIAL QUESTIONS ........................................................................................................................ 150
6.3.2 HIQUAL QUESTIONS .................................................................................................................... 150
6.3.3 ADDITIONAL QUESTIONS ............................................................................................................... 155
8
6.4 DATA COLLECTION ............................................................................................................................. 156
6.4.1 THE POPULATION .......................................................................................................................... 156
6.4.2 THE SAMPLE .................................................................................................................................. 156
6.4.3 ANALYSIS OF THE DATA ................................................................................................................. 158
6.4.4 DISTRIBUTION ................................................................................................................................ 159
6.4.5 DEMOGRAPHICS OF RESPONDENTS .............................................................................................. 161
6.5.1 ADJUDGING MODEL FIT ................................................................................................................ 163
6.5.2 PATH ANALYSIS ............................................................................................................................. 165
6.6 DISCUSSION ........................................................................................................................................ 172
6.7 LIMITATIONS ...................................................................................................................................... 174
6.8 IMPLICATIONS FOR FUTURE RESEARCH ............................................................................................ 174
6.9 CONCLUSION ...................................................................................................................................... 175
CHAPTER SEVEN: FINDING THE DETERMINANTS OF SERVICE QUALITY IN THE LOW-‐COST
AIRLINE INDUSTRY ……………………….……………………….……………………….……………………….………176
7.1 INTRODUCTION .................................................................................................................................. 176
7.2 INDUSTRY WATCHERS ....................................................................................................................... 177
7.2.1 WHICH? ......................................................................................................................................... 177
7.2.2 SKYTRAX ......................................................................................................................................... 180
7.2.3 TRIPADVISOR ................................................................................................................................. 182
7.3 CONTENT ANALYSIS STUDY ............................................................................................................... 183
7.4 THE DETERMINANTS .......................................................................................................................... 185
7.4.1 OVERVIEW: RYANAIR AND EASYJET .............................................................................................. 185
7.4.2 BAGGAGE HANDLING AND POLICY ............................................................................................... 187
7.4.3 BOARDING AND CHECK-‐IN ............................................................................................................ 188
7.4.4 PENALTY FEES AND APPLICATION OF POLICY ............................................................................... 191
7.4.5 STAFF BEHAVIOUR ......................................................................................................................... 193
7.4.6 WORD FREQUENCY QUERY RESULTS ........................................................................................... 194
9
7.5 OTHER FACTORS ............................................................................................................................. 196
7.5.1 CONSUMER’S KNOWLEDGE AND EXPERIENCE .............................................................................. 196
7.5.2 FELLOW PASSENGERS .................................................................................................................... 197
7.5.3 THE AIRPORT EXPERIENCE ............................................................................................................ 199
7.5.4 VALUE FOR MONEY ....................................................................................................................... 200
7.6 LIMITATIONS ...................................................................................................................................... 201
7.7 CONCLUSION ...................................................................................................................................... 201
CHAPTER EIGHT: THE AIRLINE SERVICE QUALITY INDICATOR ............................................. 204
8.1 INTRODUCTION .................................................................................................................................. 204
8.2 THE VARIABLES .................................................................................................................................. 206
8.2.1 ON-‐TIME PERFORMANCE ............................................................................................................. 208
8.2.2 TICKET PRICE ................................................................................................................................. 208
8.2.3 ROUTE CAPACITY ........................................................................................................................... 209
8.2.4 LOAD FACTOR ................................................................................................................................ 210
8.2.5 ALLOCATED SEATING ..................................................................................................................... 210
8.2.6 BAGGAGE ....................................................................................................................................... 211
8.2.7 AVERAGE AGE OF AIRCRAFT ......................................................................................................... 213
8.2.8 NUMBER OF ACCIDENTS ............................................................................................................... 213
8.2.9 EMPLOYEE CONTENTMENT ........................................................................................................... 214
8.3 METHODOLOGY ................................................................................................................................. 215
8.3.1 THE WEIGHTS ................................................................................................................................ 216
8.3.2 GATHERING THE DATA .................................................................................................................. 217
8.3.3 MEASURING THE IMPACT ON ANCILLARY REVENUE .................................................................... 220
8.4 ALSI RESULTS .................................................................................................................................... 221
8.5 DISCUSSION ........................................................................................................................................ 226
8.5.1 THE RELATIONSHIP BETWEEN QUALITY AND VALUE ................................................................... 227
8.5.2 MEASURING THE IMPACT ON ANCILLARY REVENUE .................................................................... 228
10
8.7 CONCLUSION ...................................................................................................................................... 229
8.7.1 SHIFTING RESEARCH PHILOSOPHY ................................................................................................ 231
8.7.2 LIMITATIONS .................................................................................................................................. 231
8.7.3 IMPLICATIONS FOR FURTHER RESEARCH ...................................................................................... 232
CHAPTER NINE: DISCUSSION AND CONCLUSION ................................................................ 233
9.1 INTRODUCTION .................................................................................................................................. 233
9.2 THE LITERATURE REVIEW .................................................................................................................. 234
9.2.1 THE AIRLINE INDUSTRY ................................................................................................................. 234
9.2.2 SERVICE QUALITY .......................................................................................................................... 236
9.3 THE RESEARCH ................................................................................................................................... 237
9.3.1 THE CONTENT ANALYSIS STUDY ................................................................................................... 237
9.3.2 THE HIQUAL STUDY .................................................................................................................... 241
9.3.3 THE ALSI STUDY ........................................................................................................................... 244
9.3.4 RELATIONSHIP BETWEEN STUDIES ................................................................................................ 248
9.4 CONTRIBUTIONS ................................................................................................................................ 249
9.4.1 CONTRIBUTIONS TO THE SERVICE QUALITY LITERATURE ............................................................. 249
9.4.2 CONTRIBUTIONS TO PRACTISE ...................................................................................................... 251
9.4.3 CONTRIBUTIONS TO INDUSTRY ..................................................................................................... 251
9.5 LIMITATIONS ...................................................................................................................................... 253
9.6 IMPLICATIONS FOR FUTURE RESEARCH ............................................................................................ 255
9.7 CONCLUSION ...................................................................................................................................... 256
BIBLIOGRAPHY .................................................................................................................. 258
APPENDIX: SURVEY ........................................................................................................... 270
11
ABSTRACT
Since the end of World War II, the service sector has expanded to encompass over 80%
of the economy of most developed nations. This places an immense importance on the
ability to accurately measure service outputs. However, the most precise method of
measuring these outputs is still unclear. This thesis examines Service Quality as a
measurement of service outputs, and tests this within an industry-specific context: the
low-cost sector of the UK airline industry. This is an industry that has been facing
serious challenges since market liberalisation began in 1976. This thesis recognises that
offering superior quality may allow airlines to gain a competitive advantage; despite
this, there is still no preferred method of measuring Service Quality in this specific
context. This PhD therefore examines three methods of Service Quality measurement
in the context of the low-cost sector of the UK airline industry: a qualitative method
(content analysis), a quantitative survey approach (HiQUAL) and an indexing approach
(ALSI). The first study provides an in-depth analysis of the determinants of airline
quality through a content analysis study. The second study uses a neglected
measurement of Service Quality (HiQUAL) to take a quantitative measurement of
Service Quality in the low-cost airline industry. The third study uses measurement
(ALSI), an indexing approach, to provide an indication of airline quality. The results of
this PhD define the determinants of Service Quality in the low-cost airline industry and
confirm the hierarchical nature of Service Quality. This PhD also develops a novel
objective metric that represents a shift in ontology from subjective to objective
measurements of Service Quality.
12
CHAPTER ONE: INTRODUCTION
1.1 Introduction
In early pre-industrial societies, large portions of the labour force were dominated by
agricultural endeavours. Work in these societies was challenging and success was
largely dependent on an individual's physical ability. Life was centred around the rise
and fall of the sun and the changing of seasons. Large families were a necessity for
survival and economic prosperity (Bell, 1976). Industrialisation brought division of
labour resulting in semi-skilled workers. In these societies, the clock dictated life and
energy replaced raw muscle power. Innovation in industrial societies came from
thoughtful tinkerers: experimenters and inventors, whose developments made life
more efficient (Bell, 1976).
Industrial expansion happened almost simultaneously in Europe and North
America, while in places like South America and Asia, they took place at a much slower
rate. Industrialism has become synonymous with the successful development of
society. However, a society's industrial expansion will eventually reach its pinnacle. For
the western world, this happened in the early 20th century during the Second World
War.
The short time between 1941 and 1945 saw death and destruction on a global
scale. Fighting the war required the production of vast quantities of food, equipment
and munitions. Such high levels of production were unprecedented and greatly
expanded the capabilities of countries involved. Immediately following the war,
production returned from weapons and munitions to domestic products, leaving
countries with an excess of production capability (Bell, 1976). This was especially true
in the United States where, unlike Europe and Japan, there had been little damage to
plant, property and equipment.
13
In post-war society, the semi-skilled labour required for manufacturing was at
an all-time high. This encouraged the population to enter more specialised fields,
causing industrial expansion to slow and giving rise to more service based industries.
Therefore, in the decades since the Second World War, the economies of developed
nations shifted from manufacturing to service dominance (Bell, 1976).
In recent years this shift has become extensive, with services making up around
80% GDP of many North American and European countries (Zeithaml & Bitner, 2003).
Reasons for this transformation have been multifaceted: off-shoring to developing
nations, increasing domestic costs of labour, increased specialisation of the workforce,
improved technologies, and ease of access to higher education have all played a role in
establishing service dominance (Zeithaml & Bitner, 2003). Today’s society no longer
places the semi-skilled labourer as the backbone of civilisation. Rather, the central
person in this society is now the doctor, the lawyer, the accountant, the hair stylist, the
auto-mechanic or any other professional. These individuals are equipped with a
specific education and training that allows them to offer specialised services. In the
service dominant society, innovation comes not from the increased physical
capabilities of the workforce, but from the development and application of theoretical
knowledge (Bell, 1976).
With the economic shift from an industrial to service society comes a unique
problem: how to measure output quality. During the agricultural and industrial phases,
a society can accurately measure its outputs by measuring them against an expected
outcome or ideal model (for example, the farmer can compare crop yields
longitudinally from year to year and the manufacturer can compare production outputs
against specified design standards). This allows for easy forecasting and is attractive to
investors. Once a society has transitioned to service dominance, the accurate
measurement of output quality becomes more complex (Berry, Zeithaml, &
Parasuraman, 1985).
14
Many service firms have attempted to define their outputs in terms similar to
the manufacturing industry (for example, by measuring the time it takes to serve each
customer or the number of customers served); however, this is not always ideal
(Crosby, 1979; Johnson, Tsiros, & Lancioni, 1995). Although such measurements are
attractive to many services due to their cost effective nature, easy comprehension,
comparability and objectiveness, firms that adopt this type of strategy can easily
overlook the value of the customer’s experience. Adopting a strict production focus can
cause a firm’s operating strategy to become disconnected from the consumer’s needs
and will undoubtedly have a negative financial impact on the firm (Christian Grönroos
& Ojasalo, 2004). In addition to this, a lack of output measurability can make
attracting investment more difficult for service firms (Alfaro, 2003). With such a high
portion of developed nation’s GDP being derived from the service sector, the accurate
determination of output quality in the service sector becomes paramount.
1.2 What is Service Quality?
By their very nature, services have unique properties that can complicate marketing
(Zeithaml & Bitner, 2003). Contrary to buying a manufactured good, the consumer
cannot sample a service before purchasing. This increases risk to the consumer, leaving
the service provider predominantly motivated to reduce this risk (Shostack, 1977).
Managing output quality can be an effective strategy for service providers in alleviating
the consumer's pre-purchase anxiety (Gronroos, 1984). However, unlike
manufacturing systems, service outputs can be complicated to measure. A
manufacturer can define quality by establishing various physical constraints of an end
product. However, this is not possible for the service provider. The determinants of
quality are therefore often left to the consumer. This has led to considerably debate
concerning the best method of capturing the consumer's perception of service outputs
15
(for example, Service Quality). Unfortunately, as Christian Grönroos (1982) noted;
service firms seem to be the last to adopt a customer centred focus.
Popular Service Quality literature began in the early 1980s and has been largely
dominated by two schools of thought: the “Nordic” school (Gronroos, 1984) and the
American School (Parasuraman, zeithaml, & Berry, 1985; Parasuraman, Zeithaml, &
Berry, 1994; Zeithaml, Berry, & Parasuraman, 1988). This early work was grounded in
the disinformation paradigm associated with the manufacturing literature, which
Grönroos (1982, 1984) adapted to fit the service sector. The premise of the paradigm
centres on a disconformity between the perception of Service Quality evaluated by the
consumer, and the level of Service Quality the consumer expects. This dichotomy
between perception and expectation led to the development of the Gap Model by
Parasurman, Zeithaml and Berry (1985) that later led to the development of the more
popular SERVQUAL scale.
Despite early and continuing criticisms, the SERVQUAL scale (or some
modification thereof) remains the dominant metric in application. It is in widespread
use in both managerial decision making and academia. Early criticisms (Babakus &
Boller 1992; Carman 1990; Cronin & Taylor 1992) have led to alternate measures being
developed; however, no alternative has had such widespread implementation within
industries as SERVQUAL. The genesis of modern Service Quality theory, its major
developments and the various scales (with their advantages and disadvantages) will be
discussed in-depth in subsequent chapters in this thesis.
1.3 Service Quality in Context
The context of this research in Service Quality is the airline industry. Within the past
few decades there have been significant changes to this industry on a global scale.
Liberal “open-skies” agreements, legislation, rising fuel costs and increased
competition have all contributed to the deterioration of profit margins for many of the
16
world’s airlines. Despite these pressures, demand for air travel is forecasted to continue
its upward trend (Doganis, 2006; IATA, 2012). This increase in demand, coupled with
ever shrinking margins represents a serious challenge for the airlines (Belobaba,
Odoni, & Barnhart, 2015). This has caused many long-standing players in the industry
(particularly within Europe) to rethink their competitive and operational strategies in
order to meet the market demands and maintain profitability.
While many traditional carriers are struggling with the challenges of the
modern air travel market, the low-cost carriers (hereafter LCCs), which implement
novel business strategies, have found success. These airlines provide a unique context
when studying Service Quality. As their name implies, these airlines operate under a
different business strategy than traditional airlines, primarily by having a universal
focus on reducing ticket prices. Low ticket prices are maintained through the reduction
of fixed costs, resulting in LCCs being among the most profitable of airlines in the
world.
High fixed costs are a characteristic of the airline industry as a whole (Belobaba,
Odoni and Barnhardt, 2010) and effective management of these costs is critical to
industry survival (Doganis, 2006). However, the strategy of cost reduction is a zero-
sum game. A point exists at which the Law of Diminishing Return makes further cost
reducing measures, or reductions in service, unprofitable. Since many of the fixed costs
are common among airlines operating in a given market (for example, fuel, landing
fees, taxes, governmental fees and even aircraft type), it is certainly feasible for several
airlines in a given market to have similar break-even points. This could make the
minimum ticket price very similar. Furthermore, excessive cost-cutting can negatively
affect Service Quality in some instances, causing consumers to seek better value
services elsewhere (Christian Grönroos & Ojasalo, 2004). Collectively, these factors
make it very difficult to compete on price alone. Therefore, in the very near future,
airlines (especially LCCs) will need to develop different competitive strategies and
offering superior service could be one of these.
17
The LCC offers a unique experience than that of the traditional airline. Most
notably is the unbundling of inclusive service. The purchase of a LCC ticket provides
the passenger with no additional services other than the right to board a specific
aircraft, at a specified time. Additional amenities (such as extra baggage, in-flight
food/entertainment) are still available to the passenger, however these must be
purchased in addition to the base fare. This allows the consumer to tailor the airline
experience to their needs and budget. However, in-flight retailing has created a unique
situation where the airline is not only functioning as a service provider, but as a
retailer. This raises a debate over the effect of Service Quality on consumer's purchases
intentions. Superior Service Quality may result in an increased competitive advantage.
Therefore, the mechanisms by which consumers measure and evaluate service in the
low-cost airline industry become extremely important.
1.4 Justification
This thesis is justified by both a continued debate within the Service Quality literature
and the challenges faced by the low-cost airline industry. This sections seeks to
illustrate why the research is important in both theory and context.
1.4.1 Importance to the Service Quality Literature
The best possible instrument with which to measure Service Quality has been the
subject of debate since the late 1980s (Babakus & Boller, 1992; Cronin & Taylor, 1992,
1994). This study does not seek to resolve this debate; rather, this study takes the
position that there is no singularly best instrument for which to measure Service
Quality and among the popular metrics, no universality exists across industries.
Therefore, this research argues there may be an advantage to creating industry specific
measurements (Carrillat, Jaramillo, & Mulki, 2007; Jain & Gupta, 2004).
18
There is a need to revisit an appealing, yet long neglected, Service Quality
model developed by Brady and Cronin (Brady & Cronin 2001). Their Hierarchical
Effects Model (hereafter HiQUAL) has high predictive strength along with attractive
face validity. This model needs further attention in current Service Quality research, if
only to add to the diversity of Service Quality measurements in the literature. Brady
and Cronin (Brady & Cronin, 2001) outline the need for modification of the model to fit
various industries, however did not take measures to assess the concept. This study
offers support for adapting and applying HiQUAL to the airline industry.
Following the modification and reintroduction of HiQUAL, this study to
investigates the possibility Service Quality can be defined in more objective and
quantifiable terms. This involves the development of an indexing approach to
measuring Service Quality in the LCC industry. This could push the theory from a
purely subjective standpoint into a more objective ontology. Currently, there is no
mention within the Service Quality literature necessitating an ontological shift;
however, this research investigates this need and the benefits of objective
measurement. Such a shift will help Service Quality to better parallel the Customer
Satisfaction literature (Anderson & Fornell, 2000; Fornell, 1992; Fornell, Johnson,
Anderson, Cha, & Bryant, 1996; Johnson, Gustafsson, Andreassen, Lervik, & Cha,
2001). These two theories are both closely related, yet remain independent drivers of
consumer behaviour (Dabholkar, Shepherd, & Thorpe, 2000); therefore, it necessitates
that they both have individual, objective systems of measurement. If both attributes
could be measured in objective terms, the two items more would be comparable and
would greatly increase the understanding of consumer's behavioural intentions.
1.4.2 Importance to the Airline Industry
The competitive strategy of the major LCCs seems a contradiction to the time-
honoured sales mantra: “Give the people what they want” (Delfmann, 2005). They
19
offer limited service, yet attempt to generate revenues from the sale of additional
services and on-board goods. The industry recognises the importance of in-flight
retailing to their profit margins (Pate & Beaumont, 2006), with major industry
conferences (such as the Airline Retail Conference in London) dedicated to the sole
subject of in-flight retailing and ancillary revenue generation. The industry must
increase its understanding of the impact of Service Quality on in-flight sales before
service diminishes further.
Unfortunately, very little academic research has been directed toward Service
Quality in the airline industry. While studying Korean and Australian air travellers,
Park, Robertson and Wu (Park, Robertson, & Wu, 2004) identified Service Quality as a
contributing factor to consumer repurchase behaviour; however, it is safe to assume
that the impact of Service Quality is further reaching. As well, Bowen, Headley and
Luedtke (Bowen & Headley, 2007; Bowen, Headley, & Luedtke, 1991) created the best
known measurement of airline quality, the Airline Quality Rating (AQR). While this
was a giant step in the right direction for measuring airline quality, its applicability to
markets outside the United States is questionable. Further investigation is necessary to
bring the AQR up-to-date with modern Service Quality theory and to determine if such
a measurement is possible outside of the United States and within the strict context
low-cost airlines.
The development of a more objective scale for measuring Service Quality in the
airline industry would again be beneficial to consumers and industry professionals
alike. Consumers will benefit from an easily accessible, unbiased and comparable tool
to aide in making pre-purchase decisions. Industry professionals will also benefit from
an unbiased evaluation of service performance that is not only strictly objective, but
comparable, easy to calculate and interpret. This could help identify strengths and
weakness in competitive strategy as well as provide a tool to attract investment.
20
1.5 Structure
1.5.1 Chapter Two: The Airline Industry
Chapter Two provides the contextual framework for this research. It gives justification
for a focus on the airline industry within the UK. A background of aviation history is
followed by a description of industry characteristics. This leads into a discussion of
current challenges facing the industry. The chapter concludes with justification for the
focus on Service Quality in the airline industry and confirm its relevance to the Service
Quality literature.
1.5.2 Chapter Three: Service Quality in the Airline Industry
This chapter continues the contextual discussion from Chapter Two by focusing on the
value of Service Quality in the airline industry. It begins by examining the air travel
experience as a whole, from the consumer's perspective. An important link is made
between the hierarchical nature of Service Quality in the airport industry and the need
to demonstrate the same in the airline industry. The chapter then moves into a
discussion concerning the possible effects of Service Quality to an airline's profitability.
The chapter concludes with specific research questions that will be examined in detail
in Chapter Five: Methodology.
1.5.3 Chapter Four: Measuring Service Quality
Chapter Four provides the theoretical framework for the research in this PhD, through
a critical review of the Service Quality literature. This chapter specifically highlights
relevant gaps within Service Quality. The individualities of the service sector will be
discussed, followed by a review of current schools of thought in Service Quality. This
leads into a review of the various popular Service Quality metrics employed in
21
academia and the industry: advantages and disadvantages of each are discussed. A
clear argument for more objective, industry-specific measurements of Service Quality
concludes the chapter.
1.5.4 Chapter Five: Methodology
Chapter Five details the methodologies applied within this research. It begins by
describing key elements of the research philosophy, and goes on to discuss the mixed-
methods approach used within this PhD, detailing both the qualitative and quantitative
methods used. The chapter provides a critical analysis of these methods alongside in-
depth descriptions of each study. It then moves into a clear justification for the data
collection, population sampling, and statistical analysis methods that were used. The
chapter further defines the contextual focus of the research by detailing the airlines to
be included or excluded from this study. This produces only two airlines that are
operating in UK markets and qualify as true LCCs: Ryanair and EasyJet.
1.5.5 Chapter Seven: Finding the Determinants of Airline Quality
This chapter seeks to identify the determinants of Service Quality in the low-cost airline
industry. It discusses the methods used by external industry watchers to evaluate
Service Quality in the airline industry. The sources covered in this chapter are Which?,
TripAdvisor and Skytrax. Each source has a unique method of determining the quality
of service, and advantages and disadvantages of each are discussed. This chapter also
sees the undertaking of a short content analysis of consumers’ comments on Skytrax
relating to Ryanair and EasyJet. A discussion of their results provides a qualitative
measurement of consumer’s opinions of the LCC experience and simultaneously
highlights any discrepancy or media bias toward the LCC.
1.5.6 Chapter Six: HiQUAL
22
This chapter draws heavily on the work of Brady and Cronin (2001) and revives their
hierarchical model of Service Quality. While the foundations of this theory are
discussed in Chapter Two, this chapter focuses on the application of the HiQUAL scale.
It presents a slight modification of the original hypothetical framework to fit the airline
industry and provides justifications for each modification. The resultant airline-specific
model is tested and the results are evaluated.
1.5.7 Chapter Eight: ALSI
This chapter draws heavily on the work of Bowen, Headley and Luedtke (1991, 2007) in
the United States and applies their Airline Quality Rating concept to the European
Market (as recommended by Headley and Bowen, 1997). Furthermore, it advances
their example by linking the AQR to more modern Service Quality theories. This
produces a measurement (ALSI) of Service Quality for UK based LCCs, Ryanair and
EasyJet. It concluded with the results of the study and discusses in detail its advantages
and limitations.
1.5.8 Chapter Nine: Discussion and Conclusion
A comprehensive evaluation of the research undertaken in the thesis is discussed in
Chapter Nine. It begins by assessing the findings of the literature review, and goes on
to review each research chapter in sequence. The conclusion of this chapter contains a
resolution of the research aims and questions, and illustrates the contribution to
literature. Limitations of this research along with implications for future research are
discussed.
23
CHAPTER TWO: THE AIRLINE INDUSTRY
This is the first of two contextual chapters of this study. It provides an in depth look at
the airline industry as a whole, beginning with an overview of major developments in
global airline history. The chapter then moves into a discussion of the various business
models that exist within the scheduled airline industry, providing the necessary
background for Chapter Three: Service Quality in the Airline Industry.
2.1 Introduction
The civilian aviation industry is immense. It is largely divided between two macro-
sectors: General Aviation1 and Scheduled Operations (airlines operating along
scheduled routes). The focus of this thesis is the scheduled air carrier industry2.
While the global airline industry is a diverse marketplace encompassing many
market segments, the scheduled air carrier industry can be categorised into two general
categories: full-service carriers (FSCs; these are also known as national carriers,
flagship carriers or traditional carriers), and low-cost carriers (LCCs; in some markets
these are known as low-cost airlines; in this thesis these terms are used
interchangeably). The FSCs have been in operation for some time (typically they are
considered traditional carriers if they have been operating before the deregulation act
in late 1970s) while the LCCs are relative newcomers to the market. They differ in their
levels of inclusive service, market strategies and operational characteristics. Both Full-
1 This the largest sector of the aviation industry in terms of number of aircraft and refers to a wide variety of operations including any unscheduled aviation operation from personal aircraft to air ambulance services or unscheduled passenger carriers such as charter airlines.
2 Within the context of this research “airline” refers to any scheduled air carrier operating in accordance FAA Regulations (Title 14 CFR - Part 121, 125, or 129) and CAA Official Record Series 1 (Part3) or any other similar certifying agency recognised by the ICAO.
24
Service Carriers and low-cost carriers airlines compete alongside each other for market
share based on several factors (Belobaba et al., 2015): i) frequency of flights along
scheduled routes; ii) price relative to other airlines (in liberalised markets); iii) quality
of service and products offered (this includes airport and in-flight service amenities).
It is difficult for any FSC or LCC (particularly FSCs) to gain a market advantage
in any of these areas, largely because the companies within the airline industry can take
decades to change business and operating strategies. The market demand for the
airline industry is closely tied to the economic, governmental and competitive forces
within the region of operation (Doganis, 2006): new technological developments,
increased competition, and operational and regulatory constraints set forth by
governments has changed the modern marketplace significantly from its position even
5 years ago. This has resulted in a constant pressure on the airline industry to adapt to
novel pressures.
In addition to managing viability within a fast-changing marketplace, many of
the world’s airlines have operated with extremely tight margins since the 1990s (largely
associated with rising fuel cost, increased competition and increased legislation), which
has led to demanding profitability issues (Doganis, 2006). The decline in airline
profitability margins was intensified following the liberalisation of the airline industry.
Prior to airline deregulation, governments viewed the airline industry as a domestic
utility (Doganis, 2006; Morrison & Winston, 1986; Westra, 2009; Williams, 1994); this
led to introduced controls such as defined routes, fixed pricing and subsidised
operating budgets. During this time, governments actively prevented competition
between carriers. This allowed carriers to operate free from competition. This was the
golden-age of airline travel when ticket prices were at a premium and service was at its
most luxurious. However, in 1978, the United States (US) Government became the first
to liberalise the airline industry as Congress passed The Airline Deregulation Act. This
began a trend that would eventually lead to market liberalisation across North America
and Europe. Not only did this remove access to operational subsidies from the
25
taxpayer, but deregulation forced operators into a competitive “open-skies” market.
With deregulation came increased competition, legislation, and shrinking margins
(Belobaba et al., 2015). In response, the industry has become a dynamic theatre of cost
reductions, mergers, code-sharing agreements, innovations in technology and both
operational and management strategy changes (Doganis, 2006).
The economic importance of the airline industry makes examining such issues
as profitability, competitive advantage, and sustainability of great significance to
researchers (MIT: Global Airline Industry, 2011). However, examining the airline
industry as a whole may overcomplicate some research because each division
(traditional carrier, regional airline, low-cost carriers, charter airline, or air taxis) has
its own unique properties. An understanding of the genesis of the modern airline
industry and its various divisions may help to illustrate some of the difficulties faced
within the airline industry, both as a whole and within the Service Quality sector.
2.2 Airline History
The airline industry has gone through significant adaptation to changing market
conditions since its beginning in the early 20th century. An understanding of airline
history may help to illustrate the industries present-day challenges. In general, this is
an industry that has been able to adapt to overcome significant challenges, resulting in
a service that was once available only to a privileged few becoming a widely accessible
form of transportation.
2.2.1 Before 1942
The earliest days of passenger carriage grew out of the airmail routes (Brady, 2000a).
The Airmail Act of 1925 (commonly known as the Kelly Act) gave the US Postmaster
General the authority to contract routes for the mail service to specific operators.
Airmail Route No.1 took place between Washington D.C. and New York. Soon airmail
26
would expand into a transcontinental service. The US Post Office itself would operate a
transcontinental route from New York to San Francisco (called the Colombia Route)
and private contractors would feed into this main “trunk” route. Retired WWI pilots in
surplus aircraft mostly flew the early airmail routes. They had open cockpits, wood and
fabric construction, and no aids to navigation. Passengers (if they were taken at all)
were then seen largely as a burden as they took up valuable space for airmail (Brady,
2000a).
The famous transatlantic flight of Charles Lindbergh in May of 1927 created an
amazing amount of attention towards aviation. Aircraft manufacturers began
producing more passenger specific aircraft and some passengers began looking at air
travel as an alternative to train travel. That year, passenger traffic grew 500% (Brady,
2000 p.149). Everyone desired to become “air-minded” and the future of the airline
industry in America was set to become a reality.
The greatest champion of the Pre-WWII airline industry was Juan Tripp, a Yale
graduate and enthusiastic businessman. He decided to leave a career at his father's
investment bank and begin his own airline company. Having formed the Aviation
Corporation of America, Tripp learned that the US Post Office was offering bids on one
of the first international airmail routes from Key West to Cuba. Tripp had subverted
the competition by negotiating exclusive landing rights with the Cuban president for
his airline and thus secured the route on the 19th of October, 1927 (Brady, 2000a). The
Aviation Corporation of America became the holding company for Pan American
Airways (more commonly known as Pan Am). Pan Am later developed a monopoly
(protected by US Government legislation) of the international traffic originating from
the continental United States. This allowed Juan Tripp to make Pan Am one of the
most successful airlines in aviation history. Unfortunately, Pan Am could not survive in
the competitive deregulated marketplace after 1978 and was forced into bankruptcy in
1991 (Lehrer, 2000).
27
Early passengers were typically seen as more adventurous in nature (Brady,
2000a; Omelia & Waldock, 2003). The first passenger planes were constructed of wood
and fabric or very thin metal and offered almost no protection from extreme
temperatures. These aeroplanes flew at a relatively low altitude by today’s standard
(often less than 10,000 feet) and had only simple aids for navigation. This made for an
experience that could be noisy, turbulent and at times very risky. Forced landings were
a common occurrence and early passengers would often have to resume their journey
by train (Omelia & Waldock, 2003). This would all change following one of the most
rapid periods of technical innovation in the history of aviation, the Second World War.
2.2.2 Post-‐War
The modern airline industry within the United States and Western Europe grew out of
the Second World War (Brady, 2000b). The war had left a large supply of available
transport aircraft that could be easily converted to suit civilian transportation (such as
the DC-3 and its military counterpart the CH-47). Likewise, the war had led to the
advancement of aerial navigation technology (RADAR, Aerial Direction Finding, and
the Instrument Landing System). This drastically increased the safety and reliability of
passenger transportation (Brady, 2000b). Operators soon began to capitalise on these
post-war assets by flying a few privileged passengers on point-to-point routes (Lehrer,
2000). This was the golden era of commercial aviation; flying was a luxury, a status
symbol and something to look forward to, despite being more dangerous than modern
air transportation and relatively uncomfortable (post-war transport aircraft were still
not insulated, very noisy and often subjected to turbulence). The early days of
commercial aviation were undoubtedly viewed with a sense of romance and adventure
(Omelia & Waldock, 2003).
As popularity grew, operators began to expand their markets. New civilian
airports led to new routes. Airport planning and air-traffic technology increased route
frequency. With this increase in air-travel, competition among the major players
28
became fierce. Public policy makers saw the airlines as a public utility, vital to the
growth and prosperity of the nation (Hanlon, 2007). Competition was seen to be
counterproductive to the stability of the industry. Legislation (like the Kelly Act)
allowed the government to control the airline market by establishing a few carriers as
market leaders, establishing the “flagship,” “traditional” or “legacy” carriers. These
usually carried with them a strong sense of national identity as they were often named
according to their country of origin (for example, British Airways, American Airlines,
Air France) (Doganis, 2006).
For many years these airlines operated within highly regulated markets almost
free from competition within the industry. In the US the governing body was the Civil
Aviation Board and later the Federal Aviation Administration (FAA). In the UK it was
the Civil Aviation Authority (CAA). Universally, the life cycle of the airline industry
within a country began with this regulated stage (Francis, Humphreys, Ison, & Aicken,
2006).
In the years' operating under governmental regulation, air carriers were
assigned specific markets (or routes) in which to operate. Competition within these
respective markets was non-existent or highly regulated. Pricing and ticket
distribution was also tightly structured; although pricing was set internally by the
airline, strict regulations (such as the Kelly Act) prevented competition where markets
overlapped. Ticketing usually took place through third-party travel agents, offering
sustainability to this industry.
Shortly after World War II, technological barriers were overcome and political
tensions diminished, allowing international air travel became a reality. As the early
airlines began to expand their routes, political concern grew from the lack of intrastate
regulation of air commerce. Nations therefore began establishing Bilateral Air Service
Agreements (ASAs) also known as Air Transport Agreements (ATAs) (Hanlon, 2007).
These were essentially civil treaties, as these were trade agreements negotiated between
29
two or more states instead of airlines (Doganis, 2006). Therefore, governments had
legislative control over all domestic routes as well as agreements (with friendly nations)
over international routes. This allowed for strict control over market access,
designation, capacity, and tariffs. There were originally two types of bi-lateral
agreements: the Predetermination type and the more liberal Bermuda type (aptly
named, as the relationship between Caribbean airlines tended to be less restrictive but
only in relation to the predetermination type) (Doganis, 2001, 2009). These bilateral
agreements were a necessity after the failed 1944 Chicago Convention’s attempt at an
open-skies market.
2.2.3 Bilateral Agreements
Air Service Agreements (ASAs) encompass every aspect of air operations between the
nations involved. They cover traffic rights, designations (the number and type of
airlines allowed to operate within the agreed space and time), gateways (airports),
frequency (permitted landing/departure time slots), and capacity (Shaw & Ivy, 1994).
Such agreements often prohibit carrying passengers within a foreign country (Westra,
2009, p. 162).
The early system of regulated markets was highly complex and costly. Member
States desperately attempted to protect their national airlines (many of which were
often state owned) against the threat of new entrants. Bureaucratic regulation was
often very cumbersome. However, this system would remain in place until the early
1980s when market liberalisation would lead to a reduction in ticket price, increased
passenger numbers and the removal of restrictions that would allow low-cost carriers
to expand into out-of-state markets (Fageda, Suau-Sanchez, & Mason, 2015).
The International Convention on Civil Aviation (later known as the Chicago
Convention) convened in 1944 to establish a set of statutory rights regarding air travel
between Member States. The Convention signed the Document on December, 7th 1944
and established the International Civil Aviation Organisation (ICAO). The ICAO
30
originally included 52 signatures (today 191 states have joined the ICAO and adhere to
the Chicago Convention). The Convention’s regulations guarantee five Freedoms of the
Air and four “so-called” Freedoms of the Air (only the first five have been officially
recognised by international treaty the others must be mutually agreed upon by
individual Member States). Currently these nine statues are as follows (ICAO:
International Civil Aviation, 2013):
First Freedom
• The right to fly over a Member State without landing.
Second Freedom
• The right for a scheduled operator to land in another Member State's
territory for non-revenue purposes. This allows an airline originating from
one Member State to make a “technical stop” (for example, maintenance or
refuelling) within the legal boundaries of another Member State without
boarding or deplaning passengers.
Third Freedom
• The right for a scheduled operator to carry paying passengers (revenue
traffic) originating within your country of origin to another members State’s
country (for example, an American airline can carry passengers to a UK
airport and deplane them).
Fourth Freedom
• The right for a scheduled operation to board revenue traffic in a Member
State and carry them back to their own country (for example, an American
airline can board passengers at a UK airport and return with them to
America).
Fifth Freedom
• The right to carry passengers from a member’s country of origin to second
country and from that country to a third or fourth (and so on). In order to
31
exercise this right, the third and fourth countries must also be in agreement
(for example, British airline carriers. At each stop the airline is allowed to
deplane and bored revenue traffic.
Sixth Freedom
• This is the first of the “so-called” rights guaranteed by the ICAO. The Sixth
Freedom is essentially a combination of the Third and Fourth Freedoms and
guarantees the right to carry revenue traffic between two Member States by
stopping in one’s own country.
Seventh Freedom
• The “so-called” right for an airline to carry revenue traffic between two
countries along routes that lies completely outside its own country. This
right is hardly exercised outside of the EU Open-Skies Agreement. In 1990,
as part of the US-UK bilateral agreement, Seventh Freedom rights were
granted to the United Kingdom by the United States, however; since that
time these rights have not been used (Doganis, 2006). Typically, LCCs
operating in Europe exercise this right to a large extent (for example,
Ryanair is an Irish airline yet operates scheduled routes between London
and Rome).
Eighth Freedom
• The “so-called” right for an airline to carry revenue traffic between two
points within a foreign country on a service originating from its home
country (for example, a Canadian airline flies a route between Ottawa, New
York and Chicago whereby they board and deplane passengers at each stop).
This “so-called” right is commonly referred to as Consecutive Cabotage.
Outside of the EU Consecutive Cabotage is extremely rare. Currently New
Zealand has agreements with the United Kingdom and Ireland, but these
appear to be merely symbolic given the distance between these countries.
32
The most famous example of Consecutive Cabotage would be the granting of
Consecutive Cabotage to Pan Am to operate a route between Frankfurt and
West Berlin from the 1950s until the 1980s.
Ninth Freedom
• The “so-called” Ninth Freedom refers to the practise of Stand-Alone
Cabotage. This is the right granted to an airline allowing them to carry
revenue traffic between two points within a foreign country (for example, a
route between Edinburgh and London operated by Air France). Stand-Alone
Cabotage is also extremely rare outside of the EU open-skies market.
2.2.4 Post-‐Deregulation
In 1978 the US Government (under the Carter administration) instituted the Airline
Deregulation Act (the administration’s mission of removing government control of
civilian markets and returning it to the consumers drove deregulation). The premise of
the Airline Deregulation Act was to remove as much regulation from domestic air travel
as possible in support of consumer interests (Doganis, 2006). Initially, legislation only
applied to US domestic air travel. However, success of the concept had made the idea
very popular and it soon spread throughout much of the western world.
Deregulation had a mixed effect on the airline industry. Market leaders began to
expand services (particularly in respect to scheduling), and increase employee
efficiency in order to offset the threat of new entrants. In the open market, the threat of
competition became almost as productive as competition itself (Hanlon, 2007).
However, deregulation didn’t necessarily begin the price wars that would lead to
significantly lower airfares. Traditional carriers live by an industry “golden rule”
whereby players refrain from direct price competition within a market where they have
a dominant share, for fear of losing the price war to a competitor in a market where
they lack dominance (Evans & Kessides, 1994). This rule would be shaken somewhat by
the introduction of LCCs within a given market; as LCCs expand, their presence can
33
pull traditional carriers into direct price competition. This has been popularised as “the
Southwest effect” because of Southwest Airline’s general success in competitive
markets (Mentzer, 2012). The presence of a LCC within a given market instantly forces
all traditional carriers into price competition where, without the LCCs presence, the
players simply follow the “golden rule” of non-price competition.
The deregulation concept quickly spread from the US domestic market to
international routes, provoking more liberal bilateral agreements (Doganis, 2001).
Europe saw a drastic adoption of the deregulation concept (Hanlon, 2007). In Europe
the ideal evolved into “open-skies” agreements between Member States as part of the
Third Package of Measures, effective January 1st 1993 (Doganis, 2006). Again,
competition forced a reduction in tariffs, opened new routes, and caused existing
airlines to alter their business strategies (Doganis, 2001).
A distinguishing feature of European Liberalisation (not present in the US
counterpart) was the removal of national ownership constraints (Doganis, 2006, p. 13).
Now an airline could be owned by one Member State and operate from within, or be
based inside of, another Member State. Therefore, the Sixth and Seventh Freedom
Rights (along with Cabotage) are now guaranteed within the European economic area,
although they are still prohibited on many overseas routes (Westra, 2009).
In 2008 a bold move to create a more liberal market between the EU and the
US took place. The US-EU Open-Skies Agreement was aimed at increasing competition
and reducing air-fares (and effectively increasing passenger yields) along this route.
Cento (Cento, 2009) identifies three positive effects this will have of future global air
travel:
1. All operators originating from the EU are classified identically as “community
air carriers.”
2. Flights are now possible from any airport within the EU to any airport within
the United States.
34
3. European Airlines will be allowed to use any US airport as a stopover point to
flights beyond the United States.
Previous to this agreement not all EU Member States had bilateral agreements
established with the United States. This new agreement effectively levels the playing
field among European airlines in the transatlantic market. In addition to Cento’s
(Cento, 2009) analysis it is reasonable to expect this to have a profound effect on the
low-cost carriers’ entrance into this market. The Open-Skies Agreement between the
US and EU is the first step for many LCCs (such as Ryanair) that have their eyes on this
market (Millward, 2008).
2.2.5 Global Alliances
To survive in the highly competitive post-deregulation environment, many airlines
began to enter into code-sharing agreements (whereby one company can sell seats on-
board another airline), partnerships, and even mergers (such as the Delta/Northwest
merger that effectively made Delta the world's largest airline in size and passenger
volume). Organisations such as The Star Alliance (the largest of the Global Alliances,
with Delta, Air France and KLM as the major companies), SkyTeam and The Oneworld
Alliance have dominated the skies over Europe and North America. The advantage
behind such alliances is simply strength in numbers. Members of an alliance are
capable of bringing passengers into their individual markets from markets served by
other members (thereby automatically granting Seventh, Eighth and Ninth Freedoms
to each other). Oneworld Alliance members British Airways and United benefit directly
from mutual code-sharing. For example, when travelling from Edinburgh, Scotland to
Charlotte, North Carolina on United, the first part of the journey (Edinburgh to
London) is served by British Airways. In this example, United has gained access to the
Edinburgh market without the expense of manually creating a new route.
35
2.2.6 The New Generation
Deregulation was one of the most significant influences on the airline industry until the
beginning of the 21st Century (Belobaba et al., 2015; Cento, 2009; Doganis, 2006;
Hanlon, 2007). The 1990s were a high point for the global airline industry (Cento,
2009). Increased passenger traffic, coupled with historically low fuel prices led to
record seats sold, increased profits, outstanding growth forecasts (predicted between 5-
7%) and rapid route expansion for many of the world's leading airlines (Doganis, 2006,
p. 8). However, this would all change following the last quarter of the year 2000. The
turn of the new Millennium brought a maelstrom of challenges that would require
massive strategic change within the industry (Cento, 2009). Five unique factors created
a “perfect storm” that would challenge traditional carriers on a global scale (Cento,
2009, p. 5; Doganis, 2006; Markus Franke & John, 2011):
1. The airline crisis occurred at a particularly vulnerable time for the industry. It
began at a positive peak in the year 2000, just prior to the strong economic
recession which followed later in the year. This economic downturn was largely
due to a slowing down of growth in the technology sector. At this time, airlines
saw a drastic reduction in the business-class travel. At the time, business-class
was extremely important to traditional carrier’s revenue management as these
seats carried extremely high yields (Doganis, 2006).
2. An industry already in decline saw crisis turn into disaster with the terrorist
attack of September 11, 2001. This grounded all US domestic and international
air travel for three days and significantly impacted passenger numbers on a
global scale (Doganis, 2006, p. 10).
3. Before the industry could recover from September 11th, the Iraq war and the
SARS epidemic (2003) created a second wave of passenger number shrinkages.
36
4. In stark contrast to the advances in network and yield management made
during the 1990s, full-service carriers were not innovating. This further
exacerbated any losses and made recovery very improbable.
5. Spurred by government pressure to boost the LCC industry in Europe, the Third
Package of EU deregulation had come into effect in 1997. This would allow
LCCs to expand their market presence and offer price-sensitive consumers an
attractive alternative to traditional airlines.
The effect on the industry was immediate and long-lasting. The wake of the
perfect storm left most of the world's airlines at risk. This crisis was the first in the
history of the industry to reduce yield forecasts (Markus Franke & John, 2011), and
most national carriers needed huge injections of operating capital from their respective
governments in order to survive. However, many LCCs (such as Southwest) fared more
positively. During the industry crisis, Southwest returned record profits (Doganis,
2006). This was mainly a result of their operational and marketing strategies, such as
price competition, short turnaround times and fuel hedging practises. Other LCCs such
as EasyJet and Ryanair greatly expanded their route structure during this time. One of
the key factors that slowed (or in many cases halted) recovery for traditional carriers
was their outdated operating practises (Markus Franke & John, 2011). This is
evidenced by the success of the LCCs during the same time period. However, the
industry as a whole was not yet on a stable path to recovery.
Following the “perfect storm” of 2001-2003 a severe economic recession in
2008 (for American and European markets and many other developed countries)
further impacted the travel market. This new crisis exacerbated the industry’s already
cyclic revenue stream (during the summer of 2008 the industry was already in a strong
downturn driven by high fuel prices) and led to another reduction in overall capacity
and an increase in operating costs for the world's airlines. In addition to this, the
housing crisis of 2008-2009 created a “double-dip” (Markus Franke & John, 2011)
effect that slowed recovery for the industry as a whole. Despite this, LCCs (with their
37
more scalable operating strategies) were better equipped than traditional carriers to
handle economic hardship and reductions in passenger numbers (Doganis, 2006;
Markus Franke & John, 2011). In recent years, many national carriers have begun
developing operating strategies that employ many principles of the low-cost model3.
2.3 The Traditional Business Model
Traditional carriers such as American Airlines, United Airlines, or British Airways have
dominated the skies since the earliest days of aviation. For many years (until 1978)
carriers operated under the protection of their governments, protected from many
market forces that challenge them today. However, they now face the many challenges
of an unregulated market and are constantly challenged with maintaining profitability
(Cento, 2009, p. 5; Doganis, 2006; Franke, 2004a; Markus Franke & John, 2011).
The traditional carrier business model is not as homogeneous as in the past,
although there are still some general practises and strategies associated with
traditional carriers (Doganis, 2001). The most prominent of these practices is the hub-
and-spoke system, where the airline route structure resembles that of a wheel with a
central hub and spokes radiating outward to various destinations. Operators maintain
a central base of operations, denoted as “the hub” (Belobaba et al., 2015). This is
usually a very large airport surrounded by an extremely busy airspace, for example:
Delta’s hub of operations in Atlanta, GA has the busiest airspace in the world with over
2,500 flights per day (KnowAtlanta, 2016). All flights will originate from this central
location and other smaller hubs and will radiate outward to connect to other hubs or
terminal airports (in the case of international flights). This design allows airlines to
maintain markets that cover massive geographical areas. However, the hub-and-spoke
3 A look at the traditional carrier business model (section 3.3) past and present, as well as an in-depth analysis of the LCC business model (section 3.4), will further illustrate the future of airline operating strategies.
38
system often requires passengers to make one or more connections before reaching
their final destination. This requires highly complex operational systems to manage
passenger and baggage transfers. While these systems operate with a high degree of
reliability, malfunctions can be a major inconvenience to passengers (SITA, 2015).
Furthermore, operating a hub-and-spoke system can be costly (Ito & Lee, 2003). For
example, it costs much more to fly a passenger from Chicago to Atlanta, then on to
Orlando, than it would to fly them in a direct flight. This creates a much higher fixed
cost for carriers operating on a hub and spoke system than those flying point to point
(Mentzer, 2012).
Traditional carriers also engage in overbooking practises (selling more tickets
than there are available seats in the aircraft). This strategy allows carriers to maximise
revenue on some routes (Belobaba et al., 2015; Doganis, 2006). By assuming that a
given percentage of passengers will not turn up for boarding, therefore potentially
leaving empty seats, overbooking the airline assures that all seats will be filled. The risk
associated with overbooking is that some passengers may be denied boarding. In the
past, this practise rarely interfered with the average passengers travel. While being
denied boarding is still rare, overbooking is becoming increasingly more common as
many airlines reduce scheduled flights (in response to falling passenger yields and
increased fuel and operating costs) in highly competitive markets in order to maintain
profits (Bishop, Rupp, & Zheng, 2011).
Typically, all legacy carriers offer some amenities in conjunction with the basic
service; however, the type and degree of such service can vary highly from carrier to
carrier and with the type of seat purchased (colloquially these are known as First Class,
Business Class, or Economy, although exact definitions and number of options can vary
among airlines). Such amenities can include in-flight meals, entertainment, checked
baggage, or services at the airport (such as private lounges for exclusive passengers).
During the early days of the aviation industry, flying was a luxury and operators tried
to best perpetuate this image with as many high quality inclusive services as possible.
39
Freshly prepared food served with luxury silverware, accompanied by fine wines and
desserts was the standard. Although this service may seem dated when comparing to
current airline practices, this tradition actually continued up until the early 1980s.
Since deregulation, competition has forced traditional carriers to modify the quality,
type, and number of inclusive services. However, in the last decade, internal and
external market pressure has caused some major air carriers to begin charging for
previously included services (such as a second checked bag) or remove some services
altogether (such as in-flight meals and entertainment on US domestic flights).
2.3.1 Regional Airlines
The profitability challenges faced by the legacy carriers resulting from the deregulation
act of 1978 (Cento, 2009, p. 5; Doganis, 2006; Franke, 2004b; Markus Franke & John,
2011) led to many small communities with less demand for air travel at risk of being
without service. This lack of service influenced the introduction of regional carriers
(Doganis, 2006). These airlines typically operate smaller aircraft and connect
passengers from remote destinations to larger hubs where they can transfer to a legacy
carrier. Regional airlines can be wholly owned by and operating under the brand of the
legacy airline (for example, BA Connect or Delta Connection), or they can be
independent carriers operating under their own brand (for example, London City
Airways or AirUK). These independent regionals have code sharing agreements with
the legacy carriers that allows them to “feed” passengers into larger hubs to be picked
up by a legacy carrier.
Regionals come in all shapes and sizes and each fills a specific gap in the legacy
carriers’ market. However, they all have one defining feature: their dependence on a
legacy carrier. This close relationship means they often adopt similar business practises
as a legacy carrier, yet serve a smaller market. The consumer is usually sold a ticket on
a regional airline when purchasing a flight on the traditional carrier. Service on-board
the regional is usually sparse due to the short flight times.
40
2.4 The Low-‐Cost Carrier
In the open market of post-deregulation, a new breed of airline emerged: the low-cost
carrier. Their business model takes several departures from that of traditional airlines,
such as adopting a point-to-point route structure as opposed to the hub-and-spoke
system favoured by legacy carriers. These airlines initially flew domestic routes within
the EU, or intrastate routes within the US. Slowly, the LCC market share has expanded
to encompass more international slots (Belobaba et al., 2015). Today, many LCCs are
some of the most profitable airlines in the sky, commanding huge shares of the market
(Belobaba et al., 2015).
The grandfather of all the LCCs is Southwest Airlines. The Texas based firm first
began operations in 1969. Until the deregulation act of 1978 they were confined to
operations within the state of Texas. Their base was Dallas Love Field, a relatively
smaller airport outside of the busy Dallas/Fort Worth (DFW) airport traffic but still
within the confines of the city of Dallas. Their operations were more efficient than the
larger DFW airport as they could reduce flight delays, and they were also less costly to
operate due to the lower fees imposed at the smaller airport. They standardised all
their equipment, operating only one type of aircraft, the Boeing 737. Instead of
operating on a hub-and-spoke system like traditional airlines, Southwest flew point to
point routes selling only one-way fares. This model of cost reduction, point-to-point
routing, and operating from smaller airports would revolutionise the aviation industry.
Today it is simply known as “the Southwest model”
Southwest’s motto was to “make flying fun” (“Nuts About Southwest - Funny
Stuff...,” 2012). They did this well. At one time, it was corporate policy that every
stewardess closely resembled Farrah Fawcett. Likewise, each customer received a free
bottle of Jim Beam Whiskey with each ticket purchase. At that time Flying was
unarguably Fun. This philosophy remains within Southwest today, albeit with different
terms, but the end result is the same. Cabin crew often sing, dance, or play harmonica.
41
Even the Captain and First Officer often attempt humour from the flight deck. On one
flight the captain announced: "Ladies and Gentleman, I have some good news and I
have some bad news. The bad news is...it's raining and 40 degrees [Fahrenheit] in
Baltimore right now. The good news is...I just saved a bunch of money on my car
insurance by switching to Geico" (“Nuts About Southwest - Funny Stuff...,” 2012).
In 1991, the newly appointed CEO of Ryanair, Michael O’Leary, returned to
Ireland from a six-month stay at Southwest Airlines. He was tasked with returning
profitability to the fledgling Irish airline. At that time Ryanair (named after its founder
Tony Ryan) was only operating on two routes (Waterford to London-Gatwick and
Dublin to London-Luton), and even those were in dispute by the Irish government. He
quickly implemented the Southwest Model at Ryanair (O’Leary, 1994).
The success of introducing the Southwest model at Ryanair cannot be
understated. Prior to O’Leary’s introduction Ryanair operated all routes at a loss
(Ryanair, 2012a). In 1990, Ryanair sent O’Leary to visit Southwest Airlines in Dallas
Texas. There he spent six months with Herb Kelleher (the founder of Southwest
Airlines). After extensive restructuring (and a capital investiture from the Ryan family
of almost £20 million pounds) involving the incorporation of many of Southwest's
operational and market strategies, Ryanair was able to reduce its average fare from £99
to £59 within the year (Ryanair, 2012a). This gave a significant advantage over their
competitors’ BA and Aer Lingus (both traditional carriers) and led to Ryanair carrying
twice the number of passengers than in 1989.
In 2010 Ryanair’s average fare was only 32 Euro, yet it remains one of the most
profitable airlines operating in Europe (Pratley, 2012). Only one other LCC closely
competes in UK markets with Ryanair; the London-Luton based carrier EasyJet.
Founded in 1995, EasyJet has grown to operate 700 routes in 32 countries, and despite
ever increasing fuel prices EasyJet also saw an increase in revenue per seat of 12%
during the first half of 2012 (Pratley, 2012). Both Ryanair and EasyJet combined are
42
each worth more than British Airways and Aer Lingus combined (CAPA, 2012), a true
testament to the success of the LCC model. These airlines have become such large
players in the aviation market within Britain that they have begun to expand their
competitive strategies out with the aviation industry itself. Ryanair’s current aim is to
not only compete with other air carriers, but with ground transportation as well to
make flying more cost effective than taking the train or the bus on long distance
journeys (Ryanair, 2012b).
Much of the LCCs growth and profitability was fostered by advancements in
technology, legislation, and management practices (Barrett, 2004b). Some of the
technological advancements that have furthered the success of the LCC model are
super-efficient aircraft, online ticketing, avionics, and communications. Online ticket
purchasing was a strong driver of LCC success (Brunger and Perelli, 2009). Before the
growth of the internet, legacy carriers had strict control over their channels of
distribution, particularly with travel agents. This made market entry very difficult for
any newcomers. Additionally, price comparing was a difficult task for the consumer
(unless booking through a travel agent). However, while legacy carriers were still
relying on traditional channels of distribution (either through physical or online travel
agents), LCCs began selling tickets through proprietary websites, exclusively4
(however, LCCs typically do not directly promote themselves through third-party travel
websites such as Expedia.com, Kayak.com, and Travelocity.com5). Consumers seem to
prefer online ticket purchasing as it offers greater control and “breadth of search”
4 The success of this model eventually led to its adoption by legacy carriers (Doganis, 2006) 5 While Skyscanner.com may passively search for prices for LCCs it does
not hold any special promotions for the airlines and is not part of the LCCs direct marketing strategy.
43
(Brunger and Perelli, 2009). Such distribution has also given the operators greater
control of ticket pricing and promotions. This has resulted in substantial cost savings
counter to traditional channels of distribution (Brunger and Perelli, 2009).
2.5 The Low-‐Cost Carrier Business Model
Competition is largely price driven and extremely fierce within the LCC market;
therefore cost management is essential (Belobaba et al., 2015; Cento, 2009; Doganis,
1999, 2001, 2006). A core strategy of all LCCs is a reduction of inclusive service
(Delfmann, 2005). Major players in the industry have become famous for their
additional fees (Table 2.1). In this industry, the price of a ticket buys the customer a
seat on a flight from point A to point B, and nothing else (Gilbert, Child, & Bennett,
2001).
The LCC industry incorporates a somewhat uniform set of characteristics.
While not all LCC airlines operate under the same criteria, there are some consistent
features that are commonly understood to belong to LCC. Most of these are associated
with increased productivity and efficient operating strategies. These are (Belobaba et
al., 2015, pp. 122–123):
• Fleet Commonality: This is the practise of operating a single aircraft type or a
fleet of equipment from the same family of aircraft. Such practices can
drastically reduce maintenance costs by limiting the number of spare parts and
crew training. While it is becoming more common for LCCs to operate multiple
types of aircraft, this is still considered an industry trait as the modern concept
of fleet commonality was born from the Southwest Model (Doganis, 2009).
• Point-to-point routing: this abandons the traditional concept of the hub-and-
spoke system. Point-to-point routes allow more consistent passenger service
(better on-time performance and greatly reduced risk of lost luggage) and
greater productivity at the airports. This allows LCCs to achieve extremely short
44
turnaround times at the gate. Additionally, this route structure allows LCCs to
lower operating costs by utilising smaller airports out with major metropolitan
areas (Calder, 2002). These airports generally have lower landing fees and less
congested traffic resulting in more consistent scheduling and more efficient
approach/departure procedures.
• No labour unions: Keeping the workforce non-union allows for less restrictive
work rules and allows for lower wage rates (on a per hour basis) and greater
workforce utilisation.
• Single cabin service: The majority of LCCs do not offer premium class
passenger service (with the notable exception of EasyJet's Business Class).
Multi-class services add to pricing complexity and can be costly in terms of
passenger revenue if premium seats go undersold.
• No Frequent Flyer Loyalty programs: While this is becoming less common,
frequent-flyer programs are not generally associated with LCCs.
• No assigned seating: Assigned seating increases complexity of airport boarding
procedures and increases turnaround time for aircraft. This is another area
where many LCCs are now departing from the norm. Most operators now offer
the option to purchase an assigned seat or a priority-boarding pass that allows
them to be one of the first people on board and most operators now see selling
seat assignments as a source for potential revenue.
• No “frills”: This has become the common moniker associated with all LCCs. So
much so that “no frills airline” is synonymous with the LCC industry itself.
Again, reducing inclusive services is a way for operators to better manage costs
and increase revenue.
• Reduced seating space: Reducing the available space for each passenger’s seat
allows airlines to maximise their cabin space. Increasing the available number
of seats increases the total revenue per seat/mile for each flight and in-turn
lowers operating costs.
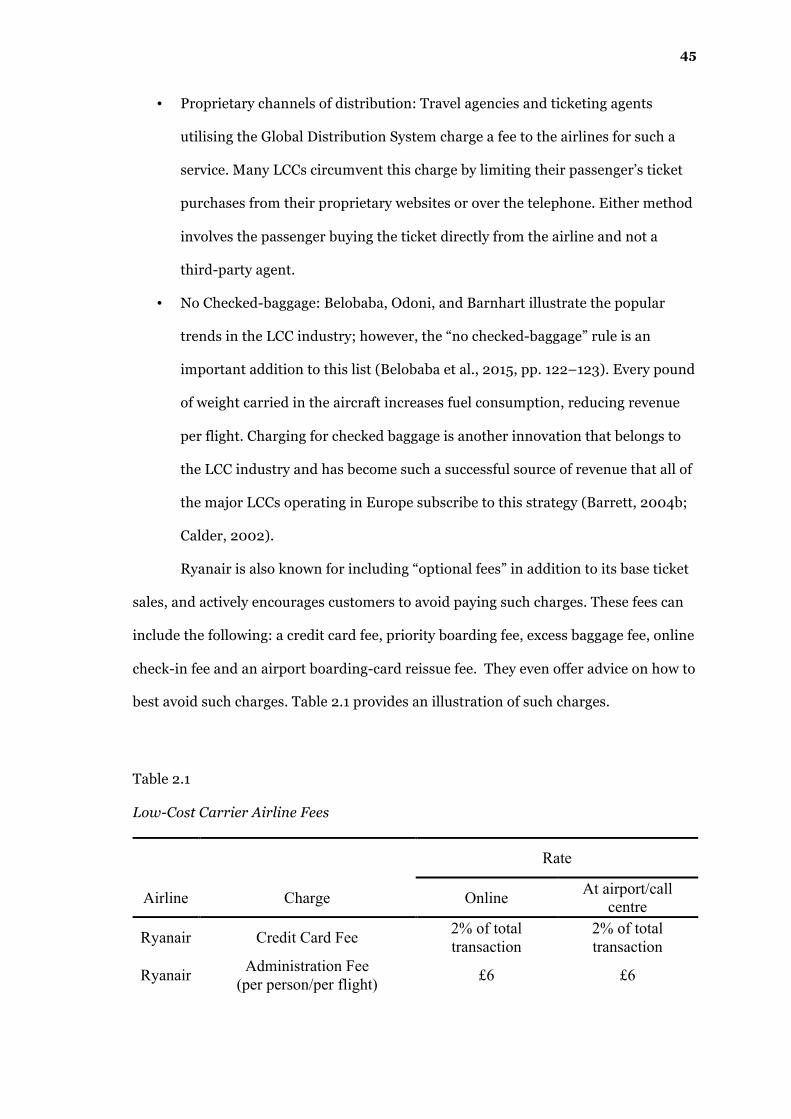
45
• Proprietary channels of distribution: Travel agencies and ticketing agents
utilising the Global Distribution System charge a fee to the airlines for such a
service. Many LCCs circumvent this charge by limiting their passenger’s ticket
purchases from their proprietary websites or over the telephone. Either method
involves the passenger buying the ticket directly from the airline and not a
third-party agent.
• No Checked-baggage: Belobaba, Odoni, and Barnhart illustrate the popular
trends in the LCC industry; however, the “no checked-baggage” rule is an
important addition to this list (Belobaba et al., 2015, pp. 122–123). Every pound
of weight carried in the aircraft increases fuel consumption, reducing revenue
per flight. Charging for checked baggage is another innovation that belongs to
the LCC industry and has become such a successful source of revenue that all of
the major LCCs operating in Europe subscribe to this strategy (Barrett, 2004b;
Calder, 2002).
Ryanair is also known for including “optional fees” in addition to its base ticket
sales, and actively encourages customers to avoid paying such charges. These fees can
include the following: a credit card fee, priority boarding fee, excess baggage fee, online
check-in fee and an airport boarding-card reissue fee. They even offer advice on how to
best avoid such charges. Table 2.1 provides an illustration of such charges.
Table 2.1
Low-Cost Carrier Airline Fees
Rate
Airline Charge Online At airport/call centre
Ryanair Credit Card Fee 2% of total transaction
2% of total transaction
Ryanair Administration Fee (per person/per flight) £6 £6
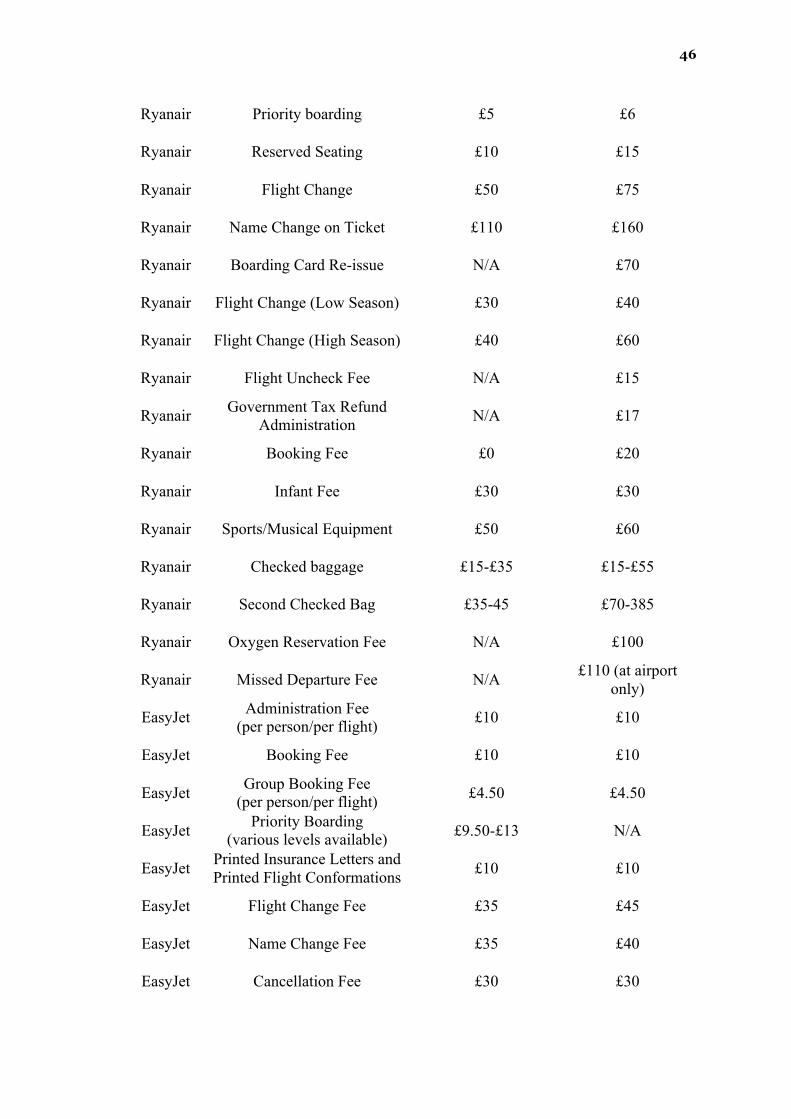
46
Ryanair Priority boarding £5 £6
Ryanair Reserved Seating £10 £15
Ryanair Flight Change £50 £75
Ryanair Name Change on Ticket £110 £160
Ryanair Boarding Card Re-issue N/A £70
Ryanair Flight Change (Low Season) £30 £40
Ryanair Flight Change (High Season) £40 £60
Ryanair Flight Uncheck Fee N/A £15
Ryanair Government Tax Refund Administration N/A £17
Ryanair Booking Fee £0 £20
Ryanair Infant Fee £30 £30
Ryanair Sports/Musical Equipment £50 £60
Ryanair Checked baggage £15-£35 £15-£55
Ryanair Second Checked Bag £35-45 £70-385
Ryanair Oxygen Reservation Fee N/A £100
Ryanair Missed Departure Fee N/A £110 (at airport only)
EasyJet Administration Fee (per person/per flight) £10 £10
EasyJet Booking Fee £10 £10
EasyJet Group Booking Fee (per person/per flight) £4.50 £4.50
EasyJet Priority Boarding (various levels available) £9.50-£13 N/A
EasyJet Printed Insurance Letters and Printed Flight Conformations £10 £10
EasyJet Flight Change Fee £35 £45
EasyJet Name Change Fee £35 £40
EasyJet Cancellation Fee £30 £30
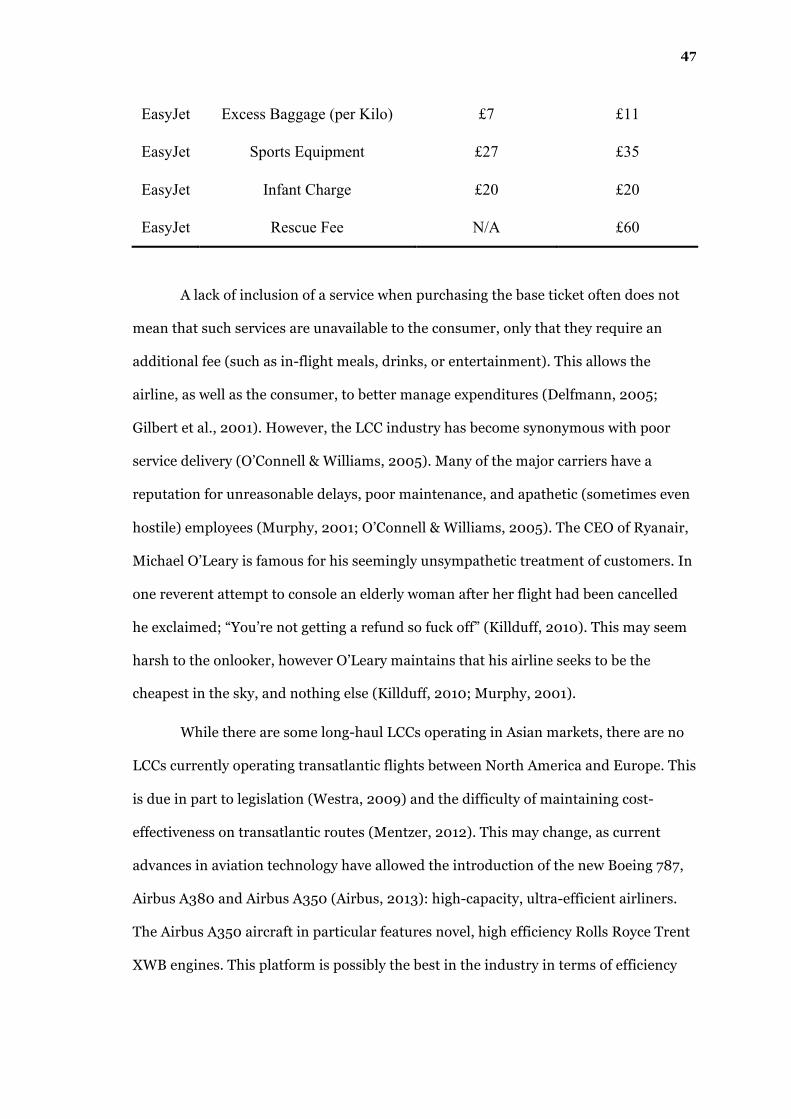
47
EasyJet Excess Baggage (per Kilo) £7 £11
EasyJet Sports Equipment £27 £35
EasyJet Infant Charge £20 £20
EasyJet Rescue Fee N/A £60
A lack of inclusion of a service when purchasing the base ticket often does not
mean that such services are unavailable to the consumer, only that they require an
additional fee (such as in-flight meals, drinks, or entertainment). This allows the
airline, as well as the consumer, to better manage expenditures (Delfmann, 2005;
Gilbert et al., 2001). However, the LCC industry has become synonymous with poor
service delivery (O’Connell & Williams, 2005). Many of the major carriers have a
reputation for unreasonable delays, poor maintenance, and apathetic (sometimes even
hostile) employees (Murphy, 2001; O’Connell & Williams, 2005). The CEO of Ryanair,
Michael O’Leary is famous for his seemingly unsympathetic treatment of customers. In
one reverent attempt to console an elderly woman after her flight had been cancelled
he exclaimed; “You’re not getting a refund so fuck off” (Killduff, 2010). This may seem
harsh to the onlooker, however O’Leary maintains that his airline seeks to be the
cheapest in the sky, and nothing else (Killduff, 2010; Murphy, 2001).
While there are some long-haul LCCs operating in Asian markets, there are no
LCCs currently operating transatlantic flights between North America and Europe. This
is due in part to legislation (Westra, 2009) and the difficulty of maintaining cost-
effectiveness on transatlantic routes (Mentzer, 2012). This may change, as current
advances in aviation technology have allowed the introduction of the new Boeing 787,
Airbus A380 and Airbus A350 (Airbus, 2013): high-capacity, ultra-efficient airliners.
The Airbus A350 aircraft in particular features novel, high efficiency Rolls Royce Trent
XWB engines. This platform is possibly the best in the industry in terms of efficiency
48
and comforts (Shukman, 2014) and could make transatlantic LCC operations a reality
within the near future.
While the appeal of low-cost travel between North America and Europe makes
transatlantic carriage a possible future market for the European LCC (Westra, 2009),
many requirements for long-haul or transatlantic flights may not correspond with the
LCC business model. On long duration flights, legroom, seat pitch, food and
entertainment become of greater concern than flights under three or four hours.
Additionally, transatlantic market liberalisation has already led to extremely
competitive pricing among traditional carriers (Francis et al., 2006). This has made
establishing transatlantic routes very difficult for LCCs. Despite this, Michael O’Leary
had planned for Ryanair to offer a low-cost6 transatlantic flight by 2014 (Westra,
2009); however, this was dependent on the success of the availability of “cheap” super-
efficient aircraft such as the Boeing 787 and Airbus A-380. Unfortunately, Ryanair was
unable to secure a reasonable aircraft order. The failure of Ryanair, one of the most
successful LCCs in Europe, to secure transatlantic routes, highlights the difficulty of
applying the LCC model to this market.
The importance of the transatlantic market makes it a strategic focus for the
future of many operators. Despite the failure of Canadian transatlantic carrier Zoom
(Hume, 2012; News, 2008), support for this concept is already very popular in Asia
with airlines such as Jetstar (Australia), Airasia X (Malaysia) and Scoot (Singapore)
operating successful long-haul international routes (Hume, 2012)7. Many industry
professionals such as O'Leary and Norwegian Air Service’s (NAS) Bjorn Kjos have their
sights set on the transatlantic market. NAS have been operating successfully in small
markets originating from Norway for some time; however, they recently began
6 Estimates were as low as 15 Euro.
7 Zoom blamed its failure on the high price of fuel and the economic climate in 2008 (BBC News, 2008) when many regional airlines operating the North American markets filed for Chapter Six (The Associated Press, 2011).
49
expansion into European and Asian markets. The firm sees itself potentially becoming
a competitor for Ryanair and EasyJet in the very near future (Hotten, 2013). However,
the firm's primary goal is expansion into budget long-haul markets. Having failed
miserably with previous attempts at the long-haul markets during the 1970s and 1980s,
NAS feels the Boeing Dreamliner and the A350 XWB will allow this to become a reality
(Hotten, 2013)8.
2.6 Types of Low-‐Cost Carriers
While LCC is a blanket term and should not imply a standard of business practices
within the industry (Calder, 2002), LCCs largely fall under one of five general business
models: Southwest Copycats, Subsidiaries, Cost Cutters, Diversified Charter Carriers,
or State Subsidised Competing on Price (Francis et al., 2006). The major UK operators
(Ryanair and EasyJet) fall under the category of Southwest Copycats.
2.6.1 Southwest Copycats
Southwest being the eldest, and arguably one of the most successful LCCs, has earned
its paramount reputation within the industry. The term Southwest Copycats simply
refers to any airline claiming to reproduce the Southwest model. While many airlines
claim to encompass Southwest’s practises within their own, there are many variations
within this category. Some operators have adopted this model only in part. For
example, Ryanair only flies to smaller secondary airports and EasyJet only flies to
major airports, however Southwest flies to both (however, during Southwest's Genesis,
they too only flew to Class C and Class D airports where there is less landing traffic
than at Class B airports). Other LCCs have taken the Southwest model and extended it
8 Norwegian Air Service has recently announced it will begin trans-Atlantic carriage in early 2015. They have secured aircraft and landing rights at several US airports and are currently taking bookings.
50
while others have failed to implement all the Southwest features, usually to their
detriment. For example, Debonair failed to grasp the “no-frills” concept, resulting in
ceased operations in 1999 (Francis, Fidato, & Humphreys, 2003; Francis et al., 2006).
2.6.2 Subsidiaries
Subsidiaries refer to LCCs that are set up and wholly owned by major legacy carriers,
however the business model also tries to encompass the Southwest philosophy of no-
frills, cost reduction. These airlines will inherit certain assets (equipment, personnel,
and aircraft) as well as liabilities (collective bargaining agreements, unions) from their
parent airline. The low-cost strategy of such an airline will need to reflect those
inherited traits. The airlines are managed autonomously but may, at times, be
subsidised by the legacy carrier (Francis et al., 2006). UK examples include BMI Baby
by BMI, Jet2.com owned by Dart Group PLC. and BA Cityhopper operated by British
Airways. Globally, Subsidiary LCCs are formed in response to the success of the
Southwest Copycats (Doganis, 2006). These airlines closely resemble regional airlines
but differ in that they operate along point-to-point routes and offer no baggage transfer
between flights.
2.6.3 Cost Cutters
Cost Cutters are legacy carriers that are moving to adopt the LCC philosophy. Typically,
they have simply began charging for service that were once inclusive (such as food,
entertainment or checked baggage). Operators within this classification retain the hub-
and-spoke system. Again, the level of adoption varies among this category. While some
carriers are simply charging for once inclusive services, others are beginning to adopt a
pricing strategy similar to Southwest Copycats by offering low-cost one-way tickets.
Examples include Jet Blue and Frontier in the USA.
51
2.6.4 Diversified Charter Carriers
Recently, the charter airline industry (unscheduled air carriers) has taken to
remodelling some routes to fit the LCC model. As charter airlines do not fly regularly
scheduled routes, this is a large change in their corporate structure. In order to do this
effectively, the parent company (a charter airline) utilises subsidiary airlines. They
closely imitate the Southwest model by operating one type of aircraft, charging for
food, operating point-to-point and offering one-way fares. A unique characteristic of
these airlines is the relatively low-cost structure. Their parent airlines are often thought
to have some of the lowest operating costs in the industry (Doganis, 2001). Examples of
Diversified Charter Carriers are Thompson, sponsored by Britannia or formerly
MyTravelLite by MyTravel (Francis et al., 2006).
2.6.5 State Subsidised Competing on Price
Within the international market, there are still some airlines that are heavily subsidised
by government. The State Subsidised Competing on Price category isn’t a true LCC.
They can gain a competitive advantage by operating at a loss, subsidised by
government, usually to attract attention to a new route or some national event. This is
exemplified by Flydubai (Dubai Aviation Corporation), a United Arab Emirates state-
owned low-cost airline.
2.7 Current Challenges Facing the Low-‐Cost Carrier Industry
In recent years the airline industry as a whole has met a diverse array of challenges.
Although much of the focus has recently been on the 2008 global financial crisis, the
industry has been plagued with difficulties since deregulation occurred. Predominantly
these centre around rising fuel prices, frivolous litigation, high fixed costs, insolvency,
and fierce price competition within the industry (Belobaba et al., 2015; Doganis, 2001,
2006; Gilbert et al., 2001). Most of these challenges are external market forces and are
52
uncontrollable by management (an excellent example of this is flight
delays/cancellations caused by unfavourable weather).
The success of the airline industry will always be tied to economic growth on
both a global and regional scale (Doganis, 2006). Recently, the “triple threat” and
housing crisis certainly had their effect on the industry as a whole, yet the LCCs have
certainly fared somewhat better within the industry (Doganis, 2006). While several
traditional carriers have been forced into bankruptcy or have been grounded
altogether, many LCCs have been vastly expanding their route structure (especially
EasyJet and Ryanair).
The most persistent challenge faced by any player within the aviation industry
is rising fuel prices. Until the early part of the last decade the price of fuel was relatively
stable (Doganis, 2001, p. 6). However, since 2007 crude oil prices have fluctuated
between $55 and $180 per barrel (IATA, 2012); this rapid fluctuation in particular
makes it very difficult to manage costs. Southwest, along with many LCCs, hedge their
fuel when they feel that the price is low. Unfortunately, in such a market this is difficult
to predict. In early 2008 Southwest’s fuel contract was up for renewal; at this time the
price of Jet A (aviation grade kerosene) was at its highest point since the late 1970s. In
a knee jerk reaction (uncharacteristic of Southwest) they hedged their fuel for the next
ten years at this price. Later in the year the price dropped to its lowest point in this
century (Bachman, 2008). Although Southwest did recover from this mistake, this
was, for a short time, disastrous for Southwest.
Furthermore, the low-cost model itself is not at all protective against disaster
(Doganis, 2006). As LCCs expand their route structure into one another's markets,
rapid price competition will drive down average fares and load factors. This itself could
be detrimental to the industry unless other strategies can be implemented. Doganis
sees the necessity for the industry to implement survival strategies, however; this alone
may not be enough to capture sufficient market share (Doganis, 2006). Given that with
53
increasing size, a LCC has more economic security, new strategies must be
implemented by smaller airlines in order to regain market power.
This research attempts to highlight one such strategy; improved Service
Quality. There is some evidence to suggest that improved Service Quality can have a
positive effect on an airlines’ financial performance, especially in highly competitive
markets (Steven, Dong, & Dresner, 2012). However, the determinants of Service
Quality in the airline industry have yet to be clearly defined.
2.8 The Modern Airline Industry
The airline industry is continually evolving (Alderighi, Cento, Nijkamp, & Rietveld,
2012) and there is evidence supporting that many of the operating strategies of
traditional and LCCs alike are beginning to become hybridised (Klophaus, Conrady, &
Fichert, 2012). This has led to a complex marketplace in Europe where the lines
between LCCs and traditional carriers are no longer so clearly defined (Fageda et al.,
2015).
The growing need to adapt to market conditions has resulted in the archetypal
European LCC business model shifting somewhat (Fageda et al., 2015; Klophaus et al.,
2012). Many of the once state supported full-service airlines have begun to adopt some
of the business models found in LCCs. Likewise, some LCCs have begun to offer
inclusive or premium services that were uncharacteristic of the typical LCC business
model in years past. There are now large LCCs that fly to major airports, offer both
reserved and premium seating and that sell tickets through third-party websites such
as Skyscanner.com (an exception would by Ryanair). Therefore, there is now no single
LCC business model, but rather a collection of operating strategies that are adaptable
to the airlines’ particular market.
54
2.9 Conclusion
In stark contrast to how the industry initially developed, many of the airlines in the
western world now operate in competitive markets. With the removal of the protection
provided by legislative oversight and public subsidies, airlines were pushed into
competition with one another. Both internal and external forces have led a vast
restructuring of the industry (Morrison & Winston, 1986; Williams, 1994), leading to
mergers, consolidations, and bankruptcies among many of the major industry carriers
(Doganis, 1999; Williams, 1994). However, one success that has emerged during this
period of traditional airline decline is the low-cost carrier – the future of aviation.
The aviation industry is characterised by a high degree of fixed costs, however
the success of the LCCs centres around their ability to effectively manage those fixed
costs (Alderighi et al., 2012). Not only does this allow cost savings to be passed onto the
consumer, but by excluding unessential services from the base ticket price the
consumer is left to better manage the price they pay for the ticket. However, as
traditional carriers begin to streamline their operating practises, the LCC price
advantage is shrinking. Furthermore, many of the LCCs have developed a reputation
for unfavourable customer service (Southwest excluded). This is largely due to their
competitive management strategy of high employee utilisation (Malighetti, Paleari, &
Redondi, 2009a) and corporate culture (Murphy, 2001; Smith, 2013).
An increase in global travel has led to an increase in airline passenger numbers,
yet rising fuel prices, competition in liberalised markets, and tight margins make
profitability difficult to maintain. It is therefore essential that marketers focus their
research on the airline industry to ensure its survival. Obvious attention should be
directed toward factors affecting competitive advantage and profitability. Of the
competitive avenues defined by Belobaba, Odoni, and Barnhart, the principal area for
market research should be Service Quality (Belobaba et al., 2015). Airline route
structure can be difficult, time consuming and costly, and price competition will
55
continue to drive fares nearer to the break-even point. Service Quality is now the last
playing field for airlines to gain a competitive advantage within the marketplace.
Furthermore, marketers should focus attention to the LCC industry. This sector
is the fastest growing and most profitable within the airline industry on an almost
universal scale. The success of the model cannot be understated and with traditional
carriers fast adopting “low-cost like” strategies, it appears that a large portion of the
industry is headed in this direction.
The low-cost carrier is particularly interesting to academic research. This
segment has seen rapid growth within the decade. Furthermore, whenever a LCC
enters a market dominated by traditional carriers, it almost instantly becomes the
dominant player (save the presence of another competing LCC) (Doganis, 2006;
Francis et al., 2006; Gilbert et al., 2001; Michaels & Fletcher, 2009). Determining the
drivers of these relatively new (for the aviation industry) business models success, as
well as defining its peculiarities and nuances should be paramount for academics and
industry watchers. No industry today is at such a turning point in which many players
are redefining their operational, managerial and competitive strategies.
The roots of the LCC revolution lie in the late 1970 when critical legislation, the
United States Deregulation Act of 1978, severely impacted the operational and
competitive strategies of the aviation industry. Deregulation, liberalisation, open-skies
agreements, labour union disputes, legislation and litigation have all led to the industry
developing into what is now a highly competitive environment for the modern air
carrier, and the emergence of the low-cost carrier. These airlines have developed
competitive strategies drastically different than the traditional carriers. Low-cost
carriers try to manage costs by cutting inclusive services from the base ticket price (the
topic of unbundling of services will be expanded in the next chapter). However,
margins will continue to diminish even after the airlines hit the zero point of service
inclusion. This research sees the industry’s zero-sum game as a forthcoming affliction

56
as there is a finite number of services to exclude. Without serious strategic change, this
will leave the industry in a terminal state. This research views quality of service (and
the resultant customer satisfaction) as a viable means of gaining a competitive
advantage in the future airline marketplace. Therefore, the next chapter will focus
specifically on Service Quality in the airline industry (what it is and what needs to be
done).
57
CHAPTER THREE: SERVICE QUALITY IN THE AIRLINE INDUSTRY
3.1 Introduction
Her name was Ellen Church. Born in Cresco, Iowa, in 1904, she was a fully qualified
nurse and pilot. She had a passion for aviation and felt that her experience and training
as a registered nurse would make her an asset to an airline by allowing her to aid
passengers in emergencies and on bumpy flights. She petitioned Steve Simpson from
Boeing Air Transport for the role. He was so taken with this novel concept that he
requested his manager employ her on a trial basis along the Oakland to Chicago route.
In this request, he brilliantly exemplified the opportunity: “Imagine the psychology of
having young women as part of the crew. Imagine the national publicity we could get
from it and the tremendous effect it would have on the travelling public. Also, imagine
the value they would be to us, not only in the neater and nicer method of service food,
but looking out for the passengers' welfare” (Omelia & Waldock, 2003, p. 12). On May
15th, 1930, Boeing Air Transport (later to become United Airlines) became the first
airline to employ a stewardess.
Ellen Church had so successfully demonstrated the concept of the stewardess
that Boeing Air Transport soon hired eight ladies with similar qualifications. These
early stewardesses had to meet with strict requirements: they were scrutinised for their
attractiveness, and were required to be single and less than 25 years old. They were not
allowed to weigh more than 115 pounds, however this was largely to minimise
interference with the weight and balance of early aircraft as they moved about the
cabin. The low ceilings and extremely narrow aisles of early aircraft also limited their
height to a maximum of 5’4” (Omelia & Waldock, 2003, p. 17). On top of the physical
requirements they were also required to be registered nurses.
58
The responsibilities of the early hostesses were numerous. In addition to many
of the common duties of today’s stewardess (such as serving food and issuing safety
briefings), the early hostess had to battle with cold cabins, constant turbulence (many
of the early airlines rarely flew above 10,000 feet), cramped cabins, extreme weather
and unsafe aircraft (by today’s standard) that resulted in frequent forced landings
(Brady, 2000a). The United Airlines Air Stewardesses Manual outlined: “Check the
floor bolts on the wicker seats on the Ford Tri-Motor to make sure they are securely
fastened down, swat flies in cabin after take-off, and warn passengers against throwing
lighted smoking butts or other objects out the windows, particularly over populated
areas” (Omelia & Waldock, 2003, p. 18). Despite the challenges, their performance
would revolutionise the air travel industry. With the “Original Eight,” as they were
later known to United Airlines, the era of in-flight service was born.
3.2 Phases of the Air Travel Experience
The flying experience has changed considerably since the early days of air travel. Gone
are the days of exclusivity. In the past, the relatively small demands for air transport
allowed airlines to offer more personalised services (at both the airport and in flight)
than many of today’s passengers receive. Today, air travel is accessible to the masses.
However, with this increased demand comes smaller seats, less legroom, lower quality
meals, and an overall less personalised service. While full-service carriers still offer
premium service options to a select few (such as First or Business Class), most of the
LCC in operation do not (the exception being EasyJet, offering business class service on
some routes).
From the consumers’ point of view, the air travel experience can be divided into
three distinct phases: i) check-in and boarding (airport side); ii) the in-flight phase and
iii) arrival (leaving the airport), as illustrated in Figure 3.1. At each stage, the consumer
has different needs and requirements and is conversely met with distinct challenges.
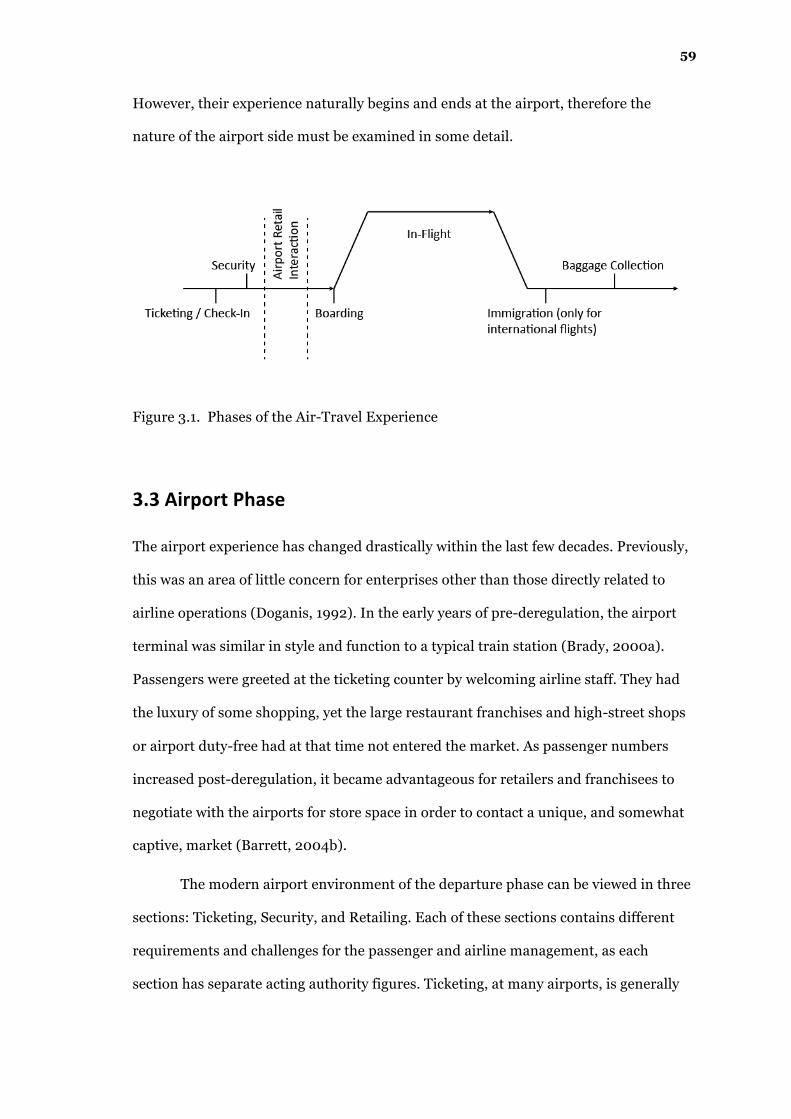
59
However, their experience naturally begins and ends at the airport, therefore the
nature of the airport side must be examined in some detail.
Figure 3.1. Phases of the Air-Travel Experience
3.3 Airport Phase
The airport experience has changed drastically within the last few decades. Previously,
this was an area of little concern for enterprises other than those directly related to
airline operations (Doganis, 1992). In the early years of pre-deregulation, the airport
terminal was similar in style and function to a typical train station (Brady, 2000a).
Passengers were greeted at the ticketing counter by welcoming airline staff. They had
the luxury of some shopping, yet the large restaurant franchises and high-street shops
or airport duty-free had at that time not entered the market. As passenger numbers
increased post-deregulation, it became advantageous for retailers and franchisees to
negotiate with the airports for store space in order to contact a unique, and somewhat
captive, market (Barrett, 2004b).
The modern airport environment of the departure phase can be viewed in three
sections: Ticketing, Security, and Retailing. Each of these sections contains different
requirements and challenges for the passenger and airline management, as each
section has separate acting authority figures. Ticketing, at many airports, is generally
60
managed by the airline (with the UK being an exception), security is in the control of
national governance in most of the world, and retailing is overseen and run by third-
party retailers/franchisees; therefore, it is important to examine each stage
independently.
3.3.1 Ticketing
Prior to the late 1990s, most airline tickets were purchased in person from the airline’s
ticket counter, or from a travel agent (Doganis, 2006). Despite allowing the airline to
more closely control their pricing, this was burdensome for the consumer. During the
last part of the Twentieth Century, online price-comparison sites became popular. This
led to an e-ticketing revolution whereby consumers could easily and quickly engage in
the comparison of multiple airlines' services and pricing. This new age of consumer is
very price sensitive (Franke, 2004b; Park, 2007), highly informed and possesses a high
degree of buying power (Robertson & ChengLung, 2005).
The almost universal adoption of e-tickets, coupled with online check-in
procedures and the ability for many passengers to print their own boarding passes, has
led to a more expeditious experience for many. There is no longer any need to wait in
long lines at the check-in counter (as long as the passenger is without checked
baggage). Online e-ticketing and boarding passes is an area where LCCs are leading
the field (Franke, 2004b). Many LCCs, such as Ryanair, realised that long ticket lines
can have an impact on efficiency and profitability. Therefore, numerous LCCs have
even begun to charge passengers for printing a boarding pass at the counter
(Malighetti, Paleari, & Redondi, 2009b). However, e-ticketing and online boarding
passes have undoubtedly made the airport experience less stressful for the consumer
and have speed up the transition to the security phase (Gkritza, Niemeier, &
Mannering, 2006; Halpern & Graham, 2013; Pate & Beaumont, 2006).
61
3.3.2 Security
In the early years, security was of little concern (Brady, 2000a, 2000b; Lehrer, 2000).
There were no baggage screenings or even checks for personal identification. The only
requirement for a passenger to board a flight was to arrive shortly before departure and
present a ticket. Passengers would often have their friends and family accompany them
directly to the gate. January 5th, 1973 saw a marked change in the airport experience
(Lehrer, 2000; Lindsey, 1973). Following a terrorist attempt to take control of Southern
Airways flight 49 and crash it into the Oak Ridge National Laboratory in Oak Ridge,
Tennessee, the US Federal Aviation Administration required that all airlines screen
passengers and baggage prior to boarding (Lindsey, 1973). However, it was the
responsibility of the airline to oversee security screening and the airport itself had no
authority at this point. This screening was performed at the airline gate just prior to
boarding.
The modern day airport security scenario is much more complex. Today,
airlines have no control over the security screening process. This process is specifically
overseen by the national government in all International Civil Aviation Organisation
(ICAO) countries. Furthermore, post-September 11th (hereafter referred to as 9/11),
security protocols can change rather rapidly, requiring consumers to stay educated on
the subject. However, recent advancements in technology (such as whole body imaging
systems) are soon to be adopted worldwide among all ICAO countries (Elias, 2010).
This may streamline the process of security screening making it much faster and well
as increasing reliability. However, passenger volume at larger airports can still make
this process time consuming and the invasive nature of these security checks stressful
for passengers (Gkritza et al., 2006). Gkritza, Niemeier and Mannering demonstrate
the inverse relationship between wait times at airport security checkpoints and
62
passenger satisfaction(Gkritza et al., 2006)9; however, smaller airports with lower
passenger volumes may offer shorter security wait times and may help reduce
passenger stress (Barrett, 2004a; Francis et al., 2003).
There has been some examination into the effect of increased security measures
and passengers’ overall satisfaction with the air travel experience (Gkritza et al., 2006;
Sindhav, Holland, Rodie, Adidam, & Pol, 2006); however, there is no clear evaluation
of the impact of airport screening on passengers’ perceptions of the air travel
experience. There is also very little research into the effect of increased security
measures on overall passenger volumes. There is some evidence that passenger
screening has had little effect on passenger volumes while baggage screening was seen
to dramatically reduce passenger volume post-9/11 (Blalock, Kadiyali, & Simon, 2007).
Even though passenger screening procedures are out of control to both the airline and
the airport authority, it is still a factor in passengers’ overall evaluations of the quality
of experience (Correia, Wirasinghe, & de Barros, 2008). Thus, the security process may
undoubtedly affect how passengers behave as they transition to the next phase of the
air travel experience (Perng, Chow, & Liao, 2010).
3.3.3 Airport Retailing
Driven by increased passenger traffic, the airport has become a new frontier for
retailers (Doganis, 1992). Gone are the days of passengers foraging for snacks from
vending machines or waiting in line at cafeteria-style restaurants for poor quality food
(Cerovic, 1998). Today’s air traveller can choose from major restaurant franchises, high
street retail shops or even speciality airport-specific business (such as the micro-hotel
chain YOTEL). European airports often offer high-street retailers that utilise innovative
layouts (Cerovic, 1998; Freathy & O’Connell, 1999). Many airports in Europe have
9 The qualitative study in Chapter Seven further illustrates the relationship between the airport experience and customer's perceptions of the airline experience.
63
begun to see shops as brand development tools for the airport itself (Cerovic, 1998).
Conversely, the North American market is significantly behind the European/UK
market in airport retailing investment. In the US, some retail shops have begun to take
hold, however; these are mostly in the food-service industry (Cerovic, 1998).
The increased privatisation of airports across Europe has fostered the
commercialisation of the airport environment (Doganis, 1992) and created novel
approaches to revenue generation and management. Becoming more prevalent is the
idea of the airport as not just a transient gateway from one destination to another, but
as a destination in its own right (Freathy & O’Connell, 1999).
Typologies of airport retailing have become highly varied in recent years
(Freathy & O’Connell, 1999); however, retailers can be classed into four main
categories: strict commercial services, food and beverage, complementary services, and
advertising services (Jarach, 2005). Strict commercial retailers offer items such as
jewellery, car rental, high-street apparel, and newsagents. These make up the majority
of goods purchased within the airport. Food and beverage storefronts can greatly wide-
ranging, offering services from typical fast food franchises to four-star sit-in
restaurants. Complementary services are there to directly enhance the passengers’
travel experience by providing additional amenities while travelling. These include cash
machines/currency exchange, internet access, or religious services.
There is some discrepancy as to the passengers’ desires and emotional state
when entering the retail side of the airport (Bor, 2003). The opponent-process theory
of emotion (Bor, 2007) maintains that after passengers have made their way through
the security phase, feelings of tension become replaced with feelings of excitement
(Thomas, 1997). This creates a “happy hour,” whereby passengers can engage in
shopping or other leisure activities (Perng et al., 2010). However, it is more likely
(especially in the post-9/11 travel experience) that many passengers, driven by a
heightened sense of anxiety resulting from their unfamiliarity with the air travel
64
experience, will experience “gate lock” whereby they quickly pass through the terminal
and arrive at their departure gate much earlier than required (Freathy & O’Connell,
1998). This is confirmed by observing that many airports are beginning to place
storefronts near departure gates.
Airport retailing is expected to grow exponentially in the near future (Freathy &
O’Connell, 1998, 1999; Thompson, 2007). Turnover in airport retailing may not be
large, but it represents an important opportunity for brand exposure (Halpern &
Graham, 2013; Thompson, 2007). With the privatisation of many of the world's
airports, the importance of revenue generated from airport retailing is at an all-time
high. However, simply providing passengers with retail opportunities may not be
enough (Halpern & Graham, 2013). A differentiating factor among airports may in fact
be the quality of service provided to passengers (Correia et al., 2008; Fodness &
Murray, 2007; Halpern & Graham, 2013; Tsai, Hsu, & Chou, 2011).
3.3.4 Airport Service Quality
Despite the importance of the airport servicescape to both the travel and retail
industries, only a small amount of research into passenger's perceptions of airport
Service Quality has been undertaken (Fodness & Murray, 2007; Tsai et al., 2011). This
is most likely due to the relatively new (in terms of the whole of aviation history)
concept of the airport as a retailing centre as well as a travel hub (Halpern & Graham,
2013). While Tsai, Hsu and Chou used the SERVQUAL model as the base for their
research, Fodness and Murray undertook a qualitative study to discover the
determinants airport Service Quality (Tsai et al., 2011; Fodness & Murray, 2007).
Fodness and Murray sampled 100 participants at a major airport in the Southwest of
the United States through in-depth interviews and focus groups and employed content
analysis techniques for both. They discovered that the determinants of passenger's
Service Quality of airports consisted of three primary dimensions and three sub-
dimensions of each (Figure 3.2). This is similar to Brady and Cronin’s (Brady & Cronin,
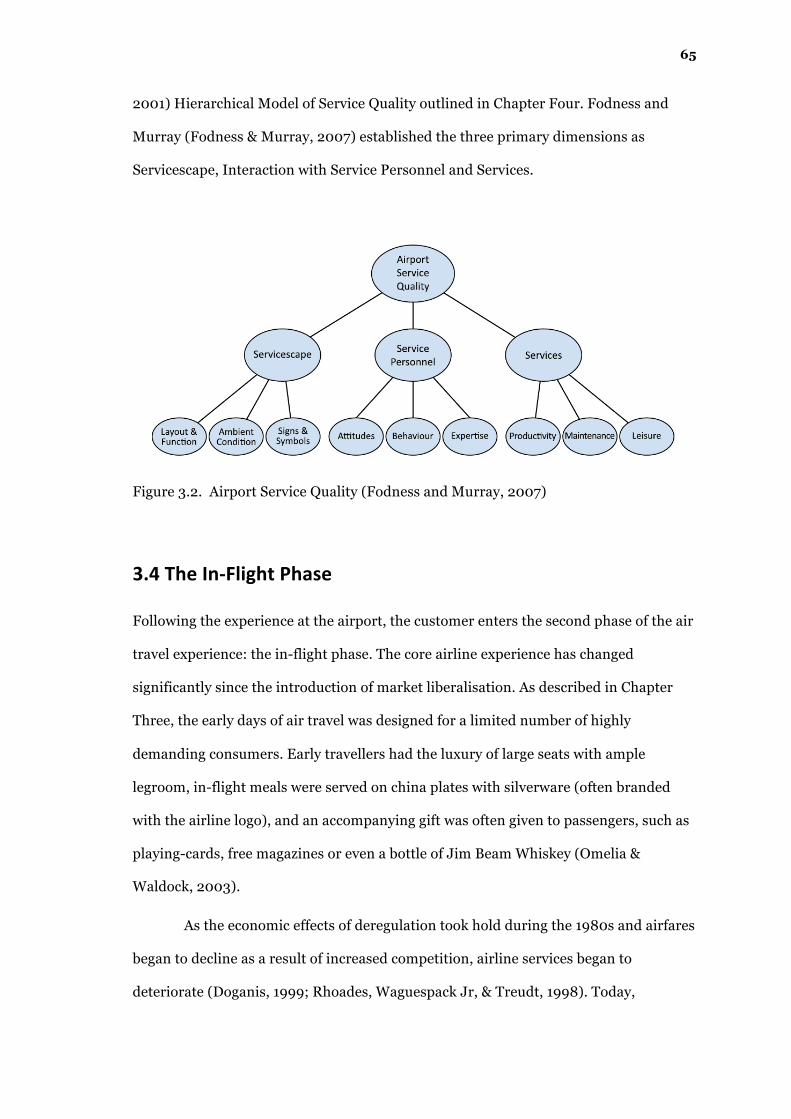
65
2001) Hierarchical Model of Service Quality outlined in Chapter Four. Fodness and
Murray (Fodness & Murray, 2007) established the three primary dimensions as
Servicescape, Interaction with Service Personnel and Services.
Figure 3.2. Airport Service Quality (Fodness and Murray, 2007)
3.4 The In-‐Flight Phase
Following the experience at the airport, the customer enters the second phase of the air
travel experience: the in-flight phase. The core airline experience has changed
significantly since the introduction of market liberalisation. As described in Chapter
Three, the early days of air travel was designed for a limited number of highly
demanding consumers. Early travellers had the luxury of large seats with ample
legroom, in-flight meals were served on china plates with silverware (often branded
with the airline logo), and an accompanying gift was often given to passengers, such as
playing-cards, free magazines or even a bottle of Jim Beam Whiskey (Omelia &
Waldock, 2003).
As the economic effects of deregulation took hold during the 1980s and airfares
began to decline as a result of increased competition, airline services began to
deteriorate (Doganis, 1999; Rhoades, Waguespack Jr, & Treudt, 1998). Today,
66
premium airline service is almost non-existent except to a select few customers (such
as First and Business Class). Compared to the experience of today, standard fare
passengers on traditional carriers have less legroom, less comfortable seating and
reduced meal quality while the LCCs have removed inclusive services altogether.
3.5 The Airline “Product”
The airline “product” is highly complex (Belobaba et al., 2015; Doganis, 2006; Halpern
& Graham, 2013). The basic service encompasses nothing more than the right to board
a particular flight and be transported with reasonable safety from point A to point B
within the schedule stated on the ticket. Seats on board the aircraft operating within
given markets are relatively homogeneous. This results into distinct consequences for
players in a given market (Doganis, 2006). Firstly, homogeneity increases the threat of
new entrants within the market. Without drastic service differentiation, open-skies
agreements and high passenger yields can make it relatively easy for established
airlines to enter new markets. Secondly, the homogeneous nature of the industry drives
competitors to differentiate themselves. Traditionally, players have tried to gain a
competitive advantage by offering passengers the opportunity to fly on-board the latest
aircraft types, offering more frequent services within competitive markets or by
spending money on more tangible aspects of the air-travel experience such as in-flight
entertainment or airport lounges (Belobaba et al., 2015; Halpern & Graham, 2013).
Many traditional carriers are attempting to overcome homogeneity and beginning to
differentiate themselves based on inclusive services. This usually involves the
promotion of new and advanced first-class seating (Omelia & Waldock, 2003). Some
traditional carriers now offer first class travellers comfortable seating that can include
(depending on the airline and market served) the following: reclining seats that are one
to two inches wider, recline more than economy seating and can have ten to thirty
inches more legroom, lie-flat seats that recline completely horizontally and in-flight
67
suits, which consist of lie-flat beds with a privacy divider between areas
(SeatGuru.com, 2014). This level of service often comes with more attentive cabin crew,
higher quality meals, personal workstations and electrical sockets to power laptops and
other devices. Many traditional carriers (such as JAL, Korean Air, Emirates, and
Cathay Pacific) are returning to a pre-deregulation branding strategy, whereby
excellent service (albeit mostly to first class passengers) is a highlighted feature
(Seatguru, 2013). Price competition is still the most popular way to gain an advantage
in many markets, especially when considering LCCs (Doganis, 2006, 2009). However;
due to ever shrinking margins, this zero-sum game is may reach a point that could be
terminal to the industry as a whole.
Most airlines recognise that their service is inextricably linked to a variety of
other products and services (Doganis, 2006, 2009). The airline is not a service that is
consumed alone, it is almost always consumed in conjunction an external experience
driving the purchase, such as a holiday or business trip (Barrett, 2004a). Airline
services can be a highly varied, yet an integral part of the consumer's decision making
process (Park, 2007). While most airlines face similar market challenges, the level, type
and quality of service can still be highly varied. However, the LCC industry, with its
commitment to cost reduction, offers the most standardised services (or lack thereof)
among operators in the airline industry (Barrett, 2004b). This similarity makes
modelling Service Quality in this industry very interesting to researchers wishing to
highlight its importance by providing a sample with fewer differing variables between
subjects, thus highlighting minute operational differences.
3.5.1 Service Quality in the Low-‐Cost Carriers
The debate over Service Quality in the airline industry begins with de-regulation in the
late 1970s (Cunningham, Young, & Lee, 2004). While the airlines may have mixed
opinions on deregulation, the entrance of non-state-owned carriers into the
marketplace has had a positive impact in terms of overall customer satisfaction (López-
68
Bonilla & López-Bonilla, 2008a) . López-Bonilla and López-Bonilla (López-Bonilla &
López-Bonilla, 2008b) outline that the discrepancy in satisfaction is a result of poor
quality on part of the state-owned carriers. They maintain that state carriers often
suffer from “Distressed Airline Syndrome.” This is “a political and organisational virus
that affects most state-owned carriers” and is directly related to a combination of
factors, such as: “The inability to replace inadequate staff, poor management and
strong unions” (López-Bonilla & López-Bonilla, 2008b). While this might not be the
case for all airlines, it is certainly a reasonable explanation for the shortcoming of most
state-owned carriers and is congruent with the theory that private organisations
generally perform better than state-owned firms (Boardman & Vining, 1989).
Chapter Two introduced the concept of LCCs as champions of the liberalised
market. Their services are remarkably different from traditional carriers. Almost every
aspect of their service strategy is centred on reducing costs (Barrett, 2004b). Despite
an almost universal corporate focus on cost reduction, most players have their own
interpretations of what aspects of airline service are important to their customers (Pate
& Beaumont, 2006). The grandfather of all LCCs, Southwest airlines in the United
States, not only has a different service strategy than that of traditional carriers, but they
also evolved to remain competitive in a changing market. Initially, Southwest offered
single tickets in only one seat class, quick turnaround of aircraft and point-to-point
routing on board a standardised aircraft type (Harvey & Turnbull, 2010). Attractive,
young stewardesses in “hot-pants” served the cabin. Early travellers even received a
free bottle of whisky with every ticket (Omelia and Waldock, 2003). Today Southwest
have replaced many of these now-outdated services with more standard in-flight
services and uniforms (Harvey & Turnbull, 2010). However, the focus is still on
reducing cost in order to lower fares while “making flying fun” (“Nuts About Southwest
- Funny Stuff...,” 2012). The success of the Southwest model has made its way to the
European market where two Southwest Copycats (Ryanair and EasyJet) have begun to
dominate the market (Doganis, 2001).

69
During his introduction as CEO of the Irish airline Ryanair, Michael O’Leary
incorporated much of the Southwest business model and took it to the next level and
established a complete “no frills” strategy (Ryanair, 2012a). This is slightly different
from the traditional LCC model of “low-fare” airlines in that Ryanair offers no inclusive
services at all10. However, unlike at Southwest, service at Ryanair isn’t “fun” (Harvey &
Turnbull, 2010; O’Connell & Williams, 2005); according to popular media reviews, it
isn’t even pleasant (Calder, 2002; Murphy, 2001). The no-frills strategy employed by
Ryanair encompasses every aspect of airline operations and has even reached the
highest level in the company. Ryanair CEO, Michael O'Leary, has been well-publicised
in voicing his opinions in a brash, unprofessional manner. Ryanair seems to use
O'Leary's outlandish behaviour as a marketing strategy (Barrett, 2004b; Calder, 2002;
R. Johnson, 2009; Killduff, 2010). In a statement to the American news channel CNBC,
O’Leary remarks about some controversy over the Ryanair Logo: “She looked like a
bloke with wings. Somebody said we should give her bigger boobs. So we did. Some
quango said we were demeaning women. Fuck off. She’s got bigger boobs and the story
got two half-pages in the Sun, worth £25,000 each” (Johnson, 2009).
Service with Ryanair is basic. Almost nothing is included. Passengers must even
pay if they need a boarding pass printed at the airport instead of printing one at home
themselves (Malighetti et al., 2009b). This strategy has allowed Ryanair to offer a base
tariff that is the lowest in the industry (Ryanair Annual Report, Ryanair Holdings PLC.,
2012). Ryanair is adamant about its pricing policy and aims to be the “cheapest airline
in Europe, and nothing else” (Killduff, 2010).
Recent legislation from the European High Court may affect Ryanair's
profitability and force them to rethink their customer service strategy (Mulligan, 2013).
The European High Court ruled in favour of a Ryanair passenger who claimed damages
10 Ryanair is still considered a “Southwest Copy-cat” as it is a wholly owned airline
that incorporates much of the low-cost model established by Southwest.
70
against the company after being stranded following the Eyjafjallajokull volcanic ash
cloud eruption in Iceland during 2010. Prior to this ruling, Ryanair already had a
claims procedure in place to reimburse passengers’ losses due to delays caused by the
volcanic ash disruption (Ryanair, 2013). Despite Ryanair's claim the passenger's
compensation was excessive, the court stated: "An airline has no limit in its
responsibility to its passengers” (Metro, 2010; Mulligan, 2013). This has left Ryanair in
a more vulnerable position, requiring the company to adjust its customer service
policies.
This avoidance of Service Quality by Ryanair is in stark contrast to its largest
competitor EasyJet (Pratley, 2012). While still offering a no-frills service strategy,
EasyJet seems to operate by the old adage, “service with a smile”. Its customer centric
views are even expressed in their long-term strategy published in their corporate
annual report (“EasyJet, Plc. Annual Reports and Accounts 2013,” 2014). A major part
of their strategic framework is to focus on the customer and improve the customer
experience. EasyJet sees its employees as an important asset, both to the provision of
quality service and to maintaining an overall competitive advantage. Furthermore,
EasyJet is the only LCC to actually publish “overall customer satisfaction” and “likeness
to recommend” values as Key Performance Indicators in their corporate annual reports
(“EasyJet, Plc. Annual Reports and Accounts 2013,” 2014). Therefore, in the context of
approach to Service Quality, Ryanair and EasyJet are polar opposites. However, they
both participate in a practise of in-flight retailing. Although in-flight retailing began as
an additional service on board traditional carriers, it has now been expanded into the
LCC model to encompasses basic services.
3.5.2 In-‐Flight Retailing
Form early in airline history, many airlines (such as Pan Am) sold exclusive goods to
passengers duty-free (Omelia & Waldock, 2003). Often these products were specially
71
held for the airlines exclusive passengers by the producer and accessing these duty-free
goods was one of the fringe benefits of the early days of flying (Omelia & Waldock,
2003). However, since the introduction of duty-free shops in the most frequented
terminals there has been a negative impact on in-flight duty-free sales (Francis et al.,
2003). This is most likely due to the more tactile experience of shopping in the airport’s
retail store than the catalogue-style purchases made on-board the aircraft (Omar,
2002).
With external market forces and increased competition driving down margins
for many of today’s airlines, selling ancillary products in conjunction with the airline
ticket has regained popularity (Doganis, 2006). While traditional carriers have long
offered luxury items, the LCCs have begun to offer a variety of ancillary products or
services. These can be highly varied and can range from in-flight entertainment, in-
flight meals and drinks to lottery cards or even post-flight services such as
accommodation (EasyJet now operates its own range of hotels). The low-cost carrier
has been a champion in this area, and many of the services associated with traditional
carriers (such as a baggage allowance, in-flight meals, drinks and entertainment) have
been transformed into ancillary revenue streams (Piga & Filippi, 2002). This allows the
LCC consumer to better manage the overall cost of air travel by directly choosing which
services they wish to purchase. With the LCC model comes an interesting change in the
consumer experience. No longer is the cabin simply a place where service are rendered,
it is now a place where products are sold. In this model, services like in-flight meals,
entertainment, or (in Ryanair’s case) toilets provide an alternate revenue stream for the
LCC. It also allows both the airline and the consumer to better manage expenses.
Ancillary revenues have become very important to LCCs (Michaels & Fletcher,
2009). During the fiscal years of 2009, 2010 and 2011 Ryanair generated almost 600
million Euros in ancillary revenue each year (Ryanair, 2012b), accounting for over 20%
of their total revenue. Moreover, over half of all ancillary revenues sold during this time
were from in-flight sales (Ryanair, 2012b, p. 46). The importance of managing this
72
revenue stream cannot be understated. With over 12% of Ryanair’s total revenue
coming from the in-flight sale of food, beverages and material goods alone, this is
clearly a key item on Ryanair's balance sheet and is integral to maintaining profitability
and a competitive advantage (Ryanair, 2012b, p. 47).
This new strategy of selling goods or services while in-flight has inadvertently
turned the cabin of the aircraft into a storefront with the cabin crew acting as
salespeople. Traditionally, a crew member would simply offer a passenger a choice of
beverages; now they are encouraged to up-sell or suggest various products. This is
common practise with many LCCs, particularly Ryanair, where crew member's salaries
can be based on sales performance (Ryanair, 2012b, p. 60). This creates a new set of
objectives for the airline personnel who must act as both service providers and retail
salespersons.
3.5.3 The Importance of Service Quality to Profitability
Despite the “no-frills” philosophy, many aspects of air transport service have improved
with LCCs in comparison to their legacy counterparts (Barrett, 2005). Much of this
comes from the LCCs point-to-point design, the use of “small” airports, and high
utilisation of labour. The point-to-point route structure also offers a reduced chance of
lost luggage over the traditional hub-and-spoke system of traditional airlines (SITA,
2015). Overbooking (the practise of selling more tickets than available seats for a given
flight) is also not a problem with LCCs as most carriers do not oversell their flights.
Therefore, there is very little chance that a passenger may be denied boarding (as with
the legacy airlines), which can lead to passenger frustration (Wangenheim & Bayón,
2007). Furthermore, according to data collected by the Civil Air Authority in 2013, on-
time performance tends to be much better with LCCs than with legacy carriers. For
73
example, in 2013 Ryanair produced an on-time performance11 of 93% and EasyJet
88%, while British Airway only produced an on-time performance of 65% (Civil
Avation Athority, 2012). This is most likely because of the point-to-point system,
operating from smaller secondary airports, and the high utilisation of labour (Barrett,
2004a).
As their business model dictates, LCCs are price competitive airlines. This has
resulted in an operating strategy of reduced or unbundled services. While amenities
such as food and entertainment may be available on the LCC, they are not included in
the ticket price and must be purchased for an additional fee. The key being that the cost
savings of the LCC is substantial enough to warrant this unbundling of services.
However, while passengers may be able to purchase similar services as a traditional
carrier on a LCC (in addition to the base fare), it is not known to what extent this
unbundling has on passengers’ perception of Service Quality.
Service Quality is becoming increasingly important to air travellers and the airline
industry (An & Noh, 2009; Gilbert & Wong, 2003; Park, Robertson, & Wu, 2006;
Tiernan, Rhoades, & Waguespack, 2008). Service Quality can have a significant effect
on establishing customer loyalty within the industry (An & Noh, 2009; Chang & Chang,
2010).
As the average person in the UK will spend around 12 full days on board an
aircraft in their lifetime (Anderson, 2015), maintaining loyalty may be important for
industry success.
Passengers’ purchase behaviour differs greatly in respect to what airline they
choose to fly. This behaviour can vary with passenger demographics (Park et al., 2006)
and reasons for travel (Harris & Uncles, 2007). Park, Robertson and Wu (Park et al.,
2006) determined that Service Quality is crucial to the decisions making process, as it
11 Measured as a percentage of flights arriving early to 15 minutes late.
74
is a driver of both perceived value and passenger satisfaction. However, satisfaction
itself is not always guaranteed to produce repurchase behaviour as repurchase effect
can be moderated by convenience, income, competitive intensity and consumer
involvement (Seiders, Voss, Grewal, & Godfrey, 2005). Given that convenience is
nullified by the aviation market structure (airlines only compete within the markets
that they serve) and there is little consumer involvement within the LCC market (LCCs
are not heavily involved in consumer loyalty schemes), the most important driver of
repurchase behaviour for LCC industry is price.
Price is negatively associated with consumers’ repurchase intentions in the
airline industry (Park et al., 2006). If perceived ticket price is low, then consumers are
more likely repurchase with the airline. This could explain some of the success of the
LCCs “no-frills” business models. However, at this time, the consumer has no way of
comparing airline services (short of flying on each airline operating a given route). This
could change with the development of an instrument that would aid consumers in
choosing the airline that offers the most satisfactory level of service at the most
economical price (given that there is more than one LCC serving their market). This
would make maintaining a high level of Service Quality an important strategy in the
highly competitive LCC industry.
3.6 Conclusion
The literature suggests that each facet of the air-travel experience can have an effect on
customer's perception of Service Quality (Park, 2007). However; within the British
market, many of these factors are out of the control of the airline. At many airports in
the UK, ticketing, check-in and baggage are handled through a third-party contracted
by the airport (for example, Servisair at Edinburgh Airport) thereby nullifying the
airline’s influence on the provision of such services. Furthermore, many passengers
now choose to print their own boarding tickets and may bypass the ticket counter
75
altogether (save having to check baggage). The retailing side of the airport experience
is uniform for all passengers and is again out of control of the airline. Within the
airport, LCC do not maintain proprietary lounges (although EasyJet allows for booking
into third-party lounges via their website). These factors make the air-travel experience
in Britain somewhat more uniform than in other markets. The LCC experience is the
most standardised when compared to traditional carriers. This should magnify the
effect of Service Quality on competitive advantage.
Removing inclusive services may become a self-defeating prophecy for the LCC
industry (Doganis, 2006; Francis et al., 2006; Graham, Alessandro and Humphreys
2006). On one hand, it allows airline customers to individually tailor their travel
experience. On the other, once all services are removed it puts airlines in direct price
competition. This could make it difficult for low-cost airlines to differentiate
themselves from one another within markets. To add to this problem, traditional
carriers are beginning to adopt such cost-cutting strategies while offering inclusive
services. Therefore, industry players will need a way to maintain a competitive
advantage. One way to do this is to establish a reputation for excellent Service Quality.
In most service sectors, Service Quality is directly related to market competitiveness
and overall profits (Gronroos, 1984, 2006); however, profitability cannot be sustained
below the break-even price for given service. Fierce competition and increasing fixed
costs could eventually drive many players to operate at the break-even point, therefore
making price competition very difficult and driving competitive advantages into other
areas (such as service or advertising).
Most of the costs in the aviation industry are fixed within a given market,
therefore the break-even ticket price should be similar among all LCCs operating
within that given market (Belobaba et al., 2015; Doganis, 2006). This is because LCCs
share common operating strategies (point-to-point markets and lack of inclusive
services), management practises (in respect to maintenance and employee utilisation),
and equipment (the industry highly utilises the popular Boeing 737). This zero-sum
76
game of cutting cost will be terminal unless the LCCs can find alternate revenue
streams. One of the most lucrative avenues for alternative revenue generation is
ancillary sales. Such activities are very important to profitability as they can make up
over 10% of total revenue (Ryanair, 2012b). Given a retailing focus, these revenue
streams could be easily managed.
All LCCs attempt to sell passengers consumer goods while in flight. This creates
a wholly unique condition inside the aircraft. On board these airlines, the servicescape
and the retailing environment are inextricably linked. While some service providers in
other industries also sell goods along with their services (for example, hair salons
selling shampoo and hair care products, or an auto mechanic selling car batteries), only
on the LCC are these two so interconnected. For the airline, such sales are a vital
revenue stream unlike other services who sell products on a purely value-added
premise. The consumer on-board the LCC cannot leave to purchase the goods
elsewhere. If the consumer becomes hungry or thirsty they have no choice but to
purchase food and beverages from the airline. Therefore, within this unique
environment, these two systems must affect each other. It is thus vitally important to
determine what relationship they have on one another. Potentially, there may be an
inverse relationship between Service Quality and in-flight sales. If so, a lack of high
quality service could act detrimentally to the airline.
Many of the popular methods for measuring Service Quality (for example,
SERVQUAL, SERVPERF or SERVPEX) have been applied to multiple industries. While
there has been some attention to Service Quality in the airline industry (for example,
An & Noh, 2009; Parast & Fini, 2010; Park et al., 2006; Park et al., 2004; Park,
Rodger, & Wu, 2009; Park, 2007; Saha, 2009), most of this has been qualitative in
nature. Some research has attempted more quantitative measures, but they typically
employ the SERVQUAL model (Chau & Kao, 2009) or extremely complex fuzzy integral
methods (Liou & Tzeng, 2007; Tsaur, Chang, & Yen, 2002). In this industry a
hierarchical performance-only measurement may be more theoretically appropriate.
77
The research into the hierarchical nature of airport quality (Fodness & Murray, 2007)
drives investigation into the structure of airline quality. Since these two systems
complement each other, it is possible that airline quality can also be examined as a
hierarchical construct.
Most academic research into airline Service Quality illustrates that it is
important to customer satisfaction, loyalty (Oh, 1999; Spreng & Mackoy, 1996; Taylor
& Baker, 1994), future purchase intentions (Park et al., 2004) and a firms competitive
advantage (Parast & Fini, 2010; Suzuki, Tyworth, & Novack, 2001). Customer
Satisfaction has long been viewed as an antecedent to Service Quality while Customer
Loyalty and Purchase Intentions are often viewed as service outcomes. This
relationship puts Service Quality at the centre of these factors; a better understanding
of Service Quality in a given industry could help link the understanding of the other
three. This makes examining Service Quality important to the airline industry.
However, there are many possible methods for examining Service Quality in the
low-cost carrier airline industry. The following chapter will discuss the core elements of
Service Quality literature, including its constructs and measurement, to determine
relevant gaps within the literature.
78
CHAPTER FOUR: SERVICE QUALITY
This chapter provides an in-depth review of the Service Quality literature. It covers the
lineage of Service Quality through its genesis, to the current iteration of modern theory.
Research within this area is vast and diverse, encompassing theoretical developments
and applications; this chapter focuses largely on major theoretical developments within
the literature. The main body of Service Quality research begins in the early 1980s and
continues until around 2001.
4.1 Service Attributes
There are a wide variety of services in most developed nations; there are almost as
many types of services as are service providers. Each service has its own characteristics
and can be associated with a set of classifications. Understanding these classifications
is important to differentiating the service sector from manufacturing and helps
researchers to better understand the peculiarities of different service sectors.
4.1.1 Characterising Services
All services typically have a mix of four general character traits. These traits help
distinguish services from the manufacturing industry. These have been identified as
(Zeithaml & Bitner, 2003, p. 20):
• Intangibility: Services are performances or actions. They cannot be seen, felt,
tasted or heard. They are experienced, rather than consumed. Manufactured
items can be visually measured and empirically tested to assure consistency and
quality. Intangibility makes this kind of quality measurement impossible for a
service provider. Likewise, the consumer is unable to try the service before
making a purchase, which creates unique marketing implications for the
services industry. Furthermore, even after a service is rendered, the consumer
79
may not even fully understand the service performed. In the case of technical
services (such as: an auto mechanic, doctor or surgeon), the consumer trusts in
the provider that the service has been performed to an adequate degree because
the consumer lacks the knowledge of experience to ascertain a valid judgement
of the service.
• Heterogeneity: The manufacturing industry is dedicated to product consistency
(evident in modern manufacturing philosophies such as Six Sigma). No two
services are exactly the same. Additionally, no two consumers are exactly alike.
The service sector seeks to reflect this by providing a more individualised
outcome. In this way, services are more akin to performances than productions.
An attorney may provide a different service experience to two different
customers, on the same day. The needs of the consumers may be completely
different and the attorney must adjust his service accordingly. Furthermore, the
performance aspect of the service experience lends itself to a high degree of
variability. The attorney may provide a more detailed service to customers in
the afternoon than early in the morning (when he is tired). Many factors affect
the service experience, from the mood of the provider to the varying needs of
the consumer. In this, no two services are ever the same.
• Simultaneous production and consumption: Unlike manufactured goods that
can be produced, stored, transported and consumed time and again, services
are consumed at the time of production. In many cases (such as a restaurant,
cleaning service, or travel agency), the service is sold before it is consumed. The
consumer cannot try before they buy and therefore relies heavily on external
cues (for example, the appearance and attitude of employees) to make an
informed decision before purchasing. The interaction between the service
provider (or employees of the service provider) and the consumer strongly
affects perceived quality of service and customer satisfaction.
80
• Perishability: Unlike many manufactured goods, services cannot be saved,
stored, resold, or returned. Once a service output is produced, it must be
consumed. An hours' time in an attorney's office, a doctor's visit, haircut, or a
seat on an aeroplane cannot be returned once it is consumed (despite how much
one may wish it). Service providers are then required to have strong recovery
strategies in place to account for unsatisfied customers.
The underlying theme of these elements points to a greater risk on the part of
the consumer when purchasing a service as opposed to a manufactured good
(Shostack, 1977). This can result in a greater level of pre-purchase anxiety than with
manufactured goods. A firm’s reputation for consistently providing consumers with a
high quality of service can help to alleviate some of this anxiety (Gronroos, 1982). That
makes understanding the quality of service outputs extremely important to managers,
whose success in part depends on their ability to effectively communicate the quality of
their service. To understand and convey the quality of service effectively, managers
need a concrete metric with which to measure the quality of service outputs.
The largest distinguishing factor between services and the manufacturing
industry is their degree of interaction with the consumer (Lovelock, 1983). It is also
important to recognise that each service is different. The four characteristics of services
exist in different degrees depending on the service offered; they may even be dynamic,
varying with each service encounter. This variation can make classifying most services
difficult at times.
4.1.2 Classifying Services
There has been significant research and debate over classifications of services (Chase,
1977a; Chase & Tansik, 1983; Lovelock, 1983; Schmenner, 1986; Tansik, 1990;
Wemmerlöv, 1990). Many classifications involve some degree of contact with the
customer, be it “high or low” (Chase, 1977b; Schmenner, 1986) or more recently,
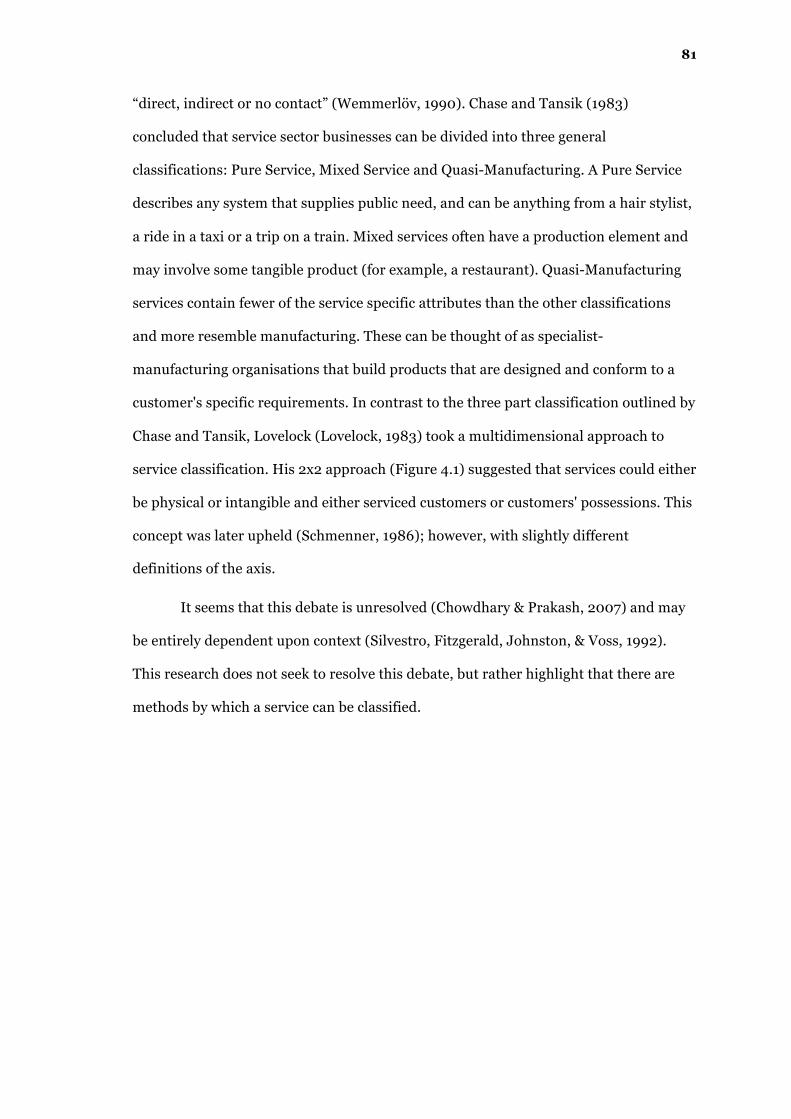
81
“direct, indirect or no contact” (Wemmerlöv, 1990). Chase and Tansik (1983)
concluded that service sector businesses can be divided into three general
classifications: Pure Service, Mixed Service and Quasi-Manufacturing. A Pure Service
describes any system that supplies public need, and can be anything from a hair stylist,
a ride in a taxi or a trip on a train. Mixed services often have a production element and
may involve some tangible product (for example, a restaurant). Quasi-Manufacturing
services contain fewer of the service specific attributes than the other classifications
and more resemble manufacturing. These can be thought of as specialist-
manufacturing organisations that build products that are designed and conform to a
customer's specific requirements. In contrast to the three part classification outlined by
Chase and Tansik, Lovelock (Lovelock, 1983) took a multidimensional approach to
service classification. His 2x2 approach (Figure 4.1) suggested that services could either
be physical or intangible and either serviced customers or customers' possessions. This
concept was later upheld (Schmenner, 1986); however, with slightly different
definitions of the axis.
It seems that this debate is unresolved (Chowdhary & Prakash, 2007) and may
be entirely dependent upon context (Silvestro, Fitzgerald, Johnston, & Voss, 1992).
This research does not seek to resolve this debate, but rather highlight that there are
methods by which a service can be classified.
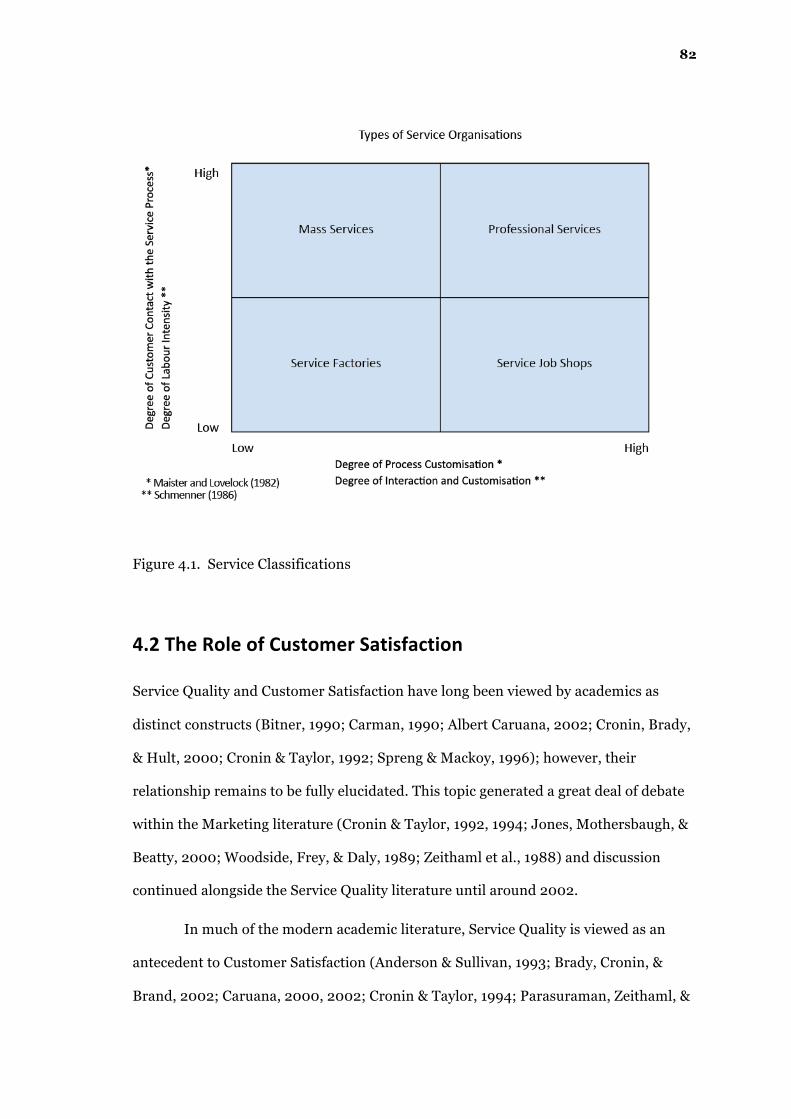
82
Figure 4.1. Service Classifications
4.2 The Role of Customer Satisfaction
Service Quality and Customer Satisfaction have long been viewed by academics as
distinct constructs (Bitner, 1990; Carman, 1990; Albert Caruana, 2002; Cronin, Brady,
& Hult, 2000; Cronin & Taylor, 1992; Spreng & Mackoy, 1996); however, their
relationship remains to be fully elucidated. This topic generated a great deal of debate
within the Marketing literature (Cronin & Taylor, 1992, 1994; Jones, Mothersbaugh, &
Beatty, 2000; Woodside, Frey, & Daly, 1989; Zeithaml et al., 1988) and discussion
continued alongside the Service Quality literature until around 2002.
In much of the modern academic literature, Service Quality is viewed as an
antecedent to Customer Satisfaction (Anderson & Sullivan, 1993; Brady, Cronin, &
Brand, 2002; Caruana, 2000, 2002; Cronin & Taylor, 1994; Parasuraman, Zeithaml, &
83
Berry, 1994)12. Excellent quality will produce a satisfied customer. Customer
satisfaction may also function as a mediator between Service Quality and consumers’
behavioural intentions. Therefore, perceived Service Quality and Customer Satisfaction
should be measured independently from one another (Dabholkar et al., 2000).
Alongside Service Quality, switching barriers may influence overall customer
satisfaction (Jones et al., 2000). These can include anything that increases the
difficulty of switching service providers (such as price, availability or bureaucracy).
Figure 4.2 depicts this relationship of Service Quality and Satisfaction, and consumers’
Behavioural Intentions. In many sectors, competition is naturally the most intense
when switching costs are low. In such markets, Service Quality would be an excellent
avenue for gaining a competitive advantage.
The causal relationship to Service Quality and lack of a clear definition of
Customer Satisfaction results in this being an area of continuing debate within the
Services Marketing literature. This study does not seek to resolve any of these issues,
only to highlight the importance of Service Quality in the overall customer evaluations
of service performance and behavioural intentions. Given the significant role of Service
Quality, it becomes an important variable for management and having an accurate
metric for Service Quality could aid managerial decision-making.
12 Parasurman, Zeithaml and Berry had originally characterised Customer
Satisfaction as a transaction-specific measurement and Service Quality as a global measurement; however, they conceded that Customer Satisfaction it is indeed an antecedent of Service Quality in their 1994 paper Reassessment of Expectations as a Comparison Standard in Measuring Service Quality: Implications for Further Research published in The Journal of Marketing.
84
Figure 4.2 - Customer Satisfaction (Dabholkar, Shepard and Thorp, 2000; Jones, Mothersbaugh and Beatty, 2000)
4.3 Measuring Service Outputs
Quality is a conformance to a specification (Crosby, 1979). Within the manufacturing
sector, the producer defines these specifications; however, within the service sector,
such specifications are largely defined by the consumer (Berry, Parasuraman, &
Zeithaml, 1988). Early research saw Service Quality as a result of process quality and
output quality (Lehtinen, 1983). The consumer judges process quality during the
service and output quality after the service. Therefore, it is the consumer who
definitively makes the determination of Service Quality.
Theoretical debate and development of Service Quality largely took place in the
late 1980s and early 1990s. Much of the research since this time has focused on which
concept best measures Service Quality or modifications of popular models. A common
theme resonates throughout the literature: the valuation of the service outputs rests in
the hands of the consumer. Researchers refer to this as perceived Service Quality.
Traditionally, two schools of thought dominate Service Quality: the Nordic School
(Figure 4.3) (Gronroos, 1982, 1984, 2006) and The American School (Berry et al.,
1985; Brady et al., 2005, 2002; Cronin & Taylor, 1994, 1992; Parasuraman, Zeithaml, &
Berry, 1988; Parasuraman et al., 1985; Parasuraman, Zeithaml, & Berry, 1991; Valarie
Zeithaml, Berry, & Parasuraman, 1996).
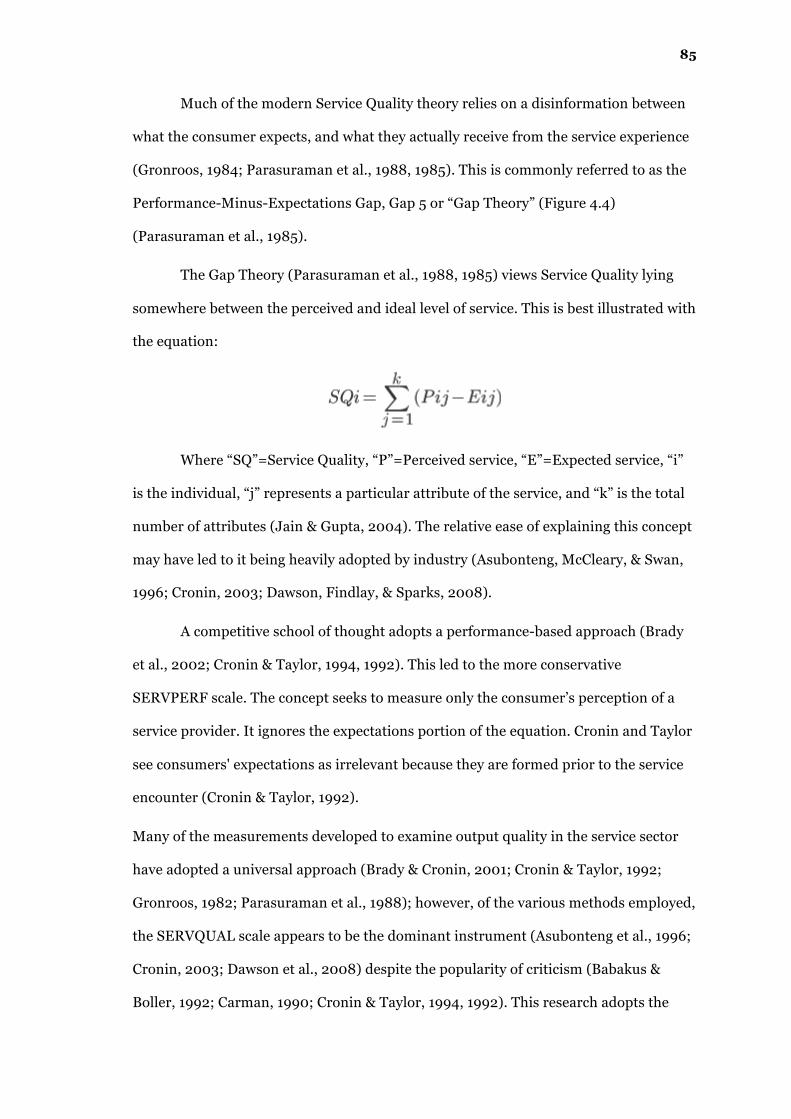
85
Much of the modern Service Quality theory relies on a disinformation between
what the consumer expects, and what they actually receive from the service experience
(Gronroos, 1984; Parasuraman et al., 1988, 1985). This is commonly referred to as the
Performance-Minus-Expectations Gap, Gap 5 or “Gap Theory” (Figure 4.4)
(Parasuraman et al., 1985).
The Gap Theory (Parasuraman et al., 1988, 1985) views Service Quality lying
somewhere between the perceived and ideal level of service. This is best illustrated with
the equation:
Where “SQ”=Service Quality, “P”=Perceived service, “E”=Expected service, “i”
is the individual, “j” represents a particular attribute of the service, and “k” is the total
number of attributes (Jain & Gupta, 2004). The relative ease of explaining this concept
may have led to it being heavily adopted by industry (Asubonteng, McCleary, & Swan,
1996; Cronin, 2003; Dawson, Findlay, & Sparks, 2008).
A competitive school of thought adopts a performance-based approach (Brady
et al., 2002; Cronin & Taylor, 1994, 1992). This led to the more conservative
SERVPERF scale. The concept seeks to measure only the consumer’s perception of a
service provider. It ignores the expectations portion of the equation. Cronin and Taylor
see consumers' expectations as irrelevant because they are formed prior to the service
encounter (Cronin & Taylor, 1992).
Many of the measurements developed to examine output quality in the service sector
have adopted a universal approach (Brady & Cronin, 2001; Cronin & Taylor, 1992;
Gronroos, 1982; Parasuraman et al., 1988); however, of the various methods employed,
the SERVQUAL scale appears to be the dominant instrument (Asubonteng et al., 1996;
Cronin, 2003; Dawson et al., 2008) despite the popularity of criticism (Babakus &
Boller, 1992; Carman, 1990; Cronin & Taylor, 1994, 1992). This research adopts the
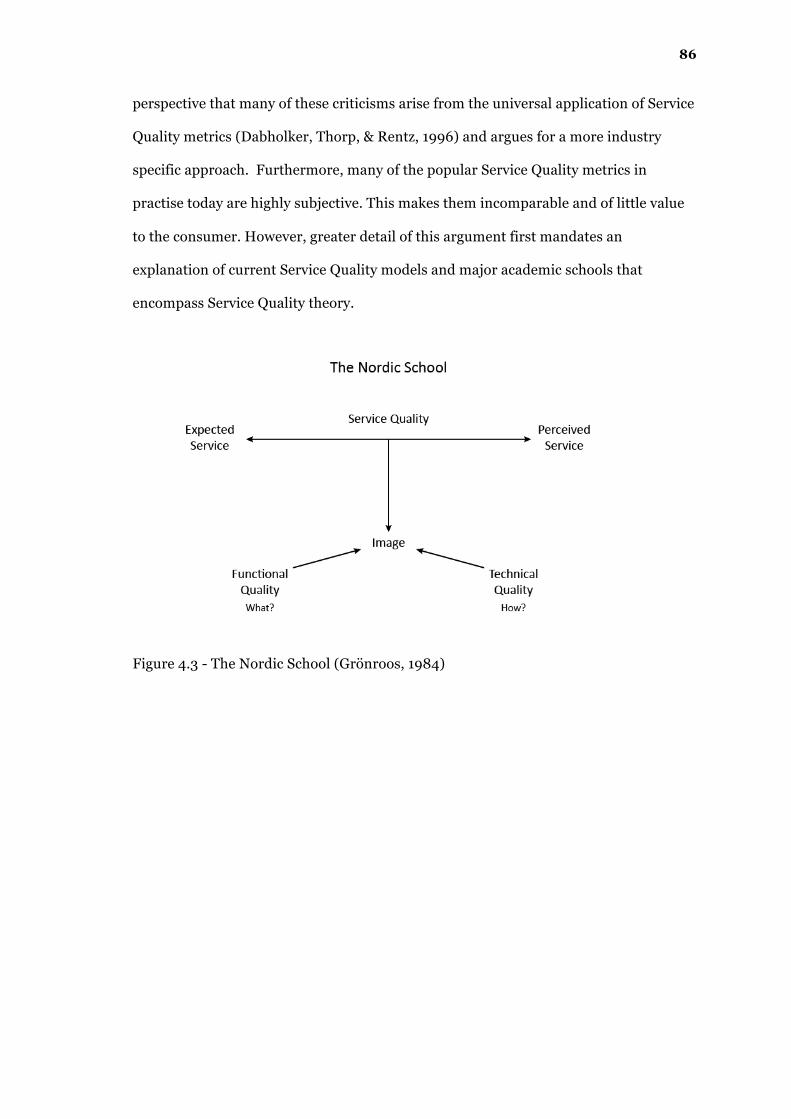
86
perspective that many of these criticisms arise from the universal application of Service
Quality metrics (Dabholker, Thorp, & Rentz, 1996) and argues for a more industry
specific approach. Furthermore, many of the popular Service Quality metrics in
practise today are highly subjective. This makes them incomparable and of little value
to the consumer. However, greater detail of this argument first mandates an
explanation of current Service Quality models and major academic schools that
encompass Service Quality theory.
Figure 4.3 - The Nordic School (Grönroos, 1984)
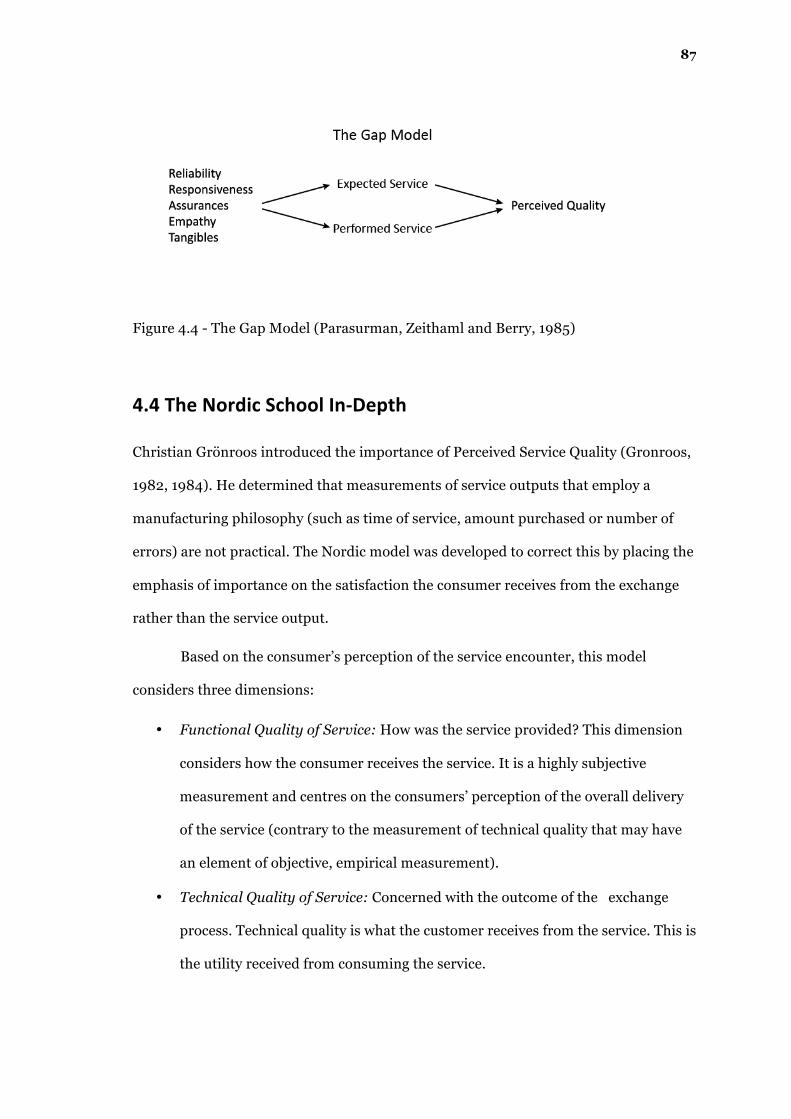
87
Figure 4.4 - The Gap Model (Parasurman, Zeithaml and Berry, 1985)
4.4 The Nordic School In-‐Depth
Christian Grönroos introduced the importance of Perceived Service Quality (Gronroos,
1982, 1984). He determined that measurements of service outputs that employ a
manufacturing philosophy (such as time of service, amount purchased or number of
errors) are not practical. The Nordic model was developed to correct this by placing the
emphasis of importance on the satisfaction the consumer receives from the exchange
rather than the service output.
Based on the consumer’s perception of the service encounter, this model
considers three dimensions:
• Functional Quality of Service: How was the service provided? This dimension
considers how the consumer receives the service. It is a highly subjective
measurement and centres on the consumers’ perception of the overall delivery
of the service (contrary to the measurement of technical quality that may have
an element of objective, empirical measurement).
• Technical Quality of Service: Concerned with the outcome of the exchange
process. Technical quality is what the customer receives from the service. This is
the utility received from consuming the service.
88
• Image of Service Provider: The customer’s general perception of the service
provider.
Technical Quality is the most straightforward component of Grönroos’ Service
Quality model (Gronroos, 1984). It is strictly a measurement of the service outputs. The
doctor bandages the wounded knee, the mechanic replaces the belt, the airline
transports the passenger to the destination, the attorney completes the lawsuit, or the
tree surgeon removes the dead tree. These are merely outcomes. Technical Quality is
concerned with what is delivered, not how the service is delivered. It is purely objective,
without any qualitative elements. It can be measured in much the same way as
manufacturing outputs: “Was the service delivered to the consumer, yes or no?”
Functional Quality is a much more difficult component to capture. The key
component of Functional Quality is not what the consumer receives from the service,
but how the service is delivered. Grönroos describes functional quality as “the way in
which the technical quality is transferred to [the consumer] functionally” (Gronroos,
1984, p. 39). This comes, in part, from the facets of the service encounter that are not
directly essential for the provision of the service, but those elements that contribute
indirectly to the operation. Accessibility, appearance and attitudes of employees,
cleanliness of the surrounding, and especially employee performance can have a strong
impact on how the consumer perceives the service outcome. Some services may also
have a self-service requirement as part of their operation (such as a buffet restaurant,
equipment rental service or a fuel station). A greater acceptance of this role will
translate into a greater appreciation of the service encounter. Lastly, other consumers
engaging in the same encounter may have an effect on others’ perception of the service
encounter. Crowds, angry customers or long queues are likely to have a negative impact
on the customer's perception of the service. Conversely, other happy customers that
seem to be enjoying the service can have a very positive impact on Service Quality.
89
Before a global measurement of Service Quality can be determined, functional
and technical quality must pass through a common modifier: image. The expectations
of the consumer are greatly influenced by their views of the company. In the service
sector, the only tool available for evaluating a company may be its corporate image.
Corporate image is extremely important to the service provider. It is largely influenced
through such avenues as tradition, ideology, and word of mouth. Marketing activities
such as advertising, pricing and public relations can also have a strong influence on
corporate image (Gronroos, 1984, p. 39).
These three dimensions make up the customers’ perception of Service Quality.
The question then becomes: Does the perception of Service Quality balance the scale
between perceived and expected service? If yes, then acceptable service has been
delivered. If the answer is no, then the perceived level of service delivered does not
meet with the consumers' expectations.
The Nordic School has become the cornerstone of the Service Quality literature.
The concept of Service Quality and the Performance-Minus-Expectations Gap
resonates over 25 years later. This idea was expanded upon by the work of Parasurman,
Zeithaml and Berry; however, they ignore the technical quality side of the argument
and focus solely on functional quality (Parasuraman et al., 1988, 1985). Within the
literature, their work has become known as the “American School.”
4.5 The American School In-‐Depth
The overall view of the Nordic school is that Service Quality is to be viewed in global
terms (Brady & Cronin, 2001). Its cousin, the American School, seeks to characterise
the service encounter itself. It contains some of the most popular literature in modern
marketing and is where most of the debate over Service Quality resides.
90
4.5.1 SERVQUAL
Where the Nordic School views the factors of Service Quality as components of the
overall model, the American School sees them as antecedents of customer satisfaction
(Dabholkar et al., 2000). Therefore, customers evaluate the quality of a service
experience by weighing their perceptions with their expectations. When perceptions
meet or exceed expectations, customer satisfaction has occurred. This puts Service
Quality in a very important place in the satisfaction equation. This idea led Berry,
Parasurman and Zeithaml to attempt to identify the overall components of Service
Quality (Parasuraman et al., 1994). Following a series of focus groups conducted with
corporate executives of large service firms, they identified ten determinants of Service
Quality: Reliability, Responsiveness, Competence, Access, Courtesy, Communication,
Credibility, Security, Understanding the Customer, and Tangibles13. These ten (which
would later be reduced to five) would form the groundwork for modern Service Quality
theory and become incorporated into a multitude of useful models.
In 1985, Parasurman, Zeithaml and Berry developed the famous Service Quality
model based on Gap analysis (Parasuraman et al., 1985). This research identified five
gaps in the relationship between customer and service provider. These gaps were:
• Gap 1: The difference between consumers’ expectations and manager's
perceptions of those expectations (misunderstanding consumers' expectations).
• Gap 2: The Difference between management's perceptions of customer’s
perceptions and service specifications (Improper service standards).
• Gap 3: The difference between Service Quality specifications and the service
actually delivered (the service/performance gap).
13 However, the SERVQUAL literature is somewhat unspecific as to exactly what
these dimensions are measuring. Parasurman, Zeithaml and Berry (1988) referred to it as “... similar in many ways to an attitude” (p.15). This ambiguity has remained unresolved within the SERVQUAL camp.
91
• Gap 4: The difference between service delivery and the communications to
consumers about the service delivery (whether promises match delivery).
• Gap 5: The difference between consumers' expectations and perceptions of the
service (this gap depends on the magnitude of the other four).
This research provided the groundwork for much of modern Service Quality
theory. It illustrates the applicability of the disconfirmation paradigm and the use of
difference scores in determining levels of Service Quality. Much of their further work
would focus on Gap 5, the Performance-Minus-Expectations Gap. Following this was
the construction of a reliable metric that could be used by academics and industry
professionals. The resultant model was SERVQUAL (Parasuraman et al., 1988;
Parasuraman, Zeithaml, & Berry, 1994). It reduced the interaction between consumer
and provider into five dimensional terms of:
• Reliability: The ability to perform the promised service dependably and
accurately.
• Assurance: The knowledge and courtesy of the employed and their ability to
convey trust and confidence.
• Tangibles14: The appearance of physical facilities, equipment, personnel and
communication materials.
• Empathy: The provider’s ability to care for the customer and provide an
individualised service.
• Responsiveness: The willingness to help customers and provide prompt service.
14 This term is somewhat confusing. Zeithaml and Bitner (2003, p.20), themselves, define Intangibility as one of the key characteristics of services. However, SERVQUAL states that Tangibles are an important part of Perceived Quality. In the SERVQUAL context, “Tangibles” refers to elements affecting the service delivery, not to the service itself. It would be more useful to name this dimension of SERVQUAL “Materials” or “Substantials” to avoid confusion.
92
SERVQUAL remains the most popular Service Quality measurement among
practitioners (Asubonteng et al., 1996; Cronin, 2003; Dawson et al., 2008). This is
largely due to its ease of adaptability and high predictive validity (Carrillat et al., 2007).
The instrument consists of a 22-item scale that captures the consumer's perceptions of
either perceived or expected Service Quality. Quality is then defined as something that
exists within the gap between perceived and expected service. Some of SERVQUAL’s
initial attractiveness comes from its balance (though this is to be later contested). The
instrument uses the 22-item scale twice. Once to capture respondents’ perceptions of
the service encounter, and again to measure expectations. A difference score can then
be calculated (by subtracting perceptions from expectations) that is reflexive of
perceived Service Quality.
Following some criticism (Cronin & Taylor, 1994; Cronin & Taylor, 1992),
development of SERVQUAL went through several variants. The initial study involved a
97 item instrument submitted by a research firm in a large shopping mall in the
Southwest of the United States (Berry et al., 1985). The survey consisted of two
separate parts: the first part included 97 items pertaining to expectations. The second
consisted of 97 items pertaining to perceptions. The first part gave an example service
category and asked consumers to rate the level of performance they would expect from
a service provider within the given category. These were spread across five industries:
appliance repair and maintenance, retail banking, long-distance telephone, securities
brokerage, and credit cards. The second part of the survey allowed consumers to
consider a firm of their own choosing (ideally one that would be most familiar).
This initial scale possessed high reliability; however, proved to be somewhat
cumbersome. This led Parasurman, Zeithaml and Berry (Parasuraman et al., 1985) to
undertake several item purification stages. The first stage reduced the 97 item scale
down to 34. The second compacted the instrument to 22 items. This round of
purification revealed that the content of the final 22 items had negated some of the
original ten dimensions. This left Parasurman, Zeithaml and Berry (Berry et al., 1988;
93
Parasuraman et al., 1985) with the five SERVQUAL dimensions that are still in use
today: Tangibles, Reliability, Responsiveness, Assurance and Empathy.
SERVQUAL received further refinement in 1991, when the research compared
customer assessments across three service industries: retail banking, insurance, and
telephone repair (with the exception of retail banking, these service were different from
the originally studied services). A nationally known company represented each
industry. A survey was mailed to between 1,800 and 1,900 randomly chosen customers
of each company. The survey yielded response rates from 17 to 25%. This gave a good
foundation from which to re-examine SERVQUAL’s reliability and validity
(Parasuraman, Berry, & Zeithaml, 1991).
The resultant SERVQUAL still contained the 44 items. However, several of
these items had been reworded to remove possible bias. Some of the items that had
unusually high statistical means were found to contain non-normative expressions, and
were found to contribute to bias largely through respondent confusion. For example,
the phrase “Telephone companies should [italics mine] keep their records accurately,”
was reworded as: “Excellent telephone companies will insist on error free records.” In
total six of the 22 items were found to contain negative wording, all of which were
found in the Responsiveness and Empathy dimensions (Parasuraman, Berry, et al.,
1991, p. 42). Re-wording of these phrases completed SERVQUAL’s evolution and left
researchers and practitioners with the instrument that is still in use 20 years later.
4.5.2 Criticisms of SERVQUAL
Despite its popularity, many facets of SERVQUAL have experienced on-going criticism.
Critique has been made concerning almost every facet of the SERVQUAL scale. These
have been widespread and began almost as soon as SERVQUAL was published
(Babakus & Boller, 1992; Buttle, 1996; Carman, 1990; Cronin & Taylor, 1992). The
strongest of these criticisms are focused on the use of difference scores, dimensionality,
94
predictive validity, and the length of the survey (Babakus & Boller, 1992; Carman,
1990; Cronin & Taylor, 1992; Jain & Gupta, 2004; Teas, 1993).
The first of such objections centres on Parasurman, Zeithaml and Berry’s
disinformation paradigm (Parasuraman et al., 1988, 1985). Many of SERVQUAL's
opponents claim that difference scores do not offer an accurate picture of Service
Quality. Teas identifies that different combinations of Perceived values and Expected
values could each yield the same difference score (for example, P=3, E=4 yields a score
of -1 as well does P=2, E=5) (Teas, 1993). This has led many researchers to remove the
expectation component of the disconfirmation paradigm and only focus on customer
perceptions (Babakus & Boller, 1992; Cronin & Taylor, 1994 , 1992). Parasurman,
Zeithaml and Berry defend the use of expectations; however, their supporting research
is based wholly on a series of qualitative focus groups while the opposition tends to
focus on more quantitative methodologies (Parasuraman, Berry, et al., 1991, 1988,
1985).
One major objection to SERVQUAL lies with its theoretical definition.
Parasurman, Zeithaml and Berry seem to avoid the issue of clearly defining constructs
of Service Quality terminology, in particular the definition of Customer Satisfaction
(Parasuraman, Berry, et al., 1991; Parasuraman et al., 1988, 1985; Parasuraman,
Zeithaml, et al., 1991). Cronin and Taylor claim that Customer Satisfaction should be
firmly defined as an attitude. They state the “SERVQUAL scale is measuring neither
Service Quality nor Customer Satisfaction” (Cronin and Taylor, 1994, p.126).
Furthermore, there is a complaint that Parasurman, Zeithaml and Berry do not
take into account research from other scientific disciplines such as Economics,
Statistics and Psychology (Buttle, 1996). Andersson claims “Parasurman, Zeithaml and
Berry abandon the principle of scientific continuity and deduction” (Andersson, 1992,
p. 41). However, Parasurman, Zeithaml and Berry defended their position claiming that
95
their theory is “firmly rooted within the previous Service Quality research” without
offering an in-depth explanation (Parasuraman et al., 1994, p. 112).
There has also been some criticism of the statistical techniques used in
evaluating SERVQUAL. The SERVQUAL scale measures responses on a seven point,
Likert-type scale. Likert scales collect ordinal data. This lends itself to lower-order
descriptive statistics and cross tabulations. However, in both their 1985 and 1988
articles, Parasurman, Zeithaml and Berry use factor analysis. This is a high order
statistical process and is best suited for interval/ratio level data (Stevens, 2012). This
may have confounded some of Parasurman, Zeithaml and Berry’s results and
contributed to higher than normal values of reliability and validity (Buttle, 1996)15.
There has been further criticism that SERVQUAL adopts a process orientation
rather than an outcome based perspective (Cronin & Taylor, 1992; Richard & Allaway,
1993). This means that the SERVQUAL items are oriented around the service process
instead of focusing on the outcomes. In an attempt to correct this discrepancy, Richard
and Allaway used a modified SERVQUAL scale to examine Service Quality within the
Domino’s Pizza chain (Richard & Allaway, 1993). The original 22 items were
augmented with an additional six items that attempted to capture outcomes. The
original 22 items only accounted for 45% of the variance in consumer choice. Adding
the six outcome oriented items brought that up to 71.5% (p<= 0.001). This resulted in
increased validity of the scale (Richard & Allaway, 1993).
Finally, the most pervasive criticism of SERVQUAL concerns its dimensionality
(Babakus & Boller, 1992; Brady & Cronin, 2001; Buttle, 1996; Carman, 1990; Gagliano
& Hathcote, 1994). These criticisms typically concentrate on the specific number of
dimensions that the scale employs. To date there has been no conclusive argument as
15 While Buttle (1996) does make a clear argument against using factor analysis, this technique often used to evaluate ordinal data in the Social Sciences and has been used to evaluate other Service Quality scales (for example: Brady and Cronin, 2001; Cronin and Taylor, 1992).
96
to the precise number of dimensions appropriate for a global measurement of Service
Quality. What has appeared is an apparent need to modify the SERVQUAL dimensions
to fit specific industries (Brady & Cronin, 2001; Buttle, 1996; Carman, 1990; Gagliano
& Hathcote, 1994; Richard & Allaway, 1993).
In spite of this criticism, SERVQUAL retains its dominance as the preferred
metric for management measuring Service Quality, most likely due to its ease of
comprehension by the practical community (Dawson et al., 2008). Management seems
to be attracted to concepts such as the SERVQUAL difference score for their ease of
calculation and understanding (Ahmad, Awan, Raouf, & Sparks, 2009). While the
scientific community continues to criticise its construction and implementation,
management seems to take a “good enough” approach to the implementation of such
metrics (Asubonteng et al., 1996).
4.5.3 SERVPERF
While SERVQUAL seeks to conceptualise quality as a relationship between perceptions
and expectations, its cousin SERVPERF takes a purely performance based approach
(Cronin & Taylor, 1992). The rationale comes from the premise that satisfaction is an
antecedent of perceived Service Quality (Bitner, 1990; Bolton & Drew, 1991).
SERVPERF sought to clarify some issues cover the definition of satisfaction. Cronin
and Taylor maintain that the previous work by Parasurman, Zeithaml and Berry fails to
clearly establish satisfaction as an attitude (Cronin & Taylor, 1994). Doing so might
have invalidated the disconfirmation paradigm, based on research within the attitude
and satisfaction literature (Oliver, 1980, 2009). Oliver illustrates that Service Quality
and Customer Satisfaction are distinct terms (Oliver, 1980, 2009). Satisfaction is an
attitude resulting from repeated interactions with a service firm. Thus, satisfaction can
become a component of future Service Quality judgements by the consumer (Oliver,
2009).
97
Cronin and Taylor simplify the measurement of Service Quality by examining
only the performance side of the equation (Cronin & Taylor, 1992). They found
evidence to support their theory in the work of Churchill and Surprenant and decided
that performance alone was enough to determine the consumer’s perception of Service
Quality (Churchill & Surprenant, 1982). Capturing consumer expectations was
unnecessary and cumbersome.
When examining the dimensionality of SERVQUAL, Cronin and Taylor felt that
the five SERVQUAL dimensions were inadequate for a performance only measurement
and needed to be redefined (Cronin & Taylor, 1992). Using confirmatory factor analysis
(LISREL VII) they determined that SERVQUAL did not have consistent factor loading
patterns across the five dimensions (Cronin & Taylor, 1992). This led them to believe
that SERVQUAL was lacking in construct validity (the extent to which the various
constructs of the model support the hypothesis) and felt that a performance only
measurement would help alleviate many of the problems. This led directly to the
development of the SERVPERF scale.
The SERVPERF instrument simplifies the overall number of items required to
measure Service Quality from 44 to 22 (Cronin & Taylor, 1992). This puts SERVPERF
ahead in terms of overall efficiency (Brady, Cronin & Brand, 2002; Cronin & Taylor,
1992). Additionally, by only measuring performance SERVPERF allows for
comparability across firms within an industry (Brady et al., 2002) and research has
demonstrated that the SERVPERF scale lends itself to a much more global application
than SERVQUAL (Babakus & Boller, 1992; Buttle, 1996; Carrillat et al., 2007; Jain &
Gupta, 2004).
SERVPERF contributed to the Service Quality literature by offering a more
streamlined measurement of Service Quality and strengthening of the link between
Service Quality, Customer Satisfaction, and Consumer Purchase Intentions (Brady et
al., 2002; Cronin & Taylor, 1992). The theoretical basis for this construct had been
98
emerging within the Service Quality literature, but was yet unresolved. Parasurman,
Zeithaml and Berry had conceptualised Service Quality as an antecedent of satisfaction,
while Bitner and Bolton and Drew viewed satisfaction as an outcome of Service Quality
(Bitner, 1990; Bolton & Drew, 1991; Parasuraman, Berry, et al., 1991; Parasuraman et
al., 1988). It was Cronin and Taylor who first applied the theory to empirical science
and they discovered that Service Quality was a strong driver of Customer Satisfaction,
and satisfaction greatly affected purchase intentions; however, there was no direct
relationship between Service Quality and purchase intentions (Cronin & Taylor, 1992).
If it were satisfaction that was the sole driver of purchase intentions, and not Service
Quality, this meant that Service Quality must be an antecedent of satisfaction (Cronin
& Taylor, 1992). Therefore, a performance-only measurement of Service Quality should
be a better predictor of Customer Satisfaction than the Gap Model (Anderson &
Sullivan, 1993; Brady et al., 2002).
The superiority of performance-only metrics is recognised by the academic
community (Babakus & Boller, 1992; Boulding, Kalra, Staelin, & Zeithaml, 1993; Brady
et al., 2002). Even Valarie Zeithaml recognised the empirical superiority of a
performance only measurement of Service Quality over that of the gap theory
(Boulding et al., 1993). Along with being a much more efficient instrument, SERVPERF
has been found to have greater convergent and discriminant validity than SERVQUAL
(Jain & Gupta, 2004). Without the need to calculate consumer’s expectations,
SERVPERF also allows managers to create a comparative study of Service Quality with
a firm's competitors (Cronin & Taylor, 1994).
The advantages of a performance-only measurement of Service Quality does not
necessitate disposal of SERVQUAL as a practical instrument (Carrillat et al., 2007; Jain
& Gupta, 2004). SERVPERF is simply another choice managers have when trying to
evaluate service outputs. However, while SERVQUAL may need extensive modification
in order to fit the intended context SERVPERF may need little or no adaptation
(Carrillat et al., 2007). This, along with being comparable and less cumbersome, should
99
make SERVPERF more attractive to some managers. However, despite these
advantages SERVQUAL still appears to be the practical instrument of choice (Dawson
et al., 2008).
4.5.4 SERVPEX
In early 2001, Robledo attempted to resolve the issue of the best method of measuring
Service Quality (Robledo, 2001). He affirmed the five factor model of Parasurman,
Zeithaml and Berry; however, he wanted to investigate the relationship between five
various models of Service Quality: SERVQUAL, Weighted SERVQUAL, SERVPERF,
Weighted SERVPERF and his own model, SERVPEX. Robledo (2001) thought, unlike
Cronin and Taylor (1992), that expectations were an important factor in examining
Service Quality. Therefore, the Gap model was relevant and Robledo’s contribution was
found in the measurement of this gap.
Parasurman, Zeithaml and Berry (1985) measured the disconfirmation
paradigm by taking the difference between two 22 item instruments. Robledo took the
novel approach of measuring performance and expectations at the same time (Robledo,
2001). This resulted in the scale he refers to as SERVPEX. This scale attempts to
measure performance and expectations simultaneously utilising a similar scale to
SERVPERF and SERVQUAL. The key difference with SERVPEX is the points of the
scale range from “Much worse than expected” to “Much better than expected”, whereas
in the other instruments they range from “Strongly Agree” to “Strongly Disagree.”
Robledo feels this is sufficient to account for the inclusion of both performance and
expectation measurements within the same question. Furthermore, he found that this
scale is statistically superior to existing measurements of Service Quality specifically
when examining the airline industry.
Robledo did not intend for SERVPEX to be an industry specific instrument, but
rather a general instrument (based on the SERVQUAL framework) that could be
modified to fit the airline industry (Robledo, 2001). SERVPEX has also seen no further
100
adoption from academics or practitioners. This may largely be because of the
complexity of measuring two different values within the same item (Seth, Deshmukh, &
Vrat, 2005). Doing so could be likened to measuring both time of day and temperature
with an analogue wristwatch. It may accurately measure time; however, one could only
use it to guess the temperature (presumably by touching the metal to see if is cool or
warm).
4.5.5 Brady and Cronin’s Hierarchical Model (HiQUAL)
In an effort to converge the two major schools of thought, Brady and Cronin developed
a hierarchical model of Service Quality (hereafter referred to as HiQUAL) (Brady &
Cronin, 2001). HiQUAL incorporates elements from the Nordic and American Schools
and, like SERVPERF, it is a performance-only measurement of Service Quality. The
difference is in its factor structure and the number of dimensions used to measure
Service Quality. Brady and Cronin propose that Service Quality contains three primary
dimensions: Interaction Quality, Physical Environment, and Outcome Quality (instead
of the five used in most other Service Quality metrics). This is complementary to Rust
and Oliver’s model containing service product (technical quality), service delivery
(functional quality) and the service environment which was based on Grönroos’ model
(Gronroos, 1984; Rust & Oliver, 1994). Brady and Cronin felt that the Nordic models,
as well as the five dimensional concepts in SERVQUAL, were both relevant constructs
of Service Quality (Brady & Cronin, 2001). They attempted to combine the two schools
into a hierarchical model (Figure 4.5). This model is based on Rust and Oliver’s view
that Service Quality is a function of customer/employee interactions, or the service
environment and the outcome (Bitner, 1990; Christian Grönroos, 1982).
Brady and Cronin agreed with some of the five-factor structure of Parasurman,
Zeithaml and Berry’s SERVQUAL model (Brady & Cronin, 2001). However, they felt
that SERVQUAL was not descriptive as to what elements of Service Quality should be
reliable, empathetic, tangible or assured. Brady and Cronin use three of SERVQUAL’s
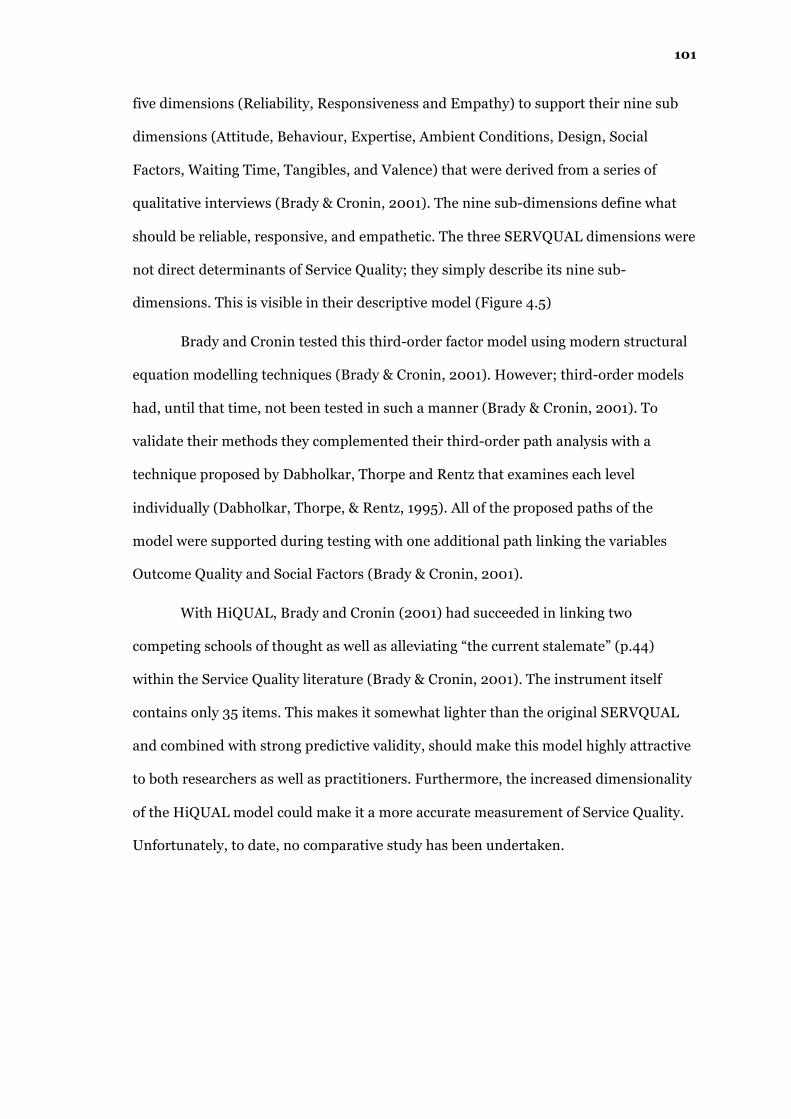
101
five dimensions (Reliability, Responsiveness and Empathy) to support their nine sub
dimensions (Attitude, Behaviour, Expertise, Ambient Conditions, Design, Social
Factors, Waiting Time, Tangibles, and Valence) that were derived from a series of
qualitative interviews (Brady & Cronin, 2001). The nine sub-dimensions define what
should be reliable, responsive, and empathetic. The three SERVQUAL dimensions were
not direct determinants of Service Quality; they simply describe its nine sub-
dimensions. This is visible in their descriptive model (Figure 4.5)
Brady and Cronin tested this third-order factor model using modern structural
equation modelling techniques (Brady & Cronin, 2001). However; third-order models
had, until that time, not been tested in such a manner (Brady & Cronin, 2001). To
validate their methods they complemented their third-order path analysis with a
technique proposed by Dabholkar, Thorpe and Rentz that examines each level
individually (Dabholkar, Thorpe, & Rentz, 1995). All of the proposed paths of the
model were supported during testing with one additional path linking the variables
Outcome Quality and Social Factors (Brady & Cronin, 2001).
With HiQUAL, Brady and Cronin (2001) had succeeded in linking two
competing schools of thought as well as alleviating “the current stalemate” (p.44)
within the Service Quality literature (Brady & Cronin, 2001). The instrument itself
contains only 35 items. This makes it somewhat lighter than the original SERVQUAL
and combined with strong predictive validity, should make this model highly attractive
to both researchers as well as practitioners. Furthermore, the increased dimensionality
of the HiQUAL model could make it a more accurate measurement of Service Quality.
Unfortunately, to date, no comparative study has been undertaken.
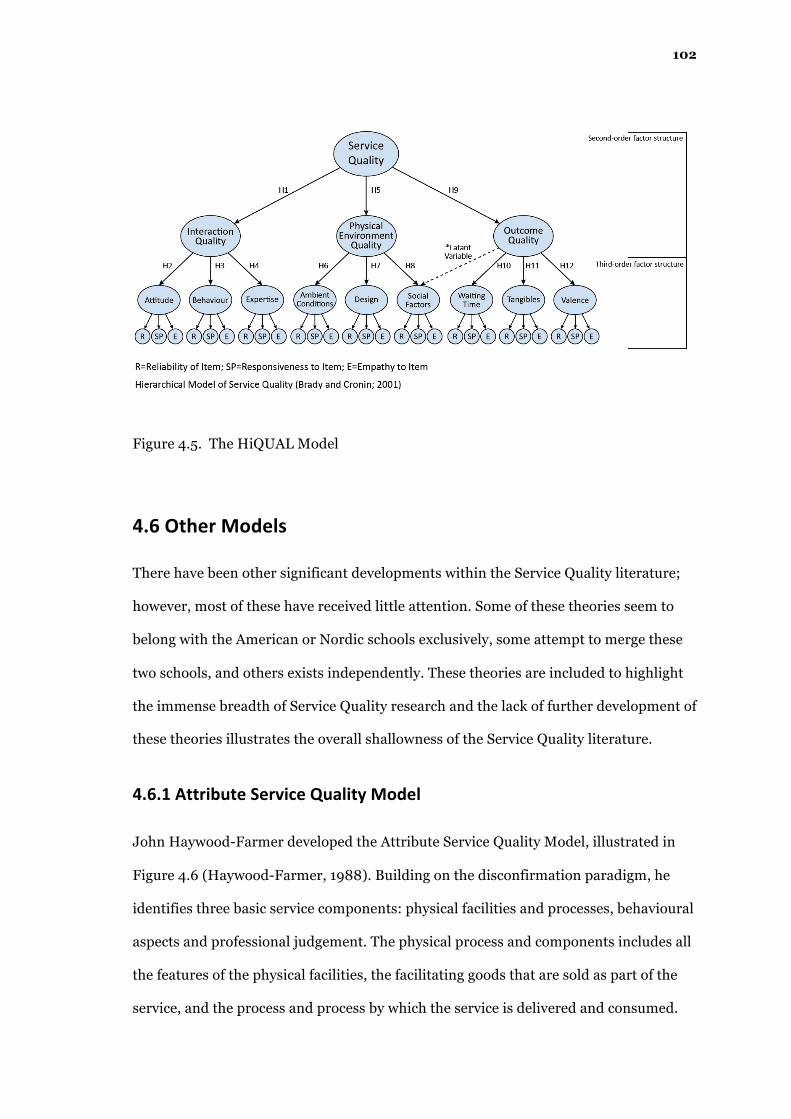
102
Figure 4.5. The HiQUAL Model
4.6 Other Models
There have been other significant developments within the Service Quality literature;
however, most of these have received little attention. Some of these theories seem to
belong with the American or Nordic schools exclusively, some attempt to merge these
two schools, and others exists independently. These theories are included to highlight
the immense breadth of Service Quality research and the lack of further development of
these theories illustrates the overall shallowness of the Service Quality literature.
4.6.1 Attribute Service Quality Model
John Haywood-Farmer developed the Attribute Service Quality Model, illustrated in
Figure 4.6 (Haywood-Farmer, 1988). Building on the disconfirmation paradigm, he
identifies three basic service components: physical facilities and processes, behavioural
aspects and professional judgement. The physical process and components includes all
the features of the physical facilities, the facilitating goods that are sold as part of the
service, and the process and process by which the service is delivered and consumed.
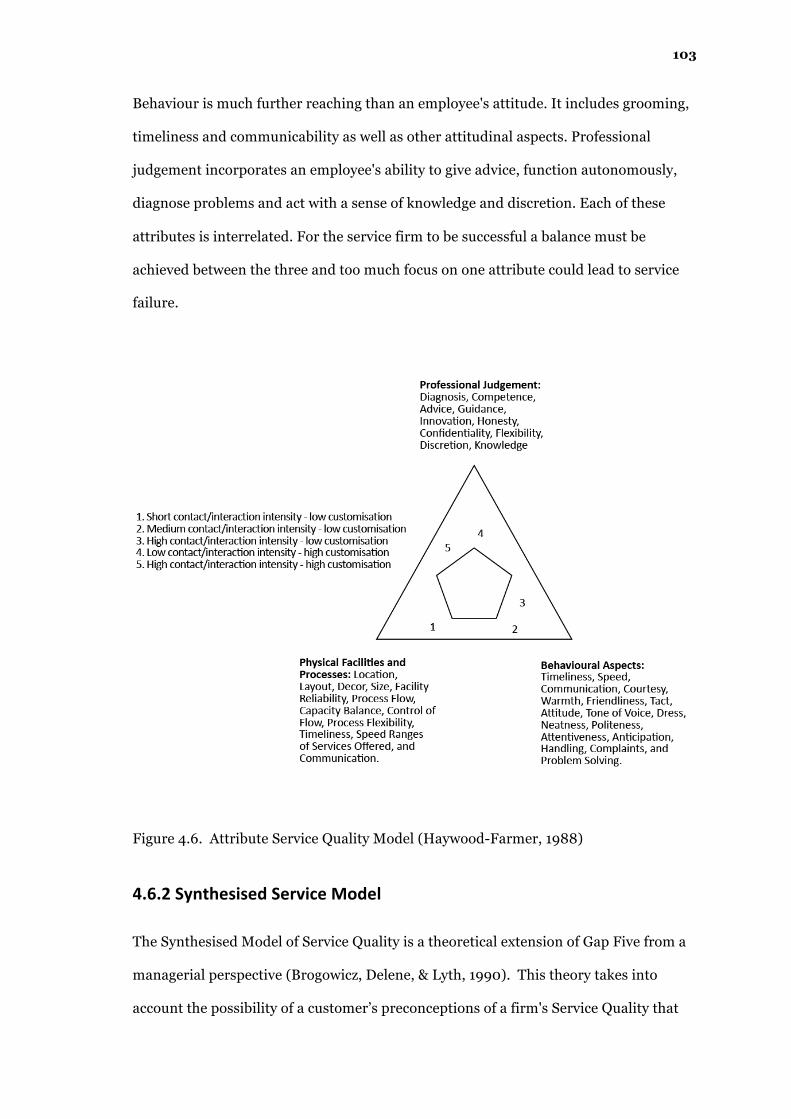
103
Behaviour is much further reaching than an employee's attitude. It includes grooming,
timeliness and communicability as well as other attitudinal aspects. Professional
judgement incorporates an employee's ability to give advice, function autonomously,
diagnose problems and act with a sense of knowledge and discretion. Each of these
attributes is interrelated. For the service firm to be successful a balance must be
achieved between the three and too much focus on one attribute could lead to service
failure.
Figure 4.6. Attribute Service Quality Model (Haywood-Farmer, 1988)
4.6.2 Synthesised Service Model
The Synthesised Model of Service Quality is a theoretical extension of Gap Five from a
managerial perspective (Brogowicz, Delene, & Lyth, 1990). This theory takes into
account the possibility of a customer’s preconceptions of a firm's Service Quality that
104
are learned through word of mouth, advertising or marketing communications. This
model identified three overall factors affecting Service Quality from a managerial
perspective: company image, external influences and traditional marketing practises.
In an apparent attempt to merge the Nordic and American schools, the Synthesised
Model of Service Quality determines that each of these factors can influence
expectations of a firm's Technical or Functional Quality.
4.6.3 Ideal Value Model of Service Quality
The Ideal Value Model of Service Quality, depicted in Figure 4.7, takes a more
psychological approach to modelling Service Quality (Mattsson, 1992). This theory
attempts to further examine the expectations side of the disconfirmation paradigm.
Most of the American School sees expectations as a belief toward having desired
attributes as a standard of evaluation; however Mattsson felt this was much more
complex and felt that more attention needed to be given to the cognitive processes that
form and change consumers’ service concepts (Mattsson, 1992).
Figure 4.7. The Ideal Value Model of Service Quality
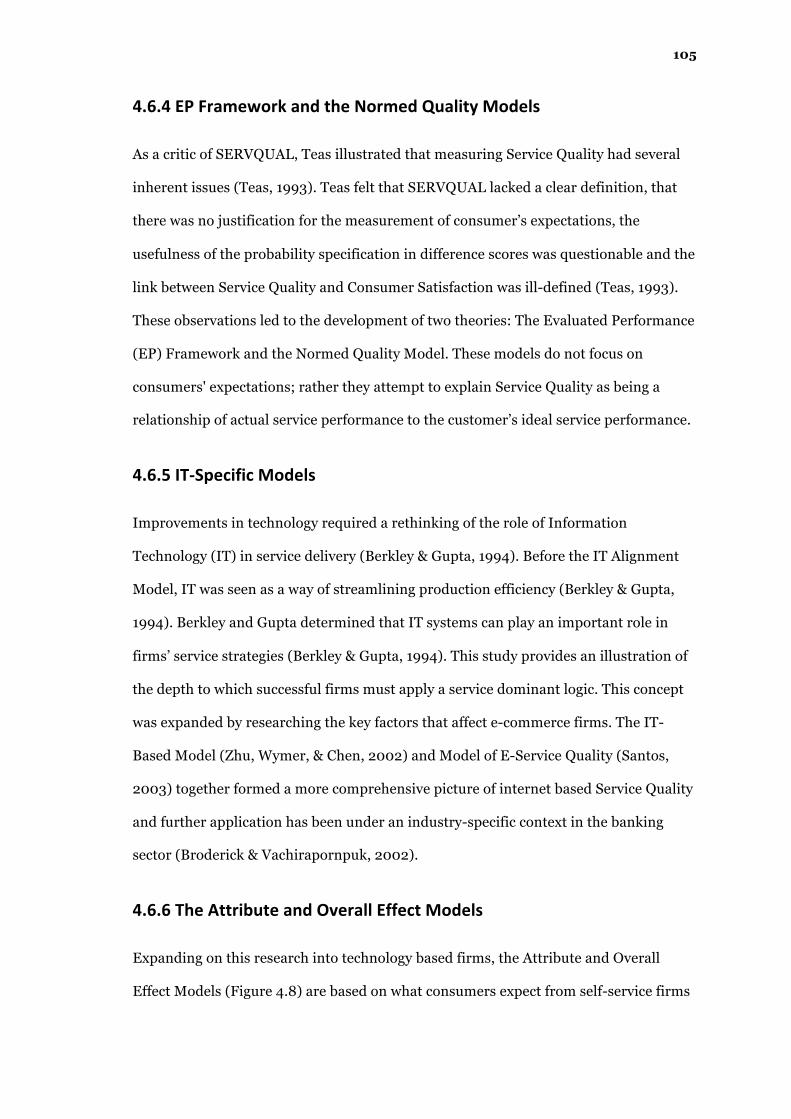
105
4.6.4 EP Framework and the Normed Quality Models
As a critic of SERVQUAL, Teas illustrated that measuring Service Quality had several
inherent issues (Teas, 1993). Teas felt that SERVQUAL lacked a clear definition, that
there was no justification for the measurement of consumer’s expectations, the
usefulness of the probability specification in difference scores was questionable and the
link between Service Quality and Consumer Satisfaction was ill-defined (Teas, 1993).
These observations led to the development of two theories: The Evaluated Performance
(EP) Framework and the Normed Quality Model. These models do not focus on
consumers' expectations; rather they attempt to explain Service Quality as being a
relationship of actual service performance to the customer’s ideal service performance.
4.6.5 IT-‐Specific Models
Improvements in technology required a rethinking of the role of Information
Technology (IT) in service delivery (Berkley & Gupta, 1994). Before the IT Alignment
Model, IT was seen as a way of streamlining production efficiency (Berkley & Gupta,
1994). Berkley and Gupta determined that IT systems can play an important role in
firms’ service strategies (Berkley & Gupta, 1994). This study provides an illustration of
the depth to which successful firms must apply a service dominant logic. This concept
was expanded by researching the key factors that affect e-commerce firms. The IT-
Based Model (Zhu, Wymer, & Chen, 2002) and Model of E-Service Quality (Santos,
2003) together formed a more comprehensive picture of internet based Service Quality
and further application has been under an industry-specific context in the banking
sector (Broderick & Vachirapornpuk, 2002).
4.6.6 The Attribute and Overall Effect Models
Expanding on this research into technology based firms, the Attribute and Overall
Effect Models (Figure 4.8) are based on what consumers expect from self-service firms
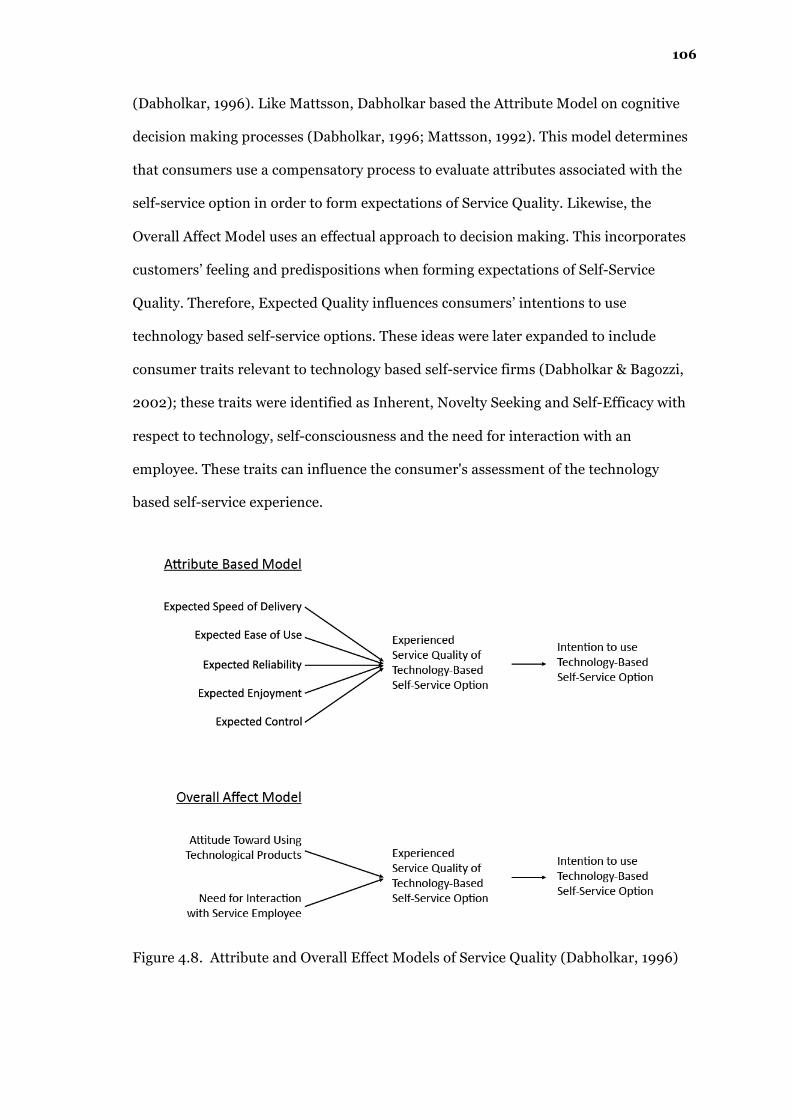
106
(Dabholkar, 1996). Like Mattsson, Dabholkar based the Attribute Model on cognitive
decision making processes (Dabholkar, 1996; Mattsson, 1992). This model determines
that consumers use a compensatory process to evaluate attributes associated with the
self-service option in order to form expectations of Service Quality. Likewise, the
Overall Affect Model uses an effectual approach to decision making. This incorporates
customers’ feeling and predispositions when forming expectations of Self-Service
Quality. Therefore, Expected Quality influences consumers’ intentions to use
technology based self-service options. These ideas were later expanded to include
consumer traits relevant to technology based self-service firms (Dabholkar & Bagozzi,
2002); these traits were identified as Inherent, Novelty Seeking and Self-Efficacy with
respect to technology, self-consciousness and the need for interaction with an
employee. These traits can influence the consumer's assessment of the technology
based self-service experience.
Figure 4.8. Attribute and Overall Effect Models of Service Quality (Dabholkar, 1996)
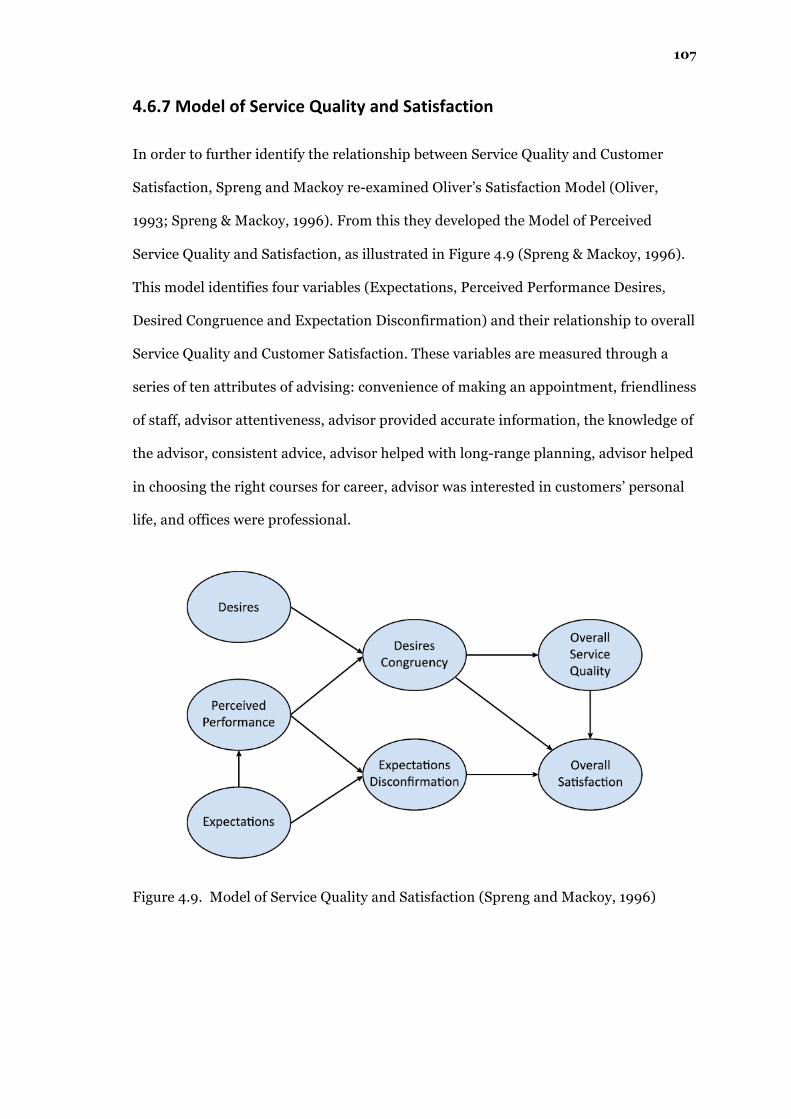
107
4.6.7 Model of Service Quality and Satisfaction
In order to further identify the relationship between Service Quality and Customer
Satisfaction, Spreng and Mackoy re-examined Oliver’s Satisfaction Model (Oliver,
1993; Spreng & Mackoy, 1996). From this they developed the Model of Perceived
Service Quality and Satisfaction, as illustrated in Figure 4.9 (Spreng & Mackoy, 1996).
This model identifies four variables (Expectations, Perceived Performance Desires,
Desired Congruence and Expectation Disconfirmation) and their relationship to overall
Service Quality and Customer Satisfaction. These variables are measured through a
series of ten attributes of advising: convenience of making an appointment, friendliness
of staff, advisor attentiveness, advisor provided accurate information, the knowledge of
the advisor, consistent advice, advisor helped with long-range planning, advisor helped
in choosing the right courses for career, advisor was interested in customers’ personal
life, and offices were professional.
Figure 4.9. Model of Service Quality and Satisfaction (Spreng and Mackoy, 1996)
108
4.6.8 P-‐C-‐P Model of Service Attributes
While examining service outputs, Philip and Hazlett developed the P-C-P Model of
Service Attributes depicted in Figure 4.10 (Philip & Hazlett, 1997). They determined
that the popular SERVQUAL scale did not take into account service deliverables, and
sought to develop a model with these service outputs at its core. Their model is the first
Service Quality model to have a hierarchical structure. This consists of three Service
Quality attributes represented in ascending order: Pivotal Attributes, Core Attributes
and Peripheral Attributes. Pivotal Attributes are the most important of the three and
exerts the greatest influence on satisfaction. These attributes are the outputs of the
service encounter and encompass the very reason the customer decided to approach a
particular organisation. Core Attributes are the people, process and structure with
which the consumer must interact in order to receive the Pivotal Attributes. Finally, the
Peripheral Attributes are the incidental extras or frills designed to “make the whole
experience a delight” (Philip & Hazlett, 1997, p. 280).
Figure 4.10. P-C-P Attribute Model (Phillip and Hazlett, 1997)
109
4.6.9 Retail Service Quality and Perceived Value Models
Expanding on the relationship between Technical and Functional Quality, the Retail
Service Quality and Perceived Value Models examines the role of Value and its
influence on Service Quality and consumer purchase behaviour (Sweeney, Soutar, &
Johnson, 1997). In this model values are expressed as a comparison between
customer's benefits and sacrifices. The Retail Service Quality Model illustrates that
both functional and technical quality influences customers’ value perceptions (along
with product quality and price perceptions). The Perceived Value model demonstrates
that Functional Quality also directly influences consumers' willingness to buy as well as
influencing Technical Quality, which in turn drives product quality perceptions. During
their analysis, Sweeney, Soutar and Johnson actually modified the Perceived Value
model (determining that it was superior to the Retail Service Model) to allow Technical
Quality to directly influence Perceived Value. This led them to conclude that
consumers’ perceptions of Service Quality during the service encounter were more
influential in their willingness to buy that product (Sweeney et al., 1997).
4.6.10 Service Quality, Customer Value and Customer Satisfaction Model
The Service Quality, Customer Value and Customer Satisfaction Model was developed
in an attempt to resolve some of the debate between the relationship of Customer
Satisfaction and Service Quality (Oh, 1999). This holistic model attempted to integrate
the three factors (Service Quality, Customer Satisfaction and Value) by focusing on the
post-purchase process. There was some evidence that Customer Value plays a
significant role in customers’ post-purchase decision making. Furthermore, Customer
Value was shown to be an immediate antecedent to Customer Satisfaction and
consumer repurchase intentions. One of the most interesting items to come from this
model was the overall influence of Perceived Price. The research discovered that
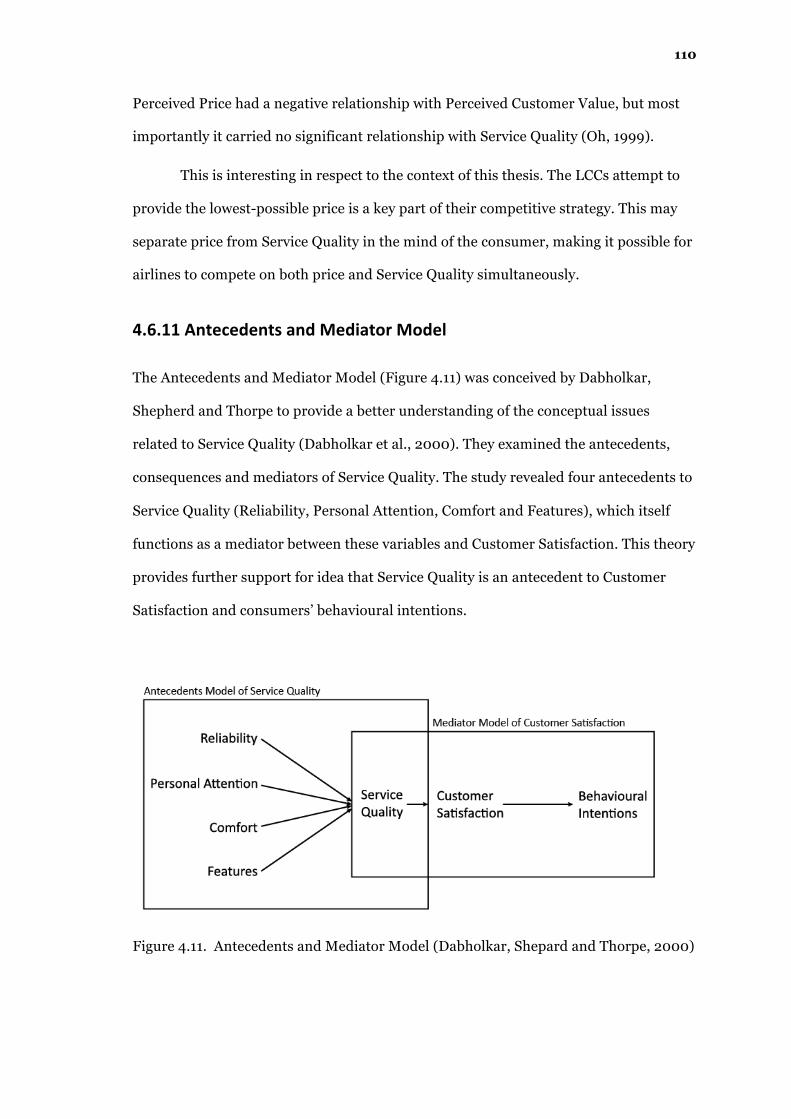
110
Perceived Price had a negative relationship with Perceived Customer Value, but most
importantly it carried no significant relationship with Service Quality (Oh, 1999).
This is interesting in respect to the context of this thesis. The LCCs attempt to
provide the lowest-possible price is a key part of their competitive strategy. This may
separate price from Service Quality in the mind of the consumer, making it possible for
airlines to compete on both price and Service Quality simultaneously.
4.6.11 Antecedents and Mediator Model
The Antecedents and Mediator Model (Figure 4.11) was conceived by Dabholkar,
Shepherd and Thorpe to provide a better understanding of the conceptual issues
related to Service Quality (Dabholkar et al., 2000). They examined the antecedents,
consequences and mediators of Service Quality. The study revealed four antecedents to
Service Quality (Reliability, Personal Attention, Comfort and Features), which itself
functions as a mediator between these variables and Customer Satisfaction. This theory
provides further support for idea that Service Quality is an antecedent to Customer
Satisfaction and consumers’ behavioural intentions.
Figure 4.11. Antecedents and Mediator Model (Dabholkar, Shepard and Thorpe, 2000)
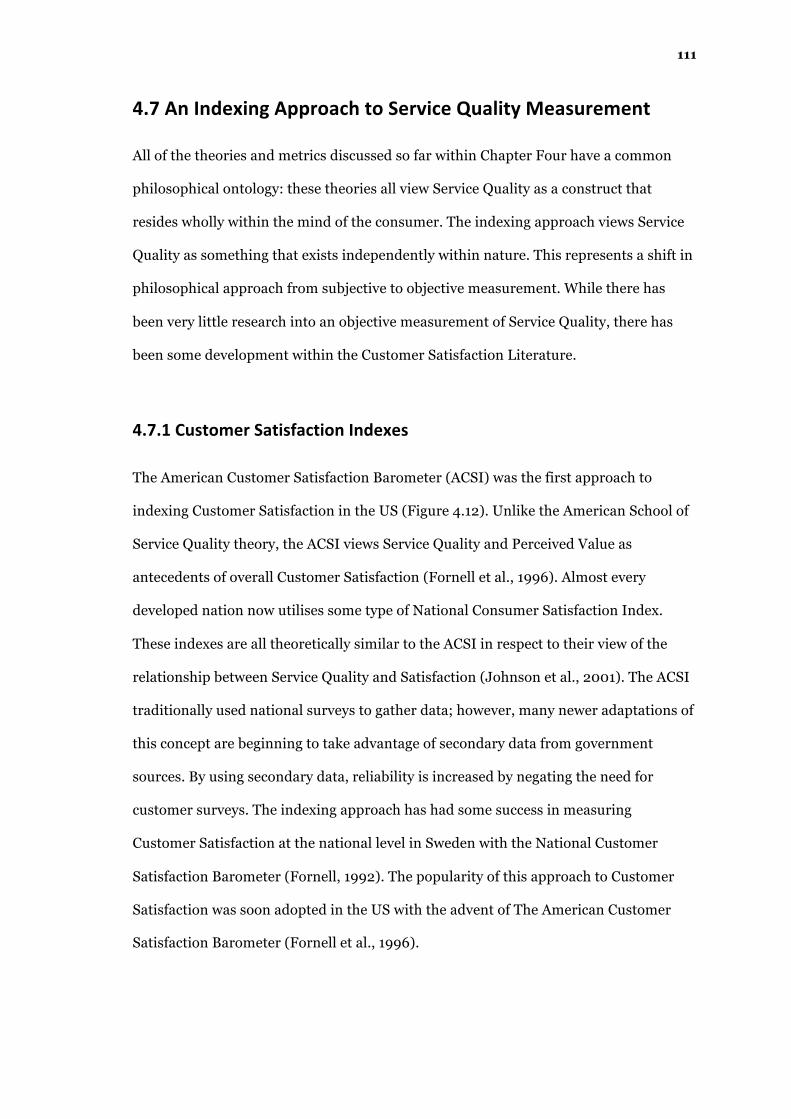
111
4.7 An Indexing Approach to Service Quality Measurement
All of the theories and metrics discussed so far within Chapter Four have a common
philosophical ontology: these theories all view Service Quality as a construct that
resides wholly within the mind of the consumer. The indexing approach views Service
Quality as something that exists independently within nature. This represents a shift in
philosophical approach from subjective to objective measurement. While there has
been very little research into an objective measurement of Service Quality, there has
been some development within the Customer Satisfaction Literature.
4.7.1 Customer Satisfaction Indexes
The American Customer Satisfaction Barometer (ACSI) was the first approach to
indexing Customer Satisfaction in the US (Figure 4.12). Unlike the American School of
Service Quality theory, the ACSI views Service Quality and Perceived Value as
antecedents of overall Customer Satisfaction (Fornell et al., 1996). Almost every
developed nation now utilises some type of National Consumer Satisfaction Index.
These indexes are all theoretically similar to the ACSI in respect to their view of the
relationship between Service Quality and Satisfaction (Johnson et al., 2001). The ACSI
traditionally used national surveys to gather data; however, many newer adaptations of
this concept are beginning to take advantage of secondary data from government
sources. By using secondary data, reliability is increased by negating the need for
customer surveys. The indexing approach has had some success in measuring
Customer Satisfaction at the national level in Sweden with the National Customer
Satisfaction Barometer (Fornell, 1992). The popularity of this approach to Customer
Satisfaction was soon adopted in the US with the advent of The American Customer
Satisfaction Barometer (Fornell et al., 1996).
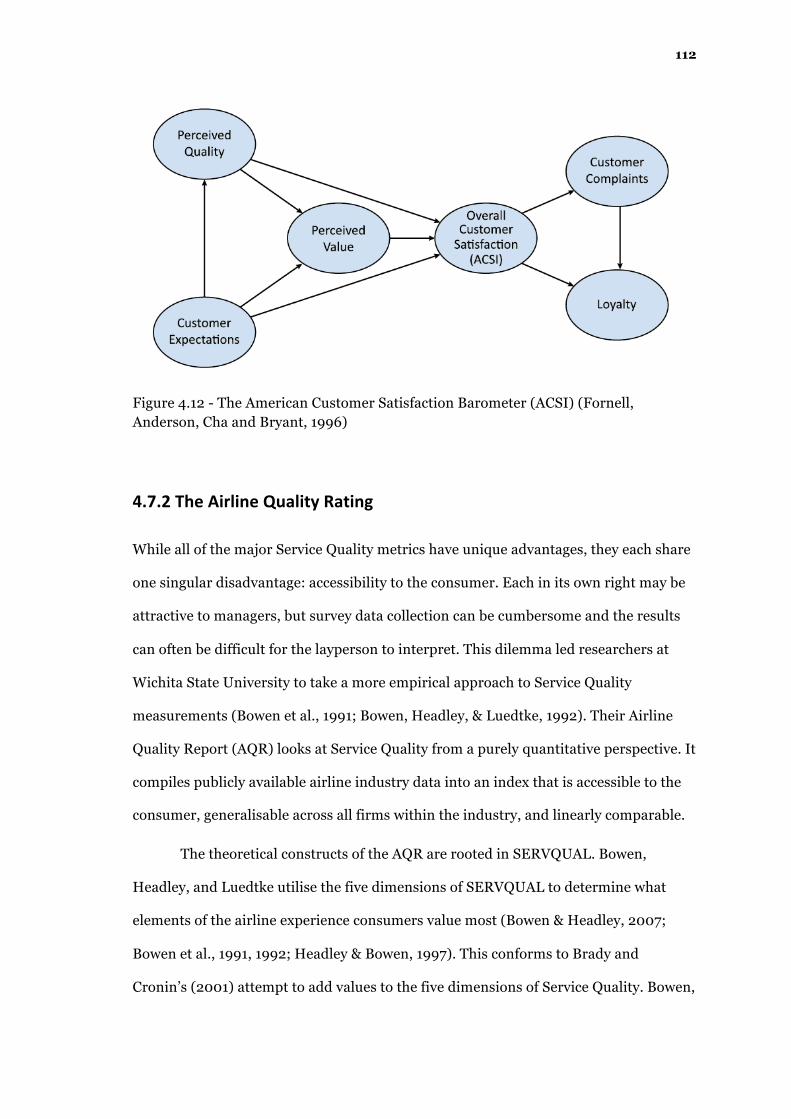
112
Figure 4.12 - The American Customer Satisfaction Barometer (ACSI) (Fornell, Anderson, Cha and Bryant, 1996)
4.7.2 The Airline Quality Rating
While all of the major Service Quality metrics have unique advantages, they each share
one singular disadvantage: accessibility to the consumer. Each in its own right may be
attractive to managers, but survey data collection can be cumbersome and the results
can often be difficult for the layperson to interpret. This dilemma led researchers at
Wichita State University to take a more empirical approach to Service Quality
measurements (Bowen et al., 1991; Bowen, Headley, & Luedtke, 1992). Their Airline
Quality Report (AQR) looks at Service Quality from a purely quantitative perspective. It
compiles publicly available airline industry data into an index that is accessible to the
consumer, generalisable across all firms within the industry, and linearly comparable.
The theoretical constructs of the AQR are rooted in SERVQUAL. Bowen,
Headley, and Luedtke utilise the five dimensions of SERVQUAL to determine what
elements of the airline experience consumers value most (Bowen & Headley, 2007;
Bowen et al., 1991, 1992; Headley & Bowen, 1997). This conforms to Brady and
Cronin’s (2001) attempt to add values to the five dimensions of Service Quality. Bowen,
113
Headley, and Luedtke do this through completely subjective means (Bowen et al., 1991,
1992). After compiling a list of airline industry factors that relate to SERVQUAL’s five
dimensions, they assigned two conditions to each variable. Firstly, data relating to the
variable had to be readily available from government sources. Secondly, the factor had
to be relevant to the consumers’ value of Service Quality. To test the second condition,
65 representatives were interviewed from most of the major airlines, air travel experts,
FAA representatives, academic researchers, airline manufacturing and support firms,
and individual consumers (Bowen et al., 1991, p. 8). This allowed them to reduce the
original list of 80 factors, down to 19 final variables.
The AQR uses public data collected by the US Department of Transportation
(DOT), the National Transportation and Safety Board (NTSB), and 10-K reports for the
major air carriers whose base of operations was within the United States (major air
carriers are defined as any air carrier with operating revenues in excess of one billion
dollars for a given fiscal year). The instrument uses weighted averages to determine an
overall Airline Quality Rating. The weights (as determined from the interview process)
were assigned either positive or negative values which relate to the direction of impact
the factor has on Service Quality, with positive values given to factors that may increase
quality and negative values given to factors that may detract from quality (Table 4.1).
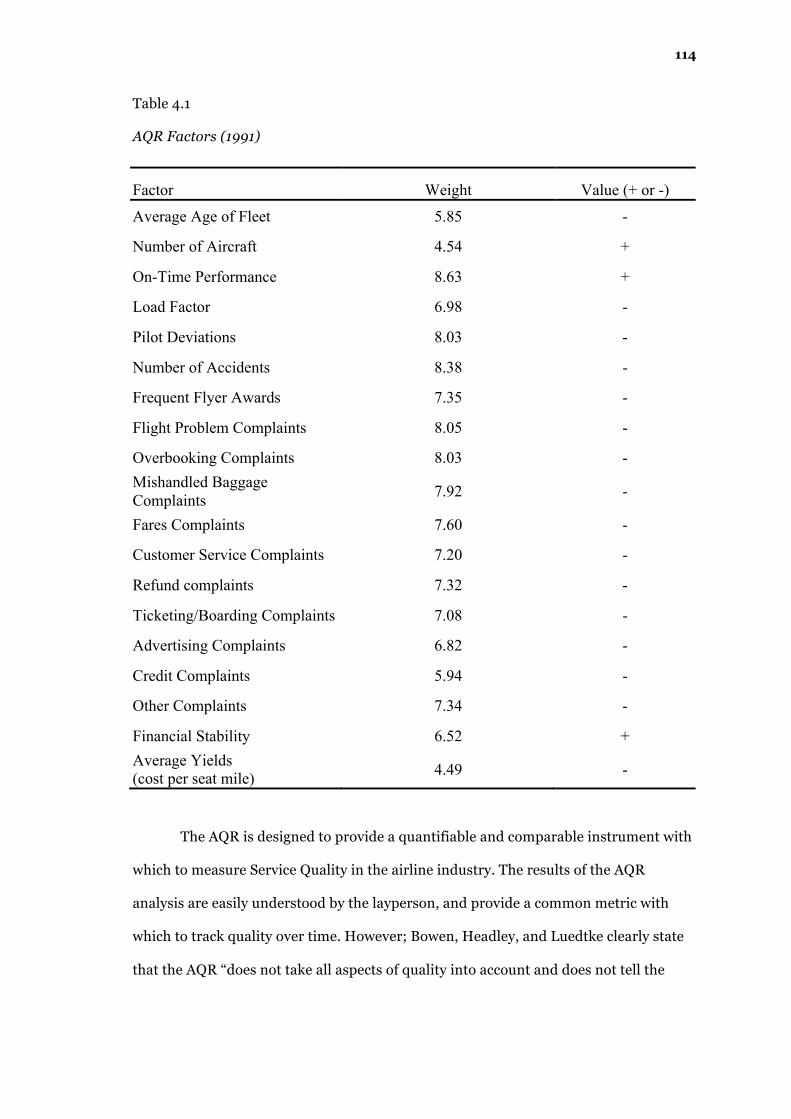
114
Table 4.1
AQR Factors (1991)
Factor Weight Value (+ or -)
Average Age of Fleet 5.85 -
Number of Aircraft 4.54 +
On-Time Performance 8.63 +
Load Factor 6.98 -
Pilot Deviations 8.03 -
Number of Accidents 8.38 -
Frequent Flyer Awards 7.35 -
Flight Problem Complaints 8.05 -
Overbooking Complaints 8.03 - Mishandled Baggage Complaints 7.92 -
Fares Complaints 7.60 -
Customer Service Complaints 7.20 -
Refund complaints 7.32 -
Ticketing/Boarding Complaints 7.08 -
Advertising Complaints 6.82 -
Credit Complaints 5.94 -
Other Complaints 7.34 -
Financial Stability 6.52 + Average Yields (cost per seat mile) 4.49 -
The AQR is designed to provide a quantifiable and comparable instrument with
which to measure Service Quality in the airline industry. The results of the AQR
analysis are easily understood by the layperson, and provide a common metric with
which to track quality over time. However; Bowen, Headley, and Luedtke clearly state
that the AQR “does not take all aspects of quality into account and does not tell the
115
whole story”. It merely provides an “open source” instrument for observing quality
within the airline industry (Bowen et al., 1991, p. 16).
While there has been little criticism of the AQR in the literature, questions may
arise relating to the qualitative groundwork from which the AQR is supposedly
constructed. Bowen, Headley, and Luedtke’s interviewed 65 airline industry “experts
including representatives of most major airlines, air travel experts, FAA
representatives, academic researchers, airline manufacturing and support firms, and
individual consumers” Bowen et al., 1991, p. 9) in order to determine the factors
involved in US Airline Service Quality. Following the initial qualitative interviews, they
made no effort to implement a passenger survey using firm academic theory (such as a
SERVPERF survey). Such a survey could have added much needed dimensionality to
the study (Gardner, 2004).
Therefore, in 1992 Bowen, Headley, and Luedtke re-examined the constructs of
the AQR (Bowen et al., 1992). They surveyed 766 airline customers to determine if their
preferences were in-line with the earlier assumptions made by management. The
results demonstrated no statistical difference between the “expert” opinions and the
customer survey. To determine the validity of the AQR study Bowen, Headley, and
Luedtke compared the results of the AQR to the current Zagat rating for US major
airlines and found a high statistical correlation (Bowen et al., 1992).
The AQR possesses significant reliability coefficients (Cronbach’s Alpha =
0.87). This further solidifies the AQR’s factor loading and helps to alleviate criticism of
the AQR methodological construction (Bowen et al., 1992). This is may be because of
the AQR’s readily simple algebraic design:
(+8.63xOT)+(-8.03xDB)+(-7.92xMB)+(-7.17xCC)/(8.63+8.03+7.92+7.17)
This equation utilises the four major variables On-Time (OT), Denied Boarding (DB),
Mishandled Baggage (MB) and Customer Complaints (CC), which the current
generation of the AQR employs (Table 4.2) (Bowen & Headley, 2007). The Customer
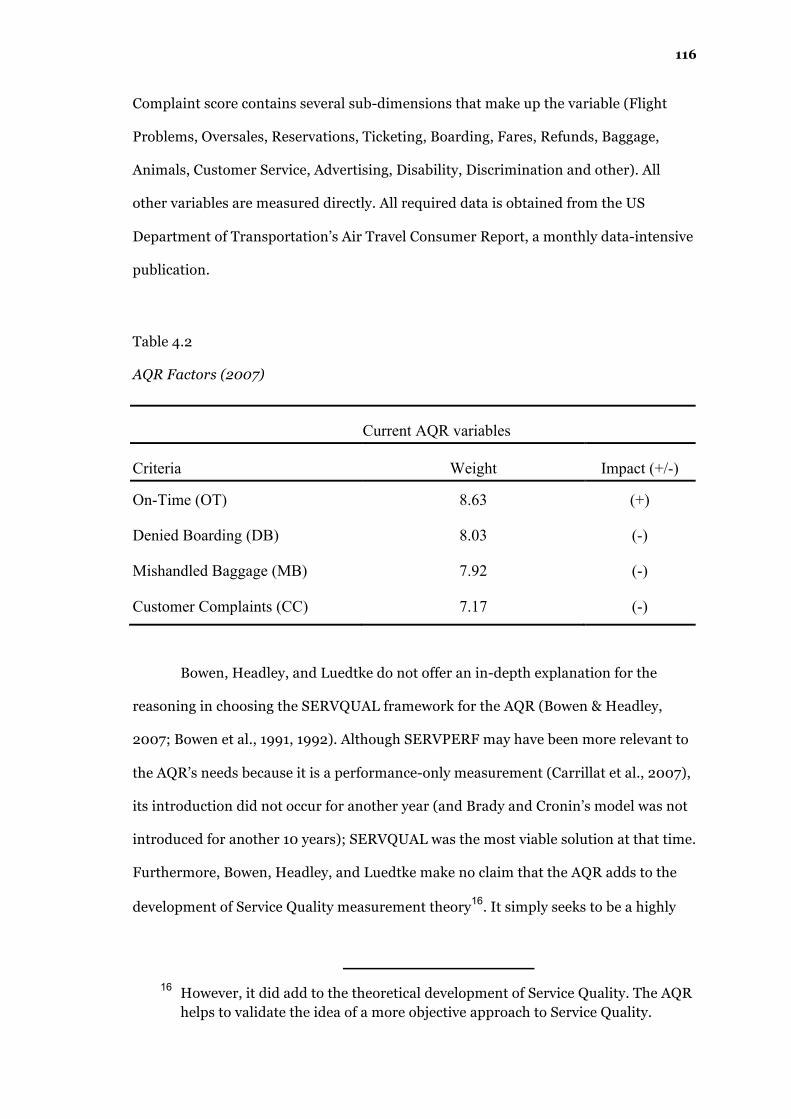
116
Complaint score contains several sub-dimensions that make up the variable (Flight
Problems, Oversales, Reservations, Ticketing, Boarding, Fares, Refunds, Baggage,
Animals, Customer Service, Advertising, Disability, Discrimination and other). All
other variables are measured directly. All required data is obtained from the US
Department of Transportation’s Air Travel Consumer Report, a monthly data-intensive
publication.
Table 4.2
AQR Factors (2007)
Current AQR variables
Criteria Weight Impact (+/-)
On-Time (OT) 8.63 (+)
Denied Boarding (DB) 8.03 (-)
Mishandled Baggage (MB) 7.92 (-)
Customer Complaints (CC) 7.17 (-)
Bowen, Headley, and Luedtke do not offer an in-depth explanation for the
reasoning in choosing the SERVQUAL framework for the AQR (Bowen & Headley,
2007; Bowen et al., 1991, 1992). Although SERVPERF may have been more relevant to
the AQR’s needs because it is a performance-only measurement (Carrillat et al., 2007),
its introduction did not occur for another year (and Brady and Cronin’s model was not
introduced for another 10 years); SERVQUAL was the most viable solution at that time.
Furthermore, Bowen, Headley, and Luedtke make no claim that the AQR adds to the
development of Service Quality measurement theory16. It simply seeks to be a highly
16 However, it did add to the theoretical development of Service Quality. The AQR
helps to validate the idea of a more objective approach to Service Quality.
117
reliable, quantitative measure of Service Quality that utilises publicly available
secondary data. This provides accessibility, while providing a metric that allows for
cross comparison of firm performance.
4.8 Measuring Service Quality in the Airline Industry
Current Service Quality measurements in the airline industry have several distinct
problems. First, while some airlines measure their Service Quality, this is often done
in-house and not publicised to consumers (except for EasyJet who publish their
measurements in their Annual Report). They seem to only serve to paint a longitudinal
picture of Service Quality to attract investment. However, the most important
discrepancy with such in-house measurements is their lack of real value to the
consumer when making purchase decisions. These reports may seem confusing and
can be difficult to locate (the average airline consumer is not likely to actively search
out EasyJet’s Annual Report prior to ticket purchase, for example). Furthermore, there
is often no comparative scores among airlines with which the consumer can use to
make a decision.
Industry watchers may play an important role in offering consumers some pre-
purchase comparison of airline Service Quality. Firms such as Skytrax rank each airline
according to a prescribed set of parameters (although their methods are usually
private). Often (especially in the case of Skytrax) the firms employ researchers to fly on
board each airline and measure the level of service personally. These industry
watchdogs may provide a consistent and accurate picture of airline service; however, it
is not complete. They typically subscribe ordinal values to each airline, such as the star
system used by Skytrax which places airlines into groups ranging from one to five
“stars” (they do publish a sixth and seventh star, but this is purely for expansion into a
Unfortunately, in 1991 no one had thought of this concept and the AQR’s contribution was largely unnoticed.
118
private carriage rating system). This system may be easily understood by consumers,
but it is of little use when comparing airlines of the same class. For example, Skytrax
ranks seven airlines as “Five Star” (ANA, Malaysia, Singapore, Hainan Airlines, Qatar
Airways, Asiana Airlines, and Cathay Pacific), this offers no comparison within the Five
Star group. Furthermore, due to the proprietary nature of their methods (Skytrax,
2013b) it is difficult to determine what variables Skytrax uses to measure such airlines
and whether or not the methods used to derive such variables are accurate and
consistent with modern Service Quality theory.
The most direct instrument for measuring airline Service Quality in the United
States (to date) is the AQR. While it has received some criticism for its lack of
dimensionality (Gardner, 2004), it is an easily interpreted mechanism for consumers,
industry professionals and investors and provides a clear and comparable
measurement of Service Quality in the US airline industry. However, the AQR is based
on only a rudimentary application of Service Quality theory (further demonstrated in
Chapter Four). In addition to this, its factor structure and data collection methods are
only applicable to the US market (Headley & Bowen, 1997). In Europe the JAA does not
compile as much data as the FAA, nor are the corporate annual reports of European
airlines as standardised as in the US. European passengers may also have slightly
different determinants of airline quality than American passengers (Tiernan et al.,
2008). Although these issues make a European based AQR type instrument more
difficult to construct, it would nonetheless be beneficial.
Currently, a comparable system for measuring Service Quality within the
UK/EU airline industry is needed (Headley & Bowen, 1997) . The area sees heavy price
competition, especially within the LCC market. However, construction of such an index
may be difficult in the UK because this market has differing industrial and
governmental data collection methods and reporting standards than the US market
where the AQR is based.
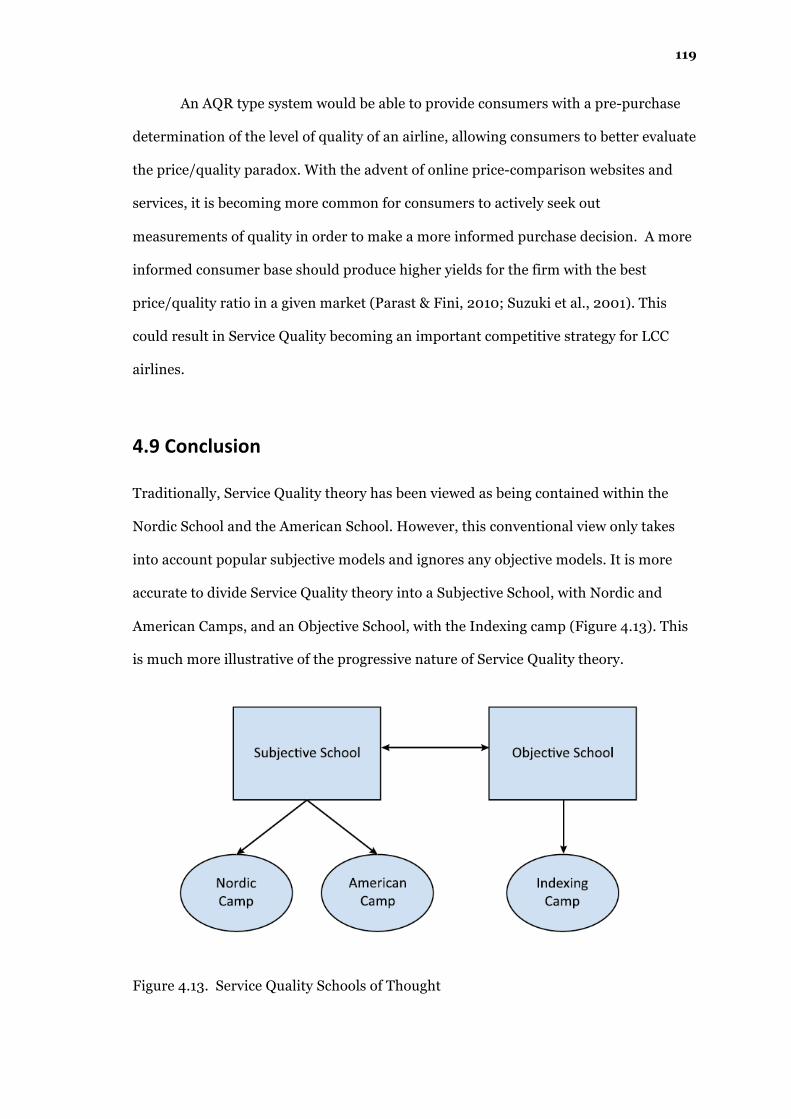
119
An AQR type system would be able to provide consumers with a pre-purchase
determination of the level of quality of an airline, allowing consumers to better evaluate
the price/quality paradox. With the advent of online price-comparison websites and
services, it is becoming more common for consumers to actively seek out
measurements of quality in order to make a more informed purchase decision. A more
informed consumer base should produce higher yields for the firm with the best
price/quality ratio in a given market (Parast & Fini, 2010; Suzuki et al., 2001). This
could result in Service Quality becoming an important competitive strategy for LCC
airlines.
4.9 Conclusion
Traditionally, Service Quality theory has been viewed as being contained within the
Nordic School and the American School. However, this conventional view only takes
into account popular subjective models and ignores any objective models. It is more
accurate to divide Service Quality theory into a Subjective School, with Nordic and
American Camps, and an Objective School, with the Indexing camp (Figure 4.13). This
is much more illustrative of the progressive nature of Service Quality theory.
Figure 4.13. Service Quality Schools of Thought
120
Service Quality theory will always be an area of hot debate. The only concept
that seems prevalent throughout the literature is that there is no singular best
measurement of Service Quality. Each metric seems to have unique advantages and
disadvantages: some are more useful to the practitioner (such as SERVQUAL and
SERVPERF) and some are better suited to the academic world (for example, Rust and
Oliver’s Three Component Model or Grönroos’ early model). Furthermore, some
industries may lend themselves to more advanced objective measurements (such as the
airline industry with is high degree of available quantitative industry data), while
others may still need to rely on purely qualitative evaluations of Service Quality (for
example, the hairstyling industry where many of its qualities cannot be quantified). The
high degree of variation among services makes a global metric of Service Quality very
difficult. This “best-fit” approach will almost always result in compromises that could
affect the overall accuracy of the measurement. Therefore, in order to gain the best
picture of Service Quality, a context-specific approach should always be adopted.
The Service Quality literature is very broad, yet seems to lack depth. There is a
multitude of Service Quality models found in the literature; however, other than
SERVQUAL and Grönroos’ (1984) model of Technical and Functional Quality, there
has been very little follow up research to these models. Many of these models deserve
expansion, particularly Brady and Cronin’s (2001) HiQUAL. This model provides a
solid base for research into the nature of Service Quality in the LCC industry by
providing a hierarchical, performance-only metric.
Another underlying problem with many of the popular Service Quality
measurements is accessibility to the public. These instruments require extensive data
collecting methods and complex analysis. Furthermore, once firms have collected and
analysed their data, they rarely publish the results (Bowen et al., 1991). This makes a
picture of Service Quality almost impossible to obtain from outside the industry. The
AQR attempts to rectify this dilemma. The AQR provides a clear picture of the current
level of Service Quality within a firm (Bowen et al., 1991; Bowen & Headley, 1993). This
121
information is then visible to consumers and comparable to industry competitors as
well as past performance. However, it requires modification to fit the European market
(Headley & Bowen, 1997).
Although the AQR refers to SERVQUAL’s five factors, the theory behind the
AQR is not consistent with the SERVQUAL model. There is no measurement with the
AQR for Consumer Expectations, nor is there any mention of “gap” theory or difference
scores. The AQR is a performance-only measurement of Service Quality17. However,
performance-only measurements are supported in the Service Quality literature and
seem to be more reliable when used to measure Service Quality within industries that
offer a high degree of tangibility (Buttle, 1996; Carrillat et al., 2007; Cronin & Taylor,
1992, 1994). Secondly, it appears the AQR is attempting to capture measurements of
Customer Satisfaction along individual variables and compile them into a
measurement of overall quality. Again, this conforms to the popular theory that
Satisfaction is an antecedent of Service Quality (Bitner, 1990; Bolton & Drew, 1991;
Brady et al., 2002; Cronin & Taylor, 1992; Oliver, 1980, 2009). Brady and Cronin
developed their model from a sample obtained from four industries: fast food,
photograph developing, amusement parks, and dry cleaning (Brady & Cronin, 2001).
Assessment of the nine sub-dimensions demonstrated the strong impact of valence
(factors beyond the control of management) on Service Quality. They suggest that one
or more of the other sub-dimensions may be able to counteract the negative effect of
valence (Brady & Cronin, 2001). Great service in flight may counteract the effects of a
flight delay due to maintenance problems. This concept is captured within the AQR:
the weights and their associated values allow exceptional service in one area to
counterbalance substandard service in another.
17 This is another area where the AQR was ahead of the Service Quality literature
as it was published a year before Cronin and Taylor’s (1992) SERVPERF article.
122
Being built upon industry performance data, the AQR certainly appears as if it
is a return to a manufacturing philosophy. However, the AQR ultimately tries to
capture a picture of customer satisfaction. Again, Cronin and Taylor see satisfaction as
one of the constructs of Service Quality (Cronin & Taylor, 1992, 1994). Thus, Service
Quality is also a determinant of consumers’ repurchase behaviour (Park et al., 2006) as
well as consumer loyalty (An & Noh, 2009; Chang & Chang, 2010) and overall
satisfaction (Taylor & Baker, 1994) within the airline industry.
There is some evidence that the LCC industry is beginning to understand the
importance of Service Quality. EasyJet currently publishes the Customer Satisfaction
Survey results (CSAT) in their yearly annual reports. Passengers are given the option to
take part in the CSAT survey immediately following their flight. EasyJet’s research has
identified on-time performance and boarding as two major areas of concern for
passengers. The CSAT attempts to capture consumer’s opinions of these factors along
with their repurchase intentions and willingness to recommend. While EasyJet's efforts
may be highly effective management tools, the results of CSAT still remain property of
EasyJet and are not easily visible to the average consumer. Additionally, they are not
comparable between other LCCs (if other LCCs were likely to collect and publish such
data).
The North American Market has the AQR (Bowen et al., 1992), yet no similar
instrument exists compliant with the European market. Unfortunately, the North
American AQR may not be easily transferable to the European market (Headley &
Bowen, 1997) due to characteristic differences between the two markets. Therefore, a
unique instrument commensurate to an individual market within the European Union
Economic Area (in this case the United Kingdom) should be created, independently of
other airline markets. The development of a market specific instrument could help
drive consumer choice to airlines providing superior services, thus adding a new
competitive advantage for the LCC.
123
CHAPTER FIVE: METHODOLOGY
5.1 Introduction
While considerable research has been conducted into services in the airline industry,
the investigation of Service Quality is typically carried out from a universal perspective
or in markets outside of Europe. Further Service Quality research within the European
market is needed, particularly because the European airline industry has undergone
extensive changes since the United States Deregulation Act was passed in 1978. The
resulting liberalisation and open-skies agreements that followed within the global
airline industry encouraged the emergence of the low-cost carrier. Much of the
research focusing on Service Quality within the airline industry views LCCs in the same
light as traditional carriers. However, the LCC business model diverges from the
traditional business model in both operational and marketing strategies. Therefore,
when examining Service Quality within this industry it is important to make a
distinction between the two types of airline carriers to take account of the differences in
consumers’ purchase intentions. LCCs are currently some of the most profitable
airlines in the global market, and their sector is the fastest growing within the industry,
with many traditional carriers adopting similar operational and marketing strategies.
However, the differences between the two carriers still warrant their separation when
examining Service Quality.
Rising fuel prices, intense competition and increasingly tight margins has
particularly challenged the modern airline industry and increased the difficulty of
maintaining profitability. Evidence has suggested that profitability can be improved,
particularly within a competitive market, by improving Service Quality; this is one of
the last areas that airlines can use to gain a competitive advantage. Therefore, the aim
of this thesis is to examine Service Quality in the low-cost airline industry. By
conducting research focusing on LCCs within the European market (specifically the
124
United Kingdom), a novel perspective can be provided that can be used in both a
theoretical and practical sense.
Chapter Four has highlighted several of the popular methods for measuring
Service Quality. This thesis will select various methods of measuring Service Quality
and will attempt to highlight different facets of quality in the low-cost airline industry
using these methods.
Three separate studies have beenwill be conducted using different methods of
measuring Service Quality. This includes a qualitative study (content analysis), a
quantitative survey (HiQUAL), and the creation of the Airline Service Quality Indicator
(ALSI). In addition to having distinct methods, each of these measurements is
philosophically different.
5.2 Research Aim and Objectives
The aim of this thesis is to examine Service Quality in the UK low-cost airline industry.
The Literature Review drives several objectives that can help in achieving this aim.
Each objective fulfils a specific purpose:
1. Identify the determinants of Service Quality in the low-cost airline industry.
While Airline Quality has received substantial research there has yet been no clear
identification of the determinants of Service Quality in the low-cost airline industry.
This objective will attempt to benefit Airline Quality researchers and industry
professionals by identifying the factors that affect consumers’ experiences with the
airline.
2. Apply a traditional model of Service Quality to the low-cost airline industry.
This thesis will attempt to adapt an accepted Service Quality instrument to fit the
low-cost airline industry. While there has been significant quantitative research
into the airline industry, very little of this research is market specific. Furthermore,
many of the investigations into airline quality do not utilise popular Service Quality
125
instruments. Answering this objective will add value to the Service Quality
literature by examining quantitative models of Service Quality. Traditional
quantitative methods for measuring Service Quality (such as SERVQUAL) have
typically been applied universally. This thesis argues that an industry-specific
instrument is preferable to a global instrument. It will examine the popular service
quality models to determine which may be the most beneficial to this research.
3. Construct and AQR type metric for the UK market.
Indexing metrics, such as the AQR benefit from the application of easily accessible
secondary data and longitudinally comparable outputs. Currently there is no
Service Quality index to fit the UK low-cost airline industry. This objective will
benefit consumers and industry professionals by constructing an easily understood
and longitudinally comparable metric for this context. This thesis will also attempt
to demonstrate that an AQR type metric of Service Quality can add to the Service
Quality literature by demonstrating the possibility of a shift in research philosophy
to more objective measurements.
4. Examine the relationship between Service Quality and airline profitability.
Given the large volume of research covering Service Quality and its effect on a
firm's profitability (Zahorik & Rust, 1992; Valarie A Zeithaml, 2000), it would seem
that the two variables would naturally be positively linked in the airline industry.
This is particularly true as the airline industry (especially the LCC industry) is
becoming highly price sensitive (Doganis, 2006). However, there is very little in-
depth research examining the relationship between Service Quality and
profitability, particularly within the unique environment of the airline industry.
This objective attempts to further investigate the relationship between Service
Quality and its impact on airline profitability. Demonstrating a positive correlation
between these factors would benefit the airline industry by highlighting the
importance of Service Quality in providing a competitive advantage.
126
5.3 Research Paradigm
The research within this thesis employs a variety of philosophical approaches. The
qualitative study is epistemologically interpretive, while the latter studies which look at
airline quality from a quantitative and indexing approach are more empirical and
positivist. Inductive/interpretive approaches were popular with the Nordic School, and
involve heavy use of qualitative measures. Using this approach can be useful when
attempting to gather rudimentary data to aid in the construction and development of
new theories or to help direct further research (Saunders, Lewis, & Thornhill, 2007).
Traditionally, most research within the American School involves both inductive and
deductive reasoning, with a blending of the two philosophical approaches. The
qualitative approach is used to support the development of the objective instrument.
This process demonstrates shift from a subjective to a more objective approach to
Service Quality theory.
This thesis employs both deductive and inductive reasoning. In the deductive
approach, data are collected to answer specific research questions (Saunders et al.,
2007), for example secondary industry data was collected for input into the ALSI. This
is the foremost method of reasoning used in this study. However, there is a small
element of inductive reasoning contained in the construction of the ALSI. This is found
in the various weights applied to the variables in the ALSI.
Most of the modern Service Quality research centres on a subjectivist ontology.
That is, the actors in society are the drivers of social phenomena through constantly
changing viewpoints (Saunders et al., 2007). Most of the current Service Quality
research follows this line of thinking (Grönroos, 2006); the only exception may be the
AQR (Bowen & Headley, 2007; Bowen et al., 1992; Bowen & Headley, 1993). The
subjective approach relies heavily on the perspectives of individuals to ascertain social
variable (here, Service Quality).
127
However, there is an inherent problem with using individuals to measure
Service Quality: their opinions, and therefore the results of the measurement, are easily
biased (Berg & Lune, 2004; Mayring, 2004). The Systematic Distortion Hypothesis
states that respondents can easily distort their evaluations of other people, or in this
case service providers (Shweder & D’Andrade, 1980). This distortion is a result of one
or both of the following misconceptions: the first comes from respondents pre-existing
ideas of “what goes with what”, the second states that recall for affiliated memory items
is much easier than for individual items (Shweder & D’Andrade, 1980). Therefore,
subjective measurements of Service Quality are intrinsically biased.
Part of this research demonstrates a slight shift in Service Quality from a
subjective to a more objective ontology (Figure 5.1). Objectivism views social constructs
as absolute and independent of social actors (Saunders et al., 2007). While this may
never be completely true with Service Quality measurements, it can be demonstrated in
part through the creation of Service Quality indexes. This would result in Service
Quality being viewed as an absolute value that exists within nature, independent of the
opinions of consumers. Doing so can simplify calculating, analysing and comparing
Service Quality scores.
Subjective investigations into Service Quality merely examine an individual's
emotional commitment toward the ideal of Service Quality. This theory assumes that
social variables (Service Quality) are somehow an intrinsic component of man's psyche,
independent of reality. The objective approach sees Service Quality as an absolute
value, independent of the individual (Rand, 1990). Service Quality is therefore an
“evaluation of the facts of reality by man's consciousness, according to a rational
standard of values” (Rand, 1990, p. 221). Therefore, a shift toward an objective
approach to Service Quality theory may provide a more representative measurement of
Service Quality within a given industry (not Perceived Quality).
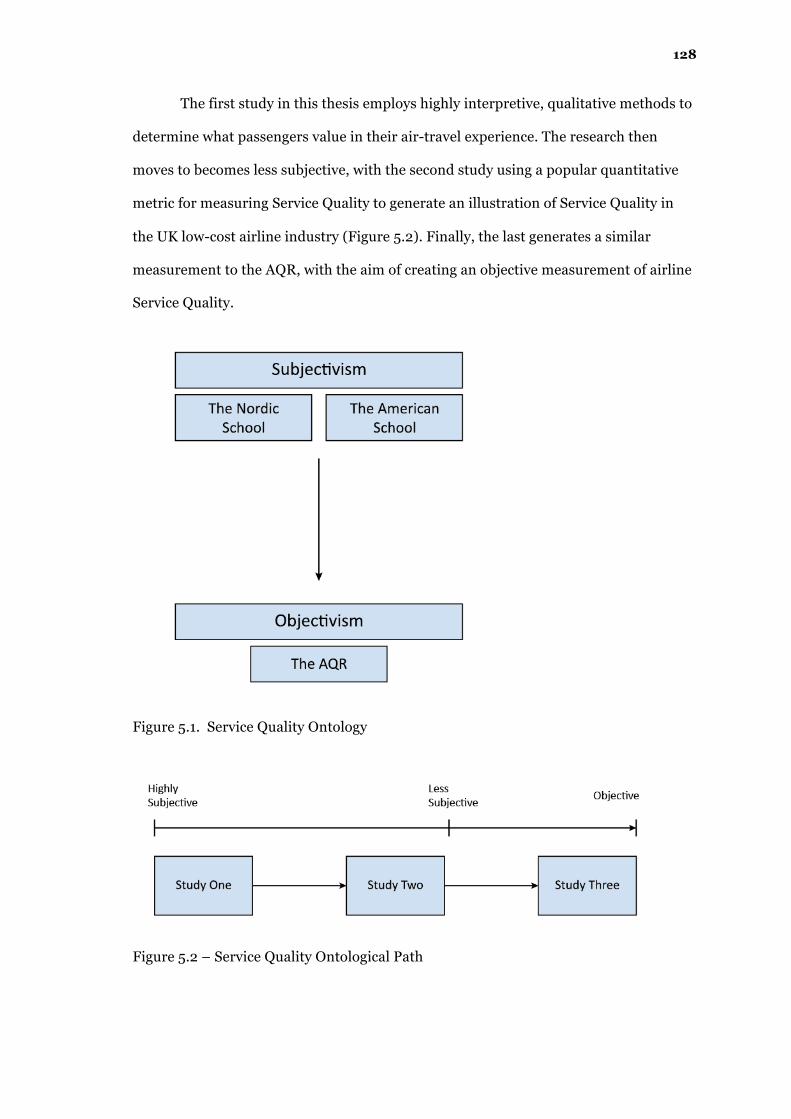
128
The first study in this thesis employs highly interpretive, qualitative methods to
determine what passengers value in their air-travel experience. The research then
moves to becomes less subjective, with the second study using a popular quantitative
metric for measuring Service Quality to generate an illustration of Service Quality in
the UK low-cost airline industry (Figure 5.2). Finally, the last generates a similar
measurement to the AQR, with the aim of creating an objective measurement of airline
Service Quality.
Figure 5.1. Service Quality Ontology
Figure 5.2 – Service Quality Ontological Path
129
5.4 Achieving the Objectives
In order to fulfil the aim and objectives of this thesis, an in-depth investigation into
Service Quality in the low-cost airline industry in Europe will need to be conducted.
This investigation will use several key methods that have previously been used within
the literature to advance Service Quality Theory, including in-depth interviews, focus
groups and quantitative surveys (Ritchie, Lewis, Nicholls, & Ormston, 2013). This
section will detail which methods are appropriate in helping to meet the objectives of
this thesis.
5.4.1 Objective One: What are the determinants of Service Quality in the UK low-
cost airline industry?
Previous research into airline Service Quality has not specifically focused on the
LCC industry in Europe. Exploratory research into the determinants of Service Quality
in the European airline industry will further progress by qualitative investigation.
Qualitative research is often used to explore the truth in society or find the real
perceptions of individuals (Robertson, 2002). Focus groups and in-depth interviews
may help establish an in-depth understanding of passengers’ opinions of airline
quality; however, these methods of data collection can be expensive and time
consuming. While each has its inherent strengths, conducting a large-scale project is
out of the scope of this project due to constrained timescales. Examining existing
content is an efficient solution that can effectively identify the key determinants of
Service Quality in this industry.
The popularity of the airline industry has spawned many industry watchers
(such as Which?, Skytrax and TripAdvisor). These generally come in the form of media
publications, online review sites, or specialist companies that specifically monitor
airline quality. While there is a multitude of independent airline industry watchers
130
available to the consumer, this study will only focus on the most popular and most
visible. A clear explanation of the advantages and disadvantages of each watcher will be
discussed in-depth in Chapter Seven.
The comments left by consumers on web-based travel sites can be a source of
secondary data. These sites provide the ability to purposive select responses that relate
specifically to the context (in this case a specific airline). Therefore, the comments can
be selected and categorised based upon like experiences. Consumers can give
information-rich responses on such websites and often comment on the most
influential aspects of the experience. Therefore, this type of data, primarily, represents
an information-rich account of consumers’ experiences with an airline and has a
secondary benefit of being readily available to the researcher.
Some popular web-based industry watchers offer consumers the ability to give
feedback on their experiences and such comments may be a valuable source of easily
obtainable data for researchers (Bakos, 1998). Some research has used such sources to
evaluate Customer Satisfaction within the securities brokerage services (Yang & Fang,
2004); therefore, this study will determine the approachability of such data to finding
the determinants of Service Quality in the low-cost airline industry. The results of this
study should generate a set of determinants relating to airline quality that are
important to the consumer.
5.4.2 Objective Two: Can current Service Quality Models be applied to the UK low-
cost airline industry?
While there has been significant research into the airline industry, many of
these studies do not utilise popular Service Quality scales. While they incorporate a
variety of methods, very few use accepted instruments such as SERVPERF or
SERVQUAL. Furthermore, much of the Service Quality literature seeks to apply Service
131
Quality scales universally. This thesis argues for the modification of such scales to fit a
given industry.
This study will apply an established quantitative metric of Service Quality in
order to gain insight into the nature of Service Quality in the low-cost airline industry.
Such models provide an established framework with which we can investigate
Perceived Quality from a quantitative perspective. These methods can allow the direct
comparison of results and statistical inference from the data. This study will
investigate the applicability some of the possible metrics (outlined in Chapter Four)
and make a recommendation for the following research.
Considering the theoretical problems with SERVQUAL and SERVPERF;
SERVPEX appears to be a more appropriate choice for examining Service Quality
within the LCC industry. As Chapter Four illustrates, SERVPEX is both a theoretically
sound and modern instrument for measuring Service Quality. SERVPEX also has the
advantage of being originally constructed for the airline industry so little or no
modification would be required. However, Robledo demonstrated that performance-
only measurements statistically outperform difference-score based instruments in
measuring Service Quality within the airline industry, an argument which was justified
in Chapter Four (Cronin & Taylor, 1994; Robledo, 2001). This study therefore
implements a performance-only measurement of Service Quality in order to be
congruent with established Service Quality literature. While SERVPEX may be an
acceptable instrument, it is not a performance-only measurement as it attempts to
measure both expectations and performance simultaneously. Consistency of
measurements negates its usage in this study leaving only SERVPERF and HiQUAL as
possible instruments of choice.
Research has previously been conducted on the hierarchical nature of Service
Quality within the airport environment. Fodness and Murray found that their data fit a
clear hierarchical model of Service Quality in the airport industry (Fodness & Murray,
2007). Given the close relationship of the airport and consumer airline experiences, it
132
would be relevant to also test the applicability of hierarchical models to the airline
industry. The second study within this thesis (found in Chapter Six) will apply the long-
neglected HiQUAL instrument to establish a quantitative measurement of Service
Quality within the UK LCC industry (Brady et al., 2002). HiQUAL is a justifiable choice
for this study because it is a performance-only measurement of Service Quality, easily
adapted to a specific industry, and hierarchical in structure. Furthermore, this thesis
argues for an industry-specific measurement of Service Quality and HiQUAL should be
easily adaptable to an airline context.
Achieving this objective involves the creation and distribution of a quantitative
survey. The survey collected data for two separate studies simultaneously (Chapter Six
and Chapter Eight). This was necessary to fit the time constraints of this research
project. The survey is constructed in four parts: i) initial qualifying questions; ii)
questions generated from the content analysis study in Chapter Seven; iii) the HiQUAL
instrument and iv) demographic questions.
In order to fit the specific context, the HiQUAL instrument requires slight
modification of the verbiage to fit the low-cost airline context. The results of the
content analysis study were also transformed into a series of questions in order to
capture consumers' opinions of these topics. The results from these questions will be
used in Chapter Eight to construct a novel metric for low-cost airline quality.
5.4.3 Objective Three: Can Service Quality in the low-cost airline industry be
measured objectively?
Much of the Service Quality literature is based on subjective evaluations of
consumer response data. Consequently, much of the airline industry-specific research
into Service Quality follows the same pattern. Subjective measurements rely on the
interpretations of consumers’ opinions. Such opinions are subject to change and could
affect the outcomes of the research. This objective will demonstrate a shift in ontology
133
from the purely subjective measurements of Service Quality to a more objective
measurement. Demonstrating the viability of such metrics could allow for further
development of objective metrics within the Service Quality literature. An objective
instrument would measure Service Quality independently from the consumer. This
would allow for data other than consumer opinion (such as secondary data obtained
from government and industry sources) to be utilising in generating a Service Quality
score. The Airline Quality Rating provides an example to support the creation of an
objective instrument for measuring service quality in the airline industry (Bowen &
Headley, 2007; Bowen et al., 1991, 1992; Headley & Bowen, 1997).
Headley and Bowen suggest the application of their concept to airline markets
in Europe, however; to date there has been no attempt at implementing this (Headley
& Bowen, 1997). This may be because the availability of data within the UK is much
different than in the US because of the distinct reporting requirements between the two
countries. Therefore, the AQR cannot simply be transposed onto the UK market. It
must be reconstructed to fit the UK context.
This thesis also argues that there are significant differences within airline
markets and Service Quality should only be measured within these unique markets to
avoid unfair comparisons between full-service and low-cost carriers. The LCC market
differs greatly in respect to service offered than traditional carriers (which were
included in the AQR). Therefore, this study will construct an AQR type index
specifically for the UK low-cost airline industry. Such a metric will provide
longitudinally comparable outputs that are independently measured (to help reduce
bias) and easily understood by the consumer and professional alike.
Justification for such an objective measurement of Service Quality has been
outlined in the literature (Elliott & Roach, 1993). Elliot and Roach determined that
there may be factors influencing airline service attributes other than those available for
observation by the consumer. Therefore, the airline may be receiving an unfair
134
evaluation from the consumer. This thesis suggests that the construction of a scale that
assesses the quality of low-cost airlines operating within the United Kingdom, namely
the Airline Service Quality Indicator (ALSI). Unlike other methods of measuring
quality, ALSI uses regularly published, comparable, quantitative data that are linked to
customer quality concerns.
The Airline Service Quality Indicator draws its concept from the Airline Quality
Rating; however, unlike the AQR, ALSI will measure Service Quality within one
segment of the UK airline industry, whereas the AQR looks at the industry within the
United States as a whole (incorporating low-cost, regional and traditional carriers).
This is a marked difference between the AQR and ALSI as the various segments of the
airline industry offer very different services and should be measured separately.
Some opinion has been expressed as to the lack of dimensionality that this type
of instrument may possess (Gardner, 2004). The ALSI will attempt to correct this
through its construction on modern Service Quality theory and where possible,
bringing in values other than raw data figures (such as percentages or weighted
variables). This should alleviate any concerns over dimensionality by providing
increased depth to the instrument.
5.4.4 Objective Four: Can Service Quality be related to airline profitability?
As outlined in the context chapters, many low-cost airlines in the UK engage in
the practise of selling goods and services in flight. This effectively makes the cabin of
the aircraft a retail storefront. If an AQR style metric for Service Quality in the UK low-
cost airline industry can be created, then the results of that index may be comparable to
airline’s ancillary sales, which are a component of the low-cost airlines’ profitability
strategies. This comparison is be traced longitudinally to determine if there is a
relationship between Service Quality and profitability.
135
5.5 The Subjects
Within the European airline industry, there exists many markets with unique attributes
whose examination would result in academically and professionally interesting
perspectives for Service Quality. In these markets, the LCC can currently be argued as
one of the most interesting due to its fast growth, strong market presence and
preference for price competition. Therefore, this study will examine LCC’s operating
within Europe, specifically within the United Kingdom (chosen for its uniformity of
financial reporting and ease of access). Traditional carriers and regional airlines are
excluded from the studies in this thesis along with small or unscheduled operators as
these airlines serve a different market than the LCC’s. This section highlights some of
the more interesting points of the airlines included in this study and, importantly,
explains the exclusion of some airlines commonly thought to belong to the LCC market.
Each airline is evaluated by its applicability to the LCC model and its applicability to
the three studies in this thesis.
5.5.1 Ryanair
Founded by the Ryan family of Dublin Ireland in 1985, Ryanair is the largest (in
number of aircraft and route structure) and most profitable LCC operating within the
UK. They began with the objective of putting Ireland’s national flagship carrier Aer
Lingus out of business (interestingly Aer Lingus is now partly owned by Ryanair).
Initially, they operated a single route from Waterford to London Gatwick flying in a 15-
seat Embraer Bandeirante (EMB 110). The first few years saw rapid growth for Ryanair
until 1990 when they began to face significant managerial and legislative challenges
that bankrupted the fledgling airline (Ryanair, 2012a). After an extensive capital
investiture of (£20 million pounds from the Ryan family, Ryanair employed Michael
O’Leary to shadow Herb Keller (CEO for Southwest airlines in Dallas, Texas) for six
136
months (Ryanair, 2012a) . Following this, O’Leary implemented the Southwest model
at Ryanair with great success (Ryanair, 2012a).
From the late 1990’s Ryanair has seen extensive expansion of its route structure
and growth of passenger numbers. They now operate from 53 bases on over 1,500
routes across 23 countries (Ryanair, 2012a) . They are headquartered in Dublin,
however; it is included in this study due to its very large market presence in the UK. It
is considered a Southwest Copycat even though it has extensively modified the
Southwest model.
Like Southwest, Ryanair’s flights are carried out in a single aircraft type, the
Boeing 737-800. This aircraft is the most advanced of the 737 series and offers
maximum efficiency and economy of operations due to the need to carry parts and
maintenance schedules for only one type of aircraft. Their route structure encompasses
“smaller” airports (in relation to major airports such as London, Heathrow or Paris
Charles-de-Gaulle) usually located outside the metropolitan areas of large cities.
Ryanair follows the “no frills” model of service exclusion charging additional fees for
everything from checked baggage to printing a boarding pass at the check-in counter
(Figure 3.2).
Ryanair is famous for their marketing strategy claiming to be “the world's
favourite airline” (Ryanair, 2012a) . Their business plan is simple; they design
themselves to be the cheapest airline in the industry, and nothing else (Ryanair Annual
report, 2012). Their advertising campaigns have generated significant media attention
and have suffered frequent criticism by popular press media. However, scrutiny does
not seem to stop Ryanair (Gordon, 2011).
Ryanair is not committed to personal, face-to-face Service Quality. Rather,
their interest in Service Quality is in any element that affects profitability directly (such
as on-time performance). Their lack of empathy is very popular in modern media and
extends throughout their corporate hierarchy. This makes Ryanair a great lens with
137
which to look at the influence of Service Quality to ticket purchasing: empathy and
responsiveness are virtually non-existent, yet they remain one of the most profitable
airlines in the industry.
Furthermore, like most LCCs in Europe, Ryanair generates ancillary revenues
from the sale on in-flight goods. They also offer the availability to book hotels and
rental cars through their corporate website. Ryanair is as progressive in generating
ancillary revenues as they are with cost cutting and marketing. “Exploding fees”
(whereby the consumer finds themselves paying an unexpected fee) have been a
popular method for generating new revenues. Recently Ryanair has adopted the
advanced notion of selling advertising space inside their cabins and is generating
notable revenues. This is definitely an industry first within the UK and European
market; however, it is unclear how Service Quality can influence these revenues.
5.5.2 EasyJet
EasyJet PLC. is the second largest LCC operating in the UK market. Having carried
more than 60 million passengers in 2013 it operates over 200 aircraft and employed
over 8,000 people. Founded in 1995, with the vision of being a consumer-focused
brand, EasyJet has quickly expanded to become the largest airline operating in the UK
market. Unlike Ryanair, EasyJet is a pure Southwest Copycat (they allow for some
inclusive services within the ticket price such as allocated seating). Unlike many LCCs,
EasyJet offers business class seating. However, priority boarding is still an additional
fee and they do not offer a baggage allowance.
EasyJet offers low fare, point-to-point flights from 23 bases throughout Europe.
They have over 700 routes and are rapidly expanding (200 routes have been added
since 2011). Mostly routes are throughout the UK and Europe, but some include
destinations to the African continent (such as Morocco, the Faroe Islands and three
destinations in Egypt). EasyJet estimates that 300 million people live inside a one-hour
138
drive of an EasyJet carrier. This makes EasyJet the largest competitor for Ryanair in
the UK market.
Despite being a Southwest copycat, EasyJet differentiates itself from Ryanair in
several respects. EasyJet has a consumer focus while Ryanair has become famous for is
gross lack of friendly service. Ryanair also focuses strictly on price competition,
catering only to budget minded travels (mostly within the leisure market). EasyJet likes
to see itself as a value airline, not strictly the lowest-price in the market. This leads to
several distinctly different business strategies. Most notably, EasyJet passengers have
an option to buy business class seating or standard class tickets with priority boarding
or extra leg room. Ryanair passengers can purchase priority boarding only. Ryanair’s
passengers only fly to smaller airports located far from city centres (such as Paris
Beauvais), while EasyJet currently flies to 44 out of Europe’s 50 largest airports (such
as Paris Charles-de-Gaulle). EasyJet also plans to expand its availability of larger
airports in the near future, while Ryanair has no plans to do so. EasyJet has begun to
view itself, not just as an airline, but as a value brand. This has led EasyJet to expand
into the hospitality industry with the EasyHotel brand. These hotels are modelled after
the same values as EasyJet: to make travel easy and affordable. At this time there is no
evidence that Ryanair has plans to operate outside of the airline industry.
EasyJet’s competitive strategy is aggressive. Their mission statement is simply,
“Turning Europe orange” (“EasyJet, Plc. Annual Reports and Accounts 2013,” 2014)
which illustrates EasyJet's plan to expand its market coverage to all of Europe and
beyond. However, unlike Ryanair, EasyJet's guiding principle is not simply to have the
greatest market share, but to be the first or second airline in the market with significant
share while generating the highest financial return. EasyJet’s Strategy also differs from
Ryanair's in that it includes language relating to friendly customer service. Their
statement of Strategic Intent clearly illustrates this point: “Leverage EasyJet's cost
advantage, leading market positions and brand to deliver point-to-point low fares with
139
operational efficiency and friendly service for our customers” (“EasyJet, Plc. Annual
Reports and Accounts 2013,” 2014).
EasyJet publishes a Customer Satisfaction rating in the company's annual
report. They claim that in 2012, 85% of all passengers were satisfied with the service
(“EasyJet, Plc. Annual Reports and Accounts 2013,” 2014). However, there is no
comparison made with the satisfaction levels of competitors’ customers, nor is there
any description of the methods used to derive the Customer Satisfaction figures. This
emphasises the need for a universal, comparable means of measuring quality within
the LCC industry. Since Service Quality may drive some aspects of repurchase
behaviour and consumer loyalty within the airline industry (Ostrowski, O’Brien, &
Gordon, 1993), the ability to freely compare Service Quality scores could be attractive
to investors.
5.5.3 Jet2.com
Jet2.com is a wholly owned subsidiary of Dart Group PLC. The group operates two key
market segments: aviation (Dart Group, 2012) and ground transport (under the trade
name Fowler Welch). The aviation business is targeted at the holiday travel market
through their Jet2holidays.com website. This is the only UK-LCC that offers third-party
channels of distribution for its tickets, although the majority of ticket sales are still
through the company's website (Dart Group, 2012). They are relatively small in
comparison to Ryanair and EasyJet. They seek market differentiation by specifically
focusing on holiday tourism. While Jet2.com is a wholly owned subsidiary of Dart
Group PLC., the company provides some segmentation of financial statements in their
annual reports. Unfortunately, the aviation and trucking operations cannot be
completely separated, and so Service Quality in Jet2.com’s airline industry cannot be
measured. For this reason they have been excluded from this study. However, if Dart
Group PLC. were to publish figures for their airline independently from their other
operations, Jet2.com could be integrated into this study.
140
5.5.4 Bmibaby
Bmibaby is a wholly owned subsidiary of British Midlands Ltd. (bmi). Since November
2009, Lufthansa has been the sole shareholder of bmi via the British holding company
LHBD Holding Ltd. In 2010 the company was successfully integrated into the
Lufthansa Group. Lufthansa Group consolidates bmi and bmibaby’s financial and
performance data in their yearly publications, along with many other Lufthansa
partners. Similar to Jet2.com, this makes raw data pertaining solely to bmibaby very
difficult to obtain. For this reason, bmibaby is excluded from this study.
5.5.5 Flybe
While having relatively low airfares, Flybe operates as a Regional Airline, not an LLC.
This is evident in their recent code sharing agreement with Air France (Flybe, 2012).
For this reason, Flybe has been excluded from this study.
5.6 Conclusion
This thesis will record three individual studies with the aim of investigating Service
Quality in the low-cost airline industry in the United Kingdom. Each study will provide
a different perspective for assessing Service Quality. While this thesis assumes there
are no perfect measures of Service Quality, each measure has its own relative
advantages and disadvantages. SERVQUAL, while being cumbersome, does have the
advantage of being easily understood and accepted by academics and practitioners.
SERVPERF is a lightweight measure for Service Quality built around the same five
dimensions as SERVQUAL. HiQUAL is theoretically sound, but it has seen little
adoption in academic literature or industry practice. There is no ideal method for
constructing a comparable metric for quality in a given industry. Again, this is largely
because there can never be enough data to fill all of the variables needed to measure
customer preferences in a given service industry. Any comparable, industry specific
141
measurement of Service Quality can only use the data that is available. Therefore, a
“best fit” approach is the most reasonable expectation for measuring Service Quality
(Robertson, 2002).
It may be possible to reconstruct the AQR in a UK context. Doing so would
provide the UK market with an objective measurement of Service Quality that produces
longitudinally comparable outputs and is easily calculated and understood. However,
reconstructing this metric to fit the UK market is a challenge, particularly because UK
passengers may value different aspects of the airline experience than US passengers,
therefore requiring a re-examination of the metric’s variables. Additionally, the
reporting process for airline statistics may be different in the UK than the US and this
could potentially limit the collection of the necessary data.
142
CHAPTER SIX: A QUANTITATIVE MEASUREMENT
6.1 Introduction
The second aim of this thesis asks: can traditional quantitative methods of measuring
Service Quality be adapted to fit the low-cost airline industry context? This is
important as it continues the debate on qualitative scales within the Service Quality
literature. This chapter fulfils this objective by using an accepted quantitative method
of Service Quality to measure Service Quality in the UK low-cost airline industry. By
using this method, a quantitative representation of the value of specific variables
relating to quality in this context can be presented. The previous Chapter examined the
determinants of Service Quality from a qualitative perspective; this Chapter will
examine Service Quality through a quantitative lens. The quantitative lens allows for
the assessment of the relationship between different factors of Service Quality. This
Chapter represents a complete study and will utilise a somewhat neglected hierarchical
measurement of Service Quality (HiQUAL).
Chapter Four outlined several inconsistencies in the application of modern
Service Quality measurements. The most prominent of these is the discrepancy over
the disconfirmation paradigm and the need to measure Performance in Service Quality
scales. Another inconsistency is the long-standing argument between the Nordic and
American schools. Brady and Cronin’s hierarchical model HiQUAL was developed to
unify the theory found in Nordic and American schools and to resolve many of the
discrepancies in Service Quality research by combining the two schools of thought
(Brady & Cronin, 2001). The development of HiQUAL negates the need to measure
“Gaps” in the service encounter, and by offering measures of technical and functional
quality it integrates both the Nordic and American schools within its design thereby
creating a more holistic scale. Furthermore, the hierarchical structure of the scale
143
allows for the examination of Service Quality in greater depth than one-level scales.
Unfortunately, because of an often unjustifiable dedication to using SERVQUAL and
other gap-models in Service Quality research, this highly developed metric has since
gone unused in practise. While there are some instances of researchers constructing
similar models that appear to resemble HiQUAL (Dagger, Sweeney, & Johnson, 2007;
Ko & Pastore, 2005), there is limited direct application of the HiQUAL model in the
literature.
Previous Chapters cover the construction of HiQUAL and the reasons why it has
been chosen for examining Service Quality in the UK low-cost airline industry.
HiQUAL was chosen for it’s performance-only characteristics and hierarchical
structure that had also been identified in the airport industry. HiQUAL contains a total
of thirty-five items that intend to capture consumers' evaluations of twelve factors
relating to Service Quality (second-order dimensions include Interaction Quality,
Service Environment Quality and Outcome Quality, third-order dimensions include
Attitude, Behaviour, Expertise, Ambient Conditions, Design, Social Factors, Waiting
time, Tangibles and Valence). Most of the questions are designed to capture
measurement of Reliability (r), Responsiveness (sp), or Empathy (em). These elements
were taken from the popular SERVQUAL model. The HiQUAL model seeks to add
another dimension to the SERVQUAL factors by determining what is Reliable,
Responsive and Empathetic (as illustrated in Chapter Five).
The numerical outputs in the HiQUAL study allow the results to be inherently
more quantitative than those produced by the content analysis study conducted in
Chapter Seven. However, HiQUAL still relies on consumer’s opinions, which are
naturally susceptible to bias (Bertrand and Mullainathan, 2001). Brady and Cronin
(2001) developed HiQUAL as a global measure of Service Quality (p.55). Therefore,
slight modification of the HiQUAL model is necessary to fit the context if the low-cost
carrier airline industry. However, Brady and Cronin (2001) did not specify how to
modify HiQUAL, or to what degree the scale would need to be modified to fit a specific
144
industry. Therefore, this study will examine the verbiage of the HiQUAL items for
their fit with the low-cost airline industry context in the following section. Following
modification, the survey will be distributed, data collected and analysed to determine if
the data fits the HiQUAL framework.
The findings of this study illustrate the hierarchical structure of Service Quality
in the UK low-cost airline industry. This benefits the Service Quality literature by
furthering the understanding and application of hierarchical models. Additionally, the
path analysis provides industry professionals with a clear picture of the relationship
among the components of Service Quality in this context.
6.2 HiQUAL Framework
The HiQUAL Framework consists of three second-order sub-dimensions and nine
third-order dimensions, which give the scale a hierarchical structure. The following
section will describe in detail the hypothetical framework of the HiQUAL scale.
6.2.1 Interaction Quality
The interaction between customer and service provider (the employee-customer
interface) is a key element to understanding Service Quality (Czepiel, 1990). Some of
the literature views Service Quality as being a process oriented variable (Surprenant
and Solomon, 1987), especially within the airline industry (Chen and Chang, 2004).
This means that Service Quality, in this context, may be dependent on the interaction
with the service provider during the process, rather than simply the outcome.
Brady and Cronin (2001) agree that three factors contribute to the Interaction
Quality: Attitude (Bitner, 1990; Grönroos, 1990), Behaviours (Grönroos, 1990), and
Expertise (Grönroos, 1990). The section consists of eleven questions measured on a
seven point Likert scale. Each of these sub-dimensions (Attitude, Behaviours and
145
Expertise) is supported with three items relating to Reliability, Responsiveness, or
Empathy.
The hypothetical framework for Interaction Quality is as follows:
H1: Perceptions of interaction quality are positively related to perceived
Service Quality.
H2: Perceptions of Employee attitudes directly influence the quality of service
interactions.
H3: Perceptions of employee behaviour directly influence the perceived
quality of service interactions.
H4: Perceptions about employee expertise directly influence the quality
of service interactions.
6.2.2 Service Environment Quality
As a service is consumed within a servicescape, it is rational to assume that
Environmental Quality will have an effect on the total perception of Service Quality.
Brady and Cronin cite strong support in the literature for measuring Service
Environment Quality (Brady & Cronin, 2001). This is largely because most services
(particularly in the case of the airline industry) require the consumer to be present
during the consumption process making them subject to the elements of the service
environment. The quality of the environment in which the service is provided will have
an effect on the consumers’ overall perception of Service Quality (Bitner,1992).
Brady and Cronin (2001) identify three factors that affect overall
Environmental Quality: Ambient Conditions, Facility Design, and Social Factors. Each
of these is measured in the survey with three items capturing Reliability,
Responsiveness, and Empathy.
In this study, Ambient Conditions refers to anything non-visual that may affect
the passengers’ perception of Environmental Quality. Smell, temperature, and noise
146
are great examples. These factors can be highly influential in passengers' perceptions of
environmental quality (Baker, 1996; Bitner, 1992; Brady and Cronin, 2001) and are
particularly impactful within the enclosed cabin space of an aircraft. Additionally,
many of the contributors to these factors are within the control of the airline. Cabin
crew frequently adjust atmospheric temperature and pressure to ensure optimal
comfort. Noise can be compensated for and reduced during the construction of the
airline, for example: many of today's modern aircraft are fitted with high efficiency
engines and winglets that not only increase fuel economy but also reduce noise.
Conversely, many older aircraft of the same type tend to not have these devices and are
much louder.
It may seem that many aspects of the LCC servicescape are out of the control of
the airline (for example, screaming children or obtrusive passengers in neighbouring
seats). However, the airline can provide a positive environment where such annoyances
may be minimised. Therefore, the customer’s overall perception of the environment is
more positive. Furthermore, even though LCCs typically uses the same equipment (like
the very popular Boeing 737), each aircraft cabin is fairly customisable in the number of
rows of seats, seat reliability, leg room and colour scheme which can all affect
passenger comfort. Comfort is essential to Service Quality in many service industries as
well as transportation services (Larrabee and Boldon, 2001; Richards, 1980). As
passenger comfort is at the direct control of the airline, it is essential to try to
understand the consumer's perception of the service environment and Service
Environment Quality may be reflective of the level of comfort.
Brady and Cronin also identified Facility Design as a factor that affects overall
Environmental Quality. To aid in the validity of this section the questions were
modified to better fit the airline context; “Facility Design” now refers to “Cabin
Design”. Cabin Design can affect perceived Environmental Quality from both a
functional and aesthetic perspective. Functionally, the design of the chair is most likely
to have the biggest influence on Environmental Quality (such as the ability to recline
147
and the addition of adjustable headrests). Overhead cabin space (which has the
potential to reduce or enhance claustrophobic-type feelings) is also a major functional
contributor to Cabin Design. Aesthetically, details from the seat material to window
size can affect Environmental Quality. A principal contributor to the aesthetic Cabin
Design is the colour scheme. Traditional airlines are often viewed as having a superior
cabin design to LCCs. KLM for example integrates a variety of complementary colours
randomly throughout their cabin space as this results in a more personalised, richer
environment. LCCs are often known for their garish colour schemes (such as Ryanair’s
yellow and EasyJet’s orange colour themes), which can detract from the Environmental
Quality experience. However, in 2016 Ryanair revealed a re-designed cabin space for
their aircraft. The seats are now a more uniform dark blue, with a yellow band
surrounding the headrest. This change moves the design style closer to that of
traditional carriers such as British Airways, which should improve Environmental
Quality for passengers by providing a more modern, relaxed interior.
Social Conditions was a further factor that Brady and Cronin identified as
affecting Environmental Quality. Social Conditions, in this context, refers to other
consumers’ opinions of the service. These can have a strong impact on the passengers’
overall perception of the service environment (Baker, 1996; Brady and Cronin, 2001).
Such things as disgruntled passengers or crying children are good examples of how
some social conditions can have a negative effect on the consumers' perceptions of the
service environment. Likewise, pleased passengers, or a friendly employee could have a
positive impact on this dimension. Social Conditions have the potential to have a
cumulative effect: a more positive experience from other influences (such as boarding
the aircraft) can result in better behaviour and happier surrounding passengers and
staff, or a more negative experience (for example, through imposed fees) can result in
the reverse. Even if some elements of the Environmental Quality is out of the control of
the service provider, it is nonetheless relevant to the consumers’ overall perception of
Service Quality (Baker, 1986; Baker, Grewal, and Parasurman, 1994; Bitner, 1990).
148
The hypothetical framework for Service Environment Quality is:
H5: Service Quality is directly affected by physical environment quality.
H6: Ambient conditions within the servicescape directly affect the
Service Quality of the environment.
H7: Facility design directly affects perceived environmental quality.
H8: Social conditions have a direct influence in perceived environmental
quality.
6.2.3 Outcome Quality
Technical Quality (Carman, 2000; Grönroos, 1982, 1984, 1992; Rust and Oliver, 1994)
is the actual result of the service encounter. Brady and Cronin measure this as Outcome
Quality. In the HiQUAL Model it is a function of three sub-dimensions: Waiting Time,
Tangibles, and Valence. Waiting time in this study, refers to waiting time for cabin
service on-board the aircraft. This is stressed in the survey with the modifications of
some of the questions, as it is important that respondents do not confuse waiting-time
with time spent in the airport or flight delays. There is also a significant amount of
literature to support the influence of perceived Waiting Time on consumer buying
behaviour (Hornik, 1984).
The second sub-dimension of Outcome Quality is Tangibles. There is some
support to warrant the inclusion of a tangible measurement (Chen and Chang, 2004)
when measuring airline quality. However, this is based on a study of traditional carriers
and Tangibles should similarly be examined into the low-cost airlines industry. Recent
research has shown that tangibles play heavily in the perceived Service Quality within
some low-cost airline markets in Korea (Kim and Lee, 2011). This determination was
arrived via SERVQUAL, not a performance-only metric. As well, the Korean LCA
market differs greatly from the UK LCA market in respect to tangibility. This makes
149
tangibles an area of special interest when examining Service Quality in the UK LCA
market.
Valence is an all-encompassing measurement of the service outcome. It
“captures attributes that control whether the customers believe the service was good or
bad, regardless of their evaluation of any other aspect of the experience” (Brady and
Cronin, 2001, p. 40). This variable controls for factors that are outside of the control of
the firm, yet still influence the passenger's perception of the outcome, for example,
flight cancellations due to severe weather. Valence captures the overall attitude toward
the service provider. Including this factor ties together some long held beliefs by the
Service Quality literature that perceived Service Quality is similar to an attitude
(Cronin and Taylor, 1992; Parasurman, Zeithaml and Berry, 1985,1988). However,
measuring Service Quality as an attitude was not included in any of the popular Service
Quality metrics (SERVQUAL or SERVPERF) until Brady and Cronin’s (2001) model.
All of the factors originally identified in HiQUAL may be present when applied
to the airline industry. However, it is important to implement HiQUAL as completely
as possible as this will allow the analysis to determine how, and to what degree, each of
these factors relate to the airline industry.
The hypothetical framework for Outcome Quality is:
H9: The outcome directly influences the Service Quality of the service.
H10: Perceptions of Waiting Time directly influence the perceived
outcome quality.
H11: Perceptions of the tangible evidence directly influence the service
outcome quality.
H12: The Valence of the Service encounter directly influences service
outcome quality.
150
6.3 Survey Construction
6.3.1 Initial Questions
The survey begins with two questions to segregate the respondents into groups:
Have you flown with either of the following airlines: Ryanair or EasyJet?
How often do you take flights on one of these air carriers?
The first question is a disqualifying question in order to negate respondents
who have not flown on Ryanair or EasyJet within the last 12 months. The second
question allows for further sorting of the results based on amount of experience.
6.3.2 HiQUAL Questions
Because the original HiQUAL instrument was designed as a global measurement of
Service Quality it required slight modification of its verbiage to fit the airline industry.
This involved rewording some of the items to fit the context and provide clarity. The
original text appears below in italic and modifications appear in brackets. In all
instances, the “XYZ corporation” used in Brady and Cronin’s (2001) original survey has
been replaced with “the Airline.” A full copy of the survey form can be found in
Appendix III.
The HiQUAL instrument consists of each of the three second-order factors of
Service Quality (Interaction Quality, Service Environment Quality and Outcome
Quality) across two initial items. The third-order factors (Attitude, Behaviour,
Expertise, Ambient Conditions, Design, Social Factors, Waiting Time, Tangibles and
Valence) are then measured across three items; however, each of these items is
designed to capture the Reliability, Responsiveness or Empathy of each factor. The
following sections describe the HiQUAL instrument broken down by second-order
factors.
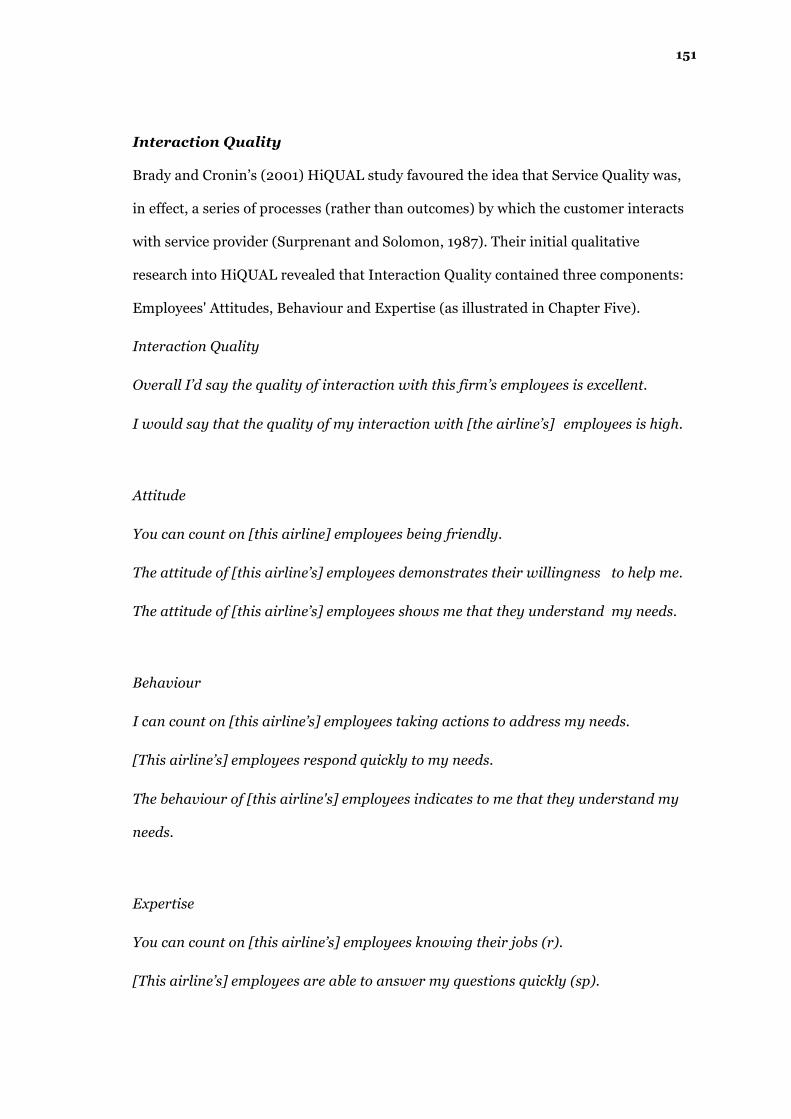
151
Interaction Quality
Brady and Cronin’s (2001) HiQUAL study favoured the idea that Service Quality was,
in effect, a series of processes (rather than outcomes) by which the customer interacts
with service provider (Surprenant and Solomon, 1987). Their initial qualitative
research into HiQUAL revealed that Interaction Quality contained three components:
Employees' Attitudes, Behaviour and Expertise (as illustrated in Chapter Five).
Interaction Quality
Overall I’d say the quality of interaction with this firm’s employees is excellent.
I would say that the quality of my interaction with [the airline’s] employees is high.
Attitude
You can count on [this airline] employees being friendly.
The attitude of [this airline’s] employees demonstrates their willingness to help me.
The attitude of [this airline’s] employees shows me that they understand my needs.
Behaviour
I can count on [this airline’s] employees taking actions to address my needs.
[This airline’s] employees respond quickly to my needs.
The behaviour of [this airline's] employees indicates to me that they understand my
needs.
Expertise
You can count on [this airline’s] employees knowing their jobs (r).
[This airline’s] employees are able to answer my questions quickly (sp).
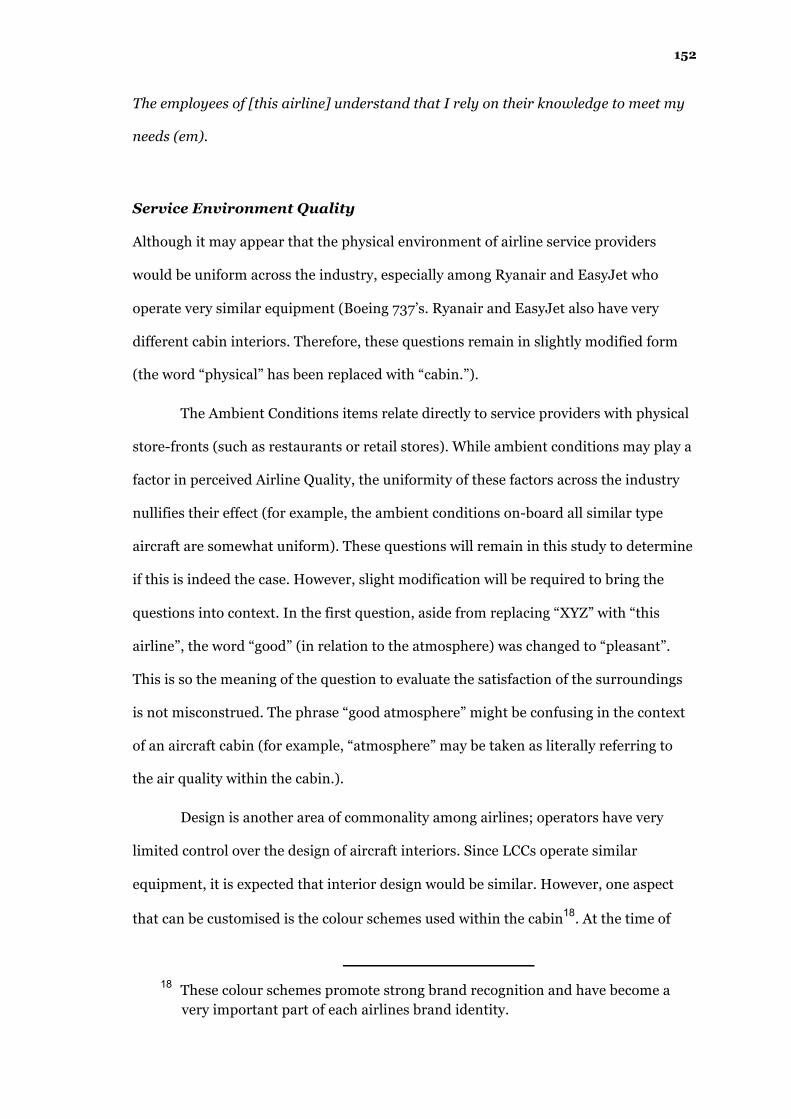
152
The employees of [this airline] understand that I rely on their knowledge to meet my
needs (em).
Service Environment Quality
Although it may appear that the physical environment of airline service providers
would be uniform across the industry, especially among Ryanair and EasyJet who
operate very similar equipment (Boeing 737’s. Ryanair and EasyJet also have very
different cabin interiors. Therefore, these questions remain in slightly modified form
(the word “physical” has been replaced with “cabin.”).
The Ambient Conditions items relate directly to service providers with physical
store-fronts (such as restaurants or retail stores). While ambient conditions may play a
factor in perceived Airline Quality, the uniformity of these factors across the industry
nullifies their effect (for example, the ambient conditions on-board all similar type
aircraft are somewhat uniform). These questions will remain in this study to determine
if this is indeed the case. However, slight modification will be required to bring the
questions into context. In the first question, aside from replacing “XYZ” with “this
airline”, the word “good” (in relation to the atmosphere) was changed to “pleasant”.
This is so the meaning of the question to evaluate the satisfaction of the surroundings
is not misconstrued. The phrase “good atmosphere” might be confusing in the context
of an aircraft cabin (for example, “atmosphere” may be taken as literally referring to
the air quality within the cabin.).
Design is another area of commonality among airlines; operators have very
limited control over the design of aircraft interiors. Since LCCs operate similar
equipment, it is expected that interior design would be similar. However, one aspect
that can be customised is the colour schemes used within the cabin18. At the time of
18 These colour schemes promote strong brand recognition and have become a very important part of each airlines brand identity.
153
survey distribution, Ryanair supported a distinctive interior design, with dark blue and
very bright yellow colour themes, safety briefing cards that are glued to the back of the
seat, and removed window shades. EasyJet had a more traditional approach with its
soft orange colour themes and the addition of business class seating.
Other passengers may have the potential to affect how passengers evaluate their
overall experience with an airline (such as seeing a passenger mistreated by airline staff
could lead to a negative impression of the airline). With large numbers of passengers
sitting or queueing within close proximity of each other, flying is inherently a semi-
social experience. This makes this line of questions extremely interesting in this
context. It will be interesting to see to what degree the social elements of the air travel
affect passengers’ overall perception of airline quality. To date, HiQUAL is the only
Service Quality instrument to take social factors into account.
Service Environment Quality
I would say that [this airline’s] [cabin] environment is one of the best in the industry.
I would rate [this airline's] [cabin] environment highly.
Ambient Conditions
At, [this airline], you can count on their being a [pleasant] atmosphere [within the
cabin].
[This airline's] [cabin] layout serves my purposes.
[This airline] understands the design of its [aircraft cabin] is important to me.
Design
[This airline’s] [cabin] layout never fails to impress me.
[This airline’s] [cabin] layout serves my purposes.
154
[This airline] understands the design of [the cabin] is important to me.
Social Factors
[This airline’s} other customers do not affect its ability to provide me with good
service.
[This airline] understands that other patrons affect my perception of its service.
I find [this airline’s] other customers consistently leave me with a good impression of
its service.
Outcome Quality
Outcome Quality is probably the least understood of the three sub-dimensions of
Service Quality in this context. This may be because the outcome quality of passage on
an airline is not often as varied as in other service sectors (for example: when getting a
haircut). The outcome of a flight on an airline is the safe arrival at the destination
airport (preferably on time). Waiting Time could also be likened to an airline’s On-
Time Performance, an important factor in the AQR.
Outcome Quality
I always have an excellent experience when I [fly with] [this airline].
I feel good about what [this airline] provides [for] its customers.
Waiting Time
Waiting time at [this airline] is predictable.
[This airline] tries to keep waiting time to a minimum.
This [airline] understands that waiting time is important to me.
155
Tangibles
The following questions require the respondent to think of an important aspect of
airline service and then evaluate their airline based their perception of the service.
I am constantly pleased with the ______ at [this airline].
I like [this airline] because it has the ______ that I want.
[This airline] knows the kind of ______ its customers are looking for.
Valence
Directions: These questions refer to whether you think the outcome of your experience
was either good or bad. Please choose the number which best reflects your perception
of whether the experience was good or bad.
When I leave [this airline], I usually feel that I have had a good experience.
I believe [this airline] tries to give me a good experience.
I believe [this airline] knows the type of experience its customers want.
Service Quality
Finally, HiQUAL measures Service Quality directly across two items:
I would say that [this airline] provides superior service.
I believe [this airline] offers excellent service.
6.3.3 Additional Questions
In addition to the HiQUAL framework, this survey included several questions relating
to the passengers’ experience. These questions were generated from the qualitative
study (Chapter Seven). Each of the determinants identified in the qualitative study
were transformed into general questions about the experience. These questions were
included for a deeper understanding of the themes discovered in the content analysis
156
study. Each response was then evaluated on a five-point Likert-type scale from Not
Important to Very Important with the middle value a No Opinion option.
This section recorded opinions on seven variables: On-Time Performance,
Ticket Price, In-Flight Services, Aircraft Cabin Crowdedness, Route Capacity, Allocated
Seating and Baggage Policy. These questions were evaluated separately from HiQUAL
later in this thesis (Chapter Eight) during the construction of ALSI. The justification for
these variables comes from the qualitative study in Chapter Seven and the AQR (Bowen
& Headley, 2007; Bowen et al., 1991, 1992; Bowen & Headley, 1993).
6.4 Data Collection
6.4.1 The Population
The domain of this study was anyone who had flown on a LCC operating within the
United Kingdom. The geographic restriction was implemented to later help in the
collection and consistency of the secondary data (as data would only have to be
collected in the UK) that was to be used to develop the purely objective measurement of
LCC Service Quality in Chapter Eight. The UK’s Civil Aviation Authority (CAA) collects
different data than some of its European counterparts. Corporate annual filings was
also utilised as a source of secondary data. It is preferable to use data from the same
nation as accounting procedures can vary widely, even within the European Economic
Area. This allowed for more consistency in the data for the later study.
6.4.2 The Sample
This study employed two non-probability sampling techniques: convenience sampling
and snowball sampling. The frame (indirect-element) for the convenience sample was
students and staff at major Scottish Universities. This cross-section was chosen largely
157
for ease of access. The snowball effect comes from distribution through popular social
networking websites (in this case, Facebook).
The convenience and snowball sampling techniques was largely expected to
reach university students. A student sample may be representative of the future of the
airline consumer market (Helm, 2013). Furthermore, all LCCs identified in this study
have multiple routes departing from Edinburgh International, Glasgow International,
or Prestwick airports which are easily accessible to the students surveyed in this study.
The survey was initially distributed to staff and students at Scottish universities via
email. The survey was also posted to the University of Stirling’s student web portal
where it appeared on each student’s home page. This site is readily accessed by
university students and frequently hosts student surveys. The University hosts over
11,600 students (8,200 undergraduate and 3,400 post-graduate) from 115
nationalities, all of which have easy access to the University's highly visible student
portal. This diversity made this a very attractive sampling pool.
The snowball sampling strategy placed the survey on popular social media
websites and asked members to take the survey and share it with friends. It is possible
that this reached a wider audience outside of the University of Stirling and allowed for
non-students to take the survey. However, it was expected that the majority of
respondents would be current university students or recent graduates. While the
majority of respondents were expected to be students, non-students were also welcome
to respond.
Posting the survey to aviation specific forums was also considered. While these
forums could provide an ideal audience for the survey, this idea proved difficult for two
reasons: firstly, it was very difficult to get attention from many of the forums as many
of them have strict guidelines for posting. Online forums typically have personalised
communities; to receive enough responses to a survey, it would be necessary to become
familiar to that community through regular posting on the forum. Secondly, the
158
forums that could be receptive were usually extremely biased towards the LCC industry
or one of its players (for example, the website: IHateRyanair.com). Due to these
reasons, the idea of forum specific posting was abandoned.
Google recently introduced a new product to help market researchers: Google
Surveys. The survey distribution is through a mobile application created by Google
whereby the user is paid (as a credit to their Google Play Store account) for responding.
Google also applies its own proprietary demographic collection methods to each survey
and offers an analysis service. This could be a very powerful tool to researchers;
however, at £3.50 per response for every ten questions, this service is cost prohibitive
for this application.
The questionnaire was administered in electronic form. The questions and
appropriate scales were re-created as a spreadsheet “form” in Google Documents. This
web-based software had the advantage of being easy to distribute through electronic
channels, while instantaneously recording the results of the survey. Additionally, as
this is a web-based Google product, the content is secure (possibly more so than if
stored locally) and easily accessible from any location.
6.4.3 Analysis of the Data
The data from the survey was compiled in an electronic form automatically as
responses were entered. Data was then stored as a spreadsheet. The data was easily
exportable to SPSS or other statistical software as needed. Analysis of the original
HiQUAL study employed LISERAL 8, a popular Structural Equation Modelling (SEM)
software package; however, this research utilised a comparable software package, IBM
SPSS Amos 19, because of its availability. The two packages are similar and should
produce similar results.
159
6.4.4 Distribution
The survey was circulated to students outside the University of Stirling through email
contact during May, 2014. The business school administrators for The University of
Glasgow, The University of St. Andrews, The University of Edinburgh and The
University of Aberdeen agreed to distribute the survey to their post-graduate students.
Napier University and Queen Margaret University were unable to help due to a lengthy
approval process from their ethics committees. Glasgow Caledonian University was
unwilling to help, yet did not specify a reason. Because of the difficulty of pushing a
survey to students, the response rate was relatively low at only 3.3% (n=5) of all
responses returned through the email campaign (see Section 7.4.5 Demographics of
Respondents for examination of this data).
Following distribution via email, the survey was posted to The University of
Stirling’s MyPortal. There were multiple responses per day for a period of around two
weeks. After this time, the frequency of incoming responses began to slow, largely
because the website only had space to promote two surveys at a time on the main page.
The survey could be accessed through the homepage, yet doing so required students to
actively seek the survey. Because the frequency of responses completely stopped once
the survey had disappeared from the homepage, it appeared that there might have been
impulsive behaviour driving the responses. Therefore, the survey was taken offline
with n=150 responses, once response frequency has diminished.
The sample (n=150) was initially screened for non-responses and unengaged
respondents as recommended (Pallant, 2010, p. 43). There were no errors, invalid or
missing cases in the data file. Only one survey response was incomplete. In this
situation, the respondent did not answer the initial screening question: “Have you
flown with one of these airlines: Ryanair or EasyJet?” After examining the respondents'
answers, it was determined that they indeed had flown with one of those airlines
(particularly because the answer to Q3 was Ryanair). Thus the response was altered to
160
include a “yes.” This was the only discrepancy in the data. All respondents seemed
engaged in answering the survey.
Descriptive statistics indicate normally distributed results across all of the
variables. Skewness was within the upper limits of what is generally accepted (+1 / -1).
Kurtosis of the individual items was also within acceptable limits (+1 / -1). However,
the sample size is large enough to reduce any risks associated with non-ketotic results
(Tabachnick and Fidell, 2007, p.80). The combined items demonstrated characteristics
of normalcy (Table 6.1) as the individual items. This characteristic of the data makes
examining the items grouped as variables (as opposed to on an individual basis) much
more attractive as these characteristics allow for the assumption of similar results
while decreasing confusion and reducing the overall chance of error.
Table 6.1
Descriptive Statistics for Survey Data
Descriptive Statistics
Factor
N
Mea
n
Mea
n SE
Stan
dard
D
evia
tion
Var
ianc
e
Skew
ness
Skew
ness
SE
Kur
tosi
s
Kur
tosi
s SE
Combined Expertise 150 5.047 0.108 1.322 1.748 -0.547 0.198 -0.113 0.394
Combined Tangibles 150 4.903 0.109 1.330 1.770 -0.551 0.198 -0.068 0.394
Combined Attitude 150 4.873 0.225 1.540 2.370 -0.991 0.347 0.337 0.681
Combined Interaction Quality
150 4.833 0.125 1.531 2.345 -0.691 0.198 -0.059 0.394
Combined Valence 150 4.747 0.122 1.492 2.225 -0.534 0.198 -0.305 0.394
Combined Waiting Time 150 4.693 0.125 1.527 2.331 -0.514 0.198 -0.215 0.394
Combined Behaviour 150 4.449 0.126 1.542 2.377 -0.459 0.198 -0.256 0.394
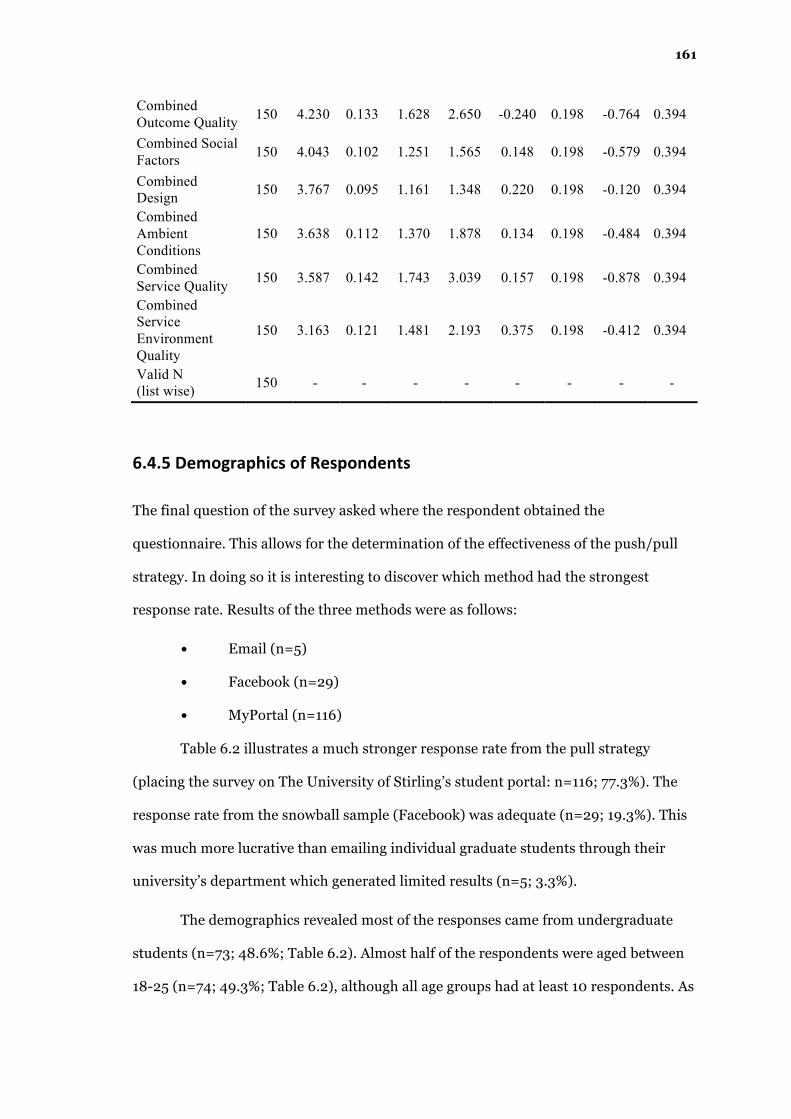
161
Combined Outcome Quality 150 4.230 0.133 1.628 2.650 -0.240 0.198 -0.764 0.394
Combined Social Factors 150 4.043 0.102 1.251 1.565 0.148 0.198 -0.579 0.394
Combined Design 150 3.767 0.095 1.161 1.348 0.220 0.198 -0.120 0.394
Combined Ambient Conditions
150 3.638 0.112 1.370 1.878 0.134 0.198 -0.484 0.394
Combined Service Quality 150 3.587 0.142 1.743 3.039 0.157 0.198 -0.878 0.394
Combined Service Environment Quality
150 3.163 0.121 1.481 2.193 0.375 0.198 -0.412 0.394
Valid N (list wise) 150 - - - - - - - -
6.4.5 Demographics of Respondents
The final question of the survey asked where the respondent obtained the
questionnaire. This allows for the determination of the effectiveness of the push/pull
strategy. In doing so it is interesting to discover which method had the strongest
response rate. Results of the three methods were as follows:
• Email (n=5)
• Facebook (n=29)
• MyPortal (n=116)
Table 6.2 illustrates a much stronger response rate from the pull strategy
(placing the survey on The University of Stirling’s student portal: n=116; 77.3%). The
response rate from the snowball sample (Facebook) was adequate (n=29; 19.3%). This
was much more lucrative than emailing individual graduate students through their
university’s department which generated limited results (n=5; 3.3%).
The demographics revealed most of the responses came from undergraduate
students (n=73; 48.6%; Table 6.2). Almost half of the respondents were aged between
18-25 (n=74; 49.3%; Table 6.2), although all age groups had at least 10 respondents. As
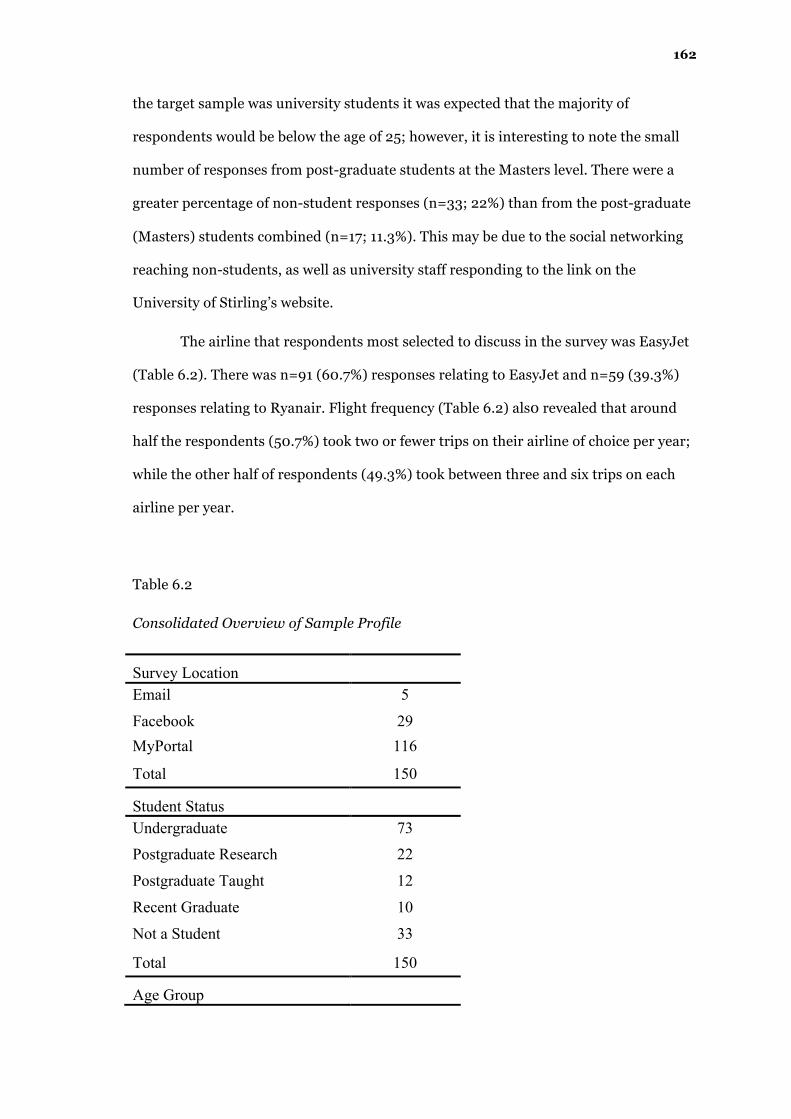
162
the target sample was university students it was expected that the majority of
respondents would be below the age of 25; however, it is interesting to note the small
number of responses from post-graduate students at the Masters level. There were a
greater percentage of non-student responses (n=33; 22%) than from the post-graduate
(Masters) students combined (n=17; 11.3%). This may be due to the social networking
reaching non-students, as well as university staff responding to the link on the
University of Stirling’s website.
The airline that respondents most selected to discuss in the survey was EasyJet
(Table 6.2). There was n=91 (60.7%) responses relating to EasyJet and n=59 (39.3%)
responses relating to Ryanair. Flight frequency (Table 6.2) als0 revealed that around
half the respondents (50.7%) took two or fewer trips on their airline of choice per year;
while the other half of respondents (49.3%) took between three and six trips on each
airline per year.
Table 6.2
Consolidated Overview of Sample Profile
Survey Location Email 5
Facebook 29 MyPortal 116
Total 150
Student Status Undergraduate 73 Postgraduate Research 22
Postgraduate Taught 12
Recent Graduate 10
Not a Student 33
Total 150
Age Group
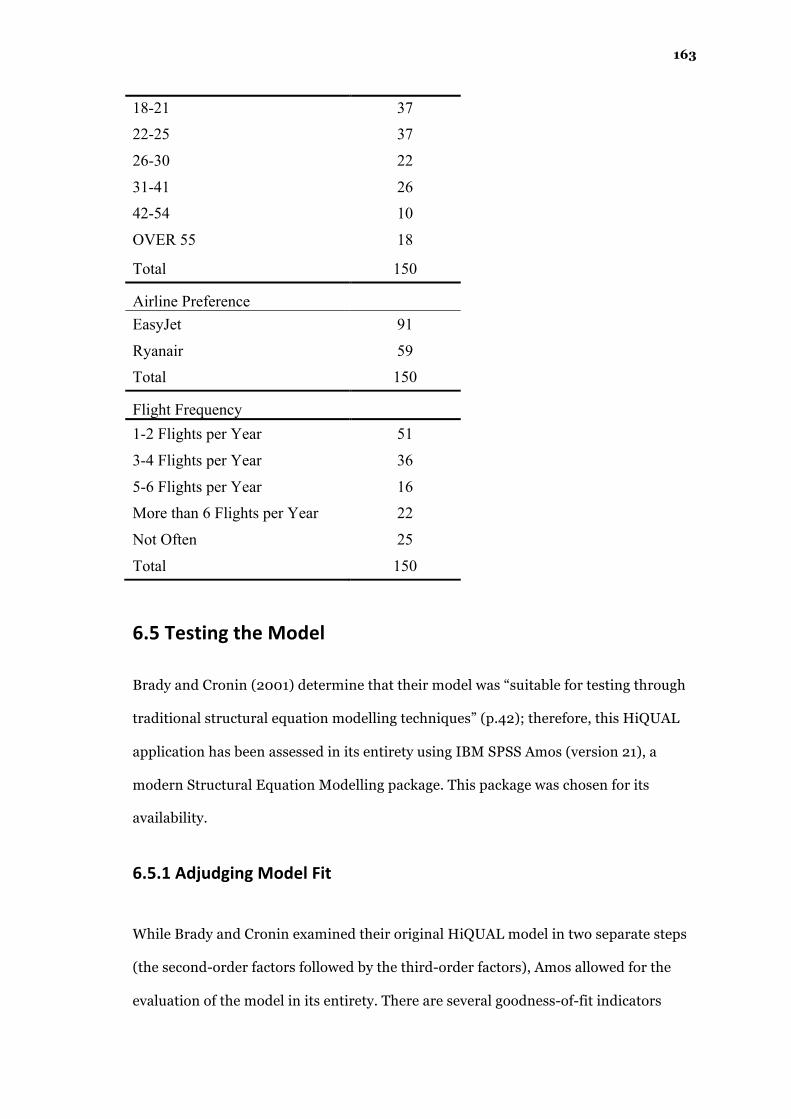
163
18-21 37 22-25 37
26-30 22
31-41 26 42-54 10
OVER 55 18
Total 150
Airline Preference EasyJet 91
Ryanair 59 Total 150
Flight Frequency 1-2 Flights per Year 51
3-4 Flights per Year 36
5-6 Flights per Year 16 More than 6 Flights per Year 22
Not Often 25
Total 150
6.5 Testing the Model
Brady and Cronin (2001) determine that their model was “suitable for testing through
traditional structural equation modelling techniques” (p.42); therefore, this HiQUAL
application has been assessed in its entirety using IBM SPSS Amos (version 21), a
modern Structural Equation Modelling package. This package was chosen for its
availability.
6.5.1 Adjudging Model Fit
While Brady and Cronin examined their original HiQUAL model in two separate steps
(the second-order factors followed by the third-order factors), Amos allowed for the
evaluation of the model in its entirety. There are several goodness-of-fit indicators
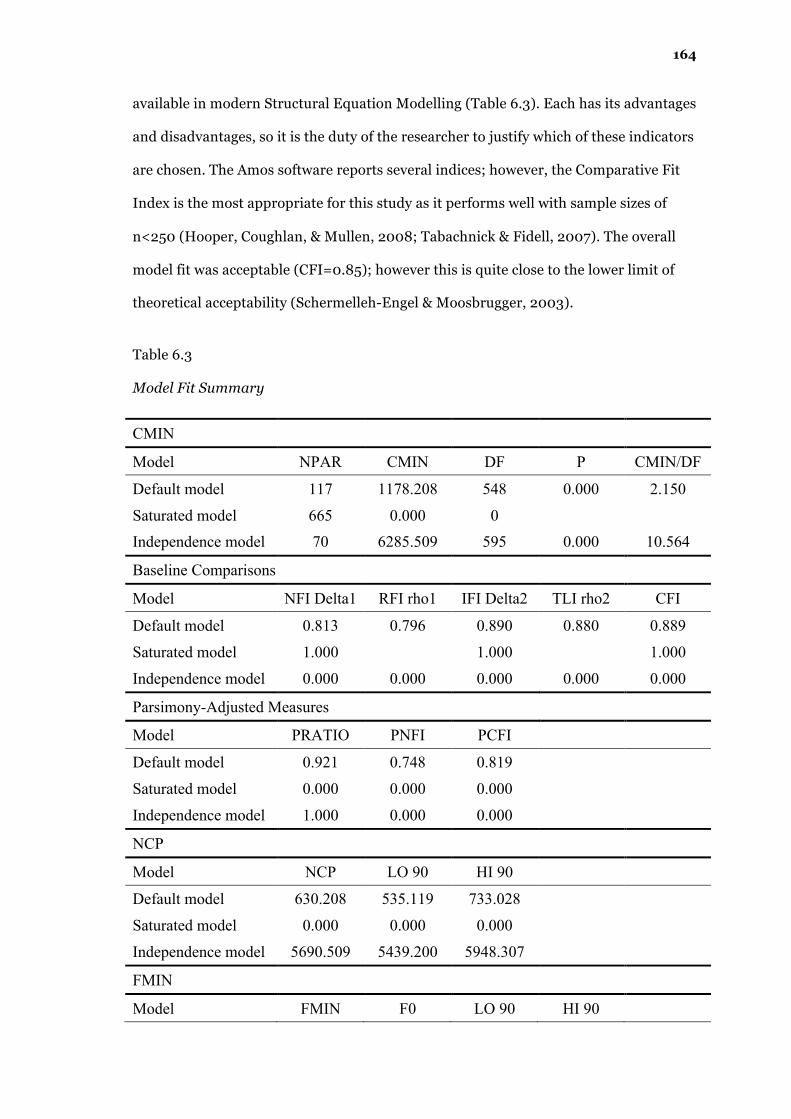
164
available in modern Structural Equation Modelling (Table 6.3). Each has its advantages
and disadvantages, so it is the duty of the researcher to justify which of these indicators
are chosen. The Amos software reports several indices; however, the Comparative Fit
Index is the most appropriate for this study as it performs well with sample sizes of
n<250 (Hooper, Coughlan, & Mullen, 2008; Tabachnick & Fidell, 2007). The overall
model fit was acceptable (CFI=0.85); however this is quite close to the lower limit of
theoretical acceptability (Schermelleh-Engel & Moosbrugger, 2003).
Table 6.3
Model Fit Summary
CMIN
Model NPAR CMIN DF P CMIN/DF
Default model 117 1178.208 548 0.000 2.150
Saturated model 665 0.000 0 Independence model 70 6285.509 595 0.000 10.564
Baseline Comparisons
Model NFI Delta1 RFI rho1 IFI Delta2 TLI rho2 CFI
Default model 0.813 0.796 0.890 0.880 0.889
Saturated model 1.000 1.000 1.000
Independence model 0.000 0.000 0.000 0.000 0.000
Parsimony-Adjusted Measures
Model PRATIO PNFI PCFI
Default model 0.921 0.748 0.819
Saturated model 0.000 0.000 0.000
Independence model 1.000 0.000 0.000
NCP
Model NCP LO 90 HI 90
Default model 630.208 535.119 733.028
Saturated model 0.000 0.000 0.000
Independence model 5690.509 5439.200 5948.307
FMIN
Model FMIN F0 LO 90 HI 90
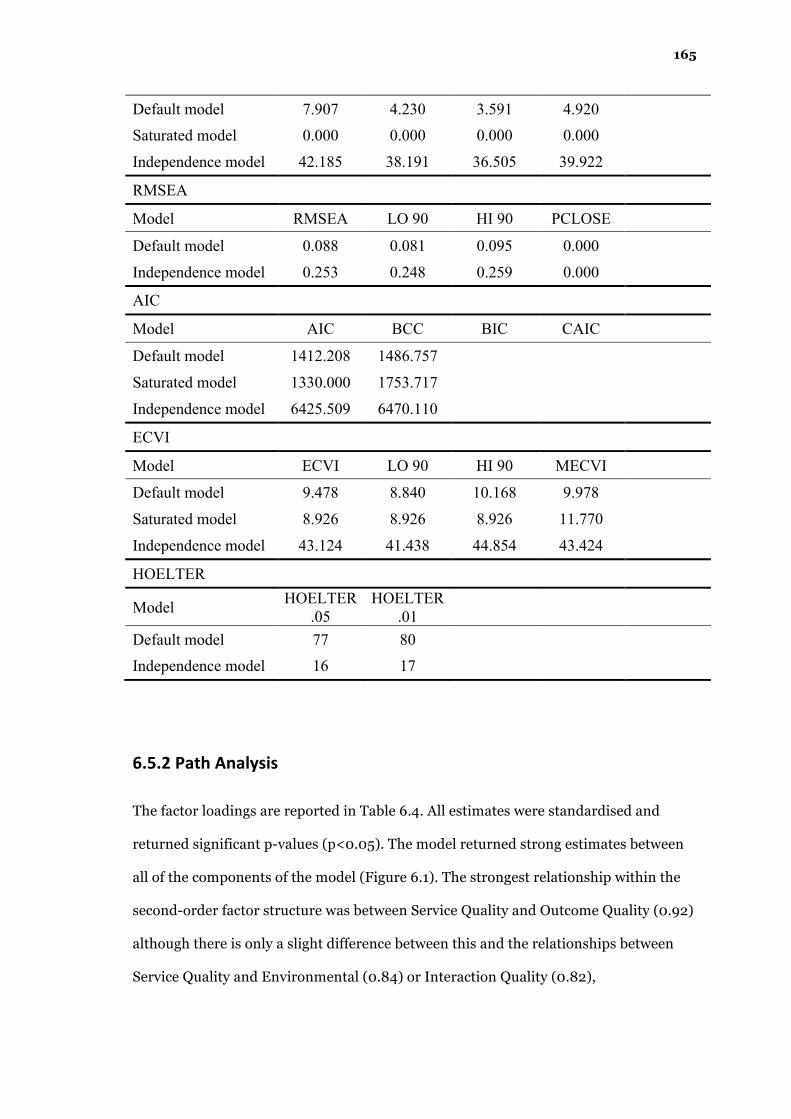
165
Default model 7.907 4.230 3.591 4.920 Saturated model 0.000 0.000 0.000 0.000
Independence model 42.185 38.191 36.505 39.922
RMSEA
Model RMSEA LO 90 HI 90 PCLOSE
Default model 0.088 0.081 0.095 0.000
Independence model 0.253 0.248 0.259 0.000
AIC
Model AIC BCC BIC CAIC
Default model 1412.208 1486.757
Saturated model 1330.000 1753.717
Independence model 6425.509 6470.110
ECVI
Model ECVI LO 90 HI 90 MECVI
Default model 9.478 8.840 10.168 9.978
Saturated model 8.926 8.926 8.926 11.770
Independence model 43.124 41.438 44.854 43.424
HOELTER
Model HOELTER .05
HOELTER .01
Default model 77 80 Independence model 16 17
6.5.2 Path Analysis
The factor loadings are reported in Table 6.4. All estimates were standardised and
returned significant p-values (p<0.05). The model returned strong estimates between
all of the components of the model (Figure 6.1). The strongest relationship within the
second-order factor structure was between Service Quality and Outcome Quality (0.92)
although there is only a slight difference between this and the relationships between
Service Quality and Environmental (0.84) or Interaction Quality (0.82),
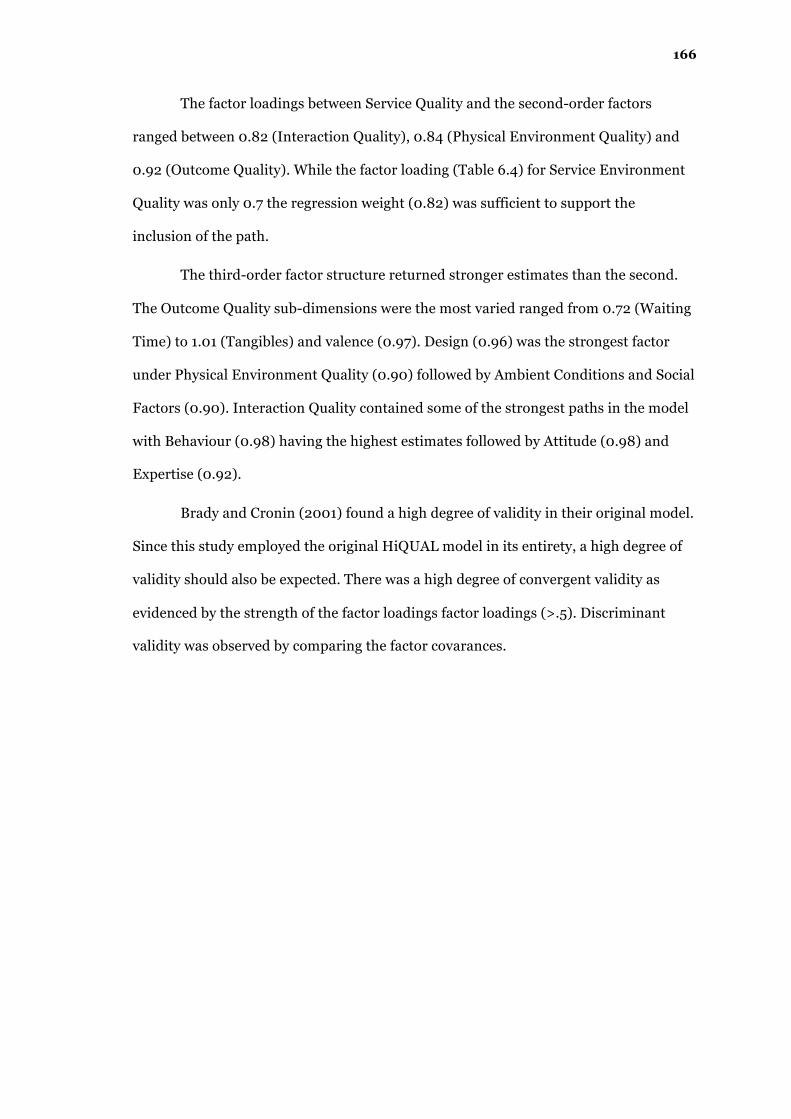
166
The factor loadings between Service Quality and the second-order factors
ranged between 0.82 (Interaction Quality), 0.84 (Physical Environment Quality) and
0.92 (Outcome Quality). While the factor loading (Table 6.4) for Service Environment
Quality was only 0.7 the regression weight (0.82) was sufficient to support the
inclusion of the path.
The third-order factor structure returned stronger estimates than the second.
The Outcome Quality sub-dimensions were the most varied ranged from 0.72 (Waiting
Time) to 1.01 (Tangibles) and valence (0.97). Design (0.96) was the strongest factor
under Physical Environment Quality (0.90) followed by Ambient Conditions and Social
Factors (0.90). Interaction Quality contained some of the strongest paths in the model
with Behaviour (0.98) having the highest estimates followed by Attitude (0.98) and
Expertise (0.92).
Brady and Cronin (2001) found a high degree of validity in their original model.
Since this study employed the original HiQUAL model in its entirety, a high degree of
validity should also be expected. There was a high degree of convergent validity as
evidenced by the strength of the factor loadings factor loadings (>.5). Discriminant
validity was observed by comparing the factor covarances.
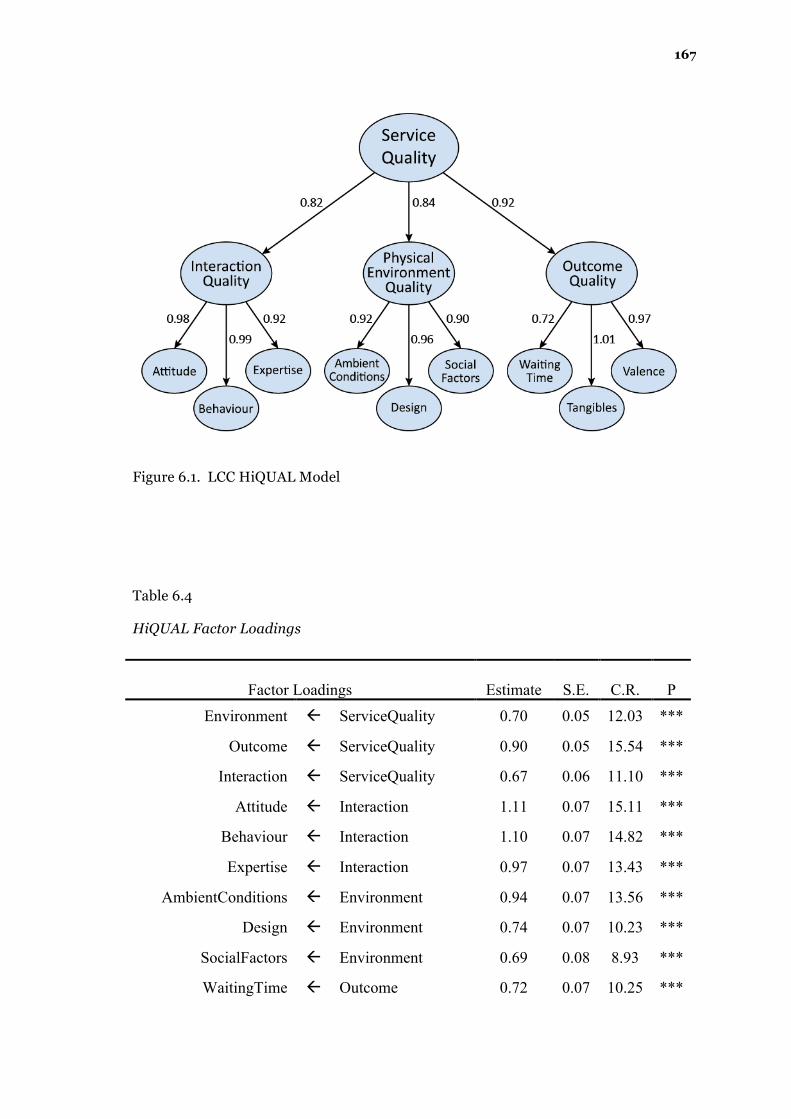
167
Figure 6.1. LCC HiQUAL Model
Table 6.4
HiQUAL Factor Loadings
Factor Loadings Estimate S.E. C.R. P Environment ! ServiceQuality 0.70 0.05 12.03 ***
Outcome ! ServiceQuality 0.90 0.05 15.54 ***
Interaction ! ServiceQuality 0.67 0.06 11.10 ***
Attitude ! Interaction 1.11 0.07 15.11 ***
Behaviour ! Interaction 1.10 0.07 14.82 ***
Expertise ! Interaction 0.97 0.07 13.43 ***
AmbientConditions ! Environment 0.94 0.07 13.56 ***
Design ! Environment 0.74 0.07 10.23 ***
SocialFactors ! Environment 0.69 0.08 8.93 ***
WaitingTime ! Outcome 0.72 0.07 10.25 ***
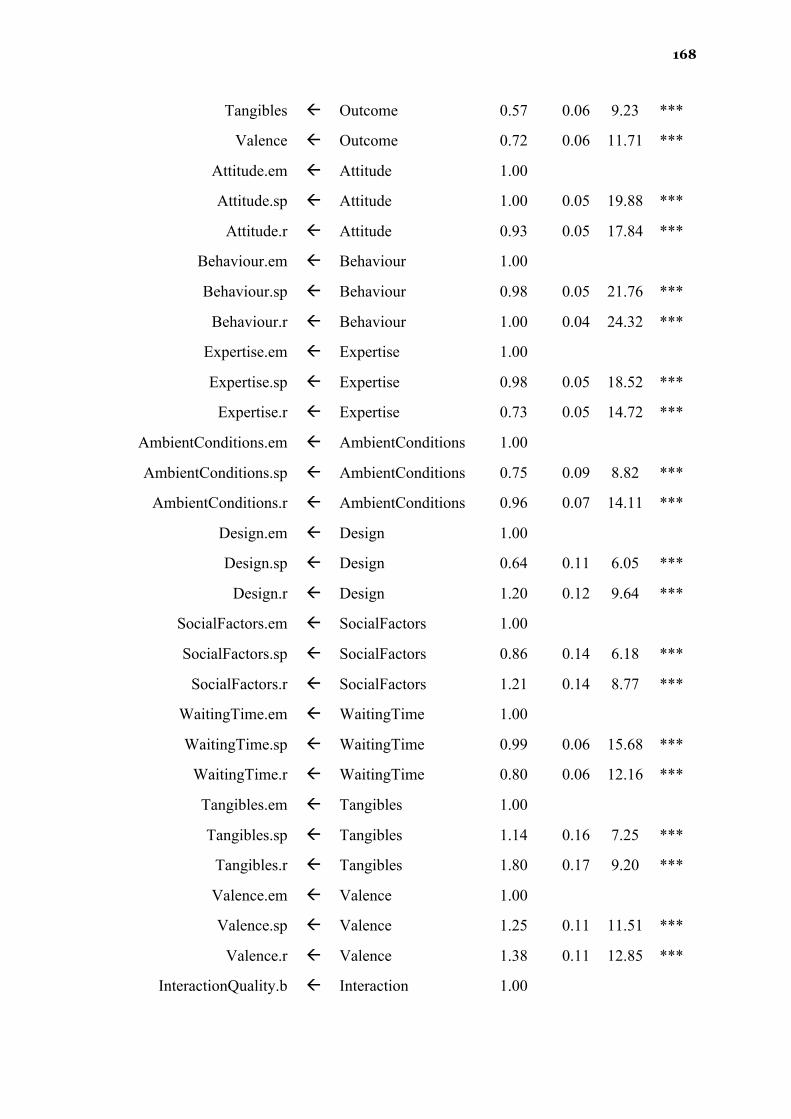
168
Tangibles ! Outcome 0.57 0.06 9.23 ***
Valence ! Outcome 0.72 0.06 11.71 ***
Attitude.em ! Attitude 1.00
Attitude.sp ! Attitude 1.00 0.05 19.88 ***
Attitude.r ! Attitude 0.93 0.05 17.84 ***
Behaviour.em ! Behaviour 1.00
Behaviour.sp ! Behaviour 0.98 0.05 21.76 ***
Behaviour.r ! Behaviour 1.00 0.04 24.32 ***
Expertise.em ! Expertise 1.00
Expertise.sp ! Expertise 0.98 0.05 18.52 ***
Expertise.r ! Expertise 0.73 0.05 14.72 ***
AmbientConditions.em ! AmbientConditions 1.00
AmbientConditions.sp ! AmbientConditions 0.75 0.09 8.82 ***
AmbientConditions.r ! AmbientConditions 0.96 0.07 14.11 ***
Design.em ! Design 1.00
Design.sp ! Design 0.64 0.11 6.05 ***
Design.r ! Design 1.20 0.12 9.64 ***
SocialFactors.em ! SocialFactors 1.00
SocialFactors.sp ! SocialFactors 0.86 0.14 6.18 ***
SocialFactors.r ! SocialFactors 1.21 0.14 8.77 ***
WaitingTime.em ! WaitingTime 1.00
WaitingTime.sp ! WaitingTime 0.99 0.06 15.68 ***
WaitingTime.r ! WaitingTime 0.80 0.06 12.16 ***
Tangibles.em ! Tangibles 1.00
Tangibles.sp ! Tangibles 1.14 0.16 7.25 ***
Tangibles.r ! Tangibles 1.80 0.17 9.20 ***
Valence.em ! Valence 1.00
Valence.sp ! Valence 1.25 0.11 11.51 ***
Valence.r ! Valence 1.38 0.11 12.85 ***
InteractionQuality.b ! Interaction 1.00
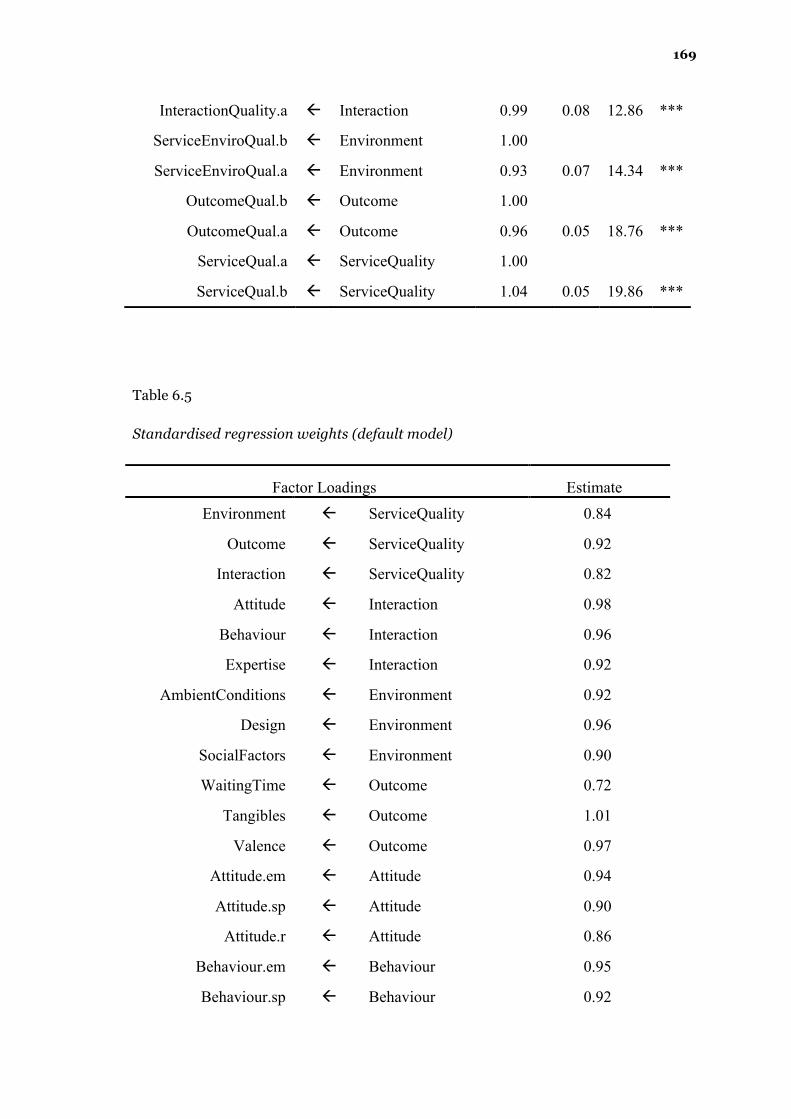
169
InteractionQuality.a ! Interaction 0.99 0.08 12.86 ***
ServiceEnviroQual.b ! Environment 1.00
ServiceEnviroQual.a ! Environment 0.93 0.07 14.34 ***
OutcomeQual.b ! Outcome 1.00
OutcomeQual.a ! Outcome 0.96 0.05 18.76 ***
ServiceQual.a ! ServiceQuality 1.00
ServiceQual.b ! ServiceQuality 1.04 0.05 19.86 ***
Table 6.5
Standardised regression weights (default model)
Factor Loadings Estimate Environment ! ServiceQuality 0.84
Outcome ! ServiceQuality 0.92
Interaction ! ServiceQuality 0.82
Attitude ! Interaction 0.98
Behaviour ! Interaction 0.96
Expertise ! Interaction 0.92
AmbientConditions ! Environment 0.92
Design ! Environment 0.96
SocialFactors ! Environment 0.90
WaitingTime ! Outcome 0.72
Tangibles ! Outcome 1.01
Valence ! Outcome 0.97
Attitude.em ! Attitude 0.94
Attitude.sp ! Attitude 0.90
Attitude.r ! Attitude 0.86
Behaviour.em ! Behaviour 0.95
Behaviour.sp ! Behaviour 0.92
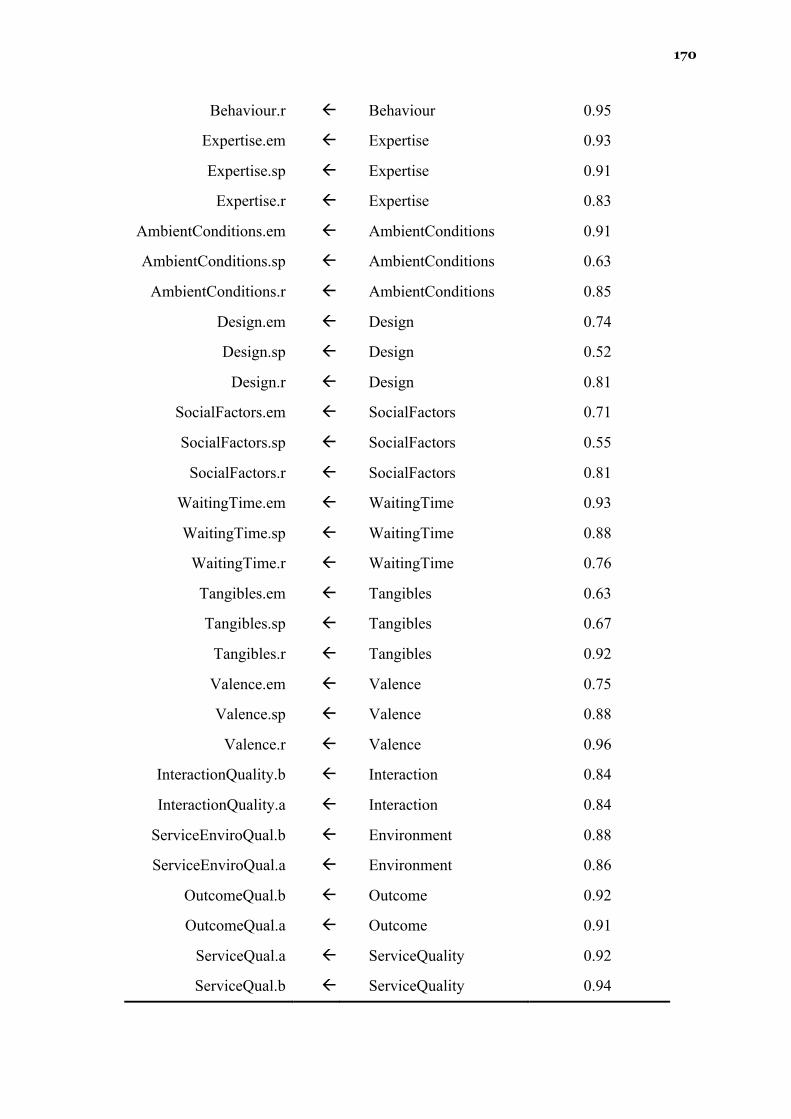
170
Behaviour.r ! Behaviour 0.95
Expertise.em ! Expertise 0.93
Expertise.sp ! Expertise 0.91
Expertise.r ! Expertise 0.83
AmbientConditions.em ! AmbientConditions 0.91
AmbientConditions.sp ! AmbientConditions 0.63
AmbientConditions.r ! AmbientConditions 0.85
Design.em ! Design 0.74
Design.sp ! Design 0.52
Design.r ! Design 0.81
SocialFactors.em ! SocialFactors 0.71
SocialFactors.sp ! SocialFactors 0.55
SocialFactors.r ! SocialFactors 0.81
WaitingTime.em ! WaitingTime 0.93
WaitingTime.sp ! WaitingTime 0.88
WaitingTime.r ! WaitingTime 0.76
Tangibles.em ! Tangibles 0.63
Tangibles.sp ! Tangibles 0.67
Tangibles.r ! Tangibles 0.92
Valence.em ! Valence 0.75
Valence.sp ! Valence 0.88
Valence.r ! Valence 0.96
InteractionQuality.b ! Interaction 0.84
InteractionQuality.a ! Interaction 0.84
ServiceEnviroQual.b ! Environment 0.88
ServiceEnviroQual.a ! Environment 0.86
OutcomeQual.b ! Outcome 0.92
OutcomeQual.a ! Outcome 0.91
ServiceQual.a ! ServiceQuality 0.92
ServiceQual.b ! ServiceQuality 0.94
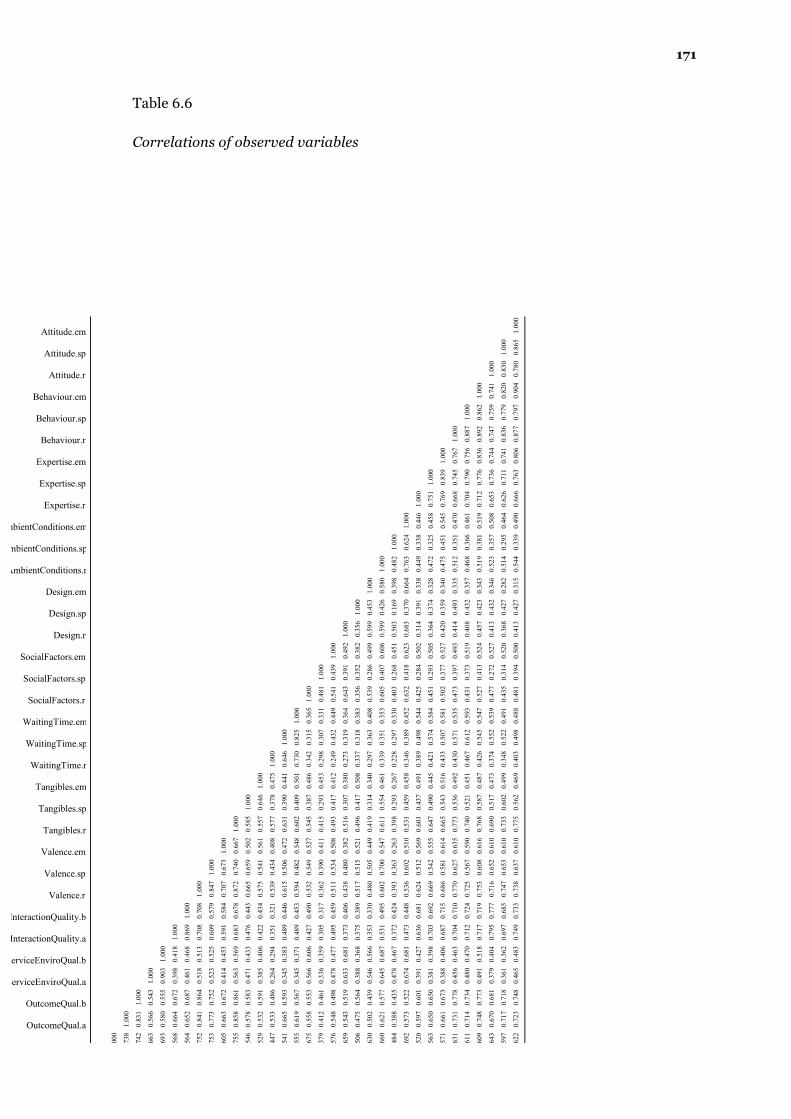
171
Table 6.6
Correlations of observed variables
ServiceQual.b
ServiceQual.a
OutcomeQual.a
OutcomeQual.b
ServiceEnviroQual.a
ServiceEnviroQual.b
InteractionQuality.a
InteractionQuality.b
Valence.r
Valence.sp
Valence.em
Tangibles.r
Tangibles.sp
Tangibles.em
WaitingTime.r
WaitingTime.sp
WaitingTime.em
SocialFactors.r
SocialFactors.sp
SocialFactors.em
Design.r
Design.sp
Design.em
AmbientConditions.r
AmbientConditions.sp
AmbientConditions.em
Expertise.r
Expertise.sp
Expertise.em
Behaviour.r
Behaviour.sp
Behaviour.em
Attitude.r
Attitude.sp
Attitude.em
ServiceQual.b
1.000
ServiceQual.a
0.8751.000
OutcomeQual.a
0.7870.7381.000
OutcomeQual.b
0.7710.7420.8311.000
ServiceEnviroQual.a
0.6200.6630.5660.5431.000
ServiceEnviroQual.b
0.6210.6930.5800.5550.9031.000
InteractionQuality.a
0.6410.5680.6640.6720.3980.4181.000
InteractionQuality.b
0.6540.5640.6520.6870.4610.4680.8691.000
Valence.r
0.8010.7520.8410.8640.5180.5130.7080.7081.000
Valence.sp
0.8040.7530.7730.7520.5230.5250.6090.5790.8471.000
Valence.em
0.6820.6050.6630.6720.4140.4530.5910.5840.7070.6731.000
Tangibles.r
0.7620.7550.8580.8610.5630.5690.6830.6780.8720.7400.6671.000
Tangibles.sp
0.5840.5460.5780.5830.4710.4330.4760.4430.6650.6590.5020.5851.000
Tangibles.em
0.5480.5290.5320.5910.3850.4060.4220.4340.5750.5410.5610.5570.6461.000
WaitingTime.r
0.4540.4470.5330.4860.2640.2940.3510.3210.5390.4340.4080.5770.3780.4751.000
WaitingTime.sp
0.5980.5410.6650.5930.3450.3830.4890.4460.6150.5060.4720.6310.3900.4410.6461.000
WaitingTime.em
0.5620.5550.6190.5670.3450.3710.4890.4530.5940.4820.5480.6020.4090.5010.7300.8251.000
SocialFactors.r
0.6500.6750.5580.5530.5660.6060.4270.4900.5320.5490.5270.5450.3870.4860.3420.3150.3651.000
SocialFactors.sp
0.3480.3790.4120.4610.3360.3590.3050.3170.3620.3900.4110.4150.2930.4530.2980.3070.3310.4811.000
SocialFactors.em
0.5940.5760.5480.4980.4780.4770.4950.4590.5110.5340.5080.4930.4170.4120.2490.4320.4490.5410.4391.000
Design.r
0.5820.6590.5430.5190.6330.6810.3730.4060.4380.4800.3820.5160.3070.3800.2730.3190.3640.6430.3910.4921.000
Design.sp
0.5440.5060.4750.5640.3880.3680.3750.3890.5170.5150.5210.4960.4170.5080.3370.3180.3830.3560.3520.3820.3561.000
Design.em
0.5690.6300.5020.4390.5460.5660.3530.3300.4800.5050.4490.4190.3140.3400.2970.3630.4080.5390.2860.4990.5990.4531.000
AmbientConditions.r
0.6750.6600.6210.5770.6450.6870.5310.4950.6020.7000.5470.6110.5540.4610.3390.3510.3530.6050.4070.6060.5990.4260.5801.000
AmbientConditions.sp
0.4100.4840.3880.4350.4780.4670.3720.4240.3930.3630.2630.3980.2930.2670.2280.2970.3300.4030.2680.4510.5030.1690.3980.4821.000
AmbientConditions.em
0.6390.6920.5730.5220.6740.6810.4730.4480.5360.6020.5100.5310.4590.4580.3460.3890.4520.6320.4180.6230.6830.3700.6640.7630.6241.000
Expertise.r
0.5820.5200.5970.6010.3910.4270.6360.6810.6240.5120.5690.6010.4370.4910.3890.4980.5440.4250.2840.5020.3140.3910.3380.4490.3380.4461.000
Expertise.sp
0.6280.5630.6500.6500.3810.3980.7030.6920.6690.5420.5550.6470.4900.4450.4210.5740.5840.4510.2930.5050.3640.3740.3280.4720.3250.4580.7511.000
Expertise.em
0.6010.5710.6610.6730.3880.4060.6870.7150.6860.5810.6140.6650.5430.5160.4330.5070.5810.5020.3770.5270.4200.3590.3400.4750.4510.5450.7690.8391.000
Behaviour.r
0.6900.6310.7310.7780.4560.4630.7040.7100.7700.6270.6350.7730.5360.4920.4300.5710.5350.4730.3970.4930.4140.4930.3350.5120.3510.4700.6680.7450.7671.000
Behaviour.sp
0.6690.6110.7140.7340.4800.4700.7120.7240.7250.5670.5900.7400.5210.4510.4670.6120.5930.4310.3730.5190.4080.4320.3570.4680.3660.4610.7040.7900.7560.8871.000
Behaviour.em
0.6520.6090.7480.7730.4910.5180.7170.7190.7530.6080.6160.7680.5870.4870.4260.5450.5470.5270.4130.5240.4570.4230.3430.5190.3810.5190.7120.7760.8360.8920.8621.000
Attitude.r
0.6920.6430.6700.6810.3790.4040.7950.7770.7160.6520.6100.6900.5170.4730.3740.5520.5390.4770.2720.5270.4130.4320.3460.5230.3570.5080.6530.7360.7440.7470.7590.7411.000
Attitude.sp
0.6630.5970.7170.7180.3610.3620.6970.6850.7470.6530.6100.7330.6020.4990.3480.5220.4910.4350.3140.5200.3680.4270.2820.5140.2950.4640.6260.7110.7410.8360.7790.8200.8301.000
Attitude.em
0.6410.6220.7230.7480.4650.4830.7490.7330.7380.6370.6100.7750.5620.4690.4030.4980.4880.4810.3940.5000.4130.4270.3150.5440.3390.4900.6660.7630.8060.8770.7970.9040.7800.8651.000
172
6.6 Discussion
This study fulfils the second aim of this thesis by applying a known model of Service
Quality to the low-cost airline industry. HiQUAL, with it’s unique hierarchal structure,
provided a detailed look at the relationship of Service Quality to its sub-dimensions.
Each factor in the hierarchical structure was confirmed through the survey data. While
some of the factor loadings were not as high as others (for example Waiting time at
0.70), they were nonetheless significant. Additionally, it is possible that the strength of
these relationships could have been improved with a larger sample size. Therefore, the
entirety of the HiQUAL model fits this context.
Demographic results were as expected for a student-centred sample. However;
the sampling method did return some interesting results. Given the large student body
at The University of Stirling that has easy access to the University's student web portal,
the pull strategy naturally had much greater potential than the push strategy given the
potential for survey exposure. However, it was not expected to generate such a strong
response rate in such a short amount of time (just over one week). The push strategy
achieved limited results, only generating five responses. Only speculative reasons for
this can be offered. For example, many of the university contacts had warned that
students frequently become inundated with survey emails, and response rate would be
low. This may have also been further affected by the time of year, as it is a time when
many undergraduate and post-graduate students are beginning to publish surveys.
Postgraduate response rate may have been low due to a typically higher volume of work
than undergraduate students, leaving them with less free time.
The results of the HiQUAL path analysis demonstrate a robust metric that can
be easily modified to fit a specific context. All components of the original model were
retained in this experiment. Again, this research sought to determine the scales
applicability in this context, rather than to reinvent the model; therefore, the models
properties were not in question. However, it is interesting, given the context specific
173
nature of this study, the model remains significant in its entirety. This could add value
to any argument for HiQUAL’s adaptability and applicability for examining Service
Quality in other industry-specific contexts.
While all of the paths confirm that the latent variables fit the data, there is a
slight variation in strength within the second-order factor structure. Specifically, the
relationship between Service Quality and Outcome Quality is slightly stronger than that
of the other two factors (Interaction Quality and Service Environment Quality).
However, because these estimates were all of acceptable strength and were significant
at the p<0.05 level the entire model was retained.
Outcome Quality contained the strongest relationship with Service Quality
(.92); however, Interaction Quality contained the strongest sub-dimensions. This may
indicate that there is more depth to the relationship between airline staff and their
interactions with customers than the Physical Environment or Outcome Quality.
Since the Outcome Quality had the most varied sub-dimensions this may
indicate a highly variable assessment of airline outcomes from the consumer. This
indicates the strength of Tangibility in consumers’ evaluation of the low-cost airline
experience. Furthermore, the weakest path was Waiting Time (0.72). This may be
because of the relatively quick turn-around times for low-cost airlines and point-to-
point routing which result in less waiting time for the passengers.
The HiQUAL results provide a clear picture of the importance of each of its
factors to Service Quality in the low-cost airline industry. This information could prove
useful to airlines wishing to improve their overall Service Quality by highlighting key
areas to focus their service strategies.
174
6.7 Limitations
The email campaign to universities outside of the University of Stirling saw limited
success. Due to the effort that went into planning and executing this distribution
strategy, the low response rate makes it largely ineffective. Additionally, because the
majority of responses were students at The University of Stirling, more research is
needed to determine if the results are generalisable outside this narrow sampling
frame.
The snowball sampling strategy may have limited by the choice of social
networking medium chosen. While Facebook is extremely popular, there are certainly
several other very active social networking avenues that could have been employed (for
example, Twitter) or an online community-based forum such as Reddit. Twitter would
have been the second most viable avenue based on its equally large share of the social
networking market. However, at the time of this survey, the researcher does not have a
Twitter account. Creating a Twitter account and generating “followers” that could pass
along the survey, would take considerable time and could have potentially delay the
research.
While HiQUAL does provide practitioners with a tool to examine airline quality
in-depth, it’s results are not easily understood by, or accessible, to the average
consumer. As well, because of a varying sampling frame, these results cannot be
accurately compared longitudinally, without significant effort. This naturally limits its
applicability as a consumer decision-making tool.
6.8 Implications for Future Research
Since this is the first instance in the literature where the applicability of a hierarchical
measurement of Service Quality has been applied in the context of the LCC industry,
more research needs to be conducted to expand the applicability of such metric to other
175
industries. This would require testing HiQUAL's application in other industry-specific
contexts. Doing so is the only way that SERVQUAL variants can ever be replaced in
practise with more appropriate means. It would be interesting to see a comparison of
HiQUAL studies between LCCs and traditional carriers; however, doing so was outside
the scope of this study. Furthermore, it may be possible to redefine HiQUAL’s third-
order factors to a more context specific manner. This would further establish the
adaptability of HiQUAL. However, as this study demonstrates, the current sub-
dimensions have a good fit with LCC industry.
6.9 Conclusion
The purpose of this survey was to apply HiQUAL in a specific context and determine its
relevance as an investigative tool for Service Quality for the low-cost airline industry.
The model appears to fit the data confirming the original HiQUAL structure in this
context. This allows for an illustration of Service Quality in the UK low-cost airline
industry. The second-order factor estimates seem to point to an importance of
Outcome Quality; however, from this data, no reasoning can be accurately ascertained.
Additionally, this study only examines the UK low-cost airline industry as a whole and
cannot make any conclusions as to the difference between the two subjects Ryanair and
EasyJet.
176
CHAPTER SEVEN: FINDING THE DETERMINANTS OF SERVICE QUALITY IN THE LOW-‐COST AIRLINE INDUSTRY
7.1 Introduction
The aim of this chapter is to search for the determinants of Service Quality in the UK
low-cost airline industry by qualitatively examining secondary consumer opinion data.
A qualitative approach is used to gather in-depth detail about passengers’ evaluations
of airline quality. Chapter Five: Methodology highlighted the possibility of using
secondary consumer opinion publications as a possible source for data. There is now
significant online consumer opinion websites dedicated to the airline industry and
using such data to investigate consumers’ opinions of airline Quality will save
considerable time over collecting primary qualitative data. This study also assesses the
accessibility of consumer watch groups as possible sources of data when finding the
determinants of Service Quality in the UK airline industry.
Consumer watch groups have been around for some time. Their popularity
developed in both the UK and North America during the surge of consumerism that
followed the Second World War. Monthly publications such as Which? and Consumer
Reports (in the United States) reported on a large variety of goods and service aimed at
the general public. These consumer watch group publications grew in popularity until
very recently, when personalised customer reviews via the internet took over as the
preferred method for customer information (Bakos, 1998; Ratchford, Tulakdar and
Lee, 2001; Ward and Lee, 2000).
The industry watchers chosen for this analysis were Which?, Skytrax and
TripAdvisor. Although these three industry watchers used in this chapter were
certainly not the only available, they were the most informative for this study. They
were chosen based on their size, their popularity and because they highlight a range of
177
methodologies used by industry watch groups. Each one represents a different type or
style of industry watcher. Which? represents the established commercial publication
that collects primary data and compiles it into monthly subscription magazine. Skytrax
represents the web-based, airline specific publication with free access. They collect field
data to generate a “star rating” of airlines. TripAdvisor.com is a web-based, free access
industry watcher with a more generalised content. It uses customer reviews and also
generates a five-point classification of airlines, as well as hotels and other travel
specific services.
While each of these Industry Watchers has widely varied methods, they are all
easily understood and accessible to the consumer. Even though their methods are not
always firmly established in the latest scientific literature, this accessibility and ease of
understanding makes them very important and powerful in the marketplace.
7.2 Industry Watchers
7.2.1 Which?
Which? has been testing consumer products and service since 1957. They publish their
results in a monthly print magazine, also released in an online format. Which?
currently has over 617,000 subscribers and 254,000 online subscribers and is the
largest consumer reporting publication in print circulation within the United Kingdom
(Which?, 2015). Which? claims to use controlled testing methods “that can be
replicated time and again” (Which?, 2015). They employ a wide variety of empirical
methods for testing such goods which closely resemble those used in manufacturing
quality-control testing, in addition to a variety of qualitative methods to measure
services.
The Which? laboratory tests a variety of consumer goods, from toasters to
televisions, household cleaners to automobiles. Which claims “lab testing is the best
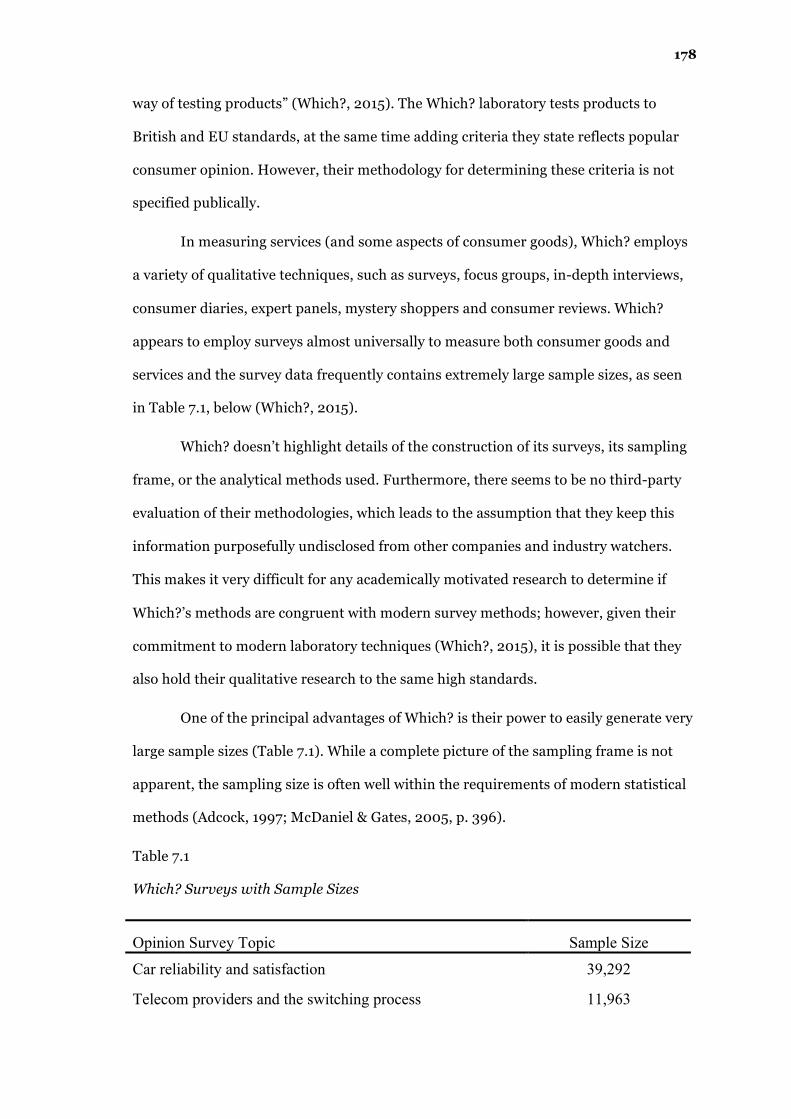
178
way of testing products” (Which?, 2015). The Which? laboratory tests products to
British and EU standards, at the same time adding criteria they state reflects popular
consumer opinion. However, their methodology for determining these criteria is not
specified publically.
In measuring services (and some aspects of consumer goods), Which? employs
a variety of qualitative techniques, such as surveys, focus groups, in-depth interviews,
consumer diaries, expert panels, mystery shoppers and consumer reviews. Which?
appears to employ surveys almost universally to measure both consumer goods and
services and the survey data frequently contains extremely large sample sizes, as seen
in Table 7.1, below (Which?, 2015).
Which? doesn’t highlight details of the construction of its surveys, its sampling
frame, or the analytical methods used. Furthermore, there seems to be no third-party
evaluation of their methodologies, which leads to the assumption that they keep this
information purposefully undisclosed from other companies and industry watchers.
This makes it very difficult for any academically motivated research to determine if
Which?’s methods are congruent with modern survey methods; however, given their
commitment to modern laboratory techniques (Which?, 2015), it is possible that they
also hold their qualitative research to the same high standards.
One of the principal advantages of Which? is their power to easily generate very
large sample sizes (Table 7.1). While a complete picture of the sampling frame is not
apparent, the sampling size is often well within the requirements of modern statistical
methods (Adcock, 1997; McDaniel & Gates, 2005, p. 396).
Table 7.1
Which? Surveys with Sample Sizes
Opinion Survey Topic Sample Size
Car reliability and satisfaction 39,292
Telecom providers and the switching process 11,963
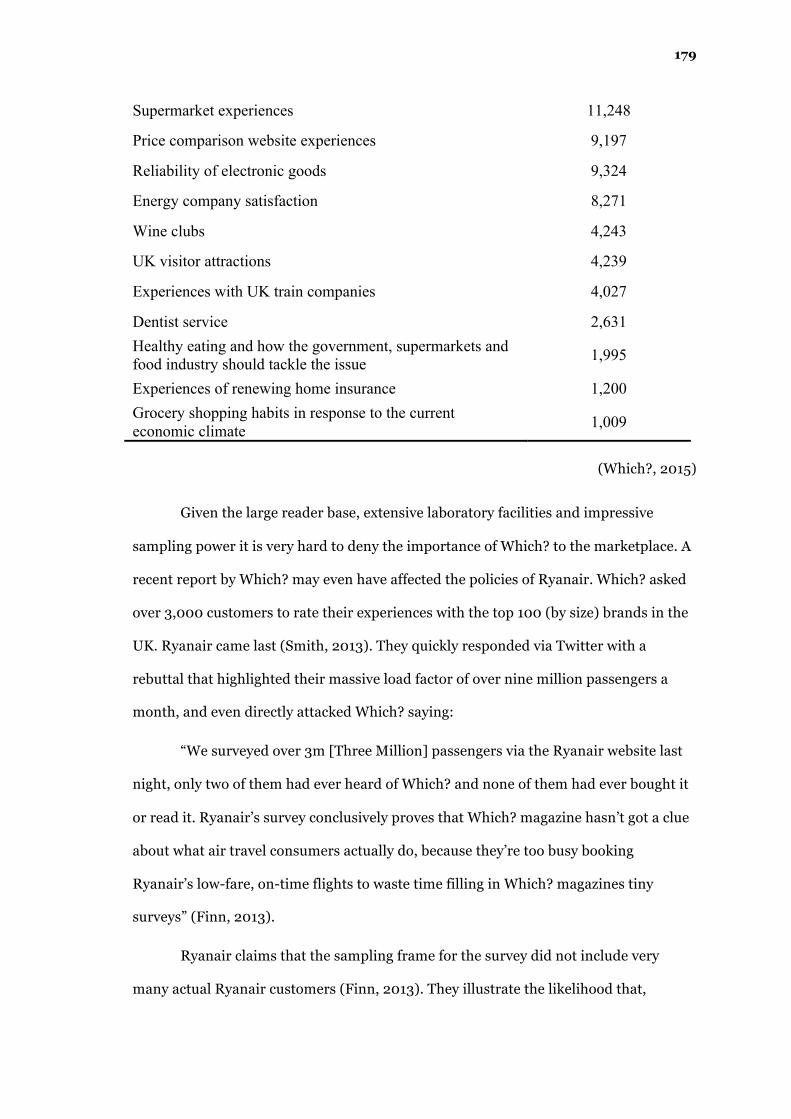
179
Supermarket experiences 11,248
Price comparison website experiences 9,197
Reliability of electronic goods 9,324
Energy company satisfaction 8,271
Wine clubs 4,243
UK visitor attractions 4,239
Experiences with UK train companies 4,027
Dentist service 2,631 Healthy eating and how the government, supermarkets and food industry should tackle the issue 1,995
Experiences of renewing home insurance 1,200 Grocery shopping habits in response to the current economic climate 1,009
(Which?, 2015)
Given the large reader base, extensive laboratory facilities and impressive
sampling power it is very hard to deny the importance of Which? to the marketplace. A
recent report by Which? may even have affected the policies of Ryanair. Which? asked
over 3,000 customers to rate their experiences with the top 100 (by size) brands in the
UK. Ryanair came last (Smith, 2013). They quickly responded via Twitter with a
rebuttal that highlighted their massive load factor of over nine million passengers a
month, and even directly attacked Which? saying:
“We surveyed over 3m [Three Million] passengers via the Ryanair website last
night, only two of them had ever heard of Which? and none of them had ever bought it
or read it. Ryanair’s survey conclusively proves that Which? magazine hasn’t got a clue
about what air travel consumers actually do, because they’re too busy booking
Ryanair’s low-fare, on-time flights to waste time filling in Which? magazines tiny
surveys” (Finn, 2013).
Ryanair claims that the sampling frame for the survey did not include very
many actual Ryanair customers (Finn, 2013). They illustrate the likelihood that,
180
Which? readers are of a different demographic than Ryanair Customers. This may be
true, however neither Which? not Ryanair reveal the details of their surveys or the
demographics of their sampling frames so any accurate determination of this
discrepancy is not possible.
Despite Ryanair’s dismissal of the Which? report, they coincidentally made
several bold statements at the annual shareholders meeting citing Customer
Satisfaction as being the focus of the airlines’ policies in the future (some of Ryanair’s
customer service shortcomings and corporate culture have been highlighted in Chapter
Four). Michael O’Leary said directly: “We’ve got to stop trying to unnecessarily piss
people off” (Pogatchnik, 2013). This provides an example of Service Quality driving
changes in corporate policy and culture.
7.2.2 Skytrax
Skytrax is an airline and airport quality review website. Founded in 1989, they gather
primary data to assess the Service Quality of many airlines and airports around the
globe and publish the results yearly as an Airline/Airport Star Rating (Skytrax, 2013c).
This system ranks each airline or airport’s service from one to seven stars (although no
six-star rating has yet been awarded to an airline and the seventh star is merely for
statistical purposes). The results are displayed as groups of airlines with similar star
ratings. No distinction is made among airlines within groups.
Along with the Airline Star Rating, Skytrax publishes a Consumer Opinion
Rating. This offers a similar five-point rating as the Airline Star Rating; however, the
data used to calculate it comes directly from the consumer. This is a very important
feature of Skytrax, as this data represents first-hand consumer accounts instead of the
observations of researchers. As part of the consumer opinion rating, Skytrax requires
customers to leave comments, and then makes those comments available to the public
(Skytrax, 2013a).
181
Skytrax is rather ambiguous about their rating methodology. On their website,
they explain; “it classifies airlines by the Quality of front-line product and staff service
standards, and is recognised as a leading, global Benchmark of airline standards”
(Skytrax, 2013d). They claim to use over 800 criteria to evaluate an airline's product
and service; however they do not mention what those criteria are or how they are
collected or analysed (Skytrax, 2013c). They agree to release detailed information about
their methodology only to airlines listed in the rating system. Access to this
information is proprietary and only available to the airline directly and no one else.
Completing the “methodology request form” returned no response from Skytrax.com.
An indication of their methodology can be obtained from their employment
sites. Skytrax regularly employees field data collectors they call “airline and airport
audit staff”. These persons fly the routes gathering primary data on the airlines’ service
(Skytrax, 2013c). Judging by other Skytrax reports on seat pitch, comfort and layout it
is reasonable to assume that “airline auditors” collect a variety of empirical
measurements as well as more subjective measurements such as employee friendliness;
however, the number of researchers, the frequency of data collection or the sampling
distribution are unknown. Key determinants in the final rating include staff Service
Quality, seat standards and in-flight entertainment (Skytrax, 2013c). Skytrax evaluates
traditional carriers and LCCs alongside one another. This may result in an unbalanced
assessment on part of the LCCs if the same criteria are used as with the traditional
carriers because the LCCs offer an arguably different service than traditional carriers.
Skytrax.com also has an area for customer reviews. Customers can offer
responses to scales on Value for Money, Seat Comfort, Staff Service, Catering and
answer a yes/no question as to whether or not they recommend the airline. There is
also an area where customers can leave extensive comments about the service. This
provides an opportunity to easily and freely collect subjective secondary data that may
be used for evaluation of consumers’ experiences.
182
7.2.3 TripAdvisor
With over 120 million reviews and 260 million visitors each month, TripAdvisor.com is
the most popular travel website in the world (TripAdvisor, 2015). Consumers can post
reviews of hotels, restaurants, and flights. Like Skytrax, TripAdvisor rates airlines
based on a five-point scale; however, it does not gather primary data. TripAdvisor users
securely log in and rate the experience themselves resulting in a collaborative score for
each airline.
The survey that TripAdvisor uses does not conform to any academic scale for
Service Quality measurement, it simply asks consumers to rate their experience, across
seven variables, on a six-point scale with points one to five ranking from Terrible to
Excellent, with point six as a non-response option (TripAdvisor, 2015). These variables
relate directly to what TripAdvisor seems to have determined to be important to the
airline experience (though they make no reference to how these variables were
derived). These variables are Check-In Service, Seat Comfort, In-Flight Amenities, In-
Flight Service, Baggage Handling, and Value. The survey also captures consumer
opinion relating to airline fees, but on a five-point scale. Importantly, the survey has a
space for consumers to write comments. It has a minimum character requirement for
the comments section to avoid short responses such as: “Great!” or “Terrible Service!”
Respondents are required to answer with a complete thought. These responses are
published along with the consumers’ review and allow researchers and other
consumers to see what drove the responses to the scaled items.
TripAdvisor’s size and popularity make it very important to the marketplace
(TripAdvisor, 2015). Like Skytrax it is easily accessible and understood by the
consumer. TripAdvisor’s five-point rating is generated directly from consumers’
responses to questions on their website. Individual responses are tabulated to generate
a personal rating for each experience. The availability of customer reviews alongside
the five-point scale adds another dimension to the website. Strangely, TripAdvisor only
183
makes individual comments available for hotels and not airlines (they offer no
explanation for the discrepancy). However, there is a TripAdvisor Forum where
discussion can be found relating to specific airlines. Searches of forum topics revealed
these are usually related to technical aspects or the airline service (such as Ryanair’s
routing, aircraft type, or claims procedures) and are rarely direct discussions of airline
quality.
In addition to providing service reviews, the TripAdvisor website has a flight
search function. It performs a meta-search of other travel websites (for example,
Expedia, Orbitz, Opodo) as well as airlines’ own websites (including Ryanair and
EasyJet) and relays that information back to the consumer. TripAdvisor does not
associate with the airlines directly and therefore holds no pricing agreements
(TripAdvisor, 2015). While it features a “Book Now” button, it does not have its own
booking privileges with the airlines. Selecting this button redirects the customer to an
external retailer.
7.3 Content Analysis Study
The comments left on consumer review websites can provide an efficient method to
determine what consumers’ value most in their experiences with LCCs (Mayring, 2004;
Yang & Fang, 2004). This study used comments left on the Skytrax website as it is an
airline specific industry watcher. While TripAdvisor does collect and rate peoples’
perceptions of their airline experience, it does not publish comments relating to those
experiences; therefore, Skytrax will be the single source of data for this study.
The analysis can be performed using both manual and computer techniques
(Morris, 1994), however this analysis employed NVivo 10 software, the latest
development of qualitative data management software from QSR. This program helps
with coding through its word frequency queries and also reduces the time and error
rate associated with manual coding.
184
Skytrax collects comments and opinions left by consumers on their website. At
the time of data collection, there were a total of 75 comments available for Ryanair and
61 available for EasyJet. The comments are over a range of dates within the most recent
six-month period. Comments on the Skytrax website were only available from
9/9/2013 until the day of retrieval, 21/10/2013.
Skytrax collects six points of data: customer name (initial and surname),
country of origin, customer’s rating of the airline (on an absolute scale of 1 to 10), value
for money (five-point), seat comfort (five-point), staff service (five-point), catering
(five-point), whether or not they would recommend this airline (yes/no) and
customer’s comments. They use these data only to augment the primary data collected
by their field researchers (Skytrax, 2013c). Skytrax averages the customers’ ratings into
the Customer Review Score presented on a one to 10 scale as integers (as opposed to
the absolute values entered by the consumers).
Analysis began by reading the comments relating to Ryanair or EasyJet
available on the website and taking systematic notes on the general topics highlighted
in the consumers’ comments. The comments were entered into a spreadsheet for input
into the NVivo 10 software. NVivo created super-nodes for each airline and all of the
comment data was imported into the relevant node.
The comments were then split into two sub-nodes: those that would
recommend and those that would not recommend the airline. This distinction was
required to be made by the respondent when leaving their comment on the Skytrax
website. This was done so similarities between the two groups could be evaluated. If a
topic appeared in both groups, then it may be something that could either add or
detract from the experience and should therefore be treated as an important
determinant of the low-cost airline experience. This will highlight complete
determinants of airline quality, not simply factors that effect only positive or negative
experiences. This distinction is important if these determinants are to be used in
185
further research where factors that could potentially add or detract from the experience
may be necessary (such as the construction of an objective measure of airline quality in
Chapter Eight of this thesis). Within the “Would Not Recommend” group, topics that
seemed to detract from the airline travel experience or that led to an evaluation of poor
quality were further coded into sub-nodes. In the “Would Recommend” group, topics
that seemed to add to the experience or lead to a positive evaluation of Service Quality
were further coded into sub-nodes.
7.4 The Determinants
Most of the nodes coded seem to repeat themselves between categories. This repetition
is found between airlines as well. This uniformity adds confidence to the node selection
and allows for the clear identification of the key determinants of Service Quality
between Ryanair and EasyJet.
The determinants were chosen systematically by reviewing the personal journal
written when reading the Skytrax comments and comparing them to the word
frequency queries. The comments were investigated for repeating themes directly
relating to the customers’ experiences. Notes were compared across the “Would
Recommend” and “Would Not Recommend” groups to highlight similarities. These
similar themes both add and detract from the airline experience. Once identified, the
themes were compared to the word frequency queries to illustrate the key determinants
of airline quality. Highlighted words in the word frequency query, which were related
to the themes highlighted in the personal journal, were then judged to be a key
determinant of Service Quality in the low-cost airline industry.
7.4.1 Overview: Ryanair and EasyJet
The Ryanair comments (n=75) were the first analysed. Initial separation of the
comments into “Would Recommend” and ”Would Not Recommend” nodes revealed
186
that the majority of customers would not recommend Ryanair (59% would not
recommend, 41% would recommend). The “Would Not Recommend” comments were
the first to be coded. Coding of the “Would Not Recommend” group (n=44) showed
that the majority referenced Staff Friendliness, Check-In and Boarding, Baggage (the
handling of baggage and the application of rules), Extra Fees, and Seating (as discussed
in Chapter Four, Ryanair charges for assigned seats). Most comments involved some
complaint about staff friendliness (mostly relating to airport staff). Of the complaints,
the treatment of baggage and the application of strict rules relating to carry-on baggage
and weight limits of checked-bags and the fees that result from non-adherence to the
rules were of major concern. There also appeared to be some concern over inconsistent
application of the baggage rules. Many of these comments were from first time Ryanair
customers who were unfamiliar with the baggage and check-in rules; the unfamiliarity
was Ryanair’s baggage system created confusion and stress for the passengers resulting
in a negative experience.
The “Would Recommend” group was coded in a similar fashion. These
passengers made reference to Ryanair’s Staff Friendliness, On-Time Performance and
Value for Money. A significant number of responses stated that they did not
understand negative public opinion of Ryanair. These customers did not report any
problems with Ryanair’s baggage or check-in policies and seemed to have mostly been
experienced travellers.
The group that would recommend Ryanair seemed generally pleased with the
airline’s overall service, to the degree that they often could not understand people’s
complaints (n=11). Most of these passengers had flown with Ryanair beforehand, or
expressed some knowledge of Ryanair’s policies and procedures.
NVivo coding for EasyJet comments began in the same manner as Ryanair. The
“Would Not Recommend” group (n=22) also yielded a similar word frequency query to
Ryanair. The final coding reveals passengers were most concerned with: Staff
187
Unfriendliness, Baggage, Check-In and Boarding, and Inconsistent Application of
Rules. The Inconsistent Application of Rules node is almost universally related to
carry-on baggage and the fees associated with baggage.
Coding of the “Would Recommend” group (n=39) began as before. Comments
about Staff Friendliness were the most common, with On-Time Performance, Check-In
and Boarding and The Aircraft Cabin and Seating being the most common topics, of
which Staff Friendliness, Value for Money and On-Time Performance were most
positively commented on.
Therefore, this study identifies four key determinants of airline quality: Baggage
Handling and Policy, Boarding and Check-in, Penalty Fees and Application of Policy
and Staff behaviour. These represent the factors that contributed to the passengers’
perception of the low-cost airline experience. They are loosely comparable to some of
the accepted theoretical conceptions of Service Quality and could possibly have
practical implications in constructing an objective measurement of Service Quality.
7.4.2 Baggage Handling and Policy
Both LCC’s have very strict requirements for passenger baggage. Passengers are
typically limited to one carry-on bag and there is a charge for checked baggage (per 15
kilos). The majority of passengers who complained about baggage charges simply did
not adhered to Ryanair’s strict guidelines. Many customers state their ignorance to
baggage rules, yet many seem to knowingly violate the policy and still complain. Non-
compliance carries with it an additional fee from both Ryanair and EasyJet and this
seems to upset the customers. They frequently see it as unfair and punitive.
This non-compliance fee also extends to hand luggage. Low-cost carriers are
very strict regarding the dimensions of carry-on baggage (for example, Ryanair has a
maximum dimension size of 55 x 40 x 20 cm, which incurs a £50 charge if exceeded).
188
Passengers may complain that the airline is being unfair and over-cautious if these
rules are strictly enforced. However, if the dimension rules are not adhered to, an
individual with a particularly large bag may take up additional overhead cabin space
resulting in a negative experience for a fellow passenger.
Although passengers may complain about an additional fee to include checked
baggage, this strategy works well for the low-cost carrier model. As LCC flights are
point-to-point and short-haul (Ryanair’s flights rarely exceed four hours) many
individuals are using Ryanair for “long weekend” holidays where limited baggage is not
an issue. By splitting the price and including baggage as an excess cost, “long weekend”
passengers can feel they are better managing their costs, resulting in a more positive
experience.
This study highlights a clear importance of passenger’s baggage, their
interactions with staff over the baggage and the airlines’ policies relating to baggage to
their interpretation of the airline experience. Baggage Handling and Policy may be
conceptualized as a measurement of Functional Quality (Gronroos, 1982, 1984) and as
well could relate to four of the five SERVQUAL factors (Reliability, Responsiveness,
Empathy and Assurances). Within the HiQUAL framework, it could be affecting
Outcome Quality and Interaction Quality. Further examination on the next chapter
may revel its relationship to the HiQUAL framework. Because some of the elements of
baggage are quantifiable (such as maximum allowable weight or volume) it is possible
that this determinant could be incorporated in an objective measure of Service Quality
later in this thesis.
7.4.3 Boarding and Check-‐In
Ryanair’s boarding policy has been described as a “mad rush” to the gate with most of
the passengers trying to get to the front of the line thereby giving them the first choice
of seats and places to store their baggage. This process is sometimes referred to as
189
“cattle class” and comments frequently refer to extremely rude behaviour on part of
other passengers:
“Coming back was like a cattle market! All crammed into a waiting area, so hot,
people pushing and queue jumping, priority went through and some passengers that
were not priority pushed their way in and were not stopped, what is the point of paying
when you can just push in?”
“At one point it was a free for all. No better than a cattle market.”
The EasyJet comments about seating were mostly positive. In contrast to
Ryanair’s “cattle class” boarding, EasyJet now operates with assigned seating. It is
possible that this creates less disorder when boarding the aircraft than general
boarding (as seen in Ryanair). Passengers can still purchase priority boarding and exit
row seats with extra legroom. Most of the “Would Recommend” category state they
had purchased priority boarding (which includes an assigned seat) and this seemed to
have a positive effect on the passengers’ overall experience with the airline. Having
assigned seats and not being subjected to “cattle class” most likely accounts for the
more positive comments for EasyJet. Furthermore, EasyJet attributes its recent raise in
passenger yield and profits to assigned seating having improved the overall customer
experience (EasyJet PLC. Annual Report: 2012). However, one customer in particular
offered a unique perspective on EasyJet's seating policy:
“The introduction of allocated seating seems to have made the whole boarding
process more relaxed, though it does mean that you can no longer vet the passengers in
your immediate vicinity before sitting down: on one of our flights we had to suffer seat
kicking children behind us with parents who took no notice.”
Boarding has the potential to be a strong influence in Service Quality for a LCC.
In general, having assigned seats would allow for better boarding practices that were
more efficient and potentially could result in a more positive passenger experience. For
example, there are a number of different boarding patterns, such as back-to-front by

190
row, block boarding or alternating back-to-front which can improve boarding
efficiency; this is not possible with unassigned seating. By improving boarding
efficiency, not only do passengers receive a higher Service Quality experience, but the
airline decreases turnaround time and increased profits (more flights can be scheduled
in one day, and expenses are reduced).
Conversely, poor boarding practices can cause a number of difficulties for
passengers, decreasing the LCC Service Quality experience. If seating is unassigned,
boarding can be chaotic. Passengers not boarding in a specific order may have to wait
to wait to pass other passengers in the aisle (this can take additional time if the
passenger is stowing luggage) or move already-seated passengers to access window
seats, for example. This is compounded in LCCs such as Ryanair, as seating space is
maximised which results in reduced movement area aboard the aircraft. Consumers
also tend to rush when there is unassigned seating, to receive adequate cabin space to
store their hand luggage (although Ryanair implements strict hand luggage policies,
many individuals can place additional items such as coats within the storage space,
reducing the room available for other passengers).
Unassigned seating can also lead to individuals travelling together seated apart,
which can be particularly stressful for families. By encouraging a system of pre-
purchased seating, this can not only increase the potential for positive Service Quality
for Boarding, but also generate profits for the LCC.
The importance of boarding and check-in procedures to the SkyTrax
respondents could be related to the third-order variable Waiting Time in the HiQUAL
metric (Brady and Cronin, 2001). Although no all comments were directly related to
waiting time, the amount of time spent waiting at boarding and check-in seemed to be
clearly associated with passengers evaluation of the airline experience.
191
7.4.4 Penalty Fees and Application of Policy
The majority of penalty fees incurred by passengers are due to oversize/overweight
baggage and not having printed boarding passes. These fees must be levied
immediately at the check-in counter, with non-compliance resulting in denied
boarding. Many passengers see these fees as punitive. However, many of these fees
seem to be incurred because of simple ignorance of the Ryanair policies. This is best
illustrated in a comment left by an American passenger:
“In the US it customary for passengers to print their airline tickets at kiosk by
simply entering their confirmation number of their itinerary. When I attempted to do
the same, the kiosk requested payment of 140 pounds. My husband and I were
completely stunned as we had already made payment to Ryanair for the tickets which
included priority boarding and baggage fees. When I questioned the employee I was
informed that I would have to pay 140 pounds in order to board the flight! We felt
completely extorted by Ryanair's unscrupulous fees.”
The proponents of Ryanair claim that the airline does an excellent job of
alerting passengers to instances which might cause them to incur a fee. The approving
passengers view being charged a fee as a result of the ignorance of the passenger and
not the fault of the airline itself:
“There are enough warnings on their website about potential extra charges, so if
you get caught you only have yourself to blame.”
“Ryanair emailed us prior to flight to make sure we were aware of restrictions
on baggage etc. and also reminding us to print boarding pass.”
“Just don't go to one of their flights with your mind set on trying to beat their
system. If you want it cheap, then you must abide by their rules. If you don't want to be
bothered with that, just go with the pricier airlines.”
192
LCCs such as Ryanair have specific penalty fees to both enforce the implementation of
their strict policies and generate additional income. Many LCC-specific policies are in
place to ensure maximum cost efficiency. For example, by implementing an incentive
to print your own boarding pass (to avoid a penalty fee) Ryanair avoids additional time
(and therefore money) that would otherwise be spent on doing this for each passenger.
By having a penalty fee, any additional cost for Ryanair that occurs due to passengers
not fulfilling the requirement is offsets, which allows Ryanair to offer cheaper baseline
ticket prices. LCCs evidently do not attempt to catch customers out, as many
passengers commented on the number of “reminder emails” that they were sent prior
to the flight, but rather to ensure the airline is functioning as efficiently as possible.
Knowledge and experience of the LCCs system, policies and procedures seems
to greatly affect passengers’ overall experience. The LCC system is one that demands
efficiency. When passenger’s behaviour does not conform to this rigid system, the
experience can become uncomfortable. Therefore, it would be recommended that a
tactical improvement in customer education should become an important part of all
LCCs service strategies.
Some of the comments that were related to Penalties Fees and Application of
Policy were seemed to relate to employees’ handling of a negative service encounter.
Many of the fees imposed by the airline can be punitive in nature (for example: one
passenger was charged £150 at the gate by Ryanair because their cabin bag was only
slightly to large). This means that these fees and policies could relate the Interaction
Quality between staff and Passengers as well as Tangibles on the HiQUAL scale.
Furthermore, these determinants become part of the Technical Quality of the Nordic
Model because many passengers see them as an additional service provided by the
airline and contribute to low fares.
193
7.4.5 Staff Behaviour
Staff Behaviour produced opposing views for both Ryanair and EasyJet passengers, as
it was a major source of both complaints and compliments. Within Ryanair, staff
unfriendliness was a commonly occurring complaint. Much of the animosity seems to
be directed towards ground staff. Ryanair typically flies to smaller airports, and the
majority of these passengers are interacting with Ryanair staff directly (as opposed to
larger airports that use contract labour).
“Staff were miserable, especially at boarding, when I tried helping my grandma
put her hand luggage in the metal box sizer, she got all uppity because I was blocking
other passengers!”
“Staff are rude and disinterested, I worry if they would cope in an urgent
situation.”
While there may be some inconsistency in Ryanair staff’s helpfulness (as there
are in many service industries) the overwhelming number of complaints came from
ground staff; these were usually interactions with airport personnel that were mistaken
for official Ryanair staff members. It seems that Ryanair passengers have more
negative experiences with staff than do the EasyJet passengers, although there may be
some confusion on part of the passenger as to what organisation the employee
represents (the airline, the airport or a third-party contractor). With EasyJet, as with
Ryanair, most of the complaints came from interactions with ground staff. The staff are
often not EasyJet employees, but were airport staff or staff of some contracting
company like Servisair. Many of the complaints from interacting with ground staff
came from larger airports, most notably London Gatwick.
One customer who would not recommend Ryanair directly attributed
mistreatment by airport security to the airline:
“When we eventually managed to get through the farce of baggage check in, we
had to open our hand luggage and remove laptops etc., but at the same time had to take
194
our child out of his buggy, fold that up and put it on the belt then pass ourselves
through security scanners whilst our 2 year old son was left to his own devices.”
Although Staff Behaviour received many complaints from passengers, the friendliness
of Ryanair staff was also praised. While this seems juxtaposed to the criticism, most of
the complaints of staff unfriendliness came from interactions with ground staff, while
most of the praise from interactions with the cabin crew. Although there was discussion
about Ryanair’s cabin crew being rude or unfriendly, there were just as many
comments praising the cabin crew’s helpfulness.
In general, interactions with staff seem to have a large effect on passengers’
overall experience with the airline. High labour utilisation is a characteristic of many
LCCs and Ryanair commonly use this operation strategy, with staff expected to carry
out multiple tasks as part of their employment. Although this is cost-effective, it can
lead to overworked staff who may contribute to a negative Service Quality experience
for the passenger. Furthermore, it is important to note that regardless of who the
employee actually represents, the passenger tends to associate their behaviour with
that of the airline.
Staff Behaviour is applicable to a broad range of Service Quality theory. It can
be related to Empathy, Assurances, Reliability and Responsiveness in the traditional
SERVQUAL framework and to Interaction Quality in the HiQUAL scale. However, it is
hard to imagine a quantification of Staff Behaviour, so may prove difficult to
implement in an objective measurement of Service Quality.
7.4.6 Word Frequency Query Results
A word frequency query was used to cross-check the results of the content
analysis study. The results of the word frequency queries were compared to the
observations and initial notes on the comments. This allowed a pattern to be
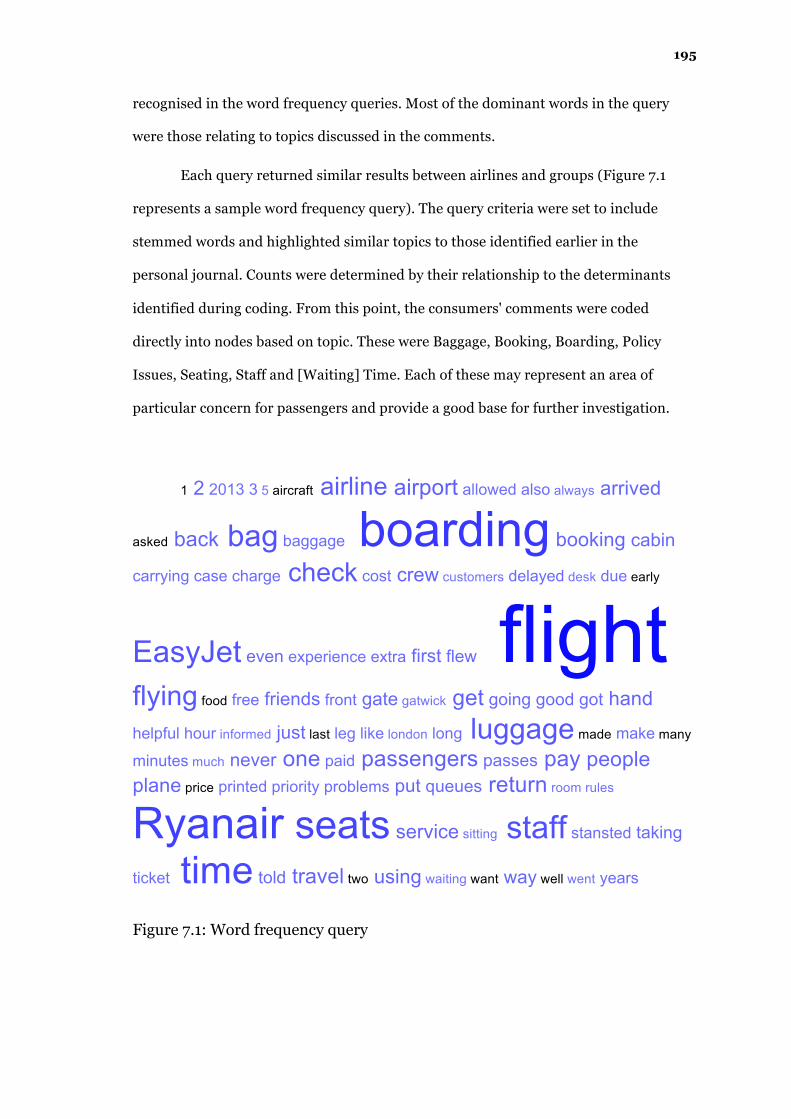
195
recognised in the word frequency queries. Most of the dominant words in the query
were those relating to topics discussed in the comments.
Each query returned similar results between airlines and groups (Figure 7.1
represents a sample word frequency query). The query criteria were set to include
stemmed words and highlighted similar topics to those identified earlier in the
personal journal. Counts were determined by their relationship to the determinants
identified during coding. From this point, the consumers' comments were coded
directly into nodes based on topic. These were Baggage, Booking, Boarding, Policy
Issues, Seating, Staff and [Waiting] Time. Each of these may represent an area of
particular concern for passengers and provide a good base for further investigation.
1 2 2013 3 5 aircraft airline airport allowed also always arrived
asked back bag baggage boarding booking cabin
carrying case charge check cost crew customers delayed desk due early
EasyJet even experience extra first flew flight flying food free friends front gate gatwick get going good got hand
helpful hour informed just last leg like london long luggage made make many
minutes much never one paid passengers passes pay people plane price printed priority problems put queues return room rules Ryanair seats service sitting staff stansted taking
ticket time told travel two using waiting want way well went years
Figure 7.1: Word frequency query
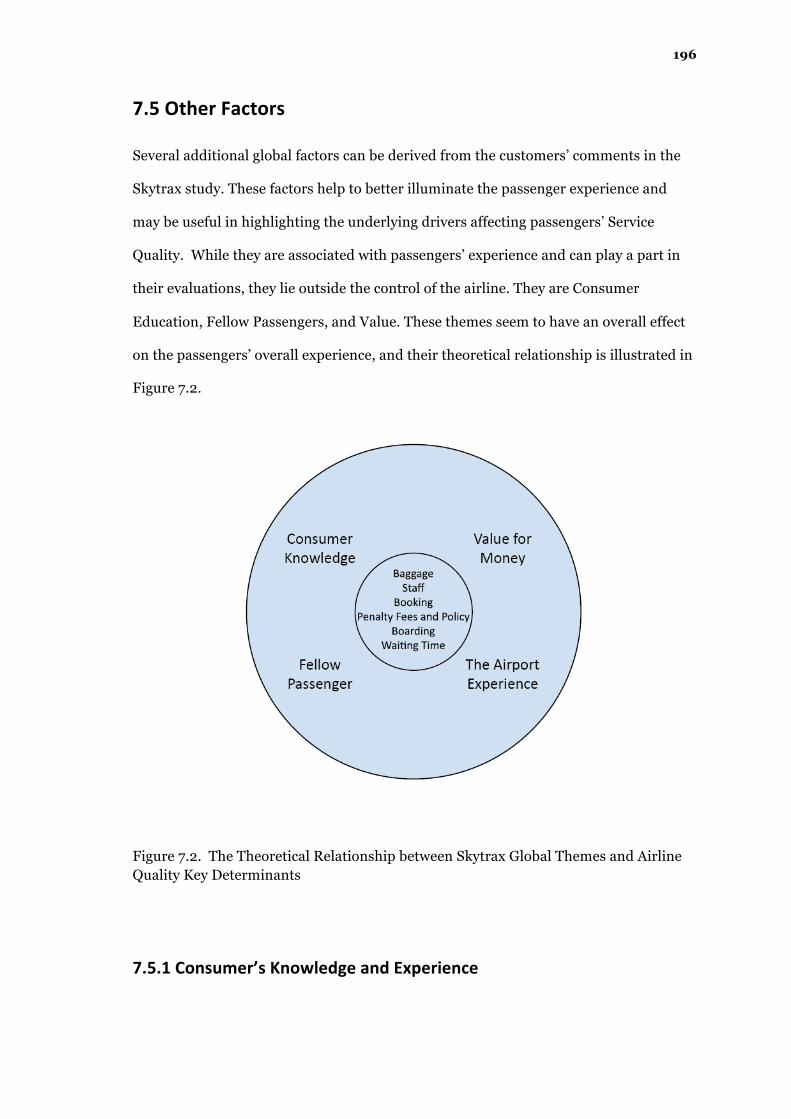
196
7.5 Other Factors
Several additional global factors can be derived from the customers’ comments in the
Skytrax study. These factors help to better illuminate the passenger experience and
may be useful in highlighting the underlying drivers affecting passengers’ Service
Quality. While they are associated with passengers’ experience and can play a part in
their evaluations, they lie outside the control of the airline. They are Consumer
Education, Fellow Passengers, and Value. These themes seem to have an overall effect
on the passengers’ overall experience, and their theoretical relationship is illustrated in
Figure 7.2.
Figure 7.2. The Theoretical Relationship between Skytrax Global Themes and Airline Quality Key Determinants
7.5.1 Consumer’s Knowledge and Experience
197
Popular press media seems to have an affinity for emphasising the disadvantages of
travelling with low-cost airlines. This can lead to passengers expecting poor service
when travelling on LCCs. Additionally; LCCs often implement non-traditional policies
and procedures relating to boarding and baggage. This expectation of poor service,
combined with situations that can potentially cause confusion for the consumer can
often lead to a negative experience. As derived in section 6.4.4, much of passengers'
dissatisfaction seems to stem from ignorance of the LCC experience and airline policies
(often resulting in hefty fees being incurred at the airport).
It is understandable how such confusion could lead to consumer
disappointment. Therefore, it becomes vital to the airline's operations that consumers
are well informed of what to expect when dealing with the LCC. Despite the airline’s
best efforts to inform consumers of their policies and procedures, there still tends to be
some confusion at the airport for new passengers. The LCC experience is unique in the
air-transport marketplace, and it seems that learning (on part of the consumer) only
happens through doing. Some consumers directly expressed frustration over an
incongruence with the traditional procedures of legacy airline (such as the American
passenger in section 6.4.4). In order to make informed decisions, consumers need
accurate and easily available information. Although this is partially down to the airline,
LCCs such as Ryanair clearly state their strict policies while booking, and then again via
email before flying. There is a limit to how many times Ryanair sends policy reminders,
as passengers already familiar with these restrictions may experience annoyance at
receiving multiple emails. As the LCC model becomes more familiar with individuals
and consumer knowledge increases, the number of individuals who have a negative
experience with LCCs in this respect may potentially decrease.
7.5.2 Fellow Passengers
198
The other passengers seem to have some effect on individual’s perception of the overall
experience. Notes from passengers on both airlines complain of “cattle class” and other
passengers pushing, queue jumping and displaying rude behaviour. Although airlines
cannot control other passengers, many of the policies they implement (for example,
unassigned seating) has the potential to encourage this behaviour. Removing this
element of the LCC experience seems to have a positive effect on passenger’s overall
experience (section 6.4.3) This is true with both Ryanair and EasyJet. Again, Ryanair
customers who choose to purchase assigned seating/priority boarding tend to have a
more positive experience than those who do not. EasyJet has apparently begun to
realise this (on a practical level) and as a result has implemented assigned seating.
Many of EasyJet's passengers believe this has led to an overall improvement in the
experience (section 6.5.3) by reducing the “mad rush” to board the aircraft that many
of Ryanair’s passengers experience.
Air travel can be extremely stressful for some passengers and the anxiety
associated with travel can cause these people to act disruptively (Bor, 2003). Again, an
airline's policies and procedures can be a factor in compounding an individual's anxiety
and may antagonise their stress resulting in disruptive behaviour (Bor, 2003). The CAA
collects data relating to disruptive passenger behaviour on-board aircraft and divides it
into two major groups: significant (such as smoking in-flight or disobeying the seatbelt
warning sign) and severe (such as displays of violent behaviour). The data suggests that
severe passenger disruptions (often termed “air rage”) are not as pervasive as press
media might have the public believe (Bor, 2007). If airlines could quell unruly
passengers it may reduce the frequency of negative experiences for other passengers.
Strict implementation of no-alcohol policies and further training in passenger
management for airline staff (for example: understanding the psychology behind
aggressive passengers and how to counteract this) have the potential to reduce the
stress and negative experience caused by fellow passengers’ behaviour.
199
7.5.3 The Airport Experience
Many of the complaints could be driven by interactions with third party employees.
Most airports in the UK and Europe employ contract staff to handle ticketing and
baggage checking. These employees serve the airport, not the airline, and many often
work check-in procedures for multiple carriers. It is extremely difficult for the airline
to have any influence over these personnel as they are employed by third-party
companies. Most of the negative comments on Staff Friendliness involve interactions
with such staff. Therefore, it becomes difficult to determine exactly what part of the
dissatisfaction can be attributed to the airline. What is clear however, is that the airport
experience influences consumers’ opinions of the airline. It seems that some
consumers tend to evaluate the entire flight experience (ground side and air side) as a
whole. However, many of the “Would Recommend” group seem to be able to
distinguish between the airport side of the experience and the in-flight side.
EasyJet complaints about uncomfortable departure lounges came from
passengers at smaller (class D) airports. The nature of this complaint was similarly
found in Ryanair and demonstrates that some aspects of service tangibles (such as
comfortable departure lounges) may be lost at smaller airports. Several customers
complained about the departure lounge at the Budapest airport:
“25 minutes wait before boarding. No seats, no ventilation and very poor
lighting. In fifty years of travelling on most Continents it was the worst embarkation
experienced.”
“In Budapest, passengers have to walk within fences on the airport field, then
wait on cattle-like ware-house, without seats, water, toilets or food, for minimum 30
minutes.”
However, while complaints of poor facilities in departure lounges were
frequent, there were fewer complaints from interactions with staff at smaller airports.
With the overall increased efficiency of check-in and security at smaller airports, and
200
the lower arrival and departure slot fees charged to airlines, it is understandable why
the design of departure lounges is not an immediate concern to most LCCs. However,
as traffic increases it is likely that the smaller airports utilised by LCCs will improve
their facilities.
7.5.4 Value for Money
Examination of the Ryanair “Would Recommend” group reveals Value for Money to be
a very strong driver of consumer's decision making. Often passengers talk of Ryanair
enabling the possibility of travel, where beforehand it was much too expensive.
“I would like to say that if it was not for Ryanair and its cheap flights I would
not be able to fly as much as I do.”
“I can go home and get away for a cheaper price than a train ticket to London
from Manchester.”
And comments even relate Ryanair’s value to traditional carriers:
“I fly for business about twice a month and use various airlines from
Manchester and to be honest the difference between KLM and Ryanair for example is a
free juice a muffin and about 300 quid.”
As Value for Money is one of the principal aims of the LCC business model, it is
affirming that this contributes to a positive Service Quality Experience.
However, it is useful to note that Value for Money may not be achieved if a
passenger requires extensive additional costs to be added to their base ticket price. For
example, a couple with an infant flying on Ryanair that required an additional 20 kg
bag, along with the infant’s car booster or travel cot added, would be charged an
additional £120 for the journey (£20 per 20 kg bag, £20 infant fee, £20 infant
equipment fee, per flight). This may place the LCC in the same price bracket as the
traditional carriers, who may not charge for these items (for example, most traditional
carried have an allowance of one additional 23 kg bag for free). However, having split
201
pricing allows the customer to pick and choose what elements of service are important
to them, allowing for a more tailored experience in regards to cost.
7.6 Limitations
Coding in the NVivo software helped to mitigate many of the traditional limitations of
content analysis research (Morris, 1994). The primary limiting factor for this study was
the data source; most significantly, the limited number of responses and the lack of
temporal and airport specific information. While qualitative methods do not usually
require large samples (Mayring, 2004), coding of the Skytrax study came from only the
responses available on their website. The website does provide a time and date stamp
for each response; however, it is impossible to determine the amount of time between
the customer’s flight experience and when they left a response on Skytrax.
Furthermore, Skytrax does not record the respondent’s route or the airports involved.
Several comments mention particular routes or airports, but there is no requirement to
do so. Having this information would allow researchers to pinpoint particularly
problematic airports. Airports which consistently resulted in a bad Service Quality
experience could be excluded from future routes, if there was an alternative airport
available. Additionally, there was no confirmation of the respondent's identification.
While Skytrax does not permit anonymous responses, it does not have any means of
verifying the respondent actually flew with the airline that they rated. However, these
limitations are relatively minor when compared to Skytrax’s ease of accessibility, layout
that provides efficient coding, and engagement of responses.
7.7 Conclusion
202
Consumer watch-groups have been around for a long time and are still as popular
today as they were in the early 1950s. They still remain important players in the
marketplace; however, their format has changed extensively in recent years. The
popularity of print media seems to be waning in the face of internet based sources
(Bakos, 1998; Ratchford, Talukdar, & Lee, 2001; Ward & Lee, 2000). Online sources
not only have the distinct advantage of reaching a wider audience, but they are usually
free to the consumer, unlike most print media. They are also easily shared via social
media, and are becoming increasingly more trusted by the public. Like print based
watch-groups, some internet based groups deploy field agents to collect primary data;
however, they have the added advantage of easily compiling individual consumer
opinions on an ad hoc basis and efficiently displaying the results to the public. This has
led to internet recourses becoming the dominant players among industry watchers
(Brunger, William; Perelli, 2009; Ratchford et al., 2001).
Skytrax is a very good specialised aviation-industry watcher. Aside from the
field data collected by their researchers, they publish a separate rating based on
consumer opinions. Fortunately, these tend to be congruent (for example, the field
rating for Ryanair is two stars and the consumer opinion rating is also two stars).
TripAdvisor’s focus is much wider, yet it still does an exceptional job of collecting
consumer opinion data. When the customer comments are analysed, an interesting
uniformity appears. It appears many of the criticisms left by Ryanair customers (such
as Staff Unfriendliness) are shared by EasyJet customers. This is also true for
customers’ positive responses.
The Skytrax result is congruent with the TripAdvisor ratings. Although
TripAdvisor does not collect comments that could be used in content analysis, the
website does list several quality categories: Value, Check-In Experience, Punctuality,
Baggage Handling, Seat Comfort, In-Flight Service, In-Flight Amenities and
Reasonableness of Fees. These categories are synonymous with the nodes that were
203
coded in the Skytrax study and gives further support to the findings of the Skytrax
study.
The uniformity of topics between the “Would Recommend” and “Would Not
Recommend” groups of both airlines demonstrates the importance of these issues to
the consumer. An explanation may be found in the observation that Ryanair had more
negative comments relating to confusion or ignorance of policies and procedures than
EasyJet. This may be in part to the design of the Ryanair website (at the time of this
study)19. It seems that enjoyment of the Ryanair experience hinges on having full
knowledge of their policies and procedures. Ryanair does provide the consumer with
the necessary information, and many seem to understand it clearly; however, there is a
great number that do not. Passenger's ignorance can also lead to greater difficulty at
boarding and check-in and reduce ground-side operational efficiency. Improved
education protocols could help Ryanair to greatly improve ground-side efficiency
thereby adhering to Ryanair’s operational philosophy of cost-reduction.
This study identified the key determinants of Service Quality in the low-cost
airline industry through in-depth content analysis of secondary qualitative data. These
five determinants were: Boarding and Check-in, Baggage Handling and Policy, Penalty
Fees and Staff Behaviour. Identifying these factors could be valuable to low-cost
airlines attempting to improve their Service Quality; these determinants could be
monitored specifically and targeted for improvement. They could also be applied to
further academic research and will play a key role in developing an objective metric for
Service Quality in Chapter eight of this thesis.
19 As of March 2014, the Ryanair website has been significantly redesigned to
become more simple and highlight key areas where additional charges may be implemented. It would be interesting to conduct a follow up study to determine what effect this new website has had on consumer education and the overall passenger experience.
204
CHAPTER EIGHT: THE AIRLINE SERVICE QUALITY INDICATOR
8.1 Introduction
Chapter Eight seeks to achieve the third objective of this thesis: can an AQR type
metric be constructed for the UK market? Chapter Seven identified the specific
determinants for Service Quality in the airline industry, and Chapter Six used a
quantitative scale to give an overall view of the relationships of Service Quality in the
UK LCC airline industry. Chapter Eight generates a practical measurement of Service
Quality that will allows for the comparison of results between airlines, in this case
Ryanair and EasyJet.
While Chapter Six provided a theoretical view of Service Quality in the LCC
airline industry which is beneficial to researchers of Service Quality (particularly those
focusing on context specific research such as the airline industry), the research
conducted in Chapter Eight will benefit industry professionals and consumers by
providing them with an easily understood and longitudinally comparable metric for
measuring Service Quality in the UK low-cost airline industry. This study has the
potential to represent a possible shift toward more objective measurements of Service
Quality through the creation of an instrument (ALSI) that uses quantitative secondary
data relating to a given set of constraints to generate a Service Quality score for each
airline.
In addition to addressing the third objective of this thesis to determine if an
AQR type metric be constructed for the UK market, ALSI can also be used to answer
the fourth objective of this thesis: can Service Quality related be to an airline’s
profitability? This question was justified in Chapter Three, when the importance of
ancillary revenue to airlines’ profitability was highlighted. By establishing a
relationship between Service Quality and ancillary revenue, the importance of Service
205
Quality (in relation to profitability) can be justified to the airline industry. This
relationship can be demonstrated by longitudinally comparing each airlines’ ALSI score
to the corresponding ancillary revenues. This should provide a clear indication of a
relationship if it exists between an airline’s level of Service Quality and their ancillary
revenues.
The results of the qualitative study in Chapter Seven were used in the
construction of the Chapter Eight model in comparison with the AQR factors. Several
challenges in constructing the Chapter Eight model were identified: identifying the
variables, finding appropriate data sources in the UK and assigning weights to the
individual variables of the indicator to address the lack of dimensionality found in the
AQR (Gardner, 2004).
The study in Chapter Seven used a purely subjective methodology and the
survey in Chapter Six provided a quantitative, yet still subjective, approach to
measuring Service Quality. This Chapter investigates a third possible measurement of
airline quality by presenting a slightly more objective approach than the previous two
methods. The subjective measurements (for example, qualitative methods or the more
quantitative methods of SERVQUAL and HiQUAL) maintain an internal reality
assumption. That is, their philosophical approach assumes that Service Quality is a
construct that resides within the individual (as illustrated in Chapter Five). Subjective
measures rely on the individual's perception to determine Service Quality. The external
reality assumption assumes that Service Quality is a separate construct from the
individual and exists within nature as a construct separate from the individual.
Objective measurements should be treated as high-order measurements,
relying on subjective means to establish their parameters. Therefore, any objective
metric of Service Quality must first establish itself subjectively. A novel objective
instrument (ALSI) was created in order to demonstrate this concept. This study
produces an instrument similar to the AQR (Headley & Bowen, 1997) that fits the
206
context of the UK low-cost airline industry and modern Service Quality Theory and
demonstrates the viability of conceptualising Service Quality in objective terms.
The unique index created in this study is the Airline Service Quality Indicator
(ALSI). While ALSI is wholly unique in its application, it’s construction is largely based
on the AQR (Bowen, Headley, and Luedtke, 1991). The AQR was specifically designed
to fit the data rich US airline industry. In the UK and Europe, much of the data
required to fit many of the AQR’s variables are unavailable. Therefore, ALSI is required
to redefine its own factors to fit the UK LCC market. These factors are taken from the
content analysis study in Chapter Seven. The values for each factor come from publicly
available sources (airline's annual reports) and the weights are derived from the survey
data collected along with the HiQUAL study.
Like the AQR, the great advantage of ALSI is that it utilises quantifiable data
obtained directly from industry sources. Most of the data comes from the airline’s own
published annual report or government sources such as the Civil Aviation Authority
(CAA). Using governmental or other regulated sources should give validity to the data
and reduce bias.
8.2 The Variables
The variables in ALSI get justification directly from the findings of the content analysis
in Chapter Seven and are supported by the AQR (Bowen et al., 1991, 1992). This section
provides an in-depth description of the ALSI variables and justification for their
inclusion or a detailed explanation of their exclusion.
When comparing variables of the AQR to ALSI, applicability had to be taken
into account; the AQR uses many variables that may not relevant in the context of the
LCC industry (such as Denied Boarding or Lost Baggage) due to the differing operation
strategies of low-cost and traditional airlines. The selection of variables is also limited
by the amount of industry data collected within the United Kingdom and European
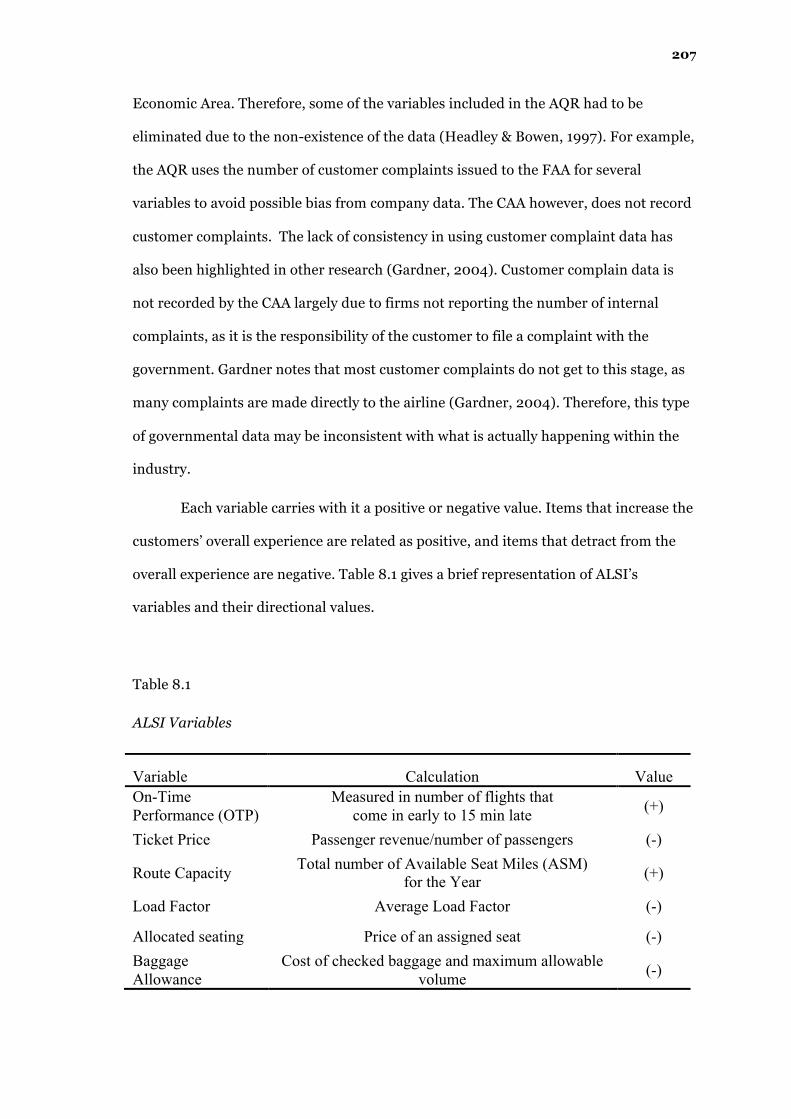
207
Economic Area. Therefore, some of the variables included in the AQR had to be
eliminated due to the non-existence of the data (Headley & Bowen, 1997). For example,
the AQR uses the number of customer complaints issued to the FAA for several
variables to avoid possible bias from company data. The CAA however, does not record
customer complaints. The lack of consistency in using customer complaint data has
also been highlighted in other research (Gardner, 2004). Customer complain data is
not recorded by the CAA largely due to firms not reporting the number of internal
complaints, as it is the responsibility of the customer to file a complaint with the
government. Gardner notes that most customer complaints do not get to this stage, as
many complaints are made directly to the airline (Gardner, 2004). Therefore, this type
of governmental data may be inconsistent with what is actually happening within the
industry.
Each variable carries with it a positive or negative value. Items that increase the
customers’ overall experience are related as positive, and items that detract from the
overall experience are negative. Table 8.1 gives a brief representation of ALSI’s
variables and their directional values.
Table 8.1
ALSI Variables
Variable Calculation Value On-Time Performance (OTP)
Measured in number of flights that come in early to 15 min late (+)
Ticket Price Passenger revenue/number of passengers (-)
Route Capacity Total number of Available Seat Miles (ASM) for the Year (+)
Load Factor Average Load Factor (-)
Allocated seating Price of an assigned seat (-) Baggage Allowance
Cost of checked baggage and maximum allowable volume (-)
208
8.2.1 On-‐Time Performance
On-Time Performance is a measure of an airline’s punctuality. Records of missing or
late flights are kept by the CAA and IATA with impressive accuracy. ALSI Measures
On-Time Performance as a component of flight delays expressed as a percentage of
total flights. A flight is considered on-time if it arrives early, up to fifteen minutes late.
This attribute is almost universally agreed upon as a factor throughout the airline
quality literature (Bishop et al., 2011; Bowen & Headley, 1993; Elliott & Roach, 1993).
The AQR identifies On-Time Performance as a measurement of a firm's reliability
(Bowen & Headley, 2007; Bowen et al., 1991, 1992; Bowen & Headley, 1993). On-Time
Performance was also identified as an important factor to consumers’ evaluation of
airline quality during the Skytrax study in Chapter Seven. Furthermore, EasyJet's
“Customer Satisfaction Survey” (CSAT) claims that On-Time Performance was strongly
related to consumers’ repurchase behaviour, willingness to recommend and overall
satisfaction; however, they offer no detail as to the strength of these relationships
(“EasyJet, Plc. Annual Reports and Accounts 2013,” 2014, p. 54).
Annual Data for this variable in ALSI was gathered from the CAA’s yearly-
published punctuality statistics report. This is presented in number of minutes the
flight arrived early. Early flights are defined as any flight arriving more than 15 minutes
ahead of its scheduled time. This variable carries a positive value, with a greater
number of on-time or early aircraft for the year represents better Service Quality.
8.2.2 Ticket Price
The AQR included Ticket Price as a measure of reliability (Bowen et al., 1991). Data was
collected from each firm's annual report. This is a highly dynamic and competitive area
for LCCs operating within the UK. One characteristic found in many LCCs is that
ticketing is done in-house through proprietary company websites (some firms such as
209
EasyJet or Jet2.com may sell tickets through third party sites, but this makes up for a
small majority of overall sales). This gives the firms total control over pricing and
scheduling. This condition offers a unique context to study the effect consumers'
perceptions and opinions on pricing (for example, Service Quality or Brand Identity).
With the LCCs, unlike traditional carriers, ticket sales are not the result of a third
party’s marketing efforts; rather, they carry the full weight of the firm's brand image
(Service Quality is a factor in brand image).
This variable carries a negative value. High fares negatively impact the
consumers’ overall experience (Bowen & Headley, 2007; Bowen et al., 1991; Park et al.,
2004, 2009). This value can be found in the airlines’ average fare for the year. Ryanair
reports this figure directly; however, EasyJet requires that it be calculated by dividing
Total Revenue by Total Passengers to produce a comparable value.
8.2.3 Route Capacity
Responses from the qualitative study in Chapter Seven indicated that overly crowed
aircraft were a factor influencing passengers’ Service Quality. However, an increase in
route capacity can result in lower passenger volumes per flight, along with more
flexible scheduling for booking flights. Therefore, a higher route capacity offered by an
airline should increase the overall quality of the service to the consumer.
The original AQR used size of fleet and number of airports served as measures
of responsiveness. Measuring these variables individually does not give a clear picture
of Service Quality. While size of fleet may be a good measure of financial performance,
route capacity may be a better measurement of Service Quality. Additionally, the
number of airports served only provides an illustration of market size. When
measuring the level of Service Quality offered within a given market, it is route capacity
that adds value to the consumer's experience.
210
Route capacity is represented in airline’s annual reports as Available Seat Miles
(ASM) or Available Seat Kilometres (ASK). Ryanair reports ASM and EasyJet prefers
ASK, they both give the same information, but in different units. Therefore, in order to
maintain consistency of measures EasyJet's ASK values are converted to ASM for the
calculation of ALSI. This variable carries a positive value as an increased route capacity
leads to less congestion within cabin space and greater choice for the passenger when
choosing flights.
8.2.4 Load Factor
Load Factor is the percentage of aircraft total capacity that is used per flight. As ticket
prices decrease and the demand for air travel increases, high load-factors are certain to
become commonplace in the LCC environment. Load Factor is a measurement of
aircraft crowdedness. While Route Capacity relates to the number of available flights
along a given route, Load Factor illustrates the fullness of the aircraft. The qualitative
study in Chapter Seven identified that crowded aircraft cabins can result in more noise
and discomfort for the passenger. The AQR has never taken Load Factor into
consideration. However, the results of the content analysis study offer support for the
inclusion of this variable.
Load Factor data is obtained directly from airlines’ annual reports. It is
reported as percentage of total aircraft capacity. The variable carries a negative value.
This is because higher load factors seem to negatively impact the consumers’ overall
experience (Bowen & Headley, 1993).
8.2.5 Allocated Seating
Allocated Seating is a functional quality and gives the study greater balance between its
positive and negative measures. The AQR did not include assigned seating as a
211
variable. This is most likely because the AQR is designed for US carriers and all firms in
that market offer assigned seating. As outlined in Chapter Three, unlike traditional
carriers (or their North American counterparts), not all UK LCCs offer assigned seating
or baggage allowance. Typically, LCCs offer the option to purchase allocated seating.
The content analysis study revealed that purchasing allocated seating can
greatly improve the passengers’ overall experience. EasyJet's “Customer Satisfaction
Survey” (CSAT) also found that allocated seating was strongly related to consumers’
repurchase behaviour, willingness to recommend and overall satisfaction (EasyJet,
PLC. Annual Report, 2013, p.54). While both airlines have historically offered the
option to buy allocated seats, currently the only LCC offering this as an inclusive
service is EasyJet. They see this as a way of differentiating themselves from Ryanair to
gain a competitive advantage20. Therefore, this variable is represented as a function of
the price the airline charges for the allocated seat. Therefore, this variable carries a
negative value, as lower charges for allocated seats are an advantage to the consumer.
8.2.6 Baggage
Baggage can be evaluated from a number of different aspects, including lost or
mishandled baggage, baggage allowance, cost per baggage item and cabin baggage.
Lost or mishandled baggage is a concern for every air traveller. Flight delays, increased
security, and transfer traffic all contribute to the efficiency of baggage handling
(Walker, 2008). Many aging baggage handling systems are strained due to an increase
of passenger traffic through airports, further increasing the risk of baggage damage and
loss. Having a bag lost or mishandled could certainly have a negative impact on the
passengers’ experience; however, this variable was not included in the ALSI equation
20 It is possible that allocated seating might become inclusive with Ryanair in the
near future following the implementation of their new customer service strategy (Ryanair, PLC. 2013).
212
for three reasons. First, there is very little consistent data describing the frequency or
quantity of lost or mishandled luggage. While there is some general industry data
available, it is not airline specific. While Ryanair publishes its lost or mishandled
baggage figures in their annual report, EasyJet does not. Secondly, it is difficult to
attribute fault in a lost or mishandled baggage claim. After a passenger checks their
bag, it can pass through several independent personnel and automated systems before
reaching the aircraft. This makes it very difficult to determine where, along a very
complex network, the fault happened. However, once a bag has been lost, it becomes
the responsibility of the airline to return it to the consumer. This often results in a net
loss for the airline as recovery of the lost bag can become expensive (Walker, 2008).
Finally, as illustrated in Chapter Five, there is less risk of lost baggage in LCCs because
the point-to-point route structure allows fewer chances for loss than in traditional
carriers. In 2013, Ryanair lost less than 1 bag per 3,000 passengers in 2013 (Ryanair
Annual Report, 2013; p.5). This is minimal when compared to traditional carriers
where a passenger can have as high as a one in 60 chance of having a bag lost (Walker,
2008). Unfortunately, the CAA or the IATA does not have clear data reporting on lost
or mishandled baggage. However, the results of the Skytrax content analysis study and
the Chapter Six survey both indicate that baggage is an important topic to LCC
consumers. Some airlines report it in their annual report, while others do not, and it is
often unclear whether the responsibility was that of the airline or the airport.
As data for lost and mishandled baggage was therefore not available, this study
examined baggage only from a value-based perspective, specifically via baggage
allowances and baggage costs. Airlines can modify their baggage allowances as a means
of differentiating themselves. These allowances have existed largely unchanged over
the last six years; however, in 2014 Ryanair began to remove fees for a second checked
bag as a way of differentiating itself from EasyJet. Therefore, this measure was taken
into consideration along with the total cost per kilogram of two checked bags.
213
Furthermore, most of the responses from the content analysis study related to
cabin baggage. This was represented in this study as the total volume of cabin baggage
allowed. As it was impossible to capture both cabin baggage volume and checked
baggage allowances within the same measure, ALSI therefore contained two variables
relating to baggage: Total Cabin Baggage Volume (a positive value) and Cost per kg of
Checked Baggage (a negative value). These values are available from the airlines’
annual filings.
8.2.7 Average Age of Aircraft
Traditional carriers often operate older models of aircraft. Some older aircraft are less
comfortable for passengers than their modern counterparts. This is largely due to
improvements in engine efficiency that result in lower noise, improved cabin layout,
better facilities, and improved fuselage insulation. LCCs tend to rely on modern, ultra-
efficient aircraft to maintain profitability. Although Average Age of Aircraft was found
in the original AQR study, however the average age of fleet is not mandatory reporting
for UK carriers. Therefore data may be difficult to calculate for this measurement as it
is not required reporting in the United Kingdom. For these reasons it must be excluded
from ALSI.
8.2.8 Number of Accidents
Bowen, Headley and Luedtke (1991) assign a relatively heavy weight to this variable;
yet removed it completely in their 2003 AQR re-examination. Unfortunately, the CAA
or Department for Transport does not regularly publish statistics in this area.
Furthermore, most of the UK’s LCCs have outstanding safety records; therefore, for
many of them this figure would be zero. However, it is very typical for an airline
accident to be reported in the news; one accident could therefore have a negative
214
impact on an airlines’ Service Quality. This is particularly true if an accident is related
to poor pilot performance or maintenance, and this could result in a negative Service
Quality perspective. If an accident was seen as being out of control of the airline it may
have a neural effect of customers' perceptions of performance. Conversely, some
accidents may produce positive emotions toward the airline, such as US Airways flight
1549 that landed in the Hudson River following multiple bird strikes. Following the
crash, and the airline’s vast public relations campaign, the airline developed a
reputation for having highly experienced and safe pilots.
Within the Skytrax responses in the content analysis study, there was almost no
mention of airline safety mentioned. This may be due to airlines being generally very
thorough with their passenger safety (for example, the mandatory passenger safety
checks at the start of each flight), and very few individuals who fly are ever involved in
an accident: IATA reported in 2013 that out of 3 billion people who flew on commercial
aircraft that year, there were only 210 fatalities and 81 accidents. Therefore, this
variable will not be included in ALSI.
8.2.9 Employee Contentment
Justification for the inclusion of Employee Contentment is derived from the literature.
Employee satisfaction is the first link in the Service/Profit Chain (Heskett, Sasser, and
Schlesinger, 1997). It is assumed that happier employees should provide a better
service than displeased employees (Loveman, 1998). However, because many LCCs
have high rates of labour utilisation as part of their business strategy, employee
dissatisfaction may be more prevalent than in traditional carriers. Many of the
complaints from the Skytrax study (Chapter Seven) seem to illustrate interactions with
angry, rude, or unfair employees, even if this was not directly stated. Employee
Contentment can be measured as by the average yearly rate of turnover, however
Ryanair do not have employee turnover data available for collection, so this variable
215
was excluded from ALSI.
8.3 Methodology
The ALSI data was gathered from available industry and government sources and input
into a spreadsheet. Data was collected longitudinally from 2008 to 2013. The outputs
of ALSI are easily calculated and understood. They are the summation of each
individual variable divided by its respected weight.
ALSI=[(w�H1)+(w�H2)+(w�H3)...] ÷ [w�+w�+w�....]
The weights were generated from the responses to the survey (the details of this
survey are outlined in the previous chapter). This produced a raw score that was
comparable between airlines and longitudinally across years (2008-2013). The
secondary data used in ALSI, being sourced from industry and government, resulted in
a high degree of validity for ALSI. After establishment, this measurement can be
repeated on a scheduled basis (quarterly, or yearly) and can therefore produce notable
trends in airline Service Quality.
The individual variables were measured during the survey that collected the
HiQUAL items from Chapter Six. Responses (n=150) were recorded on a five-point
Likert-type scale and range from Not Important to Very Important. These were recoded
as numerical values in SPSS ranging from -2 to +2. This is reflective of the wording of
the scale as the midpoint was a No Opinion option. This recoding allowed the midpoint
to maintain the zero value and gave positive or negative values to the other options.
Table 8.2 gives the means of responses to each variable.
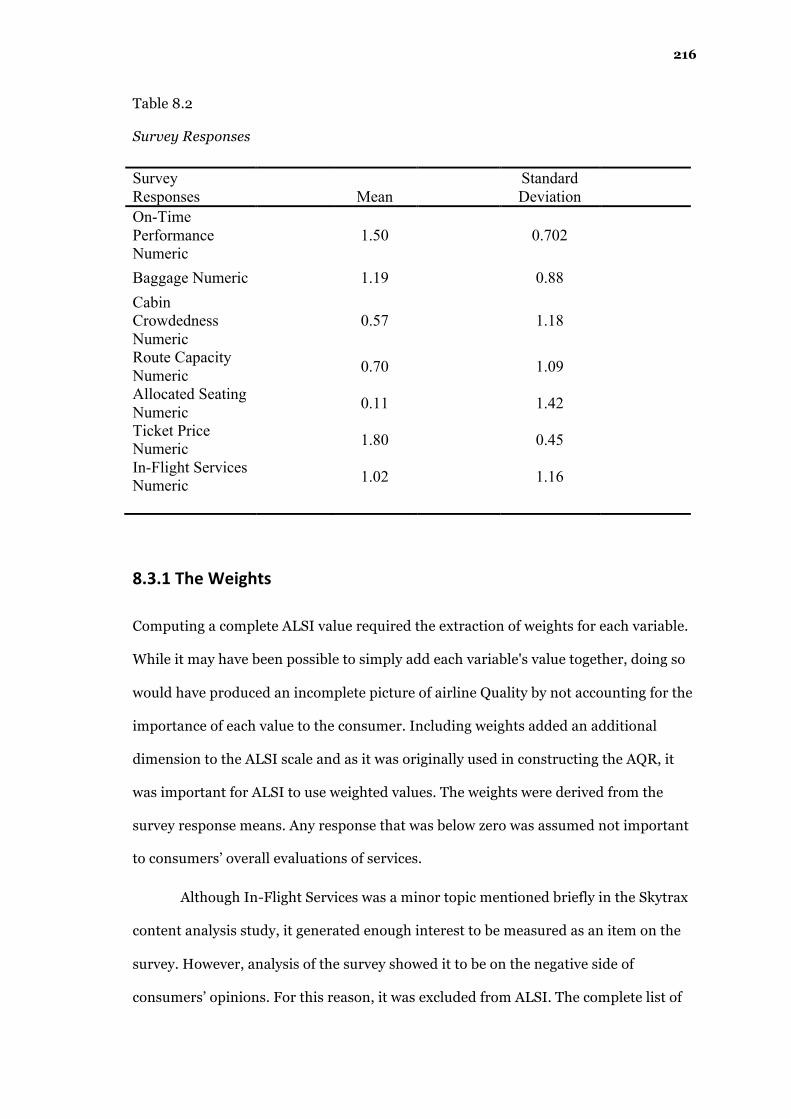
216
Table 8.2
Survey Responses Survey Responses Mean
Standard Deviation
On-Time Performance Numeric
1.50 0.702
Baggage Numeric 1.19 0.88 Cabin Crowdedness Numeric
0.57 1.18
Route Capacity Numeric 0.70 1.09
Allocated Seating Numeric 0.11 1.42
Ticket Price Numeric 1.80 0.45
In-Flight Services Numeric 1.02 1.16
8.3.1 The Weights
Computing a complete ALSI value required the extraction of weights for each variable.
While it may have been possible to simply add each variable's value together, doing so
would have produced an incomplete picture of airline Quality by not accounting for the
importance of each value to the consumer. Including weights added an additional
dimension to the ALSI scale and as it was originally used in constructing the AQR, it
was important for ALSI to use weighted values. The weights were derived from the
survey response means. Any response that was below zero was assumed not important
to consumers’ overall evaluations of services.
Although In-Flight Services was a minor topic mentioned briefly in the Skytrax
content analysis study, it generated enough interest to be measured as an item on the
survey. However, analysis of the survey showed it to be on the negative side of
consumers’ opinions. For this reason, it was excluded from ALSI. The complete list of
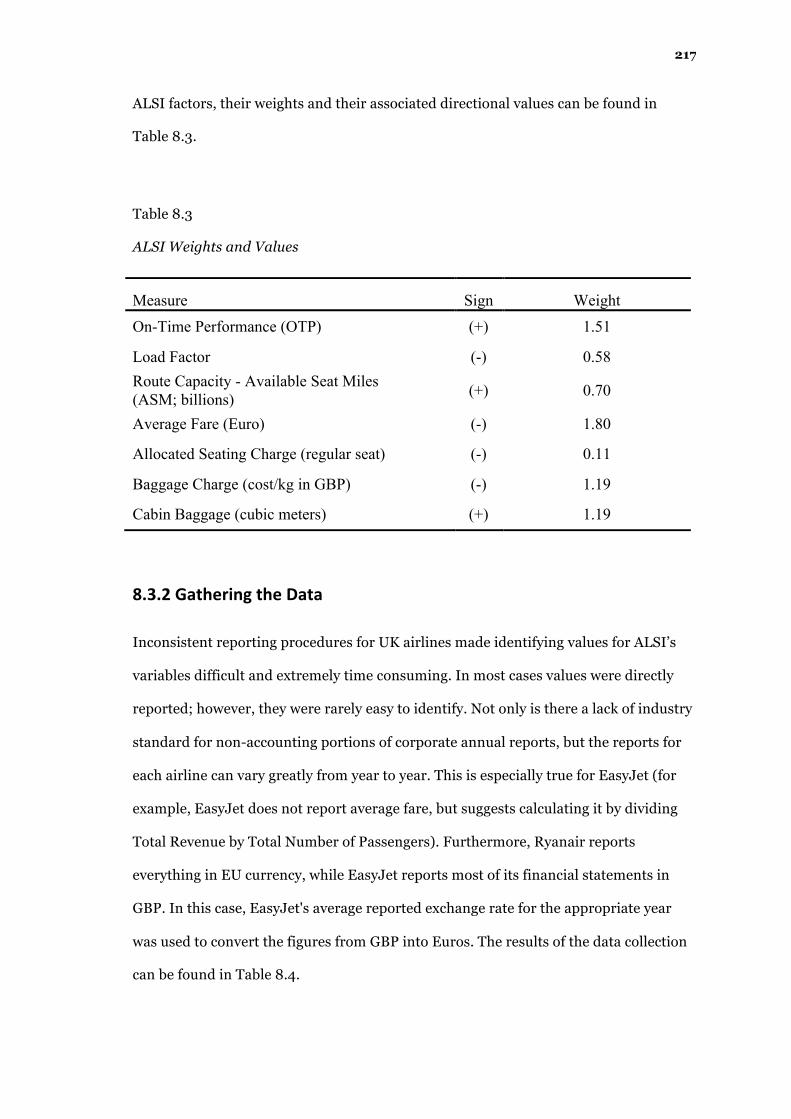
217
ALSI factors, their weights and their associated directional values can be found in
Table 8.3.
Table 8.3
ALSI Weights and Values Measure Sign Weight On-Time Performance (OTP) (+) 1.51
Load Factor (-) 0.58 Route Capacity - Available Seat Miles (ASM; billions) (+) 0.70
Average Fare (Euro) (-) 1.80
Allocated Seating Charge (regular seat) (-) 0.11
Baggage Charge (cost/kg in GBP) (-) 1.19
Cabin Baggage (cubic meters) (+) 1.19
8.3.2 Gathering the Data
Inconsistent reporting procedures for UK airlines made identifying values for ALSI’s
variables difficult and extremely time consuming. In most cases values were directly
reported; however, they were rarely easy to identify. Not only is there a lack of industry
standard for non-accounting portions of corporate annual reports, but the reports for
each airline can vary greatly from year to year. This is especially true for EasyJet (for
example, EasyJet does not report average fare, but suggests calculating it by dividing
Total Revenue by Total Number of Passengers). Furthermore, Ryanair reports
everything in EU currency, while EasyJet reports most of its financial statements in
GBP. In this case, EasyJet's average reported exchange rate for the appropriate year
was used to convert the figures from GBP into Euros. The results of the data collection
can be found in Table 8.4.
218
Other data that was thought to be interesting to the LCC context was also
collected (Table 8.5). This dataset further highlights the non-uniformity of airline
performance reporting in the UK. Several of these measures would be interesting to
compare between groups; however, the information is unavailable. For example,
Ryanair reports in-flight sales and EasyJet only reports ancillary revenues. EasyJet also
reports yearly staff turnover, and Ryanair does not. While this does not directly
influence the ALSI calculation, it is interesting for comparison.
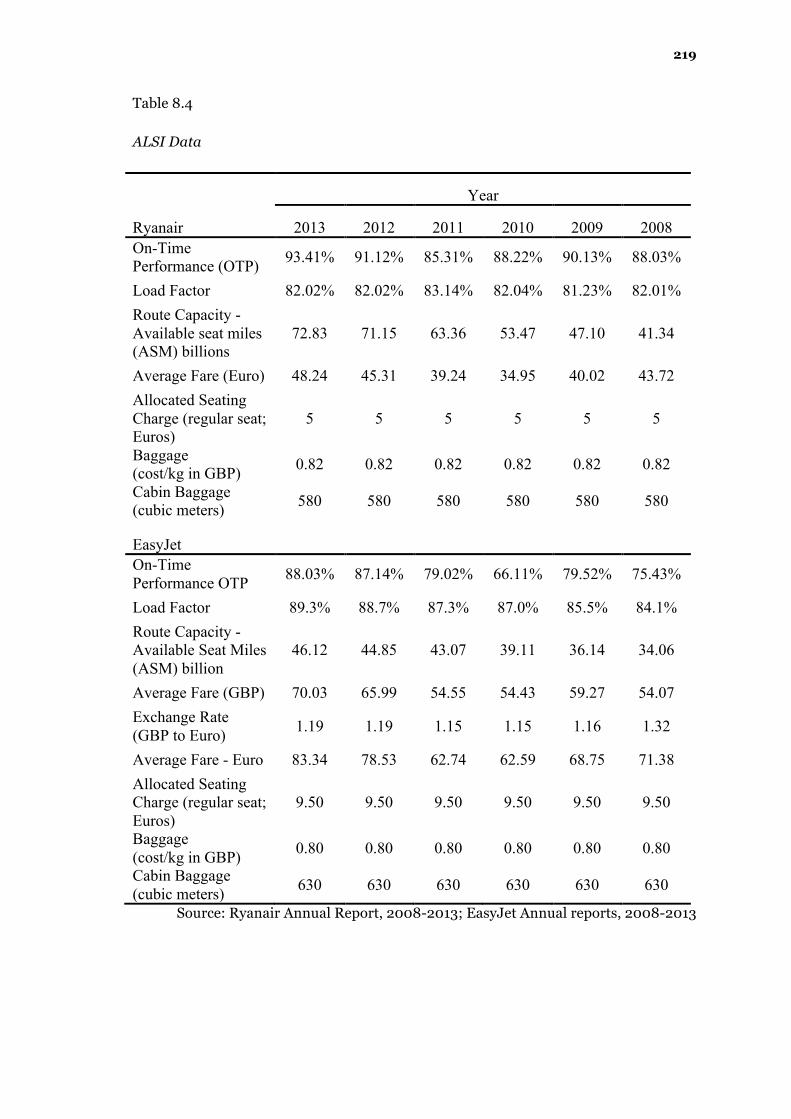
219
Table 8.4
ALSI Data
Year
Ryanair 2013 2012 2011 2010 2009 2008 On-Time Performance (OTP) 93.41% 91.12% 85.31% 88.22% 90.13% 88.03%
Load Factor 82.02% 82.02% 83.14% 82.04% 81.23% 82.01% Route Capacity - Available seat miles (ASM) billions
72.83 71.15 63.36 53.47 47.10 41.34
Average Fare (Euro) 48.24 45.31 39.24 34.95 40.02 43.72 Allocated Seating Charge (regular seat; Euros)
5 5 5 5 5 5
Baggage (cost/kg in GBP) 0.82 0.82 0.82 0.82 0.82 0.82
Cabin Baggage (cubic meters) 580 580 580 580 580 580
EasyJet On-Time Performance OTP 88.03% 87.14% 79.02% 66.11% 79.52% 75.43%
Load Factor 89.3% 88.7% 87.3% 87.0% 85.5% 84.1% Route Capacity - Available Seat Miles (ASM) billion
46.12 44.85 43.07 39.11 36.14 34.06
Average Fare (GBP) 70.03 65.99 54.55 54.43 59.27 54.07 Exchange Rate (GBP to Euro) 1.19 1.19 1.15 1.15 1.16 1.32
Average Fare - Euro 83.34 78.53 62.74 62.59 68.75 71.38 Allocated Seating Charge (regular seat; Euros)
9.50 9.50 9.50 9.50 9.50 9.50
Baggage (cost/kg in GBP) 0.80 0.80 0.80 0.80 0.80 0.80
Cabin Baggage (cubic meters) 630 630 630 630 630 630
Source: Ryanair Annual Report, 2008-2013; EasyJet Annual reports, 2008-2013
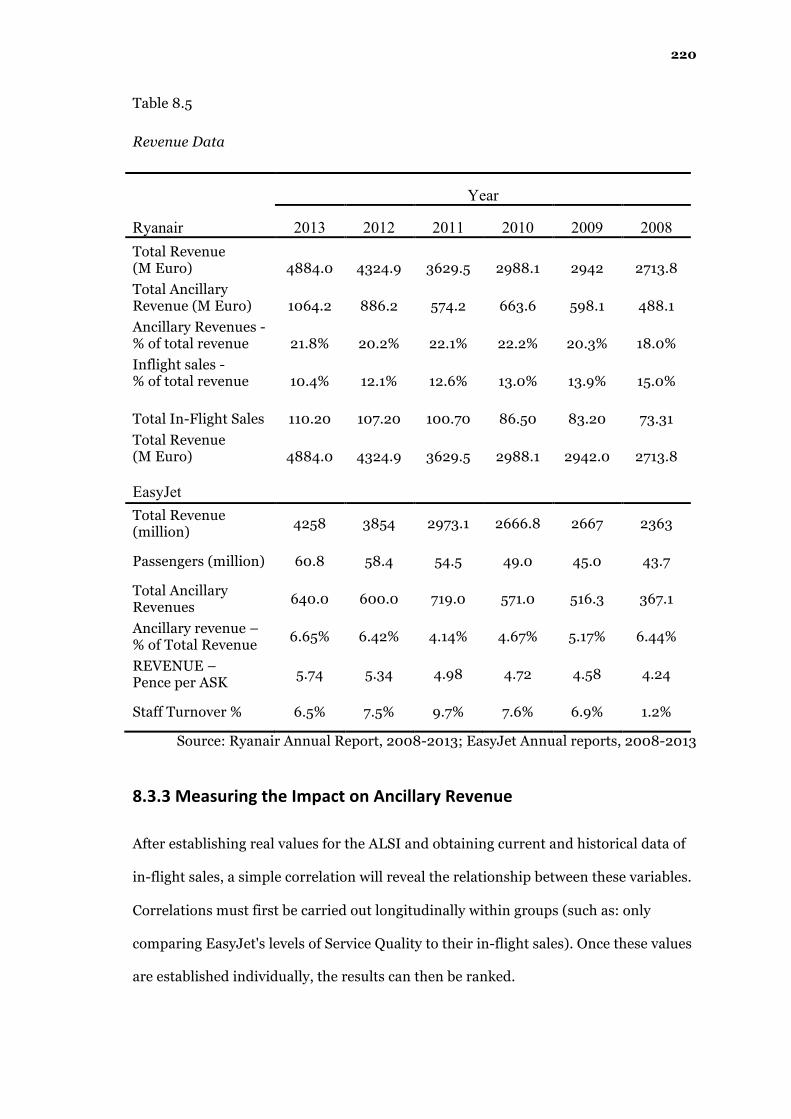
220
Table 8.5
Revenue Data
Year
Ryanair 2013 2012 2011 2010 2009 2008 Total Revenue (M Euro) 4884.0 4324.9 3629.5 2988.1 2942 2713.8 Total Ancillary Revenue (M Euro) 1064.2 886.2 574.2 663.6 598.1 488.1 Ancillary Revenues - % of total revenue 21.8% 20.2% 22.1% 22.2% 20.3% 18.0% Inflight sales - % of total revenue 10.4% 12.1% 12.6% 13.0% 13.9% 15.0%
Total In-Flight Sales 110.20 107.20 100.70 86.50 83.20 73.31 Total Revenue (M Euro) 4884.0 4324.9 3629.5 2988.1 2942.0 2713.8
EasyJet Total Revenue (million) 4258 3854 2973.1 2666.8 2667 2363
Passengers (million) 60.8 58.4 54.5 49.0 45.0 43.7
Total Ancillary Revenues 640.0 600.0 719.0 571.0 516.3 367.1
Ancillary revenue – % of Total Revenue 6.65% 6.42% 4.14% 4.67% 5.17% 6.44%
REVENUE – Pence per ASK 5.74 5.34 4.98 4.72 4.58 4.24
Staff Turnover % 6.5% 7.5% 9.7% 7.6% 6.9% 1.2%
Source: Ryanair Annual Report, 2008-2013; EasyJet Annual reports, 2008-2013
8.3.3 Measuring the Impact on Ancillary Revenue
After establishing real values for the ALSI and obtaining current and historical data of
in-flight sales, a simple correlation will reveal the relationship between these variables.
Correlations must first be carried out longitudinally within groups (such as: only
comparing EasyJet's levels of Service Quality to their in-flight sales). Once these values
are established individually, the results can then be ranked.
221
While this is probably the simplest test in this entire study, it is probably the
most important. Firstly, it establishes the reliability of the ALSI. Most importantly, it
satisfies one of this projects overall aims by providing a picture of the value of Service
Quality to the industry by highlighting the effect on ancillary sales. Testing the effect of
Service Quality on in-flight purchasing is very important to establishing the reliability
of ALSI. If a longitudinal relationship exists between the level of Service Quality of a
given subject within LCC industry and their level of in-flight sales, then ALSI is reliable.
Ryanair directly reports In-Flight Sales as part of Total Revenue on its balance
sheet. Unfortunately, EasyJet does not differentiate revenues on its balance sheet to the
degree of Ryanair. Therefore, it is impossible to determine an exact value for in-flight
sales and ancillary revenues must be examined as a whole. Ancillary Revenues are
anything sold in addition to Passenger Revenues (such as: in-flight meals and
entertainment, rental cars or hotels). Passenger Revenues are revenues associated
directly with the flight (for example, the ticket, extra baggage, priority boarding). Since
ancillary revenues are expected to be influenced by Service Quality, it is important to
examine the ratio of ancillary to total revenue. Examining the raw value for ancillary
revenues helps control for changes in operating strategy that affect total revenue. This
ratio is important because it an increase or decline in the ancillary revenue/total
revenue ratio is reflexive of the value of ancillary revenues in relation to the airlines’
management strategy.
8.4 ALSI Results
As Chapter Five has illustrated, calculation of ALSI is very simple. It involves basic
arithmetic to arrive at a common output. Each year ALSI is calculated represents an
independent measurement. As the values that add to the customer experience are
positive and values that detract for it are negative, a higher ALSI score equates to better

222
service. The results of ALSI are found in Table 8.6 with the highest values for the year
in bold.
Comparing means and standard deviations of ALSI for Ryanair and EasyJet
(Table 8.7) demonstrate the results are relatively close to the mean (Ryanair =1.255;
EasyJet =1.5764). There were no exceptional outliers for either airline across all years,
and the ALSI scores seem to be relatively close to one another as would be expected
among players in the LCC industry where airlines share similar operating strategies.
Standard Q-Q plots indicate that the results of ALSI are relatively close to being
normally distributed for such a small sample size across both Ryanair and EasyJet
(Figures 8.1 and 8.2). The data for the individual variables can also be assumed to be
normally distributed, and many of these are perfectly linear. This close relationship is
further evidenced by the strong correlations between the two airlines (Table 8.8).
The ALSI metric returned values for each year between 2008 and 2013. Scores
for both airlines varied from year to year with Ryanair having a higher score than
EasyJet in all years except 2008 and 2011, when EasyJet outperformed Ryanair. The
data indicates a clear and dynamic trend of ALSI scores and provides an easily
understood illustration of Service Quality by year.
The results indicate Ryanair as having a higher level of Service Quality than
EasyJet in 2013. However, this is below their mean score (µ=92.7501) and indeed is a
lower score than they achieved in 2012, but is still within one standard deviation
(1.255) from the mean. Both airlines seem to increase in their overall service to the
consumer until 2011, when EasyJet loses a considerable amount of its Service Quality.
That year, EasyJet had some serious problems with OTP that predominantly impacted
its ALSI score. As well, an increase in Average Fare and a slight increase in Load Factor
contributed to EasyJet's reduction in Service Quality.
In measuring the impact on ancillary revenue, Pearson-r correlation reveals
strong relationships between the ALSI values and Ancillary Revenue Ratios (Tables 8.9
and 8.10). Ryanair has a positive relationship (r=0.889; p=0.012) between ALSI and
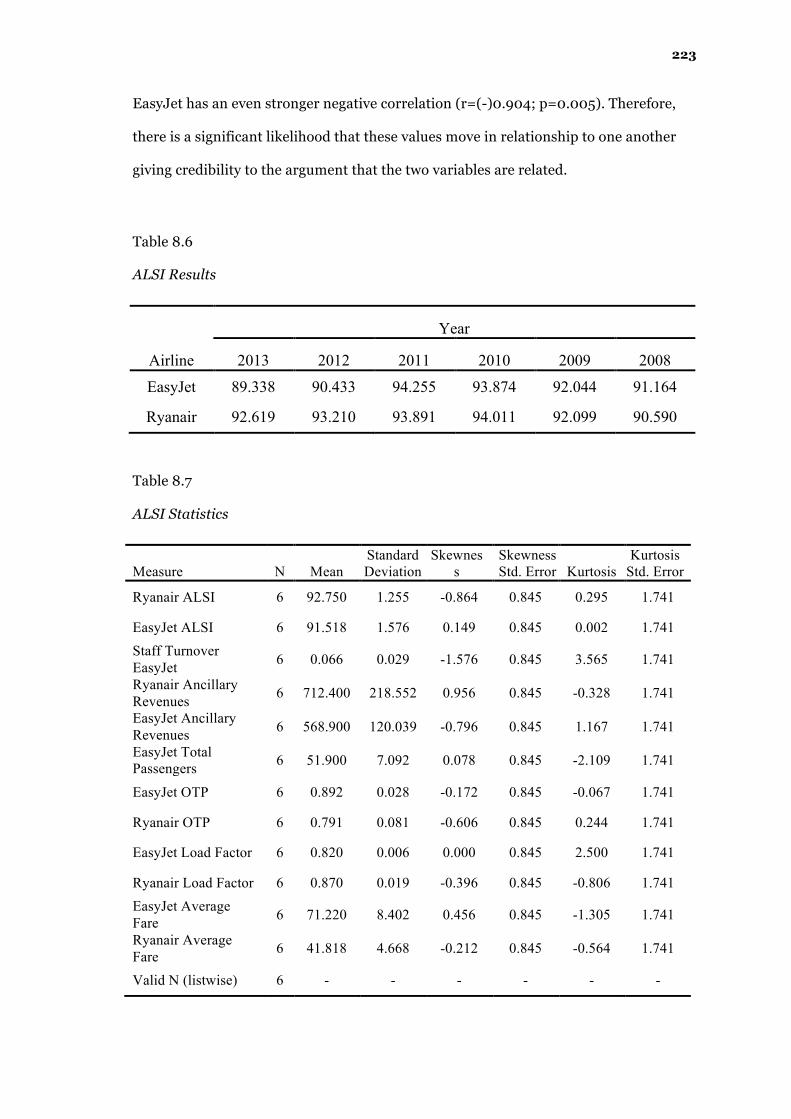
223
EasyJet has an even stronger negative correlation (r=(-)0.904; p=0.005). Therefore,
there is a significant likelihood that these values move in relationship to one another
giving credibility to the argument that the two variables are related.
Table 8.6
ALSI Results Year
Airline 2013 2012 2011 2010 2009 2008
EasyJet 89.338 90.433 94.255 93.874 92.044 91.164
Ryanair 92.619 93.210 93.891 94.011 92.099 90.590
Table 8.7
ALSI Statistics
Measure N Mean Standard Deviation
Skewness
Skewness Std. Error Kurtosis
Kurtosis Std. Error
Ryanair ALSI 6 92.750 1.255 -0.864 0.845 0.295 1.741
EasyJet ALSI 6 91.518 1.576 0.149 0.845 0.002 1.741 Staff Turnover EasyJet 6 0.066 0.029 -1.576 0.845 3.565 1.741
Ryanair Ancillary Revenues 6 712.400 218.552 0.956 0.845 -0.328 1.741
EasyJet Ancillary Revenues 6 568.900 120.039 -0.796 0.845 1.167 1.741
EasyJet Total Passengers 6 51.900 7.092 0.078 0.845 -2.109 1.741
EasyJet OTP 6 0.892 0.028 -0.172 0.845 -0.067 1.741
Ryanair OTP 6 0.791 0.081 -0.606 0.845 0.244 1.741
EasyJet Load Factor 6 0.820 0.006 0.000 0.845 2.500 1.741
Ryanair Load Factor 6 0.870 0.019 -0.396 0.845 -0.806 1.741 EasyJet Average Fare 6 71.220 8.402 0.456 0.845 -1.305 1.741
Ryanair Average Fare 6 41.818 4.668 -0.212 0.845 -0.564 1.741
Valid N (listwise) 6 - - - - - -
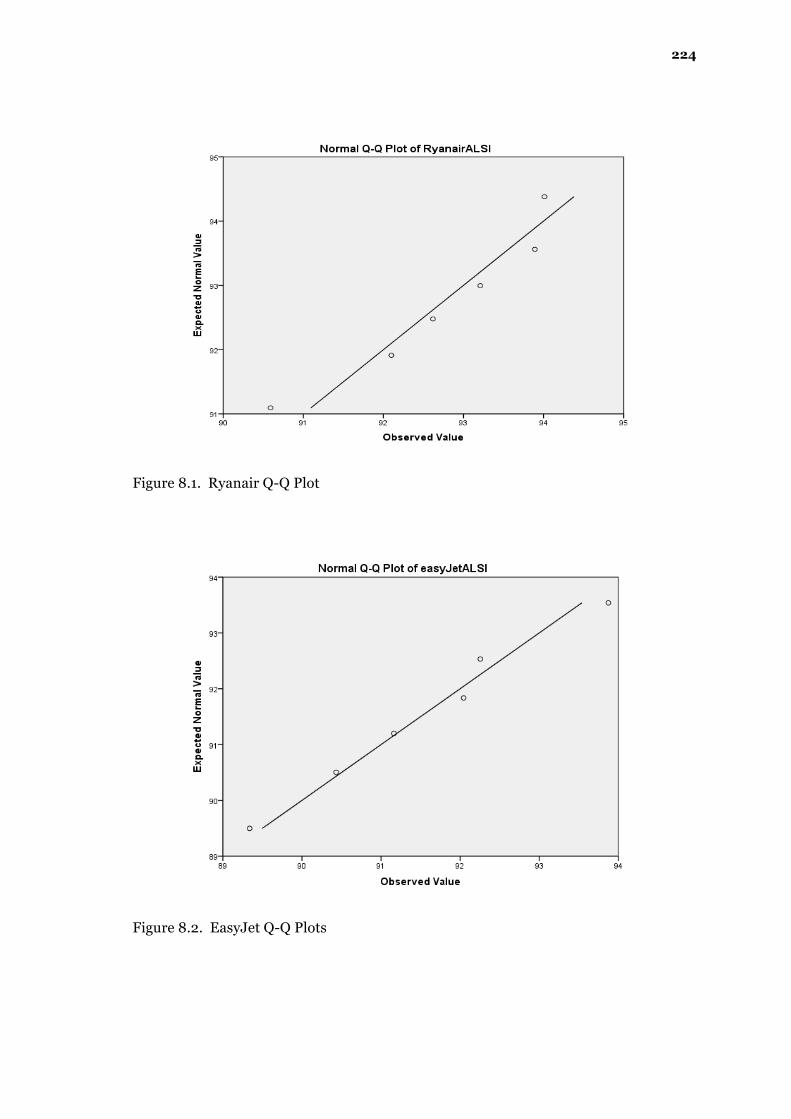
224
Figure 8.1. Ryanair Q-Q Plot
Figure 8.2. EasyJet Q-Q Plots
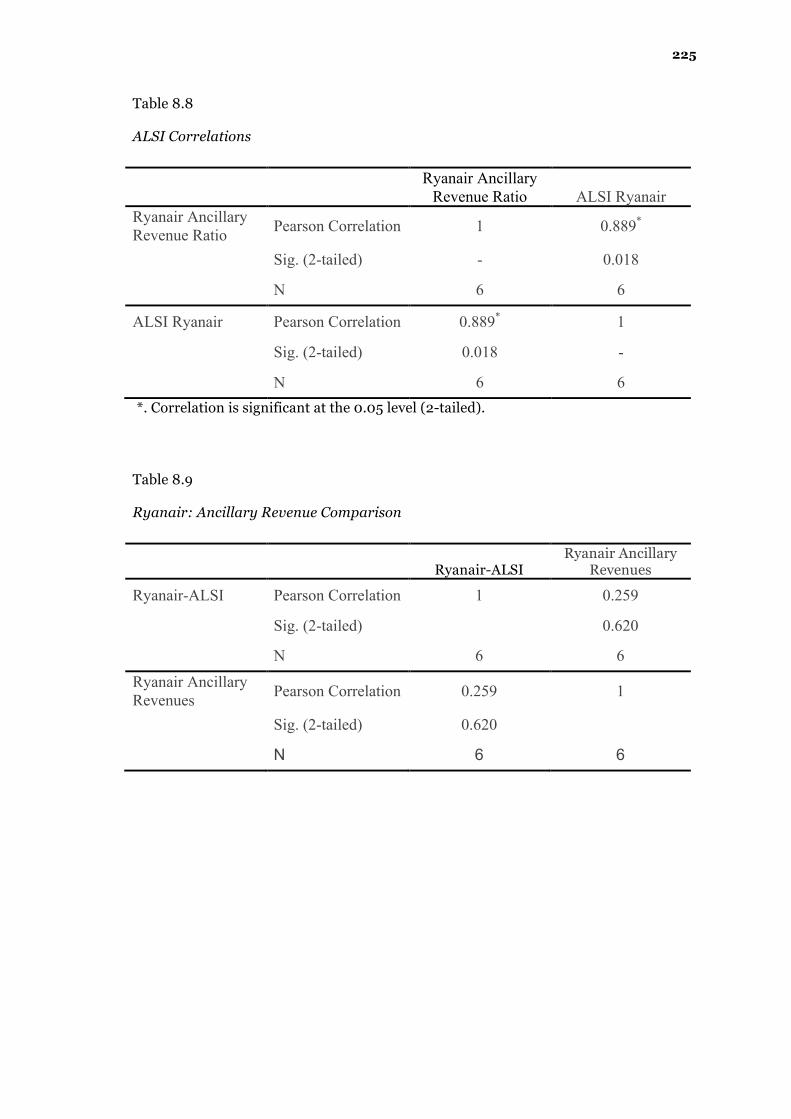
225
Table 8.8
ALSI Correlations Ryanair Ancillary
Revenue Ratio ALSI Ryanair Ryanair Ancillary Revenue Ratio Pearson Correlation 1 0.889*
Sig. (2-tailed) - 0.018
N 6 6
ALSI Ryanair Pearson Correlation 0.889* 1
Sig. (2-tailed) 0.018 -
N 6 6 *. Correlation is significant at the 0.05 level (2-tailed).
Table 8.9
Ryanair: Ancillary Revenue Comparison Ryanair-ALSI
Ryanair Ancillary Revenues
Ryanair-ALSI Pearson Correlation 1 0.259
Sig. (2-tailed) 0.620
N 6 6 Ryanair Ancillary Revenues Pearson Correlation 0.259 1
Sig. (2-tailed) 0.620
N 6 6
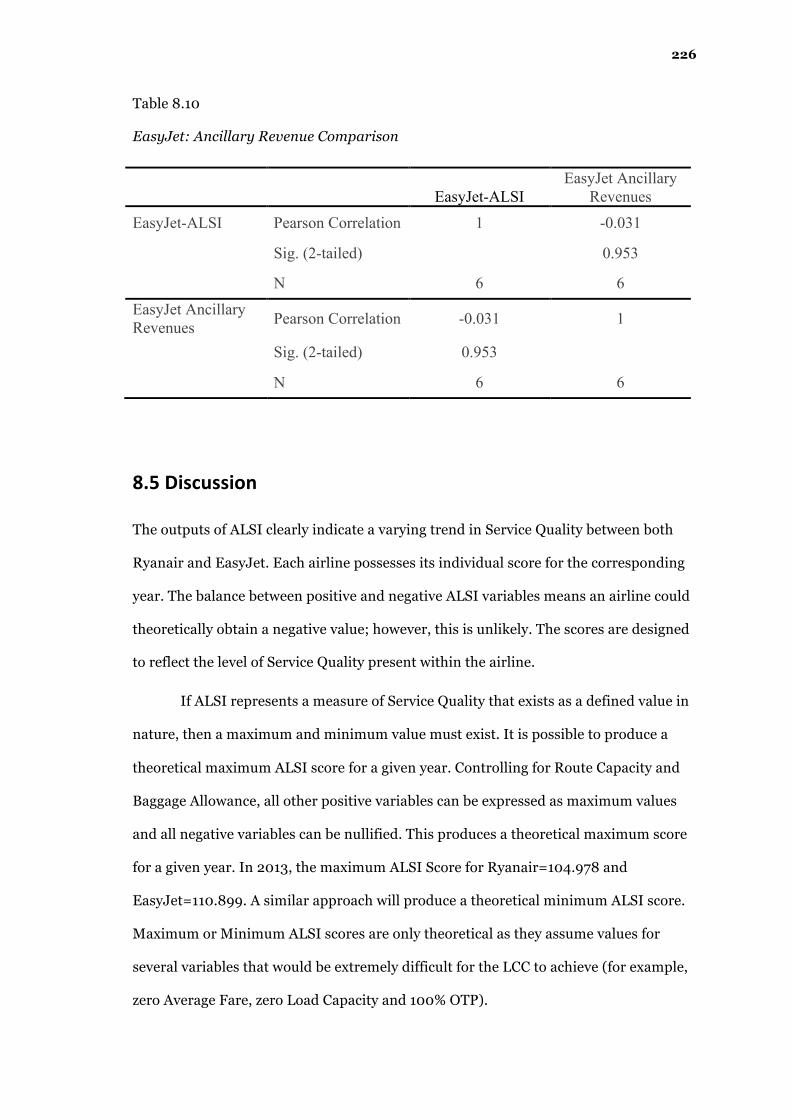
226
Table 8.10
EasyJet: Ancillary Revenue Comparison EasyJet-ALSI
EasyJet Ancillary Revenues
EasyJet-ALSI Pearson Correlation 1 -0.031
Sig. (2-tailed) 0.953
N 6 6 EasyJet Ancillary Revenues Pearson Correlation -0.031 1
Sig. (2-tailed) 0.953
N 6 6
8.5 Discussion
The outputs of ALSI clearly indicate a varying trend in Service Quality between both
Ryanair and EasyJet. Each airline possesses its individual score for the corresponding
year. The balance between positive and negative ALSI variables means an airline could
theoretically obtain a negative value; however, this is unlikely. The scores are designed
to reflect the level of Service Quality present within the airline.
If ALSI represents a measure of Service Quality that exists as a defined value in
nature, then a maximum and minimum value must exist. It is possible to produce a
theoretical maximum ALSI score for a given year. Controlling for Route Capacity and
Baggage Allowance, all other positive variables can be expressed as maximum values
and all negative variables can be nullified. This produces a theoretical maximum score
for a given year. In 2013, the maximum ALSI Score for Ryanair=104.978 and
EasyJet=110.899. A similar approach will produce a theoretical minimum ALSI score.
Maximum or Minimum ALSI scores are only theoretical as they assume values for
several variables that would be extremely difficult for the LCC to achieve (for example,
zero Average Fare, zero Load Capacity and 100% OTP).
227
The closeness of the ALSI scores between Ryanair and EasyJet is expected, as
both airlines operate within the same industry and have very similar business
strategies. The scores are easy to differentiate and seem to accurately measure the
intended value. As expected, ALSI’s outputs are easy to understand and are can be
compared linearly.
Within the results, Ryanair and EasyJet were able to be compared and
contrasted directly, and as such it could be determined for a specific year which airline
had a superior measurement of Service Quality. This direct comparability of scores
between airlines and across years demonstrates ALSI's ability as a diagnostic tool and
achieves the primary objective set out in this chapter. Fulfilling this objective also
allows for the successful comparison of ALSI scores to ancillary sales, thereby linking
Service Quality to profitability in this context.
The advantages of an objective measurement such as ALSI are that it provides a
standardized score that is comparable between subjects and across time. This score can
further be evaluated alongside other variables affecting the industry, such as
profitability. Furthermore, the individual components of the metric can be tracked
alongside its outputs to determine areas of service deficiency. This makes it a powerful
diagnostic instrument for industry professionals and an easily understood tool to aid
consumers in the decision-making process.
8.5.1 The Relationship Between Quality and Value
Within the constructs of the ALSI metric, On-Time Performance, Load Factor and
Route Capacity are the only variables that can be directly linked to Quality through the
Service Quality literature. The other variables (Average Fare, Allocated Seating Charge,
Baggage Fee and Baggage Allowance) are reflective of price and are therefore
representative of Value. These latter variables were included in ALSI because there was
no clear way of measuring these components of the airline experience without
228
incorporating their price. Excluding them would reduce the total number of factors
incorporated into ALSI and this may have an impact on ALSI’s dimensionality.
Despite ALSI incorporating these value measurements, it is theoretically
possible that it represents a measurement of Quality within the low-cost airline
industry. This is because there is an established relationship between Service Quality
and Value (Caruana, 2000; Cronin et al., 2000; Kuo, Wu, & Deng, 2009; Oh, 1999).
While there may be some debate as to the direct relationship between these two
variables (Caruana, 2000; Cronin et al., 2000), there is no doubt that they are clearly
linked and are components of overall Customer Satisfaction (Caruana, 2000).
Furthermore, these components represent a quantifiable measurement of the key
determinants of Service Quality in the low-cost airline industry that are identified in
Chapter Seven. Therefore, incorporating them into ALSI was deemed acceptable.
8.5.2 Measuring the Impact on Ancillary Revenue
Within the study it was shown that there is a significant likelihood that ALSI values and
ancillary revenue ratios move in relationship to one another, with Ryanair exhibiting a
positive relationship and EasyJet exhibiting a negative relationship.
The opposing directional values seen across airlines can be confusing without
first considering the different operating strategies of the two airlines. Ryanair has
continued to focus on maximising OTP and lowering ticket price, while EasyJet is
aggressively trying to expand its market share. Between 2010 and 2013, EasyJet
expanded its Route Capacity by over 16 million ASM. However, within those years
EasyJet saw a significant jump in total ancillary revenues between 2010 and 2011, then
a sharp decline in 2012. It is important to note that this comparison is airline specific.
What is important is the strong positive correlations between the ancillary revenue
ratio and ALSI across both airlines. This demonstrates that the airline's Service Quality
is directly affecting its ancillary revenues, in a firm-specific manner. Therefore, an
229
increase in Service Quality for a given year, should result in an increase in ancillary
revenues.
8.7 Conclusion
This research found that an objective instrument for Service Quality in the UK low-cost
airline industry can be constructed using available secondary data. The study also
found a clear link between Service Quality and profitability in this context.
While the AQR groups all airlines operating in the United States into one
measurement, ALSI studies only the low-cost airlines in the UK market. There is a
distinct difference in the operating principles of traditional carriers and LCCs (outlined
in Chapter Four); therefore, measuring Service Quality should be done independently.
This will give outputs on much more realistic terms. Since ALSI is constructed upon
research into the LCC industry, a separate measurement would need to be constructed
for the traditional carriers operating in the UK and Europe. While it is certainly
possible and academically interesting, unfortunately doing so is outside the scope of
this study (due to the constraints of time and space).
Simplicity of design, utilising secondary data, and quantitative measurements
all allow for the comparison of ALSI results across subsequent time periods and among
industry players. Other, more qualitative measurements of Service Quality do not allow
for cross comparison across years or between service providers as this type of
subjective data is not easily comparable. This comparable measurement provides
industry professionals with a valuable instrument for monitoring Service Quality, both
within and between airlines. Furthermore, with ALSI the consumer now has access to
information relating directly to airline Service Quality. Previously, the results of more
qualitative or survey based studies were the property of the industry. ALSI puts this
information into an easily accessible and understandable format for the consumers.
Given such information consumers will be better able to make more informed purchase
230
decisions. Additionally, a more informed consumer base may add to the competitive
advantage of quality leaders within the LCC industry (Shostack, 1977).
Furthermore, ALSI has attempted to correct or nullify many of the criticisms
that were associated with the original AQR. Within ALSI, On-Time Performance carries
the highest weight of all variables (OTPw=1.5067). The original AQR similarly applied
a heavy weight to OTP (Bowen et al., 1991, 1992; Bowen & Headley, 1993). This
resulted in some justifiable criticism that the high influence of OTP on the overall score
biases the results toward airlines that dramatically under-perform in other areas
(Gardner, 2004). However, OTP appears to be important to LCC consumers. Support
for this can be found in both the Skytrax content analysis study (Chapter Seven) and
the survey results from this chapter. This is possibly because ALSI excludes traditional
carriers. Unlike traditional carriers, LCC only sell point-to-point tickets that do not
offer connecting flights. This makes arriving on time extremely important if a
passenger has purchased tickets that involve more than one flight on a single journey,
as passengers are then required to gather and recheck their baggage and travel through
security. On-Time Performance is also an area where Ryanair seems to consistently
outperform EasyJet. This is most likely due to Ryanair’s strategy of operating out of
smaller airports where air-traffic congestion is less likely. Therefore, the market-
specific focus of ALSI should nullify most of the complaints set against the AQR.
Another criticism of the original AQR was its lack of attention to significant
digits (Gardner, 2004). Many of the values did not share uniform measurements. ALSI
tries to correct this by maintaining an appropriate number of significant digits relative
to the measurement (for example, Available Seat Miles is reported in Billions instead of
its raw value). Doing so should prevent any one factor from unnecessarily biasing the
scale.
231
8.7.1 Shifting Research Philosophy
ALSI represents a slight shift in the philosophical approach to Service Quality theory. It
assumes that Service Quality is a construct that exists within the airline industry itself,
not just in the minds of the consumer. Where Service Quality metrics are traditionally
purely subjective scales that are rarely accessible to the consumer, ALSI demonstrates
the viability of the next generation off Service Quality instruments. This new
instrument is now partially subjective (in defining the weights and variables) and
partially objective, using publicly available industry data. This will allow comparability
longitudinally across time, within industry, and even with other variables (such as in-
flight sales).
8.7.2 Limitations
The ALSI instrument possesses some inherent limitations. As it is limited in its
observation of Service Quality by the availability of data21, any objective representation
of Service Quality is by nature incomplete (while many factors have the potential to
affect a passenger's air-travel experience, it is impossible to quantify all possible
variables). Therefore, ALSI represents a "best picture" of Service Quality in the airline
industry. Furthermore, because of different operating strategies, it is possible that
consumers have different expectations of traditional carriers than LCCs. This could
make the factors making up ALSI for traditional carriers different from that of the
LCCs. Therefore, a new measurement using the same methodology would need to be
constructed to fit the traditional carrier market. The difference in construction could
make comparison between the LCC ALSI and one designed for traditional carriers very
difficult. However, as many traditional carriers are now adopting LCC-like operating
21 Most of the data used in constructing the ALSI comes from the airlines’
corporate annual reports. While there are regulations governing reports on accounts, much of the annual reports are left to the discretion of the airline.
232
strategies, the distinction between the two carrier types may not become as important
in the future.
ALSI also benefits from the comparability of its outputs; however, this is
dependent on the key factors of the ALSI metric remaining static between each
observation. Since the industry is susceptible to changes in operational strategy that
could affect Service Quality, the factors may need to be periodically revisited to ensure
linear compatibility and stability of the metric. However, doing so will employ a similar
methodology to this study.
8.7.3 Implications for Further Research
As this method of objectively measuring Service Quality is a relatively novel concept,
further expansion across industries is necessary. This is a multi-step process that
begins at the consumer level, and so expanding ALSI into new markets could improve
the understanding of consumer's need in such areas. Further research is also needed to
establish the applicability of this multi-step process within other industries.
Further refinement of the ALSI metric could see it developing into a
comprehensive measurement of Customer Satisfaction. Using the four value based
components Average Fare, Allocated Seating Charge, Baggage Charge and Baggage
Allowance, ALSI could be indicative of overall Customer Satisfaction in addition to
Service Quality. As Chapter Four highlighted, Customer Satisfaction is often seen as an
antecedent to Service Quality. In order to establish a Customer Satisfaction metric,
further research is needed to formalise the relationship between Service Quality, Value
and Customer Satisfaction.
233
CHAPTER NINE: DISCUSSION AND CONCLUSION
9.1 Introduction
This study sought to examine Service Quality in the UK low-cost airline industry. Four
key objectives were outlined:
1. Identify the determinants of Service Quality in the low-cost airline industry.
2. Apply a traditional model of Service Quality to the low-cost airline industry.
3. Construct an AQR type metric for the UK market.
4. Examine the relationship between Service Quality and airline profitability.
In order to address each of these objectives, Service Quality was examined using
three distinct measurements across three studies: content analysis, a quantitative
survey and a novel indexing metric. Each of these methods has their advantages and
disadvantages and this thesis highlights the unique characteristics of each. The content
analysis study was first used to identify the determinants of Service Quality, then by
using the quantitative HiQUAL model, it was determined that traditional quantitative
methods can be adapted to fit the low-cost airline industry. To improve on this
quantitative method by increasing reliability to consumers and industry professionals,
a comparable AQR type metric was constructed in the final study. This novel metric
also allowed for Service Quality to be related to an airline’s profitability, which is a key
reason for why Service Quality is of interest to airline industries.
This chapter includes an in-depth discussion of this research. It begins by
briefly reviewing the context and theory then expands on the findings and discusses
them in a wider context, including the justification of this research in providing novel
research theory to the Service Quality literature. The order of discussion follows the
logical order of the thesis, beginning with the literature review and concluding with a
234
discussion of each of the three studies.
9.2 The Literature Review
The purpose of the literature review was to provide a background for the thesis by
covering major developments and key theories of topics developed in this thesis. The
thesis began by providing an overview of Service Quality as both a stand-alone concept
and within the aviation industry, in particular highlighting the major developments
within Service Quality research. Illustrating the history and major developments within
the airline industry then set the context of the thesis. Service Quality within the
aviation industry was reviewed, specifically in the LCC market, before going into a
theoretical discussion on Service Quality and its measurement. The review then led to
a series of research questions that this study sought to answer in order to successfully
provide a piece of research that examined Service Quality within the low-cost airline
industry.
9.2.1 The Airline Industry
The airline industry has changed considerably in the last 100 years. Before the US
Deregulation Act of 1978, air travel was highly regulated and industry profits were
assured through careful planning and government subsidy. With the establishment of
deregulation, market liberalisation and open-skies agreements between nations,
competition airlines became intense. The literature review highlights serious
operational difficulties for legacy carriers trying to maintain a competitive advantage in
the new market. These include both external and internal market forces, deregulation
and legalisation. These factors have led to profitability issues within the much of the
airline industry.
Despite these challenges, one type of airline that has done very well in this
environment is the low-cost carrier. Chapter Three illustrates how these airlines’
235
unique strategies have returned consistently greater profits than traditional carriers,
while offering a lower ticket price. This is most likely because many of the low-cost
carriers leading the market were born within the unregulated environment and do not
have the decades old corporate culture that has made many traditional carriers so
inelastic.
The LCCs have redefined the air travel service. While traditional carriers
established themselves as offering luxurious travel in the skies, LCCs market
themselves as nothing more than a cost effective means of transportation. There is little
glamour with low-cost airlines. This price centred strategy seems to be becoming more
commonplace within the airline industry (even among traditional carriers) and it is
possible that consumers are adapting as well. The price sensitivity of the LCC market,
coupled with ever shrinking margins, makes finding an alternative competitive strategy
a must.
In order to survive with continued pressure from market liberalisation,
legislation and rising fuel prices, all airlines will need to examine new possibilities to
maintain a competitive advantage. Chapter Four outlines the possibility of offering
superior quality as a possible strategy for market leadership. The LCC provides an
excellent context to examine Service Quality in this industry because their unique
business models have very limited inclusive services, unlike traditional carriers. This
unique operating strategy makes it very important to examine LCCs and traditional
carriers independently.
However, the airline industry is constantly changing. Today there is a less clear
distinction between LCCs and traditional carriers as in the past. Now, many LCCs are
offering premium services (at a cost) and traditional carriers, in an effort to maintain
profitability, are taking on many of the operational elements of the low-cost airlines
(such as charging for checked baggage). Although there is a blending on operations
236
strategies in today’s market, there are still distinct differences between the two to
warrant their separation when examining Service Quality.
9.2.2 Service Quality
While the volume of Service Quality literature is vast, it seems that the theoretical
debate is limited to a few key authors. Much of the debate over the constructs of Service
Quality took place in the late 1980s and peaked in the mid-1990s. By the end of the 20th
century, most of the debate had slowed. At that time there were several new models
that had been published, but due to significant attention on one portion of the
literature (SERVQUAL) these received little or no criticism in the literature. After a few
short years, it appeared that the Service Quality debate was no longer of interest to
major academic research. The literature review in this thesis demonstrated the need for
continued debate in the area by offering an in-depth review of the major developments
in the Service Quality literature.
It seems that much of the Service Quality literature seems to self-identify as
being part of the “Nordic” or “American” schools of thought. Throughout Service
Quality discussion and debate, most of the literature seemed to ignore the idea of
differing ontological approaches to Service Quality measurement. Most of the literature
was related to highly subjective measures. This research offers a unique perspective
that extends the illustration of the Service Quality literature beyond these two schools
and into camps of differing philosophical constructs: the Objective Camp (with the
AQR and ALSI) and the Subjective Camp (with the American and Nordic Schools).
Recognition of the objective methods of Service Quality measurements is important if
the Service Quality literature is to be motivated toward such research. Therefore,
expanding the dynamic of the literature beyond simply the “Nordic” and “American”
schools is a key way to improve and expand upon Service Quality research.
There is some support for expanding Service Quality literature into the
Objective Camp. The closely related Customer Satisfaction literature has seen some
237
development of objective indexes and Service Quality has been measured objectively in
the Airline Quality Rating (although the authors of the AQR make no distinction of this
philosophical shift). Furthermore, Parasurman, Zeithaml and Barry, in their 1988
SERVQUAL paper even illustrate the importance of objective measures of Quality, but
dismiss them as being limited to the manufacturing sector. The ALSI instrument
represents a return to the manufacturing definition of Quality in that it sees Service
Quality as something that can be defined in nature and measured independently from
the consumer. Just as Quality in the manufacturing sector’s parameters are defined by
the needs of the end user, the constraints of an objective measurement of Service
Quality can be initially defined by the consumer.
9.3 The Research
9.3.1 The Content Analysis Study
The Content Analysis Study allowed the assessment of qualitative methods as means of
analysing the low-cost airline industry. The results gave insight into what consumers’
value most in their experience with low-cost carriers and provided a firm base from
which to develop quantifiable measures in later chapters. This study met one of the
primary objectives of this thesis: to discover the determinants of Service Quality in the
UK low-cost airline industry. The identification of these determinants benefits
researcher of the airline industry by providing an illustration of consumers’ preferences
in this context. It also may have some value to industry professionals by highlighting
some of the strengths and weaknesses of the low-cost airline experience.
The focus of this study was two UK based low-cost airlines: Ryanair and
EasyJet. With the variety of discussion about the LCC industry in popular media, there
could be some relevant information that can be used for this inspection. Therefore, this
chapter began with an investigation of three examples of popular media: printed
238
consumer report magazines (represented by Which?), internet-based travel companies
(represented by TripAdvisor.com) and airline specific websites (represented by
Skytrax). Each of these was examined in-detail for its suitability to be applied to the
content analysis method.
Consumer information can be gathered from airline specific websites that allow
customers to leave personal comments. At the time of this writing, Skytrax is the only
website specifically dedicated to airline quality. It is this direct consumer involvement
and quality-focused approach that make it an acceptable option for a qualitative study
into the determinants of Service Quality in the low-cost airline industry.
While airline specific internet forums may be considered a source of LCC public
discussion, these were not used in this study. Such member-driven forums are
prevalent on the internet; however, they tend to be extremely biased in their overall
subject matter. While it is possible that there may be some valuable information in air-
travel related forums, this information would be much more difficult to decipher and
organise than Skytrax as many of these forums can maintain lengthy discussions
between members on a variety of topics making their examination time consuming and
confusing. Therefore, Skytrax was the only suitable source for this type of data. Using
only one medium as a subject was deemed acceptable due to the high degree of
Trotsky’s conformity to the needs of this research. Limiting the analysis to only one
media also helped manage the time constraints of the study.
Skytrax was acceptable for generating topics related to airline Service Quality,
for several reasons: first, it was an airline specific medium. Furthermore, unlike
Which? and TripAdvisor.com, Skytrax’s focus on airline quality meant that consumers’
responses were most likely to be related to that topic. The layout of the Skytrax website
made finding and coding the relevant information extremely easy. People who left
comments were first asked to rate their overall experience relating to different
elements of the airline experience and were asked whether they would or would not
239
recommend the airline. This greatly simplified the research as it made favourable and
unfavourable responses very clear.
The word frequency query results display an interesting uniformity across both
airlines. This may indicate that there is comparability between consumer experiences
in the low-cost airline industry. This is most likely because different LCC airlines share
very similar operating strategies (especially in comparison to traditional carriers) and
may share similar operations challenges when attempting to meet consumers' needs.
Additionally, a deeper inspection into the consumer’s comments reveals very similar
themes arising from consumer’ discussions of the low-cost airline experience.
Particularly interesting was the appearance of evidence that highlighted areas of
confusion by the consumer. There was specific misunderstanding relating to the
identity of the service provider, as consumers seemed to have difficulty distinguishing
between the roles of the airline and the airport. Due to the close operational
relationship between the airport and airline, this confusion is somewhat justified;
however, misappropriation of responsibility for a negative experience might lead to a
negative perception of airline quality. Specifically, attributing a mistake by the airport
as one by the airline was a common occurrence among many of the respondents. This is
an extremely important concept for airline managers who wish to improve the
customers’ perception of overall Service Quality. Establishing strategies that help the
consumer to differentiate the airline’s brand from the airport could help to alleviate
some confusion; however, doing so could prove to be extremely difficult as the two
entities are securely linked through their operational requirements. It may be possible
for low-cost airlines to use their influence at smaller airports to get groundside staff to
focus more on Service Quality and Customer Satisfaction. Doing so could possibly
increase the likelihood of passengers having a positive opinion of the travel experience
as a whole.
240
The results of this study were effective in identifying important topics in the
low-cost airline experience from the consumer’s perspective. These themes were:
Consumer Education, Interactions with Staff and Fellow Passengers. Along with these
themes came a set of attributes of airline service that customers seem to generally
value. These were: Baggage Handling and Policies, Boarding and Check-In, On-Time
Performance, Penalty Fees, Inconsistent Application of Airline Policy by Staff, and Staff
Behaviour. Each is a factor that a low-cost airline could potentially focus on in order to
improve their service strategy.
The topics identified in the Skytrax study provide a valuable list of indications
for airline professionals concerned with Service Quality. This in-depth examination of
consumer responses could be a powerful tool for these managers when developing their
operating and service strategies by pinpointing areas of concern. Unfortunately, this
type of qualitative study does not allow the researcher to make generalisations to a
larger population from these responses. What it does do is provide a set of topics that
researchers can later attempt to quantify. Following this, these results can be
examined for their applicability to the construction of a more objective Service Quality
metric.
While Skytrax represents an acceptable choice it does carry with it some
inherent flaws. First, Skytrax only published the few most recent responses (between
n=58 and n=71). This does indeed provide a sufficient sample for the study; however, it
limits any possible inspection into past trends in consumer's opinion. While it could be
possible to monitor the Skytrax website for an extended period of time and record new
postings as they appear to help increase the sample size, doing so was outside of the
time constraints of this study. Only current consumer's opinions can only be observed.
Tracking any changes must be done longitudinally from the time of this study's
beginning. It would be interesting to undertake a longitudinal comparison of these
comments in order to illustrate the dynamics of consumer opinion within the LCC
industry over time, but such a study is outside the constraints of this research.
241
9.3.2 The HiQUAL Study
The HiQUAL study was conducted to investigate Service Quality in the low-cost airline
industry using a previously developed model of Service Quality. This benefits
researchers in the Service Quality literature by re-examining the debate within this
body of literature and applying a somewhat neglected hierarchical model. This is
necessary because the Service Quality literature has discontinued this debate in search
of new topics, without any resolution.
Of the many Service Quality models that were developed during the 1990s and
early 21st century, SERVQUAL seemed to dominate practise. Although SERVQUAL’s
simplicity has contributed significantly to its popularity (contrary to HiQUAL needing
elaborate factor analysis), this literature review highlighted many of SERVQUAL’s
deficiencies. While it is not clear as to the exact reasoning behind SERVQUAL’s
dominance, it is possible that practitioners are simply attracted to the acronym:
SERVQUAL. Many of the other Service Quality metrics have not been given attractive
names (except for the SERVQUAL variants). Therefore, this study began by assigning
Brady and Cronin’s Hierarchical Model of Service Quality (Brady & Cronin, 2001) the
unique moniker HiQUAL. This greatly simplifies discussion of this model and will
hopefully make it more attractive to both academics and professionals.
During its development the HiQUAL model demonstrated a high degree of
reliability and validity across several industries and this lead to the assumption that it
would be an acceptable choice to fit a context specific application and there was some
indication that Airport Quality might be a hierarchical construct (Fodness & Murray,
2007). Given the close relationship of the airport and airline, it makes sense to apply
hierarchical principles to airline Service Quality.
There has been construction of context specific models based on the concepts
presented by Brady and Cronin (Dagger et al., 2007; Ko & Pastore, 2005); however,
until this research, this has been little direct application of the original HiQUAL scale
242
in academic research or practise. This is important because HiQUAL is useful as a
practical instrument as well as a theoretical model by providing an in-depth picture of
the relationship of Service Quality to its underlying factors. With HiQUAL a clear
illustration of the constructs of Service Quality in a given context can be produced and
this can be used to highlight areas of concern for the service provider. This research
highlights HiQUAL’s practicality and will hopefully contribute to its adoption as a
popular Service Quality metric thereby deepening the literature on hierarchical models
of Service Quality and demonstrating the practicality of an industry-specific scale. This
ease of adaptability is another practical advantage of HiQUAL and is reflexive of other
popular Service Quality metrics. This could lead to more industry-specific Service
Quality models being developed or adapted from existing models.
An electronic distribution method was chosen in lieu of approaching passengers
in an airport. While there is certainly nothing wrong with first-person survey methods,
and many researchers have had success with this method when researching the airline
industry (for example, An and Noh, 2009; Gilbert and Wong, 2002; Park, 2007), the
time constraints of this study made doing so impractical.
There was only one possible discrepancy with one of the initial qualifying
questions: Question Two, “How often do you fly with this airline?”, was designed to
determine the average level of experience of respondents. This question could have
asked for a specific number of trips taken on a LCC within a given time period.
However, doing so would require respondents to accurately recall each trip, which has
the potential to be inaccurate. The method employed only requires a generalisation.
Each method would probably be adequate; however, asking for a general opinion seems
to require less effort from the respondent. Adaptation of survey methods in this respect
could be particularly useful if time was a constraint for the respondent, and overly
specific questions tend to be off-putting for in bringing respondents in to complete
surveys.
243
Unlike gap-based metrics, HiQUAL allows researchers to examine the facets of
Service Quality on a multi-level platform. This provides a much richer understanding
of the results by providing in-depth detail of the relationship between the factors
affecting Service Quality and greatly advances HiQUAL’s status as a diagnostic and
problem-solving tool. Since managers can identify service deficiencies on multiple
levels, they are able to understand the underlying factors affecting such problems. With
research pointing to Service Quality as a hierarchical construct, this makes HiQUAL a
more descriptive metric than the popular SERVQUAL based variants.
Brady and Cronin, in their initial construction of the HiQUAL scale, analysed
the second and third-order factor structures separately. This was because of the limited
capabilities of the statistical software at that time. This study utilised IBM SPSS Amos
19, a current and powerful Structural Equation Modelling tool. This made analysing the
factors as a whole a possibility, increasing the ease of analysis and reporting of this
model.
Comparing the second-order HiQUAL factors to the results of the study in
Chapter Seven forms an illustration of the HiQUAL results’ congruency with the
previous study. The second-order factors of the HiQUAL results confirm several of the
themes identified in Chapter Seven. Many of the Chapter Seven responses indicate
some statements about interactions with staff and Interaction Quality was also
confirmed through the path model. This points to an indication that Interaction Quality
may be a strong driver of consumers’ evaluations of the airline experience. Flight
Delays and On-Time Performance were also identified as determinants in Chapter
Seven. This can be compared to Outcome Quality in the HiQUAL results, as the
outcome of a flight is often dependent upon its timely arrival. Furthermore, Waiting
Time is a sub-dimension of Outcome Quality in the HiQUAL model.
A sub-dimension of Physical Environment Quality, Ambient Conditions had the
weakest factor loadings of the second-order HiQUAL factors in the path analysis. There
244
is also some mention of Ambient Conditions in the Chapter Seven study. The Chapter
Seven study had also identified determinants relating to Ambient Conditions. These
related to the departure lounge at the gate, on-board seating and the aircraft interior.
The HiQUAL metric performed well in a context-specific application. There was
an acceptable fit to the data and the path analysis revealed strong estimates between all
of the factors. This study demonstrated only a slight preference for Outcome Quality in
the results. However, given a much larger data set, there may have been more
uniformity between factor loadings.
9.3.3 The ALSI Study
Chapter Eight’s primary objective was in constructing and demonstrating the
applicability of a comparable means of measuring Service Quality within a specific
industry. This study represents a novel contribution to research by creating an
objective measurement of Service Quality in the low-cost airline industry and
illustrates the importance of Service Quality to airline profitability in the UK market.
This study meets one of the objectives of this thesis: to determine if an AQR type metric
could be constructed for the UK market. By doing this, an easily understood indicator
of Service Quality can be provided to analyse the UK airline market. This could be
beneficial to both consumers and industry professionals as the outputs of ALSI can be
compared to other industrial variable to determine their overall effect of Service
Quality (such as in-flight sales).
Bowen and Headley had illustrated the need for a measurement of airline
quality that would fit markets outside the US; however, no expansion of this concept
into European markets had taken place (Headley & Bowen, 1997). The overall difficulty
in constructing an objective metric for Service Quality in the UK low-cost airline
industry has one constraint: the availability of accurate industry data. It is impossible
to simply transfer the AQR’s weights and factors into the European market. First,
Governmental bodies in JAA countries do not collect the vast amount of industry data
245
as the US Government. Secondly, consumer’s opinions of airline quality differ slightly
in the European context (Tiernan et al., 2008). This research has corrected the issues
with applying the AQR in Europe as suggested by Headley and Bowen (Headley &
Bowen, 1997) by developing a novel UK specific scale: The Airline Service Quality
Indicator (ALSI). This confirms the applicability and advantages of industry-specific
Service Quality models.
As suggested by Bowen and Headley, obtaining the raw data for these UK based
airlines was much more difficult that would be with US airlines (Headley & Bowen,
1997). With a lack of consistent government reporting relating to the variables, the best
source for data was the airline’s corporate annual reports. Again, unlike their US
cousins, these airlines do not offer the same uniformity of content within their reports.
Each airline also varies the structure and content of their annual reports quite
frequently. This is especially true with EasyJet, who seem to significantly reformat
their reports each year. Ryanair has a much more standardised format to their reports,
but the information reported can still vary slightly. Not only does this limit the
availability of data, but also makes collecting it very time consuming. However, if this
type of metric became more common in practise, it could drive more standardised
reporting from industry and government.
Calculation of ALSI was relatively straightforward. The simple algorithm
provided by Bowen, Headley and Luedtke was easily adapted to this application
(Bowen et al., 1991). The weights for ALSI were arithmetically derived from the results
of the items in Section Two of the survey (Chapter Six).
Once individual results for each airline had been calculated, these could then be
compared between airlines, thereby giving an indication of areas of strength and
deficiency within airlines, as well as allowing for cross-comparison of the results
between airlines. There was an observable trend in the ALSI results with Ryanair
seeming to have the most stable of scores. The ALSI outputs also made sense when
246
compared to factors affecting each airline. Fore example, EasyJet had significant
problems with On-Time Performance in 2012 and the ALSI scores clearly reflected this
deficiency. Due to its simplicity and clarity, ALSI could benefit industry professionals
as a diagnostic instrument and provide passengers with an easily understood decision
making tool.
When making comparison to firms’ financial performances (in this case
ancillary revenues) the ALSI scale works very well. As its outputs contain airline
specific data, there is a high degree of accuracy when comparing ALSI outputs to other
areas of airline performance. This is a specific advantage ALSI has over other methods
of Service Quality measurement. HiQUAL and the content analysis study do not
directly measure variables relating to a specific airline, and so comparing their results
to airline financial performance is not as simple as with ALSI. While some studies have
focused on buyer behaviour, currently there has been no direct comparison in the
literature between Service Quality and factors affecting airline profitability.
ALSI also uses the same weights and variables each year, meaning its results are
longitudinally comparable. This is not necessarily true with other forms of Service
Quality measurement. While it may be possible to produce a HiQUAL or qualitative
type study on a yearly basis, the results are not as comparable as with ALSI. ALSI is the
only Service Quality metric that uses independent industry data and does not rely on
sampling consumers’ opinions. This is important in that it provides the scale with
characteristics specific only to objective measures of Quality. For example, there is a
direct longitudinal relationship between the ALSI scores (across years), where other
forms of Service Quality measurement are not as comparable. Unlike other methods of
Service Quality evaluation ALSI is easy to calculate, report, understand and generates
comparable results. Therefore, ALSI can provide accurate trend information that could
be vital to managers trying to use Service Quality as part of their airlines’ competitive
strategy.
247
This research has not only outlined the effect Service Quality has on other
industry variables, but it also demonstrates the applicability of a comparable metric of
measuring service outputs in monitoring other elements of the airline industry as they
relate back to Service Quality (in this instance: profitability). Therefore, allowing
Service Quality itself to function as an overall indicator of the firm's market
performance and competitive advantage.
ALSI demonstrates a clear relationship between Service Quality and consumer
buying behaviour related to ancillary products and services. This is consistent with the
result of consumer buying behaviour studies in the airline industry (Park et al., 2006).
Comparing ALSI outputs to ancillary sales shows a clear relationship between these
two variables. EasyJet's negative correlation between ancillary sales and Service
Quality was most likely a result of the limited amount of longitudinal ALSI scores
driven by EasyJet's recent low OTP scores. This could insinuate that poor Service
Quality at EasyJet could result in an increase in ancillary revenue sales (and thus
profitability); however, this is irrational and not supported by the extant literature. In
coming years this is expected to turn into a positive correlation, as it is with Ryanair.
While ancillary sales are not the only measure of airline financial performance,
it is most suited for this context. This revenue stream is unique to the LCC industry and
is becoming an important part of these airlines’ operating strategies. This type of
airline revenue is also the most likely to be influenced by Service Quality because of the
mode of delivery (typically in-flight sales). Revenue per Available Seat Kilometre would
be another possible measure of airline financial performance (although indirect) that
could be used as a gauge for financial performance and compared with Service Quality;
however, there are many factors that could affect this figure much more strongly than
Service Quality (such as: changes in the airlines’ cost management).
This study demonstrated the construction of a novel, objective metric
for measuring Service Quality in the UK low-cost airline industry. This illustrates the
248
possibility of a shift in philosophical approach to measuring Quality in the service
sector. While such objective measurements of Quality are commonplace in the
manufacturing sector, they are rare in the service sector. The result of this study, ALSI,
provides an easily understood, comparable metric for Service Quality in its given
context.
9.3.4 Relationship Between Studies
Most evaluations of Service Quality are subjective in nature. This applies to both
qualitative evaluations of Service Quality and quantitative surveys as both rely on
consumers’ opinions to gain insight into service outputs. This has led to the terms
Service Quality and Perceived Quality used almost interchangeably in the literature.
This thesis examines the possibility that Service Quality is a real construct existing in
nature, independent of Perceived Quality. The construction of the ALSI metric in
Chapter Eight is an illustration of this possibility.
The three models represent a step-wise shift from purely subjective evaluation
of Service Quality (in which Service Quality can be interchanged with Perceived
Quality) to the creation of an objective instrument (where Service Quality can be
viewed as a separate construct from Perceived Quality). The first study uses the purely
qualitative content analysis technique to arrive at an understanding of the
determinants of Service Quality in the low-cost airline industry. The second study then
goes on to utilise quantifiable survey data to build a hierarchal picture of Service
Quality in this context. Although the data in this HiQUAL study is quantifiable, it still
relies on the subjective interpretation of the respondent to generate its values. The final
chapter therefore demonstrates the final shift towards a more objective approach to
measuring Service Quality. However, as it uses subjective methods in the initial
determination of its factors, it is not entirely objective. This study therefore uses several
methods for measuring Service Quality to demonstrate a shift in the ontological
perspective of Service Quality.
249
9.4 Contributions
The primary aim of this thesis was to examine Service Quality in the low-cost airline
industry. This investigation provides a contribution to industry, practise and the
Service Quality literature by producing outcomes that highlight the importance of
airline quality research and demonstrating the possibility of shifting Service Quality
metrics from subjective methods to more objective instruments.
9.4.1 Contributions to the Service Quality Literature
Chapter Four provided an in-depth look at the key elements making up the popular
body of Service Quality literature. This uncovered some interesting areas of concern.
Firstly, towards the end of the popular Service Quality debate (in the early 2000s),
there were several exceptional models developed; yet these were left mostly unused
since their inception. This was largely considered to be because of the popularity of
previously developed SQERVQUAL based metrics in both academia and practise. This
thesis examines one of these unattended models as a practical measure for Service
Quality and as a competitor to the popular SERVQUAL scale.
The first contribution to the Service Quality literature comes from resurrecting
the discipline of Service Quality measurement. Unfortunately, debate within the
Service Quality community seems to have gained momentum throughout the 1990s but
ended in the early 2000s before major advances had time to become wide spread. This
thesis highlights this unfortunate trend in Service Quality and the importance of
reviving debate within this discipline thereby deepening the understanding of
hierarchical constructs.
Further contribution to the literature comes from providing an up to date
synopsis of the Service Quality literature, extending support for hierarchical Service
Quality theories, and demonstrating the practicality of HiQUAL. The most recent
250
synopsis of the Service Quality literature (Seth et al., 2005) failed to consider Brady
and Cronin’s research (Brady & Cronin, 2001). Therefore, this literature review
currently provides the most current synopsis of popular Service Quality literature. It is
possible that further investigation into hierarchical Service Quality scales was
constrained by the limited statistical software at the time; however modern software
(such as Amos) allows for much easier evaluation of these models. This can increase
ease of analysis and open up these models to a wider group of researchers.
Investigating HiQUAL as a practical tool for measuring Service Quality
contributes to the literature by extending the understanding of HiQUAL and similar
hierarchical models as practical tools. Most of the Service Quality research centres on
developing new models, or variants of models in a particular context. However, this
thesis provided support for the use of a previously conceptualised in a context specific
application, with only slight modification. This not only demonstrates the robustness of
the original HiQUAL scale and its applicability to marketing practices, but more
generally promotes the idea that previously developed (and unused) models can be
successfully adapted to fit new contexts.
The second contribution to the Service Quality literature is illustrated between
the Skytrax study in Chapter Seven and the ALSI study in Chapter Eight. This chapter
demonstrates a process to create an objective measure of Service Quality. This process
begins with a qualitative study to identify the determinants of Service Quality in a given
context, then employs a known quantitative metric to provide a weight for each of the
criteria, then fits industry data with each variable and calculate the outputs. This
process begins with deriving the determinants of Service Quality from the perspective
of the consumers and concludes by shifting the ontology into a slightly more objective
epistemology. This results in a measurement of Service Quality as a measurable term
that exists in the real world. This is congruent with work in the Customer Satisfaction
literature and supportive of Bowen, Headley and Luedtke's work on the Airline Quality
251
Rating (Bowen & Headley, 2007; Bowen et al., 1991, 1992; Bowen & Headley, 1993).
This provides a new avenue for the investigation of Service Quality.
This thesis demonstrated that Service Quality van be viewed as construct
independent of Perceived Quality. Thus, Service Quality can be viewed as a natural
construct. While seemingly this is a return to the manufacturing definition of Quality, it
provides clear advantages over subjective measures of quality. This demonstration will
hopefully give evidence for an alternative view of Service Quality and other subjective
measurements in the Social Sciences.
9.4.2 Contributions to Practise
Despite long-standing criticism of the SERVQUAL scale, managers seem to have a
preference for SERVQUAL or SERVQUAL-based instruments when taking practical
Service Quality measurements. This research offers support for the argument against
using gap-based scales and suggests that performance-only measurements are better
suited to most applications. Despite being theoretically out-dated, gap-based models do
not produce as in-depth results as hierarchical models as they provide a picture of the
factors affecting Service Quality as well as their sub-dimensions. This allows for areas
of concern to be clearly highlighted.
The analysis of the HiQUAL data demonstrated good model fit for this context;
therefore, adding value to the argument that HiQUAL is as versatile a model as
SERVQUAL or SERVPERF. This will hopefully lead practitioners to consider
hierarchical models more often when examining Service Quality in a given context.
The construction of ALSI was unique in context and demonstrates a clear
process of developing such a metric. If practitioners adopt this process, similar metrics
may prove useful in other industries. With its easily understood and comparable
outputs, it would be beneficial to examine this possibility further.
9.4.3 Contributions to Industry
252
The contributions of this thesis to the airline industry comes from identifying the key
determinants of Service Quality in the UK low-cost airline industry and developing an
objective metric of Service Quality (ALSI) This is achieved through the Skytrax study in
Chapter Seven and the ALSI study in Chapter Eight. Each of the determinants
identified in Chapter Seven (Baggage Handling and Policy, Boarding and Check-In,
Penalty Fees and Application of Policy, and Staff Behaviour) represent areas of the air
travel experience where airlines have a key opportunity to influence passengers’
perceptions of the airline and affect the overall air travel experience. Therefore, these
determinants can now be considered when managers are planning their marketing
strategies.
The qualitative research also identified possible confusion by some passengers
when recognising airport staff and airline staff. This is an important distinction as
many airports utilise their own employees (or sub-contracted staff) at the ticketing and
check-in counters. Consumers wrongfully assuming that these employees belong to the
airline may inappropriately assign blame to the airline for breakdowns of service in
these areas. This could further result in the airline receiving a negative evaluation for
something that is out of their control. Consumer Education was another factor that
seemed to influence passengers’ evaluations of their airline experience. Those that had
more knowledge or experience with traveling on a particular airline appeared to
evaluate the experience more positively. Many of the negative experiences also seemed
to stem from passengers’ misunderstanding of the LCCs’ policies or procedures.
Airlines seeking to improve their customer service or brand image should attempt to
better educate the passengers in these areas to mitigate the possibility of a negative
encounter, or even utilise a novel approach such as designing a different uniform to
allow airline personnel to stand out from airport staff.
This thesis also benefits the airline industry through the construction of an
objective metric for measuring Service Quality specifically in the LCC industry. This
was illustrated in Chapter Six in the development of the ALSI metric. As this metric
253
produces longitudinally comparable outputs, it can track changes in Service Quality
over time as well as directly compare scores between airlines. Furthermore, the ALSI
outputs can be compared to other indicators of airline performance (such as
profitability) to see the relationship between Service Quality and other performance
factors. This information could help airlines to adjust their service strategies to
maximize their competitive advantage.
Finally, this thesis benefits the airline industry by highlighting some possible
difficulties with the future of airline profitability and offers a possible solution.
Specifically, this thesis identifies shrinking margins and price competition as factors
that will contribute profitability issues unless alternative means of revenue generation
can be found. The airline industry is playing a zero-sum game with price competition
and service exclusion that can only lead to severe profitability issues in the future.
This thesis offers Service Quality as a novel solution to this problem. Since ancillary
sales have become an important part of the low-cost airline’s product mix and it is
possible that Service Quality could be a driver of these revenue streams. This research
demonstrates that Service Quality can indeed affect consumer’s buying behaviour and
therefore greatly enhance this important revenue stream. While there has been some
research into airline services, this research provides a novel comparison and clear link
of Service Quality to airline profitability.
9.5 Limitations
Because of their diversity, examining Service Quality in multiple markets is outside the
scope of this thesis due to the constraints of time, funding and the logistics of
conducting large-scale international research; therefore, this study is limited by its
market-specific focus. Following a similar investigation into Service Quality in other
markets it may then be possible to consider a global illustration of airline quality;
however, time constraints limit the specific results found in this thesis to the UK
market.
254
Furthermore, the process of creating an objective measurement of Service
Quality for a given industry possesses some inherent limitations. It does perform
admirably in the context to the LCC sector of the airline industry and should easily be
applicable to other sectors of the air-travel industry; however, it may not be as effective
across a wider array of industries. First, the process is dependent upon available first-
person consumer data to carry out the content analysis study. The Skytrax study details
an efficient method of collecting qualitative consumer opinion data; however, this
specific type of data may be unavailable in some contexts. It would be possible to
substitute a different qualitative measure for this process, but any substitute method
would most-likely increase the overall time requirements of the research dramatically
and would need further examination for its applicability.
The sampling technique was a natural limitation of the HiQUAL study. This
may limit the overall statistical inferences that the study can make in relation to a
larger population. While the sampling method does include some elements of random
sampling, it does not use pure probability sampling techniques. However, employing a
pure probability sampling technique would have exceeded the constraints of this study
and were therefore unwarranted.
The availability of reliable airline industry data was thought to be a limiting
factor. Factors such as Employee Contentment and Lost or Mishandled Baggage could
not be accounted for in the final ALSI equation because a lack of consistent reporting
or detailed data. Employee contentment could be derived from the average annual
turnover of employees; however, Ryanair did not report such figures (unlike EasyJet
who seemed proud of reducing staff turnover). Lost or Mishandled Baggage is a value
that is reported; however, lack of detail makes it impossible to attribute an incident
directly to the airline. It is not certain to what extent these factors would impact the
overall ALSI score. However, it does highlight the need for better data collecting and
reporting methods in the UK airline industry. Additionally, this factor could
significantly limit ALSI’s applicability to other industries and contexts given they have
255
similar (or worse) deficiencies in data collection and reporting; this would need to be
examined on an industry-specific basis.
This study examines only one factor affecting airline profitability: ancillary
sales. While this is a very relevant issue of profitability for the LCC industry, it is not
the only measure available. This study chose ancillary revenues as the unique operating
strategy of the LCC industry places significant importance on this type of sales. While
ALSI provides an excellent measure of Service Quality for comparison to ancillary
revenues, it may not be compatible with other factors affecting airline profitability. For
example, Average Load Factor is a clear indicator of airline financial performance;
however, since ALSI uses Load Factor as one of its variables, comparing the two would
produce biased results.
9.6 Implications for Future Research
The first natural opportunity for further research is to use this process to extend ALSI
to encompass a wider LCC market in addition to generating a similar metric for
traditional carriers. Even though they operate within the same industry, it would still
be necessary to begin with a qualitative study. This is would allow the traditional
carrier metric to fully account for the characteristics that are unique to traditional
carriers22.
The methods used in the Skytrax study could provide further research into the
determinants of airline quality. Fortunately, Skytrax allows consumer to place
comments for almost every airline in the world. It would be interesting to expand this
study to define the determinants of airline quality on a global scale. Such research
should, most likely, be broken into separate regions (such as: North America, Europe,
22 It is important to note that each metric should exist on its own. As each metric would be designed to include the variables that are representative of their particular sector or industry, individual metrics are not comparable across industries.
256
The Middle East, Asia) as well as with sectors (Traditional Carries, LCCs, Charter
Airlines). Furthermore, many of the responses in Chapter Seven related to the
uncomfortable boarding procedures of the LCCs. This was especially prevalent from
passengers whom did not purchase priority boarding. General boarding on LCCs
requires these passengers to compete for a space in the queue and all board
simultaneously, frequently referring to the procedure as “cattle class.” However, this
boarding procedure is smiler to other forms of public transportation (such as city
buses), where such practises are accepted. It would be interesting to investigate what
drives this dissatisfaction from the consumers.
Even though HiQUAL has proved a reliable and robust metric when applied to
the airline industry, it would be interesting to construct a wholly new model of airline
quality, based on Brady and Cronin’s (2001) hierarchical structure. A further reaching
Skytrax study could provide sufficient groundwork to replace the third-order factor
structure with several airline-specific factors. This could extend the knowledge of the
determinants of airline quality by providing a unique industry specific model of the
hierarchical nature of airline service. Furthermore, the methods utilised in this PhD
could be applied to other service industries other than aviation.
Having began an investigation into Service Quality in the low-cost airline
industry, it would be important to examine the relationship between Service Quality,
Customer Satisfaction and Loyalty in this context. Doing so could add value to the
Customer Satisfaction and Loyalty literature by highlighting their relationship to
Service Quality and importance to the airline industry.
9.7 Conclusion
This thesis was inspired by interest in the aviation industry. In the beginning the
industry appeared to be facing difficult challenges. It seemed perfect storm of
increasing legislation; competition and rising fuel prices would eventually overcome
the lacklustre efforts of airline executives. However, some sectors of airline industry
257
appear to be adapting. This is especially true with the LCCs whom have found success
in markets many traditional carriers have been struggling. It is possible these relatively
new low-cost airlines will come to dominate the market. Where traditional carriers still
survive, the forthcoming marketplace may necessitate they incorporate many of the
strategies employed by the low-cost airlines to remain competitive. In the near future,
this could make them distinguishable from LCCs in name only.
It seems that the expanding service sector has placed much of the economic
power in the hands of the consumers. This is evidenced by the wealth of investment
into consumer specific research. While the Service Quality literature may need
revitalisation in the academic environment, marketing practitioners seem to be well
aware of its potential. EasyJet clearly places a great deal of importance on Service
Quality and its potential for competitive advantage. This is not only evidenced by
EasyJet's reporting of its yearly Service Quality score and EasyJet's increasing
profitability; it appears in Ryanair's changing operating policies as well. With their
fervent restructuring of customer service policies, baggage allowances and redesigning
of their website, it seems that some players in the low-cost airline industry are
beginning to learn the value of Service Quality.
258
BIBLIOGRAPHY Adcock, C. J. (1997). Sample size determination: a review. Journal of the Royal
Statistical Society: Series D (The Statistician), 46(2), 261–283. Ahmad, N., Awan, M. U., Raouf, A., & Sparks, L. (2009). Development of a service
quality scale for pharmaceutical supply chains. International Journal of Pharmaceutical and Healthcare Marketing, 3(1), 26–45. http://doi.org/http://dx.doi.org/10.1108/17506120910948494
Airbus. (2013). A350 XWB. Retrieved from http://www.airbus.com/aircraftfamilies/passengeraircraft/a350xwbfamily/
Alderighi, M., Cento, A., Nijkamp, P., & Rietveld, P. (2012). Competition in the European aviation market: the entry of low-cost airlines. Journal of Transport …. Retrieved from http://www.sciencedirect.com/science/article/pii/S0966692312000579
Alfaro, L. (2003). Foreign direct investment and growth: Does the sector matter. Harvard Business School, 1–31.
An, M., & Noh, Y. (2009). Airline customer satisfaction and loyalty: impact of in-flight service quality. Service Business, 3(3), 293–307.
Anderson, E. W., & Fornell, C. (2000). Foundations of the American customer satisfaction index. Total Quality Management, 11(7), 869–882.
Anderson, E. W., & Sullivan, M. W. (1993). The antecedents and consequences of customer satisfaction for firms. Marketing Science, 12(2), 125–143.
Anderson, S. (2015). How Far You’ll Fly In Your Lifetime Might Just Surprise You - sunshine.co.uk News. Retrieved August 5, 2016, from https://www.sunshine.co.uk/news/how-far-you-ll-fly-in-your-lifetime-might-just-surprise-you-205.html
Andersson, T. D. (1992). Another model of service quality: a model of causes and effects of service quality tested on a case within the restaurant industry. Quality Management in Service, van Goraum, Assen, 41–48.
Asubonteng, P., McCleary, K. J., & Swan, J. E. (1996). SERVQUAL revisited: A Critical Review of Service Quality. The Journal of Services Marketing, 10(6), 62–81.
Babakus, E., & Boller, G. W. (1992). An Empirical Assessment of the SERVQUAL Scale. Journal of Business Research, 24, 253–268.
Bachman, J. (2008). Southwest Sees Fuel Hedges’ Pesky Side. Retrieved from http://www.businessweek.com/lifestyle/travelers_check/archives/2008/10/southwest_sees.html
Bakos, Y. (1998). The emerging role of electronic marketplaces on the Internet. Communications of the ACM, 41(8), 35–42.
Barrett, S. D. (2004a). How do the demands for airport services differ between full-service carriers and low-cost carriers? Journal of Air Transport Management, 10(1), 33–39.
Barrett, S. D. (2004b). The sustainability of the Ryanair model. International Journal of Transport Management, 2(2), 89–98. http://doi.org/DOI: 10.1016/j.ijtm.2004.12.001
Bell, D. (1976). The coming of the post-industrial society. The Educational Forum. Retrieved from http://www.tandfonline.com/doi/pdf/10.1080/00131727609336501
Belobaba, P., Odoni, A., & Barnhart, C. (2015). The global airline industry. Retrieved from https://books.google.com/books?hl=en&lr=&id=HwBhBgAAQBAJ&oi=fnd&pg=PA99&dq=airline+industry+structure&ots=c0hFssMvm5&sig=A9nKv91t-ApYkj1-AWy2vCz7_OU
Berg, B. L., & Lune, H. (2004). Qualitative research methods for the social sciences (Vol. 5). Pearson Boston.
Berkley, B. J., & Gupta, A. (1994). Improving service quality with information
259
technology. International Journal of Information Management, 14(2), 109–121. Berry, L. L., Parasuraman, A., & Zeithaml, V. A. (1988). The service-quality puzzle.
Business Horizons, 31(5), 35–43. Berry, L. L., Zeithaml, V. A., & Parasuraman, A. (1985). Quality counts in services, too.
Business Horizons, 28(3), 44–52. Bishop, J. A., Rupp, N. G., & Zheng, B. (2011). Flight Delays and Passenger
Preferences: An Axiomatic Approach. Southern Economic Journal, 77(3), 543–556. Retrieved from http://search.ebscohost.com/login.aspx?direct=true&db=buh&AN=58107564&site=eds-live
Bitner, M. J. (1990). Evaluating service encounters: the effects of physical surroundings and employee responses. The Journal of Marketing, 69–82.
Blalock, G., Kadiyali, V., & Simon, D. H. (2007). The Impact of Post‐9/11 Airport Security Measures on the Demand for Air Travel. Journal of Law and Economics, 50(4), 731–755.
Boardman, A. E., & Vining, A. R. (1989). Ownership and performance in competitive environments: A comparison of the performance of private, mixed, and state-owned enterprises. Journal of Law and Economics, 32(1), 1–33.
Bolton, R., & Drew, J. (1991). A multistage model of customers’ assessments of service quality and value. Journal of Consumer Research. Retrieved from http://www.jstor.org/stable/2626833
Bor, R. (2003). Passenger behaviour. Gower Publishing, Ltd. Bor, R. (2007). Psychological factors in airline passenger and crew behaviour: A clinical
overview. Travel Medicine and Infectious Disease, 5(4), 207–216. http://doi.org/http://dx.doi.org.ezproxy.stir.ac.uk/10.1016/j.tmaid.2007.03.003
Boulding, W., Kalra, A., Staelin, R., & Zeithaml, V. A. (1993). A dynamic process model of service quality: from expectations to behavioral intentions. Journal of Marketing Research, 30(1), 7–27.
Bowen, B. D., & Headley, D. E. (2007). Airline Quality Rating 2007. Bowen, B. D., Headley, D. E., & Luedtke, J. R. (1991). Airline Quality Rating (Vol. 91–
11). The Wichita state University, Wichita kansas: National Institute for Aviation Research. Retrieved from http://www.airlinequalityrating.com/
Bowen, B. D., Headley, D. E., & Luedtke, J. R. (1992). A quantitative methodology for measuring airline quality. The Journal of Aviation/Aerospace Education & Research, 2(2), 1.
Bowen, B., & Headley, D. (1993). The airline quality rating: Developing an industry standard. Journal of Aviation/. Retrieved from http://search.proquest.com/openview/8124f697138672651d2e54eb78b8fabb/1?pq-origsite=gscholar
Brady, M. K., & Cronin, J. J. (2001). Some new thoughts on conceptualizing perceived service quality: a hierarchical approach. Journal of Marketing, 65(3), 34–49. http://doi.org/10.1509/jmkg.65.3.34.18334
Brady, M. K., & Cronin, J. J. (2001). Some new thoughts on conceptualizing perceived service quality: a hierarchical approach. Journal of Marketing, 65, 34–49. http://doi.org/10.1509/jmkg.65.3.34.18334
Brady, M. K., Cronin, J. J., & Brand, R. R. (2002). Performance-only measurement of service quality: a replication and extension. Journal of Business Research, 55(1), 17–31.
Brady, M. K., Cronin Jr, J. J., & Brand, R. R. (2002). Performance-only measurement of service quality: a replication and extension. Journal of Business Research, 55(1), 17–31.
Brady, M. K., Knight, G. A., Cronin, J. J., Tomas, G., Hult, M., & Keillor, B. D. (2005). Removing the Contextual Lense: A Multinational Multi-Setting Comparison of Service Evaluation Models. Journal of Retailing, 81, 215–230.
Brady, T. (2000a). U.S. Airlines before 1930. In T. Brady (Ed.), The American Avation
260
Experience (pp. 125–149). Carbondale and Edwardsville: Southern Illinois University press.
Brady, T. (2000b). U.S. Airlines from 1930 to Warld War II. In T. Brady (Ed.), The American Avation Experience (pp. 171–180). Carbondale and Edwardsville: Southern Illinois University Press.
Broderick, A. J., & Vachirapornpuk, S. (2002). Service quality in internet banking: the importance of customer role. Marketing Intelligence & Planning, 20(6), 327–335.
Brogowicz, A. A., Delene, L. M., & Lyth, D. M. (1990). A synthesised service quality model with managerial implications. International Journal of Service Industry Management, 1(1), 27–45.
Brunger, William G.; Perelli, S. (2009). The impact of the internet on airline fares: Customer perspectives on the transition to internet distribution. The Impact of the Internet on Airline Fares: Customer Perspectives on the Transition to Internet Distribution, 8.2, 187–199. Retrieved from https://scholar.google.com/scholar?q=Brunger and Perelli, 2008&lr=
Buttle, F. (1996). SERVQUAL: review, critique, research agenda. European Journal of Marketing. Retrieved from http://www.emeraldinsight.com/doi/abs/10.1108/03090569610105762
Calder, S. (2002). No Frills: The Truth Behind the Low-Cost Revolution in the Skies. London: Virgin Books.
CAPA. (2012). So you think you know your airline market capitalisation: Part 3. Retrieved from http://www.centreforaviation.com/analysis/jaw-dropping-airline-market-capitalisation-facts-part-3-47249
Carman, J. M. (1990). Consumer perceptions of service quality: An assessment of the SERVQUAL dimensions. Journal of Retailing, 55.
Carrillat, F. A., Jaramillo, F., & Mulki, J. P. (2007). The validity of the SERVQUAL and SERVPERF scales: A meta-analytic view of 17 years of research across five continents. International Journal of Service Industry Management, 18(5), 472–490.
Caruana, A. (2000). Service quality and satisfaction-the moderating role of value. European Journal of …. Retrieved from http://www.emeraldinsight.com/doi/pdf/10.1108/03090560010764432
Caruana, A. (2002). Service loyalty: the effects of service quality and the mediating role of customer satisfaction. European Journal of Marketing, 36(7/8), 811–828.
Cento, A. (2009). The Airline Industry: Cahllenges in the 21st Century. Berlin Heidelberg: Springer-Verlang.
Cerovic, M. (1998). Global airport retailing. Datamonitor. Chang, Y.-W., & Chang, Y.-H. (2010). Does Service Recovery affect Satisfaction and
Customer Loyalty? An Empirical Study of Airline Services. Journal of Air Transport Management, 16, 340–342.
Chase, R. (1977a). Where does the customer fit in a service operation? Harvard Business Review. Retrieved from http://europepmc.org/abstract/med/10239167
Chase, R. (1977b). Where does the customer fit in a service operation? Harvard Business Review.
Chase, R. B., & Tansik, D. A. (1983). The customer contact model for organization design. Management Science, 29(9), 1037–1050.
Chau, V. S., & Kao, Y.-Y. (2009). Bridge over troubled water or long and winding road?: Gap-5 in airline service quality performance measures. Managing Service Quality, 19(1), 106–134.
Chowdhary, N., & Prakash, M. (2007). Prioritizing service quality dimensions. Managing Service Quality, 17(5), 493–509.
Churchill, G. A., & Surprenant, C. (1982). An INvestigation into the Determinants of Customer Satisfaction. Journal of Marketing Research, 19(November), 491–504.
Civil Avation Athority. (2012). UK Punctuality Statistics. Retrieved from http://www.caa.co.uk/default.aspx?catid=80&pagetype=88&pageid=12&sglid=12
261
Correia, A. R., Wirasinghe, S. C., & de Barros, A. G. (2008). A global index for level of service evaluation at airport passenger terminals. Transportation Research Part E: Logistics and Transportation Review, 44(4), 607–620.
Cronin, J., Brady, M., & Hult, G. (2000). Assessing the effects of quality, value, and customer satisfaction on consumer behavioral intentions in service environments. Journal of Retailing. Retrieved from http://www.sciencedirect.com/science/article/pii/S0022435900000282
Cronin, J. J., & Taylor, S. A. (1992). Measuring service quality: a reexamination and extension. The Journal of Marketing, 56(3), 55–68.
Cronin, J. J., & Taylor, S. A. (1994). SERVPERF versus SERVQUAL: reconciling performance-based and perceptions-minus-expectations measurement of service quality. The Journal of Marketing, 58(1), 125–131.
Cronin, J., & Taylor, S. (1992). Measuring service quality: a reexamination and extension. The Journal of Marketing. Retrieved from http://www.jstor.org/stable/1252296
Cronin Jr, J. J. (2003). Looking back to see forward in services marketing: some ideas to consider. Managing Service Quality, 13(5), 332–337.
Cronin Jr, J. J., & Taylor, S. A. (1992). Measuring service quality: a reexamination and extension. The Journal of Marketing, 55–68.
Crosby, P. B. (1979). Quality is free: The art of making quality certain (Vol. 94). McGraw-Hill New York.
Cunningham, L. F., Young, C. E., & Lee, M. (2004). Perceptions of airline service quality Pre and Post 9/11. Public Works Management & Policy, 9(1), 10–25.
Dabholkar, P. A. (1996). Consumer evaluations of new technology-based self-service options: an investigation of alternative models of service quality. International Journal of Research in Marketing, 13(1), 29–51.
Dabholkar, P. A., & Bagozzi, R. P. (2002). An attitudinal model of technology-based self-service: moderating effects of consumer traits and situational factors. Journal of the Academy of Marketing Science, 30(3), 184–201.
Dabholkar, P. A., Shepherd, C. D., & Thorpe, D. I. (2000). A comprehensive framework for service quality: an investigation of critical conceptual and measurement issues through a longitudinal study. Journal of Retailing, 76(2), 139–173.
Dabholkar, P. A., Thorpe, D. I., & Rentz, J. O. (1995). A measure of service quality for retail stores: scale development and validation. Journal of the Academy of Marketing Science, 24(1), 3–16.
Dabholker, P. A., Thorp, D. I., & Rentz, J. O. (1996). A Measure of Service Quality for the Retail Stores: Scale Development and Validation. Journal of the Academy of Marketing Science, 24, 3–16.
Dagger, T. S., Sweeney, J. C., & Johnson, L. W. (2007). A Hierarchical Model of Health Service Quality: Scale Development and Investigation of an Integrated Model. Journal of Service Research, 10(2), 123–142. http://doi.org/10.1177/1094670507309594
Dart Group. (2012). Annual reports, Jet2.com. Retrieved from http://www.dartgroup.co.uk/interim_report_2011/
Dawson, J., Findlay, A., & Sparks, L. (2008). The Retailing Reader. Abingdon, Oxon: Routledge.
Delfmann, W. (2005). Strategic management in the aviation industry. Ashgate Pub Co.
Doganis, R. (1992). The airport business. Routledge. Doganis, R. (1999). The Future Shape of the Airline and Airport Industries. In W.
Pfahler, H.-M. Niemeier, & O. G. Mayer (Eds.), (pp. 103–113). New York, Peter Lang. Retrieved from http://search.ebscohost.com/login.aspx?direct=true&db=edsbl&AN=CN037906724&site=eds-live
Doganis, R. (2001). Survival lessons As low-cost carries seem here to stay in Europe.
262
AIRLINE BUSINESS, 62–65. Retrieved from http://search.ebscohost.com/login.aspx?direct=true&db=edsbl&AN=RN089131200&site=eds-live
Doganis, R. (2006). The Airline Business in the 21st Century. The Airline Business in the 21st Century. London: Routledge. Retrieved from http://search.ebscohost.com/login.aspx?direct=true&db=edsref&AN=ABBC.DOGANIS.ROUTLEDGE.BJJF&site=eds-live
Doganis, R. (2009). Flying Off Course IV: Airline Economics and Marketing (Vol. 4th). Routledge.
EasyJet, Plc. Annual Reports and Accounts 2013. (2014). Retrieved July 5, 2014, from http://corporate.easyjet.com/investors/reports-and-accounts.aspx
Elias, B. (2010). Changes in airport passenger screening technologies and procedures: Frequently asked questions. Congressional Research Service, Library of Congress.
Elliott, K. M., & Roach, D. W. (1993). Service quality in the airline industry: are carriers getting an unbiased evaluation from consumers? Journal of Professional Services Marketing, 9(2), 71–82.
Evans, W. N., & Kessides, I. N. (1994). Living by the “golden rule”: Multimarket contact in the US airline industry. The Quarterly Journal of Economics, 109(2), 341–366.
Fageda, X., Suau-Sanchez, P., & Mason, K. (2015). The evolving low-cost business model: Network implications of fare bundling and connecting flights in Europe. Journal of Air Transport …. Retrieved from http://www.sciencedirect.com/science/article/pii/S0969699714001501
Finn, C. (2013). Ryanair hits back at survey that says it has the worst customer service The low-cost airline tweeted a tongue in cheek response, saying Which magazine “hasn”t got a clue’. Retrieved from http://news.ie.msn.com/ireland/ryanair-hits-back-at-survey-that-says-it-has-the-worst-customer-service
Flybe. (2012). Reports and Accounts. Retrieved from http://www.flybe.com/corporate/investors/reports_and_accounts.htm
Fodness, D., & Murray, B. (2007). Passengers’ expectations of airport service quality. Journal of Services Marketing, 21(7), 492–506.
Fornell, C. (1992). A national customer satisfaction barometer: the Swedish experience. The Journal of Marketing, 6–21.
Fornell, C., Johnson, M. D., Anderson, E. W., Cha, J., & Bryant, B. E. (1996). The American customer satisfaction index: nature, purpose, and findings. The Journal of Marketing, 7–18.
Francis, G., Fidato, A., & Humphreys, I. (2003). Airport–airline interaction: the impact of low-cost carriers on two European airports. Journal of Air Transport Management, 9(4), 267–273.
Francis, G., Humphreys, I., Ison, S., & Aicken, M. (2006). Where next for low cost airlines? A spatial and temporal comparative study. Journal of Transport Geography, 14(2), 83–94. http://doi.org/DOI: 10.1016/j.jtrangeo.2005.05.005
Franke, M. (2004a). Competition between network carriers and low-cost carriers—retreat battle or breakthrough to a new level of efficiency? Journal of Air Transport Management. Retrieved from http://www.sciencedirect.com/science/article/pii/S0969699703000826
Franke, M. (2004b). Competition between network carriers and low-cost carriers—retreat battle or breakthrough to a new level of efficiency? Journal of Air Transport Management.
Franke, M., & John, F. (2011). What comes next after recession?–Airline industry scenarios and potential end games. Journal of Air Transport Management, 17(1), 19–26.
Freathy, P., & O’Connell, F. (1998). The role of the buying function in airport retailing. International Journal of Retail & Distribution Management, 26(6), 247–256.
Freathy, P., & O’Connell, F. (1999). A typology of European airport retailing. Service Industries Journal, 19(3), 119–134.
263
Gagliano, K. B., & Hathcote, J. (1994). Customer expectations and perceptions of service quality in retail apparel specialty stores. Journal of Services Marketing, 8(1), 60–69.
Gardner, E. S. (2004). Dimensional analysis of airline quality. Interfaces, 34(4), 272–279.
Gerbing, D. W., & Anderson, J. C. (1988). An updated paradigm for scale development incorporating unidimensionality and its assessment. Journal of Marketing Research, 186–192.
Gilbert, D., Child, D., & Bennett, M. (2001). A qualitative study of the current practices of “no-frills” airlines operating in the UK. Journal of Vacation Marketing, 7(4), 302.
Gilbert, D., & Wong, R. K. C. (2003). Passenger expectations and Airline Services: A Hong Kong Based Study. Tourism Managment, 24, 519–532.
Gkritza, K., Niemeier, D., & Mannering, F. (2006). Airport security screening and changing passenger satisfaction: an exploratory assessment. Journal of Air Transport Management, 12(5), 213–219.
Gordon, S. (2011). Ryanair confirms it WILL bring in charges for on-board toilets. Retrieved March 15, 2013, from http://www.dailymail.co.uk/travel/article-1263905/Ryanair-toilet-charges-phased-in.html
Gronroos, C. (1982). Strategic managment and Marketing in the Service Sector. Finland: Swedish School of Economics and Business Administration.
Gronroos, C. (1984). A Service Quality Model and Its Marketing Implications. European Journal of Marketing, 18(4), 36–44.
Grönroos, C. (1982). An applied service marketing theory. European Journal of Marketing, 16(7), 30–41.
Grönroos, C. (2006). Adopting a service logic for marketing. Marketing Theory, 6(3), 317–333.
Grönroos, C., & Ojasalo, K. (2004). Service productivity: towards a conceptualization of the transformation of inputs into economic results in services. Journal of Business Research, 57(4), 414–423.
Halpern, N., & Graham, A. (2013). Airport Marketing. Routledge. Retrieved from https://books.google.com/books?id=MeHArNuqGkIC&pgis=1
Hanlon, P. (2007). Global Airlines Competition in a Transnational Industry (Vol. 3rd). Amsterdam ; Boston: Butterworth-Heinemann.
Harris, J., & Uncles, M. (2007). Modeling the repatronage behavior of business airline travelers. Journal of Service Research. Retrieved from http://jsr.sagepub.com/content/9/4/297.short
Harvey, G., & Turnbull, P. (2010). On the Go: walking the high road at a low cost airline. International Journal of Human Resource Management, 21(2), 230–241. http://doi.org/10.1080/09585190903509548
Haywood-Farmer, J. (1988). A conceptual model of service quality. International Journal of Operations & Production Management, 8(6), 19–29.
Headley, D. E., & Bowen, B. D. (1997). International airline quality measurement. Journal of Air Transportation World Wide, 2(1), 55–63.
Headley, D. E., & Bowen, B. D. (1997). International airline quality measurement. Journal of Air Transportation World Wide, 2(1), 55–63.
Hooper, D., Coughlan, J., & Mullen, M. (2008). Structural equation modelling: guidelines for determining model fit. Articles, 2.
Hotten, R. (2013, June). BBC News: Norwegian airline NAS targets budget long-haul market. Retrieved from http://www.bbc.co.uk/news/business-22840790
Hume, T. (2012). Asia’s budget airlines spread their wings with long-haul flights. Retrieved from http://edition.cnn.com/2012/03/15/business/low-cost-long-haul-asia/index.html
IATA. (2012). Jet Fuel Price Development. Retrieved from http://www.iata.org/whatwedo/economics/fuel_monitor/Pages/price_developm
264
ent.aspx ICAO: International Civil Aviation. (2013). Freedoms of the Air. Retrieved January 1,
2015, from http://www.icao.int/Pages/freedomsAir.aspx Ito, H., & Lee, D. (2003). Low cost carrier growth in the US airline industry: past,
present, and future. Brown University Department of Economics Paper. Retrieved from http://papers.ssrn.com/sol3/Papers.cfm?abstract_id=719741
Jain, S. K., & Gupta, G. (2004). Measuring Service Quality: SERVQUAL vs. SERVPERF Scales. Vikalpa: The Journal for Decision Makers, 29(2), 25–37. Retrieved from http://search.ebscohost.com/login.aspx?direct=true&db=buh&AN=14024712&site=eds-live
Jarach, D. (2005). Airport marketing: Strategies to cope with the new millennium environment. Gower Publishing, Ltd.
Johnson, M. D., Gustafsson, A., Andreassen, T. W., Lervik, L., & Cha, J. (2001). The evolution and future of national customer satisfaction index models. Journal of Economic Psychology, 22(2), 217–245.
Johnson, R. (2009). Lord of the Wings. Retrieved from http://www.rjsj.demon.co.uk/articles/suntimes/wings.htm
Johnson, R. L., Tsiros, M., & Lancioni, R. A. (1995). Measuring service quality: a systems approach. Journal of Services Marketing, 9(5), 6–19.
Jones, M. A., Mothersbaugh, D. L., & Beatty, S. E. (2000). Switching barriers and repurchase intentions in services. Journal of Retailing, 76(2), 259–274.
Killduff, P. (2010). Plane Speaking: The Wit and Wisdom of Michael O’Leary. Aurum Press.
Klophaus, R., Conrady, R., & Fichert, F. (2012). Low cost carriers going hybrid: Evidence from Europe. Journal of Air Transport Management. Retrieved from http://www.sciencedirect.com/science/article/pii/S0969699712000166
KnowAtlanta. (2016). Hartsfield-Jackson Atlanta International Airport. Retrieved September 16, 2016, from http://www.knowatlanta.com/atlanta-airport-hartsfield-jackson-interntional/airport/
Ko, Y. J., & Pastore, D. L. (2005). A hierarchical model of service quality for the recreational sport industry. Sport Marketing Quarterly, 14(2), 84–97.
Kuo, Y., Wu, C., & Deng, W. (2009). The relationships among service quality, perceived value, customer satisfaction, and post-purchase intention in mobile value-added services. Computers in Human Behavior. Retrieved from http://www.sciencedirect.com/science/article/pii/S0747563209000363
Lehrer, H. R. (2000). U.S. Air Carriers After World War II. In T. Brady (Ed.), The American Avation Experience (pp. 218–240). Carbondale and Edwardsville: Southern Illinois University Press.
Lehtinen, J. R. (1983). Customer Oriented Service Systems. Service Managment Institute. Helsinki, Finland: Service Management Institute.
Lindsey, R. (1973). Airports Start Thorough Screening of All Passengers; Told to Arrive Early Searches in Full View Airports Start Rigid Screening Of All Passengers and Luggage. The New Yourk Times, p. 1.
Liou, J. J. H., & Tzeng, G.-H. (2007). A non-additive model for evaluating airline service quality. Journal of Air Transport Management, 13(3), 131–138. http://doi.org/10.1016/j.jairtraman.2006.12.002
López-Bonilla, J., & López-Bonilla, L. (2008a). Influence of the state-owned airlines on passenger satisfaction. Journal of Air Transport. Retrieved from http://www.sciencedirect.com/science/article/pii/S0969699708000227
López-Bonilla, J., & López-Bonilla, L. (2008b). Influence of the state-owned airlines on passenger satisfaction. Journal of Air Transport.
Lovelock, C. H. (1983). Classifying services to gain strategic marketing insights. Journal of Marketing, 47(3).
Malighetti, P., Paleari, S., & Redondi, R. (2009a). Pricing strategies of low-cost airlines: The Ryanair case study. Journal of Air Transport Management. Retrieved from
265
http://www.sciencedirect.com/science/article/pii/S0969699708001221 Malighetti, P., Paleari, S., & Redondi, R. (2009b). Pricing strategies of low-cost airlines:
The Ryanair case study. Journal of Air Transport Management. Mattsson, J. (1992). A service quality model based on an ideal value standard.
International Journal of Service Industry Management, 3(3), 18–33. Mayring, P. (2004). Qualitative content analysis. A Companion to Qualitative
Research, 266–269. McDaniel, C., & Gates, R. (2005). Marketing Research (Vol. Sixth). Hoboken, New
Jersey: John Wiley & Sons, Inc. Mentzer, M. S. (2012). The elusive low cost carrier effect in the trans-Atlantic airline
market. Journal of Aviation Management and Education, 2, 1–12. Metro. (2010). Ryanair forced into U-Turn after refusing to payout over volcanic ash.
Retrieved from http://metro.co.uk/2010/04/22/ryanair-forced-into-u-turn-after-refusing-to-payout-over-volcanic-ash-257336/
Michaels, L., & Fletcher, S. (2009). Competing in an LCC World. Journal of Revenue and Pricing Managment, 8(5), 410–423.
Millward, D. (2008). Ryanair reveals cut-price transatlantic plans. Telegraph. MIT: Global Airline Industry. (n.d.). Previous Studies of the Global Airline Industry.
Retrieved from http://web.mit.edu/airlines/analysis/analysis_previous_studies.html
Morris, R. (1994). Computerized content analysis in management research: A demonstration of advantages & limitations. Journal of Management, 20(4), 903–931.
Morrison, S., & Winston, C. (1986). The economic effects of airline deregulation. Brookings Institution Press.
Mulligan, J. (2013). Airfares likely to rise as Ryanair Looses Volcano Case. Independent.ie. Retrieved from http://www.independent.ie/business/irish/airfares-likely-to-rise-as-ryanair-loses-volcano-case-3371436.html
Murphy, S. (2001). Ryanair staff were menacing: passenger. Independent.ie. News, B. B. C. (2008). Zoom Airlines suspend all flights. Retrieved January 1, 2014,
from http://news.bbc.co.uk/1/hi/business/7586654.stm Nuts About Southwest - Funny Stuff... (2012). Retrieved from
http://www.blogsouthwest.com/2006/06/09/funny-stuff O’Connell, J. F., & Williams, G. (2005). Passengers’ perceptions of low cost airlines and
full service carriers: A case study involving Ryanair, Aer Lingus, Air Asia and Malaysia Airlines. Journal of Air Transport Management, 11(4), 259–272. http://doi.org/DOI: 10.1016/j.jairtraman.2005.01.007
O’Leary, M. (1994). The challenge of replicating Southwest Airlines in Europe, London. In Institute of Economic Affairs. 2nd International Aviation Conference, London.
Oh, H. (1999). Service quality, customer satisfaction, and customer value: A holistic perspective. International Journal of Hospitality Management, 18(1), 67–82.
Oh, H. (1999). Service quality, customer satisfaction, and customer value: A holistic perspective. International Journal of Hospitality Management. Retrieved from http://www.sciencedirect.com/science/article/pii/S0278431998000474
Oliver, R. (1993). Cognitive, affective, and attribute bases of the satisfaction response. Journal of Consumer Research. Retrieved from http://jcr.oxfordjournals.org/content/20/3/418.abstract
Oliver, R. L. (1980). Cognitive, affective, and attribute bases of the satisfaction response. Journal of Consumer Research, 20(3), 418(13).
Oliver, R. L. (2009). Satisfaction: A behavioral perspective on the consumer. ME Sharpe Inc.
Omar, O. (2002). Airport Retailing: Examining Airline Passengers’ Impulsive Shopping Behaviour. Journal of Euromarketing, 11(1), 87–105.
Omelia, J., & Waldock, M. (2003). Come Fly With Us: A Global History of the Airline
266
Hostess. Portland, Oregon: Collectors press, Inc. Ostrowski, P. L., O’Brien, T. V, & Gordon, G. L. (1993). Service quality and customer
loyalty in the commercial airline industry. Journal of Travel Research, 32(2), 16–24.
Pallant, J. (2010). SPSS Survival Manual (Vol. 4th ed.). GB: Open University Press. Parast, M. M., & Fini, E. E. H. (2010). The effect of productivity and quality on
profitability in US airline industry: an empirical investigation. Managing Service Quality, 20(5), 458–474.
Parasuraman, A., Berry, L., & Zeithaml, V. (1991). Refinement and reassessment of the SERVQUAL scale. Journal of Retailing. Retrieved from http://search.proquest.com/openview/20ce41a3232b328c782d08cf26648612/1?pq-origsite=gscholar
Parasuraman, A., Zeithaml, V. A., & Berry, L. L. (1988). SERVQUAL: A multiple-item scale for measuring consumer perceptions of service quality. Journal of Retailing.
Parasuraman, A., Zeithaml, V. A., & Berry, L. L. (1994). Alternative scales for measuring service quality: a comparative assessment based on psychometric and diagnostic criteria. Journal of Retailing, 70(3), 201–230.
Parasuraman, A., Zeithaml, V. A., & Berry, L. L. (1994). Reassessment of expectations as a comparison standard in measuring service quality: implications for further research. The Journal of Marketing, 111–124.
Parasuraman, A., zeithaml, V., & Berry, l. (1985). A Conceptual model of Service Quality and its Implications for future Research. Journal of Marketing, 49, 41–50.
Parasuraman, A., zeithaml, V., & Berry, L. (1991). Understanding Consumer Expectations of Service. Sloan Management Review, 32(3), 39–48.
Park, J., Robertson, R., & Wu, C. (2006). Modelling the impact of airline service quality and marketing variables on passengers’ future behavioural intentions. Transportation Planning and …. Retrieved from http://www.tandfonline.com/doi/abs/10.1080/03081060600917686
Park, J. W. (2007). Passenger perceptions of service quality: Korean and Australian case studies. Journal of Air Transport Management, 13(4), 238–242.
Park, J. W., Robertson, R., & Wu, C. L. (2004). The effect of airline service quality on passengers’ behavioural intentions: A Korean case study. Journal of Air Transport Management, 10(6), 435–439.
Park, J. W., Robertson, R., & Wu, C. L. (2009). Differences in air passengers’ buying behaviour: findings from Korean and Australian international passengers. Transportation Planning & Technology, 32(5), 441–460. http://doi.org/10.1080/03081060903017176
Pate, J. M., & Beaumont, P. B. (2006). The European Low Cost Airline Industry:: The Interplay of Business Strategy and Human Resources. European Management Journal, 24(5), 322–329. http://doi.org/DOI: 10.1016/j.emj.2006.07.003
Perng, S.-W., Chow, C.-C., & Liao, W.-C. (2010). Analysis of shopping preference and satisfaction with airport retailing products. Journal of Air Transport Management, 16(5), 279–283.
Philip, G., & Hazlett, S.-A. (1997). The measurement of service quality: a new PCP attributes model. International Journal of Quality & Reliability Management, 14(3), 260–286.
Piga, C. A., & Filippi, N. (2002). Booking and flying with low‐cost airlines. International Journal of Tourism Research, 4(3), 237–249.
Pogatchnik, S. (2013). No-frills Ryanair admits it may have an image problem. Retrieved from http://www.usatoday.com/story/todayinthesky/2013/09/24/no-frills-ryanair-admits-it-may-have-an-image-problem/2858855/
Pratley, N. (2012). EasyJet still flying high despite price rises. Retrieved from http://www.guardian.co.uk/business/nils-pratley-on-finance/2012/may/09/easyjet-flying-high-price-rises
267
Rand, A. (1990). Introduction to the Objectivist epistemology: Expanded Second Edition. (H. Binswagner & L. Peikoff, Eds.) (Vol. 2nd). New York, New York: Penguin Group.
Ratchford, B. T., Talukdar, D., & Lee, M.-S. (2001). A model of consumer choice of the Internet as an information source. International Journal of Electronic Commerce, 5, 7–22.
Rhoades, D. L., Waguespack Jr, B., & Treudt, E. (1998). Service quality in the US airline industry: progress and problems. Managing Service Quality, 8(5), 306–311.
Richard, M. D., & Allaway, A. W. (1993). Service quality attributes and choice behaviour. Journal of Services Marketing, 7(1), 59–68.
Ritchie, J., Lewis, J., Nicholls, C., & Ormston, R. (2013). Qualitative research practice: A guide for social science students and researchers. Retrieved from https://books.google.com/books?hl=en&lr=&id=EQSIAwAAQBAJ&oi=fnd&pg=PP1&dq=using+online+qualitative+data&ots=lZVOep_s4Q&sig=1566unrhhH5XpDk63H2ALPHJ_ps
Robertson, C. (2002). Real World Research (Vol. 2nd). Oxford: Blackwell. Robertson, R., & ChengLung, W. (2005). Investigating the effects of airline service
quality on airline image and passengers’ future behavioural intentions: findings from Australian international air passengers. Journal of Tourism Studies, 16(1), 2–11.
Robledo, M. A. (2001). Measuring and managing service quality: integrating customer expectations. Managing Service Quality, 11(1), 22–31.
Rust, R. T., & Oliver, R. L. (1994). Service quality: New directions in theory and practice. Sage Thousand Oaks, CA.
Ryanair. (2012a). History of Ryanair. Retrieved January 1, 2015, from http://www.ryanair.com/en/about
Ryanair. (2013). Flight Disruptions. Volcanic Ash Disruptions - How to Make a Claim. Retrieved September 5, 2015, from http://www.ryanair.com/en/questions/how-can-i-make-a-claim-as-a-result-of-the-volcanic-ash-disruption
Ryanair, Ll. (2012b). Annual Reports. Retrieved from http://www.ryanair.com/en/investor/download/2013
Saha, G. C. (2009). Service quality, satisfaction, and behavioural intentions: a study of low-cost airline carriers in Thailand. Managing Service Quality, 19(3), 350–372.
Santos, J. (2003). E-service quality: a model of virtual service quality dimensions. Managing Service Quality, 13(3), 233–246.
Saunders, M., Lewis, P., & Thornhill, A. (2007). Research Methods for Busisness Students (Vol. Fourth). Essex: Pearson Education Limited.
Schermelleh-Engel, K., & Moosbrugger, H. (2003). Evaluating the fit of structural equation models: Tests of significance and descriptive goodness-of-fit measures. Methods of Psychological. Retrieved from http://citeseerx.ist.psu.edu/viewdoc/download?doi=10.1.1.509.4258&rep=rep1&type=pdf
Schmenner, R. W. (1986). How can service businesses survive and prosper. Sloan Management Review, 27(3), 21–32.
Seatguru. (2013). Long-Haul First Class Comparison Chart. Retrieved from http://www.seatguru.com/charts/longhaul_first_class.php
SeatGuru.com. (2014). SeatGuru.com by TripAdvisor. Retrieved from http://www.seatguru.com/
Seiders, K., Voss, G. B., Grewal, D., & Godfrey, A. L. (2005). Do satisfied customers buy more? Examining moderating influences in a retailing context. Journal of Marketing, 26–43.
Seth, N., Deshmukh, S. G., & Vrat, P. (2005). Service quality models: a review. International Journal of Quality & Reliability Management, 22(9), 913–949.
Shaw, S., & Ivy, R. (1994). Airline mergers and their effect on network structure.
268
Journal of Transport Geography. Retrieved from http://www.sciencedirect.com/science/article/pii/0966692394900485
Shostack, G. L. (1977). Breaking Free from Product Marketing. Journal of Marketing, 41(2), 73–80. Retrieved from http://search.ebscohost.com/login.aspx?direct=true&db=buh&AN=4996775&site=ehost-live
Shukman, D. (2014, June). BBC News: A350 markes New Phase in Aero-Engines. Retrieved January 1, 2014, from http://www.bbc.co.uk/news/science-environment-22889969
Shweder, R. A., & D’Andrade, R. G. (1980). The systematic distortion hypothesis. New Directions for Methodology of Social and Behavior Science, 4, 37–58.
Silvestro, R., Fitzgerald, L., Johnston, R., & Voss, C. (1992). Towards a classification of service processes. International Journal of Service Industry Management, 3(3), 62–75.
Sindhav, B., Holland, J., Rodie, A. R., Adidam, P. T., & Pol, L. G. (2006). The impact of perceived fairness on satisfaction: are airport security measures fair? Does it matter? The Journal of Marketing Theory and Practice, 14(4), 323–335.
SITA. (2015). Baggage Report 2015. Retrieved from http://www.sita.aero/resources/type/surveys-reports/baggage-report-2015
Skytrax. (2013a). Legal Notice. Retrieved from http://www.airlinequality.com/main/legal notice.htm
Skytrax. (2013b). Skytrax: Airline Travel Rating and Reviews. Retrieved from http://www.airlinequality.com/
Skytrax. (2013c). Skytrax Research. Retrieved from http://www.skytraxresearch.com/ Skytrax. (2013d). The Airline Quality Rating programme. Retrieved from
http://www.airlinequality.com/StarRanking/ranking.htm Smith, O. (2013). Ryanair “worst” brand for customer service. Retrieved from
http://www.telegraph.co.uk/travel/travelnews/10319838/Ryanair-worst-brand-for-customer-service.html
Spreng, R. A., & Mackoy, R. D. (1996). An empirical examination of a model of perceived service quality and satisfaction. Journal of Retailing, 72(2), 201–214.
Steven, A., Dong, Y., & Dresner, M. (2012). Linkages between customer service, customer satisfaction and performance in the airline industry: Investigation of non-linearities and moderating effects. Transportation Research Part E: Logistics …. Retrieved from http://www.sciencedirect.com/science/article/pii/S136655451100158X
Stevens, J. P. (2012). Applied multivariate statistics for the social sciences. Routledge. Suzuki, Y., Tyworth, J. E., & Novack, R. A. (2001). Airline market share and customer
service quality: a reference-dependent model. Transportation Research Part A: Policy and Practice, 35(9), 773–788.
Sweeney, J. C., Soutar, G. N., & Johnson, L. W. (1997). Retail service quality and perceived value: a comparison of two models. Journal of Retailing and Consumer Services, 4(1), 39–48.
Tabachnick, B. G., & Fidell, L. S. (2007). Experimental designs using ANOVA. Thomson/Brooks/Cole.
Tansik, D. A. (1990). Balance in service systems design. Journal of Business Research, 20(1), 55–61.
Taylor, S., & Baker, T. (1994). An assessment of the relationship between service quality and customer satisfaction in the formation of consumers’ purchase intentions. Journal of Retailing. Retrieved from http://www.sciencedirect.com/science/article/pii/0022435994900132
Teas, R. K. (1993). Expectations, performance evaluation, and consumers’ perceptions of quality. The Journal of Marketing, 18–34.
Thomas, D. (1997). Retail and leisure developments at London Gatwick. Commercial Airport, 38–41.
269
Thompson, B. (2007). Airport retailing in the UK. Journal of Retail & Leisure Property, 6(3), 203–211.
Tiernan, S., Rhoades, D., & Waguespack, B. (2008). Airline alliance service quality performance—An analysis of US and EU member airlines. Journal of Air Transport …. Retrieved from http://www.sciencedirect.com/science/article/pii/S0969699708000173
Tripadvisor. (2015). About US. Retrieved from http://www.tripadvisor.co.uk/PressCenter-c6-About_Us.html
Tsai, W.-H., Hsu, W., & Chou, W.-C. (2011). A gap analysis model for improving airport service quality. Total Quality Management & Business Excellence, 22(10), 1025–1040.
Tsaur, S.-H., Chang, T.-Y., & Yen, C.-H. (2002). The evaluation of airline service quality by fuzzy MCDM. Tourism Management, 23(2), 107–115. http://doi.org/10.1016/S0261-5177(01)00050-4
Wangenheim, F., & Bayón, T. (2007). Behavioral consequences of overbooking service capacity. Journal of Marketing. Retrieved from http://journals.ama.org/doi/abs/10.1509/jmkg.71.4.36
Ward, M. R., & Lee, M. J. (2000). Internet shopping, consumer search and product branding. Journal of Product & Brand Management, 9(1), 6–20.
Wemmerlöv, U. (1990). A taxonomy for service processes and its implications for system design. International Journal of Service Industry Management, 1(3), 20–40.
Westra, C. (2009). April 2007 US-EU Open Skies Agreement: A Dream of Liberalization Deferred, The. BC Int’l & Comp.L.Rev., 32, 161.
Which? (2015). About which? Retrieved from http://www.which.co.uk/about-which/#?intcmp=GNH.About-Us.About-Which
Williams, G. (1994). The airline industry and the impact of deregulation. Woodside, A. G., Frey, L. L., & Daly, R. T. (1989). Linking Service Quality, Cnstoiner
Satisfaction, and. Journal of Health Care Marketing, 9(4), 5–17. Yang, Z., & Fang, X. (2004). Online service quality dimensions and their relationships
with satisfaction: a content analysis of customer reviews of securities brokerage services. International Journal of Service Industry Management, 15(3), 302–326.
Zahorik, A. J., & Rust, R. T. (1992). Modeling the impact of service quality on profitability: a review. Advances in Services Marketing and Management, 1, 247–276.
Zeithaml, V. A. (2000). Service quality, profitability, and the economic worth of customers: what we know and what we need to learn. Journal of the Academy of Marketing Science, 28(1), 67–85.
Zeithaml, V. A., Berry, L. L., & Parasuraman, A. (1988). Communication and control processes in the delivery of service quality. The Journal of Marketing, 35–48.
Zeithaml, V. A., Berry, L. L., & Parasuraman, A. (1996). The behavioral consequences of service quality. The Journal of Marketing, 31–46.
Zeithaml, V. A., & Bitner, M. J. (2003). Services Marketing (Vol. 3rd). New Yourk, NY: McGraw-Hill Higher Education.
Zhu, F. X., Wymer, W., & Chen, I. (2002). IT-based services and service quality in consumer banking. International Journal of Service Industry Management, 13(1), 69–90.
270
APPENDIX: SURVEY
Ryanair or EasyJet: Which is Better?
This survey is intended to capture views of overall quality of the Low-Cost Airline
Industry Within the UK. It will be used for purely academic purposes. Any answers
given will be completely anonymous. The survey consists of 42 questions and takes
around 10 minutes to complete. Some simple demographic questions will be asked at
the end of the survey. Answering these questions is not required to complete the
survey, however; your response will be greatly appreciated. Thank you very much for
your participation in this research project. Jonavan Barnes Postgraduate research
Student The University of Stirling Institute for Retail Studies Stirling FK9
* Required
1. Have you flown with any of the following airlines: Ryanair or EasyJet * If No: Skip to
question 40.
· Yes
· No
2. How often do you take flights on one of these Low-Cost Carriers? * Count each flight
individually (i.e. Outbound and return = 2 flights).
· Not Often
· 1-2 Flights per year
· 3-4 Flights per year
· 5-6 Flights per year
· More than 6 flights per year
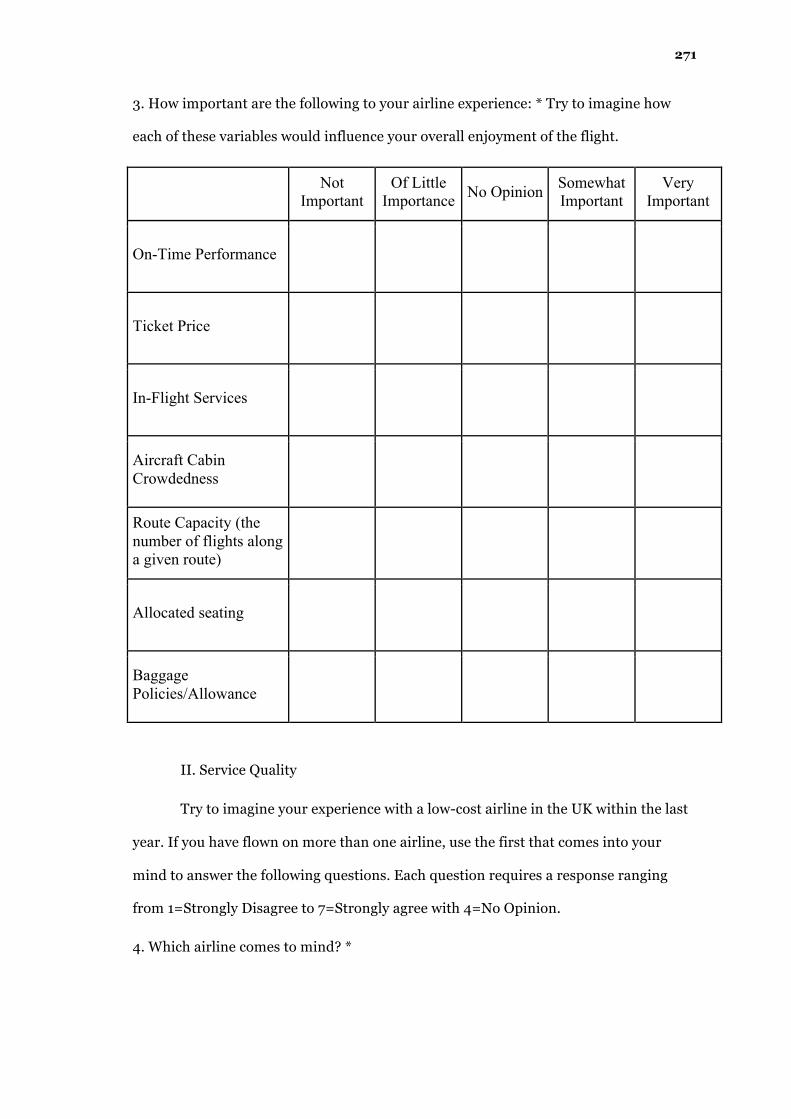
271
3. How important are the following to your airline experience: * Try to imagine how
each of these variables would influence your overall enjoyment of the flight.
Not Important
Of Little Importance No Opinion Somewhat
Important Very
Important
On-Time Performance
Ticket Price
In-Flight Services
Aircraft Cabin Crowdedness
Route Capacity (the number of flights along a given route)
Allocated seating
Baggage Policies/Allowance
II. Service Quality
Try to imagine your experience with a low-cost airline in the UK within the last
year. If you have flown on more than one airline, use the first that comes into your
mind to answer the following questions. Each question requires a response ranging
from 1=Strongly Disagree to 7=Strongly agree with 4=No Opinion.
4. Which airline comes to mind? *
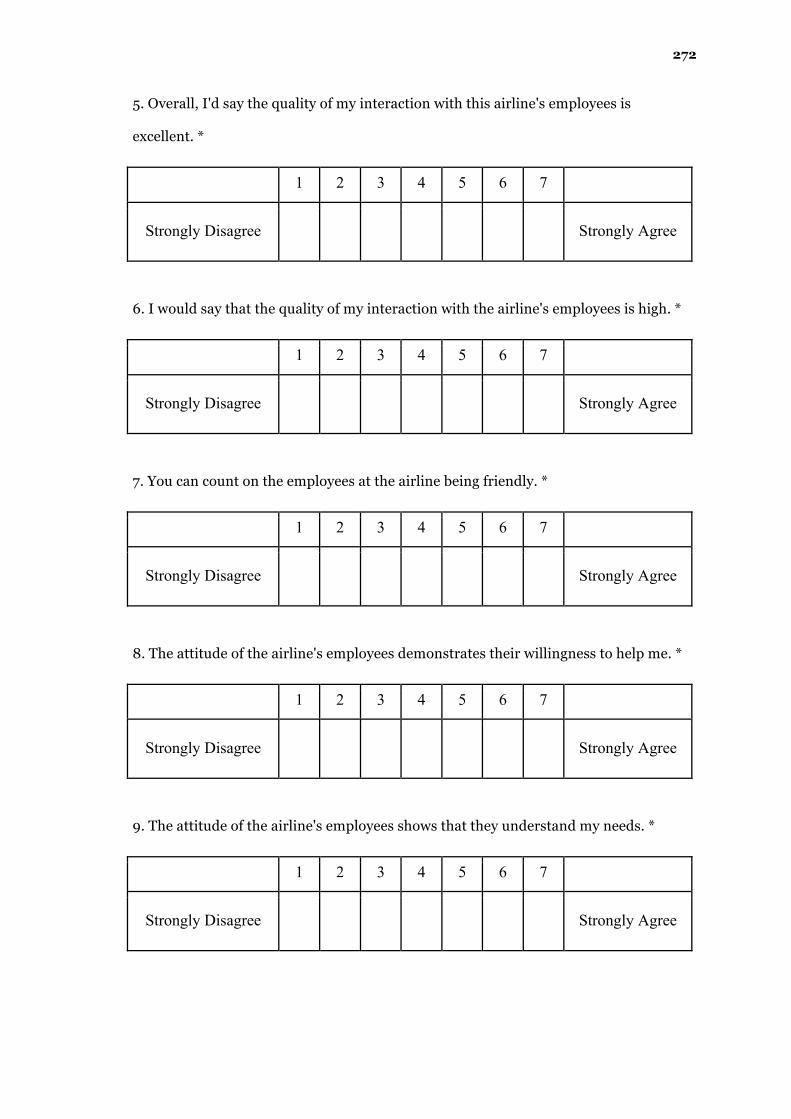
272
5. Overall, I'd say the quality of my interaction with this airline's employees is
excellent. *
1 2 3 4 5 6 7
Strongly Disagree Strongly Agree
6. I would say that the quality of my interaction with the airline's employees is high. *
1 2 3 4 5 6 7
Strongly Disagree Strongly Agree
7. You can count on the employees at the airline being friendly. *
1 2 3 4 5 6 7
Strongly Disagree Strongly Agree
8. The attitude of the airline's employees demonstrates their willingness to help me. *
1 2 3 4 5 6 7
Strongly Disagree Strongly Agree
9. The attitude of the airline's employees shows that they understand my needs. *
1 2 3 4 5 6 7
Strongly Disagree Strongly Agree
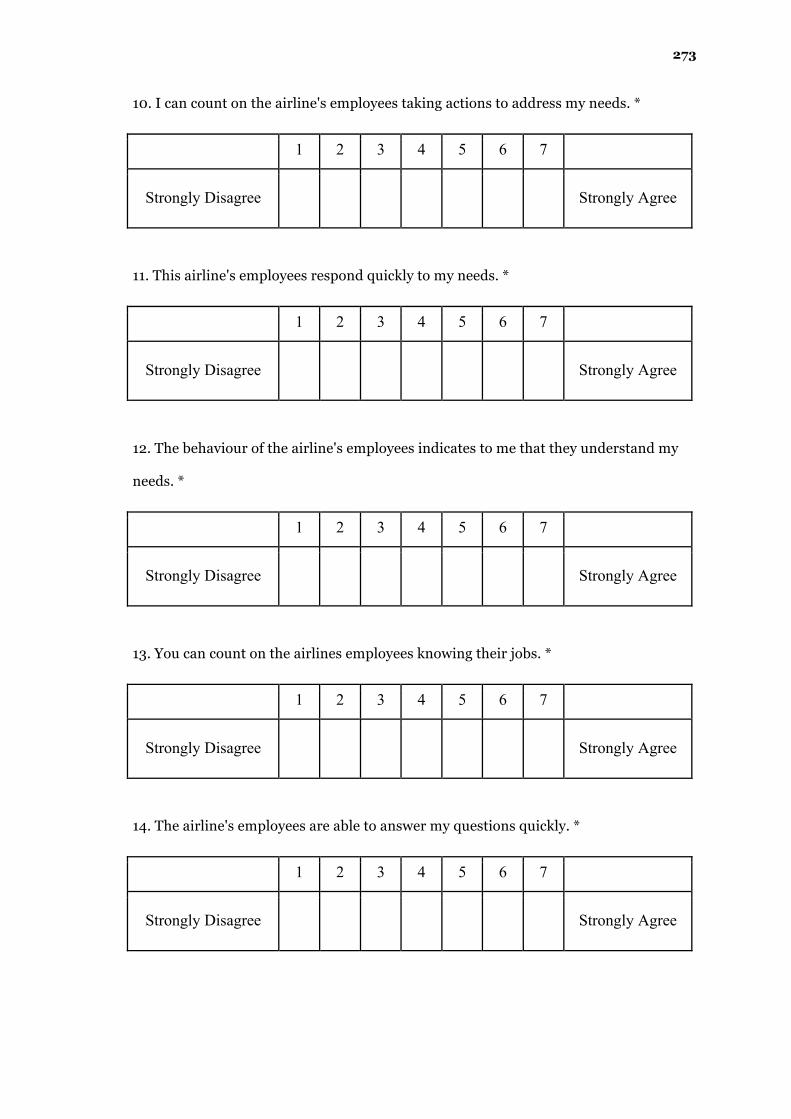
273
10. I can count on the airline's employees taking actions to address my needs. *
1 2 3 4 5 6 7
Strongly Disagree Strongly Agree
11. This airline's employees respond quickly to my needs. *
1 2 3 4 5 6 7
Strongly Disagree Strongly Agree
12. The behaviour of the airline's employees indicates to me that they understand my
needs. *
1 2 3 4 5 6 7
Strongly Disagree Strongly Agree
13. You can count on the airlines employees knowing their jobs. *
1 2 3 4 5 6 7
Strongly Disagree Strongly Agree
14. The airline's employees are able to answer my questions quickly. *
1 2 3 4 5 6 7
Strongly Disagree Strongly Agree
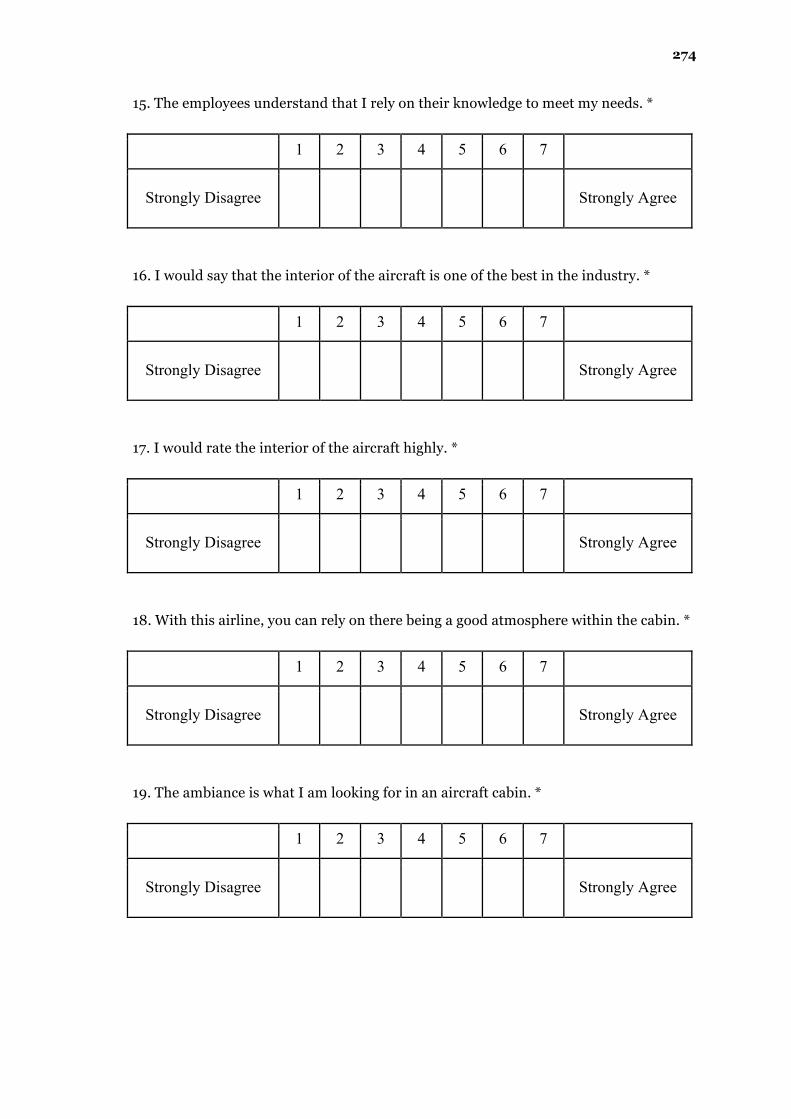
274
15. The employees understand that I rely on their knowledge to meet my needs. *
1 2 3 4 5 6 7
Strongly Disagree Strongly Agree
16. I would say that the interior of the aircraft is one of the best in the industry. *
1 2 3 4 5 6 7
Strongly Disagree Strongly Agree
17. I would rate the interior of the aircraft highly. *
1 2 3 4 5 6 7
Strongly Disagree Strongly Agree
18. With this airline, you can rely on there being a good atmosphere within the cabin. *
1 2 3 4 5 6 7
Strongly Disagree Strongly Agree
19. The ambiance is what I am looking for in an aircraft cabin. *
1 2 3 4 5 6 7
Strongly Disagree Strongly Agree
275
20. The airline understands that its atmosphere is important to me. *
1 2 3 4 5 6 7
Strongly Disagree Strongly Agree
21. The airline's cabin layout never fails to impress me. *
1 2 3 4 5 6 7
Strongly Disagree Strongly Agree
22. The cabin layout serves my purposes. *
1 2 3 4 5 6 7
Strongly Disagree Strongly Agree
23. The airline understands that the design of the aircraft interior is important to me. *
1 2 3 4 5 6 7
Strongly Disagree Strongly Agree
24. I feel that the airline's other customers consistently leave me with a good
impression of its service. *
1 2 3 4 5 6 7
Strongly Disagree Strongly Agree
276
25. The airlines other customers do not affect its ability to provide me with good
service. *
1 2 3 4 5 6 7
Strongly Disagree Strongly Agree
26. The airline understands that other patrons affect my perceptions of its service. *
1 2 3 4 5 6 7
Strongly Disagree Strongly Agree
27. I always have an excellent experience when I fly with this airline. *
1 2 3 4 5 6 7
Strongly Disagree Strongly Agree
28. I feel good about what the airline provides to its customers. *
1 2 3 4 5 6 7
Strongly Disagree Strongly Agree
29. Waiting time with this airline is predictable. * This refers to time spent waiting on
an airline employee to provide you with help, assistance or other service. It does not
refer to the airlines on-time performance.
1 2 3 4 5 6 7
Strongly Disagree Strongly Agree
277
30. The airline tries to keep my waiting time to a minimum. *
1 2 3 4 5 6 7
Strongly Disagree Strongly Agree
31. The airline understands that waiting time is important to me. * This refers to time
spent waiting on an airline employee to provide you with help, assistance or other
service. It does not refer to the airlines on-time performance.
1 2 3 4 5 6 7
Strongly Disagree Strongly Agree
32. I am consistently pleased with my flight with this airline. *
1 2 3 4 5 6 7
Strongly Disagree Strongly Agree
33. I like this airline because it has the flight I want. *
1 2 3 4 5 6 7
Strongly Disagree Strongly Agree
278
34. The airline knows the kind of flight its customers are looking for. *
1 2 3 4 5 6 7
Strongly Disagree Strongly Agree
These Questions refer to whether you think the outcome of this experience was good or
bad. Please choose the number which best reflects your perception of whether the
experience was good or bad.
35. When I leave this airline I usually feel that I have a good experience. *
1 2 3 4 5 6 7
Strongly Disagree Strongly Agree
36. I believe this airline tries to give me a good experience *
1 2 3 4 5 6 7
Strongly Disagree Strongly Agree
37. I believe that the airline knows the type of experience its customers want. *
1 2 3 4 5 6 7
Strongly Disagree Strongly Agree
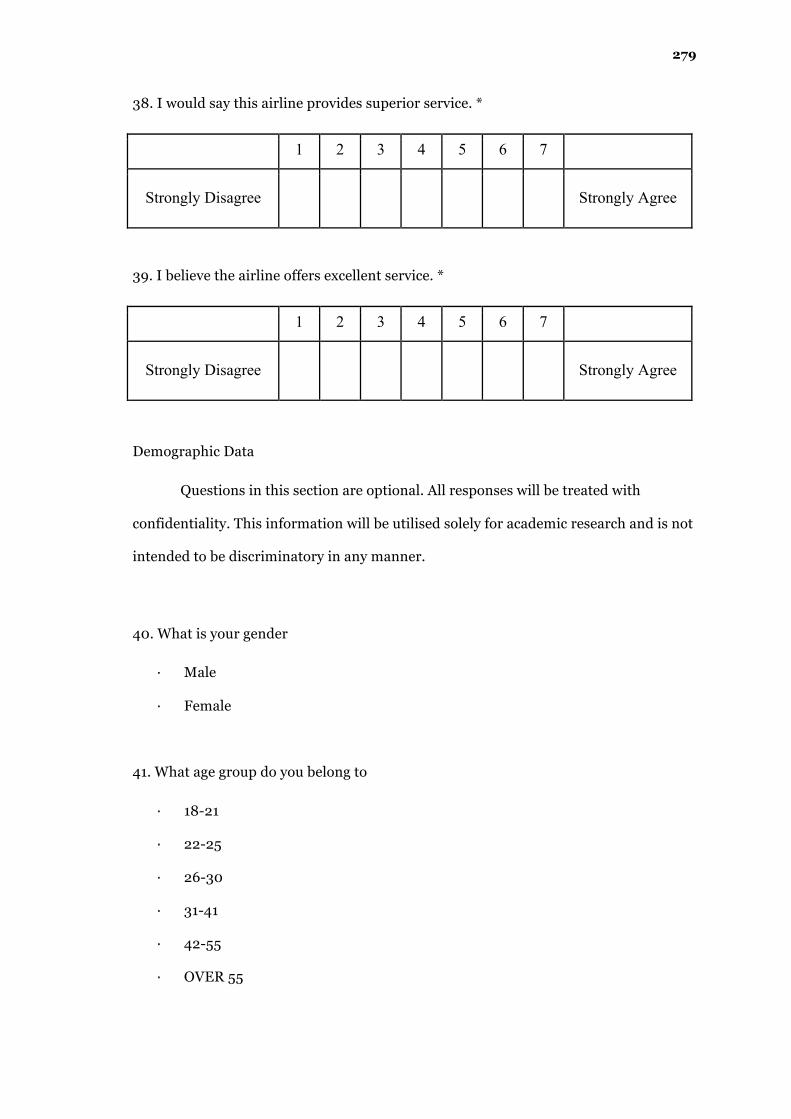
279
38. I would say this airline provides superior service. *
1 2 3 4 5 6 7
Strongly Disagree Strongly Agree
39. I believe the airline offers excellent service. *
1 2 3 4 5 6 7
Strongly Disagree Strongly Agree
Demographic Data
Questions in this section are optional. All responses will be treated with
confidentiality. This information will be utilised solely for academic research and is not
intended to be discriminatory in any manner.
40. What is your gender
· Male
· Female
41. What age group do you belong to
· 18-21
· 22-25
· 26-30
· 31-41
· 42-55
· OVER 55
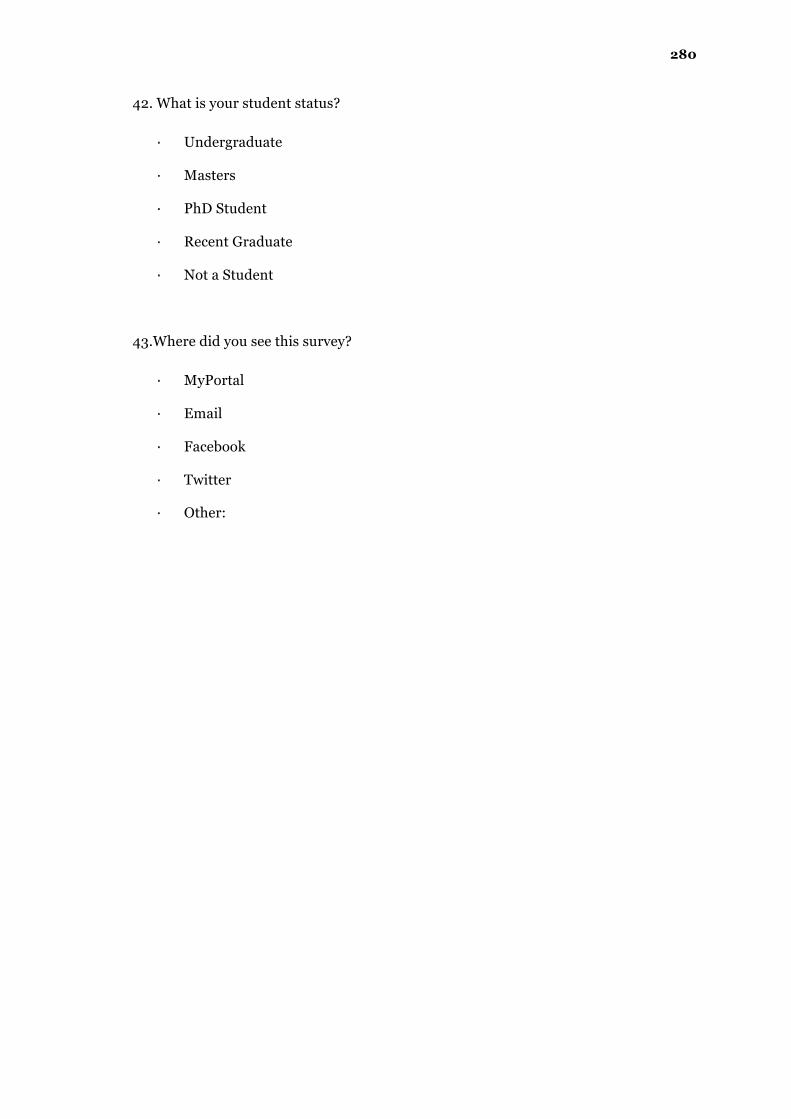
280
42. What is your student status?
· Undergraduate
· Masters
· PhD Student
· Recent Graduate
· Not a Student
43.Where did you see this survey?
· MyPortal
· Other:
Related Documents