Copyright © 2013 Pearson Education, Inc. Publishing as Addison-Wesley MEASURING PRODUCTIVITY Chapter 7

Welcome message from author
This document is posted to help you gain knowledge. Please leave a comment to let me know what you think about it! Share it to your friends and learn new things together.
Transcript

Copyright © 2013 Pearson Education, Inc. Publishing as Addison-Wesley
MEASURING PRODUCTIVITY
Chapter 7

Copyright © 2013 Pearson Education, Inc. Publishing as Addison-Wesley
Figure 7.1 Possible Sources of Differences in Output per Worker
Copyright © 2013 Pearson Education, Inc. Publishing as Addison-Wesley
Figure 7.2 Inferring Productivity from Data on Output and Factor Accumulation
Copyright © 2013 Pearson Education, Inc. Publishing as Addison-Wesley
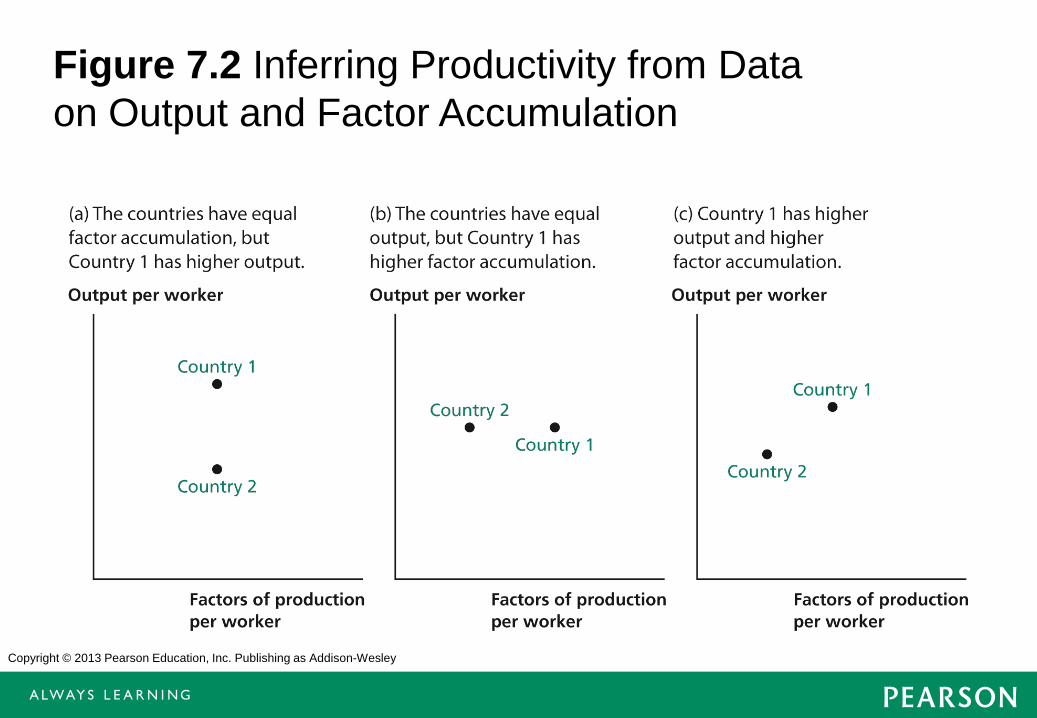
productivity accounting
Ratio of output= Ratio of productivity * Ratio of factors of production Ratio of productivity= Ratio of income/Ratio of factors of production
Copyright © 2013 Pearson Education, Inc. Publishing as Addison-Wesley
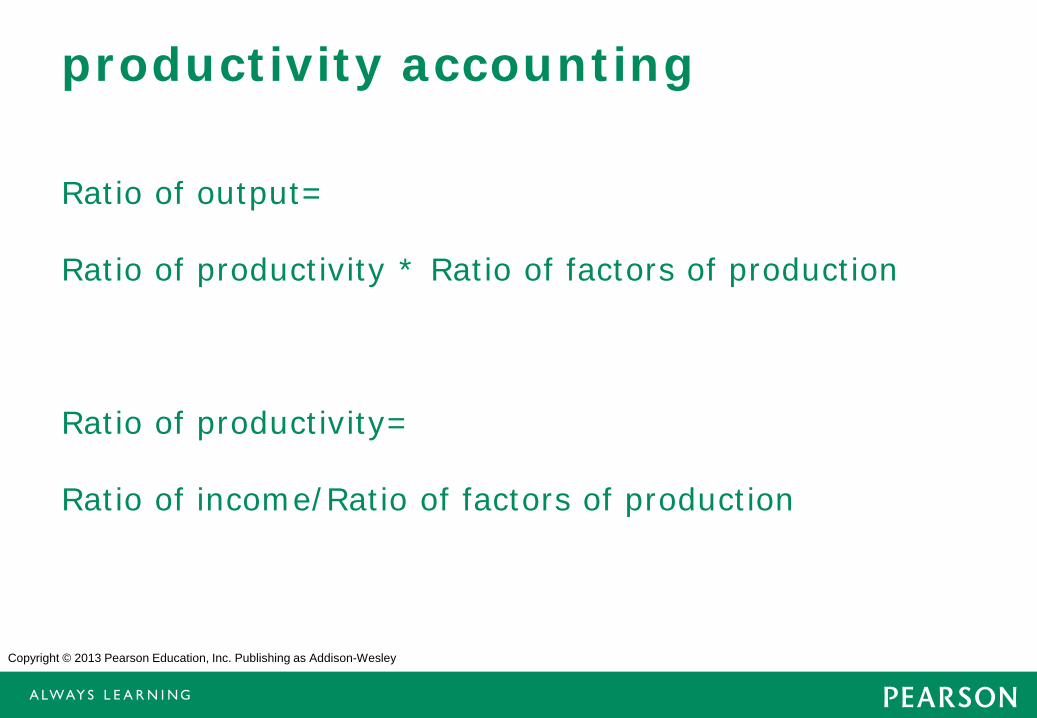
Table 7.1 Data Used to Analyze Productivity in Country 1 and Country 2
Copyright © 2013 Pearson Education, Inc. Publishing as Addison-Wesley
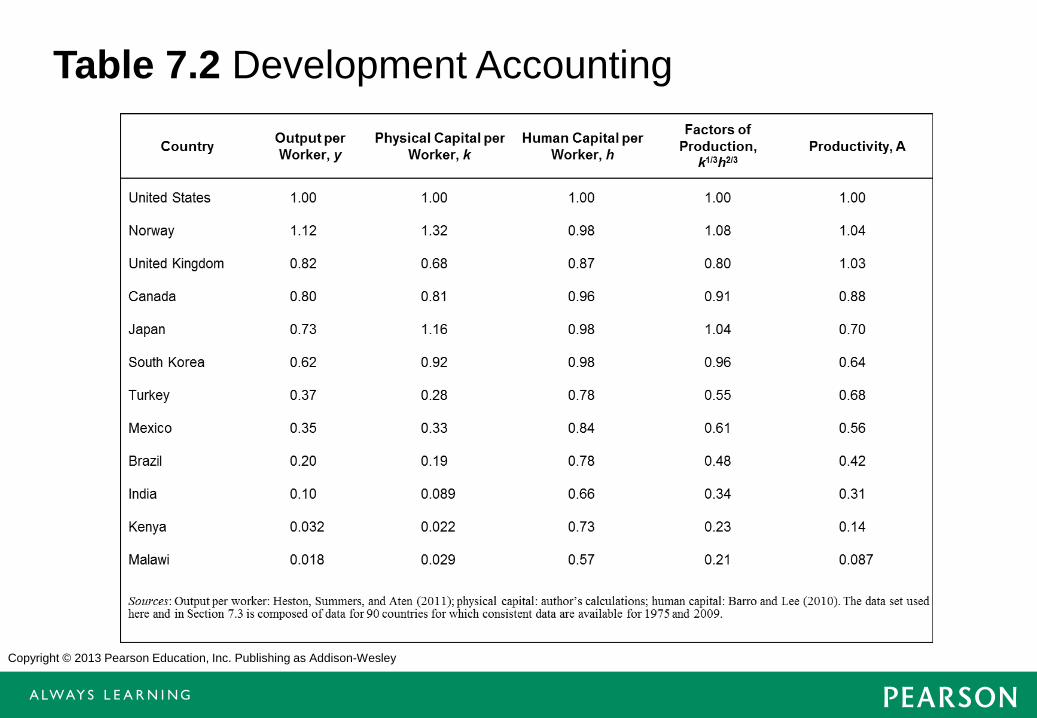
Table 7.2 Development Accounting
Copyright © 2013 Pearson Education, Inc. Publishing as Addison-Wesley
8-7
Problems with measuring capital and implications
• Waste of investment • Quality of investment
• There are estimate according to which the actual
level of the capital stock is in between 60% to 75% of the official statistics…
Copyright © 2013 Pearson Education, Inc. Publishing as Addison-Wesley
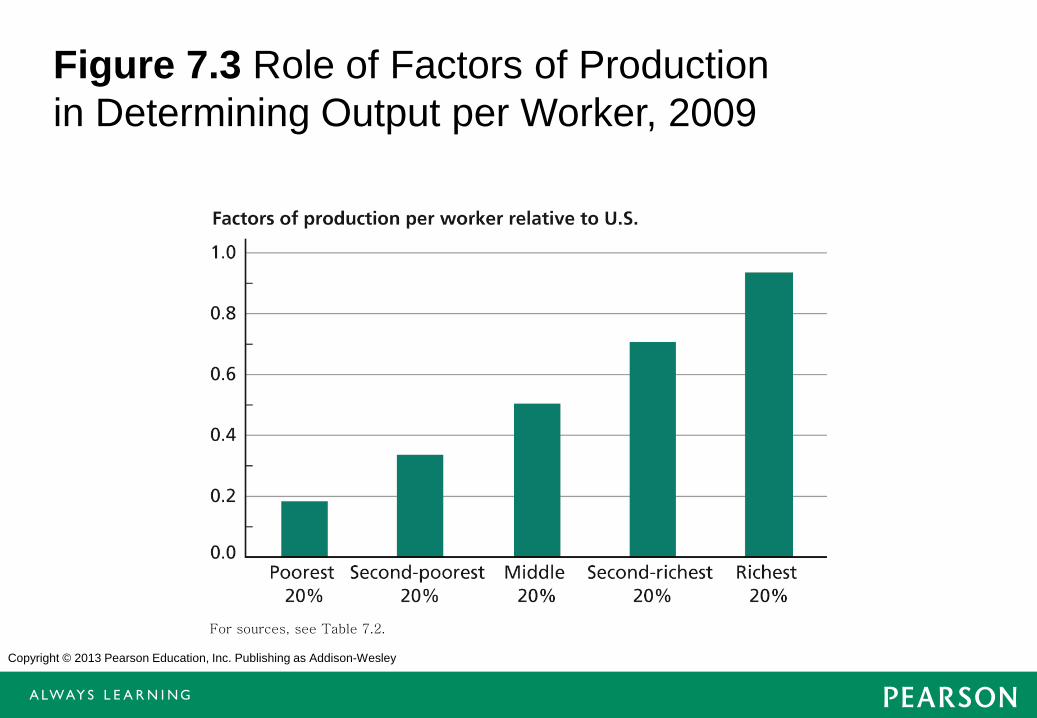
Figure 7.3 Role of Factors of Production in Determining Output per Worker, 2009
For sources, see Table 7.2.
Copyright © 2013 Pearson Education, Inc. Publishing as Addison-Wesley
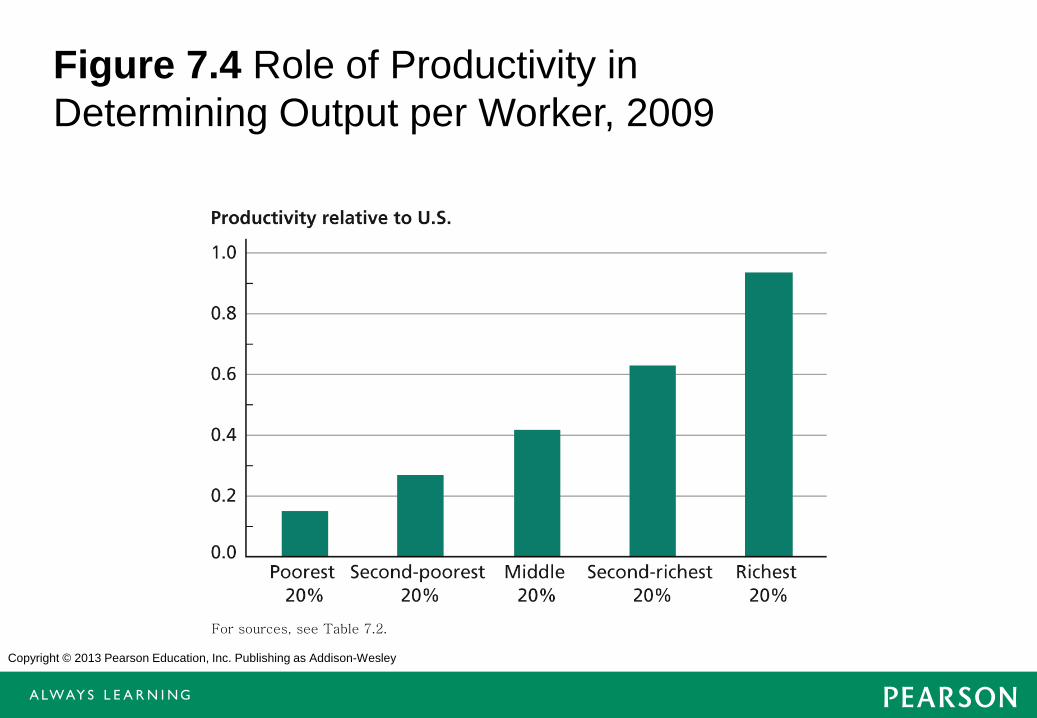
Figure 7.4 Role of Productivity in Determining Output per Worker, 2009
For sources, see Table 7.2.
Copyright © 2013 Pearson Education, Inc. Publishing as Addison-Wesley
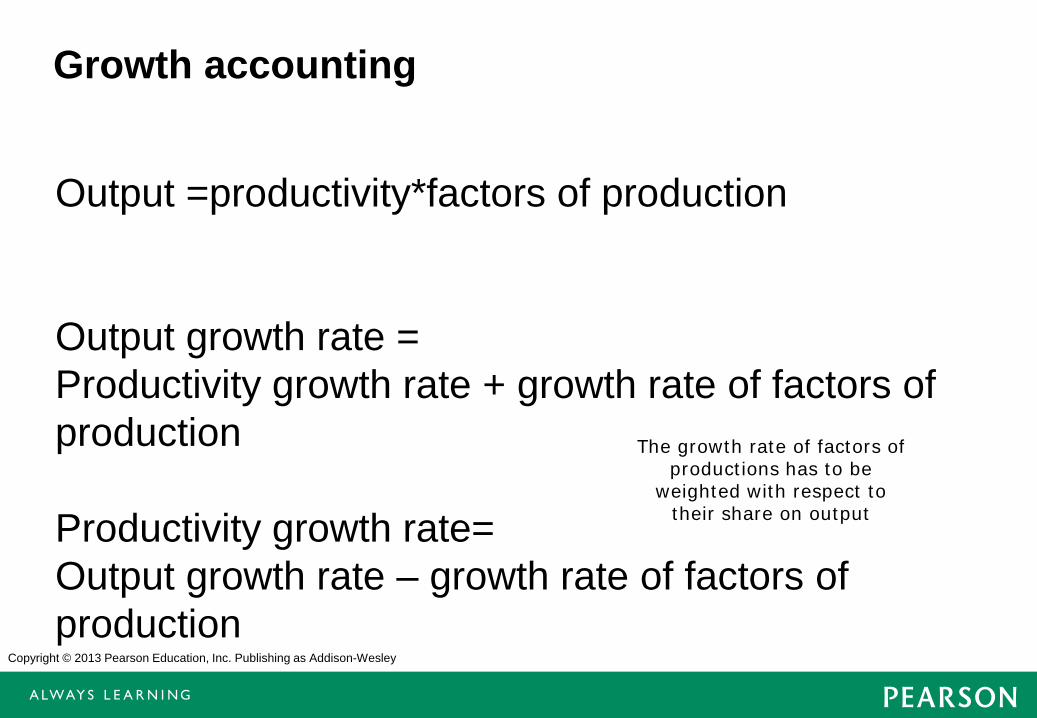
Growth accounting
Output =productivity*factors of production Output growth rate = Productivity growth rate + growth rate of factors of production Productivity growth rate= Output growth rate – growth rate of factors of production
The growth rate of factors of productions has to be
weighted with respect to their share on output
Copyright © 2013 Pearson Education, Inc. Publishing as Addison-Wesley
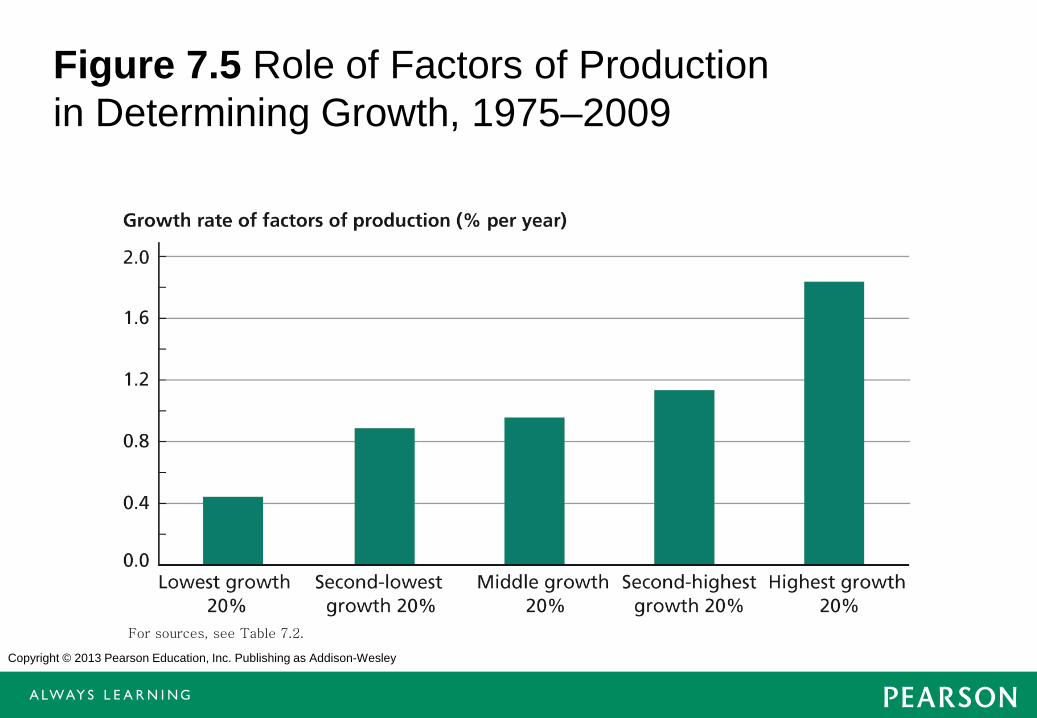
Figure 7.5 Role of Factors of Production in Determining Growth, 1975–2009
For sources, see Table 7.2.
Copyright © 2013 Pearson Education, Inc. Publishing as Addison-Wesley
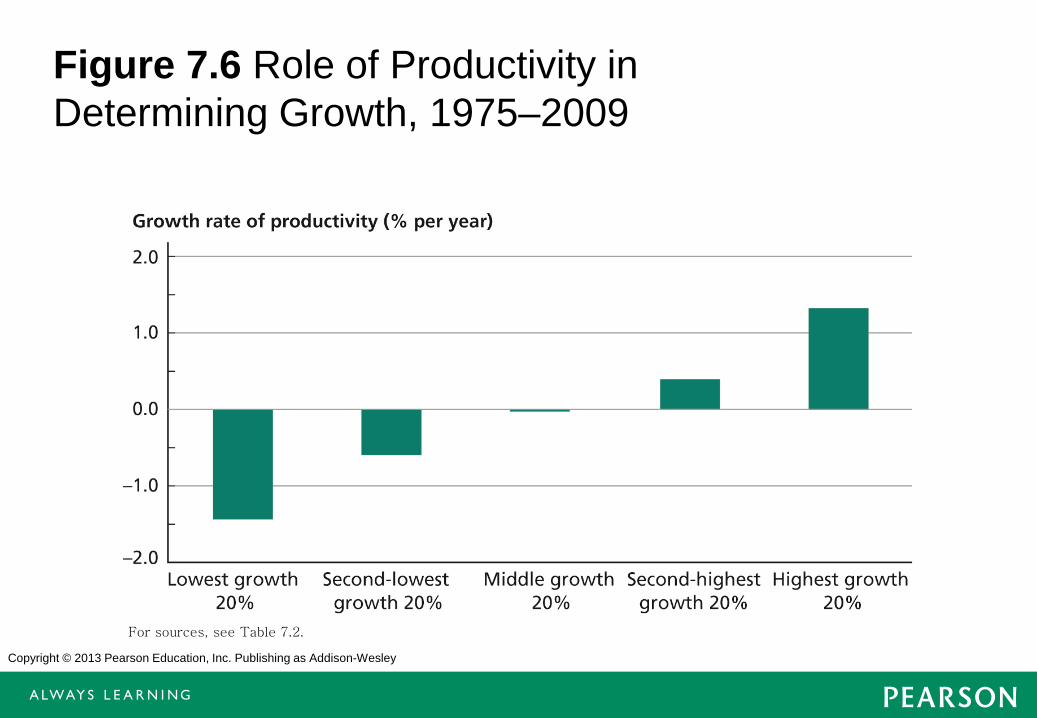
Figure 7.6 Role of Productivity in Determining Growth, 1975–2009
For sources, see Table 7.2.

Copyright © 2013 Pearson Education, Inc. Publishing as Addison-Wesley
THE ROLE OF TECHNOLOGY IN GROWTH
Chapter 8
Copyright © 2013 Pearson Education, Inc. Publishing as Addison-Wesley
8-15
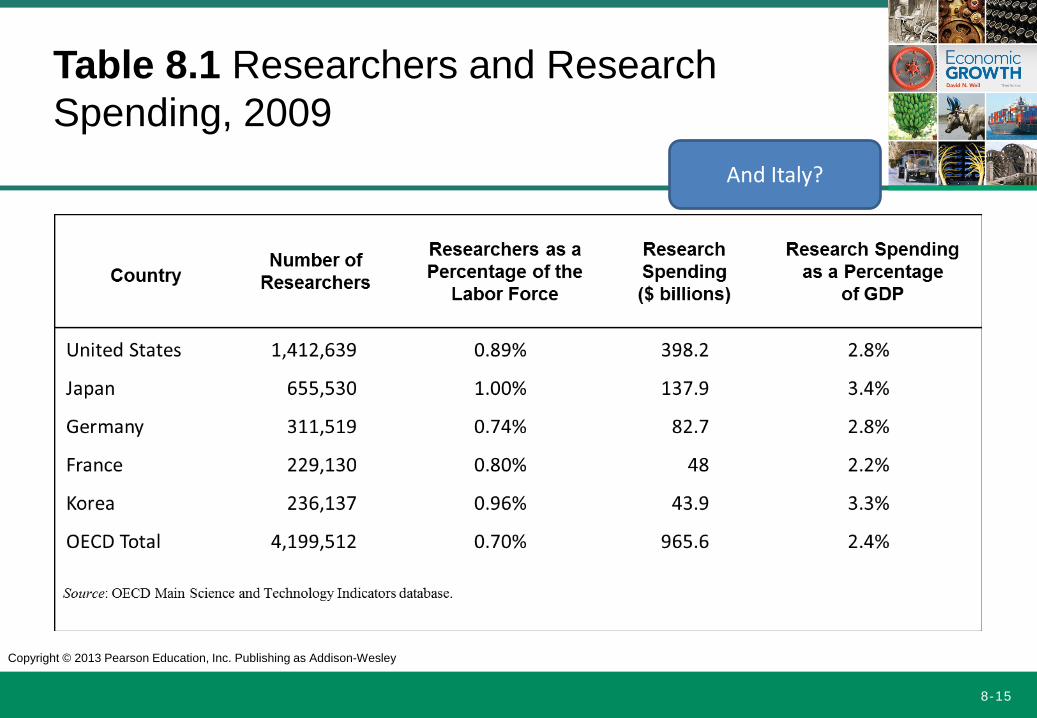
Table 8.1 Researchers and Research Spending, 2009
And Italy?

Copyright © 2013 Pearson Education, Inc. Publishing as Addison-Wesley
8-16
The nature of technological progress
• Technology creation
• Technology transfer or diffusion – Non rivarly – Non excludability
Copyright © 2013 Pearson Education, Inc. Publishing as Addison-Wesley
8-17
Determinants of R&D spending
• Profit considerations – How much advantage with respect to followers – Size of the market – How long does the advantage last – Uncertainty
Concept of creative distruction
Copyright © 2013 Pearson Education, Inc. Publishing as Addison-Wesley
8-18
One country model
• Labour is the only factor • Which can be used either in production or in the
R&D • γA is the quota of labour used in R&D…
• Its function is similar to the saving rate in the
Solow model
Copyright © 2013 Pearson Education, Inc. Publishing as Addison-Wesley
8-19
Process of productivity growth
• Growth of A = LA/µ
• where µ represents the price/cost of the new invention
• The growth rate of A represents the growth rate of y
Copyright © 2013 Pearson Education, Inc. Publishing as Addison-Wesley
8-20
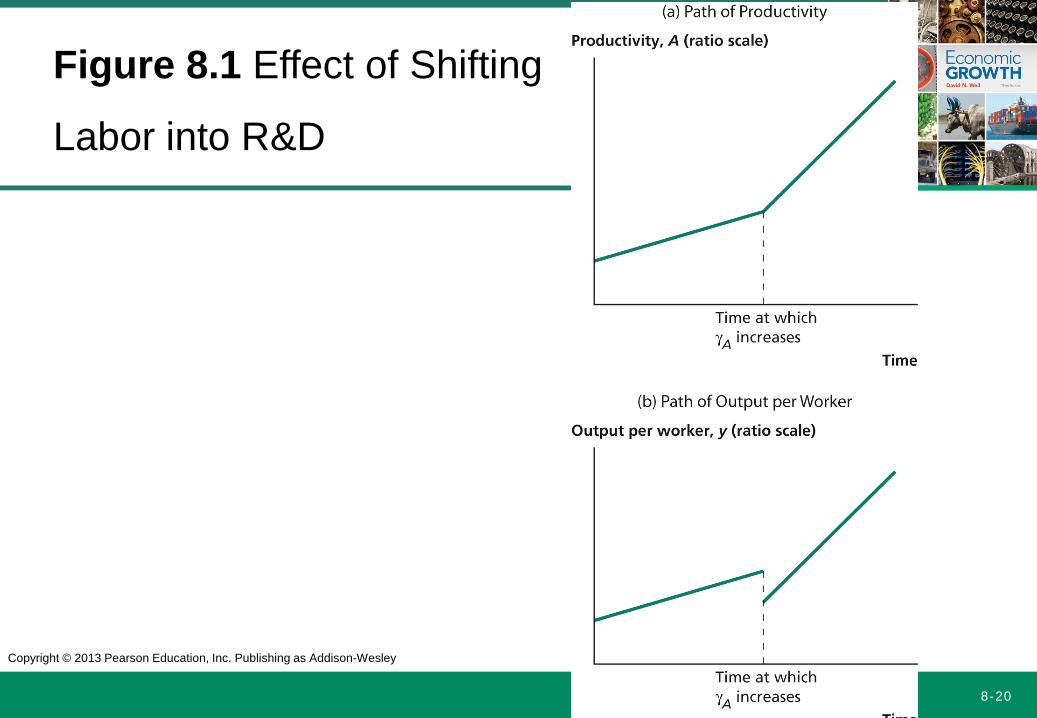
Figure 8.1 Effect of Shifting
Labor into R&D
Copyright © 2013 Pearson Education, Inc. Publishing as Addison-Wesley
8-21
Two country model
• µ is now different among countries
• One country invests more in R&D and it is the leadear the other one is the follower
Copyright © 2013 Pearson Education, Inc. Publishing as Addison-Wesley
8-22
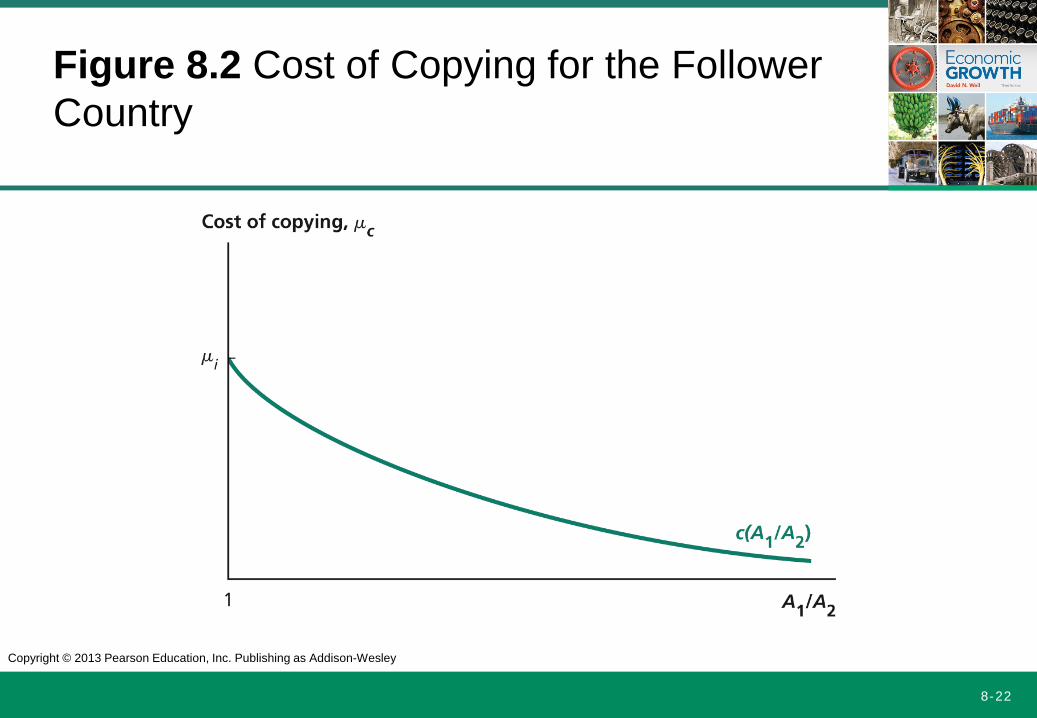
Figure 8.2 Cost of Copying for the Follower Country
Copyright © 2013 Pearson Education, Inc. Publishing as Addison-Wesley
8-23
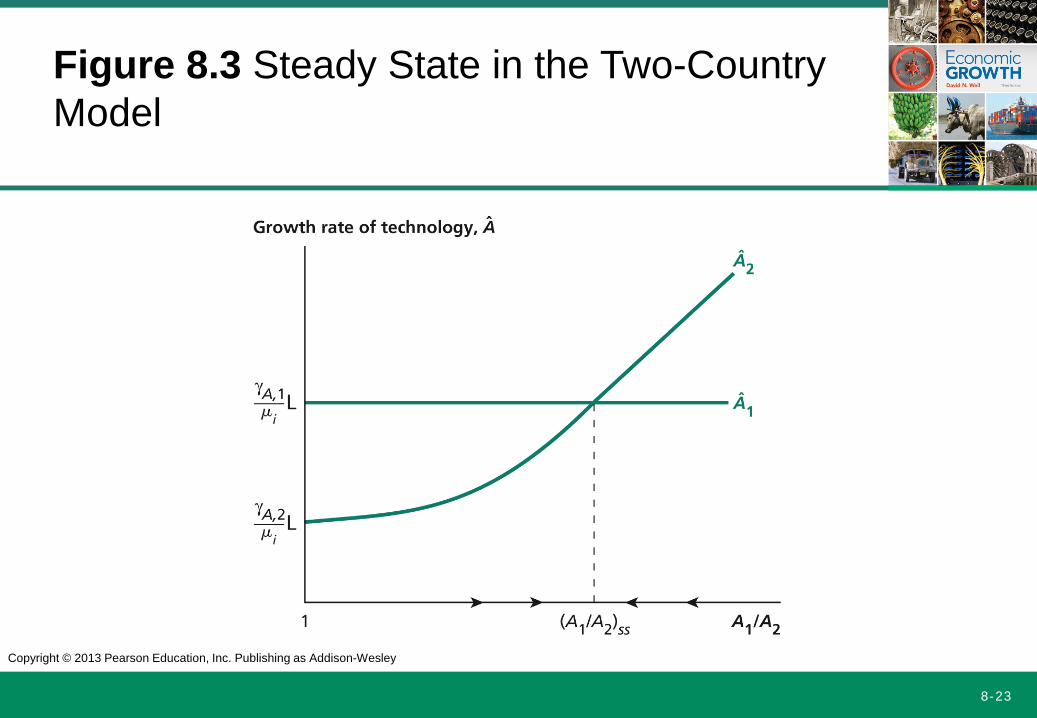
Figure 8.3 Steady State in the Two-Country Model
Copyright © 2013 Pearson Education, Inc. Publishing as Addison-Wesley
8-24
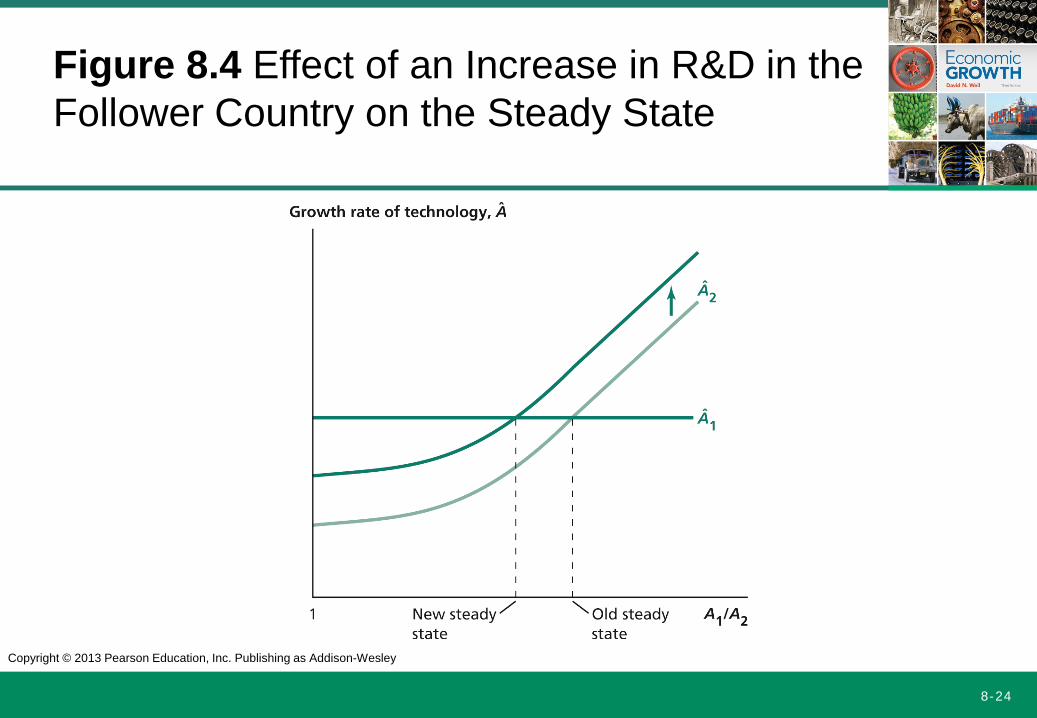
Figure 8.4 Effect of an Increase in R&D in the Follower Country on the Steady State
Copyright © 2013 Pearson Education, Inc. Publishing as Addison-Wesley
8-25
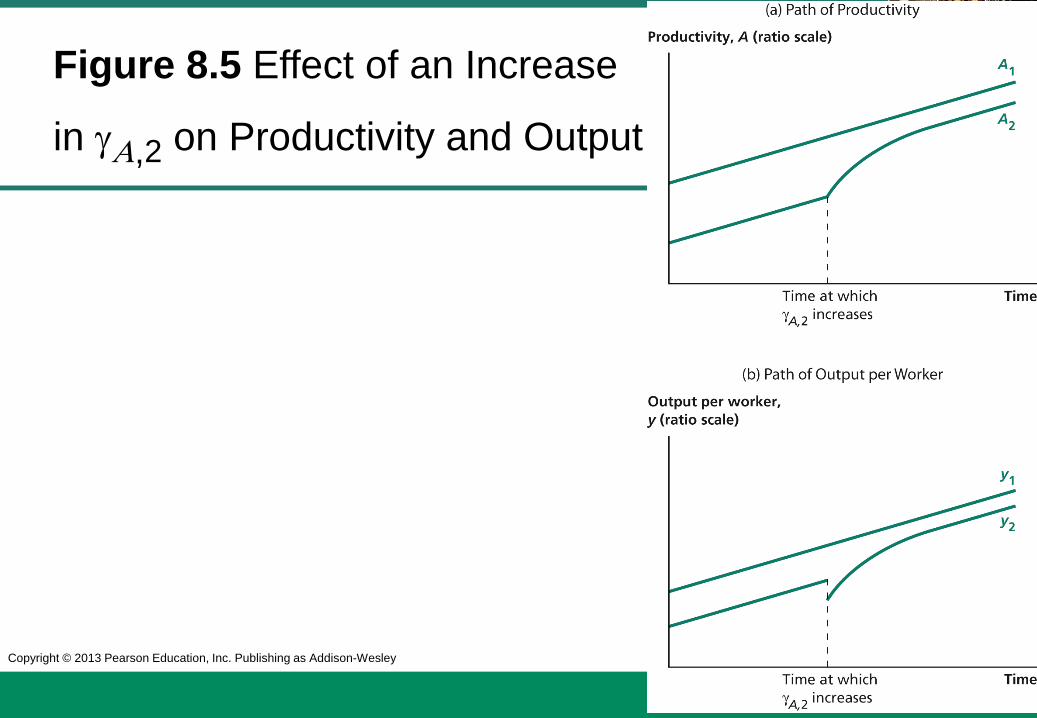
Figure 8.5 Effect of an Increase
in γΑ,2 on Productivity and Output

Copyright © 2013 Pearson Education, Inc. Publishing as Addison-Wesley
8-26
Barriers to international technology transfer
• Appropriate technology
• Tacit knowledge
• Patents and other tools to appropriate R&D returns
Copyright © 2013 Pearson Education, Inc. Publishing as Addison-Wesley
8-27
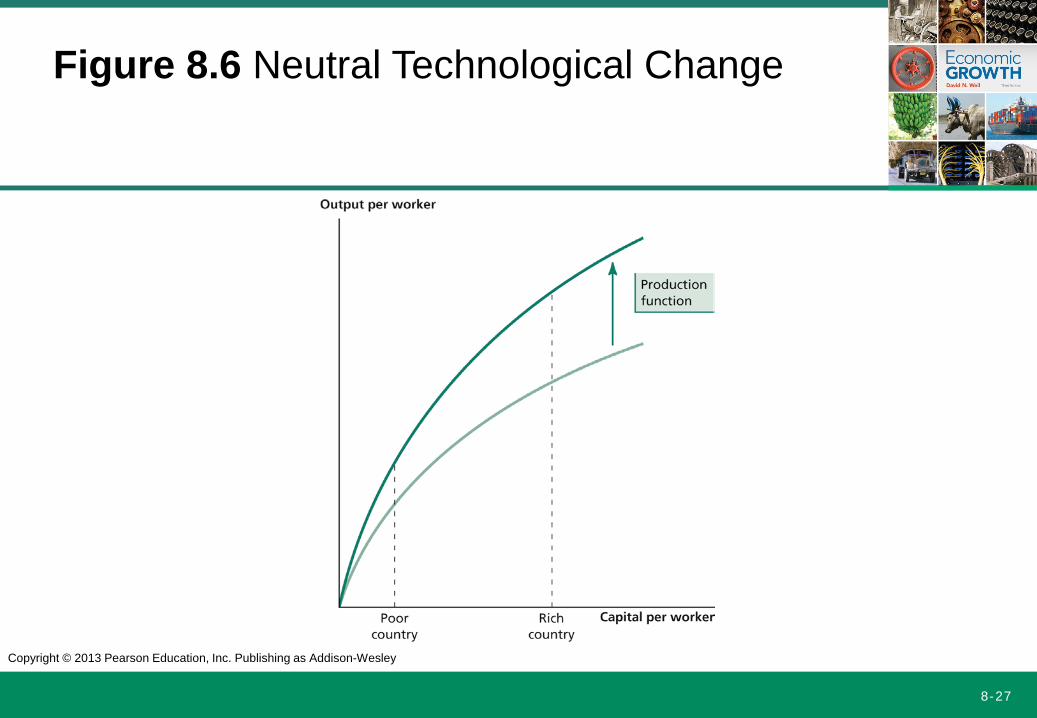
Figure 8.6 Neutral Technological Change
Copyright © 2013 Pearson Education, Inc. Publishing as Addison-Wesley
8-28
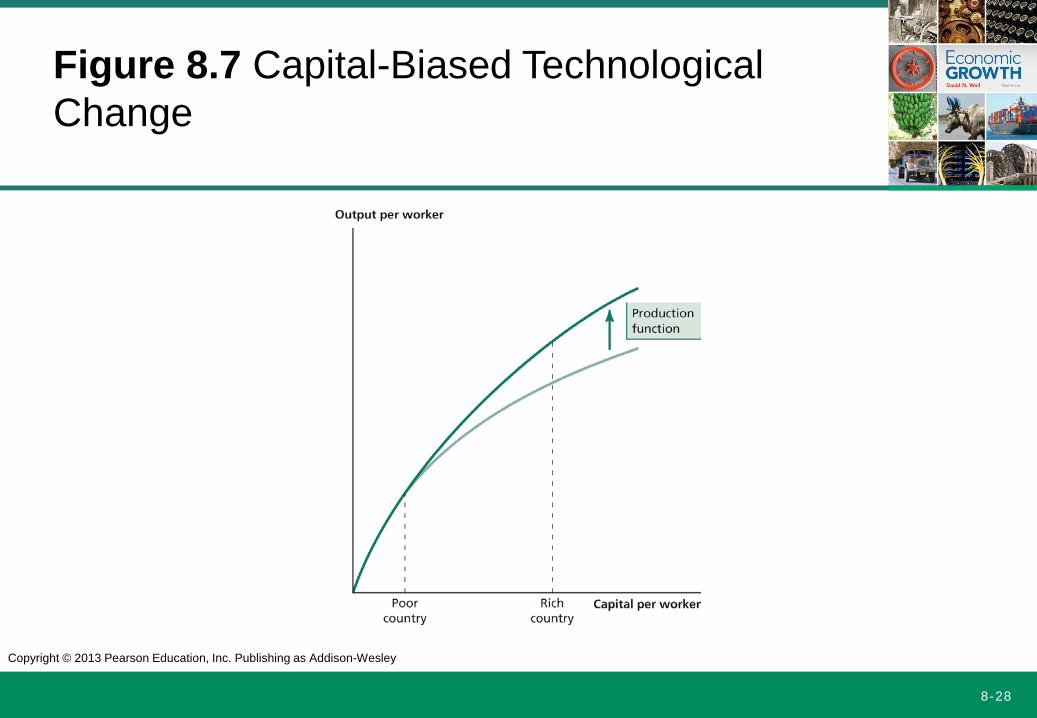
Figure 8.7 Capital-Biased Technological Change

Copyright © 2013 Pearson Education, Inc. Publishing as Addison-Wesley
8-30
THE CUTTING EDGE OF TECHNOLOGY
Chapter 9

Copyright © 2013 Pearson Education, Inc. Publishing as Addison-Wesley
8-39
EFFICIENCY
Chapter 10
Copyright © 2013 Pearson Education, Inc. Publishing as Addison-Wesley
8-40
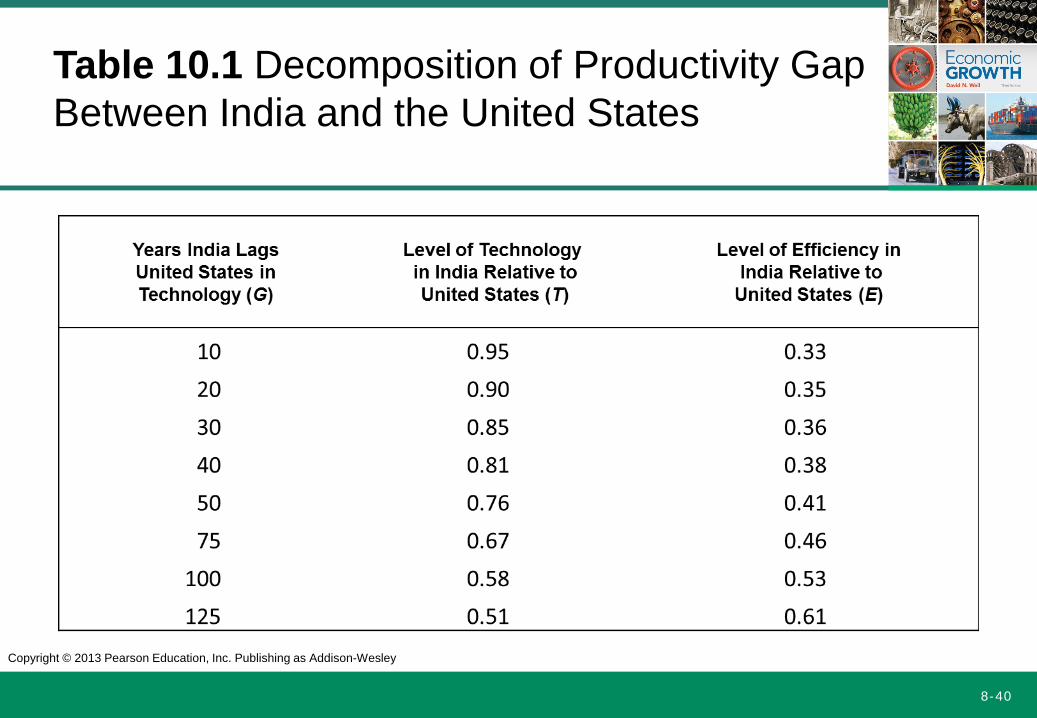
Table 10.1 Decomposition of Productivity Gap Between India and the United States
Copyright © 2013 Pearson Education, Inc. Publishing as Addison-Wesley
8-41
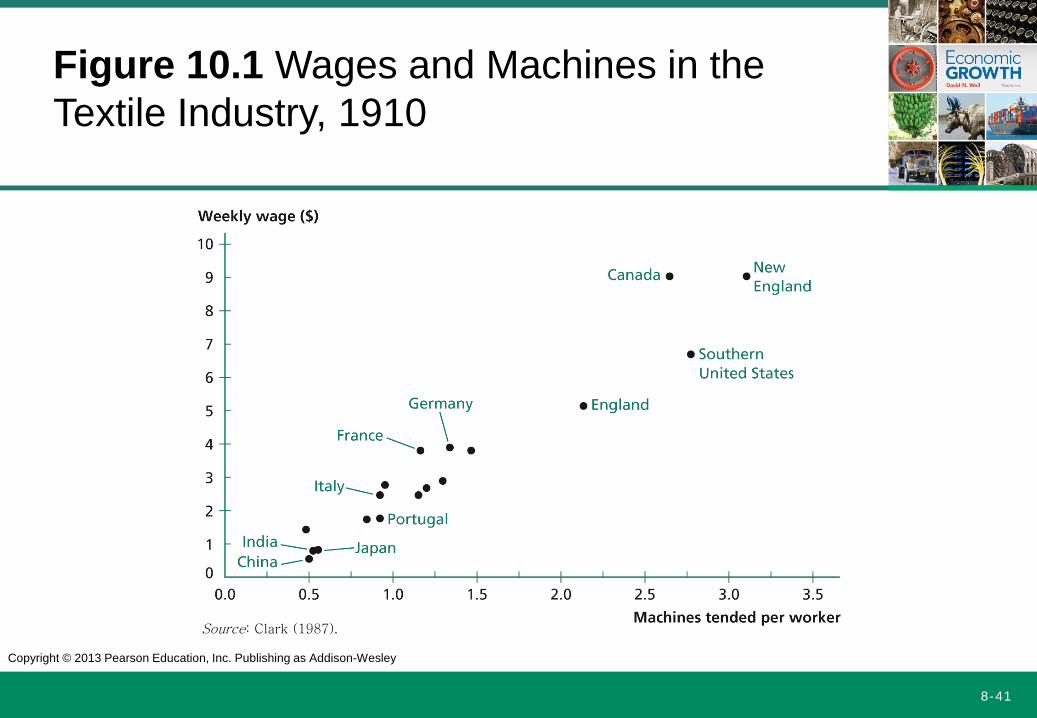
Figure 10.1 Wages and Machines in the Textile Industry, 1910
Source: Clark (1987).
Copyright © 2013 Pearson Education, Inc. Publishing as Addison-Wesley
8-42
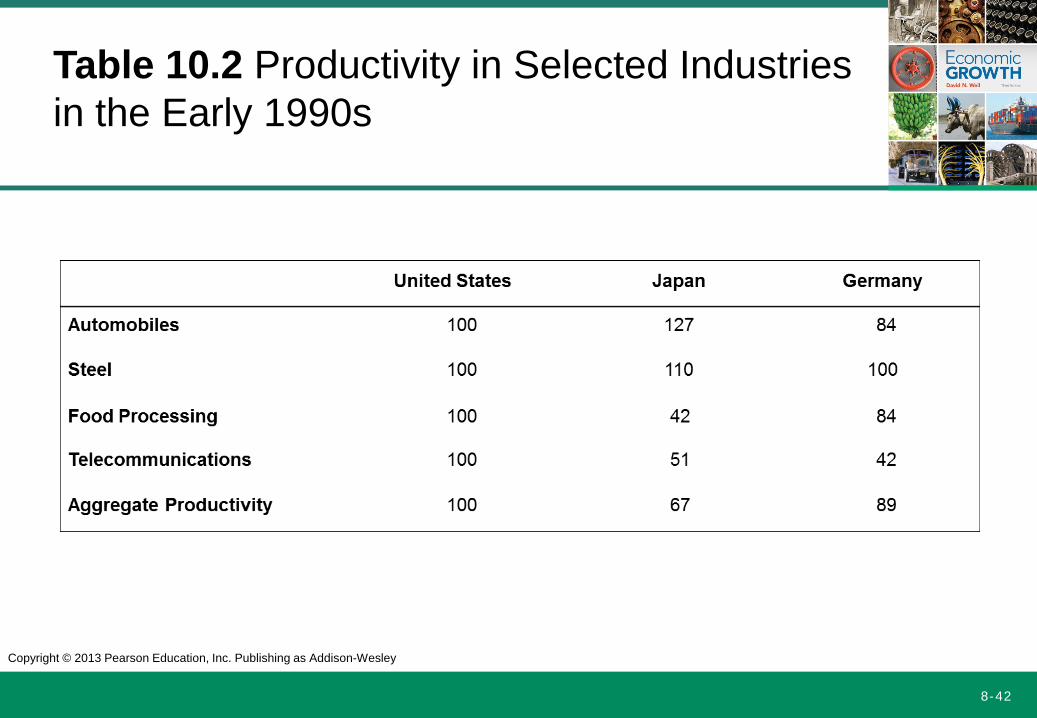
Table 10.2 Productivity in Selected Industries in the Early 1990s
Copyright © 2013 Pearson Education, Inc. Publishing as Addison-Wesley
8-43
Types of inefficiencies
• Unproductive activities – Rent seeking phenomena
• Idle resources • Misallocation of factors among sectors
– Barriers to mobility – Wages not equal to marginal product

Copyright © 2013 Pearson Education, Inc. Publishing as Addison-Wesley
8-48
GROWTH IN THE OPEN ECONOMY
Chapter 11
Copyright © 2013 Pearson Education, Inc. Publishing as Addison-Wesley
8-49
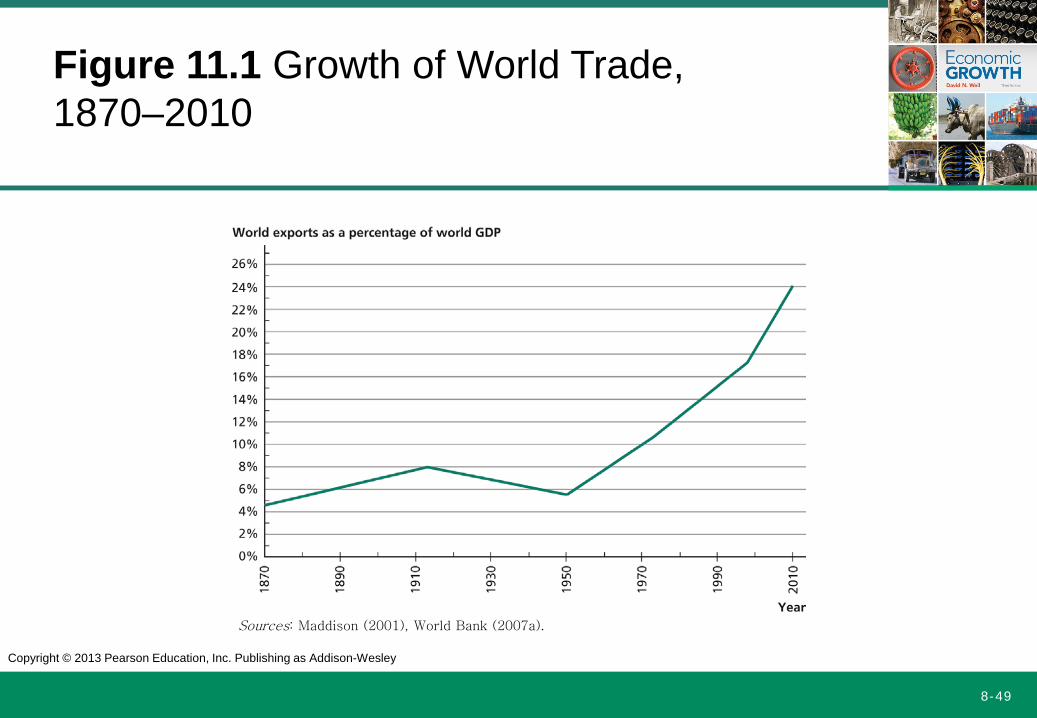
Figure 11.1 Growth of World Trade, 1870–2010
Sources: Maddison (2001), World Bank (2007a).
Copyright © 2013 Pearson Education, Inc. Publishing as Addison-Wesley
8-50
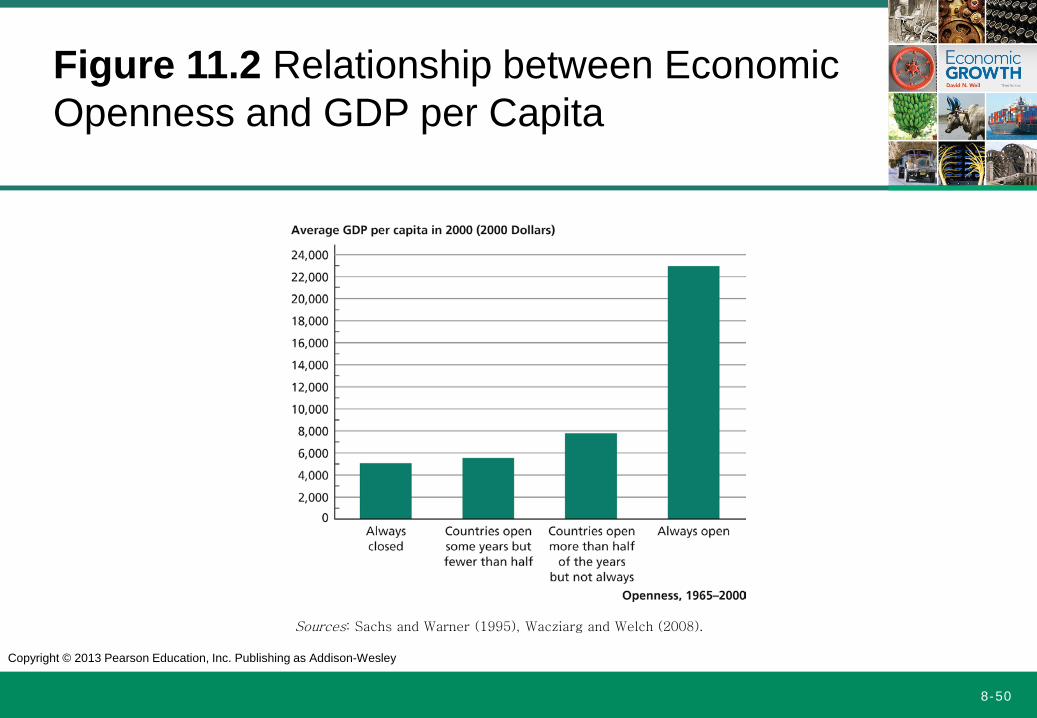
Figure 11.2 Relationship between Economic Openness and GDP per Capita
Sources: Sachs and Warner (1995), Wacziarg and Welch (2008).
Copyright © 2013 Pearson Education, Inc. Publishing as Addison-Wesley
8-51
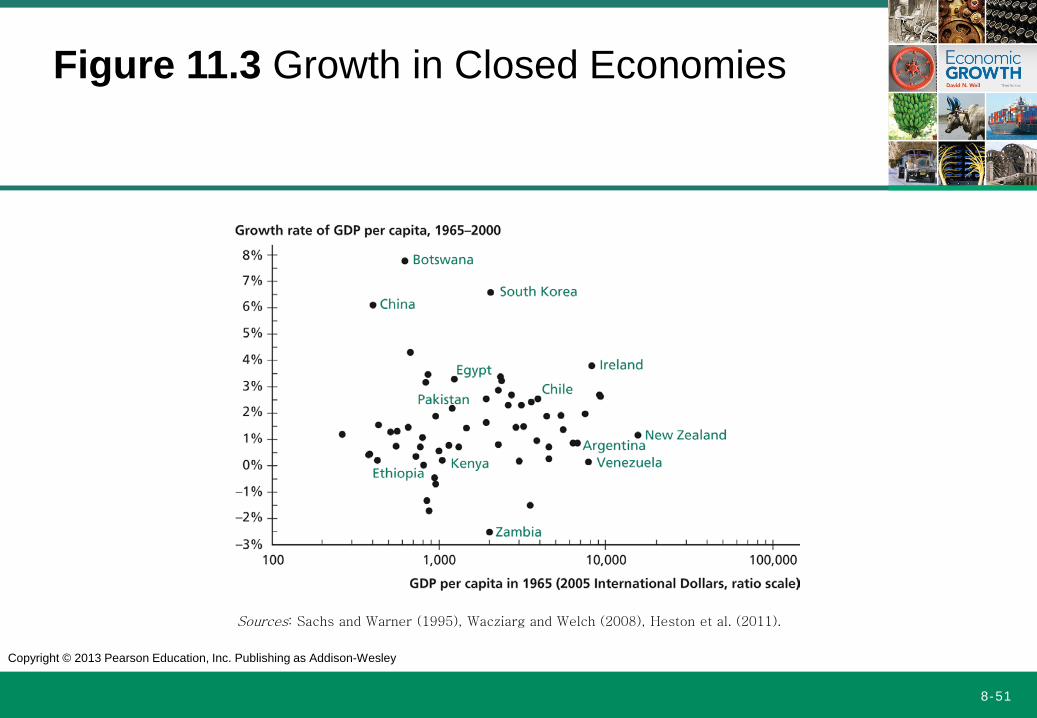
Figure 11.3 Growth in Closed Economies
Sources: Sachs and Warner (1995), Wacziarg and Welch (2008), Heston et al. (2011).
Copyright © 2013 Pearson Education, Inc. Publishing as Addison-Wesley
8-52
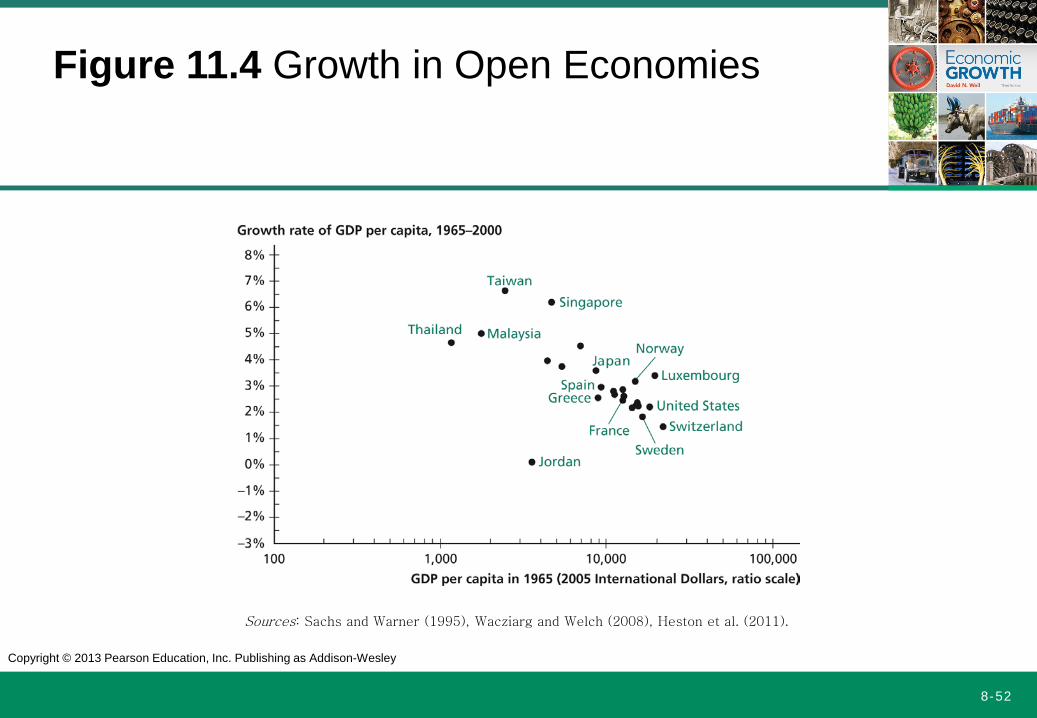
Figure 11.4 Growth in Open Economies
Sources: Sachs and Warner (1995), Wacziarg and Welch (2008), Heston et al. (2011).
Copyright © 2013 Pearson Education, Inc. Publishing as Addison-Wesley
8-53
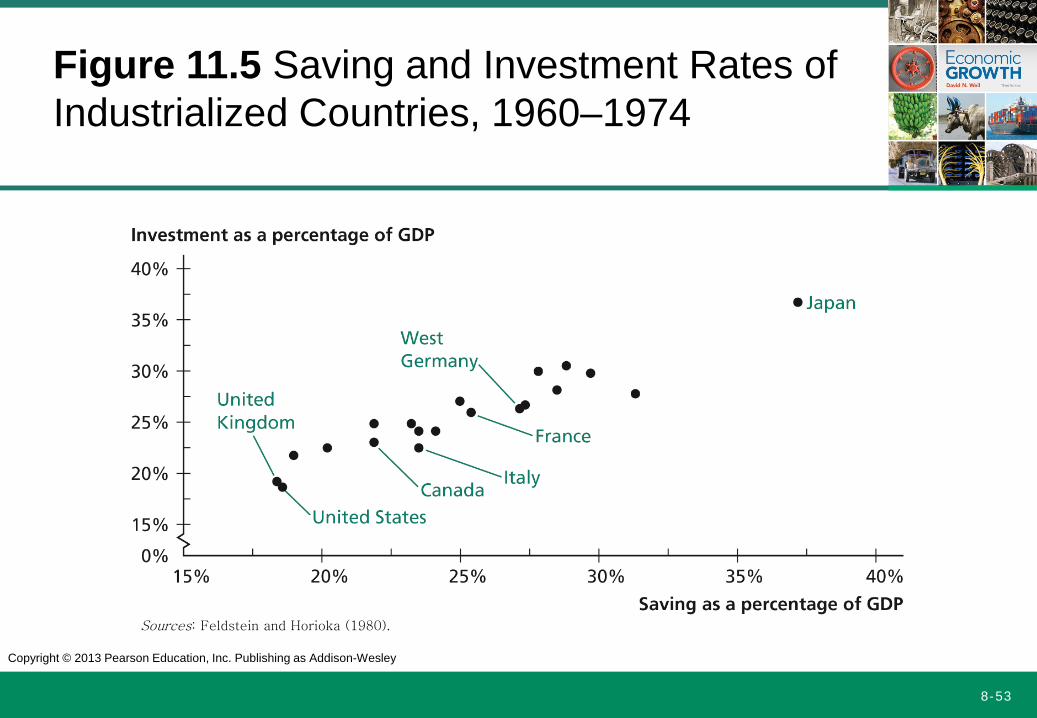
Figure 11.5 Saving and Investment Rates of Industrialized Countries, 1960–1974
Sources: Feldstein and Horioka (1980).
Copyright © 2013 Pearson Education, Inc. Publishing as Addison-Wesley
8-54
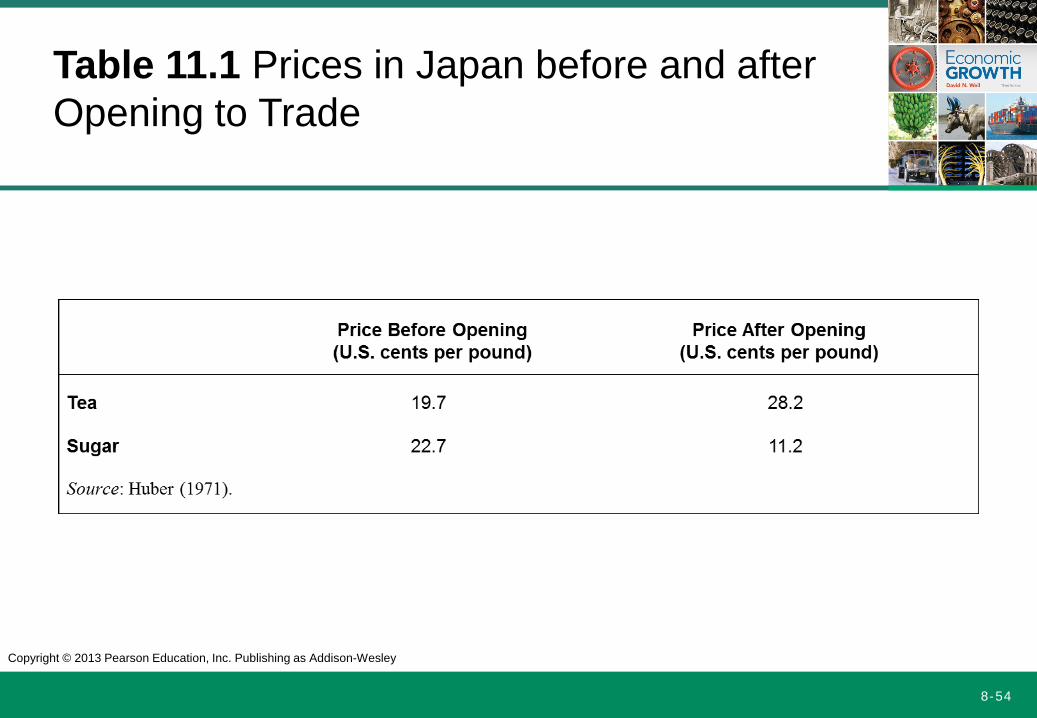
Table 11.1 Prices in Japan before and after Opening to Trade
Copyright © 2013 Pearson Education, Inc. Publishing as Addison-Wesley
8-55
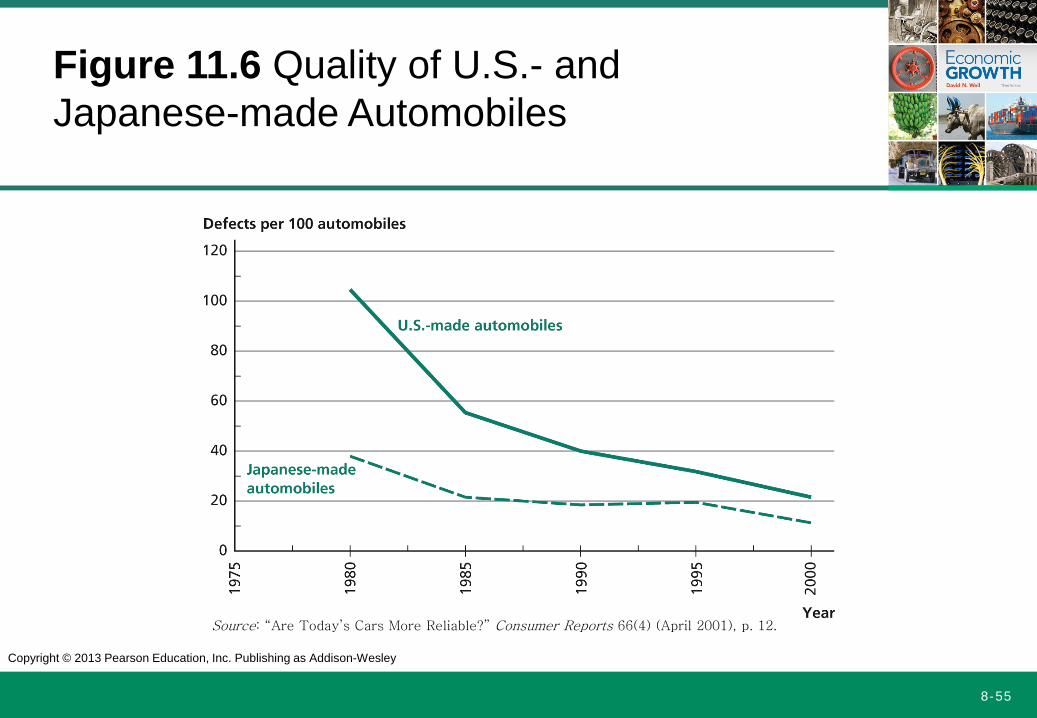
Figure 11.6 Quality of U.S.- and Japanese-made Automobiles
Source: “Are Today’s Cars More Reliable?” Consumer Reports 66(4) (April 2001), p. 12.
Related Documents