Running head: MEASURING PRESCHOOLERS’ GEOMETRY KNOWLEDGE 1 Measuring Preschoolers’ Geometry Knowledge: An IRT Analysis of a Rescaled Measure Ashli-Ann Douglas Erica L. Zippert Bethany Rittle-Johnson Vanderbilt University

Welcome message from author
This document is posted to help you gain knowledge. Please leave a comment to let me know what you think about it! Share it to your friends and learn new things together.
Transcript
Running head: MEASURING PRESCHOOLERS’ GEOMETRY KNOWLEDGE 1
Measuring Preschoolers’ Geometry Knowledge: An IRT Analysis of a Rescaled Measure
Ashli-Ann Douglas
Erica L. Zippert
Bethany Rittle-Johnson
Vanderbilt University

MEASURING PRESCHOOLERS’ GEOMETRY KNOWLEDGE: AN IRT ANALYSIS 2
Abstract
The current study modified and evaluated the validity and reliability of a measure of early
geometry knowledge. Preschoolers (n = 252) were administered geometry items from a measure
of broad math skills along with measures of their spatial, numeracy, and patterning skills. The
geometry items’ psychometric properties including their reliability and validity as a measure of
preschoolers’ geometry knowledge were assessed. Children’s scores on the geometry measure
were correlated with their spatial, numeracy, and patterning skills indicating that the measure has
strong validity. The current study also indicated that the measure is reliable. Thus, the modified
measure which takes about 10 minutes to administer may be used in future research and by
educators to assess children’s developing geometry knowledge.
MEASURING PRESCHOOLERS’ GEOMETRY KNOWLEDGE: AN IRT ANALYSIS 3
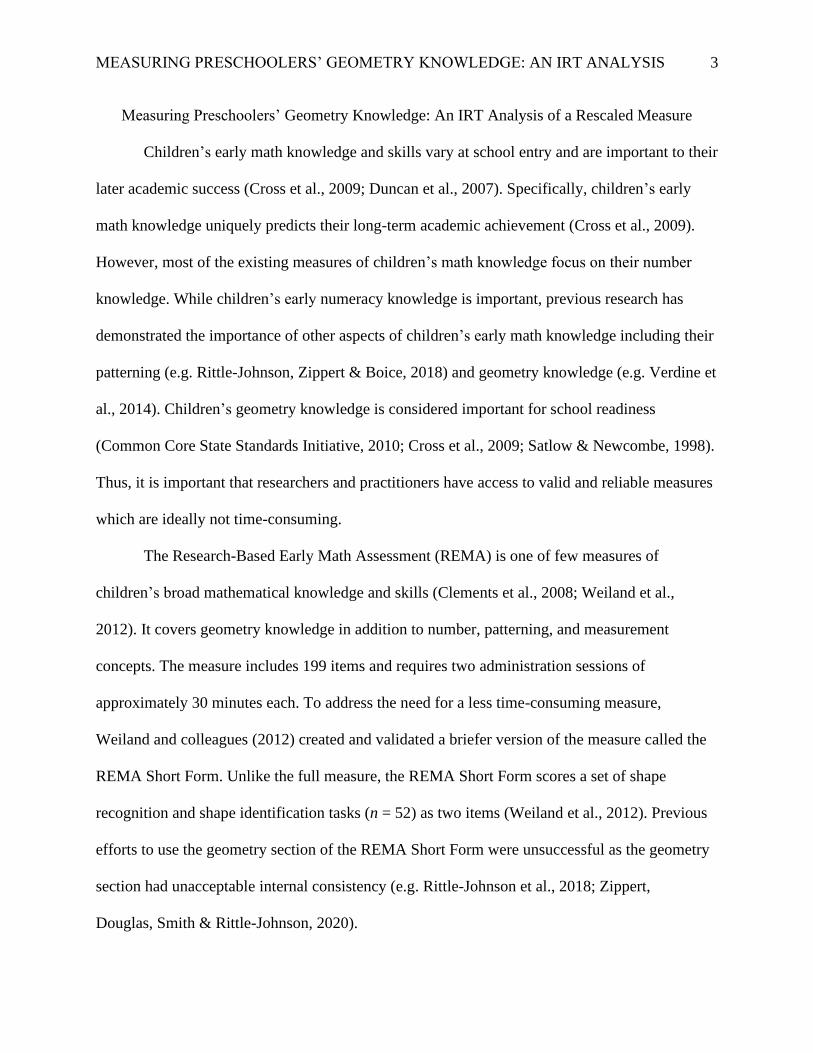
Measuring Preschoolers’ Geometry Knowledge: An IRT Analysis of a Rescaled Measure
Children’s early math knowledge and skills vary at school entry and are important to their
later academic success (Cross et al., 2009; Duncan et al., 2007). Specifically, children’s early
math knowledge uniquely predicts their long-term academic achievement (Cross et al., 2009).
However, most of the existing measures of children’s math knowledge focus on their number
knowledge. While children’s early numeracy knowledge is important, previous research has
demonstrated the importance of other aspects of children’s early math knowledge including their
patterning (e.g. Rittle-Johnson, Zippert & Boice, 2018) and geometry knowledge (e.g. Verdine et
al., 2014). Children’s geometry knowledge is considered important for school readiness
(Common Core State Standards Initiative, 2010; Cross et al., 2009; Satlow & Newcombe, 1998).
Thus, it is important that researchers and practitioners have access to valid and reliable measures
which are ideally not time-consuming.
The Research-Based Early Math Assessment (REMA) is one of few measures of
children’s broad mathematical knowledge and skills (Clements et al., 2008; Weiland et al.,
2012). It covers geometry knowledge in addition to number, patterning, and measurement
concepts. The measure includes 199 items and requires two administration sessions of
approximately 30 minutes each. To address the need for a less time-consuming measure,
Weiland and colleagues (2012) created and validated a briefer version of the measure called the
REMA Short Form. Unlike the full measure, the REMA Short Form scores a set of shape
recognition and shape identification tasks (n = 52) as two items (Weiland et al., 2012). Previous
efforts to use the geometry section of the REMA Short Form were unsuccessful as the geometry
section had unacceptable internal consistency (e.g. Rittle-Johnson et al., 2018; Zippert,
Douglas, Smith & Rittle-Johnson, 2020).
MEASURING PRESCHOOLERS’ GEOMETRY KNOWLEDGE: AN IRT ANALYSIS 4
Objectives
The current study aimed to examine the reliability and validity of the geometry section
of the REMA Short Form as a measure of children’s early geometry knowledge when its shape
recognition and identification tasks are scored dichotomously as individual items.
Perspective(s) or theoretical framework
The current study examines the psychometric properties of a measure of children’s early
geometry knowledge using Item Response Theory (IRT) which holds that latent traits
(unobservable attributes like knowledge) and their manifestations (i.e. observed responses to
items) are related (Hambleton et al., 1991). IRT models allow for the estimation of item
parameters and participants’ latent traits on the same continuum. Thus, they are often
considered more useful in assessing the psychometric properties of measures than classical test
theory models. The study also draws on Clements’ & Sarama’s (2008) theory of learning
trajectories which posits that there is a developmental progression of children’s geometry
knowledge.
Method
Preschoolers (n = 252) were recruited from 12 public and private pre-kindergartens in
a Southeastern state in the US, (M = 4.64 years old, SD= 0.28; 51% boys). They were assessed
individually in a quiet space at their school by a researcher who had experience working with
children.
Materials
Geometry knowledge. Children were administered the REMA Short-Form, including
the 6 geometry items which assessed children’s shape recognition, identification, construction,
and decomposition skills. One shape recognition item required children to indicate whether
twenty-six figures were triangles by placing a chip on top of those that were triangles (n = 6)
MEASURING PRESCHOOLERS’ GEOMETRY KNOWLEDGE: AN IRT ANALYSIS 5
while ignoring easy distractors (other shapes such as ovals, n = 17) and difficult distractors
(figures that resembled triangles but did not have all the geometric properties of triangles such as
not having straight sides or not being completely enclosed, n = 3). The second shape
identification item required children to indicate whether the same twenty-six figures were
rhombuses, with 6 rhombuses, 19 easy distractors, and 1 difficult distractor. A shape
construction item required children to construct a triangle out of straws and children received 1
point for creating a triangle. A side recognition item required children to count and point to the
sides of a quadrilateral and children received 1 point for doing so. The second shape construction
item required children to recognize which shape they would make if they connected four
displayed dots. Finally, a shape decomposition item required children to mentally decompose a
shape by identifying the two shapes that make up a more complex shape. Children received a
point for doing so correctly.
Geometry subscale development. Children’s shape recognition and identification items
were scored differently in the current study than by the developers of the REMA Short Form.
Each figure that children were required to recognize or identify was considered an item in the
current study. Children received a point for recognizing or identifying each figure correctly and
could receive up to 52 points (i.e. up to 26 points for identifying whether 26 figures were
triangles or distractors and up to 26 points for identifying whether 26 figures were rhombuses or
distractors). Ability estimates and item parameters (i.e. discrimination and difficulty) were
generated using Item Response Theory (IRT). Twelve of the 52 items which required children
to indicate whether figures were triangles, rhombuses, or distractors did not discriminate well
between children with high versus low geometry knowledge and so they were removed from the
subscale. Thus, the final subscale reported in further analyses included 44 items (40 shape
recognition and identification, 2 shape construction, 1 side recognition, and 1 shape decomposer
MEASURING PRESCHOOLERS’ GEOMETRY KNOWLEDGE: AN IRT ANALYSIS 6
item). Ability estimates and item parameters were generated again with the remaining 44 items
using a two-parameter IRT model.
Spatial skills.
Form perception. The Position in Space subtest of the Developmental Test of Visual
Perception–Second Edition (Hammill, Pearson, & Voress, 1993) was used to assess children’s
form perception, using the stop criteria specified in the manual. The assessment required
children to identify an image from a set of four or more figures that match a target image on the
right. Children earned a point for each item answered correctly, and according to the manual,
internal consistency is high (Cronbach’s α > .80) for children ages 4 through 10 years.
Spatial visualization. Children’s spatial visualization skills were assessed using the
Block Design subtest of the Wechsler Preschool and Primary Scale of Intelligence–Fourth
Edition (Wechsler, 2012). The assessment includes 17 items which require children to recreate a
structure from a picture or model using red and white colored blocks. The assessment was
administered according to standardized instructions, including stop criteria, and scored
according to the manual. The assessment’s manual reports high internal consistency (α > .80)
for children ages 4 through 7.
Numeracy knowledge. The numeracy subscale of the REMA Short-Form was used to
measure children’s general numeracy knowledge. The subscale includes 12 items which require
children to subitize, count objects, compare magnitudes, do simple arithmetic, and demonstrate
other number skills. IRT ability estimates were generated using a partial credit model.
MEASURING PRESCHOOLERS’ GEOMETRY KNOWLEDGE: AN IRT ANALYSIS 7
Patterning knowledge. A teacher-based patterning measure was used to assess
children’s knowledge about repeating patterns (Rittle-Johnson et al., 2018). Children
were required to complete, copy, extend, and abstract patterns using picture cut-outs.
Ability estimates were generated using a dichotomous Rasch model with a Laplace
approximation.
Results
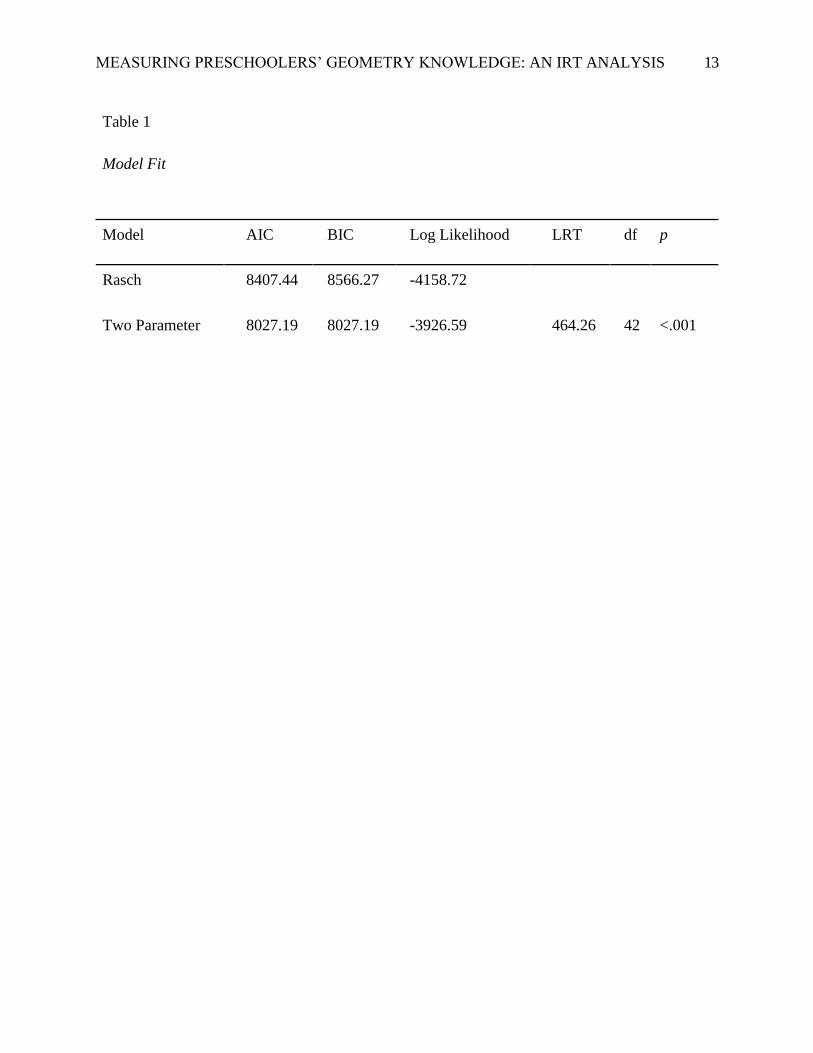
Model Fit. A Likelihood Ratio Test was conducted to compare the fit of a two-parameter
IRT model to the fit of a Rasch model. The results indicate that the data is 464.26 times more
likely under the two-parameter model than under the Rasch model. The hypothesis that the data
is equally likely under the two models was rejected, p < 0.001. Additional measures of model fit
(reported in Table 1) converge with the Likelihood Ratio Test.
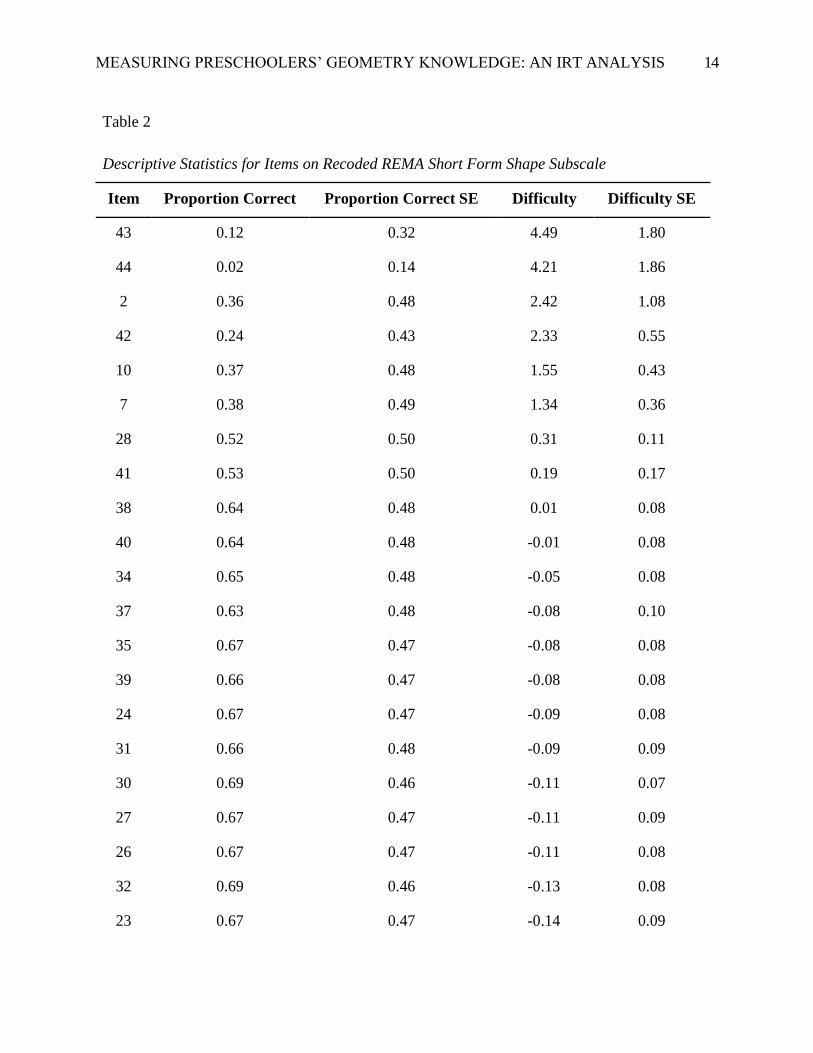
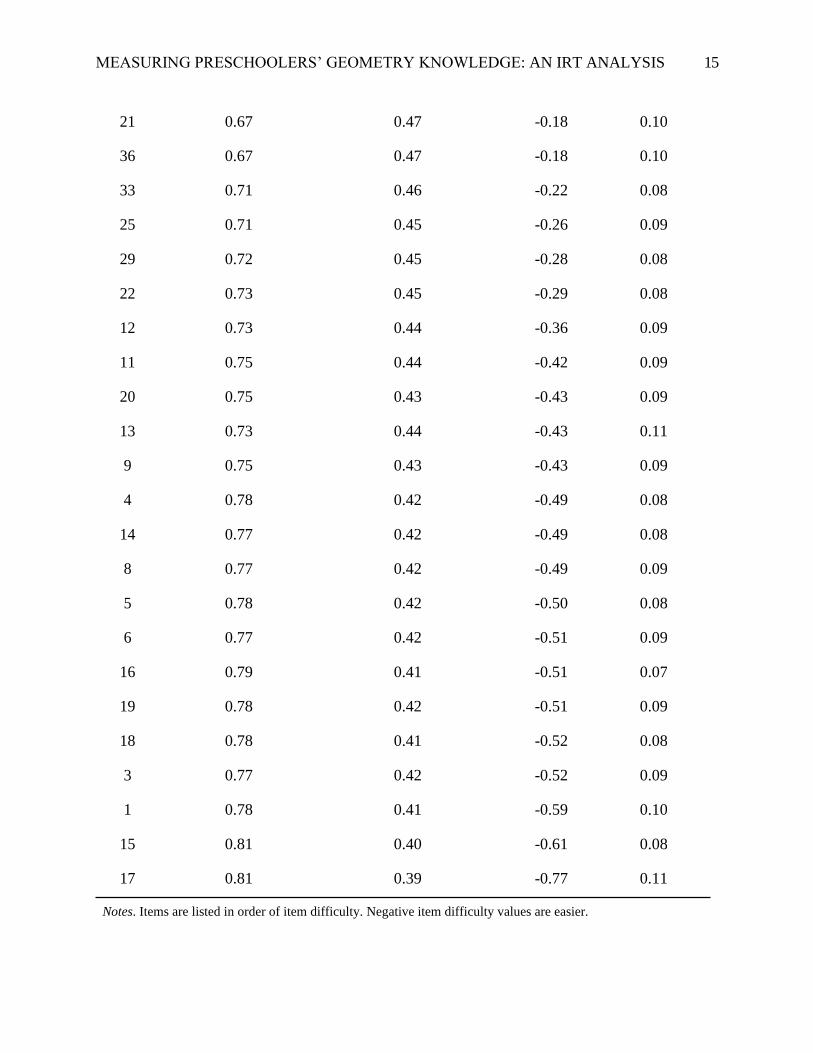
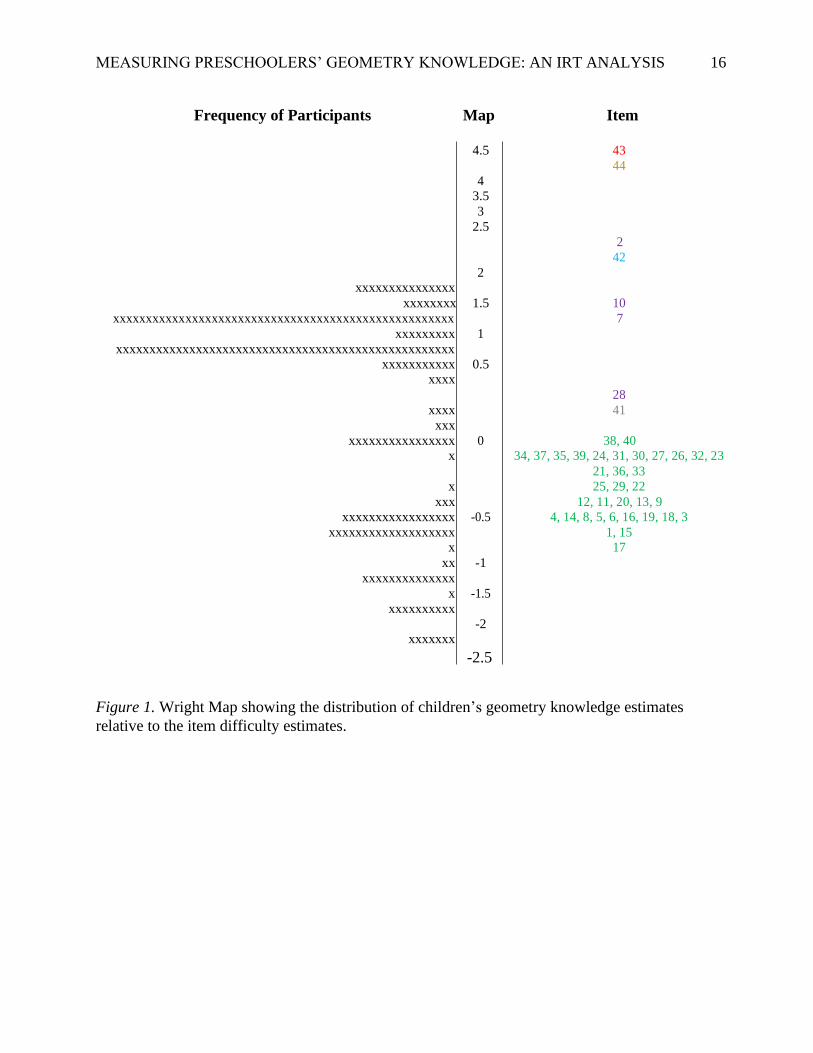
Descriptive Statistics. The geometry items ranged in difficulty as indicated by the
proportion of children who responded to them correctly (ranging from .02 to .81) and the
estimated item difficulty parameters (ranging from 4.49 to -0.77; see Table 2). The easiest items
were recognizing easy distractors (e.g. circles), followed by constructing a triangle, then
recognizing difficult distractors (e.g. identifying that an unenclosed three-sided figure is not a
triangle). The most difficult items were the side recognition, the second shape construction, and
the shape decomposition items. The data suggests that most pre-kindergarteners could not
accurately construct a shape by mentally connecting displayed dots nor decompose a shape
mentally given that less than 15% of children were accurate at each task. Further, a Wright Map
(see Figure 1) indicates that even children with the highest geometry knowledge had less than a
50% likelihood of answering the two items (43 and 44) correctly.
MEASURING PRESCHOOLERS’ GEOMETRY KNOWLEDGE: AN IRT ANALYSIS 8
Reliability. First, an item response theory statistic (separation reliability of
0.91) indicates that the subscale is reliable. Second, a classical item analysis statistic
(Kuder-Richardson Formula 20 = 0.97) offers supporting evidence of the measure’s
reliability.
Validity.
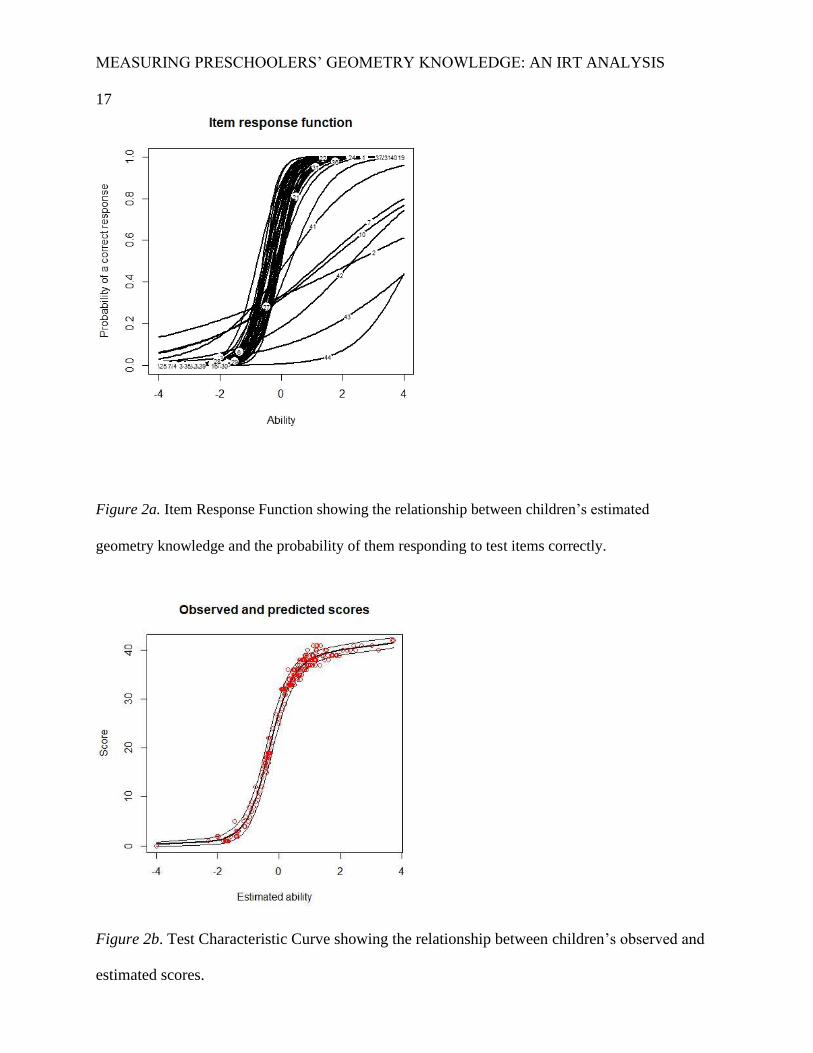
Construct validity. The item response function (IRF) provides evidence that the subscale
has good construct validity. The IRF shows the relationship between children’s estimated
geometry knowledge and the probability of them responding to the test items correctly. The
relationship between participants’ responses and their knowledge estimates were parallel across
most items as indicated by the similarity of most of the functions’ curves (see Figure 2a).
Individuals with lower ability had a lower probability of answering items correctly while
individuals with higher ability had a higher probability of answering items correctly. This was
true even of the most difficult items, though children with the highest geometry knowledge
struggled with these items (as seen by the slightly different curves).
Additionally, the test characteristic curve, which shows the relationship between the level
of each child’s geometry knowledge (estimated score) and their observed score, indicates that
the subscale has good construct validity. Children’s estimated and observed scores map onto
each other well (see Figure 2b) indicating that the test is appropriate for preschool children with
varying levels of geometry knowledge, though the observed test information curve suggests that
the subscale provides slightly more information about children with lower ability than children
with higher abilities. Children’s raw scores and IRT ability estimates were strongly correlated,
r(252) = .96, p < .001.
MEASURING PRESCHOOLERS’ GEOMETRY KNOWLEDGE: AN IRT ANALYSIS 9
Furthermore, the item difficulty estimates map onto the theorized difficulty of the items
well (see Figure 1; Weiland et al., 2012) indicating that the assessment is theoretically valid. A
strong and positive spearman correlation, rs(43) = 1.0, p < .001, provides additional evidence of
the assessment’s validity.
Convergent validity. We tested convergent validity by correlating students’ ability
estimate on the geometry subscale with their scores on two measures of their spatial skills.
Children’s geometry scores were moderately correlated with their form perception, r(142) = .32,
p < .001, and spatial visualization scores, r(76) = .28, p = .02.
Concurrent validity. We tested concurrent validity by correlating students’ scores on the
geometry subscale with their patterning and numeracy scores. Children’s geometry scores were
related to their patterning, r(252) = .32, p < .001, and numeracy, r(252) = .39, p < .001, scores.
Scholarly Significance and Practical Implications
The current study modified the REMA Short Form’s geometry section and evaluated the
psychometric validity and reliability of the modified section for use as an independent subscale.
We used a two-parameter model which had strong model-data fit to produce item difficulty and
geometry knowledge estimates. The item difficulty estimates aligned with existing theory about
shape learning trajectories (Weiland et al., 2012) and our analyses indicate that the subscale is
appropriate for students of differing levels of geometry knowledge. Further, children’s geometry
knowledge estimates were significantly correlated with measures of their spatial, patterning and
numeracy skills, indicating that the modified subscale is a valid measure of their geometry
knowledge. Additionally, our analyses indicate that the modified subscale is a reliable measure.
This is significant given that past efforts to use the geometry section of the REMA Short Form
MEASURING PRESCHOOLERS’ GEOMETRY KNOWLEDGE: AN IRT ANALYSIS 10
using the scoring criteria suggested by the authors have found the geometry section to have poor
reliability (e.g., Rittle-Johnson et al., 2018; Zippert et al., 2020). In sum, the modified geometry
subscale of the REMA Short Form appears to be a psychometrically valid and reliable
assessment of prekindergarten children’s early geometry skills. Thus, researchers and educators
can use the modified geometry subscale of the REMA Short Form as a very quick, reliable, and
valid measure of children’s geometry knowledge. Future work should examine the reliability of
the subscale with kindergarteners.
MEASURING PRESCHOOLERS’ GEOMETRY KNOWLEDGE: AN IRT ANALYSIS 11
References
Clements, D. H., Sarama, J. H., & Liu, X. H. (2008). Development of a measure of early
mathematics achievement using the Rasch model: the Research‐ Based Early Maths
Assessment. Educational Psychology, 28(4), 457–482.
https://doi.org/10.1080/01443410701777272
Clements, D. H., & Sarama, J. (2008). Experimental evaluation of the effects of a research-
based preschool mathematics curriculum. American Educational Research Journal, 45(2),
443-494.
Common Core State Standards. (2010). Washington D.C.: National Governors Association
Center for Best Practices & Council of Chief State School Officers.
Cross, C. T., Woods, T. A., & Schweingruber, H. (2009). Mathematics Learning in
Early Childhood: Paths toward Excellence and Equity. National Academies Press.
Duncan, G. J., Dowsett, C. J., Claessens, A., Magnuson, K., Huston, A. C., Klebanov, P.,
… Japel, C. (2007). School readiness and later achievement. Developmental
Psychology, 43(6), 1428–1446.
http://dx.doi.org.proxy.library.vanderbilt.edu/10.1037/0012-1649.43.6.1428
Hambleton, R. K., & Jones, R. W. (1993). Comparison of classical test theory and item
response theory and their applications to test development. Educational Measurement:
Issues and Practice, 12(3), 3847.
Hammill, D. D., Pearson, N. A., & Voress, J. K. (1993). Developmental test of visual perception
(Second ed.). Austin, TX: Pro-Ed.
MEASURING PRESCHOOLERS’ GEOMETRY KNOWLEDGE: AN IRT ANALYSIS 12
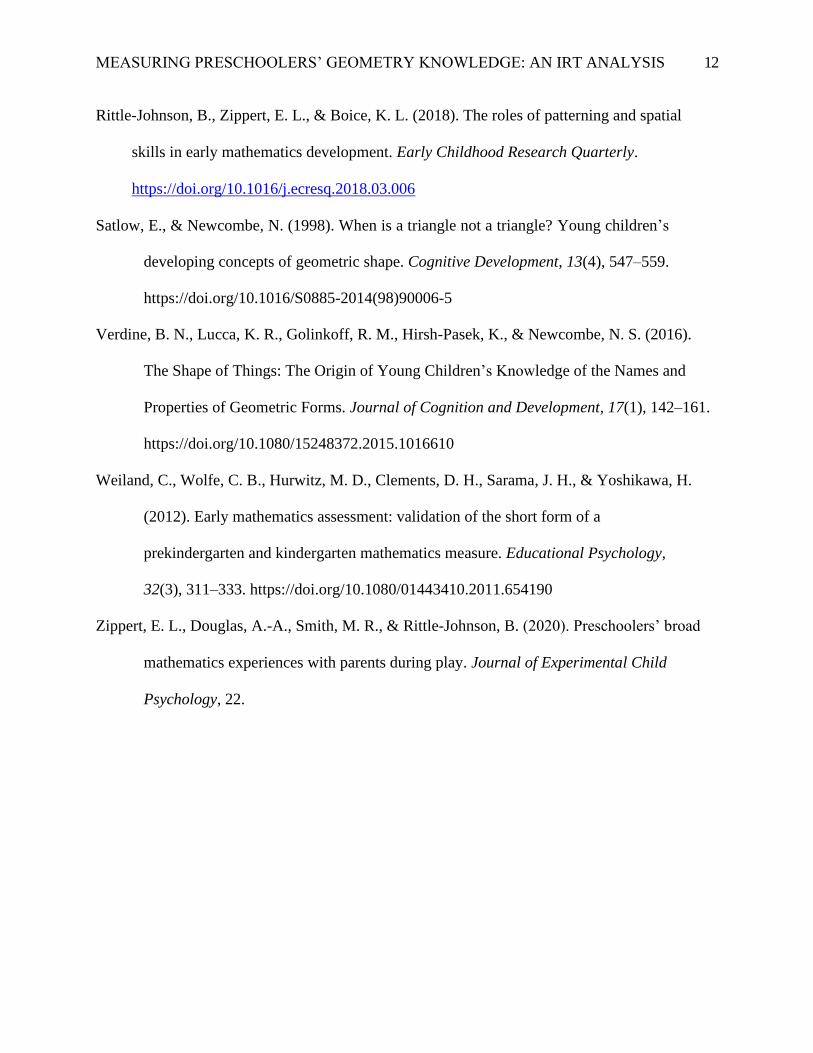
Rittle-Johnson, B., Zippert, E. L., & Boice, K. L. (2018). The roles of patterning and spatial
skills in early mathematics development. Early Childhood Research Quarterly.
https://doi.org/10.1016/j.ecresq.2018.03.006
Satlow, E., & Newcombe, N. (1998). When is a triangle not a triangle? Young children’s
developing concepts of geometric shape. Cognitive Development, 13(4), 547–559.
https://doi.org/10.1016/S0885-2014(98)90006-5
Verdine, B. N., Lucca, K. R., Golinkoff, R. M., Hirsh-Pasek, K., & Newcombe, N. S. (2016).
The Shape of Things: The Origin of Young Children’s Knowledge of the Names and
Properties of Geometric Forms. Journal of Cognition and Development, 17(1), 142–161.
https://doi.org/10.1080/15248372.2015.1016610
Weiland, C., Wolfe, C. B., Hurwitz, M. D., Clements, D. H., Sarama, J. H., & Yoshikawa, H.
(2012). Early mathematics assessment: validation of the short form of a
prekindergarten and kindergarten mathematics measure. Educational Psychology,
32(3), 311–333. https://doi.org/10.1080/01443410.2011.654190
Zippert, E. L., Douglas, A.-A., Smith, M. R., & Rittle-Johnson, B. (2020). Preschoolers’ broad
mathematics experiences with parents during play. Journal of Experimental Child
Psychology, 22.
MEASURING PRESCHOOLERS’ GEOMETRY KNOWLEDGE: AN IRT ANALYSIS 13
Table 1
Model Fit
Model AIC BIC Log Likelihood LRT df p
Rasch 8407.44 8566.27 -4158.72
Two Parameter 8027.19 8027.19 -3926.59 464.26 42 <.001
MEASURING PRESCHOOLERS’ GEOMETRY KNOWLEDGE: AN IRT ANALYSIS 14
Table 2
Descriptive Statistics for Items on Recoded REMA Short Form Shape Subscale
Item Proportion Correct Proportion Correct SE Difficulty Difficulty SE
43 0.12 0.32 4.49 1.80
44 0.02 0.14 4.21 1.86
2 0.36 0.48 2.42 1.08
42 0.24 0.43 2.33 0.55
10 0.37 0.48 1.55 0.43
7 0.38 0.49 1.34 0.36
28 0.52 0.50 0.31 0.11
41 0.53 0.50 0.19 0.17
38 0.64 0.48 0.01 0.08
40 0.64 0.48 -0.01 0.08
34 0.65 0.48 -0.05 0.08
37 0.63 0.48 -0.08 0.10
35 0.67 0.47 -0.08 0.08
39 0.66 0.47 -0.08 0.08
24 0.67 0.47 -0.09 0.08
31 0.66 0.48 -0.09 0.09
30 0.69 0.46 -0.11 0.07
27 0.67 0.47 -0.11 0.09
26 0.67 0.47 -0.11 0.08
32 0.69 0.46 -0.13 0.08
23 0.67 0.47 -0.14 0.09
MEASURING PRESCHOOLERS’ GEOMETRY KNOWLEDGE: AN IRT ANALYSIS 15
21 0.67 0.47 -0.18 0.10
36 0.67 0.47 -0.18 0.10
33 0.71 0.46 -0.22 0.08
25 0.71 0.45 -0.26 0.09
29 0.72 0.45 -0.28 0.08
22 0.73 0.45 -0.29 0.08
12 0.73 0.44 -0.36 0.09
11 0.75 0.44 -0.42 0.09
20 0.75 0.43 -0.43 0.09
13 0.73 0.44 -0.43 0.11
9 0.75 0.43 -0.43 0.09
4 0.78 0.42 -0.49 0.08
14 0.77 0.42 -0.49 0.08
8 0.77 0.42 -0.49 0.09
5 0.78 0.42 -0.50 0.08
6 0.77 0.42 -0.51 0.09
16 0.79 0.41 -0.51 0.07
19 0.78 0.42 -0.51 0.09
18 0.78 0.41 -0.52 0.08
3 0.77 0.42 -0.52 0.09
1 0.78 0.41 -0.59 0.10
15 0.81 0.40 -0.61 0.08
17 0.81 0.39 -0.77 0.11
Notes. Items are listed in order of item difficulty. Negative item difficulty values are easier.
MEASURING PRESCHOOLERS’ GEOMETRY KNOWLEDGE: AN IRT ANALYSIS 16
Frequency of Participants Map Item
4.5 43
44
4
3.5
3
2.5
2
42
2 xxxxxxxxxxxxxxx
xxxxxxxx 1.5 10
xxxxxxxxxxxxxxxxxxxxxxxxxxxxxxxxxxxxxxxxxxxxxxxxxxxx 7
xxxxxxxxx 1
xxxxxxxxxxxxxxxxxxxxxxxxxxxxxxxxxxxxxxxxxxxxxxxxxxx
xxxxxxxxxxx 0.5 xxxx
28
xxxx 41
xxx
xxxxxxxxxxxxxxxx 0 38, 40 x 34, 37, 35, 39, 24, 31, 30, 27, 26, 32, 23
21, 36, 33
x 25, 29, 22
xxx 12, 11, 20, 13, 9
xxxxxxxxxxxxxxxxx -0.5 4, 14, 8, 5, 6, 16, 19, 18, 3
xxxxxxxxxxxxxxxxxxx 1, 15 x 17
xx -1
xxxxxxxxxxxxxx
x -1.5
xxxxxxxxxx
-2 xxxxxxx
-2.5
Figure 1. Wright Map showing the distribution of children’s geometry knowledge estimates
relative to the item difficulty estimates.
MEASURING PRESCHOOLERS’ GEOMETRY KNOWLEDGE: AN IRT ANALYSIS
17
Figure 2a. Item Response Function showing the relationship between children’s estimated
geometry knowledge and the probability of them responding to test items correctly.
Figure 2b. Test Characteristic Curve showing the relationship between children’s observed and
estimated scores.
Related Documents