Munich Personal RePEc Archive Measuring preferential market access Marco Fugazza and Alessandro Nicita Unctad, Geneva 8. September 2011 Online at http://mpra.ub.uni-muenchen.de/38565/ MPRA Paper No. 38565, posted 4. May 2012 12:24 UTC brought to you by CORE View metadata, citation and similar papers at core.ac.uk provided by Munich RePEc Personal Archive

Welcome message from author
This document is posted to help you gain knowledge. Please leave a comment to let me know what you think about it! Share it to your friends and learn new things together.
Transcript
MPRAMunich Personal RePEc Archive
Measuring preferential market access
Marco Fugazza and Alessandro Nicita
Unctad, Geneva
8. September 2011
Online at http://mpra.ub.uni-muenchen.de/38565/MPRA Paper No. 38565, posted 4. May 2012 12:24 UTC
brought to you by COREView metadata, citation and similar papers at core.ac.uk
provided by Munich RePEc Personal Archive
Measuring Preferential Market Access°
Marco Fugazza× and Alessandro Nicita⊗
September 2011
Abstract
One consequence of the proliferation of preferential trade agreements is that an increasing share of international trade is not subject to most favored nation tariffs, but rather enters markets through preferential access. The objective of this paper is to better investigate to what extent preferential market access affects bilateral trade. In doing so, the paper first provides two indices of market access conditions that take into account the complex structure of tariff preferences. One index summarizes direct market access conditions (the overall tariff faced by exports), while the other measures relative market access conditions (the overall tariff faced by exports relative to that faced by foreign competitors). Then, the paper explores the effects of preferential access on international trade by estimating a gravity model augmented by the two indices. The results indicate that both direct and relative market access conditions affect bilateral trade. Although a large majority of countries benefits from the system of preference because of improved direct market access, some countries see part of their benefits eroded, sometimes substantially, by the deterioration in their relative market access conditions. Keywords: Gravity Model; Trade policy; International Trade Flows; Tariffs.
JEL classification: F10, F15
° We wish to thank Richard Baldwin, Cosimo Beverelli, Carol Box, Bernard Hoekman, Hiau Looi Kee and Marcelo Olarreaga for helpful comments and discussion. The authors are also grateful to two referees for comments that have greatly improved the paper. We also would like to thank seminar participants at UNCTAD, the World Bank, and the WTO for their comments. The authors accept sole responsibility for any errors remaining. The views expressed in this paper are those of the authors and do not necessarily represent the views of the United Nations Conference on Trade and Development (UNCTAD) Secretariat or of UNCTAD Members. × UNCTAD ‐ Division of International Trade and Commodities. Email: [email protected]. ⊗ Corresponding author. UNCTAD ‐ Division of International Trade and Commodities. Palais des Nations CH‐1211 Geneva 10, Switzerland. Email: [email protected]. Tel: +41‐229175685
1
1. Introduction
Over the past thirty years, trade liberalization has been used as an effective
development tool, based on the evidence that there are many benefits that a country can
gain from more active participation in world trade. While tariff liberalization was
initially pursued through trade agreements under the auspices of the World Trade
Organization (WTO), preferential trade agreements (PTAs)1 are the basis of the more
recent trade liberalization process. The proliferation of PTAs in the recent past has been
impressive. In 1994, at the launch of the WTO, only 37 such agreements were in place.
By 2010 more than 230 of them had been implemented, with more in the
implementation stage. Participation in regional and bilateral trade agreements is
widespread, as virtually all members of the WTO participate in one or more PTAs.
There are two key reasons for the proliferation of preferential trade. The first
relates to the sluggish pace of multilateral trade liberalization since the conclusion of the
Uruguay round (Bagwati, 2008). The second has to do with the domino effect (Baldwin
and Jaimovich, 2010): once a preferential agreement is formed, trade becomes relatively
more costly for non‐member countries, and this provides incentives to join an existing
agreement or to form new ones. A consequence of the increasing number of PTAs is
that a rising share of international trade enters markets through preferential access.2
This has implications for international trade because preferential access promotes trade
by reducing tariffs among member countries. Therefore, preferential access is
essentially a discriminatory practice that may divert trade from non‐members to
member countries.
1 By PTA we refer to all types of preferential trade agreements. 2 Although about 40 percent of world trade is free under most‐favored nation (MFN) regimes, an additional 30 percent is exempted from tariffs because of preferential access.
2
Since the seminal work of Viner (1950), the economic profession has extensively
studied the effects of PTAs on international trade. Initially, the literature focused on the
effects of PTAs both for member and non‐member countries from a theoretical
standpoint (e.g. Kemp and Wan, 1976; Grossman and Helpman, 1995; Krishna, 1998;
Ornelas, 2005). More recently, an increasing number of empirical studies has
investigated the actual effects of PTAs on trade.3 While this literature generally agrees
in finding large and positive effects of PTAs on trade flows among members4 (e.g. Baier
and Bergstrand, 2007 and 2009; Magee, 2008) there is not conclusive evidence in regard
to the effects on non‐member countries. For example, Clausing (2001) and Calvo‐Pardo,
Freund and Ornelas (2009) find trade creation but no trade diversion effects with regard
to the US‐Canada FTA and the ASEAN regional trade agreement. Similarly, Freund
(2010) does not find evidence of trade diversion effects in the analysis of six trade
agreements in Latin America and Europe. On the other hand, a number of studies find
both trade creation and trade diversion effects. For example, Trefler (2004) finds trade
diversion effects resulting from the US‐Canada FTA and Romalis (2007) finds trade
diverting effects in regard to the North American FTA. Similarly, Carrère (2006) finds
trade diversion when examining the effects of seven regional trade agreements and Lee
and Shin (2006) find trade diversion depending upon certain characteristics of member
countries in the analysis of East Asian free trade agreements.
Most of the literature has generally examined the overall impact of PTAs as a
discrete event rather than focusing on tariff liberalization.5 Although quite informative,
this approach captures not only tariff changes but also any other advantage that PTAs
3 Freund and Ornelas (2010) provide a thorough review of the literature related to PTAs. 4 One dissenting study is Ghosh and Yamarik (2004). In their analysis of 12 regional trade agreements, they are skeptical about the results of the previous literature showing positive trade creation effects. The use of fixed‐effect estimation in the subsequent literature has somewhat alleviated their criticism. 5 One exception is a study by Robertson and Estevadeordal (2009). Their findings suggest that the tariff liberalization of Latin American countries between 1985 and 1997 caused trade‐diverting effects.
3

usually imply, such as customs harmonization, trade facilitation mechanisms, and
overall reductions in non‐tariff measures and other trade costs. This paper adds to the
existing literature by isolating the effect of tariff preferences so as to better capture the
heterogeneity of trade effects for member and non‐member countries. More precisely,
this paper provides two contributions. The first contribution consists of two indices
measuring market access conditions taking into account the complex structure of tariff
preferences. One index summarizes the tariffs faced by exports and is related to the
work on trade restrictiveness (Anderson and Neary, 2005; Kee, Nicita and Olarreaga,
2008 and 2009). The other index measures the relative tariff advantage or disadvantage
that the tariffs provide vis‐à‐vis foreign competitors. This index builds on the work on
preferential margins (Low, Piermartini and Richtering, 2009; Carrère, de Melo and
Tumurchudur, 2010; and Hoekman and Nicita, 2011). The second contribution of this
paper consists of an analysis of whether bilateral trade depends not only on direct
market access conditions, but also on the market access conditions applied to third
countries. The analysis is based on a gravity model augmented by the two indices.
The findings of this paper indicate that direct market access conditions have
generally improved during the period of analysis (2000‐2009) and that relative market
access conditions have evolved from a situation where few bilateral trade relationships
enjoyed large preferential margins to a situation where the system of preference is
beneficial to a larger number of bilateral trade relationships but is less discriminatory
(i.e. resulting in a lower relative preferential margin). In terms of magnitude, the results
indicate that direct market access conditions are of primary importance in stimulating
trade. However, relative market access conditions also have a significant impact. The
greater the relative advantage provided by the system of preferences the larger bilateral
trade flows are found to be. The results also find that although a large majority of
countries benefits from the overall system of preferences, some countries see part of
4

their benefits eroded, sometimes substantially, by the deterioration in their relative
market access conditions.
The remainder of this paper is organized as follows. The next section illustrates
the empirical approach for assessing the impact of preferential access on trade flows.
Section 3 briefly summarizes the data. Section 4 provides some statistics on market
access measures and discusses their impact on trade flows. Section 5 concludes.
2. Market access and trade flows
In the last decade, market access conditions have increasingly been affected by
bilateral trade agreements. Trade agreements generally provide trading partners with
lower tariffs. As a result, countries apply different tariff rates to the same product
depending on its origin. As of 2009, in about 40 percent of international trade there is no
discrimination, as each given country applies the same tariff to all trading partners (at
the HS 6‐digit level). About 30 percent of trade is in products where two different tariff
rates are applied. The remaining 30 percent of trade consists of products where
countries apply three or more different tariff rates.
The fact that countries apply different tariff rates to identical products depending
on their origin has importance for exporters. From an exporterʹs perspective, market
access depends not only on the disadvantages that exporters face versus domestic
producers, but also on the relative advantages or disadvantages that exporters have
versus competitors from other countries. In tariff terms, the disadvantage versus
domestic competitors is simply given by the tariff applied to the specific good, while the
advantage or disadvantage versus foreign competitors is given by the preferential
margin. In practice, the preferential margin provides a measure of the strength of
5

preferential access. The higher the preferential margin, the larger is the advantage of a
given country’s exporters versus foreign competitors.
Preferential access is primarily granted with the intent to increase trade. For
example, high income countries often grant non‐reciprocal preferential access to least
developed countries in order to facilitate the latterʹs economic growth by providing an
incentive to their exports. Likewise, regional trade agreements are a common form of
reciprocal preferential access in which lower (or zero) tariffs are applied to products
originating among members, so as to foster bilateral or regional cooperation.
Agreements as such, by providing some trading partners with a lower tariff, inevitably
discriminate against those trading partners outside the trade agreement (Hoekman,
Martin and Primo Braga, 2009).
Preferential access produces diverse effects across members depending on
differences in the existing tariff regimes, implementation periods and tailored
exceptions. For example, some trade agreements may give great advantages because of
high external tariffs; while others may have more muted effects because preferential
treatment is granted to a large number of countries. Similarly, the effect of preferential
access also varies across non‐member countries. The differences largely depend on
whether key export sectors are affected by preferences conceded to foreign
competitors.6
The following two sections illustrate the empirical approach to measure the effect
of market access on trade flows. The first section presents the two indices measuring
market access conditions. One index summarizes the tariffs faced by exports; the other
index measures the preferential margin at the bilateral level. The second section lays
6 This issue also relates to preference erosion: countries who enjoy preferential access because of pre‐existing agreements see their preferential margin eroded when key trading partners enter new PTAs.
6
down the estimating framework utilized in assessing the contribution of the two indices
to explain bilateral trade flows.
2.1 Market Access
To measure market access conditions we provide two trade policy variables: the
first measure captures direct market access conditions (the overall tariff faced by
exports), the second measure captures relative market access conditions (the overall
tariff faced by exports relative to that faced by foreign competitors). Both measures are
calculated at the bilateral level.
The first measure derives from Anderson and Neary’s (1994 and 2003)
mercantilist trade restrictiveness index (MTRI) and is directly related to the partial
equilibrium simplification developed by Feenstra (1995) and implemented as the overall
tariff restrictiveness index (OTRI) in the work of Kee, Nicita and Olarreaga (2008 and
2009).7 This index provides the uniform tariff rate that yields the same level of imports
as the differentiated structure of restrictions. In this paper, the measure capturing direct
market access conditions, although methodologically identical to the OTRI, is labeled
tariff trade restrictiveness index (TTRI) to account for its more limited trade policy
coverage (i.e. only tariffs). In the construction of these indices, the aggregation across
products takes into account the fact that the imports of some goods may be more
responsive than others to a change in tariffs. Intuitively, products where imports are
less sensitive to prices (inelastic) should be given less weight because preferential access
7 The authors show (following Feenstra, 1995) that the calculation of the MTRI can be greatly simplified in a partial equilibrium setting so as to take into account only own price effects, while ignoring cross price effects on import demand. In doing so, the OTRI can be calculated as a weighted average of the levels of protection (tariff and non‐tariff measures) across products where the weights are functions of import shares and import demand elasticities.
7

(a lower tariff) would have a lesser effect on the overall volumes of trade. In formal
terms, the TTRI faced by country j in exporting to country k is:
∑∑
=
hshsjkhsjk
hsjkhs
hsjkhsjk
jk
TTTRI
,,
,,,
ε
ε
x
x (1)
where x indicates exports from country j to country k at the product level, ε is the
bilateral import demand elasticity, T is the applied tariff, and hs are HS 6‐digit
categories. This index provides the equivalent uniform tariff that will maintain the
exports from country j to country k constant. 8
The variable measuring the effect of the system of preferences relative to foreign
competitors is provided by the second index, which we label relative preferential
margin (RPM). The RPM builds on the arguments of Low, Piermartini and Richtering
(2009); Carrère, de Melo and Tumurchudur (2010); and Hoekman and Nicita (2011).
These studies recognize that the commonly used measure of preference margins (the
difference between the preferential tariff and the MFN rate) generally overestimates the
actual benefits of preferences. Given the increase in the number of PTAs, a better
measure of the preferential margin is one where the counterfactual is not the MFN
tariff, but the preferential access provided to other foreign competitors. In practice, a
proper measure of preferential margin should allow for the fact that preferential rates
8 To illustrate this, consider that the fall in the value of export of country j to country k of a specific product hs due to the bilateral tariff is given by: . Summing over products to compute the
overall trade loss due to tariffs leads to:
jkT jkjkjk Tεx
∑hs
hsjkhsjkhsjk T ,,, εx . Similarly, the trade loss from a uniform
tariff across products is . Finally, setting these two expressions equal and solving
for the TTRI results in equation (1).
∑hs
jkhsjkhsjk TTRI,, εx
8

granted to a particular country, although lower than MFN, could still penalize it
relative to other countries that benefit from even lower or zero tariffs. To allow for this,
the RPM is calculated as the difference, in tariff percentage points, that a determined
basket of goods faces when imported from a given country relative to being imported
from any other.9
There are two sets of weights when calculating the RPM. First, the counterfactual
(the tariff faced by foreign competitors) is a weighted average of the tariffs imposed on
all other trading partners. Second, the overall tariff imposed on each exporter is a
weighted average comprising the tariffs of many products. To calculate the
counterfactual, the first step is to calculate the trade weighted average tariff at the tariff
line level that one country (e. g. the USA) imposes on all other countries except the
country for which the preferential margin is calculated (e. g. Mexico). This is done by
using (USA) bilateral imports as weights, so as to take into account the supply capacity
of (USA) trading partners. The second step is to aggregate across products. This is done
by using (Mexico) exports (to the USA) so as to take into consideration the different
product compositions across partners. As in the TTRI case, a further complication
relates to demand responses to changes in the tariffs.10 This issue can be correct by
using import demand elasticites in aggregating across products.
In more formal terms, the RPM measuring the advantage that country j has in
exporting its goods to country k can be calculated as:
9 To clarify with an example, in the RPM of Mexico vis‐à‐vis the USA, the counterfactual is the average tariff for Mexico’s export bundle to the USA if this bundle were to originate from other countries. The relative preferential margin is the difference between the counterfactual and the bilateral trade‐weighted preferential tariff imposed by the USA on Mexico. 10 When aggregating across product lines, the overall relative preferential margin should be higher if the exporting country has a higher preferential margin in products for which demand is more elastic to small changes in prices.
9

kjTT
RPM
hshsjkhsjk
hsjkhs
hswkhsjkhsjk
jk ≠−
=∑
∑,
)(
,,
,,,,
ε
ε
x
x, with jv
TT
vhsvk
vhsvkhsvk
hswk ≠=∑
∑,
,
,,
, x
x(2)
where notation is as above and v denotes countries competing with country j in
exporting to country k, so that the term , is the trade weighted average of the tariffs
applied by country k to imports originating from each country v (for each HS 6‐digit
product).
hswkT ,
Note that any measure of preference margin could be positive or negative,
depending on the advantage or disadvantage of the country with respect to other
competing exporters. The RPM varies between the negative of the TTRI (maximum
negative bias, i.e. being the only trading partner facing tariffs when all other exporters
enjoy duty free access) and the MFN tariff rate (maximum positive bias, i.e. being the
only trading partner enjoying duty free access while all other exporters face MFN
tariffs). RPM is exactly zero when there is no discrimination (i.e. the importing country
applies identical tariffs across all existing trading partners).11 In summary, the RPM
provides a measure of the tariff advantage (or disadvantage) provided to the actual
exports from country j to country k, given the structure of the tariff preferences of
country k. As the RPM provides the relative advantage not with respect to the average,
but to each trading partner, it also captures the discriminatory effects of the overall
system of preferences.
11 Note that at the product level and in a three‐country setting (one importer and two exporters) the sum of the bilateral RPMs across countries is zero (i.e. the advantage of one exporter is equal to the disadvantage of the other exporter). As the RPM is relative to all other exporters, this property is lost when allowing for more than two exporters. Still, this is a valuable property as the RPM could be used to provide some insight on the extent of trade diversion at the product level, not bilaterally, but between a given country and all other countries lumped together.
10
Although the TTRI and RPM represent an improvement over other aggregate
indicators of trade policy, these two indices are still imperfect measures of direct and
relative market access. As all other trade weighted measures, both the TTRI and RPM
depend not only on trade policy but also on trade values. In terms of dynamics,
weighted indicators improve when trade shifts towards products that are less
restrictive. For example, the TTRI declines when the export mix of a country shifts
towards products that face a lower tariff. Similarly, RPM increases when the export mix
shifts toward products where the preferential margin is higher. Although the use of
import demand elasticities softens the endogeneity problem of trade to tariff, a related
problem is that both indices consider only the positive value of imports, and thus they
do not take into account prohibitive tariffs. These problems result in a systematic
underestimation of the effect of tariffs which could be corrected by setting the weights
in the indices at trade levels that would arise in a tariff‐free world. As this is not
possible because these levels are not observable, the issue can nevertheless be softened
by keeping trade weights fixed over time in order to correct for some of the
endogeneity. This is the approach we follow in the econometric estimation.
Limitations are also related to the comprehensiveness of the indices, which is a
trade‐off for their computational simplicity. In particular, these indices only take into
account the direct own price effects of tariffs and ignore the general equilibrium of cross
price effects. Thus, the indices are primarily suited to estimate the first order impacts of
market access conditions on trade. Finally, these indices are calculated only with respect
to tariffs and do not take into account any restrictive effects of non‐tariff barriers (e.g.
quotas, administered pricing, contingent protection measures, standards, etc.).
An important point is related to the interpretation of these indices. While the
TTRI has the simple economic interpretation discussed above, the RPM has a more
empirical interpretation. The RPM is a measure of the advantage provided by the
11

preferential access relative to other foreign competitors. In practice, the scope for the
RPM is primarily to build a more reliable measure for the bias in the structure of
preferences in order to allow for differences in terms of market access both across PTAs
and for different members within the same PTA. For example, PTAs with higher
external tariffs would provide a greater advantage (and thus result in a larger RPM)
than those with lower external tariffs. Similarly, some PTAs may provide relatively
fewer advantages when members already grant preferential treatment to a large
number of countries. Finally, the effects would be lower for members exporting mainly
products where the external tariffs (or elasticities) are low than for members whose
export baskets are concentrated in highly protected products. All these factors are
reflected in the RPM.
2.2 Estimating the effect of preferences on trade flows
The standard approach to measure the impact of policy variables on trade flows
is the gravity model. This model relates bilateral trade to economic sizes and to trade
and transaction costs often proxied by variables such as distance, common language,
shared border, etc.12 In such a setup, the effect of trade agreements is often estimated by
including dummy variables for the presence of policy factors affecting trade. Although
the econometric estimation of this paper follows that of the recent literature on gravity
models, the approach in identifying the effect of trade liberalization is different. The
difference is in the fact that the analysis is not based on discrete events (i.e. the effects
resulting from the implementation of a PTA). Rather, the analysis examines market
access conditions in terms of tariff changes, whether they are caused by PTAs or not.
12 Linder, 1961; Linnemann, 1966; Anderson and van Wincoop, 2003.
12
In summary, the estimating framework consists of a panel gravity model where a
set of fixed effects controls for all the determinants of trade flows normally included in
gravity model specifications, while the impact of PTAs is measured solely on the basis
of its effect on preferential tariffs. To capture the effect of changes in preferential tariffs,
the estimation includes the two trade policy variables discussed above: the TTRI which
measures the direct effect of the preferential tariff on trade, and the RPM which
measures the effect of the preferential tariff taking into account the overall tariff
structure. By including the RPM in the estimation we examine whether the effect of the
change in tariffs is stronger the greater the advantage it provides relative to other
competitors. In practice, one should expect a negative sign for the TTRI coefficient, as a
lower tariff would promote trade, and a positive sign for the RPM coefficient, as a
relatively higher preferential margin would provide an additional advantage.
An issue related to the estimation of the gravity model is that the inclusion of
gravity type variables alone does not take into account all the factors impeding bilateral
trade flows. Well‐specified gravity models consider not only frictions between pairs of
countries, but also frictions relative to the rest of the world. In particular, one needs to
control for multilateral resistance: the presence of the unobserved relative trade
impediments that a country has with all its trading partners (Anderson and van
Wincoop, 2003). In a panel setting, multilateral price terms are likely to be time varying
and therefore it is necessary to estimate the model by using country‐time fixed effects.
Moreover, country‐time fixed effects also capture any importer (and exporter) specific
effects of the tariff regime.
Trade models dealing with policy variables often suffer from a problem of
endogeneity. That is, countries choose to enter trade agreements (and thus reduce the
tariffs) with partners where trade flows are larger. In cross‐section models such
13

endogeneity is generally treated with the use of instrumental variables. However,
instrumental variable estimation may not be fully satisfactory for treating policy
variables because endogeneity bias may result from unobserved time‐invariant
heterogeneity (Baier and Bergstrand, 2004). In a panel setting, such endogeneity bias is
treated by adding country‐pair fixed effects (Baier and Bergstrand, 2007). Besides
controlling for gravity type variables such as distance and shared border, country‐pair
fixed effects control for any unobserved variable simultaneously affecting the change in
the tariff and the level of trade.
In summary, the estimation of the effect on trade from changes in market access
conditions is based on a gravity model according to the following specification:
jktkjktjtjktjktjkt RPMTTRIX φθψωβββ +++++++= 210 )1ln(ln (3)
where the subscript j denotes exporters, k denotes importers and t denotes year; and
where X is the value of total exports from country j to country k, TTRI is the tariff trade
restrictiveness index as in equation (1), RPM is the real preferential margin as in
equation (2); is the importer‐time fixed effects, is the exporter‐time fixed effects,
is the importer‐exporter pair fixed effects and
jtω ktψ
kjθ jktφ is an i.i.d error term with mean
zero and variance λ .13
An issue to consider in gravity models is the presence of zero trade flows. As the
gravity model is generally estimated in a log‐normal specification, it will discard
observations where there is no trade. Recent procedures to take into account zero trade
flows are the Poisson estimation (Santos Silva and Tenreyo, 2006), or a two‐stage
13 Note that country‐pair dummies also soak up any variance due to the presence of time invariant preferential trade agreements.
14

estimation procedure (Helpman, Melitz and Rubinstein, 2008; Burger van Oort and
Linders, 2009). Our estimation procedure does not control for the presence of zeros for
two reasons. The first reason is that, our main variables of interest, the RPM and the
TTRI, utilize trade values (at the HS 6‐digit level) as weight. Thus, these variables
cannot be properly computed when all bilateral trade is zero. Second, the incidence of
zero trade observations remains relatively limited in our sample. The matrix of bilateral
trade has about 26 percent of zero‐trade observations. However, country‐pair fixed
effects control for inexistent bilateral trade across all periods (about 5 percent) related to
cases of small and distant countries (Frankel, 1997; Rauch, 1999), and importer‐year
fixed effects control for lack of data for given country‐year periods (about 4 percent).
This leaves about 17 percent of observations where zero trade flows are not controlled
for.
A final issue in estimating equation (3) resides with the standard errors of the
coefficients of interests 1β and 2β . These standard errors have to take into account the
fact that the elasticities used in the construction of the indices are also estimates.
Therefore, to compute the correct standard errors we apply the following bootstrap
procedure. First, for each HS 6‐digit product and country we randomly draw one
from its normal distribution. Second, we calculate both indices using the random draw
of and we pair these indices with a random sample from the dataset used to
estimate equation (3). All draws are with repetition. Third, we estimate equation (3) on
the constructed random sample. We perform this procedure 100 times. Finally, we
calculate the bootstrapped standard errors of the coefficients for the TTRI and RPM as
the standard deviations of their 100 respective coefficients. Note that this procedure also
allows calculating the standard error of both indices by simply using the 100 standard
deviations of the indices themselves.
hsjk ,ε
hsjk ,ε
15

2.3 The RPM and the theoretically based gravity model
The empirical framework discussed above can be reconciled with the
theoretically based gravity model as follows. In the standard Dixit‐Stiglitz‐Krugman
model, country kʹ s import from country j is given by:
⎟⎟⎠
⎞⎜⎜⎝
⎛
Ω= −
−σ
στ 11
kj
kjjkjk P
EYX (4)
where τ reflects trade costs, Y denotes output, is the destination nation’s
expenditure on tradable goods,
E
σ is the elasticity of substitution (σ >1) among all
varieties from all nations (varieties are usually assumed to be symmetric for simplicity),
is country kʹs ideal CES price index (all goods are assumed to be traded) and, P Ω
measures the real market potential of country jʹ s exports.14
Trade costs can be redefined as jkjkjk ft=τ where is the tariff component of
trade costs and incorporates other trade costs such as freight costs, the latter being
mostly a function of geographical features. This definition of trade costs makes the price
index prevailing in the destination country an explicit function of tariffs applied to
varieties coming from different exporting countries. The properties of the price index do
not allow separating tariffs from other components of the various landed price. This
means that it is not possible to derive the RPM index from the standard Dixit‐Stiglitz‐
jkt
jkf
14 and are given respectively by kP jΩ ( )( )∑=
−−=N
iikik pnP
1
11
1 σσ and ∑=
−−
⎟⎟⎠
⎞⎜⎜⎝
⎛=Ω
N
i i
ijij P
E1
11
σστ , where
is the landed price in nation k of goods produced in country i and is the number of varieties exported from country i. The landed price is made of the producer price in the country of origin augmented by trade costs that are destination specific and take the standard iceberg form.
ikp
in
16
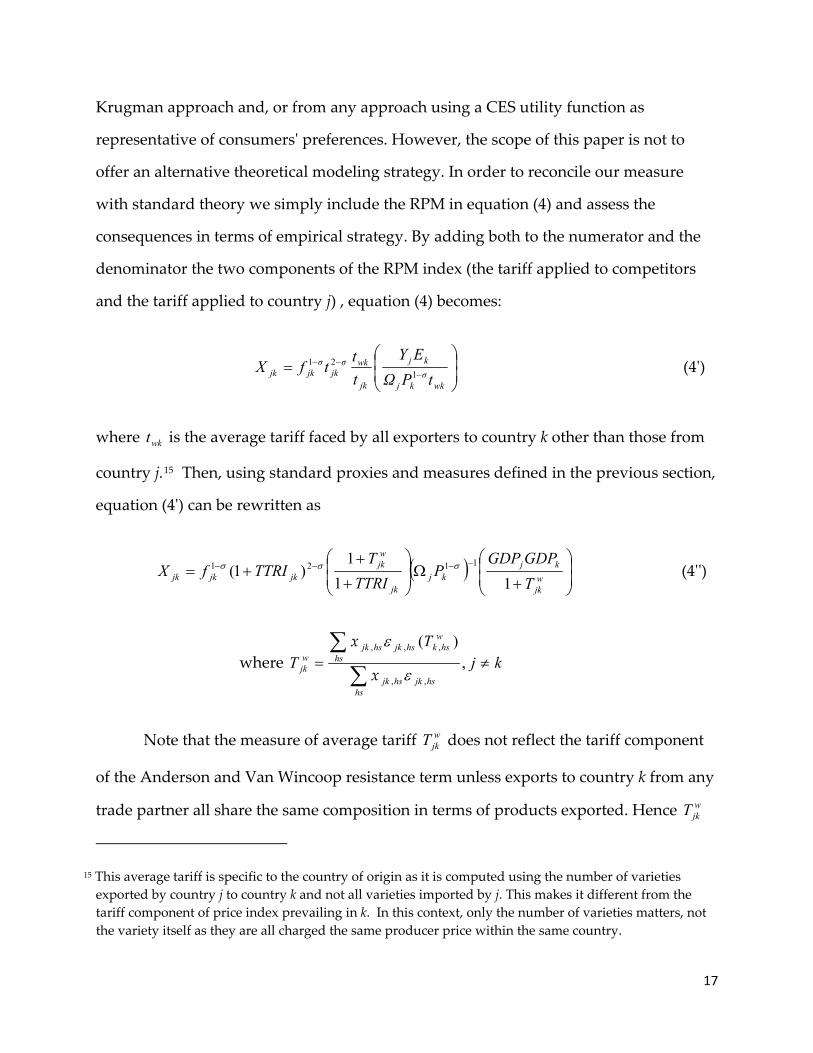
Krugman approach and, or from any approach using a CES utility function as
representative of consumersʹ preferences. However, the scope of this paper is not to
offer an alternative theoretical modeling strategy. In order to reconcile our measure
with standard theory we simply include the RPM in equation (4) and assess the
consequences in terms of empirical strategy. By adding both to the numerator and the
denominator the two components of the RPM index (the tariff applied to competitors
and the tariff applied to country j) , equation (4) becomes:
⎟⎟⎠
⎞⎜⎜⎝
⎛= −
−−
wkσ
kj
kj
jk
wkσjk
σjkjk tPΩ
EYtt
tfX 121 (4ʹ)
where is the average tariff faced by all exporters to country k other than those from
country j.
wkt
15 Then, using standard proxies and measures defined in the previous section,
equation (4ʹ) can be rewritten as
( ) ⎟⎟⎠
⎞⎜⎜⎝
⎛
+Ω⎟
⎟⎠
⎞⎜⎜⎝
⎛
+
++=
−−−−wjk
kjkj
jk
wjk
jkjkjk TGDPGDP
PTTRIT
TTRIfX11
1)1( 1121 σσσ (4ʹʹ)
where kjT
T
hshsjkhsjk
hs
whskhsjkhsjk
wjk ≠=
∑∑
,)(
,,
,,,
ε
ε
x
x
Note that the measure of average tariff does not reflect the tariff component
of the Anderson and Van Wincoop resistance term unless exports to country k from any
trade partner all share the same composition in terms of products exported. Hence
wjkT
wjkT
15 This average tariff is specific to the country of origin as it is computed using the number of varieties exported by country j to country k and not all varieties imported by j. This makes it different from the tariff component of price index prevailing in k. In this context, only the number of varieties matters, not the variety itself as they are all charged the same producer price within the same country.
17

should not be absorbed by the importer and time fixed effects, and as a consequence
should be treated explicitly.
In the standard estimation approach bilateral exports are weighted by the
product of GDPs. In our context this would mean treating the 1+ term
independently. As this may bring some additional statistical issues due to the possible
correlation of the latter term with 1+ this suggests another implementation
strategy. Instead of imposing a unity coefficient on the product of GDPs as done with
the standard weighting procedure, we keep the product on the right hand side and
normalize it by 1+ .
wjkT
jkTTRI
wjkT
The empirical specification corresponding to (4ʹʹ) that we consider for estimation
is thus given by:
jktkjjtktwjkt
kj
jkt
wjkt
jktjkt TGDPGDP
TTRIT
TTRIX φθψωββββ ++++⎟⎟⎠
⎞⎜⎜⎝
⎛
++⎟
⎟⎠
⎞⎜⎜⎝
⎛
+
++++=
1ln
11
ln)1ln(ln 3210 (5)
where the notation is as before. Specification (5) provides a theoretically based
robustness for assessing the impact of trade preferences on exports. In practice, we do
not expect considerably different results in estimating equation (5) versus equation (3).
3. Data
The data utilized in this paper is comprehensive of trade flows, tariffs and import
demand elasticities. Trade data originates from the UN COMTRADE database; tariff
data (MFN and preferential rates) originates from the UNCTAD TRAINS database.
Trade and Tariff data is available through the World Integrated Trade Solutions
18
(wits.worldbank.org).16 Import demand elasticities are from Kee, Neagu and Nicita
(2011) and Kee, Nicita and Olarreaga (2008). GDP data is from the World Bank World
Development Indicators database, while gravity type variables are from CEPII distance
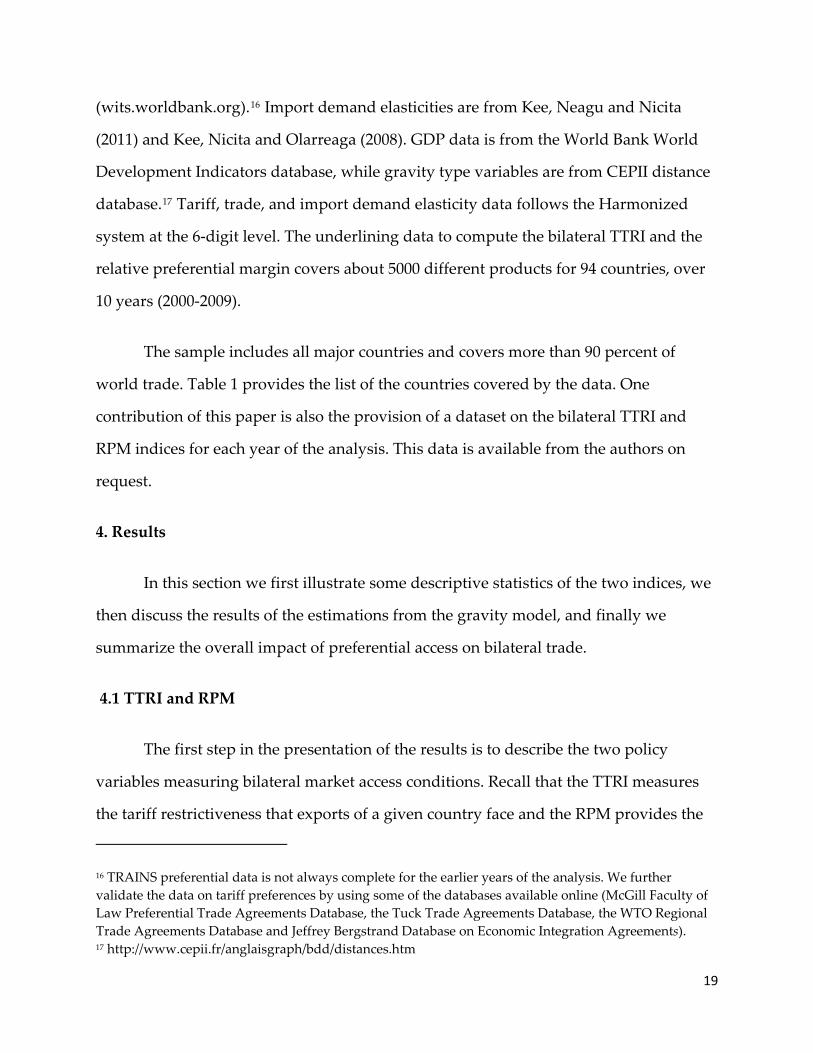
database.17 Tariff, trade, and import demand elasticity data follows the Harmonized
system at the 6‐digit level. The underlining data to compute the bilateral TTRI and the
relative preferential margin covers about 5000 different products for 94 countries, over
10 years (2000‐2009).
The sample includes all major countries and covers more than 90 percent of
world trade. Table 1 provides the list of the countries covered by the data. One
contribution of this paper is also the provision of a dataset on the bilateral TTRI and
RPM indices for each year of the analysis. This data is available from the authors on
request.
4. Results
In this section we first illustrate some descriptive statistics of the two indices, we
then discuss the results of the estimations from the gravity model, and finally we
summarize the overall impact of preferential access on bilateral trade.
4.1 TTRI and RPM
The first step in the presentation of the results is to describe the two policy
variables measuring bilateral market access conditions. Recall that the TTRI measures
the tariff restrictiveness that exports of a given country face and the RPM provides the
16 TRAINS preferential data is not always complete for the earlier years of the analysis. We further validate the data on tariff preferences by using some of the databases available online (McGill Faculty of Law Preferential Trade Agreements Database, the Tuck Trade Agreements Database, the WTO Regional Trade Agreements Database and Jeffrey Bergstrand Database on Economic Integration Agreements). 17 http://www.cepii.fr/anglaisgraph/bdd/distances.htm
19
average tariff advantage (or disadvantage) that the country has in exporting relative to
other foreign competitors. Recall also that since the primary scope of the two indices is
to measure the restrictiveness of tariff regimes, the TTRI and the RPM are calculated
with fixed weights by using the 1995‐1997 trade averages.
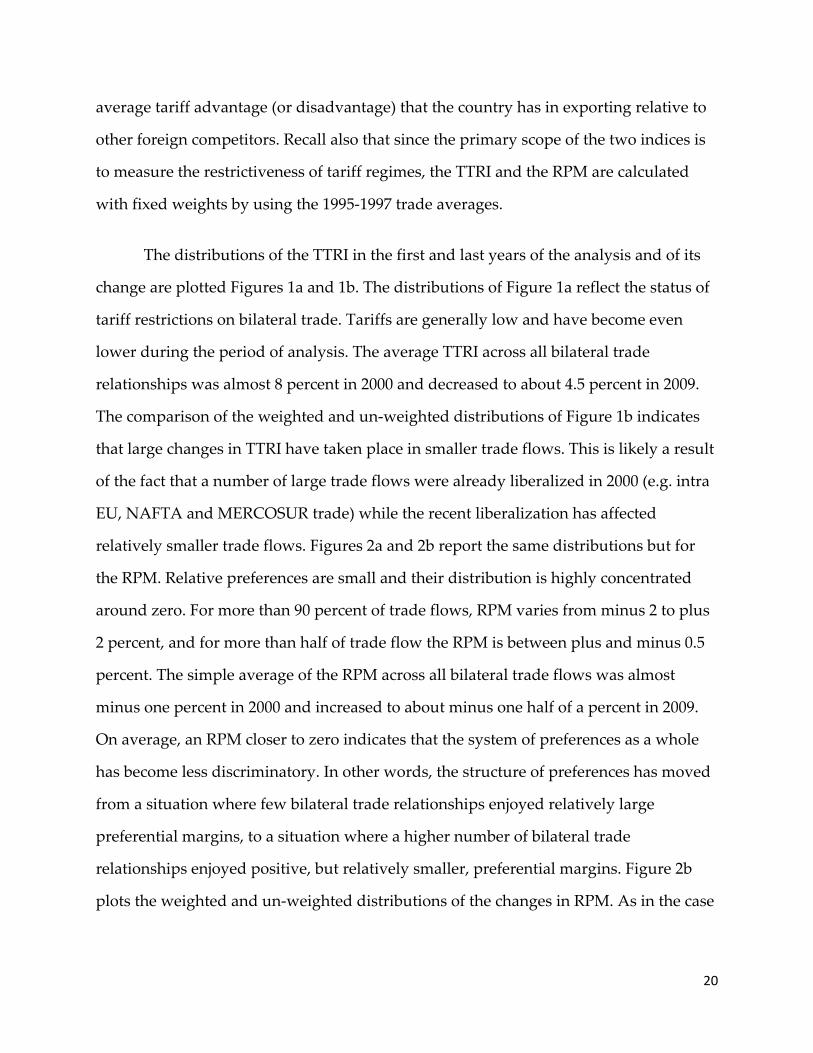
The distributions of the TTRI in the first and last years of the analysis and of its
change are plotted Figures 1a and 1b. The distributions of Figure 1a reflect the status of
tariff restrictions on bilateral trade. Tariffs are generally low and have become even
lower during the period of analysis. The average TTRI across all bilateral trade
relationships was almost 8 percent in 2000 and decreased to about 4.5 percent in 2009.
The comparison of the weighted and un‐weighted distributions of Figure 1b indicates
that large changes in TTRI have taken place in smaller trade flows. This is likely a result
of the fact that a number of large trade flows were already liberalized in 2000 (e.g. intra
EU, NAFTA and MERCOSUR trade) while the recent liberalization has affected
relatively smaller trade flows. Figures 2a and 2b report the same distributions but for
the RPM. Relative preferences are small and their distribution is highly concentrated
around zero. For more than 90 percent of trade flows, RPM varies from minus 2 to plus
2 percent, and for more than half of trade flow the RPM is between plus and minus 0.5
percent. The simple average of the RPM across all bilateral trade flows was almost
minus one percent in 2000 and increased to about minus one half of a percent in 2009.
On average, an RPM closer to zero indicates that the system of preferences as a whole
has become less discriminatory. In other words, the structure of preferences has moved
from a situation where few bilateral trade relationships enjoyed relatively large
preferential margins, to a situation where a higher number of bilateral trade
relationships enjoyed positive, but relatively smaller, preferential margins. Figure 2b
plots the weighted and un‐weighted distributions of the changes in RPM. As in the case
20
of the TTRI, the change in the RPM between 2000 and 2009 has been larger for smaller
trade flows.
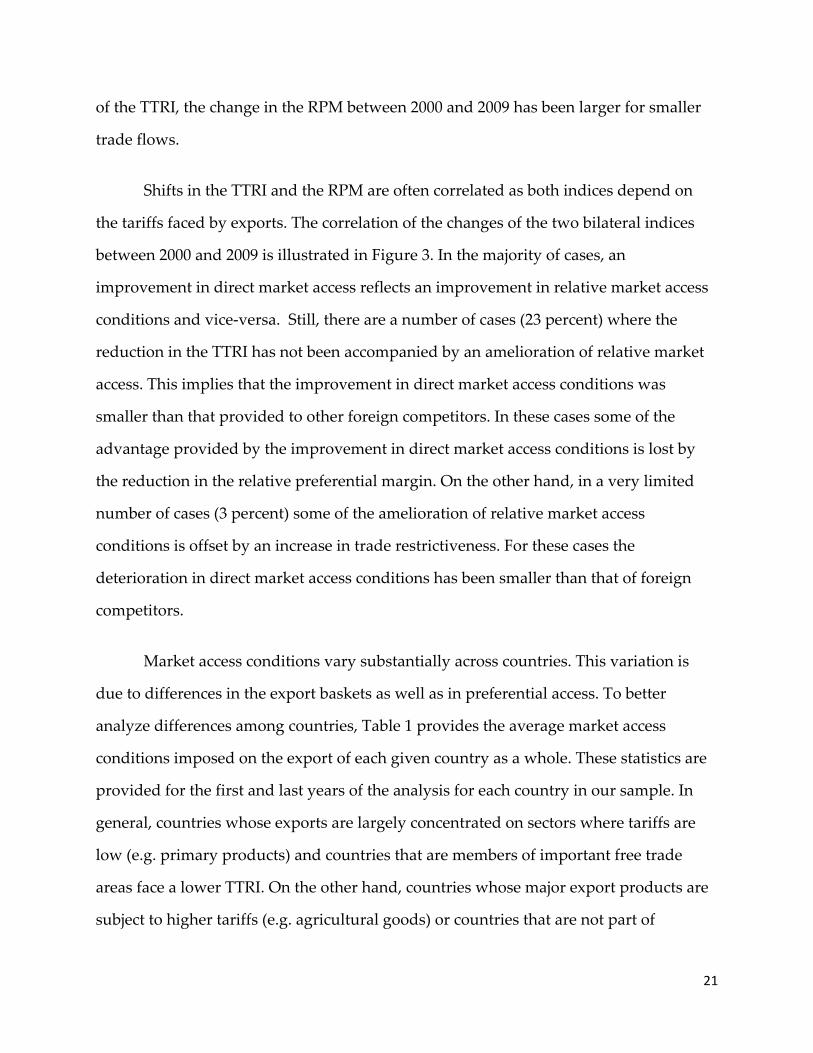
Shifts in the TTRI and the RPM are often correlated as both indices depend on
the tariffs faced by exports. The correlation of the changes of the two bilateral indices
between 2000 and 2009 is illustrated in Figure 3. In the majority of cases, an
improvement in direct market access reflects an improvement in relative market access
conditions and vice‐versa. Still, there are a number of cases (23 percent) where the
reduction in the TTRI has not been accompanied by an amelioration of relative market
access. This implies that the improvement in direct market access conditions was
smaller than that provided to other foreign competitors. In these cases some of the
advantage provided by the improvement in direct market access conditions is lost by
the reduction in the relative preferential margin. On the other hand, in a very limited
number of cases (3 percent) some of the amelioration of relative market access
conditions is offset by an increase in trade restrictiveness. For these cases the
deterioration in direct market access conditions has been smaller than that of foreign
competitors.
Market access conditions vary substantially across countries. This variation is
due to differences in the export baskets as well as in preferential access. To better
analyze differences among countries, Table 1 provides the average market access
conditions imposed on the export of each given country as a whole. These statistics are
provided for the first and last years of the analysis for each country in our sample. In
general, countries whose exports are largely concentrated on sectors where tariffs are
low (e.g. primary products) and countries that are members of important free trade
areas face a lower TTRI. On the other hand, countries whose major export products are
subject to higher tariffs (e.g. agricultural goods) or countries that are not part of
21

preferential trade agreements tend to have a larger TTRI. In value terms, average
export restrictiveness is not large and has significantly decreased between 2000 and
2009. The simple average TTRI across the countries in our sample has declined from
about 3.7 percent to about 1.4 percent during the period of analysis while the number of
countries facing very little restriction (a TTRI of less than 1 percent) increased from 10 to
52. For world trade as a whole, the TTRI has declined from about 3.2 percent to about 2
percent.
The RPM also varies substantially from one country to another. This variation
largely depends on whether the country takes part in preferential agreements with
regional partners and major trade partners. The RPM for 2009 varies from about minus
1.5 percent for Pakistan, Jamaica, India and Japan to more than 4 percent for El Salvador
and Malawi. In general, countries that are part of large PTAs and low income countries
benefiting from large preferential margins tend to have a higher RPM. On the other
hand, high income countries and countries with limited participation in trade
agreements are found to be those with a negative RPM. In regard to the change in RPM
during the period of analysis, its simple average across countries has increased from
about zero to about one half of a percent. This is due not only to the proliferation of
PTAs but more so to the fact that PTAs are often being signed between countries with
strong pre‐existing trade and economic relationships (Wonnacott and Lutz, 1989; and
Baier and Berstrand, 2004). In more detail, the results indicate that RPM has increased
the most for countries which have recently either formed new PTAs (e.g. Central
America), joined existing PTAs (e.g. EU enlargement), or entered PTAs with major
markets (e.g. Turkey, Morocco, and Honduras). These countries have gained
substantially in terms of relative preferential access. On the other hand, between 2000
and 2009 the RPM has decreased for countries that have been early adopters of PTAs
(e.g. high income and Latin American countries) as well as for some least developed
22

countries. For these countries, the preferential margins of the past have been somewhat
eroded by the proliferation of PTAs. Finally, RPM declined also for countries that did
not actively engage in forming trade agreements with major trading partners (e.g China
and India).
4.2. Econometric Results
This section discusses the results of the estimation of the gravity model discussed
in Section 2. We estimate several specifications of the gravity model controlling for an
increasing number of factors. We then test the robustness of our results to the choice of
the weights in the construction of the indices and to the inclusion of several other policy
variables.
Table 2 reports the estimated coefficients with bootstrapped standard errors for a
series of specifications of the gravity model based on equation (3).18 The overall results
indicate that both TTRI and RPM have a significant effect on trade flows and in the
direction one would expect. Bilateral trade flows are found to be negatively correlated
with the TTRI and positively correlated with the RPM. More explicitly, specifications (1)
and (2) estimate the gravity model with country‐year fixed effect accounting for
multilateral resistance while controlling for bilateral factors with a series of gravity
variables (distance, common border, common language, colonial ties). All coefficients
result significant and of the correct sign. The coefficient of the TTRI variable is about
18 Random drawing from the elasticities distribution, bootstrapping the indices and estimating the gravity model with all fixed effect is quite a computationally intensive procedure. Thus, we report bootstrapped standard error only for our main results of Table 2. For the results of Tables 3 and 4 the robust standard errors are not bootstrapped. Since bootstrapped standard errors are found to be similar in magnitude to heterodasticity robust standard errors, this should not invalidate these results. Also note that bootstrapped standard errors of the indices themselves are not found to be very large as the elasticities used in the construction of the indices are estimated with great precision (Kee, Nicita and Olarreaga, 2008).
23
minus 1.5 in specification (1) and increases to about minus 1 in specification (2) when
the RPM variable is added. In this specification the coefficient on the RPM is about 2.6.
This would indicate that relative preferences have a large impact, as a 1 percentage
point increase in RPM would increase trade by more than 2.5 percent. This result is
reduced when country‐pair fixed effects are added in specifications (3) and (4). The
lower coefficients suggest an omitted variable bias, as the gravity type variables of
specification (2) may not capture the full heterogeneity across countries. The result of
specification (3) indicates that bilateral trade flows are estimated to decrease by about
one percent for a one percentage point increase in the TTRI at its mean. Part of this
effect is transferred to the RPM variable once it is added as in specification (4). In this
specification the coefficient on the TTRI is about minus 0.86 while the coefficient on the
RPM is about 0.62. In this case the effect on bilateral trade is respectively ‐0.8 percent
and ‐0.86 percent for each percentage point increase in the TTRI and each percentage
point decrease in the RPM.19 Specification (4) is our preferred one whose results are
used to estimate the effects on bilateral trade flows. The final specification (5) derives
from the theoretically based robustness check discussed in Section 2.3 and is based on
estimating equation (5). As expected, these results are similar to those obtained from the
previous specification.
We now turn to the sensitivity analysis of our results. Table 3 reports the estimated
coefficients for a series of robustness checks largely related to the choice of variables used
in the construction of the indices. All the results so far have been based on indices that are
constructed by using fix trade weights averaged for the years 1995‐1997. To check the
19 This is to say that assuming that the one percentage point increase in TTRI taken at its mean translates
into a one percentage point decrease in the RPM (i.e. kjT
hshsjkhsjk
hshswkhsjkhsjk
≠∑
∑,
,,
,,,
ε
ε
x
x remains constant), the
impact on trade for a country pair with such characteristics is about 1.7 percent.
24

extent to which the results are robust to the choice of weights used in the construction of
the indices we also estimate our preferred specification using weights based on trade
values for the year 2000 and also weights based on average trade values across our period
of analysis (2000‐2009).20 The results are reported in columns (1) and (2) respectively.
The indices also depend on import demand elasticities. To check the robustness of
the results to the choice of elasticities we estimate the model with indices constructed
assuming unitary (or unvarying) elasticities and also by using multilateral elasticities from
Kee, Nicita and Olarreaga (2008). The results are reported in columns (3) and (4). A final
robustness check regards the use of the year 2009 in the estimating sample. Because of
economic turmoil, 2009 was a year in which international trade flows declined quite
dramatically. Although this should be captured by importer‐year and exporter‐year fixed
effects, there may be some specific bilateral effects. To check whether these impact our
results, column (5) reports the coefficients of the two indices by excluding the year 2009
from the estimating sample. All of these robustness checks do not affect our results in a
substantive matter. Both TTRI and RPM remain significant and on the correct sign across
all specifications.
A different set of concerns relates to what extent the results are robust to policy
related issues. In particular, we are interested in whether our results are affected by
preference utilization, PTAs’ trade related effects beyond those of tariffs, and exchange rate
fluctuations. We also explore the extent to which the RPM variable provides a better fit in
explaining bilateral trade than the standard measure of preferential margin simply
20 This approach increases the number of observations by about 5 percent as it guarantees that the indices are calculated for each observed level of trade.
25

constructed on the basis of the MFN rate.21 Table 4 reports these results. We start by
replacing the RPM variable with the standard measure of preferential margin in our
preferred specification. Estimation results are reported in column (1). They show the lack of
significance of the coefficient for the preference margin while the TTRI remains
substantially unchanged. The lack of significance is likely driven by some collinearity of the
standard preferential margin with the fixed effects. The standard preference margin has a
lower degree of variation across country‐time (because MFN tariffs may have not changed
as much), as well as a lower degree of variation across country‐pairs (because MFN rates
are uniformly applied to a large number of countries). These impacts are likely to be
absorbed by importer‐time and country‐pair dummies. In any case, the lack of significance
for the standard measure of preferential margin implies that it is not suited to properly
capture the effect of relative preferences on trade within a well specified gravity model.
Preferential access is often subject to stringent rules and regulations, such as rules of
origin (Krishna, 2006) which add to overall trade costs. When the preferential margin is
small, the costs of using preferential access often outweigh the benefits, and thus traders
find it more economically viable to pay MFN rates rather than to incur the cost associated
with the use of the preferential rate. As a test, we check whether our results are robust to
this issue by applying the simple rule that preferences are used only when the preferential
margin is larger than 2.5 percent (Estevadeordal, Freund and Ornelas. 2008). We recalculate
the indices and then re‐estimate our preferred specification.22 These results, provided in
column (2), show no substantial difference from those of our preferred specification.
21 The standard preferential margin is given by ( )
∑∑ −
=
hshsjk
jhsjk
jhskhsk
hshsjk
jhsjk
jk x
TMFNxPM
,,
,,,,
ε
ε
22 In a large majority of cases the TTRI and RPM resulted very close to the ones calculated on the basis of the applied tariffs. On average, the TTRI corrected for preference utilization is about 0.2 percent higher
26
Another issue of consideration is the extent to which our results are robust once we
explicitly control for the existence of a PTA. We thus re‐estimate the model by adding a
dummy variable for the presence of PTAs and provide the result in column (3)23. The
inclusion of the PTA variable does not affect the coefficients on the two indices, and results
in an insignificant effect for the PTA. The lack of significance is most likely related to
collinearity as country pair fixed effects take most of the explanatory power out of the PTA
variable. We thus re‐estimate the model substituting country‐pair fixed effects with a series
of gravity type variables as in the first two specifications of Table 2. The results are shown
in column (4). Also in this case the coefficients for our indices do not change significantly
with respect to the corresponding specification (2) of Table 2. However, in this case the
effect of the PTA is significant. In our period of analysis, the average effect of a PTA is
estimated to be about a 35 percent increase in bilateral trade.
One further concern is related to exchange rate fluctuations. Movement tariffs
and exchange rates have similar effects on international trade (Feenstra, 1989).
Exchange rates varied considerably during our period of analysis and thus our results
could be at least partly driven by exchange rate fluctuations. In our specifications,
exchange rate movements are largely captured by importer‐year and exporter‐year
fixed effects. Still, there could be some residual effects at the bilateral level. We take this
into account by adding the yearly average bilateral exchange rate as a control variable.
The results, provided in column (5), do not show a substantial change in the coefficients
on the indices, while indicating that a 10 percent depreciation of exporter currency
results in an almost 1.2 percent increase in exports.
than the uncorrected one, while the RPM is substantially unchanged. For only about 1 percent of observations the difference between the two TTRIs was larger than 1 percent. 23 The data on preferential agreements largely comes from the Jeffrey Bergstrand Database on Economic Integration Agreements available at http://www.nd.edu/~jbergstr/.
27
4.3. Impact of preferential access on trade flows
In this section we make use of the econometric results to calculate the magnitude
of the effect of the system of preferences on trade flows with respect to a scenario based
on MFN rates and thus with no discrimination across trading partners.24 The impact of
preferential access on exports for every country is simply calculated as:
( ) ( )∑∑ Δ++Δ=Δk
jkjkk
jk RPMTTRIX 21 1lnln ββ (6)
where ( ) )1(ln)1(ln1Δln jkjjk TTRIMFNTTRI +−+=+ and jkjk RPMRPMΔ = since the RPM
is equal to zero in a non discriminatory tariff regime. An important issue in the above
calculation is how to account for the fact that the MFN liberalization between 2000 and
2009 was, at least in part, a consequence of the proliferation in PTAs. By comparing
present market access conditions with those of MFN regimes existing in 2009 we
implicitly assume that any MFN liberalization that happened during the period of
analysis was not in response to the proliferation of preferential access. This may not be a
valid assumption as some of the literature suggests that PTAs contributed to freer MFN
trade by acting as a “building block”.25 This MFN liberalization should therefore be
included in our calculation as an indirect effect of preferences. On the other hand, by
comparing present market access conditions with those of MFN regimes in 2000, the
results would be based on the opposite assumption that MFN liberalization was
exclusively driven in response to the proliferation of PTAs. This is a similarly unlikely
24 Results are based on the coefficients obtained in specification (4) of Table 2. 25 Estevadeordal, Freund and Ornelas (2008) find a ‘building block’ effect in a sample of ten Latin American countries. Baldwin and Seghezza (2008) find a negative correlation between MFN tariffs and preference margins in their sample of 23 large countries. They conclude that the stumbling block mechanism, if it exists, is not of first order importance.
28

assumption. However, taken together, these results provide lower and upper bounds of
the effect of preferential access on bilateral trade.
On average, the effects of preferential access on trade are not very large, as the
difference between MFN and preferential tariffs is not large in many cases.26. Across all
bilateral trade flows, the average increase in bilateral trade due to the system of
preference relative to the MFN scenario is estimated to be between an upper bound of
3.3 percent and a lower bound of 1.2 percent. Still, the results show some variance. For
25 percent of bilateral trade flows the direct effects of preference are quantified to be
between 2 and 5 percent. For international trade as a whole, the direct impact of
preferential tariffs is quantified to account for an increase between 1.9 and 3 percent,
while the relative impact of preferences is zero.
The effect of the system of preferences on trade varies widely among countries.
As in the case of the indices, this variance depends on whether the country participates
in PTAs as well as on the product composition of its exports. Countries whose major
exports are products where MFN tariffs are low do not substantially benefit from free
trade agreements even when they are members of many PTAs. On the other hand,
countries whose exports tend towards highly protected sectors benefit greatly from
PTAs with major trading partners. Table 5 reports the average impact of preferential
access for each country in our sample. The table reports the upper and lower bounds of
the direct effect of preferences as well as the relative effect which takes into account
preferences given to foreign competitors. Some of the large beneficiaries from the
preferential tariffs regimes are South and Central American countries. For many of
these countries the total effect of the system of preferences is quantified as an increase in
export of more than 5 percent. This increase is due to their membership in regional
26Given the little difference between preferential tariffs and the MFN rates (2.2 percent in 2009), the effect on trade is on average small.
29
PTAs, preferential access to the USA, and the high external tariffs that shield internal
trade from foreign competitors. Countries enjoying preferential access in high income
markets are also those whose benefits are larger. Among these, the largest beneficiaries
are some countries in Africa (e.g. Kenya, Malawi, Mauritius, Morocco, Tanzania and
Tunisia) and some in Asia (Bangladesh and Sri Lanka). Most of the countries that are
members of the EU market also reap large benefits from the system of preferences.
Although the system of preferences always provides amelioration in direct
market access conditions, its effects with regard to relative market access conditions are
negative for almost one‐third of the countries. For these countries, the discriminatory
effect of preferences erodes part of the benefits provided by the lower tariffs on their
exports, sometimes quite significantly. Moreover, not all countries benefit from the
system of preferences. For a small subset of countries (e.g. India, Japan, Korea, and
Taiwan) the overall effect of the system of preferences is likely to be negative, as the
losses in terms of relative market access conditions are higher than the gains from direct
market access conditions.
5. Conclusions
The objective of this paper is to better investigate the extent to which preferential
market access affects bilateral trade. In doing so, the paper first provides two indices of
market access conditions that take into account the complex structure of tariff
preferences. The first index measures direct market access conditions (the overall tariff
faced by exports) while the other index measures relative market access conditions (the
overall tariff faced by exports relative to that faced by foreign competitors). The
tracking of the two indices across our period of analysis (2000 ‐ 2009) indicates that
direct market access conditions have generally improved and that relative market
30

access conditions have become less discriminatory during the period of analysis. While
the proliferation of PTAs has had the effect of reducing a large number of bilateral
tariffs, the proliferation of PTAs has also eroded some of the large tariff advantages
provided by pre‐existing PTAs.
The paper continues by estimating a gravity model to quantify the impact of
preferential market access on international trade and applies these results to calculate
the effect of tariff preferences relative to a non‐discriminatory MFN scenario. The
results indicate that while direct market access conditions are of primary importance in
increasing trade, relative market access conditions also have a significant impact. Since
2000, the system of preferences has contributed to an increase in international trade
between 1.9 and 3 percent depending on whether the MFN liberalization that occurred
between 2000 and 2009 is assumed, or not, to be consequential to the proliferation of
PTAs. At the country level the results show substantial variance. Although the results
indicate that the overwhelming majority of countries benefits from the overall system of
preferences, some countries see part of these benefits eroded, sometimes substantially,
by the deterioration in their relative market access conditions.
31

References
Anderson, James E. and Peter Neary, 1994. Measuring the restrictiveness of trade policies, World Bank Economic Review, 8(2), 151‐169.
Anderson, James E. and Peter Neary, 2003. The mercantilist index of trade policy, International Economic Review, 44(2), 627‐649.
Anderson, James E. and Peter Neary, 2005. Measuring Trade Restrictiveness of Trade Policy, Cambridge, Mass. MIT Press, 2005.
Anderson, James E. and Eric vanWincoop, 2003. Gravity with gravitas: a solution to the border puzzle, American Economic Review, 93(1), 70‐192.
Baier, Scott L., and Jeffrey H. Bergstrand, 2009. Estimating the effects of free trade agreements on international trade flows using matching econometrics, Journal of International Economics, 77(1), 63‐76.
Baier, Scott L., and Jeffrey H. Bergstrand, 2007. Do free trade agreements actually increase membersʹ international trade?, Journal of International Economics, 71(1), 72‐95.
Baldwin Richard and Dany Jaimovich, 2010. Are free trade agreements contagious?, CEPR Discussion Papers No. 7904.
Baldwin, Richard and Elena Seghezza, 2008. Are trade blocs building or stumbling blocks? New evidence, CEPR Discussion paper No. 6599.
Bhagwati, Jagdish, 2008. Termites in the Trading System: How Preferential Agreements Undermine Free Trade. Oxford University Press.
Martijn Burger, Frank van Oort and Gert‐Jan Linders, 2009. On the specification of the gravity model of trade: zeros, excess zeros and zero‐inflated estimation, Spatial Economic Analysis 4, 167‐187.
Calvo‐Pardo Hector, Caroline Freund and Emanuel Ornelas, 2009. The ASEAN free trade agreement: impact on trade flows and external trade barriers, in: Barro Robert, Lee Jong‐Wha (Eds.), Costs and Benefits of Regional Economic Integration. Oxford University Press.
Carrère, Céline, Jaime de Melo, and Bolormaa Tumurchudur, 2008. Disentangling market access effects for ASEAN members under an ASEAN‐EU FTA. CEPR Discussion Papers No. 6762.
32

Carrère, Celine, 2006. Revisiting the effects of regional trade agreements on trade flows with proper specification of the gravity model. European Economic Review, 50(2), 223‐247.
Clausing, Kimberly, 2001. Trade creation and trade diversion in the Canada‐United States Free Trade Agreement, Canadian Journal of Economics, 34, 678‐96.
Estevadeordal, Antoni, Caroline Freund and Emanuel Ornelas, 2008. Does regionalism affect trade liberalization towards non‐members?, Quarterly Journal of Economics 123(4), 1531‐1575.
Feenstra, Robert, 1995. Estimating the effects of trade policy. In Gene Grossman and Kenneth Rogoff, eds., Handbook of International Economics, 3, Elsevier, Amsterdam.
Feenstra, Robert, 1989. Symmetric pass‐through of tariffs and exchange rates under imperfect competition: an empirical test, Journal of International Economics, 27(1‐2), 25‐45.
Frankel, Jeffrey A., 1997. Regional Trading Blocs, Institute for International Economics, Washington, DC.
Freund Caroline, 2010. Third‐country effects of regional trade agreements, The World Economy, 33(11), 1589‐1605.
Freund Caroline and Emanuel Ornelas, 2010. Regional trade agreements, Annual Review of Economics, 2(1), 139‐166.
Ghosh, Sucharita and Steven Yamarik, 2004. Are regional trading arrangements trade creating?: An application of extreme bounds analysis, Journal of International Economics, 63(2), 369‐395.
Grossman, Gene M. and Elhanan Helpman, 1995. The politics of free‐trade agreements. American Economic Review 85(4), 667‐690.
Helpman, Elhanan, Marc Melitz and Yona Rubinstein, 2008. Estimating trade flows: trading partners and trading volumes, The Quarterly Journal of Economics, 123(2), 441‐487.
Hoekman, Bernard, Will Martin and Carlos P. Braga, 2009. Quantifying the value of preferences and potential erosion losses,. in: Bernard M. Hoekman, Will Martin and Carlos Braga (Eds.), Trade Preference Erosion Measurement and Policy Response. Palgrave MacMillan.
33

Hoekman , Bernard and Alessandro Nicita, 2011. Trade policy, Trade costs, and developing country trade. World Development, (forthcoming),
Kee, Hiau Looi, Cristina Neagu and Alessandro Nicita, 2011. Is protectionism on the rise? Assessing national trade policies during the crisis of 2008, The Review of Economics and Statistics, (forthcoming)
Kee, Hiau Looi, Alessandro Nicita and Marcelo Olarreaga, 2009. Estimating trade restrictiveness indices, Economic Journal, 119(534), 172‐199.
Kee, Hiau Looi, Alessandro Nicita and Marcelo Olarreaga, 2008. Import demand elasticities and trade distortions, The Review of Economics and Statistics, 90(4), 666‐682.
Kemp, Murray C. and Henry Wan, Jr. 1976. An elementary proposition concerning the formation of customs unions, Journal of International Economics, 6, 95‐97.
Krishna, Kala, 2006. Understanding rules of origins, in: Cadot, O., Estevadeordal A., Suwa‐Eisenmann A., and Verdier, T. (eds.) The Origin of Goods: Rules of Origin in Regional Trade Agreements. Oxford University Press, 2006.
Krishna, Pravin, 1998. Regionalism and multilateralism: A political economy approach, Quarterly Journal of Economics, 113, 227‐252.
Lee Jong‐Wha and Shin Kwahno 2006. Does regionalism lead to more global trade integration in East Asia?, North American Journal of Economics and Finance, 17, 283‐301.
Linder, Staffan Burenstam. 1961. An Essay on Trade and Transformation. Wiley and Sons. New York.
Linnemann, Hans, 1966. An Econometric Study of International Trade Flows. North‐Holland, Amsterdam.
Low Patrick, Roberta Piermartini and Jurgen Richtering, 2009 Multilateral solutions to the erosion of non‐reciprocal preferences in NAMA, in: Bernard Hoekman, Will Martin and Carlos Braga (Eds.), Trade Preference Erosion Measurement and Policy Response. Palgrave MacMillan.
Magee, Christopher. 2008. New measures of trade creation and trade diversion, Journal of International Economics, 75(2), 340‐62.
Ornelas, Emanuel, 2005. Rent destruction and the political viability of free trade agreements, Quarterly Journal of Economics 120, 1475‐1506.
34
Rauch, James, 1999. Networks versus markets in international trade, Journal of International Economics, 48(1), 7‐35.
Robertson, Raymond and Antoni Estevadeordal, 2009. Asymmetric tariffs and multilateral resistance, Cuadernos de Economia Latin American Journal of Economics, 46, 3‐31.
Romalis, John, 2007. Market access, openness and growth, NBER Working Paper No. 13048.
Santos Silva Joao and Silvana Tenreyro, 2006. The log of gravity, The Review of Economics and Statistics, 88(4), 641‐658.
Trefler, Daniel, 2004. The long and short of the Canada‐U. S. Free Trade Agreement, American Economic Review, 94(4), 870‐895. Viner, Jacob, 1950. The Customs Union Issue. Carnegie Endowment for International Peace.
Wonnacott, Paul, and Mark Lutz, 1989. Is there a case for free trade agreements? in: Jeffrey Schott, ed., Free Trade Areas and U.S. Trade Policy, Institute for International Economics: Washington D.C.
35

Table 1 – Average TTRI and RPM, by country
TTRI 2000
TTRI 2009
RPM 2000
RPM 2009
TTRI 2000
TTRI 2009
RPM 2000
RPM 2009
Algeria 0.006 0.001 ‐0.001 0.000 Korea 0.061 0.041 ‐0.011 ‐0.012
Argentina 0.066 0.050 0.039 0.032 Latvia 0.021 0.010 ‐0.002 ‐0.001
Australia 0.052 0.036 ‐0.001 ‐0.001 Lebanon 0.063 0.006 ‐0.003 0.013
Austria 0.018 0.006 0.006 0.003 Lithuania 0.047 0.011 ‐0.011 0.006
Azerbaijan 0.071 0.005 ‐0.002 0.016 Malaysia 0.031 0.013 ‐0.003 ‐0.001
Bangladesh 0.051 0.037 0.024 0.012 Mauritius 0.071 0.003 ‐0.021 0.013
Belgium 0.013 0.004 0.008 0.005 Mexico 0.005 0.002 0.017 0.016
Bolivia 0.003 0.002 0.040 0.018 Morocco 0.084 0.012 ‐0.026 0.005
Brazil 0.058 0.033 0.014 0.008 Netherlands 0.011 0.007 0.005 0.002
Bulgaria 0.060 0.016 ‐0.015 0.004 New Zealand 0.041 0.037 ‐0.005 ‐0.008
Cameroon 0.022 0.008 ‐0.003 0.001 Nicaragua 0.044 0.006 0.001 0.023
Canada 0.011 0.007 0.009 0.008 Nigeria 0.021 0.002 ‐0.001 ‐0.002
Chile 0.023 0.006 0.005 0.010 Norway 0.006 0.004 0.003 0.001
China 0.040 0.034 ‐0.005 ‐0.006 Paraguay 0.011 0.003 0.013 0.019
Colombia 0.024 0.008 0.011 0.014 Peru 0.029 0.009 ‐0.006 0.008
Costa Rica 0.044 0.004 ‐0.003 0.012 Philippines 0.026 0.021 0.001 ‐0.002
Cote d'Ivoire 0.037 0.009 ‐0.010 0.003 Poland 0.044 0.007 ‐0.016 0.005
Croatia 0.067 0.006 ‐0.016 0.003 Portugal 0.008 0.006 0.019 0.011
Czech Rep 0.065 0.005 ‐0.012 0.004 Romania 0.069 0.015 ‐0.016 0.015
Denmark 0.015 0.010 0.004 0.002 Russian Fed 0.024 0.015 ‐0.005 ‐0.004
Ecuador 0.056 0.028 ‐0.002 0.008 South Africa 0.028 0.017 ‐0.004 ‐0.001
Egypt 0.046 0.023 ‐0.009 ‐0.002 Saudi Arabia 0.021 0.007 ‐0.001 0.000
El Salvador 0.050 0.001 0.008 0.041 Senegal 0.030 0.013 0.033 0.012
Estonia 0.025 0.006 ‐0.008 0.004 Singapore 0.020 0.006 0.006 0.004
Ethiopia 0.004 0.002 0.002 0.002 Slovakia 0.039 0.006 0.001 0.002
Finland 0.017 0.010 0.001 0.000 Slovenia 0.059 0.006 ‐0.033 0.003
France 0.019 0.009 0.005 0.003 Spain 0.020 0.010 0.009 0.005
Ghana 0.030 0.008 ‐0.008 ‐0.011 Sri Lanka 0.073 0.047 ‐0.008 0.002
Greece 0.024 0.012 0.014 0.004 Sweden 0.018 0.008 0.002 0.001
Guatemala 0.047 0.011 0.008 0.029 Taiwan 0.051 0.035 ‐0.008 ‐0.011
Germany 0.021 0.010 0.005 0.003 Tanzania 0.086 0.016 ‐0.002 0.006
Honduras 0.061 0.003 ‐0.003 0.036 Thailand 0.052 0.034 0.000 ‐0.002
Hong Kong 0.079 0.046 ‐0.017 ‐0.009 Trinidad Tbg 0.018 0.002 ‐0.007 0.001
Hungary 0.045 0.007 ‐0.013 0.004 Tunisia 0.074 0.004 ‐0.025 0.014
Iceland 0.014 0.008 0.017 0.008 Turkey 0.077 0.022 ‐0.028 0.006
India 0.038 0.033 ‐0.006 ‐0.014 Uganda 0.026 0.005 ‐0.002 0.001
Indonesia 0.049 0.034 0.000 ‐0.002 Untd.Kingdom 0.020 0.010 0.004 0.003
Iran 0.034 0.014 ‐0.004 ‐0.003 Uruguay 0.024 0.019 0.045 0.041
Ireland 0.009 0.011 0.006 0.002 USA 0.044 0.035 0.005 0.001
Israel 0.011 0.005 0.007 0.004 Venezuela 0.013 0.002 0.009 0.008
Italy 0.025 0.014 0.007 0.004 Zambia 0.061 0.010 0.005 ‐0.001
Japan 0.054 0.037 ‐0.013 ‐0.014
Jordan 0.056 0.016 ‐0.003 0.004
Kazakstan 0.037 0.009 0.000 0.008 Simple Avg 0.037 0.014 0.000 0.006Kenya 0.048 0.008 0.000 0.030 Weighted Avg 0.033 0.020 0.001 0.001
36

Table 2 ‐ Gravity Model Results
Dependent variable: Natural log of export
(1) (2) (3) (4) (5) ‐1.530*** ‐0.979*** ‐1.003*** ‐0.857*** ‐0.886*** Ln(1+TTRI) (0.119) (0.116) (0.099) (0.100) (0.114)
2.601*** 0.625*** 0.675** RPM (0.265) (0.204) (0.274)
‐1.298*** ‐1.287*** Ln Distance (0.017) (0.017)
0.347*** 0.324*** Shared Border (0.042) (0.042)
Same Language 0.643*** 0.632***
(0.031) (0.031)
0.462*** 0.479*** Ex‐Colony
(0.032) (0.032)
Importer‐Year f.e. yes yes yes yes yes Exporter‐Year f.e. yes yes yes yes yes
Importer‐Exporter f.e. no no yes yes yes Observations 65007 65007 65007 65007 65007
R2 0.822 0.829 0.919 0.928 0.926 Note: Bootstrapped robust standard errors in parentheses ‐ * p < 0.10, ** p < 0.05, *** p < 0.01
37
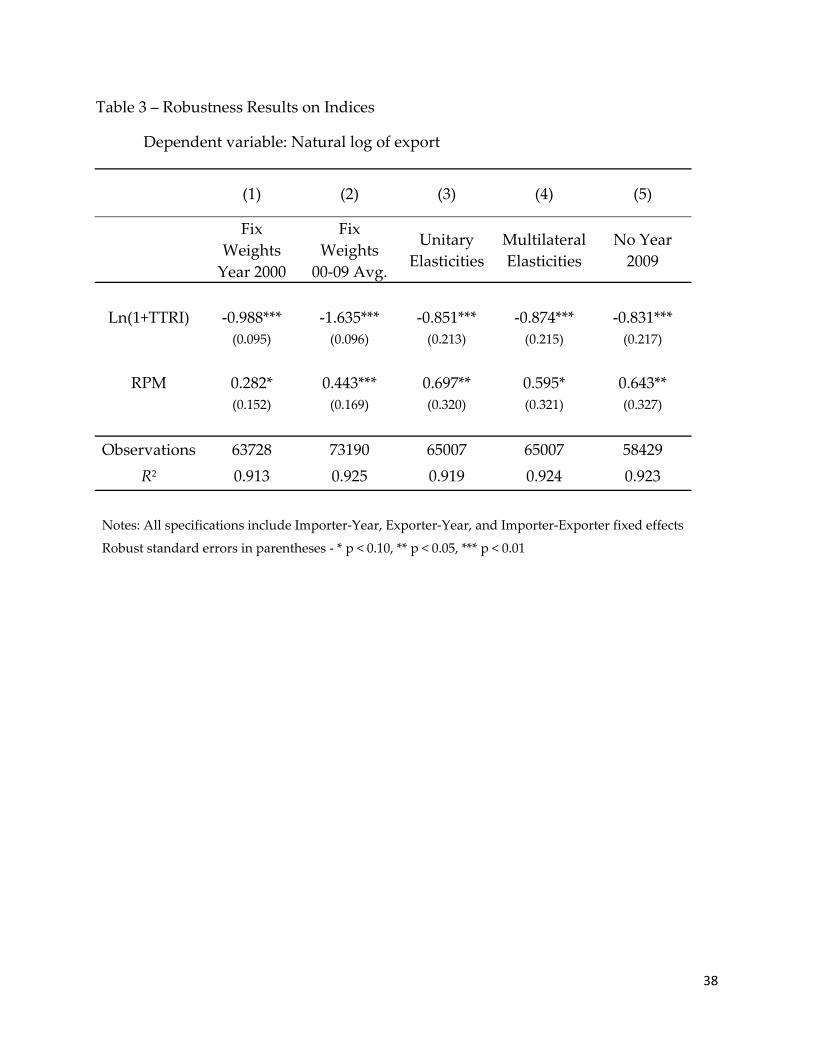
Table 3 – Robustness Results on Indices
Dependent variable: Natural log of export
(1) (2) (3) (4) (5)
Fix
Weights Year 2000
Fix Weights 00‐09 Avg.
Unitary Elasticities
Multilateral Elasticities
No Year 2009
Ln(1+TTRI) ‐0.988*** ‐1.635*** ‐0.851*** ‐0.874*** ‐0.831***
(0.095) (0.096) (0.213) (0.215) (0.217)
RPM 0.282* 0.443*** 0.697** 0.595* 0.643** (0.152) (0.169) (0.320) (0.321) (0.327)
Observations 63728 73190 65007 65007 58429 R2 0.913 0.925 0.919 0.924 0.923
Notes: All specifications include Importer‐Year, Exporter‐Year, and Importer‐Exporter fixed effects
Robust standard errors in parentheses ‐ * p < 0.10, ** p < 0.05, *** p < 0.01
38
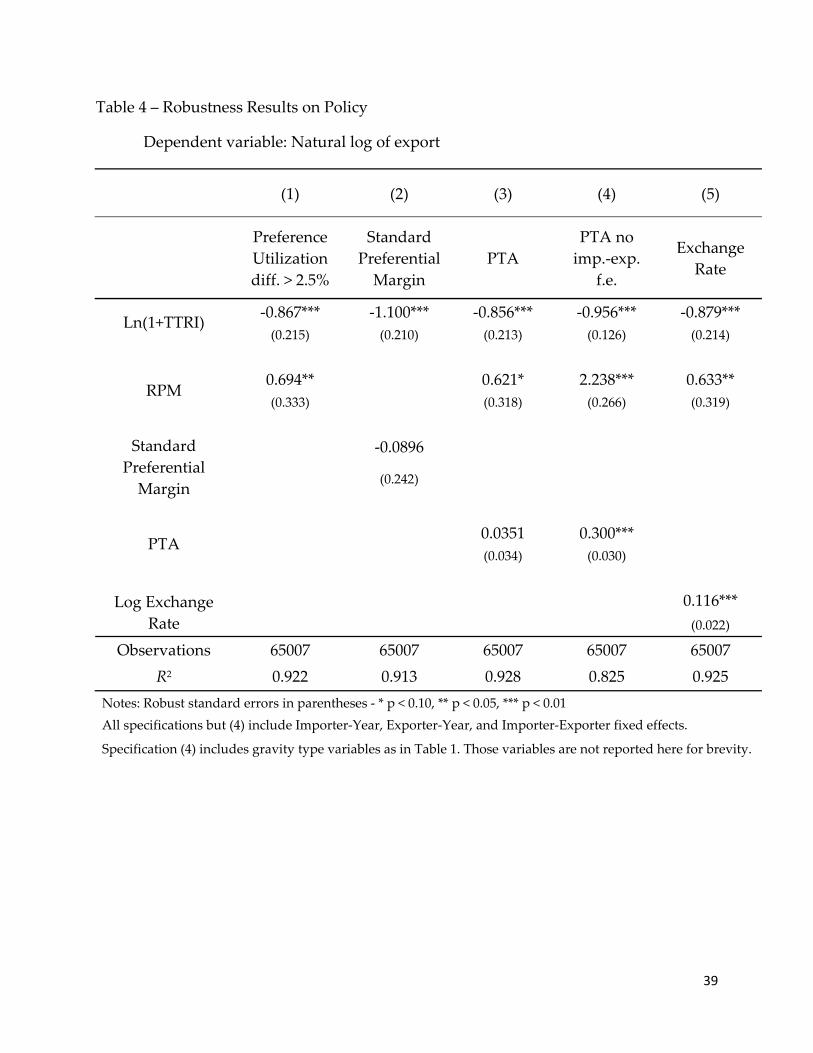
Table 4 – Robustness Results on Policy
Dependent variable: Natural log of export
(1) (2) (3) (4) (5)
Preference Utilization diff. > 2.5%
Standard Preferential Margin
PTA PTA no imp.‐exp.
f.e.
Exchange Rate
‐0.867*** ‐1.100*** ‐0.856*** ‐0.956*** ‐0.879*** Ln(1+TTRI) (0.215) (0.210) (0.213) (0.126) (0.214)
0.694** 0.621* 2.238*** 0.633**
RPM (0.333) (0.318) (0.266) (0.319)
‐0.0896 Standard
Preferential Margin (0.242)
0.0351 0.300***
PTA (0.034) (0.030)
0.116*** Log Exchange
Rate (0.022)
Observations 65007 65007 65007 65007 65007 R2 0.922 0.913 0.928 0.825 0.925
Notes: Robust standard errors in parentheses ‐ * p < 0.10, ** p < 0.05, *** p < 0.01 All specifications but (4) include Importer‐Year, Exporter‐Year, and Importer‐Exporter fixed effects.
Specification (4) includes gravity type variables as in Table 1. Those variables are not reported here for brevity.
39

Table 5 – Trade Effects of the System of Preference (% change in trade)
TTRI (upper bound)
TTRI (lower bound)
RPMTTRI (upper bound)
TTRI (lower bound)
RPM
Algeria 0.58% 0.30% 0.01% Korea 1.44% 0.14% ‐0.77%
Argentina 5.56% 3.85% 1.97% Latvia 1.28% 1.15% ‐0.04%
Australia 1.91% 0.24% ‐0.04% Lebanon 3.97% 1.81% 0.82%
Austria 3.10% 2.03% 0.21% Lithuania 3.26% 2.60% 0.35%
Azerbaijan 3.68% 2.00% 1.00% Malaysia 1.00% 0.37% ‐0.09%
Bangladesh 4.01% 3.36% 0.75% Mauritius 5.00% 4.59% 0.79%
Belgium 3.57% 2.61% 0.28% Mexico 2.22% 2.02% 0.98%
Bolivia 3.87% 2.43% 1.13% Morocco 5.16% 4.02% 0.32%
Brazil 3.71% 1.83% 0.51% Netherlands 4.06% 3.54% 0.12%
Bulgaria 3.63% 2.16% 0.26% New Zealand 0.93% 0.50% ‐0.53%
Cameroon 1.08% 0.99% 0.07% Nicaragua 4.46% 3.96% 1.44%
Canada 1.68% 1.25% 0.49% Nigeria 0.80% 0.04% ‐0.12%
Chile 2.40% 1.51% 0.60% Norway 1.18% 0.88% 0.08%
China 0.77% 0.42% ‐0.40% Paraguay 3.89% 3.16% 1.18%
Colombia 3.03% 2.38% 0.89% Peru 2.45% 2.00% 0.48%
Costa Rica 4.63% 4.24% 0.75% Philippines 0.90% 0.56% ‐0.12%
Cote d'Ivoire 2.29% 1.81% 0.21% Poland 2.76% 2.18% 0.31%
Croatia 4.67% 2.63% 0.18% Portugal 4.04% 3.75% 0.67%
Czech Rep 4.72% 2.05% 0.24% Romania 4.89% 3.38% 0.91%
Denmark 3.03% 2.34% 0.13% Russian Fed 0.88% 0.22% ‐0.24%
Ecuador 3.75% 3.52% 0.48% South Africa 1.16% 0.50% ‐0.09%
Egypt 2.34% 1.80% ‐0.10% Saudi Arabia 0.76% 0.12% ‐0.02%
El Salvador 5.13% 4.55% 2.57% Senegal 5.80% 4.69% 0.77%
Estonia 2.06% 1.57% 0.25% Singapore 1.45% 0.79% 0.24%
Ethiopia 0.81% 0.49% 0.10% Slovakia 4.10% 2.04% 0.14%
Finland 1.63% 0.74% 0.02% Slovenia 3.46% 2.33% 0.20%
France 2.97% 2.09% 0.20% Spain 3.83% 3.06% 0.33%
Ghana 1.75% 1.30% ‐0.69% Sri Lanka 2.34% 1.84% 0.15%
Greece 4.11% 3.25% 0.28% Sweden 2.28% 1.19% 0.09%
Guatemala 4.17% 3.77% 1.83% Taiwan 1.04% 0.02% ‐0.68%
Germany 3.01% 2.07% 0.20% Tanzania 4.19% 1.51% 0.37%
Honduras 5.06% 4.64% 2.24% Thailand 1.93% 1.11% ‐0.10%
Hong Kong 2.18% 0.60% ‐0.58% Trinidad Tbg 1.64% 0.72% 0.05%
Hungary 3.50% 2.10% 0.28% Tunisia 5.33% 4.55% 0.87%
Iceland 4.33% 3.55% 0.47% Turkey 4.20% 3.30% 0.36%
India 0.75% 0.22% ‐0.85% Uganda 2.64% 1.42% 0.09%
Indonesia 1.55% 0.85% ‐0.10% Untd.Kingdom 2.40% 1.54% 0.16%
Iran 1.21% 0.14% ‐0.19% Uruguay 6.01% 5.24% 2.57%
Ireland 1.82% 1.29% 0.14% USA 2.33% 1.14% 0.04%
Israel 1.70% 1.07% 0.23% Venezuela 1.97% 0.97% 0.50%
Italy 3.01% 2.15% 0.22% Zambia 4.21% 0.36% ‐0.08%
Japan 1.04% 0.05% ‐0.89%
Jordan 3.16% 0.55% 0.25%
Kazakstan 2.47% 1.89% 0.48% Simple Avg 2.87% 1.95% 0.35%
Kenya 3.81% 3.57% 1.86% Weighted Avg 2.25% 1.37% 0.00%
40
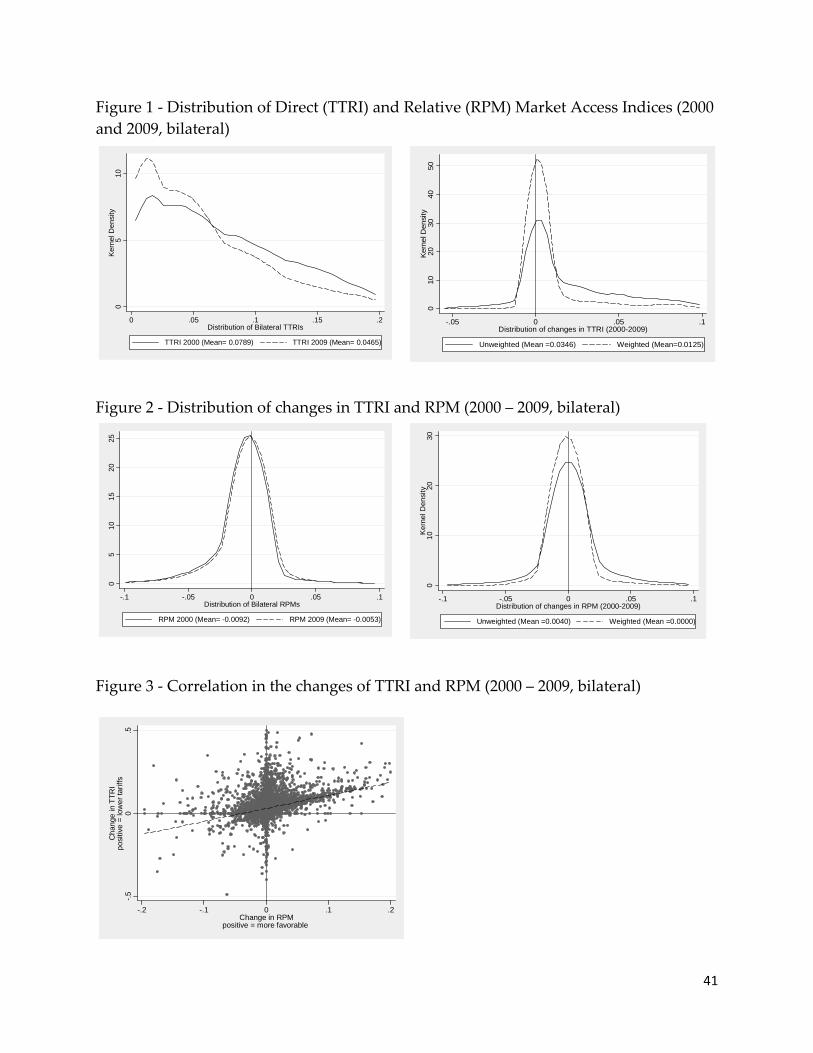
Figure 1 ‐ Distribution of Direct (TTRI) and Relative (RPM) Market Access Indices (2000 and 2009, bilateral)
05
10K
erne
l Den
sity
0 .05 .1 .15 .2Distribution of Bilateral TTRIs
TTRI 2000 (Mean= 0.0789) TTRI 2009 (Mean= 0.0465)
010
2030
4050
Kern
el D
ensi
ty
-.05 0 .05 .1Distribution of changes in TTRI (2000-2009)
Unweighted (Mean =0.0346) Weighted (Mean=0.0125)
Figure 2 ‐ Distribution of changes in TTRI and RPM (2000 – 2009, bilateral)
05
1015
2025
-.1 -.05 0 .05 .1Distribution of Bilateral RPMs
RPM 2000 (Mean= -0.0092) RPM 2009 (Mean= -0.0053)
010
2030
Ker
nel D
ensi
ty
-.1 -.05 0 .05 .1Distribution of changes in RPM (2000-2009)
Unweighted (Mean =0.0040) Weighted (Mean =0.0000)
Figure 3 ‐ Correlation in the changes of TTRI and RPM (2000 – 2009, bilateral)
-.50
.5
Cha
nge
in T
TRI
posi
tive
= lo
wer
tarif
fs
-.2 -.1 0 .1 .2Change in RPM
positive = more favorable
41

ADDITIONAL TABLES – Not to be published
Table A1 – TTRI and RPM (with their bootstrapped standard errors)
TTRI 2000TTRI 2001
SDRPM 2000
RPM 2000 SD
TTRI 2009TTRI 2009
SDRPM 2009
RPM 2009 SD
Algeria 0.006 (0.000) 0.000 (0.000) 0.001 (0.000) 0.000 (0.000)
Argentina 0.083 (0.009) 0.037 (0.008) 0.059 (0.006) 0.024 (0.008)
Australia 0.056 (0.014) ‐0.001 (0.001) 0.039 (0.012) ‐0.001 (0.001)
Austria 0.018 (0.001) 0.006 (0.001) 0.006 (0.001) 0.003 (0.000)
Bangladesh 0.053 (0.008) 0.025 (0.004) 0.040 (0.007) 0.012 (0.005)
Belgium 0.013 (0.001) 0.008 (0.002) 0.005 (0.001) 0.005 (0.001)
Benin 0.082 (0.008) ‐0.011 (0.001) 0.028 (0.001) ‐0.013 (0.001)
Bolivia 0.004 (0.001) 0.036 (0.003) 0.002 (0.000) 0.019 (0.001)
Brazil 0.062 (0.011) 0.014 (0.002) 0.037 (0.006) 0.007 (0.003)
Bulgaria 0.061 (0.010) ‐0.016 (0.007) 0.016 (0.002) 0.004 (0.002)
Cameroon 0.019 (0.002) ‐0.001 (0.001) 0.009 (0.001) 0.001 (0.000)
Canada 0.012 (0.001) 0.008 (0.002) 0.007 (0.001) 0.007 (0.002)
Chile 0.024 (0.002) 0.005 (0.003) 0.006 (0.001) 0.010 (0.002)
China 0.042 (0.007) ‐0.005 (0.002) 0.035 (0.006) ‐0.007 (0.002)
Colombia 0.025 (0.003) 0.011 (0.001) 0.009 (0.003) 0.014 (0.003)
Costa Rica 0.047 (0.011) ‐0.003 (0.003) 0.004 (0.000) 0.014 (0.003)
Cote d'Ivoire 0.038 (0.002) ‐0.009 (0.001) 0.010 (0.000) 0.003 (0.000)
Croatia 0.066 (0.005) ‐0.015 (0.002) 0.009 (0.001) 0.003 (0.001)
Czech Rep 0.064 (0.012) ‐0.012 (0.006) 0.005 (0.001) 0.004 (0.002)
Denmark 0.014 (0.002) 0.005 (0.001) 0.009 (0.001) 0.003 (0.001)
Ecuador 0.056 (0.002) ‐0.004 (0.002) 0.028 (0.002) 0.008 (0.001)
Egypt 0.052 (0.007) ‐0.009 (0.004) 0.027 (0.005) ‐0.002 (0.005)
El Salvador 0.059 (0.008) 0.001 (0.005) 0.001 (0.001) 0.042 (0.002)
Estonia 0.030 (0.004) ‐0.011 (0.002) 0.006 (0.000) 0.005 (0.002)
Ethiopia 0.004 (0.000) 0.001 (0.000) 0.003 (0.000) 0.001 (0.000)
Finland 0.017 (0.001) 0.001 (0.001) 0.010 (0.001) 0.000 (0.001)
France 0.019 (0.004) 0.006 (0.001) 0.009 (0.001) 0.003 (0.001)
Gabon 0.004 (0.000) 0.000 (0.000) 0.002 (0.000) ‐0.001 (0.000)
Ghana 0.026 (0.004) ‐0.006 (0.002) 0.008 (0.001) ‐0.012 (0.002)
Greece 0.022 (0.003) 0.015 (0.003) 0.010 (0.001) 0.005 (0.001)
Guatemala 0.054 (0.008) 0.008 (0.005) 0.014 (0.002) 0.033 (0.003)
Germany 0.021 (0.002) 0.005 (0.002) 0.010 (0.001) 0.003 (0.001)
Honduras 0.068 (0.020) ‐0.006 (0.011) 0.004 (0.001) 0.037 (0.005)
Hong Kong 0.081 (0.006) ‐0.015 (0.002) 0.047 (0.005) ‐0.008 (0.003)
Hungary 0.046 (0.006) ‐0.013 (0.005) 0.007 (0.001) 0.004 (0.001)
Iceland 0.014 (0.001) 0.017 (0.002) 0.009 (0.001) 0.008 (0.002)
India 0.041 (0.006) ‐0.007 (0.002) 0.036 (0.006) ‐0.014 (0.003)
Indonesia 0.049 (0.008) ‐0.001 (0.002) 0.034 (0.007) ‐0.003 (0.003)
Iran 0.034 (0.003) ‐0.003 (0.001) 0.017 (0.004) ‐0.004 (0.001)
Ireland 0.008 (0.001) 0.006 (0.001) 0.010 (0.002) 0.003 (0.001)
Israel 0.011 (0.001) 0.008 (0.002) 0.005 (0.001) 0.005 (0.001)
Italy 0.025 (0.002) 0.007 (0.003) 0.013 (0.001) 0.004 (0.001)
Jamaica 0.054 (0.024) ‐0.017 (0.010) 0.027 (0.023) ‐0.016 (0.018)
Japan 0.055 (0.005) ‐0.012 (0.003) 0.038 (0.003) ‐0.014 (0.002)
Jordan 0.057 (0.009) ‐0.003 (0.002) 0.015 (0.001) 0.005 (0.001)
Kazakstan 0.038 (0.002) 0.000 (0.000) 0.007 (0.001) 0.008 (0.001)
42

Table A1 (cont.) – TTRI and RPM (with their bootstrapped standard errors)
TTRI 2000TTRI 2001
SDRPM 2000
RPM 2000 SD
TTRI 2009TTRI 2009
SDRPM 2009
RPM 2009 SD
Kenya 0.051 (0.007) 0.000 (0.003) 0.008 (0.001) 0.038 (0.005)
Korea 0.062 (0.012) ‐0.011 (0.003) 0.041 (0.008) ‐0.012 (0.003)
Latvia 0.021 (0.002) ‐0.002 (0.001) 0.012 (0.001) 0.000 (0.002)
Lebanon 0.069 (0.004) ‐0.003 (0.001) 0.007 (0.001) 0.013 (0.001)
Lithuania 0.047 (0.007) ‐0.012 (0.006) 0.010 (0.002) 0.005 (0.002)
Madagascar 0.018 (0.002) 0.028 (0.003) 0.008 (0.000) 0.012 (0.001)
Malawi 0.212 (0.005) ‐0.014 (0.001) 0.086 (0.001) 0.044 (0.002)
Malaysia 0.029 (0.005) ‐0.003 (0.001) 0.012 (0.004) ‐0.002 (0.002)
Mauritius 0.084 (0.011) ‐0.025 (0.004) 0.003 (0.000) 0.017 (0.005)
Mexico 0.005 (0.000) 0.018 (0.004) 0.002 (0.000) 0.017 (0.002)
Morocco 0.084 (0.011) ‐0.025 (0.006) 0.012 (0.006) 0.004 (0.007)
Mozambique 0.046 (0.001) 0.012 (0.000) 0.003 (0.000) 0.004 (0.000)
Netherlands 0.010 (0.001) 0.006 (0.001) 0.006 (0.001) 0.003 (0.001)
New Zealand 0.046 (0.006) ‐0.004 (0.002) 0.042 (0.007) ‐0.008 (0.002)
Nicaragua 0.046 (0.012) 0.001 (0.002) 0.007 (0.002) 0.023 (0.007)
Nigeria 0.021 (0.002) ‐0.001 (0.000) 0.004 (0.000) ‐0.002 (0.000)
Norway 0.006 (0.001) 0.003 (0.001) 0.004 (0.001) 0.001 (0.001)
Oman 0.017 (0.001) ‐0.001 (0.000) 0.007 (0.000) 0.000 (0.000)
Pakistan 0.071 (0.007) ‐0.014 (0.003) 0.056 (0.006) ‐0.016 (0.004)
Paraguay 0.009 (0.001) 0.009 (0.005) 0.002 (0.000) 0.010 (0.004)
Peru 0.031 (0.006) ‐0.007 (0.003) 0.009 (0.001) 0.008 (0.003)
Philippines 0.025 (0.005) 0.001 (0.001) 0.020 (0.004) ‐0.002 (0.002)
Poland 0.045 (0.007) ‐0.016 (0.007) 0.007 (0.001) 0.005 (0.002)
Portugal 0.008 (0.001) 0.020 (0.002) 0.006 (0.001) 0.011 (0.001)
Romania 0.071 (0.006) ‐0.016 (0.005) 0.016 (0.002) 0.015 (0.004)
Russia 0.024 (0.004) ‐0.004 (0.001) 0.019 (0.002) ‐0.004 (0.001)
South Africa 0.030 (0.004) ‐0.004 (0.001) 0.018 (0.002) ‐0.001 (0.001)
Saudi Arabia 0.021 (0.001) ‐0.001 (0.001) 0.006 (0.000) 0.000 (0.000)
Senegal 0.033 (0.001) 0.024 (0.005) 0.015 (0.001) 0.011 (0.002)
Singapore 0.021 (0.003) 0.006 (0.001) 0.007 (0.001) 0.004 (0.001)
Slovakia 0.038 (0.002) 0.001 (0.002) 0.006 (0.001) 0.002 (0.001)
Slovenia 0.059 (0.003) ‐0.032 (0.002) 0.007 (0.002) 0.003 (0.001)
Spain 0.020 (0.002) 0.009 (0.002) 0.010 (0.001) 0.005 (0.002)
Sri Lanka 0.074 (0.005) ‐0.008 (0.002) 0.047 (0.003) 0.002 (0.003)
Sweden 0.019 (0.001) 0.002 (0.001) 0.008 (0.001) 0.001 (0.000)
Taiwan 0.051 (0.004) ‐0.007 (0.001) 0.035 (0.003) ‐0.010 (0.001)
Tanzania 0.085 (0.002) ‐0.002 (0.001) 0.015 (0.001) 0.007 (0.002)
Thailand 0.049 (0.015) 0.000 (0.002) 0.033 (0.013) ‐0.002 (0.002)
Togo 0.095 (0.001) ‐0.007 (0.001) 0.023 (0.000) ‐0.001 (0.000)
Trinidad Tbg 0.016 (0.001) 0.014 (0.001) 0.002 (0.000) 0.021 (0.001)
Tunisia 0.075 (0.006) ‐0.025 (0.003) 0.005 (0.000) 0.014 (0.002)
Turkey 0.075 (0.007) ‐0.027 (0.005) 0.021 (0.003) 0.006 (0.004)
Uganda 0.026 (0.001) ‐0.002 (0.001) 0.005 (0.000) 0.001 (0.000)
Untd.Kingdom 0.019 (0.002) 0.004 (0.002) 0.010 (0.001) 0.003 (0.001)
Uruguay 0.026 (0.003) 0.040 (0.007) 0.021 (0.002) 0.036 (0.006)
USA 0.043 (0.008) 0.006 (0.006) 0.034 (0.005) 0.001 (0.003)
Venezuela 0.013 (0.001) 0.008 (0.001) 0.002 (0.000) 0.008 (0.001)
Zambia 0.062 (0.001) 0.006 (0.001) 0.011 (0.000) ‐0.001 (0.000)
43

Table A2– TTRI and RPM with preference utilization only if margin from MFN is larger than 2.5 percentage points (and their difference from uncorrected statistics)
TTRI 2000 (2.5%)
differenceTTRI 2009 (2.5%)
differenceRPM2000 (2.5%)
differenceRPM 2009 (2.5%)
difference
Algeria 0.007 (0.002) 0.002 (0.001) ‐0.001 ‐(0.001) ‐0.001 ‐(0.001)Argentina 0.084 (0.001) 0.060 (0.001) 0.036 (0.000) 0.023 ‐(0.001)Australia 0.056 (0.000) 0.039 (0.000) ‐0.001 (0.000) 0.000 (0.000)Austria 0.018 (0.000) 0.007 (0.000) 0.006 (0.000) 0.003 (0.000)Bangladesh 0.053 (0.000) 0.041 (0.000) 0.028 (0.003) 0.014 (0.002)Belgium 0.014 (0.000) 0.005 (0.000) 0.009 (0.000) 0.005 (0.000)Benin 0.083 (0.001) 0.030 (0.002) ‐0.011 (0.000) ‐0.013 (0.000)Bolivia 0.004 (0.000) 0.003 (0.001) 0.036 (0.000) 0.019 (0.000)Brazil 0.063 (0.001) 0.037 (0.001) 0.014 (0.000) 0.007 (0.000)Bulgaria 0.062 (0.001) 0.016 (0.000) ‐0.015 (0.001) 0.005 (0.000)Cameroon 0.021 (0.002) 0.011 (0.002) ‐0.002 (0.000) 0.000 (0.000)Canada 0.014 (0.003) 0.009 (0.002) 0.007 ‐(0.001) 0.006 ‐(0.001)Chile 0.025 (0.002) 0.008 (0.002) 0.005 (0.000) 0.009 ‐(0.001)China 0.043 (0.001) 0.036 (0.002) ‐0.006 ‐(0.001) ‐0.008 ‐(0.001)Colombia 0.026 (0.001) 0.009 (0.001) 0.011 (0.000) 0.014 (0.000)Costa Rica 0.052 (0.005) 0.006 (0.001) ‐0.004 ‐(0.001) 0.014 (0.000)Cote d'Ivoire 0.040 (0.002) 0.012 (0.002) ‐0.010 ‐(0.001) 0.001 ‐(0.002)Croatia 0.073 (0.007) 0.010 (0.002) ‐0.020 ‐(0.005) 0.002 ‐(0.001)Czech Rep 0.065 (0.001) 0.005 (0.000) ‐0.012 (0.000) 0.004 (0.000)Denmark 0.014 (0.000) 0.009 (0.000) 0.005 (0.000) 0.003 (0.000)Ecuador 0.059 (0.003) 0.029 (0.000) ‐0.004 ‐(0.001) 0.008 (0.000)Egypt 0.054 (0.002) 0.027 (0.000) ‐0.010 ‐(0.001) ‐0.002 (0.000)El Salvador 0.060 (0.001) 0.002 (0.000) 0.001 (0.000) 0.042 (0.000)Estonia 0.036 (0.005) 0.006 (0.000) ‐0.014 ‐(0.004) 0.005 (0.001)Ethiopia 0.006 (0.002) 0.004 (0.001) 0.000 ‐(0.001) 0.000 (0.000)Finland 0.018 (0.000) 0.010 (0.000) 0.002 (0.000) 0.000 (0.000)France 0.019 (0.000) 0.010 (0.000) 0.006 (0.000) 0.003 (0.000)Gabon 0.004 (0.000) 0.002 (0.000) 0.000 (0.000) ‐0.001 (0.000)Ghana 0.029 (0.003) 0.010 (0.003) ‐0.007 ‐(0.001) ‐0.012 (0.000)Greece 0.022 (0.000) 0.010 (0.000) 0.016 (0.001) 0.006 (0.001)Guatemala 0.056 (0.002) 0.014 (0.001) 0.007 ‐(0.001) 0.033 (0.000)Germany 0.021 (0.000) 0.010 (0.000) 0.005 (0.000) 0.003 (0.000)Honduras 0.069 (0.001) 0.004 (0.001) ‐0.006 (0.000) 0.037 (0.000)Hong Kong 0.081 (0.000) 0.047 (0.000) ‐0.015 (0.001) ‐0.007 (0.001)Hungary 0.046 (0.001) 0.008 (0.000) ‐0.012 (0.001) 0.005 (0.000)Iceland 0.014 (0.000) 0.008 ‐(0.001) 0.018 (0.001) 0.008 (0.001)India 0.043 (0.003) 0.036 (0.000) ‐0.009 ‐(0.002) ‐0.014 (0.001)Indonesia 0.051 (0.002) 0.037 (0.002) ‐0.002 ‐(0.001) ‐0.004 ‐(0.001)Iran 0.035 (0.001) 0.018 (0.001) ‐0.004 ‐(0.001) ‐0.005 ‐(0.001)Ireland 0.008 (0.000) 0.010 (0.000) 0.006 (0.000) 0.003 (0.000)Israel 0.013 (0.001) 0.006 (0.001) 0.008 ‐(0.001) 0.004 ‐(0.001)Italy 0.025 (0.000) 0.014 (0.000) 0.008 (0.000) 0.004 (0.000)Jamaica 0.056 (0.002) 0.027 (0.000) ‐0.018 ‐(0.001) ‐0.016 (0.000)Japan 0.055 (0.000) 0.038 (0.000) ‐0.011 (0.001) ‐0.014 (0.001)Jordan 0.058 (0.001) 0.015 (0.001) ‐0.004 ‐(0.001) 0.005 (0.000)Kazakstan 0.039 (0.001) 0.007 (0.000) 0.000 (0.000) 0.009 (0.000)
44
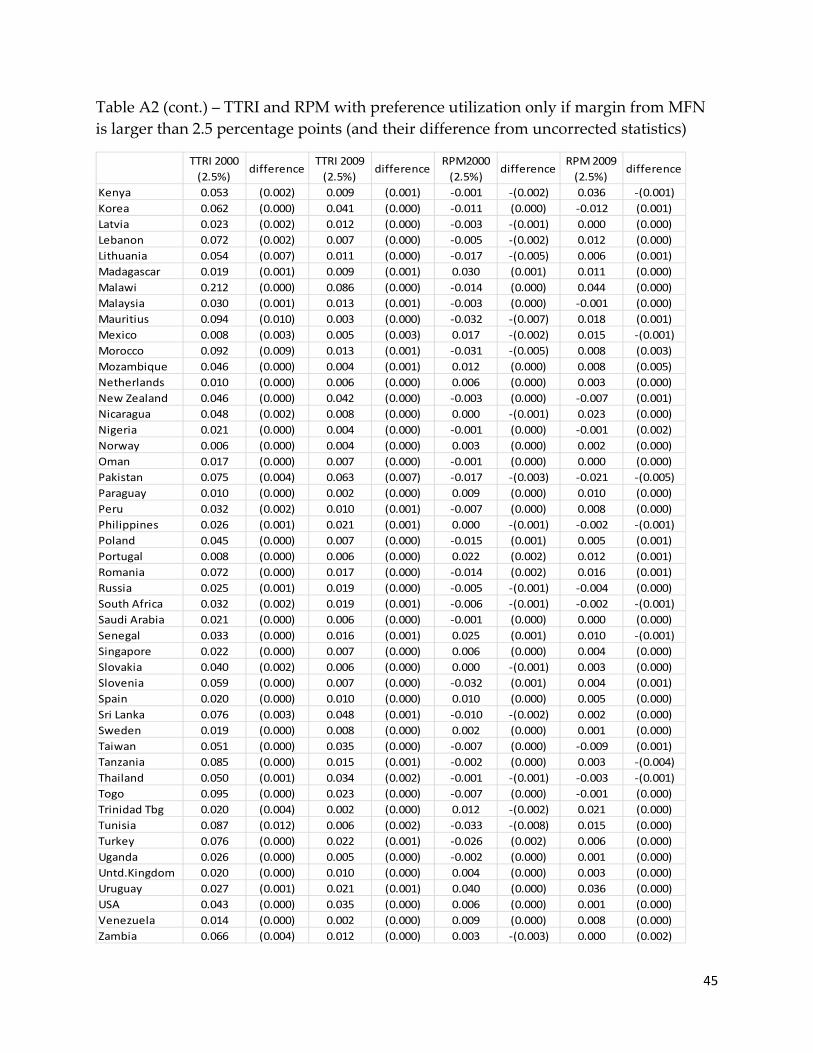
Table A2 (cont.) – TTRI and RPM with preference utilization only if margin from MFN is larger than 2.5 percentage points (and their difference from uncorrected statistics)
TTRI 2000 (2.5%)
differenceTTRI 2009 (2.5%)
differenceRPM2000 (2.5%)
differenceRPM 2009 (2.5%)
difference
Kenya 0.053 (0.002) 0.009 (0.001) ‐0.001 ‐(0.002) 0.036 ‐(0.001)Korea 0.062 (0.000) 0.041 (0.000) ‐0.011 (0.000) ‐0.012 (0.001)Latvia 0.023 (0.002) 0.012 (0.000) ‐0.003 ‐(0.001) 0.000 (0.000)Lebanon 0.072 (0.002) 0.007 (0.000) ‐0.005 ‐(0.002) 0.012 (0.000)Lithuania 0.054 (0.007) 0.011 (0.000) ‐0.017 ‐(0.005) 0.006 (0.001)Madagascar 0.019 (0.001) 0.009 (0.001) 0.030 (0.001) 0.011 (0.000)Malawi 0.212 (0.000) 0.086 (0.000) ‐0.014 (0.000) 0.044 (0.000)Malaysia 0.030 (0.001) 0.013 (0.001) ‐0.003 (0.000) ‐0.001 (0.000)Mauritius 0.094 (0.010) 0.003 (0.000) ‐0.032 ‐(0.007) 0.018 (0.001)Mexico 0.008 (0.003) 0.005 (0.003) 0.017 ‐(0.002) 0.015 ‐(0.001)Morocco 0.092 (0.009) 0.013 (0.001) ‐0.031 ‐(0.005) 0.008 (0.003)Mozambique 0.046 (0.000) 0.004 (0.001) 0.012 (0.000) 0.008 (0.005)Netherlands 0.010 (0.000) 0.006 (0.000) 0.006 (0.000) 0.003 (0.000)New Zealand 0.046 (0.000) 0.042 (0.000) ‐0.003 (0.000) ‐0.007 (0.001)Nicaragua 0.048 (0.002) 0.008 (0.000) 0.000 ‐(0.001) 0.023 (0.000)Nigeria 0.021 (0.000) 0.004 (0.000) ‐0.001 (0.000) ‐0.001 (0.002)Norway 0.006 (0.000) 0.004 (0.000) 0.003 (0.000) 0.002 (0.000)Oman 0.017 (0.000) 0.007 (0.000) ‐0.001 (0.000) 0.000 (0.000)Pakistan 0.075 (0.004) 0.063 (0.007) ‐0.017 ‐(0.003) ‐0.021 ‐(0.005)Paraguay 0.010 (0.000) 0.002 (0.000) 0.009 (0.000) 0.010 (0.000)Peru 0.032 (0.002) 0.010 (0.001) ‐0.007 (0.000) 0.008 (0.000)Philippines 0.026 (0.001) 0.021 (0.001) 0.000 ‐(0.001) ‐0.002 ‐(0.001)Poland 0.045 (0.000) 0.007 (0.000) ‐0.015 (0.001) 0.005 (0.001)Portugal 0.008 (0.000) 0.006 (0.000) 0.022 (0.002) 0.012 (0.001)Romania 0.072 (0.000) 0.017 (0.000) ‐0.014 (0.002) 0.016 (0.001)Russia 0.025 (0.001) 0.019 (0.000) ‐0.005 ‐(0.001) ‐0.004 (0.000)South Africa 0.032 (0.002) 0.019 (0.001) ‐0.006 ‐(0.001) ‐0.002 ‐(0.001)Saudi Arabia 0.021 (0.000) 0.006 (0.000) ‐0.001 (0.000) 0.000 (0.000)Senegal 0.033 (0.000) 0.016 (0.001) 0.025 (0.001) 0.010 ‐(0.001)Singapore 0.022 (0.000) 0.007 (0.000) 0.006 (0.000) 0.004 (0.000)Slovakia 0.040 (0.002) 0.006 (0.000) 0.000 ‐(0.001) 0.003 (0.000)Slovenia 0.059 (0.000) 0.007 (0.000) ‐0.032 (0.001) 0.004 (0.001)Spain 0.020 (0.000) 0.010 (0.000) 0.010 (0.000) 0.005 (0.000)Sri Lanka 0.076 (0.003) 0.048 (0.001) ‐0.010 ‐(0.002) 0.002 (0.000)Sweden 0.019 (0.000) 0.008 (0.000) 0.002 (0.000) 0.001 (0.000)Taiwan 0.051 (0.000) 0.035 (0.000) ‐0.007 (0.000) ‐0.009 (0.001)Tanzania 0.085 (0.000) 0.015 (0.001) ‐0.002 (0.000) 0.003 ‐(0.004)Thailand 0.050 (0.001) 0.034 (0.002) ‐0.001 ‐(0.001) ‐0.003 ‐(0.001)Togo 0.095 (0.000) 0.023 (0.000) ‐0.007 (0.000) ‐0.001 (0.000)Trinidad Tbg 0.020 (0.004) 0.002 (0.000) 0.012 ‐(0.002) 0.021 (0.000)Tunisia 0.087 (0.012) 0.006 (0.002) ‐0.033 ‐(0.008) 0.015 (0.000)Turkey 0.076 (0.000) 0.022 (0.001) ‐0.026 (0.002) 0.006 (0.000)Uganda 0.026 (0.000) 0.005 (0.000) ‐0.002 (0.000) 0.001 (0.000)Untd.Kingdom 0.020 (0.000) 0.010 (0.000) 0.004 (0.000) 0.003 (0.000)Uruguay 0.027 (0.001) 0.021 (0.001) 0.040 (0.000) 0.036 (0.000)USA 0.043 (0.000) 0.035 (0.000) 0.006 (0.000) 0.001 (0.000)Venezuela 0.014 (0.000) 0.002 (0.000) 0.009 (0.000) 0.008 (0.000)Zambia 0.066 (0.004) 0.012 (0.000) 0.003 ‐(0.003) 0.000 (0.002)
45
Related Documents