283 Measuring Factors Determining Private Label Purchase - An Exploratory Factor Analysis (EFA) Approach Jayakrishnan S Assistant Professor - Marketing SDMIMD, Mysuru [email protected] Abstract Indian retail sector has become competitive with the emergence of organized retail players. Currently retailers are focusing on developing their own brands or private labels to enhance customer loyalty, to add diversity and for better margins. The study primarily looks into understanding the consumer preference for Private Labels/Store brands in breakfast cereals, snacks category (Biscuits and traditional snacks) and to measure the factors that determine the store brand purchase in these categories. Consumer responses were collected from the city of Mysore (India) using structured questionnaire. Five point Likert scale was used to measure the factors. Responses were collected from consumers at organized retail outlets and households. Exploratory factor analysis (EFA) was done for measuring the factors that determine private label purchase in breakfast cereals and snacks category. Keywords: : Private labels, Store brands, Price, Price consciousness, Perceived quality, Store image, Value consciousness, Product familiarity, Shelf space allocation.

Welcome message from author
This document is posted to help you gain knowledge. Please leave a comment to let me know what you think about it! Share it to your friends and learn new things together.
Transcript

283
Measuring Factors Determining Private
Label Purchase - An Exploratory Factor
Analysis (EFA) Approach
Jayakrishnan SAssistant Professor - Marketing
SDMIMD, [email protected]
Abstract
Indian retail sector has become competitive with the
emergence of organized retail players. Currently retailers are
focusing on developing their own brands or private labels to
enhance customer loyalty, to add diversity and for better
margins. The study primarily looks into understanding the
consumer preference for Private Labels/Store brands in
breakfast cereals, snacks category (Biscuits and traditional
snacks) and to measure the factors that determine the
store brand purchase in these categories. Consumer
responses were collected from the city of Mysore (India)
using structured questionnaire. Five point Likert scale was
used to measure the factors. Responses were collected from
consumers at organized retail outlets and households.
Exploratory factor analysis (EFA) was done for measuring
the factors that determine private label purchase in
breakfast cereals and snacks category.
Keywords: : Private labels, Store brands, Price, Priceconsciousness, Perceived quality, Store image, Valueconsciousness, Product familiarity, Shelf space allocation.
284
Introduction
The Indian retail industry is estimated at USD 520 Billion
in 2013 and projected to grow at a rate of 13 % and will
have a market size of USD 950 billion by 2018 (E&Y, 2014).
Retail sector has become competitive with the emergence
of organized retail players. Currently retailers are focusing
on developing their own brands or private labels to enhance
customer loyalty, to add diversity and for better margins.
Categories like packaged foods, refined edible oils,
breakfast cereals, ketchups and sauces account for 75% of
total sales of private labels (Hindustan Times, 2013).
Breakfast cereal market in India was pegged at USD 157
million in 2013 and expected to have a double digit
growth over next five years (Techno Pak, 2014). Indian snack
market is valued at 2.1 billion USD in 2014 (Business today,
2014). So this makes these categories attractive to organized
retailers to develop their own private labels or store brands.
The contemporary description about private labels or store
brands given by Nirmalya Kumar and Steen Kamp (2007)
is that private labels are any brand to be produced and
owned by the retailer which is sold exclusively in retailer’s
outlet only. Most of the private label brands are in apparel
segment followed by food, grocery segment, electronics
and home interiors. Future group has private labels in
apparels, electronics, food and personal care segment. Tata
group has own labels in apparels and electronics segment.
We have players like ITC, Koutons, Shoppers stop and other
foreign players like Lifestyle, Zara in apparel segment who
have their own store brands. Reliance group, Aditya Birla
has private labels limited to food, grocery and personal care
285
products. RPG group have private labels in food, personal
care and apparels. Even though private label preference is
increasing it requires an in depth study to understand the
major factors that influence the consumer purchase.
Factors Determining Private Label Purchase
The major factors that determine private label purchase
include price, quality and quality perceptions, product
familiarity, value consciousness, store image and other
store factors like in store promotions, shelf space
allocation and visual merchandizing. Based on the above
factors a study was conducted among consumers of Mysore
to determine the major factors of private label purchase in
breakfast cereals and snack category.
Literature Review
Private label purchase is determined by many factors. When
we consider food segment in general there are multiple
factors that can influence the purchase. These factors may
vary depending on the individual category in the food
segment. The major factors that determine the private
label purchase include consumer factors like perceived
quality and quality, product familiarity, value consciousness,
store factors like Store image, shelf space allocation,
assortment and price.
Price and Price related factors
Price is an important factor determining the private label
purchase. Price is one of the extrinsic cues which

286
determine the private label purchase in food products like
Jams, Jellies, chocolate chip cookies, and regular potato chips
[Burger and Schott (1972), Richardson.et.al, (1994)].
Baltas (1997) in US context looked into factors like shopping
behavior and category involvement and confirmed that
consumers tend to be price sensitive in the purchase of
products in grocery and general merchandise. Sinha and
Batra (1999, 2000) found that category price consciousness
is a highly significant predictor of private label purchase
among US consumers in categories like canned tomatoes,
frozen orange juices, ground coffee etc. Consumers tend to
be less price conscious in categories where perceived risk
is high and price unfairness of national brands compared
to private labels. The study didn’t give an insight into the
pricing of private labels with respect to national brands.
Choi and Coughlan (2004) in US context stated that private
label price in categories like cookies and soups should not
be link to the national brands price and whole sale price,
the pricing need to be based on its quality and variable cost.
So retailers should launch private labels with different prices
targeting different consumer segments. The factors like
price differential and category price was not considered in
this study.
In a different study by Mendez.et.al (2008) in Spain and
Thiel and Romanuik (2009) in Australia concluded that
private label is distinguished from other brands because of
its price only in products like maria cookies, chocolate bars,
jams, sliced bread, packet soups, sliced cheese etc.

287
Jin.et.al (2010) studied about purchasing of breakfast
cereals among American consumers and found that
lower-income shoppers have the highest price sensitivity
only for private label value cereals and higher income
shoppers for national brands.
Berges.et.al (2014) study among French retail consumers
confirmed that consumers are sensitive to price when they
purchase high quality Private labels compared with National
brands in categories like Pasta, biscuits and jam. The study
looked into few categories only. The study by Singh and
agarwal (2013) among consumers of Noida region concluded
that price consciousness and impulse buying determine
private label purchase in food and grocery items. The other
factors like store loyalty and value consciousness also
determine private label purchase. Machavolu and Raju
(2013) studied private label purchase among consumers of
Andhra Pradesh concluded that Price is one major factor
followed by quality that determine private label purchase
in food and apparel segment. Sathya (2013) studied store
brand preference among consumers of Chennai and found
that price, quality, store name, promotions, extrinsic and
intrinsic cue determine purchase in food and grocery
segment.
So price and price-related factors of private labels are one
of the major determinants of private label purchase. So the
study needs to look into the effect of price of private labels
in comparison to national brands in the category.
288
Perceived Quality and Quality
Perceived quality has an important role to play in
determining the private label purchase. It can affect the
consumer perceptions about private labels.
Hoch and Banerjee (1993) in US context considered
consumer- driven, retailer driven, national manufacturer
driven factors and its effect on private label success in food
and frozen foods. The study concluded that high level
intrinsic quality is important than price for private labels. It
has limitations in terms of looking into the quality
differences among private labels and national brands.
Perceived quality differential is one of the major factors
that determine the private label purchase in products like
cheese, cookies, flour, frozen pizza, jams, jellies and
ketchup, among US consumers [Sethuraman and Cole (1999),
Sethuraman (2000)]. Perceived quality differential is lower
when consumer’s familiarity with the store brand increases.
So it has to be reduced to increase private label proneness.
The studies didn’t consider the influence of price and
category risk in determining the quality perceptions of
private labels. Sheinin and Wagner (2003) study in US
context about apparels and tooth paste category found that
perceived quality can be detrimental in purchase of private
label purchase and it is having positive relationship
with price when category risk and retail image is high. The
studies have limitations when we consider the role of
packaging and advertising in determining the private label
purchase.

289
Quality has a significant role in determining the store
brand preferences in grocery category among consumers
of Greece (Baltas and Argouslidis, 2006). Advertising and
packaging was found to be significant in determining the
consumption rate of store brands. The study didn’t explore
the effect of quality labels on improving the consumer’s
perceptions. The study in Indian context by Koshy and
Abhishek (2008) in grocery category concluded that
consumer ’s quality perceptions can be improved by
introducing public quality labels recognized by consumers
which can ensure adequate quality levels for private labels.
The role of packaging and its influence of perceived quality
were not considered in this study. Consumer perception
study in South Africa by (Beneke, 2010) revealed that
perceived quality is one of the major factors influencing
the private label purchase in food based private brands in
categories like tinned goods, cookies, flour and sugar.
Perceived quality is influenced by packaging. Bishnoi and
Kumar (2009) studied the shopping styles of Indian working
women and concluded that quality consciousness, novelty
seeker, price-value consciousness, brand consciousness and
habitual and brand/store loyal determine the purchase
of the brands in packaged food category. Recent study by
Abhishek (2011) in Indian context concluded that
demographic variables and psychographic variables like
quality variation and perceived value for money can
determine private label purchase in apparels. Another study
in Indian context by Sharma.et.al (2011) found that there
is a significant difference in quality between national
and private brands and store image is a key factor that
determines the purchase.

290
The study by Machavolu (2014) among retail consumers of
Reliance retail outlet in Andhra Pradesh concluded that
quality is an important factor that determines private label
purchase in food, grocery and apparel segment. But
this study considered one retail out let only. So we cannot
generalize. Singh (2014) study among retail consumers of
NCR region found that quality and brand image determines
consumer preference of private labels in apparel segment.
The study has limitations with respect to focus on only
one category. Permarupan.et.al (2014) studied Private
label purchase among consumers of Malaysia and concluded
that Familiarity and perceived quality as major factors that
determine store brand purchase in general. This study didn’t
look at any category. Gala and Patil (2013) concluded that
low quality is one factor that reduces PL purchase in
general. The study by Nandi (2013) among consumers
of Kolkata confirmed that quality and reliability are the
major factors that determine private label purchase in
categories like durables, personal care, apparels and
consumable products.
Perceived quality and quality is a major factor affecting
the consumer perception. So retailers need to enhance the
quality image of store brands through minimizing quality
variation by improving packaging and product quality.
Product Familiarity
Familiarity is one among the major factors that influence
store brand purchase. This is determined by product
knowledge and brand comprehension. Store brand

291
familiarity increase with the information available about it
which can increase store brand proneness due to reduction
in perceived risk and perceived quality variation associated
with these brands in products like margarine among US
consumers (Bettman, 1974). The study has not focused
on the role of product familiarity and its consequent effect
on product evaluation. Raju’s (1977) study in US context
concluded that when consumers are familiar with the
products it can enhance the consumer confidence which
can be detrimental for purchase. Product familiarity was
related positively to the degree of confidence in brand
selection in a purchase situation for categories like stereo
receivers. This can be applied to private label also. The study
has limitations in terms of looking into the extent to
which information are available with the consumers and its
influence on purchase decision.
Private label products have limited brand recognition
compared to recognized brand due to lack of information in
general merchandise category among consumers of Israel
(Wolinsky, 1987). This can hinder familiarity of the products
which can affect the product purchase. Non store brand
prone consumers in US show less familiarity with the brands
and tend to believe that store brands are low value and
low quality products in grocery category (Dick.et.al, 1995).
So familiarity of store brands needs to be enhanced by
promotional campaigns to increase the store brand
purchase.
Further study by Richardson.et.al (1996) examined the
effect on familiarity on household store brand proneness
292
in food products like cereal (Hot or Cold),cheeses,
chip dip,cookies,crackers, potato chips, pickles, jams,jellies,
preserves and canned food items among US consumers.
Familiarity with retailer’s private label brands is critical for
private label proneness. The study didn’t look at the effect
of factors like quality, risk on purchase intention even
if consumer is familiar with the product. The effect of
familiarity on store brand purchase intention is partially
mediated by perceived quality in shampoo category among
Malaysian consumers (Sheau-Fen.et.al, 2011). Age
moderates the effects of performance risk, physical risk,
familiarity and perceived quality.
Store Image
Store image is one of the major factors that influence the
purchase of private labels. The consumer perception about
the image of the store has a direct effect on the brand
image of the private label which can determine the
purchase. Store image has different dimensions which
need to be understood to create favourable image in
consumer minds.
Store image is defined in the shopper’s mind, partly by the
functional qualities and partly by an aura of psychological
attributes by Martineau (1958). The major factors that
determine the store image includes layout, architecture,
symbols, colors, advertising and sales personnel. The study
didn’t consider the aspect of merchandise in determining
the store image. Retail store image among US consumers
will depend on the store convenience, fashion, price,
293
selection of merchandise, quality, quantity of sales
personnel and other factors like degree of reward and
punishment associated with these factors (Kunkel and
Berry, 1968). The study didn’t focus on aspects of consumer
self-image and its effect on store image. Doyle and Fenwick
(1974) study in England concluded that consumer may
differ in their perceptions but they choose stores with
images most congruent with their own self-images. This
means store image is influenced by consumer’s self-image.
The study didn’t look into the development and formation
of store image. Store image depends on the price,
merchandise information (core facets), policy and service
(peripheral facets) among US consumers (Mazursky and
Jacoby, 1986). Chowdhury.et.al (1998) study in US context
concluded that employee service, product quality, product
selection, atmosphere, convenience, price and value are
the dimensions that influence the store image.
Store image attributes considered by Chowdhury.et.al
(1998) were taken to study the impact of store image among
Canadian retail consumers in grocery by Collins-Dodd and
Lindley (2003). The study found that store brands are seen
as extensions of the store image and contribute to store
differentiation in the minds of consumers. The study didn’t
look into influence of store image on image of the private
label. Store image and the presence of national brands can
influence the consumer perceptions about private labels
among US consumers in apparel category (Vahie and
Paswan, 2006). The study concluded that convenience, price
and value dimension of store image positively influence
private label image. The above studies never looked on

294
the impact of store image on store loyalty which can be
detrimental for private label purchase. Martenson (2007)
study in Sweden concluded that store image, ambience,
assortment and price dimension influence the store loyalty
and satisfaction. The study stated that factors like store
loyalty and satisfaction can be channelized to enhance
private label purchase in categories like gourmet and
lunch food. The study never focused on the consumer
psychographics and its impact on private label purchase.
Private label attitude is determined factors like positive
store image and money attitude regarding retention
and distrust among Taiwanese consumers (Liu and Wang,
2008) in grocery category. The study didn’t consider the
different dimensions like private label price image and
store image in determining private label purchase in
grocery.
Chandon.et.al (2011) study in France concluded that
store image perceptions and private label price image
perceptions along with factors like value consciousness
and perceived quality determine the private label purchase
in food and groceries. Factors like store image and product
signatureness positively impact consumer ’s quality
perception which determines the private label purchase
(Bao.et.al, 2011) in drugs and electronics among US
consumers. Recent study by Krishna (2011) in Indian
context with respect to apparels concluded that private
label purchase is determined by image of the store, brand
awareness, cheaper prices, discounts, comfort, durability,
ambience and store atmospherics.
295
The study by Gupta.et.al (2014) among retail consumers of
Madhya Pradesh found that brand image of retailer can
influence the perceived quality and risk associated with
private label purchase which can determine the purchase.
It didn’t look into the category factors. Fischer .et.al (2014)
studied private label purchase among German consumers
concluded that private label share is more related to store
loyalty in relatively higher involvement categories. The
study was limited to food and general merchandise. Rathod
and Bhatt (2013) looked into factors that determine private
label purchase among retail consumers of Ahmedabad and
concluded that store image and private label brand image
can influence loyalty which determines the purchase of
store brands. The study was limited to apparel category.
Kumar and Jawahar (2013) study among retail consumers of
Coimbatore concluded that store brand preference depends
on retail patronage. The study was limited to food, grocery
and general merchandise.
Store image has direct and indirect influence on the
consumer perceptions which can be detrimental for store
brand purchase. Retailers need to create a favourable store
image by devising an appropriate pricing strategy for
private labels by increasing the quality, variants of private
labels and improving the in store atmosphere factors.
The image factor can influence the quality perceptions,
prestige factor and store loyalty which can be vital in
influencing the purchase decision.
296
Value Consciousness
Value consciousness is an important factor that determines
the private label purchase. Value is perceived by
consumers differently. Some consumers perceive value as
low price, some others as the benefits they receive from
the products, quality they get for the price they pay and
what they get for what they pay (Zeithaml, 1988).
The factors like value consciousness, price-quality
perceptions, deal proneness, brand loyalty, risk averseness,
coupon usage and response to advertised sale items were
studied in US context by Burton.et.al (1998) in grocery
category. Private label purchase is determined by value
consciousness and deal proneness but price-quality
perceptions and brand loyalty has no effect on purchase.
The study did not consider the effect of personality traits
in determining the private label purchase. Value
consciousness and personality traits like prestige
sensitivity and need for cognition determine private label
purchase among US consumers in products like parmesan
cheese, bread, pasta and ketchup (Bao and Mandrik,
2004).The effect of value consciousness on store brand
perceptions was not focused in this study.
Value consciousness contributes positive to store brand
perceptions and purchase [Harcar.et.al (2006), Kwon.et.al
(2008)] in grocery and products like wine, chocolate,
cornflake cereal and bread, the studies didn’t look into
factors like prior experiences and uniqueness along
with value consciousness in determining the private label
purchase. Value consciousness and prior experiences have

297
a significant influence on the consumer perceptions of US
consumers about store brand which can influence the
purchase decision in grocery category (Kara.et.al, 2009).
Private label consumers of France tend to be value
consciousness and focus on low price of store brands in in
food and groceries (Chandon.et.al, 2011). This study didn’t
look into the effect of value consciousness on quality
aspect of private labels. Value consciousness has a
moderating effect on the quality perception of private
labels which can influence the purchase intention of
private labels among US consumers (Bao.et.al, 2011). Murali
and Gugloth (2013) studied private label purchase
among consumers of Bangalore and concluded that
consumer prefers PLs due to cost effectiveness and belief
that they provide value. Factors like offers, packaging and
unavailability of NBs also influence PL purchase. The study
didn’t focus on any particular category.
Value consciousness is a factor that varies across the
consumer. Some segment of consumers focus on the low
price aspect and others on the quality aspect. So retailers
need to devise strategy which ensures optimal quality and
value pricing based on the target segments which can
improve the consumer proneness to private labels.
Shelf Space allocation
Shelf space allocation is a factor that indirectly affects the
purchase of private label purchase. Shelf space allocation
can enhance the visibility of private labels or store brands.
Retailers always place their store brands in shelves

298
adjacent to National brands. Dursun.et.al (2011) found
that shelf space allocation contributes significantly in
enhancing product familiarity and perceived quality.
Zameer.et.al (2012) stated that Private labels are placed near
to national brands to make consumer.
Limitations of the existing studies
Most of the research studies focused on the price, quality
and category attributes which can vary across the globe.
Other factors like brand variants, promotional schemes,
shelf space allocation and store loyalty programmes were
not studied in Indian context. So these factors need to be
considered for future research and its inter-relationship,
impact need to be investigated.
1) Major studies related with private labels are happened
in US followed by European context. So there is
immense scope of studying about private labels and
different factors that determine the private label
purchase in Indian context.
2) One of the major factors that determine the private
label purchase is the number of variants offered by
private labels. When national brands can offer higher
variety in terms of flavour, packaging and content then
private labels cannot perform well in such category. So
how this factor affects the private label purchase need
to be studied.
3) In store promotions may play a vital role for
influencing the purchase decisions. These promotions
are not limited to discounts and offers. Retailer’s
299
promotional schemes can create awareness about
store brands which may determine the purchase of
these brands. The studies conducted previously have
not considered this factor which needs to be explored.
4) Shelf space allocation and display is also important
for categories like apparel, personal care products
and packaged food products to ensure that it seeks
attention of consumers. Minimal focus is given in most
of the literature regarding this factor. So inclusion of
these factors can help us to understand the store brand
or private label purchase in a better manner.
5) Store loyalty programmes can also influence the store
brand purchase. Initiatives like this can enhance
retailer’s image and consumer confidence in the
retailers which can be a driver for private label
purchase. This factor was not considered in many
studies which need to be explored to understand the
private label purchase in a better manner.
Major studies about private labels were related to US
and European retail business. So there is adequate scope of
studying about private labels and different factors that
determine the private label purchase in Indian context. The
influence of factors like brand variants, promotional
schemes, shelf space allocation, planograms, store loyalty
programmes and FDI inflow in multi-brand retail outlets and
its effect on private labels were not studied in Indian
context. These are the other aspects which need to be
considered for understanding private label purchase among
Indian consumers in a better manner.
300
Nature of the Study
The data collection was done using structured questionnaire
which has 39 items which measured different factors that
determine private label purchase in breakfast cereals and
snacks (Biscuits and Traditional snacks). Consumer responses
were collected from Mysore. Five point Likert scale was used
to measure the factors. The response were collected from
consumers at organised retail outlets and households. Data
analysis was conducted using software packages SPSS V 21.
Objectives of the Study
The objectives of the current research include:-
a) To understand the consumer preference for Private
Labels/Store brands in Breakfast cereals and Snacks
category
b) To measure the factors that moderate the store brand
purchase in these categories.
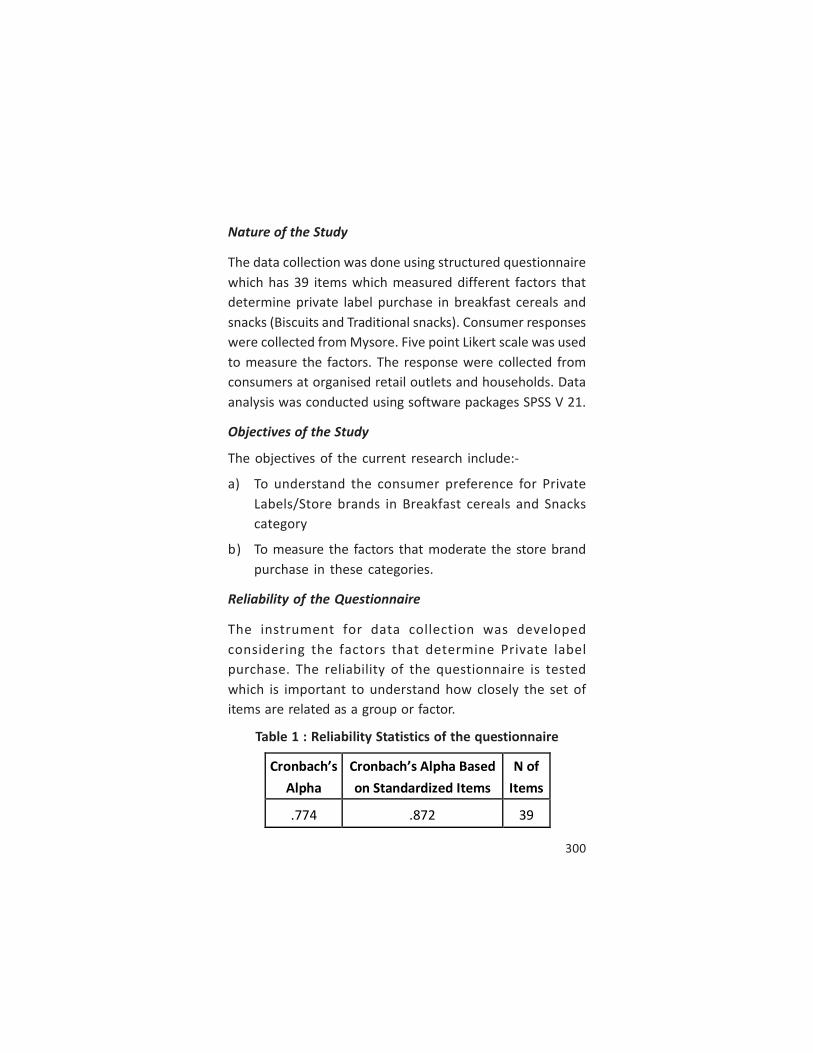
Reliability of the Questionnaire
The instrument for data collection was developed
considering the factors that determine Private label
purchase. The reliability of the questionnaire is tested
which is important to understand how closely the set of
items are related as a group or factor.
Table 1 : Reliability Statistics of the questionnaire
Cronbach’s
Alpha
Cronbach’s Alpha Based
on Standardized Items
N of
Items
.774 .872 39
301
The reliability statistics (Cronbach’s alpha) of the
questionnaire has a value of 0.774 which means high
reliability or high internal consistency.
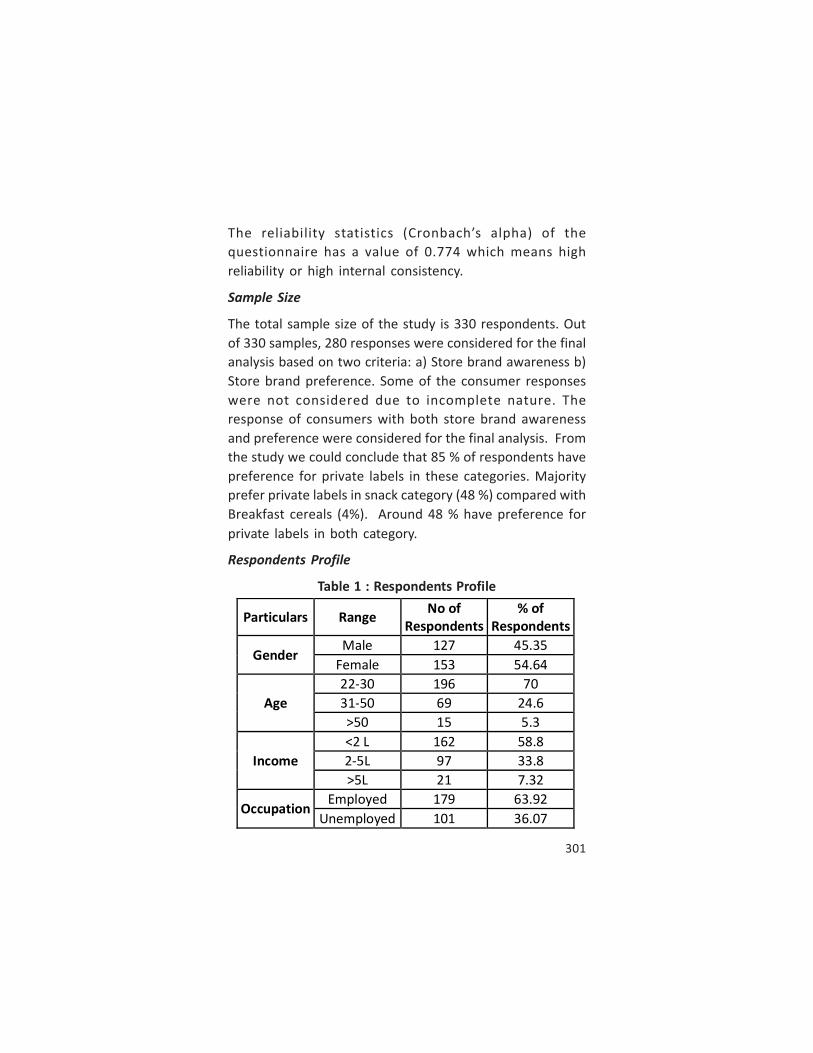
Sample Size
The total sample size of the study is 330 respondents. Out
of 330 samples, 280 responses were considered for the final
analysis based on two criteria: a) Store brand awareness b)
Store brand preference. Some of the consumer responses
were not considered due to incomplete nature. The
response of consumers with both store brand awareness
and preference were considered for the final analysis. From
the study we could conclude that 85 % of respondents have
preference for private labels in these categories. Majority
prefer private labels in snack category (48 %) compared with
Breakfast cereals (4%). Around 48 % have preference for
private labels in both category.
Respondents Profile
Table 1 : Respondents Profile
Particulars Range No of
Respondents
% of
Respondents
Gender Male 127 45.35
Female 153 54.64
Age
22-30 196 70
31-50 69 24.6
>50 15 5.3
Income
<2 L 162 58.8
2-5L 97 33.8
>5L 21 7.32
Occupation Employed 179 63.92
Unemployed 101 36.07
302
Respondents profile can be very important factor that can
determine the purchase of private labels. From Table 1, out
of the 280 valid respondents we have 45.35% are males and
54.64% are females. If we analyses the occupation pattern
63.5% respondents are employed, 3.9% are home makers,
0.7% are retired and 31.7% are students. Around 58.8%
respondents have an income less than 2 lakhs , 33.8%
respondents income is in the range of 2-5 lakhs, 7.32%
respondents and have an income more than 5 lakhs.
Among the 58.8% with an income less than 2 lakhs we have
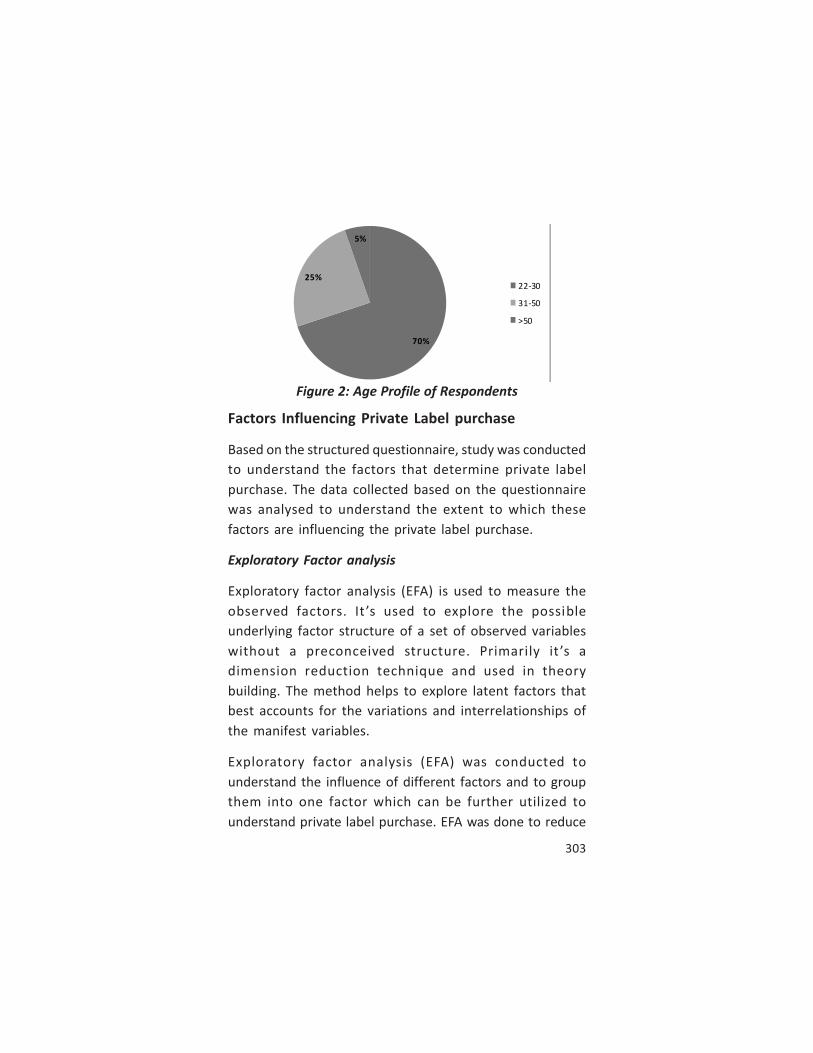
31.7% students. If we analyze the age profile 70% of
respondents are in the age range of 22-30, 25 % of the
respondents belong to an age of 31-50 and 5% respondents
have an age above 50.
Figure 1: Income Pattern of Respondents
58.89%
33.80%
7.32%
<2L
2-5L
>5L
303
Figure 2: Age Profile of Respondents
Factors Influencing Private Label purchase
Based on the structured questionnaire, study was conducted
to understand the factors that determine private label
purchase. The data collected based on the questionnaire
was analysed to understand the extent to which these
factors are influencing the private label purchase.
Exploratory Factor analysis
Exploratory factor analysis (EFA) is used to measure the
observed factors. It ’s used to explore the possible
underlying factor structure of a set of observed variables
without a preconceived structure. Primarily it ’s a
dimension reduction technique and used in theory
building. The method helps to explore latent factors that
best accounts for the variations and interrelationships of
the manifest variables.
Exploratory factor analysis (EFA) was conducted to
understand the influence of different factors and to group
them into one factor which can be further utilized to
understand private label purchase. EFA was done to reduce
70%
25%
5%
22-30
31-50
>50
304
and combine the factor for further analysis. After EFA,
Confirmatory factor analysis (CFA) can be done for
developing a measurement model for understanding
private label purchase. The different factors considered
for the analysis include a) Price b) Perceived quality c)
Familiarity d) Store Image e) Value consciousness f) Shelf
space allocation. The major measures that we will be
focusing in EFA are a) KMO value b) Factor Loadings c)
Communalities.
KMO value (Kaiser-Meyer-Olkin Measure of Sampling
Adequacy) represents the ratio of the squared correlation
between variables to the squared partial correlation
between variables. It measures the adequacy of the sample
for performing the factor analysis. KMO value has to be bare
minimum 0.5 to proceed with the factor analysis. The
minimum KMO value should be 0.5 (Kaiser, 1974) to do the
further analysis. KMO value less than 0.5 should be omitted
from factor analysis (Hair, 2009).
Communality measures the proportion of common variance
within a variable. It provides an idea about the variance
explained by the underlying factors. Higher communalities
more variance is explained by that item. Communalities
should be a minimum of 0.6 when sample size is greater
than 250 (Kaiser’s criterion). But Velicer and Fava (1998)
suggested that in social science we have low to moderated
communalities in the range of 0.4 to 0.7.
Factor Loadings signifies the substantive importance of the
item to that particular factor. The acceptable limit of factor
loading is .30 - .40 range (Positive or Negative) [Hair.et.al,
305
2009]. So for the final analysis we need to consider factor
loadings to group the items as one factor.
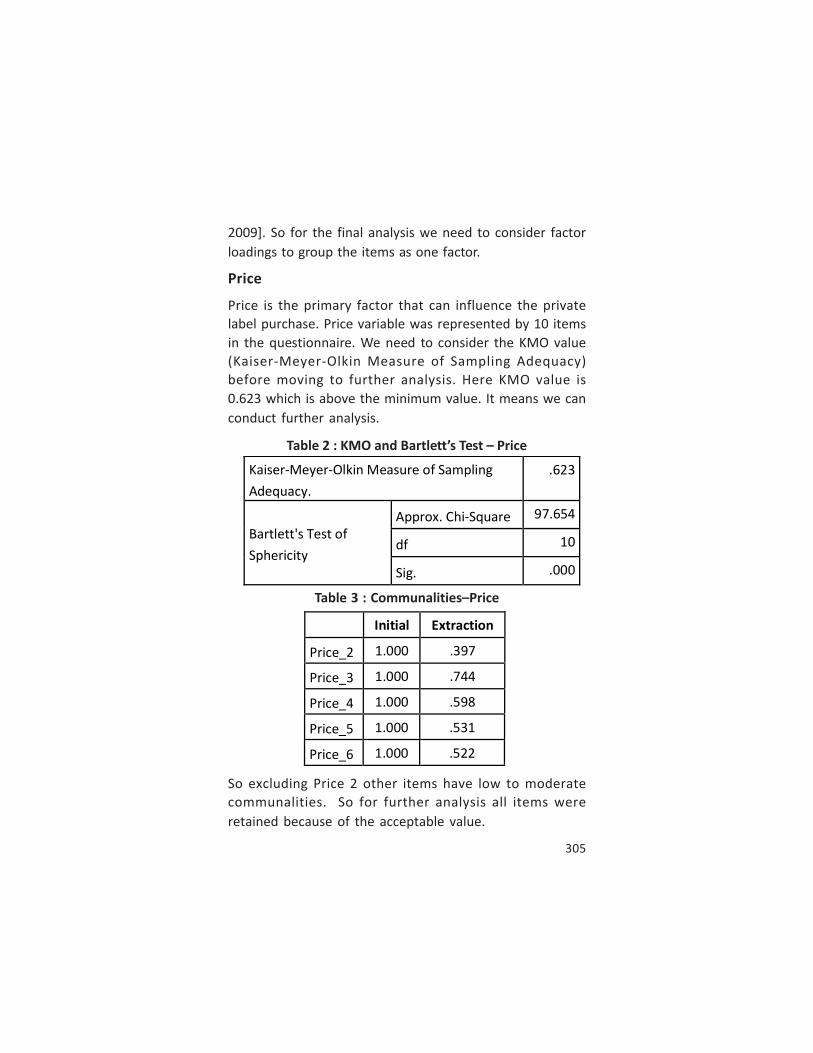
Price
Price is the primary factor that can influence the private
label purchase. Price variable was represented by 10 items
in the questionnaire. We need to consider the KMO value
(Kaiser-Meyer-Olkin Measure of Sampling Adequacy)
before moving to further analysis. Here KMO value is
0.623 which is above the minimum value. It means we can
conduct further analysis.
Table 2 : KMO and Bartlett’s Test – Price
Table 3 : Communalities–Price
So excluding Price 2 other items have low to moderate
communalities. So for further analysis all items were
retained because of the acceptable value.
Kaiser-Meyer-Olkin Measure of Sampling
Adequacy.
.623
Bartlett's Test of
Sphericity
Approx. Chi-Square 97.654
df 10
Sig. .000
Initial Extraction
Price_2 1.000 .397
Price_3 1.000 .744
Price_4 1.000 .598
Price_5 1.000 .531
Price_6 1.000 .522
30
6
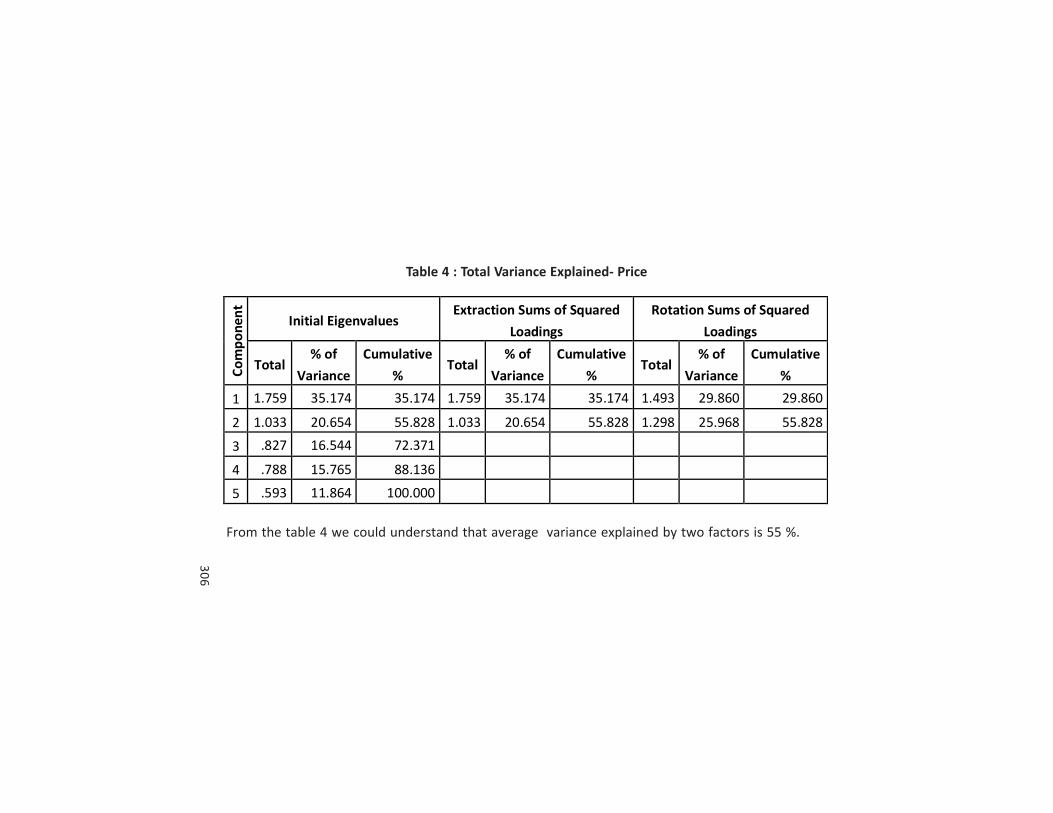
Table 4 : Total Variance Explained- Price
Co
mp
on
en
t
Initial Eigenvalues Extraction Sums of Squared
Loadings
Rotation Sums of Squared
Loadings
Total % of
Variance
Cumulative
% Total
% of
Variance
Cumulative
% Total
% of
Variance
Cumulative
%
1 1.759 35.174 35.174 1.759 35.174 35.174 1.493 29.860 29.860
2 1.033 20.654 55.828 1.033 20.654 55.828 1.298 25.968 55.828
3 .827 16.544 72.371
4 .788 15.765 88.136
5 .593 11.864 100.000
From the table 4 we could understand that average variance explained by two factors is 55 %.
307
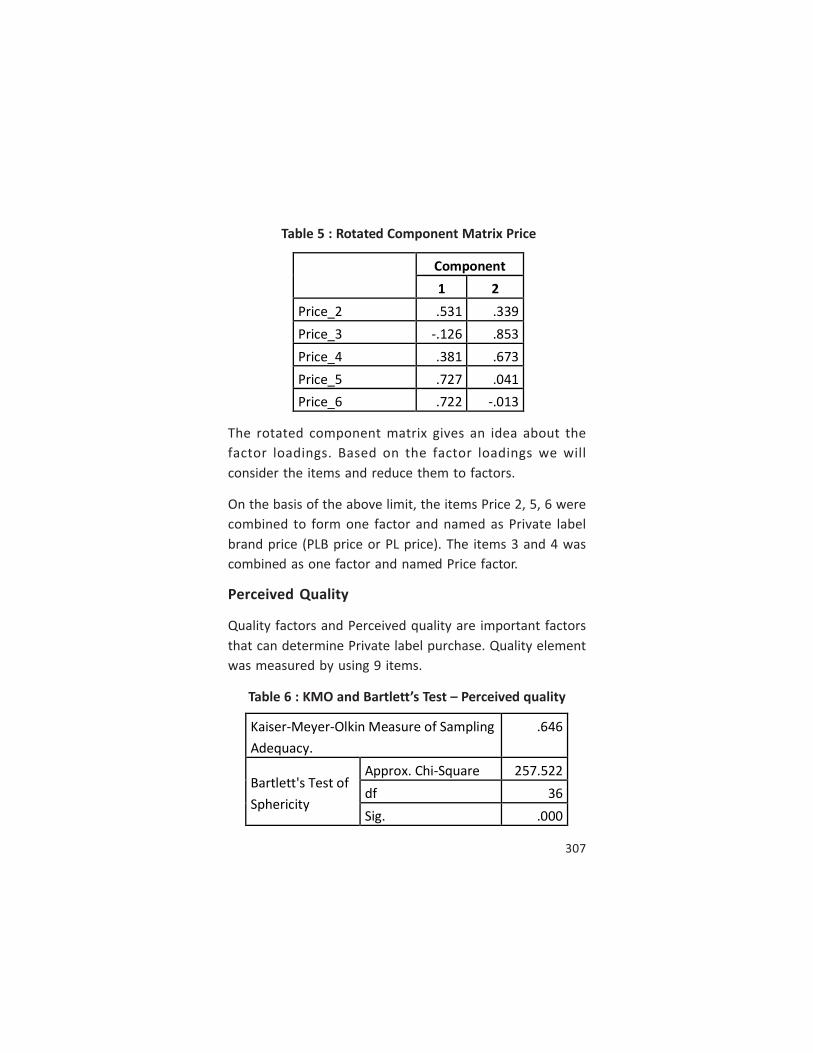
Table 5 : Rotated Component Matrix Price
The rotated component matrix gives an idea about the
factor loadings. Based on the factor loadings we will
consider the items and reduce them to factors.
On the basis of the above limit, the items Price 2, 5, 6 were
combined to form one factor and named as Private label
brand price (PLB price or PL price). The items 3 and 4 was
combined as one factor and named Price factor.
Perceived Quality
Quality factors and Perceived quality are important factors
that can determine Private label purchase. Quality element
was measured by using 9 items.
Table 6 : KMO and Bartlett’s Test – Perceived quality
Component
1 2
Price_2 .531 .339
Price_3 -.126 .853
Price_4 .381 .673
Price_5 .727 .041
Price_6 .722 -.013
Kaiser-Meyer-Olkin Measure of Sampling
Adequacy.
.646
Bartlett's Test of
Sphericity
Approx. Chi-Square 257.522
df 36
Sig. .000
308
From Table 6, KMO value is 0.646 which is in the acceptable
range.
Table 7 : Communalities- Perceived quality
If analyze the communality table, the value ranges between
0.4 to 0.7, which is in the low to acceptable range. So all
items can be retained for further analysis.
Initial Extraction
Quality_7 1.000 .657
Quality_8 1.000 .700
Quality_9 1.000 .522
Quality_10 1.000 .692
Quality_11 1.000 .486
Quality_12 1.000 .714
Quality_13 1.000 .671
Quality_15 1.000 .767
Brand_name_16 1.000 .455

30
9
Table 8 : Total Variance Explained -Perceived quality
Co
mp
on
en
t Initial Eigenvalues
Extraction Sums of
Squared Loadings
Rotation Sums of Squared
Loadings
Total % of
Variance
Cumulat
ive % Total
% of
Variance
Cumula
tive % Total
% of
Variance
Cumula
tive %
1 2.140 23.783 23.783 2.140 23.783 23.783 1.891 21.010 21.010
2 1.453 16.140 39.923 1.453 16.140 39.923 1.370 15.220 36.231
3 1.051 11.679 51.601 1.051 11.679 51.601 1.357 15.073 51.304
4 1.020 11.329 62.930 1.020 11.329 62.930 1.046 11.627 62.930
5 .837 9.296 72.226
6 .772 8.577 80.803
7 .655 7.281 88.084
8 .633 7.034 95.117
9 .439 4.883 100.000
The average variances extracted by 4 components are 62.9%.
310
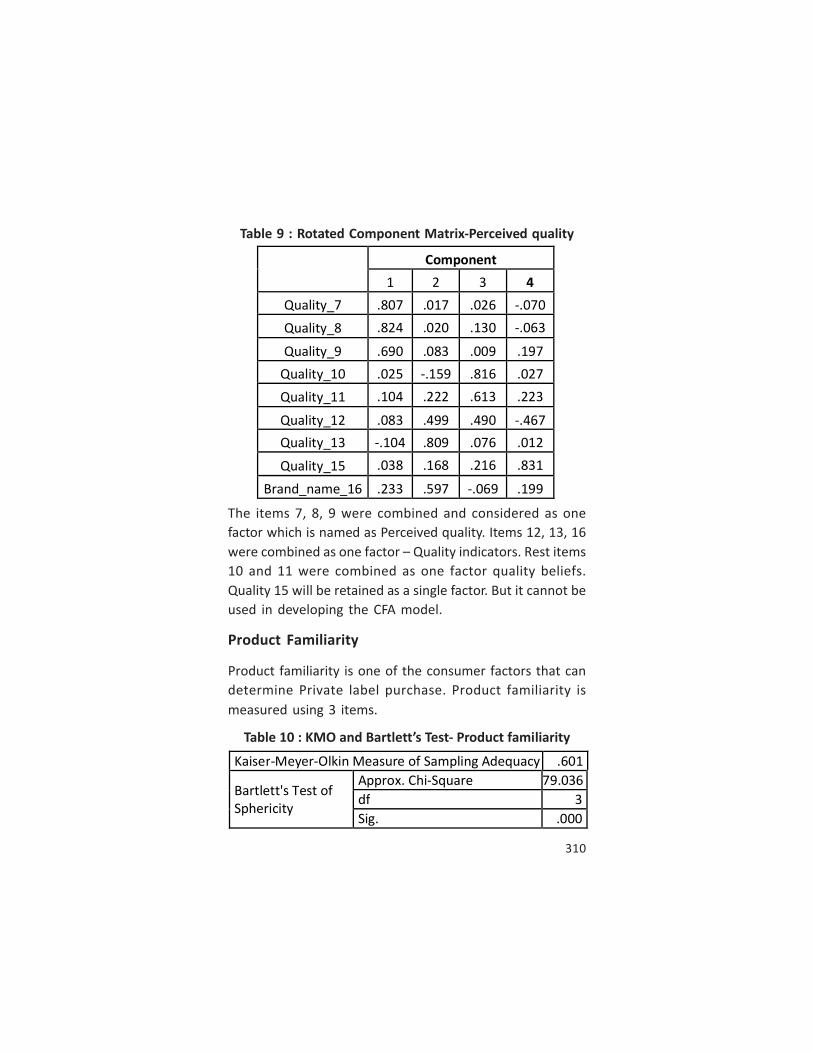
Table 9 : Rotated Component Matrix-Perceived quality
The items 7, 8, 9 were combined and considered as one
factor which is named as Perceived quality. Items 12, 13, 16
were combined as one factor – Quality indicators. Rest items
10 and 11 were combined as one factor quality beliefs.
Quality 15 will be retained as a single factor. But it cannot be
used in developing the CFA model.
Product Familiarity
Product familiarity is one of the consumer factors that can
determine Private label purchase. Product familiarity is
measured using 3 items.
Table 10 : KMO and Bartlett’s Test- Product familiarity
Component
1 2 3 4
Quality_7 .807 .017 .026 -.070
Quality_8 .824 .020 .130 -.063
Quality_9 .690 .083 .009 .197
Quality_10 .025 -.159 .816 .027
Quality_11 .104 .222 .613 .223
Quality_12 .083 .499 .490 -.467
Quality_13 -.104 .809 .076 .012
Quality_15 .038 .168 .216 .831
Brand_name_16 .233 .597 -.069 .199
Kaiser-Meyer-Olkin Measure of Sampling Adequacy .601
Bartlett's Test of
Sphericity
Approx. Chi-Square 79.036
df 3
Sig. .000
311
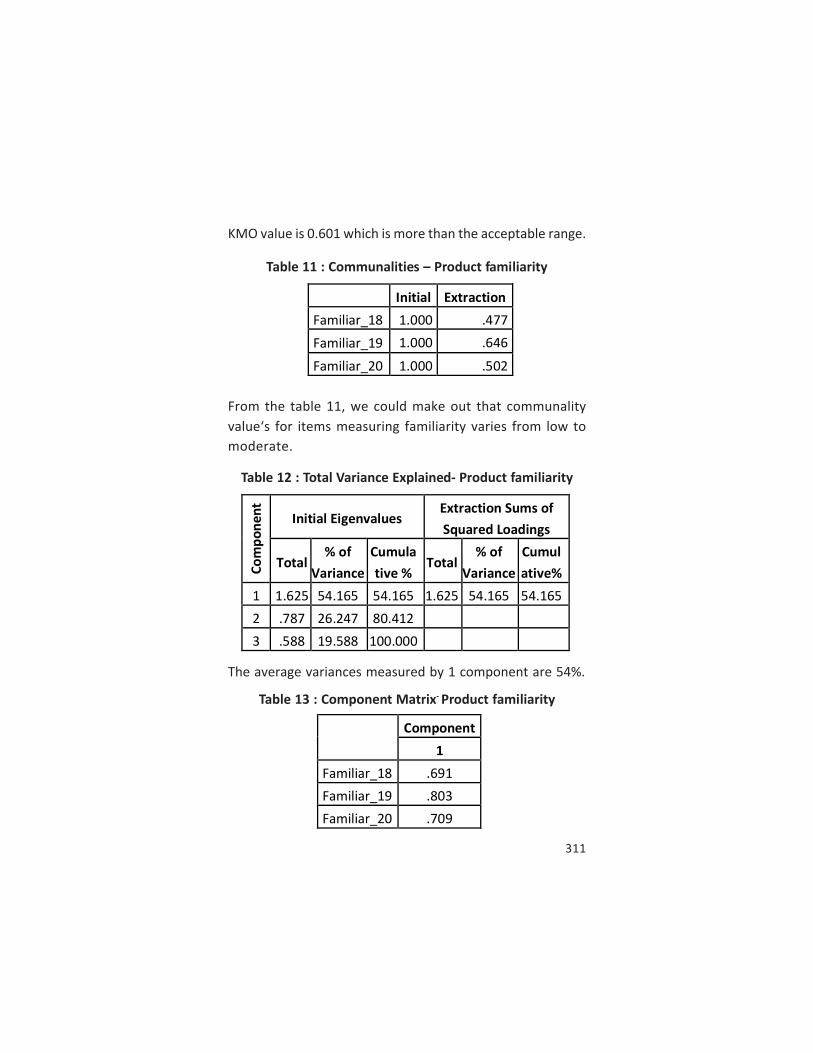
KMO value is 0.601 which is more than the acceptable range.
Table 11 : Communalities – Product familiarity
From the table 11, we could make out that communality
value‘s for items measuring familiarity varies from low to
moderate.
Table 12 : Total Variance Explained- Product familiarity
The average variances measured by 1 component are 54%.
Table 13 : Component Matrix- Product familiarity
Initial Extraction
Familiar_18 1.000 .477
Familiar_19 1.000 .646
Familiar_20 1.000 .502
Co
mp
on
en
t
Initial Eigenvalues Extraction Sums of
Squared Loadings
Total % of
Variance
Cumula
tive % Total
% of
Variance
Cumul
ative%
1 1.625 54.165 54.165 1.625 54.165 54.165
2 .787 26.247 80.412
3 .588 19.588 100.000
Component
1
Familiar_18 .691
Familiar_19 .803
Familiar_20 .709

312
All the components have a loading more than 0.5 which is
higher than the acceptable range.
Store Image
Store image is one of the store factors that directly
influence the private label purchase. Store image is
measured by two items.
Table 14 : KMO and Bartlett’s Test- Store Image
KMO value is 0.5 which is in the acceptable range.
Table 15 : Communalities- Store image
The communalities value is .724 which is higher than
the acceptable range. So these items will be retained for
further analysis.
Kaiser-Meyer-Olkin Measure of Sampling
Adequacy
.500
Bartlett's Test of
Sphericity
Approx. Chi-Square 62.368
df 1
Sig. .000
Initial Extraction
Store_image_26 1.000 .724
Store_image_27 1.000 .724
313
Table 16 : Total Variance Explained- Store Image
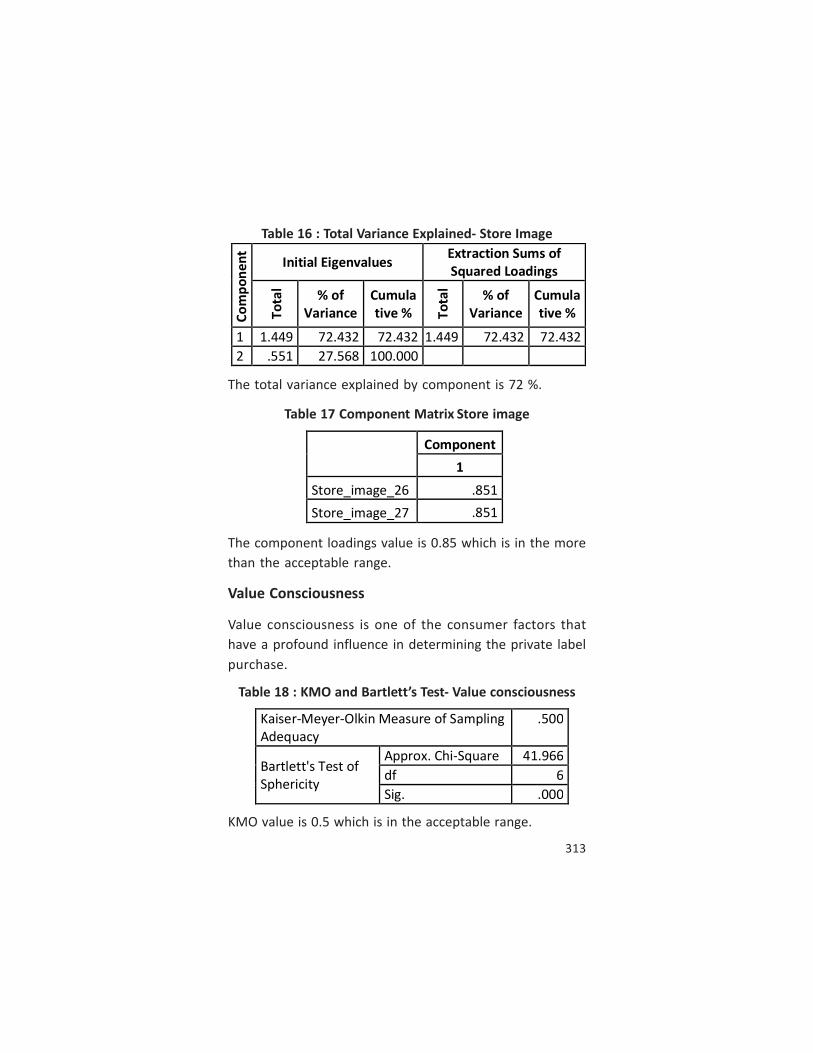
The total variance explained by component is 72 %.
Table 17 Component Matrix Store image
The component loadings value is 0.85 which is in the more
than the acceptable range.
Value Consciousness
Value consciousness is one of the consumer factors that
have a profound influence in determining the private label
purchase.
Table 18 : KMO and Bartlett’s Test- Value consciousness
KMO value is 0.5 which is in the acceptable range.
Component
1
Store_image_26 .851
Store_image_27 .851
Co
mp
on
en
t
Initial Eigenvalues Extraction Sums of
Squared Loadings T
ota
l
% of
Variance
Cumula
tive % To
tal
% of
Variance
Cumula
tive %
1 1.449 72.432 72.432 1.449 72.432 72.432
2 .551 27.568 100.000
Kaiser-Meyer-Olkin Measure of Sampling
Adequacy
.500
Bartlett's Test of
Sphericity
Approx. Chi-Square 41.966
df 6
Sig. .000
314
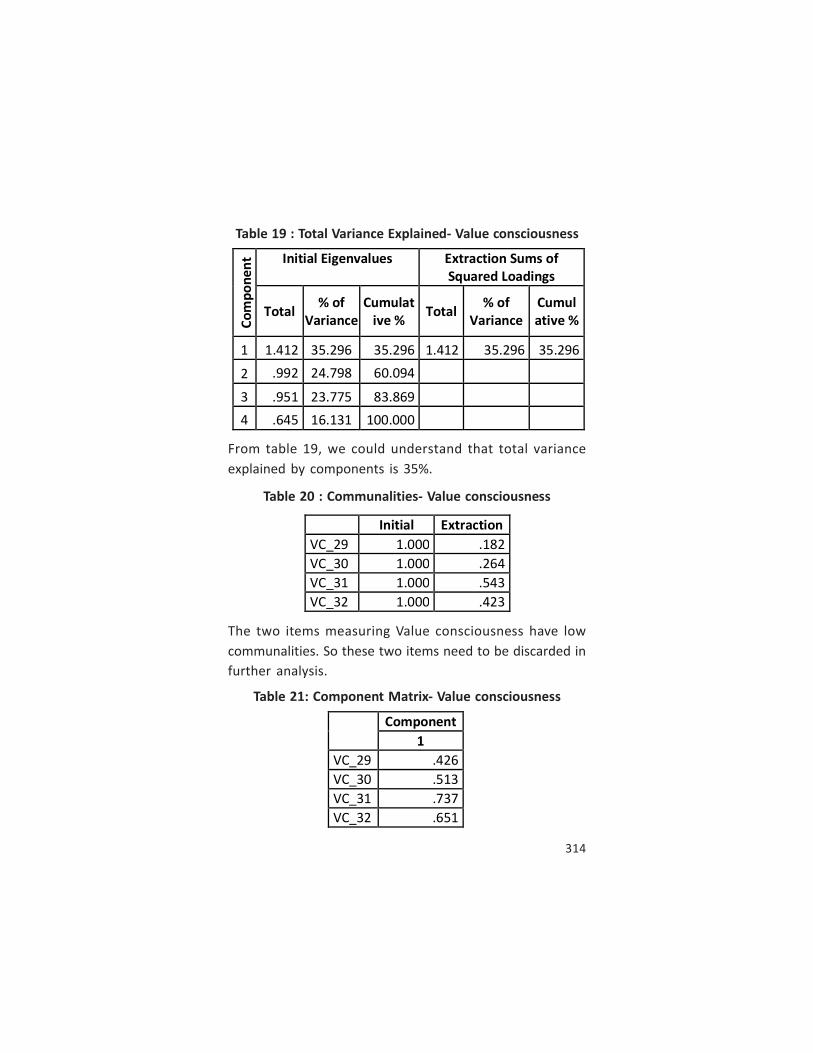
Table 19 : Total Variance Explained- Value consciousness
From table 19, we could understand that total variance
explained by components is 35%.
Table 20 : Communalities- Value consciousness
The two items measuring Value consciousness have low
communalities. So these two items need to be discarded in
further analysis.
Table 21: Component Matrix- Value consciousness
Co
mp
on
en
t Initial Eigenvalues Extraction Sums of
Squared Loadings
Total % of
Variance
Cumulat
ive % Total
% of
Variance
Cumul
ative %
1 1.412 35.296 35.296 1.412 35.296 35.296
2 .992 24.798 60.094
3 .951 23.775 83.869
4 .645 16.131 100.000
Initial Extraction
VC_29 1.000 .182
VC_30 1.000 .264
VC_31 1.000 .543
VC_32 1.000 .423
Component
1
VC_29 .426
VC_30 .513
VC_31 .737
VC_32 .651

315
If look at the component matrix most of them have a factor
loadings more than the acceptable range of 0.4.
Shelf Space Allocation
Shelf space allocation is one major store factor that can
influence private label purchase. The factor shelf space is
measured using two items.
Table 22 : KMO and Bartlett’s Test- Shelf space allocation
KMO value is 0.5 which is in the acceptable range to be
considered for further analysis.
Table 23 : Communalities- Shelf space allocation
Both items have a communalities value of 0.7. So these items
will be retained.
Kaiser-Meyer-Olkin Measure of Sampling
Adequacy.
.500
Bartlett's Test of
Sphericity
Approx. Chi-Square 48.943
df 1
Sig. .000
Initial Extraction
Shelf_space_37 1.000 .701
Shelf_space_38 1.000 .701

316
Table 24 : Total Variance Explained- Shelf space allocation
The total variance explained by one component is 70%.
Table 25 : Component Matrix Shelf space allocation
Both components have a loading of 0.837 which can be used
for further analysis.
Table flows to next page ....
Component
1
Shelf_space_37 .837
Shelf_space_38 .837
Co
mp
on
en
t
Initial Eigenvalues Extraction Sums of
Squared Loadings
Total % of
Variance
Cumul
ative %
Total % of
Variance
Cumul
ative %
1 1.402 70.106 70.106 1.402 70.106 70.106
2 .598 29.894 100.000

317
Items Construct KMO
value
Commun
alities
Variance
explained
(%)
Price_2 Private
label price 0.623
0.397
55.828
Price_5 0.531
Price_6 0.522
Price_3 Price factor
0.744
Price_4 0.598
Quality_7 Perceived
quality
0.646
0.657
62.9
Quality_8 0.700
Quality_9 0.522
uality_10 Quality
Beliefs
0.692
Quality_11 0.486
Quality_12
Quality
Indicator
0.714
Quality_13 0.671
Brand_
name_16 0.455
Familiar_18 Product
Familiarity 0.601
0.477
54.1 Familiar_19 0.646
Familiar_20 0.502
Store_
image_26 Store
Image 0.500
0.724
72.4 Store_
image_27 0.724
VC_29 Value
consciousn
ess
0.500
0.182
35.2 VC_30 0.264
VC_31 0.543
VC_32 0.423
Shelf_
space_37 Shelf space
allocation 0.5
0.701
70.1 Shelf_
space_38 0.701
Table 26 : Summary of EFA results

318
The above table gives us a summary of the EFA. From the
EFA we could conclude that KMO value is in the acceptable
range. It means that sample is adequate for performing
the factor analysis. Another important criteria is the
communalities value, most of the items have communality
value which is in the acceptable range (0.4). But two items
measuring value consciousness (VC-29 and 30) have lower
communality values. So these items need to be removed
for further analysis.
Conclusion
The study conducted provided insights about consumer
preference for private labels in this category. Majority
prefer private labels in snack category (48%) compared
with Breakfast cereals in Mysore city. It also helped us to
understand the factors that determine private label
purchase and to explore the factor structure of the observed
variables. Price was measured using two constructs -
Private Label price and Price factor. Quality was measured
using three constructs – Perceived quality, Quality Beliefs
and Quality Indicator. Familiarity is a major factor that
determines private label purchase which is measured using
three constructs. Store image determines the consumer’s
perception about private labels. So measuring store image
is important which is done by one construct. One of the
important psychological construct that determines private
label purchase is value consciousness. Only two items can
be retained for further analysis. Shelf space can indirectly
influence the consumer preference for private labels. This
is construct measured using two items. Based on the
319
exploratory factor analysis, we were able to narrow down
the items into key factors that determine private label
purchase.
Research Limitations
The current research focus primarily on Breakfast cereals
and snacks, so you cannot generalize this model and apply
to other categories. The scope of study is limited to one city
only.
Managerial Implications
From the study the insight generated was that consumers
have strong preference for private labels. So retailers need
to enhance the private label availability in terms of variants
in different product categories. Retailers need to have a
tactical approach when they price private label brands in
categories like Breakfast cereals and snacks. Retail chains
ensure that consumers are familiar with their premium and
value private labels/store brands which can impact the store
image. They should maintain competitive price and
optimal quality for private labels when compared with
national brands which can influence value-conscious
consumers.
Future Scope of Research
Based on the EFA researchers can develop a CFA
(Confirmatory Factor Analysis) model including other
variables like Instore promotions, Assortment and Customer
Loyalty. CFA is primarily theory or hypothesis driven
(Albright and Park, 2009). It helps to understand and verify

320
the factor structure helps to test the relationship between
observed variables and their underlying latent constructs
(Suhr, 2006). So CFA model can provide insights about the
relationship between these latent factors. Demographic
segmentation based studies can further help to understand
the role of family size , income , occupation and its impact
on private label purchase.
References
ASD. (2013).Indian private labels food and beverages
market forecast & opportunities. 1-64.
Abhishek. (2011). Private label brand choice dynamics
logit model involving demographic and psychographic
variables. Working Papers- IIM-A.
Albright, J. J., & Park, H, M. (2009).Confirmatory factor
analysis using Amos, LISREL, Mplus, and SAS/
STAT CALIS. Indiana University: The University Informa-
tion Technology Services (UITS) Center for Statistical
and Mathematical Computing.
Bacon, L. (1997). Using Amos for structural equation
modelling in market research. SPSS White paper, SPSS
Inc.
Baltas, G. (1997). Determinants of store brand choice: A
behavioral analysis. Journal of Product and Brand
Management, 6(5), 315-324.
Bao,Y., & Mandrik, A. C.(2004). Discerning store brand
users from value consciousness consumers: The role
321
of prestige sensitivity and need for cognition. Ad-
vances in Consumer Research, 31, 707-712.
Bao, Y., Yeng, B., & Sheng, S. (2011). Motivating purchase
of private brands: Effects of store image, product
signatureness and quality variation. Journal of Busi-
ness Research, 64,220–226.
Batra, R., & Sinha, I. (2000). Consumer-level factors
moderating the success of private label brands.
Journal of Retailing, 76, 175 –191.
Bellizzi, J. A., Krueckeberg, H. F., Hamilton, J. R., & Martin,
W. S. (1981). Consumer perceptions of National,
Private and Generic Brands.Journal of Retailing, 57(4),
56-70.
Beneke, J. (2010). Consumer perceptions of private label
brands within the retail grocery sector of South Africa
African. Journal of Business Management, 4(2), 203-
220.
Benito, O. J. (2010). Competitive effect of private labels:
the role of positioning working papers.
Institutd’Economie Industrielle (IDEI) - University of
Toulouse.
Bentler, P. M., & Bonett, D. G. (1980). Significance tests
and goodness of fit in the analysis of covariance
structures. Psychological Bulletin, 88, 588–606.
Bentler, P. M. (1990). Comparative fit indexes in structural
models. Psychological Bulletin, 107, 238–246.

322
Berges.F., Hassan. D., & Dihan, S. V. (2012). Are consumers
more loyal to nationalbrands than to private labels.
Bulletin of Economic research, 1-17.
Bettman, J. R. (1974). Relationship of information-pro-
cessing attitude structures to private brand purchasing
behavior. Journal of Applied psychology, 59(1), 79-83.
Bishnoi, V. K., & Kumar, S. (2009). Packaged food shopping
styles of Indian working women: an empirical
study. 3rd IIMA Conference on Marketing Paradigms for
Emerging Economies,424-438.
Bollen, K. A., & Long, J. S. (1993). Testing structural equa-
tion models (Vol. 154). Sage.
Bollen, K. A. (1989). A new incremental fit index for
general structural equation models. Sociological
Methods and Research, 17, 303–316.
Bowen. N. K., & Guo. S. (2011).Structural equation model-
ling. Oxford University Press, 144.
Burger, P. C., & Schott, B. (1972). Can private brand buyers
be identified.Journal of Marketing Research, 9,219-22.
Business Today. (2014). Parle products bets big on salted
snacks. Retrieved August 30, 2015, from http://
www.businesstoday.in
Burton, S., Lichtenstein, R. D., Netemeyer, G. R., &
Garretson, A. J. (1998). A scale for measuring attitude
toward private label products and an examination of
323
its psychological and behavioral correlates. Journal of
the Academy of Marketing Science, 26(4), 293-306.
Choi, C. S., & Coughlan, A. T. (2004). Private label position-
ing: vertical vs. horizontal differentiation from the
national brand. Working papers, Rutgers University.
Chowdhury, J., Reardon, J., & Srivastava, R. (1998). Alter-
native modes of measuring St Jhinuk ore image: an
empirical assessment of structured versus unstruc-
tured measures. Journal of Marketing Theory and
Practice, 6 (2), 72–86.
Collins-Dodd, C., & Lindley, T. (2003). Store brand and
retail differentiation: the influence of store image and
store brand attitude on store own brand perceptions.
Journal of Retailing and Consumer Services, 10 (6), 345-
352.
Dick, A. S., Jain, A. K., & Richardson, P. S. (1995). Correlates
of store brand proneness: Some empirical observa-
tions. Journal of Product and Brand Management,
4(4), 15 –22.
Doyle, P., & Fenwick, I. (1974).How Store image affects
shopping habits in Grocery chains. Journal of Retail-
ing,50(4), 39-52.
E., Y., & RAI. (2014). Pulse of Indian retail market, Ernst and
young. LLP Publications, 1-16.
Field, A. P. (2005). Discovering statistics using SPSS.Sage
Publications, Fischer, N. K., Cramer. J., & Hoyner, W. D.

324
(2014).Moderating effects of the relationship be-
tween private label share and store loyalty. Journal of
Marketing, 78, 69-82.
Fong, S. W. L., Kian, T. P., & Fern, S. K. (2014). Monetary and
image influences on the purchase decision of private
label products in Malaysia. Journal of Advance Man-
agement Science, 3(4), 312-317.
Gala, D., & Patil, R. D. (2013).Consumer attitude towards
private labels in comparison to national
brands.International Journal of Business and Manage-
ment Invention, 2(5), 12-18.
Garver, M. S., & Mentzer, J. T. (1999). Logistics research
methods: employing structural equation modeling to
test for construct validity. Journal of business logistics,
20(1), 33.
Grunert, K. G. (1997). What’s in a steak? A cross-cultural
study on the quality perception of beef. Food quality
and preference, 8(3), 157-174.
Grunert, K. G., Bredahl, L., & Brunsø, K. (2004). Consumer
perception of meat quality and implications for
product development in the meat sector—a review.
Meat science, 66(2), 259-272.
Gugloth. S., & Murali, L. (2014).Customer’spreference for
purchasing private labels (store brand): a study in
Bengaluru. International Journal of Marketing, Finan-
cial Services & Management Research, 3(8), 1-17.
325
Gupta. S., Jain. R., & Paramal .V. (2014).Study of impact of
brand image of retailers on customers buying decision
of store brands. International Journal of Sales, Retail-
ing and Marketing,3-10.
Gutman, J. (1982). A means-end chain model based on
consumer categorization processes. The Journal of
Marketing, 60-72.
Hair, J. F., Black, W. C., Babin, B. J., Anderson, R. E.,
&Tatham, R. L. (2006). Multivariate data analysis (Vol.
6). Upper Saddle River, NJ: Pearson Prentice Hall.
Harcar, T., Kara, A., & Kucukemiroglu, O. (2006).
Consumer’s perceived value and buying behavior of
store brands: An empirical investigation. The Business
Review, 5(2), 55-62.
Hindustan times. (2013). Focus on home labels – future
group and Tata’s to scale up presence.
Hoch, S. J., & Banerji, S. (1993). When do private labels
succeed?.Sloan management review, 34(4), 57.
Hoelter, J. W. (1983). The analysis of covariance structures
goodness-of-fit indices. Sociological Methods &
Research, 11(3), 325-344.
Hox, J. J., & Bechger, T. M. (1998).An introduction to
structural equation modeling. Family Science Review,
11, 354-373.
Hu, L. T., & Bentler, P. M. (1999). Cutoff criteria for fit
indexes in covariance structure analysis: Conven-

326
tional criteria versus new alternatives. Structural
equation modeling: a multidisciplinary journal, 6(1), 1-
55.
James, L. R., Mulaik, S. A., & Brett, J. M. (1982).Causal
analysis: Assumptions, models, and data (Vol. 1). SAGE
Publications,
Jöreskog, K. G., & Sorbom, D. (1984). LISREL-VI user’s
guide, 3rd ed. Mooresville, IN: Scientific Software.
Kaiser, H. F. (1974).An index of factorial
simplicity.Psychometrika, 39, 31-36.
Kara, A., Rojas-Méndez, J. I., Kucukemiroglu, O., & Harcar,
T. (2009). Consumer preferences of store brands: Role
of prior experiences and value consciousness. Journal
of Targeting, Measurement and Analysis for Market-
ing, 17(2), 127-137.
Koshy, A. (2008). Quality perceptions of private label
brands conceptual framework and agenda for re-
search. Indian Institute of Management, 2-22.
Krishna, C. V. (2011). Determinants of consumer buying
behaviour: an empirical study of private label brands
in apparel retail. Vilakshan: The XIMB Journal of
Management, 8(2).
Kumar, N., & Steenkamp, J. B. E. (2007).Private label
strategy: how to meet the store brand challenge.
Harvard Business Press.
327
Kwon, K. N., Lee, M. H., & Jin Kwon, Y. (2008). The effect of
perceived product characteristics on private brand
purchases. Journal of Consumer Marketing, 25(2),
105-114.
Labeaga, J. M., Lado, N., & Martos, M. (2007). Behavioural
loyalty towards store brands. Journal of Retailing and
consumer services, 14(5), 347-356.
Liu, T. C., & Wang, C. Y. (2008). Factors affecting attitudes
toward private labels and promoted brands. Journal of
Marketing Management, 24(3-4), 283-298.
MacCallum, R. C., Browne, M. W., & Sugawara, H. M.
(1996).Power analysis and determination of sample
size for covariance structure modelling.Psychological
Methods, 1(2), 130-49.
Machavolu, S. K., & Raju, K. V. V. (2013). Consumer orienta-
tion towards store brandsvis-à-vis name brands.IOSR
Journal of Business and Management, 85-93.
Machavolu, S. K. (2014). A study on customer readiness
towards store brands of reliance mart, Nellore,
Andhra Pradesh. Research Journal of Economics and
Business studies, 3(3), 26-35.
Marsh, H. W., Balla, J. R., & McDonald, R. P. (1988).Good-
ness of fit indexes in confirmatory factor analysis:
The effect of sample size. Psychological Bulletin, 103,
391-410.

328
Martineau, P. (1958). The personality of the retail
store.Harvard Business Review, 36, 47– 55.
Martenson, R. (2007).Corporate brand image, satisfaction
and store loyalty. International Journal of Retail &
Distribution Management, 35(7), 544-556.
Mazursky, D., & Jacoby, J. (1986).Exploring the develop-
ment of store images.Journal of Retailing, 62(2), 145-
165.
Mulaik, S. A., James, L. R., Van Alstine, J., Bennet, N., Lind,
S., & Stilwell, C. D. (1989). Evaluation of goodness-of-
fit indices for structural equation
models.Psychological Bulletin, 105(3), 430-45.
Nandi, D. (2013). Organized retailers and consumers
attitude towards PLs: A focus on consumers of
Kolkata.ELK Asia Pacific journal of Marketing and Retail
Management 4(3), 1-10.
Nencyz-Thiel, M., & Romaniuka, J. (2009).Perceptual
categorization of private labels and national brands.
Journal of Product and Brand Management, 18(4),
251–261.
Pandya, A. R., & Joshi, M. A. (2011). A comparative study
on consumers attitude towards private labels: a focus
on Gujarat.The IUP Journal of Marketing Management,
X (1), 19-34.
Permarupan, Y. K., Mohan. M., Mamun, A. L., & Zainol, N.
R. B. (2014). Consumer perceived value and buying

329
behavior of store brands.International Business
Management 8(2), 136-141.
Raju, J. S., Sethuraman, R. K., & Dhar, S. K. (1995). The
introduction and performance of store
brands.Management Science, 41(6), 957-78.
Raju, P. S. (1977). Product familiarity, brand name and
price influence on product evaluation. Advances in
Consumer Research, 04, 64-71.
Rathod, C. B., & Bhatt, N. H. (2014). Determinants of
customer loyalty: a study in the context of private
label apparel stores in India.IUP Journal of Brand
Management XI (1), 47-60.
Richardson, P. S., Jain, A. K., & Dick, A. (1996). Household
store brand proneness: A framework.Journal of
Retailing, 72(2), 159 –185.
Sathya. (2013). Integrating consumer perception factors
towards private labels in food and grocery retail sector
in Chennai region. AP Journal of Economics and
Management, 2(6) 1-15.
Senthilkumar, K. R., & Jawahar, P. D. (2013). Building
private labels into strong bands IUP.Journal of Brand
Management, 43-63.
Sethuraman, R., & Cole, C. (1999). Factors influencing the
price premiums that consumers pay for national
brands over store brands. Journal of Product and
Brand Management, 8(4), 340–351.
330
Sethuraman, R. (2001). What makes consumers pay more
for national brands than for store brands-image or
quality?. Review of Marketing Science WP, (318).
Sharma, K. M., Dubey, D. K., & Pandey, B. D. (2011). Cus-
tomer perception of store brandsVs national brands in
select area of Maharashtra. Journal of engineering,
science and Management Education, (4), 59-65.
Sheinin, D. A., & Wagner, J. (2003). Pricing store brands
across categories and retailers.Journal of Product and
Brand Management, 12(4), 201–219.
Singh. A., & Singh. N. (2014). A comparative study of NB
vs. PLs in apparel segment: A study in NCR region
VSRD.International Journal of Business and Manage-
ment Research, IV (VI), 169-174.
Singh, A. K., & Agarwal, P. K. (2013). Consumer behavior in
organized retail: A empirical study of Noida. Interna-
tional Journal ofManagement research and review,
3324-3331.
Sinha, I., & Batra, R. (1999). The effect of consumer price
consciousness on private label purchase. International
Journal of Research in Marketing 16, 237-251.
Sivo, S. A., Fan, X., Witta, E. L., & Willse, J. T. (2006). The
search for” optimal” cutoff properties: Fit index
criteria in structural equation modelling.The Journal of
Experimental Education, 74(3), 267-288.
331
Steiger, J. H. (2007). Understanding the limitations of
global fit assessment in structural equation modeling.
Personality and Individual differences, 42(5), 893-898.
Steenkamp, J. B. E. (1997). Dynamics in consumer behavior
with respect to agricultural and food products. In
Agricultural marketing and consumer behavior in a
changing world (pp. 143-188).Springer US.
Suhr, D. (2006). The basics of structural equation
modeling.Presented: Irvine, CA, SAS User Group of the
Western Region of the United States (WUSS).
Tanaka, J. S., & Huba, G. J. (1985).A fit index for covariance
structure models under arbitrary GLS estimation.
British Journal of Mathematical and Statistical Psychol-
ogy, 38, 197–201.
Tanaka, J. S. (1993). Multifaceted conceptions of fit in
structural equation models. Sage focus editions, 154,
10-10.
Techno Pak. (2014). The Breakfast Cereals Market in India.
Retrieved 15 March 2016, from http://
www.technopak.com/Files/breakfast-cereals-market-
in-india.pdf
Theodoridis, P. K., &Chatzipanagiotou, K. C. (2009). Store
image attributes and customer satisfaction across
different customer profiles within the supermarket
sector in Greece. European Journal of Marketing, 43(5/
6), 708-734.

332
Vahie, A., & Paswan, A. (2006). Private label brand image:
its relationship with store image and national
brand.International Journal of Retail and Distribution
Management, 34(1),67-84.
Velicer, W. F., & Fava, J. L. (1998). Effects of variable and
subject sampling on factor pattern recovery. Psycho-
logical Methods, 3, 231-251.
Wolinsky, A. (1987). Brand names and price
discrimination.Journal of Industrial Economics, 35(3),
255-268.
Wu, P. C. S., & Yeh, G. Y. (2011). The effect of store image
and service quality on brand image and purchase
intention for private label brands.Australasian Mar-
keting Journal, 19,30-39.
Zeithaml, V. A. (1988). Consumer perceptions of price,
quality, and value: A means-endmodel and synthesis
of evidence. Journal of Marketing, 52(3), 2-22.
Zielke, S., & Dobbelstein, T. (2007).Customers willingness
to purchase new store Brands. Journal of Product &
Brand Management, 16, 112–121.
Related Documents