Measuring Diversity: Mathematical Explorations in Ecology Angela Teachey, NCSSM TCM 2016 January 29, 2016 MAA/Prep Workshop, Summer 2014

Welcome message from author
This document is posted to help you gain knowledge. Please leave a comment to let me know what you think about it! Share it to your friends and learn new things together.
Transcript

Measuring Diversity: Mathematical Explorations in Ecology
Angela Teachey, NCSSM
TCM 2016
January 29, 2016
MAA/Prep
Workshop,
Summer 2014

Who Goes There? Estimating Ocean Populations in Chincoteague Bay
• Appropriate for middle school or high school pre-algebra and algebra classes
• Focus is on quantitative reasoning (ratios and proportions) with algebraic extensions

Part I
• Using data collected on the trawl, :• Classify organisms by trophic levels in the
food chain (information can be given or researched by students)
• Calculate ratios of numbers of organisms in adjacent trophic levels as a measure of energy flow in the ecosystem.

Part I: Next Steps
• Compare the ratios to Lindemann’s Law (10-20% energy transfer between trophic levels)
• Use Lindemann’s Law to approximate the number of organisms in the highest trophic level for the ecosystem where our sample was collected.

Concluding Part I:Scaling Up
Using water volume data from the trawl, we asked students to estimate the number of organisms in each trophic level for the entire Chincoteague Bay
Students are then asked to consider if the results are reasonable and what role humans play in this ecosystem.

Reflections on Part I
• Challenge: Coming to consensus on classification of organisms by trophic levels.
Search tip: “What do hermit crabs eat?”
• Students enjoyed seeing a connection between what they are doing in math class and science.
• The mathematics was not particularly challenging but this part of the activity was successful in engaging the students in the context.
• Students were fascinated by organisms like the Mantis Shrimp.
Who Goes There? Estimating Ocean Populations in Chincoteague Bay: Part II
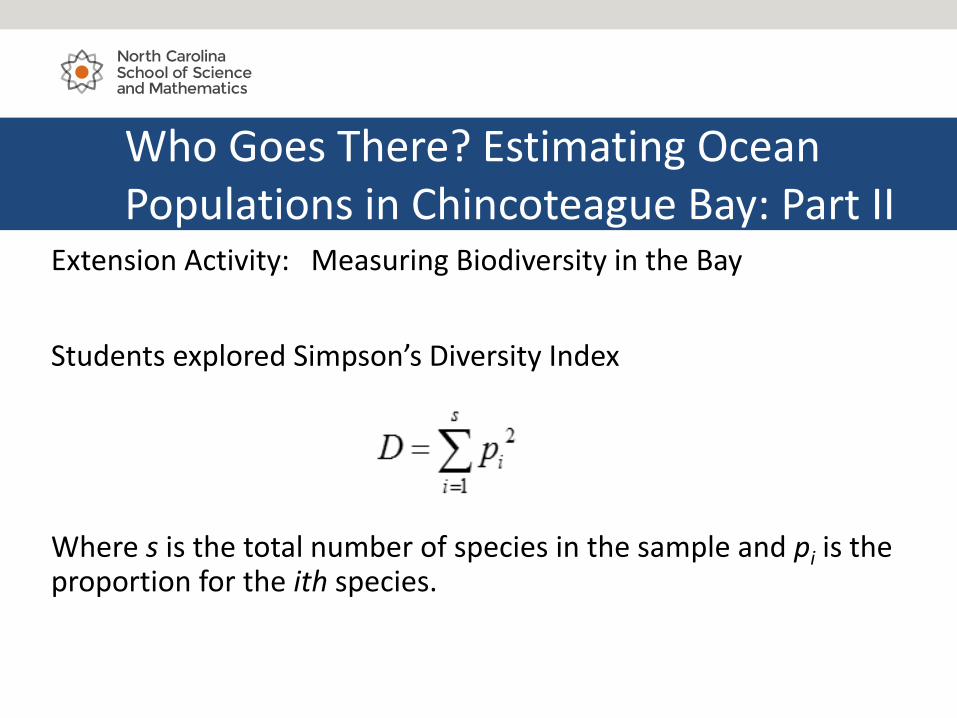
Extension Activity: Measuring Biodiversity in the Bay
Students explored Simpson’s Diversity Index
Where s is the total number of species in the sample and pi is the proportion for the ith species.

The Simpson Index for Biodiversity
• Creating examples for a sample with 100 organisms and 5 species, students calculated Simpson’s Index.
• Designed to help students think about the possible values for D and make sense of these values in context.
• Introduced alternative ways to “view” the index: 1/D or 1 - D

Sample Calculations of Simpson Index
Suppose we have 100 organisms from 5 different species. Let’s
calculate a sample Simpson index.
For Group 4, 𝑖=15 𝑝𝑖
2 =13
100
2+17
100
2+38
100
2+21
100
2+11
100
2= 0.2464

Why square the proportions?
• Students are ask to think about why the proportions are squared before summing.
• Consider alternative of summing other powers of p.
• This leads to a discussion of the behavior of power functions on the interval [0,1].
𝑓 𝑥 = 𝑥2 and 𝑔 𝑥 = 𝑥3

Data from The Trawl
Students used the sample data from the trawl to calculate Simpson’s Index and made some observations about the biodiversity of the bay.

Simpson Index from our Data
There were 26 species and 324 organisms in the
trawl sample.
Simpson Index Calculation:
𝑖=1
26
𝑝𝑖2 =137
364
2
+75
364
2
+40
364
2
+⋯+1
364
2
= 0.2122

Student-Generated Extension
Several groups were interested in determining the highest and lowest possible scores on the Simpson Index given the number of organisms from the trawl in the Chincoteague Bay.
They calculated these indices and used them as baseline values to determine the amount of biodiversity in the bay.
“The Simpson’s index of the Chincoteague Bay was calculated at .2122. We also calculated the minimum and the maximum indices given the types of organisms collected. The minimum was .0385 (the most diverse), and the maximum was .8675 (the least diverse). Given this range, we concluded that the life in the Chincoteague Bay is quite diverse.”

Writing Assignment and Reflections
“In the future, we believe it would be interesting to discuss what the biodiversity index means qualitatively. We know how to calculate it, and that a value closer to zero means that the ecosystem is more diverse, and a value closer to one means that it is less diverse. However, we never talked about what is considered a ‘good’ biodiversity index or if there is such a thing as a ‘good’ biodiversity.”

Student Suggestions for Activity
• Collaborating with other pods/reading their reports to see how they thought about and worked through this problem
• Collecting data ourselves (such as organisms from the bio pond) to create a more personal experience
• Comparing diversity levels in different bodies of water from different areas or comparing diversity levels over a span of a few years to see if it is getting worse or better”

Other Data Analysis Explorations & Collaboration
• Exploring more biodiversity topics with Biology and Ecology teachers at your school and local colleges and universities.
• Exploring other measures of biodiversity - Shannon-Wiener Index.
Other Data Analysis Explorations & Collaboration
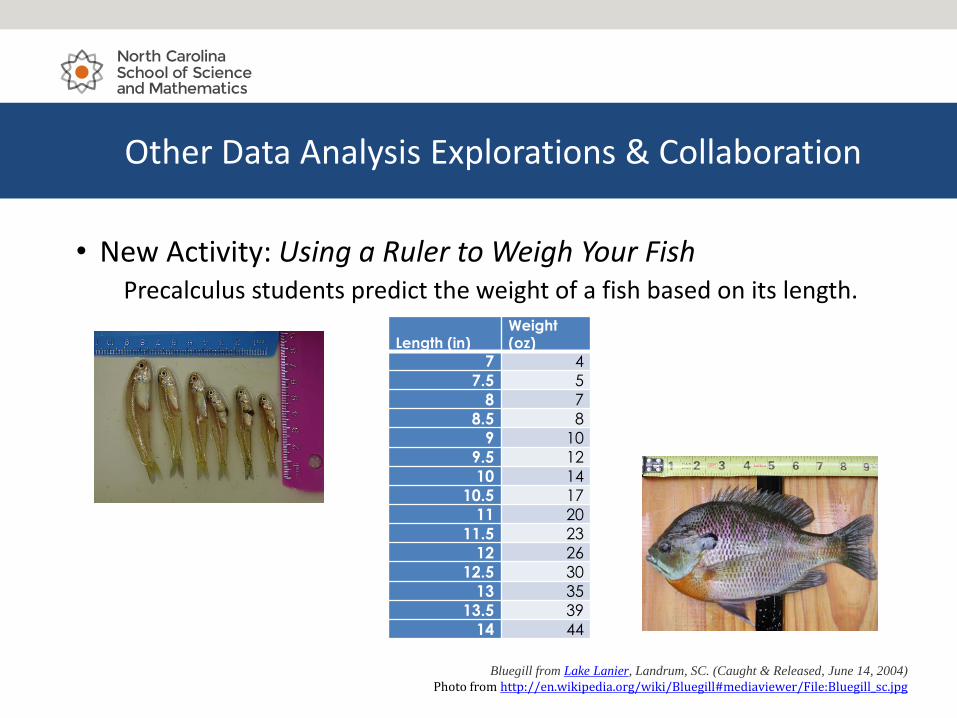
• New Activity: Using a Ruler to Weigh Your FishPrecalculus students predict the weight of a fish based on its length.
Bluegill from Lake Lanier, Landrum, SC. (Caught & Released, June 14, 2004)
Photo from http://en.wikipedia.org/wiki/Bluegill#mediaviewer/File:Bluegill_sc.jpg
Length (in)Weight (oz)
7 4
7.5 5
8 7
8.5 8
9 10
9.5 12
10 14
10.5 17
11 20
11.5 23
12 26
12.5 30
13 35
13.5 39
14 44

Other Data Analysis Explorations & Collaboration
• New Activity: Using a Ruler to Weigh Your FishUsing log-log re-expression, Precalculus students create a power function model for (length,weight) and then predict the weight of a fish based on its length.
NOAA uses this method and you can find lots of data on the web and information on how this relationship varies depending on the type of fish.

Questions, Comments, Discussion
Angela Teachey, [email protected]
Special Thanks to Maria Hernandez and Ben Galluzzo
Website for Editable Handouts: Handouts:
www.ncssm.edu/tcmconference/
Related Documents