sustainability Article Measuring Customer Reservation Price for Maintenance, Repair and Operations of the Metro Public Transport System in Qatar Jaime Larumbe Citation: Larumbe, J. Measuring Customer Reservation Price for Maintenance, Repair and Operations of the Metro Public Transport System in Qatar. Sustainability 2021, 13, 11023. https://doi.org/10.3390/su131911023 Academic Editors: Panagiotis Georgakis, Efthimios Bothos, Babis Magoutas and Michiel de Bok Received: 15 August 2021 Accepted: 22 September 2021 Published: 5 October 2021 Publisher’s Note: MDPI stays neutral with regard to jurisdictional claims in published maps and institutional affil- iations. Copyright: © 2021 by the author. Licensee MDPI, Basel, Switzerland. This article is an open access article distributed under the terms and conditions of the Creative Commons Attribution (CC BY) license (https:// creativecommons.org/licenses/by/ 4.0/). Independent Researcher, 48013 Bilbao, Spain; [email protected] Abstract: Getting to know the price that users assign to maintenance, repair and operations (MRO) has arisen as an essential consideration in gathering financial sustainability for metro public transport systems. The current research reveals customer reservation price for MRO in the main metro stations in Qatar. The purpose of the present work is to assess the willingness to pay for MRO services in eight metro stations in Doha in order to have a better understanding of user preferences. Qualitative research was carried out employing primary and secondary source of information. Primary data was collected by means of a mixture of data accumulation approaches: key informant meetings and focus-group conversations. Secondary data was collected from the account books, contracts, recordings of trans-actions, statements of work and activity reports given by the local rail committees. A stated preference investigation was applied through open text format questions to more than 1000 customers, and a Poisson regression model was used to evaluate the considerations affecting every higher value. Outputs reveal normal customer reservation prices per month and per train journey. The results also indicate a significant willingness to pay differential among the studied railway stations. The study of the decisive considerations elicits that the degree to which the MRO service can exclude paying consumers, the attending of rail conferences and the possibility of using another rail station are related with the customer reservation price. The outputs of this research are significant for railway public authorities willing to set up reasonable, adequate and realistic fares that support fund competent railway systems in Qatar. Keywords: customer reservation price; financial sustainability; metro fares; metro stations; Qatar 1. Introduction Although transport is an agreed enabler of economic growth, the role of sustainable transport is gaining recognition as an enabler of sustainable development. The Railway system is the backbone of sustainable transport. It makes close links to many goals and supporting targets: energy efficiency, resilient infrastructure and access to sustainable trans- port, resilience to climate-related hazards, fostering environmentally sound technologies and multi-stakeholder partnerships [1]. Inappropriate financing of railway MRO could turn into an obstacle for the supply of reliable railway services in some countries of the Middle East [2,3]. Although remarkable progress has been made in recent years, increasing railway service to remote locations [4,5], this has not translated into reliable service delivery [6,7]. Actually, a 2019 International Railway Agency (UIC) report on the average railway service sector functionality rates indicates that a significant amount of railway systems experience interruptions a few years after their implementation [8]. In this situation, present railway development efforts in the Middle East have focused on giving people access to reliable, adequate and competent railway systems for all [9] under the introduction of the Gulf Railway system [10,11]. Accomplishing these objectives requests a deep comprehension of the conditions that allow the long-lasting performance of railway systems [12,13]. In the last years, the national railway policies of several countries have relied on community-based management as the main model for managing railway transport sys- Sustainability 2021, 13, 11023. https://doi.org/10.3390/su131911023 https://www.mdpi.com/journal/sustainability

Welcome message from author
This document is posted to help you gain knowledge. Please leave a comment to let me know what you think about it! Share it to your friends and learn new things together.
Transcript
sustainability
Article
Measuring Customer Reservation Price for Maintenance, Repairand Operations of the Metro Public Transport System in Qatar
Jaime Larumbe
�����������������
Citation: Larumbe, J. Measuring
Customer Reservation Price for
Maintenance, Repair and Operations
of the Metro Public Transport System
in Qatar. Sustainability 2021, 13, 11023.
https://doi.org/10.3390/su131911023
Academic Editors: Panagiotis
Georgakis, Efthimios Bothos, Babis
Magoutas and Michiel de Bok
Received: 15 August 2021
Accepted: 22 September 2021
Published: 5 October 2021
Publisher’s Note: MDPI stays neutral
with regard to jurisdictional claims in
published maps and institutional affil-
iations.
Copyright: © 2021 by the author.
Licensee MDPI, Basel, Switzerland.
This article is an open access article
distributed under the terms and
conditions of the Creative Commons
Attribution (CC BY) license (https://
creativecommons.org/licenses/by/
4.0/).
Independent Researcher, 48013 Bilbao, Spain; [email protected]
Abstract: Getting to know the price that users assign to maintenance, repair and operations (MRO)has arisen as an essential consideration in gathering financial sustainability for metro public transportsystems. The current research reveals customer reservation price for MRO in the main metro stationsin Qatar. The purpose of the present work is to assess the willingness to pay for MRO services ineight metro stations in Doha in order to have a better understanding of user preferences. Qualitativeresearch was carried out employing primary and secondary source of information. Primary datawas collected by means of a mixture of data accumulation approaches: key informant meetingsand focus-group conversations. Secondary data was collected from the account books, contracts,recordings of trans-actions, statements of work and activity reports given by the local rail committees.A stated preference investigation was applied through open text format questions to more than1000 customers, and a Poisson regression model was used to evaluate the considerations affectingevery higher value. Outputs reveal normal customer reservation prices per month and per trainjourney. The results also indicate a significant willingness to pay differential among the studiedrailway stations. The study of the decisive considerations elicits that the degree to which the MROservice can exclude paying consumers, the attending of rail conferences and the possibility of usinganother rail station are related with the customer reservation price. The outputs of this research aresignificant for railway public authorities willing to set up reasonable, adequate and realistic faresthat support fund competent railway systems in Qatar.
Keywords: customer reservation price; financial sustainability; metro fares; metro stations; Qatar
1. Introduction
Although transport is an agreed enabler of economic growth, the role of sustainabletransport is gaining recognition as an enabler of sustainable development. The Railwaysystem is the backbone of sustainable transport. It makes close links to many goals andsupporting targets: energy efficiency, resilient infrastructure and access to sustainable trans-port, resilience to climate-related hazards, fostering environmentally sound technologiesand multi-stakeholder partnerships [1].
Inappropriate financing of railway MRO could turn into an obstacle for the supply ofreliable railway services in some countries of the Middle East [2,3]. Although remarkableprogress has been made in recent years, increasing railway service to remote locations [4,5],this has not translated into reliable service delivery [6,7]. Actually, a 2019 InternationalRailway Agency (UIC) report on the average railway service sector functionality ratesindicates that a significant amount of railway systems experience interruptions a few yearsafter their implementation [8].
In this situation, present railway development efforts in the Middle East have focusedon giving people access to reliable, adequate and competent railway systems for all [9]under the introduction of the Gulf Railway system [10,11]. Accomplishing these objectivesrequests a deep comprehension of the conditions that allow the long-lasting performanceof railway systems [12,13].
In the last years, the national railway policies of several countries have relied oncommunity-based management as the main model for managing railway transport sys-
Sustainability 2021, 13, 11023. https://doi.org/10.3390/su131911023 https://www.mdpi.com/journal/sustainability
Sustainability 2021, 13, 11023 2 of 16
tems [14,15]. The community-based management model underlines the financial respon-sibility of the users to essentially finance the recovery of MRO costs and the long-termreplacement capital [16]. In spite of the support of key railway players such as agencies andgovernments [17–19], recent scrutiny of the long-term performance of railway systems high-lights the weaknesses of the community-based management model [20–22] and calls forenhancements in the financial model. Similarly, many studies assessing railway financingchallenges propose that a lot of users struggle to set up and maintain a system for gatheringuser fees and raise the needed funds for sustainable railway MRO cost recovery [23–25].
Under the community-based management model, users are regularly expected to raiseamounts which are not acceptable by many members, not affordable by vulnerable usersor regularly impracticable as it comes from productive-seasons-based income [26–33].
Several other authors [34–38] have highlighted the necessity of a new model wherecost sharing arrangements between users and railway agencies could provide reliablerailway service. In addition, international organisations [39–41] recommend an increasein external financial support to supplement user contributions and ensure the financialsustainability of the railway projects. The purpose of the new model is a partial recovery ofMRO costs through user fares while transfers from private contributions would bear somemajor repairs, rehabilitation and replacements.
Regarding this, the UIC railway sector evaluation report highlighted the urgency for abetter comprehension of user preferences in the form of customer reservation price. Thereport finds that an enhanced understanding of users’ willingness to pay will supportrailway agents in establishing correct and affordable fares, which translates into sustainableMRO cost recovery [42–44].
Considering this, the purpose of the present work is to assess the willingness to payfor MRO services in eight metro stations in Doha in order to have a better understandingof user preferences. To the extent of the authors’ knowledge, there is no reported studyon users’ demand for improved railway services in Qatar. The railway agencies in chargeof the infrastructures in the city of Qatar for the last years, Qatar Rail and RKH Qitarat,grew concerned about the acute financial challenges for reliable railway service provision.These railway agencies try to set new fares with the users that can be reasonable, adequateand realistic. For this goal, it is necessary to gain a thorough understanding of the users’willingness to pay for MRO services. This is the purpose of the present work.
The paper is structured as follows. The next section presents the materials andmethods of the investigation. After that, the results of the research are described. Finally,the paper concludes with a discussion of key findings and a conclusion.
2. Materials and Methods2.1. Research Area
Qatar is a country placed in Western Asia, covering the tiny Qatar Peninsula on thenortheastern shoreline of the Arabian Peninsula [45,46]. Its only land frontier is withadjacent Gulf Cooperation Council (GCC) monarchy Saudi Arabia to the south, with therest of its area included in the Persian Gulf.
At the beginning of 2017, Qatar had 2.6 million inhabitants: 313,000 Qatari citizensand 2.3 million expatriates [47]. Islam is the official religion of Qatar [48]. In terms ofincomes, the country has the third highest GDP per capita in the world [49], and the sixthhighest GNI per capita [50]. Qatar is identified by the UN as a country of very high humandevelopment, having the third highest HDI in the Arab world following the United ArabEmirates and Saudi Arabia [51]. Qatar is a World Bank high-income economy, supportedby the world’s third-biggest natural gas reserve and oil reserve [52]. Qatar is the world’sbiggest issuer of greenhouse gasses per capita [53].
In comparison with its size, Qatar has a disproportionate weight in the world andhas been classified as a middle power [54,55]. The 2022 FIFA World Cup will take placein Qatar, making it the first Muslim and Arab country to welcome the championship [55].The 2030 Asian Games will be also held in Qatar [56]. With a quick-expanding population
Sustainability 2021, 13, 11023 3 of 16
and important economic rise over the last years, a reliable and widespread transportationnetwork is becoming progressively needed within Qatar. So far, the government, theprimary transport developer, has done well in regard to catching up with the demand fornew transportation possibilities.
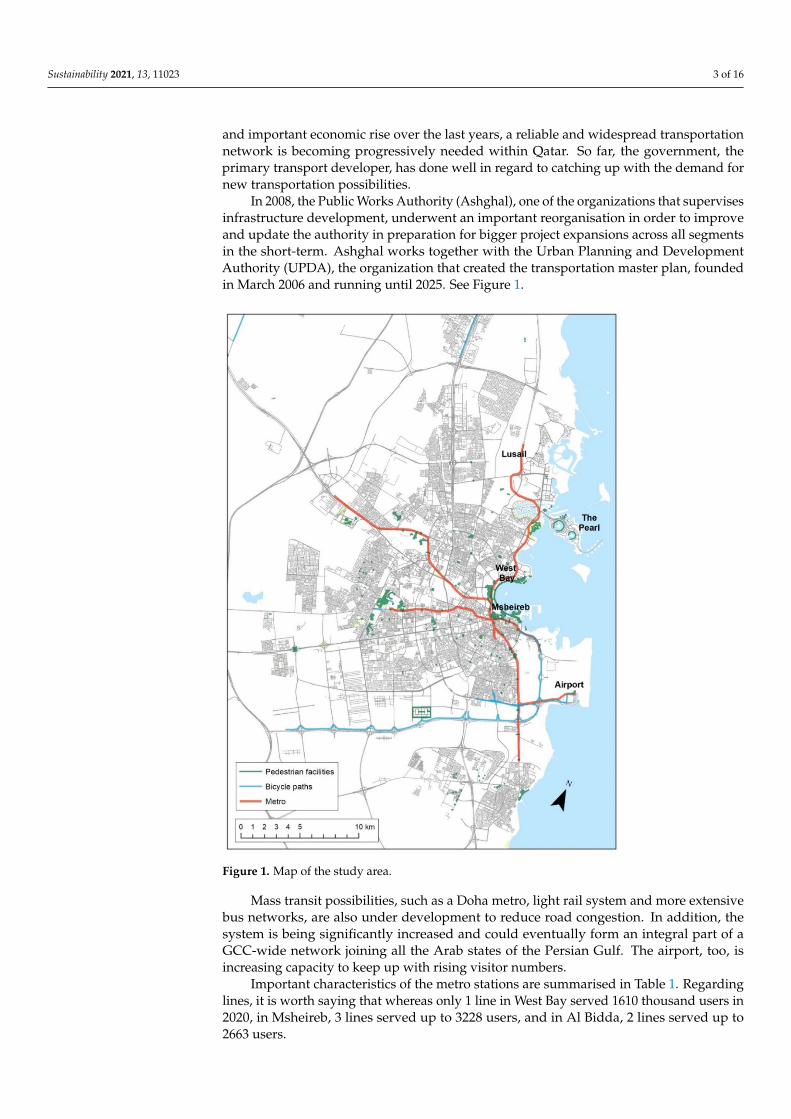
In 2008, the Public Works Authority (Ashghal), one of the organizations that supervisesinfrastructure development, underwent an important reorganisation in order to improveand update the authority in preparation for bigger project expansions across all segmentsin the short-term. Ashghal works together with the Urban Planning and DevelopmentAuthority (UPDA), the organization that created the transportation master plan, foundedin March 2006 and running until 2025. See Figure 1.
Sustainability 2021, 13, x FOR PEER REVIEW 3 of 16
development, having the third highest HDI in the Arab world following the United Arab Emirates and Saudi Arabia [51]. Qatar is a World Bank high-income economy, supported by the world’s third-biggest natural gas reserve and oil reserve [52]. Qatar is the world’s biggest issuer of greenhouse gasses per capita [53].
In comparison with its size, Qatar has a disproportionate weight in the world and has been classified as a middle power [54,55]. The 2022 FIFA World Cup will take place in Qatar, making it the first Muslim and Arab country to welcome the championship [55]. The 2030 Asian Games will be also held in Qatar [56]. With a quick-expanding population and important economic rise over the last years, a reliable and widespread transportation network is becoming progressively needed within Qatar. So far, the government, the pri-mary transport developer, has done well in regard to catching up with the demand for new transportation possibilities.
In 2008, the Public Works Authority (Ashghal), one of the organizations that super-vises infrastructure development, underwent an important reorganisation in order to im-prove and update the authority in preparation for bigger project expansions across all segments in the short-term. Ashghal works together with the Urban Planning and Devel-opment Authority (UPDA), the organization that created the transportation master plan, founded in March 2006 and running until 2025. See Figure 1.
Figure 1. Map of the study area.
Figure 1. Map of the study area.
Mass transit possibilities, such as a Doha metro, light rail system and more extensivebus networks, are also under development to reduce road congestion. In addition, thesystem is being significantly increased and could eventually form an integral part of aGCC-wide network joining all the Arab states of the Persian Gulf. The airport, too, isincreasing capacity to keep up with rising visitor numbers.
Important characteristics of the metro stations are summarised in Table 1. Regardinglines, it is worth saying that whereas only 1 line in West Bay served 1610 thousand users in2020, in Msheireb, 3 lines served up to 3228 users, and in Al Bidda, 2 lines served up to2663 users.
Sustainability 2021, 13, 11023 4 of 16
Table 1. Characteristics of the train station and the sample [57].
Station 2020 Lines Number of Lines Users per Month in 2020 (Thousand)
Msheireb Red, gold, green 3 3228Souq. Waqif Gold 1 908
Lusail Red 1 361Hamad Intl. Airport Red 1 1744
West Bay Red 1 1610Corniche Red 1 729
Hamad Hospital Green 1 256Al Bidda Red, green 2 2663
2.2. Data Analysis Framework
In data analytics, the framework allows you to move through data analysis in anorganized way.
During the last decade, a number of studies eliciting customer reservation price forrailway services have emerged [58–60]. This interest responds to a historical lack of specificinformation on community demand for improved railway services in developing countries.In order to implement reliable services, it is necessary to gain a better understanding ofthe economic value assigned by the users to the improved services [2,44,61]. It is equallycrucial to determine the factors conditioning that value.
In this paper, the concept of customer reservation price refers to the stated price thatan individual would accept to pay for avoiding the loss or the diminution of a non-marketservice [62,63].
The empirical literature on users’ preferences for railway services indicates a greatvariety of approaches and analytical techniques for measuring customer reservation price.The main two categories are the Revealed Preference and Stated Preference. In the RevealedPreference approach, the authors perform experiments or simulate price-response data [64].In the Stated Preference approach, authors employ survey techniques based on hypotheticalchoices for estimating customer reservation price [65]. Within the Stated Preference option,we can differentiate Direct and Indirect Surveys [66]. To perform Indirect Surveys, aranking procedure is applied [67]. To perform Direct Surveys, 3 elements are involved:a detailed description of the service offered, a description of how the service would beprovided and a method for eliciting preferences for the services [68]. The direct approachis referred to as Contingent Valuation Method (CVM) and despite controversies [69,70], ithas become one of the most widely used techniques for valuing non-market goods [71,72].The present research investigates users’ preferences for improved railway services througha CVM survey.
2.3. Data Gathering Strategy2.3.1. Qualitative Research
Qualitative research was carried out employing primary and secondary source ofinformation. It pursued assessing the degree to which the MRO service can exclude payingconsumers and reaching an improved comprehension of the variables to incorporate forthe quantitative research. Primary data was collected by means of a mixture of dataaccumulation approaches: key informant meetings and focus-group conversations. Thus,10 key informant meetings took place at the headquarters of Qatar Rail (QR) applyinga structured procedure. The key informants were chosen to compare the stakeholders’views between local authorities accountable for inspection of the metro stations, railwaytechnician people in charge of the control and maintenance of the railway systems, socialpublic authorities responsible for the report of the accounts of the railway services andrailway committee board members. The data collected had to do with service supply, useof rail transport, organization and control of railway resources.
Focus-group conversations also took place at the headquarters of QR to collect qual-itative data. The conversations were held at an early phase of the field survey. The aim
Sustainability 2021, 13, 11023 5 of 16
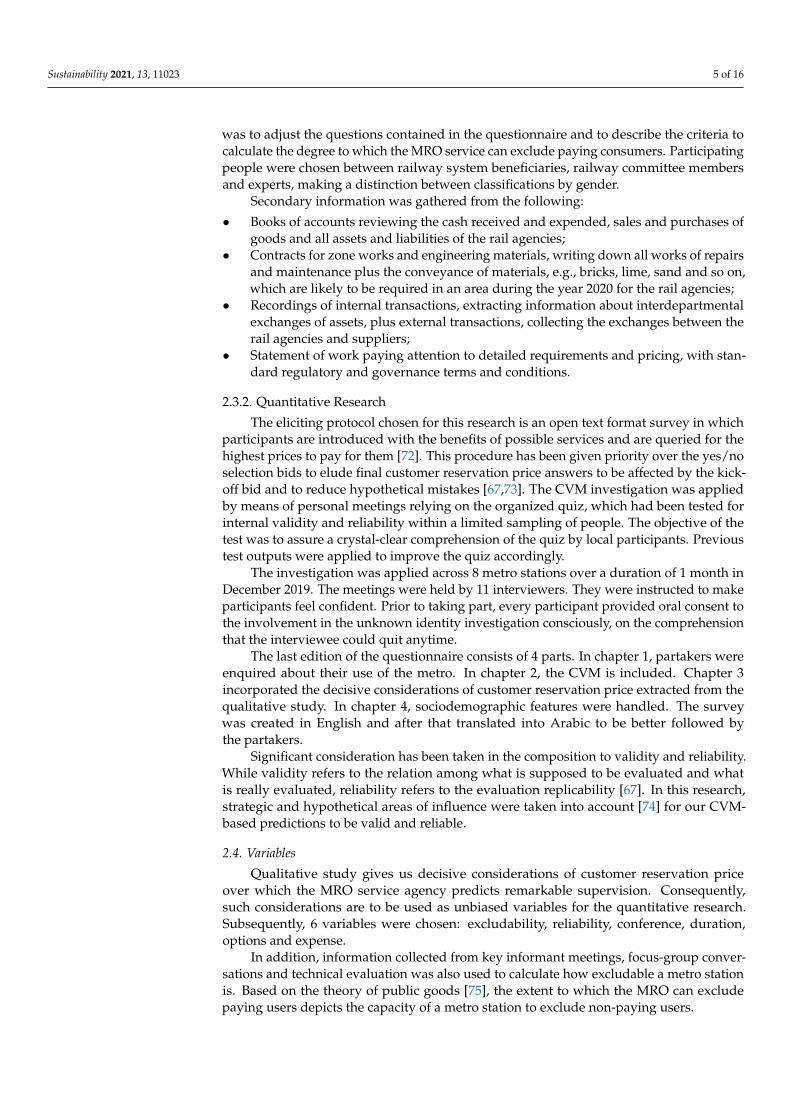
was to adjust the questions contained in the questionnaire and to describe the criteria tocalculate the degree to which the MRO service can exclude paying consumers. Participatingpeople were chosen between railway system beneficiaries, railway committee membersand experts, making a distinction between classifications by gender.
Secondary information was gathered from the following:
• Books of accounts reviewing the cash received and expended, sales and purchases ofgoods and all assets and liabilities of the rail agencies;
• Contracts for zone works and engineering materials, writing down all works of repairsand maintenance plus the conveyance of materials, e.g., bricks, lime, sand and so on,which are likely to be required in an area during the year 2020 for the rail agencies;
• Recordings of internal transactions, extracting information about interdepartmentalexchanges of assets, plus external transactions, collecting the exchanges between therail agencies and suppliers;
• Statement of work paying attention to detailed requirements and pricing, with stan-dard regulatory and governance terms and conditions.
2.3.2. Quantitative Research
The eliciting protocol chosen for this research is an open text format survey in whichparticipants are introduced with the benefits of possible services and are queried for thehighest prices to pay for them [72]. This procedure has been given priority over the yes/noselection bids to elude final customer reservation price answers to be affected by the kick-off bid and to reduce hypothetical mistakes [67,73]. The CVM investigation was appliedby means of personal meetings relying on the organized quiz, which had been tested forinternal validity and reliability within a limited sampling of people. The objective of thetest was to assure a crystal-clear comprehension of the quiz by local participants. Previoustest outputs were applied to improve the quiz accordingly.
The investigation was applied across 8 metro stations over a duration of 1 month inDecember 2019. The meetings were held by 11 interviewers. They were instructed to makeparticipants feel confident. Prior to taking part, every participant provided oral consent tothe involvement in the unknown identity investigation consciously, on the comprehensionthat the interviewee could quit anytime.
The last edition of the questionnaire consists of 4 parts. In chapter 1, partakers wereenquired about their use of the metro. In chapter 2, the CVM is included. Chapter 3incorporated the decisive considerations of customer reservation price extracted from thequalitative study. In chapter 4, sociodemographic features were handled. The surveywas created in English and after that translated into Arabic to be better followed bythe partakers.
Significant consideration has been taken in the composition to validity and reliability.While validity refers to the relation among what is supposed to be evaluated and whatis really evaluated, reliability refers to the evaluation replicability [67]. In this research,strategic and hypothetical areas of influence were taken into account [74] for our CVM-based predictions to be valid and reliable.
2.4. Variables
Qualitative study gives us decisive considerations of customer reservation priceover which the MRO service agency predicts remarkable supervision. Consequently,such considerations are to be used as unbiased variables for the quantitative research.Subsequently, 6 variables were chosen: excludability, reliability, conference, duration,options and expense.
In addition, information collected from key informant meetings, focus-group conver-sations and technical evaluation was also used to calculate how excludable a metro stationis. Based on the theory of public goods [75], the extent to which the MRO can excludepaying users depicts the capacity of a metro station to exclude non-paying users.
Sustainability 2021, 13, 11023 6 of 16
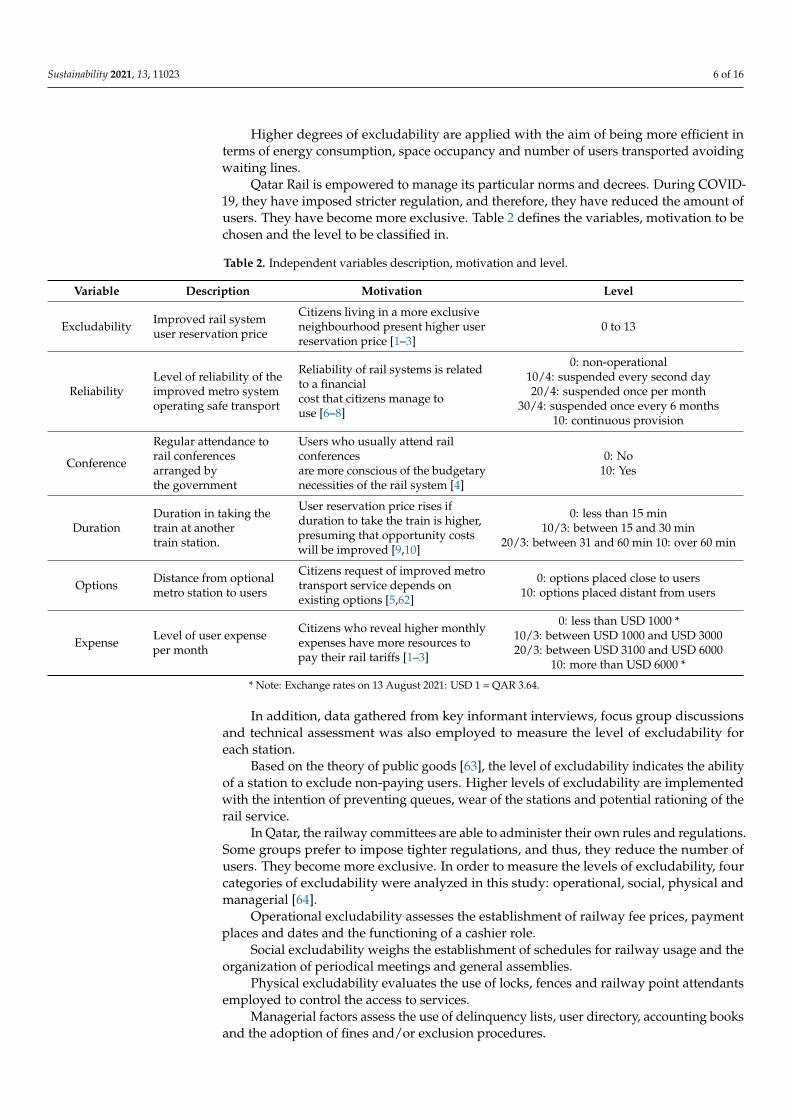
Higher degrees of excludability are applied with the aim of being more efficient interms of energy consumption, space occupancy and number of users transported avoidingwaiting lines.
Qatar Rail is empowered to manage its particular norms and decrees. During COVID-19, they have imposed stricter regulation, and therefore, they have reduced the amount ofusers. They have become more exclusive. Table 2 defines the variables, motivation to bechosen and the level to be classified in.
Table 2. Independent variables description, motivation and level.
Variable Description Motivation Level
Excludability Improved rail systemuser reservation price
Citizens living in a more exclusiveneighbourhood present higher userreservation price [1–3]
0 to 13
ReliabilityLevel of reliability of theimproved metro systemoperating safe transport
Reliability of rail systems is relatedto a financialcost that citizens manage touse [6–8]
0: non-operational10/4: suspended every second day20/4: suspended once per month
30/4: suspended once every 6 months10: continuous provision
Conference
Regular attendance torail conferencesarranged bythe government
Users who usually attend railconferencesare more conscious of the budgetarynecessities of the rail system [4]
0: No10: Yes
DurationDuration in taking thetrain at anothertrain station.
User reservation price rises ifduration to take the train is higher,presuming that opportunity costswill be improved [9,10]
0: less than 15 min10/3: between 15 and 30 min
20/3: between 31 and 60 min 10: over 60 min
Options Distance from optionalmetro station to users
Citizens request of improved metrotransport service depends onexisting options [5,62]
0: options placed close to users10: options placed distant from users
Expense Level of user expenseper month
Citizens who reveal higher monthlyexpenses have more resources topay their rail tariffs [1–3]
0: less than USD 1000 *10/3: between USD 1000 and USD 300020/3: between USD 3100 and USD 6000
10: more than USD 6000 *
* Note: Exchange rates on 13 August 2021: USD 1 = QAR 3.64.
In addition, data gathered from key informant interviews, focus group discussionsand technical assessment was also employed to measure the level of excludability foreach station.
Based on the theory of public goods [63], the level of excludability indicates the abilityof a station to exclude non-paying users. Higher levels of excludability are implementedwith the intention of preventing queues, wear of the stations and potential rationing of therail service.
In Qatar, the railway committees are able to administer their own rules and regulations.Some groups prefer to impose tighter regulations, and thus, they reduce the number ofusers. They become more exclusive. In order to measure the levels of excludability, fourcategories of excludability were analyzed in this study: operational, social, physical andmanagerial [64].
Operational excludability assesses the establishment of railway fee prices, paymentplaces and dates and the functioning of a cashier role.
Social excludability weighs the establishment of schedules for railway usage and theorganization of periodical meetings and general assemblies.
Physical excludability evaluates the use of locks, fences and railway point attendantsemployed to control the access to services.
Managerial factors assess the use of delinquency lists, user directory, accounting booksand the adoption of fines and/or exclusion procedures.
Sustainability 2021, 13, 11023 7 of 16
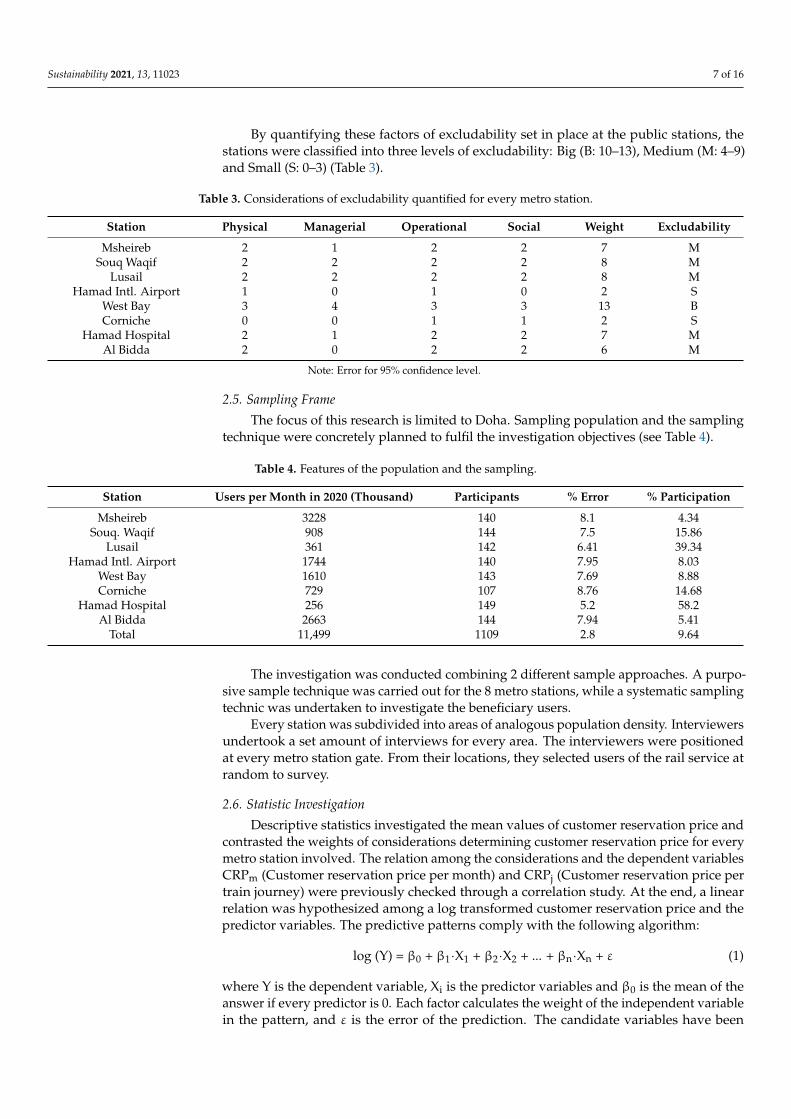
By quantifying these factors of excludability set in place at the public stations, thestations were classified into three levels of excludability: Big (B: 10–13), Medium (M: 4–9)and Small (S: 0–3) (Table 3).
Table 3. Considerations of excludability quantified for every metro station.
Station Physical Managerial Operational Social Weight Excludability
Msheireb 2 1 2 2 7 MSouq Waqif 2 2 2 2 8 M
Lusail 2 2 2 2 8 MHamad Intl. Airport 1 0 1 0 2 S
West Bay 3 4 3 3 13 BCorniche 0 0 1 1 2 S
Hamad Hospital 2 1 2 2 7 MAl Bidda 2 0 2 2 6 M
Note: Error for 95% confidence level.
2.5. Sampling Frame
The focus of this research is limited to Doha. Sampling population and the samplingtechnique were concretely planned to fulfil the investigation objectives (see Table 4).
Table 4. Features of the population and the sampling.
Station Users per Month in 2020 (Thousand) Participants % Error % Participation
Msheireb 3228 140 8.1 4.34Souq. Waqif 908 144 7.5 15.86
Lusail 361 142 6.41 39.34Hamad Intl. Airport 1744 140 7.95 8.03
West Bay 1610 143 7.69 8.88Corniche 729 107 8.76 14.68
Hamad Hospital 256 149 5.2 58.2Al Bidda 2663 144 7.94 5.41
Total 11,499 1109 2.8 9.64
The investigation was conducted combining 2 different sample approaches. A purpo-sive sample technique was carried out for the 8 metro stations, while a systematic samplingtechnic was undertaken to investigate the beneficiary users.
Every station was subdivided into areas of analogous population density. Interviewersundertook a set amount of interviews for every area. The interviewers were positionedat every metro station gate. From their locations, they selected users of the rail service atrandom to survey.
2.6. Statistic Investigation
Descriptive statistics investigated the mean values of customer reservation price andcontrasted the weights of considerations determining customer reservation price for everymetro station involved. The relation among the considerations and the dependent variablesCRPm (Customer reservation price per month) and CRPj (Customer reservation price pertrain journey) were previously checked through a correlation study. At the end, a linearrelation was hypothesized among a log transformed customer reservation price and thepredictor variables. The predictive patterns comply with the following algorithm:
log (Y) = β0 + β1·X1 + β2·X2 + ... + βn·Xn + ε (1)
where Y is the dependent variable, Xi is the predictor variables and β0 is the mean of theanswer if every predictor is 0. Each factor calculates the weight of the independent variablein the pattern, and ε is the error of the prediction. The candidate variables have been
Sustainability 2021, 13, 11023 8 of 16
summed up through a forward gradual method. The suitability of the pattern is measuredcalculating the described variance R2, the F test, the regression error and the significance ofthe factors [76,77]. Data analysis was developed by means of IBM SPSS, Version 26.0. (IBMCorp., Armonk, NY, USA).
3. Outputs
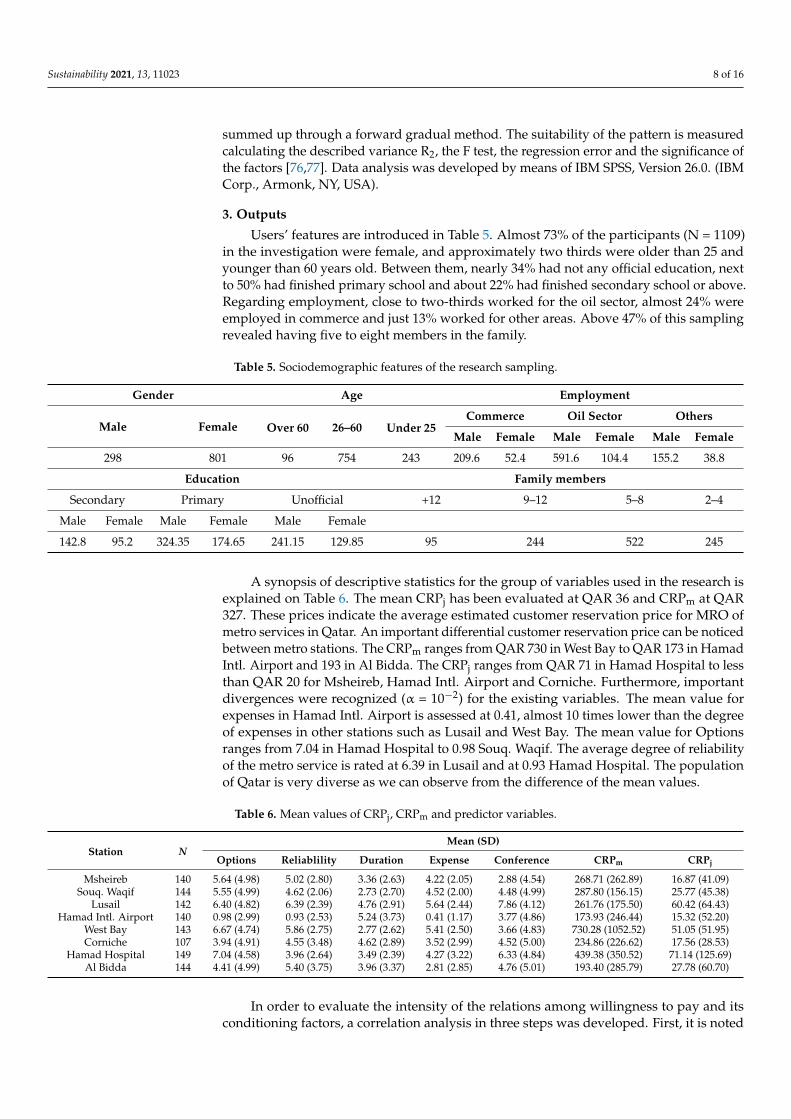
Users’ features are introduced in Table 5. Almost 73% of the participants (N = 1109)in the investigation were female, and approximately two thirds were older than 25 andyounger than 60 years old. Between them, nearly 34% had not any official education, nextto 50% had finished primary school and about 22% had finished secondary school or above.Regarding employment, close to two-thirds worked for the oil sector, almost 24% wereemployed in commerce and just 13% worked for other areas. Above 47% of this samplingrevealed having five to eight members in the family.
Table 5. Sociodemographic features of the research sampling.
Gender Age Employment
Male Female Over 60 26–60 Under 25Commerce Oil Sector Others
Male Female Male Female Male Female
298 801 96 754 243 209.6 52.4 591.6 104.4 155.2 38.8
Education Family members
Secondary Primary Unofficial +12 9–12 5–8 2–4
Male Female Male Female Male Female
142.8 95.2 324.35 174.65 241.15 129.85 95 244 522 245
A synopsis of descriptive statistics for the group of variables used in the research isexplained on Table 6. The mean CRPj has been evaluated at QAR 36 and CRPm at QAR327. These prices indicate the average estimated customer reservation price for MRO ofmetro services in Qatar. An important differential customer reservation price can be noticedbetween metro stations. The CRPm ranges from QAR 730 in West Bay to QAR 173 in HamadIntl. Airport and 193 in Al Bidda. The CRPj ranges from QAR 71 in Hamad Hospital to lessthan QAR 20 for Msheireb, Hamad Intl. Airport and Corniche. Furthermore, importantdivergences were recognized (α = 10−2) for the existing variables. The mean value forexpenses in Hamad Intl. Airport is assessed at 0.41, almost 10 times lower than the degreeof expenses in other stations such as Lusail and West Bay. The mean value for Optionsranges from 7.04 in Hamad Hospital to 0.98 Souq. Waqif. The average degree of reliabilityof the metro service is rated at 6.39 in Lusail and at 0.93 Hamad Hospital. The populationof Qatar is very diverse as we can observe from the difference of the mean values.
Table 6. Mean values of CRPj, CRPm and predictor variables.
Station NMean (SD)
Options Reliablility Duration Expense Conference CRPm CRPj
Msheireb 140 5.64 (4.98) 5.02 (2.80) 3.36 (2.63) 4.22 (2.05) 2.88 (4.54) 268.71 (262.89) 16.87 (41.09)Souq. Waqif 144 5.55 (4.99) 4.62 (2.06) 2.73 (2.70) 4.52 (2.00) 4.48 (4.99) 287.80 (156.15) 25.77 (45.38)
Lusail 142 6.40 (4.82) 6.39 (2.39) 4.76 (2.91) 5.64 (2.44) 7.86 (4.12) 261.76 (175.50) 60.42 (64.43)Hamad Intl. Airport 140 0.98 (2.99) 0.93 (2.53) 5.24 (3.73) 0.41 (1.17) 3.77 (4.86) 173.93 (246.44) 15.32 (52.20)
West Bay 143 6.67 (4.74) 5.86 (2.75) 2.77 (2.62) 5.41 (2.50) 3.66 (4.83) 730.28 (1052.52) 51.05 (51.95)Corniche 107 3.94 (4.91) 4.55 (3.48) 4.62 (2.89) 3.52 (2.99) 4.52 (5.00) 234.86 (226.62) 17.56 (28.53)
Hamad Hospital 149 7.04 (4.58) 3.96 (2.64) 3.49 (2.39) 4.27 (3.22) 6.33 (4.84) 439.38 (350.52) 71.14 (125.69)Al Bidda 144 4.41 (4.99) 5.40 (3.75) 3.96 (3.37) 2.81 (2.85) 4.76 (5.01) 193.40 (285.79) 27.78 (60.70)
In order to evaluate the intensity of the relations among willingness to pay and itsconditioning factors, a correlation analysis in three steps was developed. First, it is noted
Sustainability 2021, 13, 11023 9 of 16
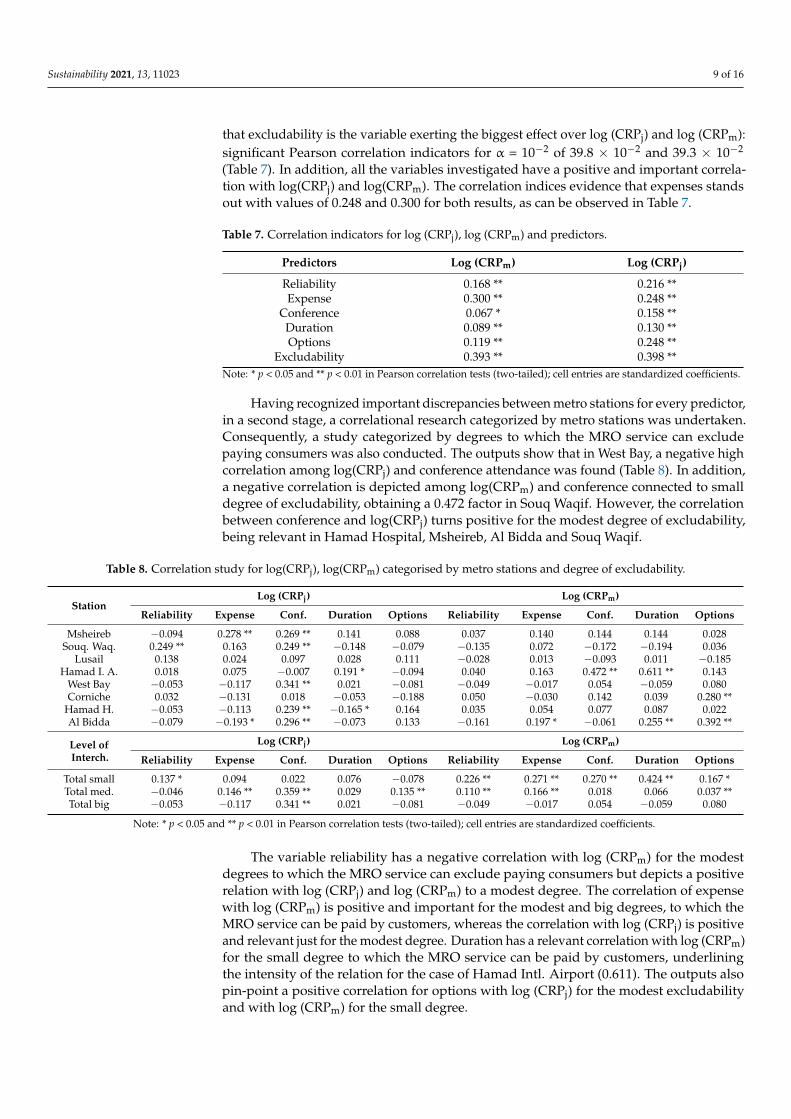
that excludability is the variable exerting the biggest effect over log (CRPj) and log (CRPm):significant Pearson correlation indicators for α = 10−2 of 39.8 × 10⁻² and 39.3 × 10⁻²
(Table 7). In addition, all the variables investigated have a positive and important correla-tion with log(CRPj) and log(CRPm). The correlation indices evidence that expenses standsout with values of 0.248 and 0.300 for both results, as can be observed in Table 7.
Table 7. Correlation indicators for log (CRPj), log (CRPm) and predictors.
Predictors Log (CRPm) Log (CRPj)
Reliability 0.168 ** 0.216 **Expense 0.300 ** 0.248 **
Conference 0.067 * 0.158 **Duration 0.089 ** 0.130 **Options 0.119 ** 0.248 **
Excludability 0.393 ** 0.398 **Note: * p < 0.05 and ** p < 0.01 in Pearson correlation tests (two-tailed); cell entries are standardized coefficients.
Having recognized important discrepancies between metro stations for every predictor,in a second stage, a correlational research categorized by metro stations was undertaken.Consequently, a study categorized by degrees to which the MRO service can excludepaying consumers was also conducted. The outputs show that in West Bay, a negative highcorrelation among log(CRPj) and conference attendance was found (Table 8). In addition,a negative correlation is depicted among log(CRPm) and conference connected to smalldegree of excludability, obtaining a 0.472 factor in Souq Waqif. However, the correlationbetween conference and log(CRPj) turns positive for the modest degree of excludability,being relevant in Hamad Hospital, Msheireb, Al Bidda and Souq Waqif.
Table 8. Correlation study for log(CRPj), log(CRPm) categorised by metro stations and degree of excludability.
StationLog (CRPj) Log (CRPm)
Reliability Expense Conf. Duration Options Reliability Expense Conf. Duration Options
Msheireb −0.094 0.278 ** 0.269 ** 0.141 0.088 0.037 0.140 0.144 0.144 0.028Souq. Waq. 0.249 ** 0.163 0.249 ** −0.148 −0.079 −0.135 0.072 −0.172 −0.194 0.036
Lusail 0.138 0.024 0.097 0.028 0.111 −0.028 0.013 −0.093 0.011 −0.185Hamad I. A. 0.018 0.075 −0.007 0.191 * −0.094 0.040 0.163 0.472 ** 0.611 ** 0.143
West Bay −0.053 −0.117 0.341 ** 0.021 −0.081 −0.049 −0.017 0.054 −0.059 0.080Corniche 0.032 −0.131 0.018 −0.053 −0.188 0.050 −0.030 0.142 0.039 0.280 **
Hamad H. −0.053 −0.113 0.239 ** −0.165 * 0.164 0.035 0.054 0.077 0.087 0.022Al Bidda −0.079 −0.193 * 0.296 ** −0.073 0.133 −0.161 0.197 * −0.061 0.255 ** 0.392 **
Level ofInterch.
Log (CRPj) Log (CRPm)
Reliability Expense Conf. Duration Options Reliability Expense Conf. Duration Options
Total small 0.137 * 0.094 0.022 0.076 −0.078 0.226 ** 0.271 ** 0.270 ** 0.424 ** 0.167 *Total med. −0.046 0.146 ** 0.359 ** 0.029 0.135 ** 0.110 ** 0.166 ** 0.018 0.066 0.037 **Total big −0.053 −0.117 0.341 ** 0.021 −0.081 −0.049 −0.017 0.054 −0.059 0.080
Note: * p < 0.05 and ** p < 0.01 in Pearson correlation tests (two-tailed); cell entries are standardized coefficients.
The variable reliability has a negative correlation with log (CRPm) for the modestdegrees to which the MRO service can exclude paying consumers but depicts a positiverelation with log (CRPj) and log (CRPm) to a modest degree. The correlation of expensewith log (CRPm) is positive and important for the modest and big degrees, to which theMRO service can be paid by customers, whereas the correlation with log (CRPj) is positiveand relevant just for the modest degree. Duration has a relevant correlation with log (CRPm)for the small degree to which the MRO service can be paid by customers, underliningthe intensity of the relation for the case of Hamad Intl. Airport (0.611). The outputs alsopin-point a positive correlation for options with log (CRPj) for the modest excludabilityand with log (CRPm) for the small degree.
Sustainability 2021, 13, 11023 10 of 16
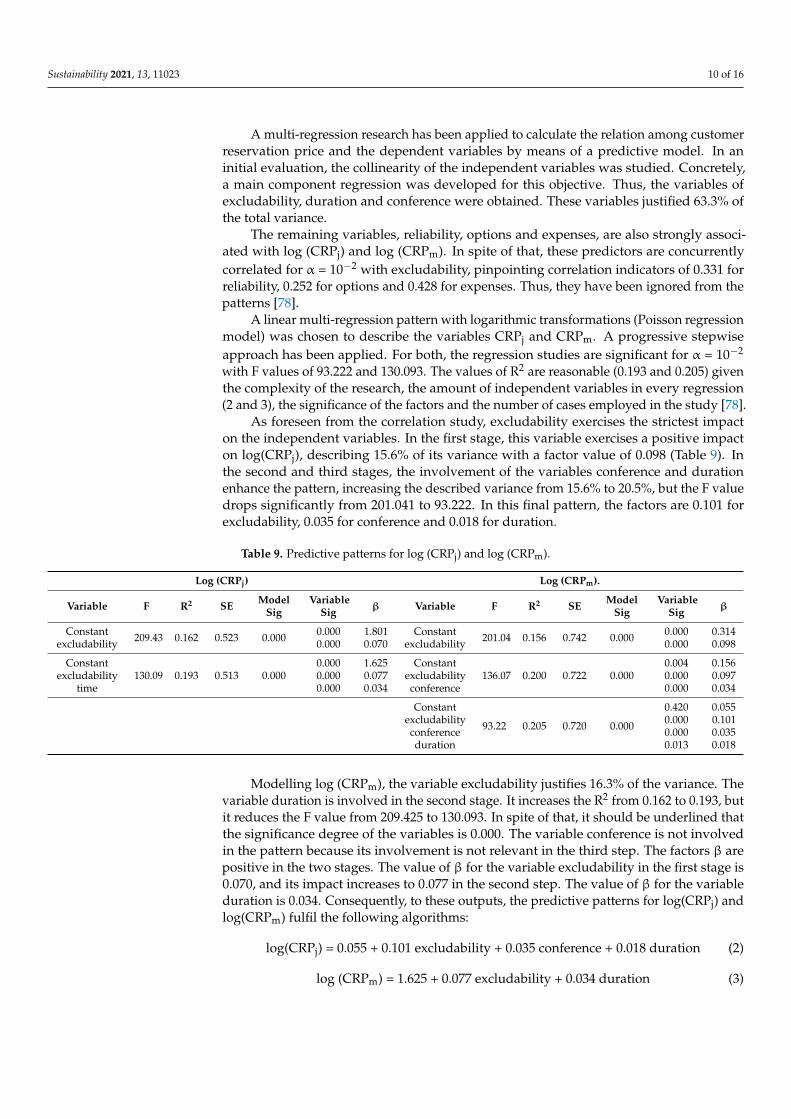
A multi-regression research has been applied to calculate the relation among customerreservation price and the dependent variables by means of a predictive model. In aninitial evaluation, the collinearity of the independent variables was studied. Concretely,a main component regression was developed for this objective. Thus, the variables ofexcludability, duration and conference were obtained. These variables justified 63.3% ofthe total variance.
The remaining variables, reliability, options and expenses, are also strongly associ-ated with log (CRPj) and log (CRPm). In spite of that, these predictors are concurrentlycorrelated for α = 10−2 with excludability, pinpointing correlation indicators of 0.331 forreliability, 0.252 for options and 0.428 for expenses. Thus, they have been ignored from thepatterns [78].
A linear multi-regression pattern with logarithmic transformations (Poisson regressionmodel) was chosen to describe the variables CRPj and CRPm. A progressive stepwiseapproach has been applied. For both, the regression studies are significant for α = 10−2
with F values of 93.222 and 130.093. The values of R2 are reasonable (0.193 and 0.205) giventhe complexity of the research, the amount of independent variables in every regression(2 and 3), the significance of the factors and the number of cases employed in the study [78].
As foreseen from the correlation study, excludability exercises the strictest impacton the independent variables. In the first stage, this variable exercises a positive impacton log(CRPj), describing 15.6% of its variance with a factor value of 0.098 (Table 9). Inthe second and third stages, the involvement of the variables conference and durationenhance the pattern, increasing the described variance from 15.6% to 20.5%, but the F valuedrops significantly from 201.041 to 93.222. In this final pattern, the factors are 0.101 forexcludability, 0.035 for conference and 0.018 for duration.
Table 9. Predictive patterns for log (CRPj) and log (CRPm).
Log (CRPj) Log (CRPm).
Variable F R2 SE ModelSig
VariableSig β Variable F R2 SE Model
SigVariable
Sig β
Constantexcludability 209.43 0.162 0.523 0.000 0.000
0.0001.8010.070
Constantexcludability 201.04 0.156 0.742 0.000 0.000
0.0000.3140.098
Constantexcludability
time130.09 0.193 0.513 0.000
0.0000.0000.000
1.6250.0770.034
Constantexcludabilityconference
136.07 0.200 0.722 0.0000.0040.0000.000
0.1560.0970.034
Constantexcludabilityconferenceduration
93.22 0.205 0.720 0.000
0.4200.0000.0000.013
0.0550.1010.0350.018
Modelling log (CRPm), the variable excludability justifies 16.3% of the variance. Thevariable duration is involved in the second stage. It increases the R2 from 0.162 to 0.193, butit reduces the F value from 209.425 to 130.093. In spite of that, it should be underlined thatthe significance degree of the variables is 0.000. The variable conference is not involvedin the pattern because its involvement is not relevant in the third step. The factors β arepositive in the two stages. The value of β for the variable excludability in the first stage is0.070, and its impact increases to 0.077 in the second step. The value of β for the variableduration is 0.034. Consequently, to these outputs, the predictive patterns for log(CRPj) andlog(CRPm) fulfil the following algorithms:
log(CRPj) = 0.055 + 0.101 excludability + 0.035 conference + 0.018 duration (2)
log (CRPm) = 1.625 + 0.077 excludability + 0.034 duration (3)
Sustainability 2021, 13, 11023 11 of 16
4. Discussion
The financial sustainability of the metro MRO depends mostly on continuous users’revenue collection. Present railway models support partial cost recovery for MRO bymeans of financing strategy shared by the local government and users. The creation ofcorrect metro fares is important to obtain continuous user payment in the long-term. Toachieve this, it is key to assess users’ demands for the railway service provided and to setup the price that customers place on such services.
This research reveals customer reservation price for MRO across eight metro stations.The outputs of the investigation evidence three key insights. First, the average economicvalue that users in Qatar attribute to frequent MRO of the enhanced metro systems has beenrated at QAR 327 per month. The outputs disclose a relevant CRPm differential betweenthe analyzed stations of up to 420%. Disclosed CRPm evaluations range from QAR 730 inWest Bay to QAR 174 in Hamad Intl. Airport. These estimations depict the user preferencesfor reasonable service at every metro station. These values enable us to comprehend thedegree of payment that metro users from local stations feel capable or willing to bear. Thisinformation on the local need for enhanced rail service is of paramount relevance for theregulation authority to set up reasonable metro fares.
A substantially high percentage of beneficiaries from the metro systems requestedpayable MRO. Above 92% of participants revealed their preference for an enhanced serviceand showed their aim to pay for MRO. The evidence proposes that revenue collectionsystems are expected to be sustainable if user payment fee exceeds a 60% threshold [79],disclosing the potential for metro stations in Qatar to achieve stable revenue collectionsystems. In spite of that, frequently, there is a contradiction between users showing demandfor improved systems and their contribution behavior for true expenses [79]. Internationalagencies disclose that, across the Middle East, few of the interventions keep an operationalsystem of railway fares many years after implementation [80].
Furthermore, the whole revenue collected from user payments when implementingthe declared preferred monthly payment of QAR 327 would be distant from ensuring fulllife cycle cost recovery for the metro stations in Doha. Documentary information from thesurveyed stations disclose that lately some important repairs have exceeded an expenseof QAR 25.106. In spite of that, in the creation of a cost-sharing arrangement that QR andRKH Qitarat is about to implement, railway fares are expected to bear just small repairsand preventative maintenance while each major repair, rehabilitation and replacementshould be covered by a revenue from government subsidies. Only if the new railway faresare reasonable and adequate could the revenue collected from users’ payment be sustainedin the long-term and contribute to the economic sustainability of the railway systems.
On the other hand, the identification of other contribution alternatives could play akey part in setting up fares adequate for all, including the poorest. The average declaredcustomer reservation price per train journey has been estimated at QAR 36, varying fromQAR 71 in Hamad-Hospital to QAR 15 in Hamad-Itl. Airport. This alternative involves ahigher fee per km of railway (e.g., the total expense in railway for a citizen consideringa consumption of one train journey per day would result in QAR 1100 per month). Inspite of that, this alternative is more practicable for users in informal economies who havedifficulties collecting the quantity needed for a monthly single instalment. The pay pertrain journey mode offers people with limited financial resources an alternative to makeuse of the metro service on a daily basis.
Furthermore, outputs disclose three main determinant factors of customer reservationprice for MRO in Qatar. The predictive model is mostly driven by the level of excludabilityto use enhanced railway systems, the involvement of users in railway conferences arrangedby QR and RKH Qitarat and the level of personal expenditure per month.
In spite of the proximity and in spite of having been applied by the similar agency inidentical organization charts, stations have evolved to new ways of management. The col-lective nature of management of railway services has translated into user groups choosingnew levels of excludability to provide long term performance of the metro stations. Preced-
Sustainability 2021, 13, 11023 12 of 16
ing investigations proposed that implementing public goods principles to the collectivemanagement of metro services could be an adequate framework of evaluation [81]. In Qatar,more exclusive associations have established tighter financial regulations to generate therequired revenue. They have reached this because of affiliation fees, penalties and strongerimposition instruments. Users of systems with exclusive ways of management show higheraverage customer reservation prices per month than more inclusive associations. Theoutputs of this research suggest that in Qatar a more exclusive way of management isrelated to higher user contribution levels.
Similarly, the outputs also imply that users that spend more time taking the metrofrom an improved station are more expected to admit a bigger customer reservation pricefor MRO. Key informants said that due to present inefficiencies in MRO, a metro stationbecame non-functional. Users of that metro stations were pushed to walk farther, lookingfor an enhanced station. Therefore, they have seen their time employed in taking the metroincrease considerably. Users who request more time to take the train are willing to payhigher metro fees in order to enhance MRO and to restore functioning metro stations.
Furthermore, taking part in conferences held by the railway committees leads toa higher customer reservation price between participants. Throughout the focus groupdebates, some participants proposed that rail users who often take part in informativeand managerial conferences with the committees become more conscious of the finan-cial challenges addressed by the systems and consequently report stronger preferencesfor MRO.
In this research, many potential constraints have been depicted. The unique social,cultural and political landscape of Qatar constrains the potential generalization of the find-ings. The group of interviewers for the investigation was selected from among engineersworking at the railway operator. This may have affected rail users’ responses in spite ofstrong ethical policy. To reduce the influence, all enumerators were assigned to survey ametro station new from the station they often work at. Protest votes and yea-sayers werenot identified with further questions, which could introduce downward bias into customerreservation price evaluations. Eventually, there are also issues about potential strategicand hypothetical biases associated with the CVM questionnaire. Strategic bias in thisinvestigation emerges because interviewees may voluntarily articulate their replies to affectthe result of the research in their own profit [82]. Hypothetical bias appears because thereis no real purchase of the service, which generally turns into an overestimation of customerreservation price [82]. Being conscious of these concerns, it is needed to be conservativewith the estimations and related repercussions.
5. Conclusions
The results of this research are the following:
• Improved understanding of customer reservation price for the railway MRO in Qatar;• High demand of the MRO service by metro system Qatar user of the metro systems• The economic value that beneficiaries of the systems attribute to improved services is
QAR 327 per month;• An important CRPm differential has been noticed between users from different
metro stations;• A significant proportion of users would benefit from a pay per train journey, in spite
of the rise in the fare up to QAR 36 per train journey;• The level of excludability of the railway MRO service, the involvement in rail manage-
ment conferences and the time employed in taking the metro from an improved metrostation are contingent with customer reservation price.
An improved comprehension of local requests for MRO service in Qatar is of paramountimportance for railway agencies working in the area. In an attempt to achieve financialsustainability, key public rail authorities will make use of these results to establish metrofares that can be realistic, reasonable and adequate for all.
Sustainability 2021, 13, 11023 13 of 16
As a result, this article will have several key economic policy contributions. Therailway systems will have funds to meet all the MRO service milestones and financialobligations. They will have the capacity to generate the expected return for the investors.The railway transport will be offered at a price that not only covers expenses but alsocreates a profit. In a crisis, it will involve meeting financial obligations within have otheralternative possibilities to fund railway services. In other words, it will be able to beself-financed. Finally, the railway agencies will have the capacity to obtain revenues inresponse to a demand in order to sustain MRO processes at a steady or growing rate toproduce results and obtain a surplus.
Funding: This research received no external or internal funding.
Institutional Review Board Statement: The research was conducted according to the guidelines ofthe Declaration of Helsinki and approved by QR Ethics Committee on 2 October 2020.
Informed Consent Statement: Informed consent was obtained from all subjects involved in the research.
Data Availability Statement: The data presented in this research are available on request from thecorresponding author.
Acknowledgments: The authors would like to thank the QR Authorities in the person of his Ex-cellency Abdulla bin Abdulaziz bin Turki Al Subaie for supporting the work reported above. Thefindings and conclusions expressed in this paper though, represent exclusively those of the author.
Conflicts of Interest: The author declares no conflict of interests.
References1. UIC. Union of Railways, Sustainability, UIC—International Union of Railways. Available online: https://uic.org/sustainability/
(accessed on 3 September 2021).2. Ehteshami, A.; Horesh, N. China’s Presence in the Middle East: The Implications of the One Belt, One Road Initiative; Routledge:
London, UK, 2017.3. Dinhobl, G.; Roth, R. (Eds.) Across the Borders: Financing the World’s Railways in the Nineteenth and Twentieth Centuries; Routledge &
CRC Press: Washington, WA, USA, 2016. Available online: https://www.routledge.com/Across-the-Borders-Financing-the-Worlds-Railways-in-the-Nineteenth-and/Dinhobl-Roth/p/book/9781138265424 (accessed on 5 September 2021).
4. Bouchet, M.; Liu, S.; Parilla, J. Global Metro Monitor 2018; Brookings Institution: Washington, WA, USA, 2018; p. 48.5. El-Anis, I. Transport Infrastructure and Regional Integration in the Middle East. Muslim World 2021, 111, 27–53. [CrossRef]6. De Gruyter, C.; Currie, G.; Rose, G. Sustainability Measures of Urban Public Transport in Cities: A World Review and Focus on
the Asia/Middle East Region. Sustainability 2017, 9, 43. [CrossRef]7. Pender, B.; Currie, G.; Delbosc, A.; Shiwakoti, N. Disruption Recovery in Passenger Railways: International Survey. Transp. Res.
Rec. 2013, 2353, 22–32. [CrossRef]8. UIC Communications. UIC Releases Its 2019 Activity Report. Available online: https://www.uic.org/com/enews/nr/699/
article/uic-releases-its-2019-activity-report (accessed on 5 September 2021).9. Al-Rawashdeh, M.S.; AL-Qatatsheh, M.H. China’s strategy in the Middle East (The Silk Road Project). IOSR J. Humanit. Soc. Sci.
2017, 22, 37–51. [CrossRef]10. Najar, M.E.M.; Al Rahbi, A.K. Investigation future planning of railway networks in the arabs gulf countries. Int. J. Transp. Dev.
Integr. 2017, 1, 654–665. [CrossRef]11. Bätzner, A.N.; Stephenson, M.L. Towards an integrated transport network in the GCC region: Fostering tourism and regional
cooperation. In International Tourism Development and the Gulf Cooperation Council States; Routledge: London, UK, 2017.12. Liu, S.; Yin, C.; Chen, D.; Lv, H.; Zhang, Q. Cascading Failure in Multiple Critical Infrastructure Interdependent Networks of
Syncretic Railway System. IEEE Trans. Intell. Transp. Syst. 2021, 1–14. [CrossRef]13. Bešinovic, N. Resilience in railway transport systems: A literature review and research agenda. Transp. Rev. 2020, 40, 457–478.
[CrossRef]14. Dale, M.; Krumdieck, S.; Page, S.; Mulligan, K. Transitionscape: Generating Community-Based Sustainable Transport Initiatives;
University of Canterbury Mechanical Engineering: Ilam, New Zealand, 2008; p. 7.15. Goetz Phillips, C.; Ruth Edwards, H. Socioeconomic, Community-Based Approach for Developing Integrated Mass Transit
Systems: Application to City of Baltimore, Maryland. Transp. Res. Rec. 2002, 1793, 71–79. [CrossRef]16. Fraga, C.C.L.; Borges, V.L.B. Tourist railway and tourism community-based: Some connections for planning and management.
Cad. Virtual Tur. 2018, 18, 28–39.17. Van Der Bijl, R.; Van Oort, N.; Bukman, B. Light Rail Transit Systems: 61 Lessons in Sustainable Urban Development; Elsevier:
Amsterdam, The Netherlands, 2018.18. Kalaycioglu, S. Towards more functional economic cooperation in the middle east. Percept. J. Int. Aff. 2003, 8, 1–27.
Sustainability 2021, 13, 11023 14 of 16
19. Newman, P.; Kenworthy, J.; Glazebrook, G. Peak Car Use and the Rise of Global Rail: Why This Is Happening and What It Meansfor Large and Small Cities. J. Transp. Technol. 2013, 3, 272–287. [CrossRef]
20. Gu, S.; Li, K. Reliability analysis of high-speed railway network. Proc. Inst. Mech. Eng. Part O J. Risk Reliab. 2019, 233, 1060–1073.[CrossRef]
21. Schiller, P.L.; Kenworthy, J.R. An Introduction to Sustainable Transportation: Policy, Planning and Implementation, 2nd ed.; Routledge:London, UK, 2017. [CrossRef]
22. Mansourianfar, M.H.; Haghshenas, H. Micro-scale sustainability assessment of infrastructure projects on urban transportationsystems: Case study of Azadi district, Isfahan, Iran. Cities 2018, 72, 149–159. [CrossRef]
23. Djordjevic, B.; Mane, A.S.; Krmac, E. Analysis of dependency and importance of key indicators for railway sustainabilitymonitoring: A new integrated approach with DEA and Pearson correlation. Res. Transp. Bus. Manag. 2021, 100650. [CrossRef]
24. Karjalainen, L.E.; Juhola, S. Framework for Assessing Public Transportation Sustainability in Planning and Policy-Making.Sustainability 2019, 11, 1028. [CrossRef]
25. Pulido, D.; Darido, G.; Munoz-Raskin, R.; Moody, J. The Urban Rail Development Handbook; World Bank Publications: Washington,DC, USA, 2018.
26. Poliak, M.; Tomicová, J.; Reuter, N. Impact of indirect user participation on public transport financing. Arch. Motoryz. 2019, 86,65–77. [CrossRef]
27. Nikolova, C. User charges for the railway infrastructure in Bulgaria. Transp. Res. Part A Policy Pract. 2008, 42, 487–502. [CrossRef]28. Tánczos, K.; Farkas, G. Problems and issues of defining user charges for railway infrastructure. Period. Polytech. Transp. Eng. 2000,
28, 103–116.29. Tang, S.; Lo, H.K. Property Models for Financing Railway Development. In Sustainable Railway Futures; Routledge: London,
UK, 2015.30. Götz, G.; Schäfer, J.T. Financing Railways. In Handbook on Railway Regulation; Edward Elgar Publishing: Cheltenham, UK,
2020. Available online: https://www.elgaronline.com/view/edcoll/9781789901771/9781789901771.00024.xml (accessed on2 September 2021).
31. Iwasaki, H. Financing mechanisms for transport infrastructure and services. In Routledge Handbook of Transport in Asia; Routledge:London, UK, 2018.
32. Dolinayova, A.; Danis, J.; Cerna, L. Regional Railways Transport—Effectiveness of the Regional Railway Line. In Sustainable RailTransport; Springer: Cham, Switzerland, 2019; pp. 181–200. [CrossRef]
33. Bennett, J.; Iossa, E. Delegation of Contracting in the Private Provision of Public Services. Rev. Ind. Organ. 2006, 29, 75–92.[CrossRef]
34. Wangai, A.W.; Rohacs, D.; Boros, A. Supporting the Sustainable Development of Railway Transport in Developing Countries.Sustainability 2020, 12, 3572. [CrossRef]
35. Chege, S.M.; Wang, D.; Suntu, S.L.; Bishoge, O.K. Influence of technology transfer on performance and sustainability of standardgauge railway in developing countries. Technol. Soc. 2019, 56, 79–92. [CrossRef]
36. Dimitriou, H.T.; Gakenheimer, R. Urban Transport in the Developing World: A Handbook of Policy and Practice; Edward ElgarPublishing: Cheltenham, UK, 2011.
37. Estache, A.; Serebrisky, T. Where do We Stand on Transport Infrastructure Deregulation and Public-Private Partnership? Social ScienceResearch Network: Rochester, NY, USA, 2004. Available online: https://papers.ssrn.com/abstract=610400 (accessed on 2September 2021).
38. Kuriakose, P.N.; Bhattacharjee, J. India’s Public Transport Systems: The Role of Metro Rail. In Railway Transportation in South Asia:Infrastructure Planning, Regional Development and Economic Impacts; Mitra, S., Bandyopadhyay, S., Roy, S., Ponce Dentinho, T., Eds.;Springer International Publishing: Cham, Switzerland, 2021; pp. 131–152. [CrossRef]
39. Hamurcu, M.; Eren, T. Transportation planning with analytic hierarchy process and goal programming. Int. Adv. Res. Eng. J. 2018,2, 92–97.
40. Phang, S.-Y. Strategic development of airport and rail infrastructure: The case of Singapore. Transp. Policy 2003, 10, 27–33.[CrossRef]
41. Casullo, L. Rail Funding and Financing. Rev. Netw. Econ. 2017, 16, 125–141. [CrossRef]42. Bergantino, A.S.; Madio, L. High-Speed Rail, Inter-Modal Substitution and Willingness-to-Pay. A Stated Preference Analysis for the
“Bari-Rome”; Social Science Research Network: Rochester, NY, USA, 2017. [CrossRef]43. Whelan, G.; Crockett, J.; Consultancy, M. An investigation of the willingness to pay to reduce rail overcrowding. In Proceedings
of the First International Conference on Choice Modelling, Harrogate, UK, 30 March–1 April 2009.44. Sharma, R.; Newman, P. Does urban rail increase land value in emerging cities? Value uplift from Bangalore Metro. Transp. Res.
Part A Policy Pract. 2018, 117, 70–86. [CrossRef]45. How Democratic Is the Middle East? 9 September 2005. Available online: http://news.bbc.co.uk/2/hi/middle_east/3784765.stm
(accessed on 14 August 2021).46. Gardner, D.; Qatar Shows How to Manage a Modern Monarchy. Financial Times. 25 June 2013. Available online: https:
//www.ft.com/content/2e141faa-dd82-11e2-a756-00144feab7de (accessed on 14 August 2021).47. Population of Qatar by Nationality in 2019. Priya DSouza Communications 15 August 2019. Available online: http://priyadsouza.
com/population-of-qatar-by-nationality-in-2017/ (accessed on 14 August 2021).
Sustainability 2021, 13, 11023 15 of 16
48. Tok, M.E.; Alkhater, L.R.M.; Pal, L.A. Policy-Making in a Transformative State: The Case of Qatar. In Policy-Making in aTransformative State: The Case of Qatar; Tok, M.E., Alkhater, L.R.M., Pal, L.A., Eds.; Palgrave Macmillan: London, UK, 2016;pp. 1–35. [CrossRef]
49. GDP Per Capita, PPP (Current International $)|Data. Available online: https://data.worldbank.org/indicator/NY.GDP.PCAP.PP.CD?most_recent_value_desc=true (accessed on 14 August 2021).
50. GNI Per Capita, Atlas Method (Current US$)|Data. Available online: https://data.worldbank.org/indicator/NY.GNP.PCAP.CD?most_recent_value_desc=true (accessed on 14 August 2021).
51. 2019 Human Development Index Ranking|Human Development Reports. 30 April 2020. Available online: https://web.archive.org/web/20200430080741/http://hdr.undp.org/en/content/2019-human-development-index-ranking (accessed on14 August 2021).
52. Indices & Data|Human Development Reports (HDR)|United Nations Development Programme (UNDP). Available online:https://web.archive.org/web/20130112042847/http://hdr.undp.org/en/statistics/ (accessed on 14 August 2021).
53. Where in the World Do People Emit the Most CO2? Our World in Data. Available online: https://ourworldindata.org/per-capita-co2 (accessed on 14 August 2021).
54. Middle Powers: Squeezed out or Adaptive? Public Diplomacy Magazine. 17 March 2015. Available online: https://web.archive.org/web/20150317144416/http://publicdiplomacymagazine.com/middle-powers-squeezed-out-or-adaptive/ (accessed on14 August 2021).
55. Henderson, J.C. Hosting the 2022 FIFA World Cup: Opportunities and challenges for Qatar. J. Sport Tour. 2014, 19, 281–298.[CrossRef]
56. Khodr, H. Exploring the driving factors behind the event strategy in Qatar: A case study of the 15th Asian Games. Int. J. EventFestiv. Manag. 2012, 3, 81–100. [CrossRef]
57. Qatar Rail Website Home. Available online: https://corp.qr.com.qa/English/Pages/default.aspx (accessed on 3 September 2021).58. Li, Z.; Hensher, D.A. Crowding and public transport: A review of willingness to pay evidence and its relevance in project
appraisal. Transp. Policy 2011, 18, 880–887. [CrossRef]59. Nellthorp, J.; Bristow, A.L.; Day, B. Introducing Willingness-to-pay for Noise Changes into Transport Appraisal: An Application
of Benefit Transfer. Transp. Rev. 2007, 27, 327–353. [CrossRef]60. Bachok, S.; Ponrahono, Z. Modelling willingness to pay for improved public transport services: The challenges of non-response
to stated preference hypothetical questions. Plan. Malays. 2017, 15. [CrossRef]61. Wulansari, D.N.; Maulana, A.C.; Astari, M.D. Analysis of ability to pay and willingness to pay for Jakarta light rail transit in
Jakarta, Indonesia. In Proceedings of the 2017 International Conference on Computing, Engineering, and Design (ICCED), KualaLumpur, Malaysia, 23–25 November 2017; pp. 1–4. [CrossRef]
62. Marleau Donais, F.; Abi-Zeid, I.; Waygood, E.O.D.; Lavoie, R. A review of cost–benefit analysis and multicriteria decision analysisfrom the perspective of sustainable transport in project evaluation. EURO J. Decis. Process. 2019, 7, 327–358. [CrossRef]
63. Johansson, P.-O.; De Rus, G. On the Treatment of Foreigners and Foreign-owned Firms in the Cost-benefit Analysis of TransportProjects. J. Transp. Econ. Policy 2019, 53, 275–287.
64. Denant-Boemont, L.; Faulin, J.; Hammiche, S.; Serrano-Hernandez, A. Valuations of Transport Nuisances and Cognitive Biases: ASurvey Laboratory Experiment in the Pyrenees Region. Environ. Model. Assess. 2021, 1–16. [CrossRef]
65. Putri, A.L.; Widyastuti, H. Study of willingness to pay the Jakarta-Bandung highspeed train: A case study of Argo Parahyangantrain passangers. IOP Conf. Ser. Mater. Sci. Eng. 2019, 650, 012048. [CrossRef]
66. Hensher, D.A. Hypothetical bias, choice experiments and willingness to pay. Transp. Res. Part B Methodol. 2010, 44, 735–752.[CrossRef]
67. Oliveira, L.; Bruen, C.; Birrell, S.; Cain, R. What passengers really want: Assessing the value of rail innovation to improveexperiences. Transp. Res. Interdiscip. Perspect. 2019, 1, 100014. [CrossRef]
68. Matos Silva, C.; Serro, J.; Dinis Ferreira, P.; Teotónio, I. The socioeconomic feasibility of greening rail stations: A case study inLisbon. Eng. Econ. 2019, 64, 167–190. [CrossRef]
69. Banzhaf, H.S. Constructing Markets: Environmental Economics and the Contingent Valuation Controversy. Hist. Political Econ.2017, 49, 213–239. [CrossRef]
70. Qiao, Y.-K.; Peng, F.-L.; Wang, Y. Valuing external benefits of underground rail transit in monetary terms: A practical methodapplied to Changzhou City. Tunn. Undergr. Space Technol. 2019, 83, 91–98. [CrossRef]
71. Besanko, D. Restructuring Rail Systems: Implications for Network Quality and Welfare. In U.S. Freight Rail Economics and Policy;Routledge: London, UK, 2019.
72. Utsunomiya, K. The value of local railways: An approach using the contingent valuation method. Res. Transp. Econ. 2018, 69,554–559. [CrossRef]
73. Rose, J.M.; Beck, M.J.; Hensher, D.A. The joint estimation of respondent-reported certainty and acceptability with choice. Transp.Res. Part A Policy Pract. 2015, 71, 141–152. [CrossRef]
74. Sivalai, T.; Rojniruttikul, N. Determinants of the State Railway of Thailand’s (SRT) Total Quality Management process: SEManalysis. J. Int. Stud. 2018, 11, 118–135. [CrossRef]
75. Sarasvathy, S.D.; Dew, N.; Venkataraman, S. Shaping Entrepreneurship Research: Made, as Well as Found; Routledge: London,UK, 2020.

Sustainability 2021, 13, 11023 16 of 16
76. Weisberg, S. Applied Linear Regression; John Wiley & Sons: Hoboken, NJ, USA, 2005.77. Cohen, J.; Cohen, P.; West, S.G.; Aiken, L.S. Applied Multiple Regression/Correlation Analysis for the Behavioral Sciences; Routledge:
London, UK, 2013.78. Faul, F.; Erdfelder, E.; Buchner, A.; Lang, A.-G. Statistical power analyses using G*Power 3.1: Tests for correlation and regression
analyses. Behav. Res. Methods 2009, 41, 1149–1160. [CrossRef]79. El-Geneidy, A.; Diab, E.; Jacques, C.; Mathez, A. Sustainable Urban Mobility in the Middle East and North Africa; Global Report on
Human Settlements; United Nations Pck edition: New York, NY, USA, 2013; p. 60.80. Khadem Sameni, M.; Preston, J.; Khadem Sameni, M. Evaluating efficiency of passenger railway stations: A DEA approach. Res.
Transp. Bus. Manag. 2016, 20, 33–38. [CrossRef]81. Mitchell, R.C.; Carson, R.T. Using Surveys to Value Public Goods: The Contingent Valuation Method; RFF Press: New York, NY,
USA, 2013. [CrossRef]82. Le Gall-Ely, M. Definition, Measurement and Determinants of the Consumer’s Willingness to Pay: A Critical Synthesis and
Avenues for Further Research. Rech. Appl. Mark. Engl. Ed. 2009, 24, 91–112. [CrossRef]
Related Documents