Rivista Italiana di Economia Demografia e Statistica Volume LXVII n. 2 Aprile-Giugno 2013 MEASURING CHRONIC POVERTY IN ITALY 1 Luigi Fabbris, Irene Sguotti 1. Chronic poverty measurement In this study we address the problem of measuring poverty using longitudinal data, that is, data that is repeatedly measured for the same units (individuals, families) in a particular time span. Although our results could apply to more general data collection methods, we will specifically refer to a multi-annual panel of households surveyed on an annual basis. Two adjectives related to poverty recur in the paper, chronic and transient. Referring to lack of resources, the adjectives specify that poverty is not uniquely defined and manifests in various forms. Chronic poverty affects units (individuals, families or communities) for a long period of time; transient poverty affects units for a certain period of time but not for long, and recurrent poverty affects units in fluctuating spells around the poverty line 2 , a situation that is occasionally termed ‘churning’. Thus, at a certain point in time, the poor may be either suffering from chronic or transient poverty and the correlates of entries to and exit from poverty may differ from those of cross-sectional poverty (see, among others 3 , Bane and 1 This work was pursued as part of a 2008 project of Padua University (CUP CPDA081538) entitled “Effectiveness indicators of tertiary education and methodological outcomes of the research on University of Padua graduates”, coordinated by L. Fabbris. The authors share responsibility for the paper as a whole; in detail, Luigi Fabbris wrote Sections 1, 3 and 5 and subsections, and Irene Sguotti wrote Sections 2 and 4 and subsections. 2 With reference to a particular period, the poverty line is the lowest annual income a person would need to achieve the same welfare level as he or she could if undertaking inter-period income transfers subject to his or her budget constraints (Aaberge & Mogstad, 2007). Similarly, a minimum sustainable consumption may be defined as the minimum income transfers required to achieve constant consumption levels over time. According to Rodgers and Rodgers (1993), permanent income is the maximum sustainable annual consumption level an individual can achieve with a given stream of real income. The empirical estimation of the poverty line depends on national or international conventions. 3 The definition of chronic poverty differs according to authors’ social and political perspectives towards the measurement of poverty. For example, Aaberge & Mogstad (2007) define the chronically poor as those with persistent inability to pursue welfare due to lack of economic means.

Welcome message from author
This document is posted to help you gain knowledge. Please leave a comment to let me know what you think about it! Share it to your friends and learn new things together.
Transcript

Rivista Italiana di Economia Demografia e Statistica Volume LXVII n. 2 Aprile-Giugno 2013
MEASURING CHRONIC POVERTY IN ITALY1
Luigi Fabbris, Irene Sguotti
1. Chronic poverty measurement
In this study we address the problem of measuring poverty using longitudinal
data, that is, data that is repeatedly measured for the same units (individuals,
families) in a particular time span. Although our results could apply to more
general data collection methods, we will specifically refer to a multi-annual panel
of households surveyed on an annual basis.
Two adjectives related to poverty recur in the paper, chronic and transient.
Referring to lack of resources, the adjectives specify that poverty is not uniquely
defined and manifests in various forms. Chronic poverty affects units (individuals,
families or communities) for a long period of time; transient poverty affects units
for a certain period of time but not for long, and recurrent poverty affects units in
fluctuating spells around the poverty line2, a situation that is occasionally termed
‘churning’. Thus, at a certain point in time, the poor may be either suffering from
chronic or transient poverty and the correlates of entries to and exit from poverty
may differ from those of cross-sectional poverty (see, among others3, Bane and
1 This work was pursued as part of a 2008 project of Padua University (CUP CPDA081538) entitled
“Effectiveness indicators of tertiary education and methodological outcomes of the research on
University of Padua graduates”, coordinated by L. Fabbris. The authors share responsibility for the
paper as a whole; in detail, Luigi Fabbris wrote Sections 1, 3 and 5 and subsections, and Irene Sguotti
wrote Sections 2 and 4 and subsections. 2 With reference to a particular period, the poverty line is the lowest annual income a person would
need to achieve the same welfare level as he or she could if undertaking inter-period income transfers
subject to his or her budget constraints (Aaberge & Mogstad, 2007). Similarly, a minimum
sustainable consumption may be defined as the minimum income transfers required to achieve
constant consumption levels over time. According to Rodgers and Rodgers (1993), permanent income
is the maximum sustainable annual consumption level an individual can achieve with a given stream
of real income. The empirical estimation of the poverty line depends on national or international
conventions. 3 The definition of chronic poverty differs according to authors’ social and political perspectives
towards the measurement of poverty. For example, Aaberge & Mogstad (2007) define the chronically
poor as those with persistent inability to pursue welfare due to lack of economic means.

100 Volume LXVII n. 2 Aprile-Giugno 2013
Ellwood, 1986; Devine et al., 1992; Chaudhuri and Ravallion, 1994; Nord, 1997;
Baulch and McCulloch, 1998; Stevens, 1999; Jalan and Ravallion, 2000; Chronic
Poverty Research Centre, 2001; Headey and Warren, 2008).
There are two strategies for defining the poverty line, relative and absolute. The
former refers to earning less income than a certain proportion of the mean or
median of the population, while the latter refers to the insufficiency of the available
income to obtain a set of durables or services that are believed to be essential in the
community that the units belong to (Citro and Michael, 1995; Lipton, 1997; Istat,
2009).
In this study we present and discuss some indicators of chronic poverty that
pertain to the income distribution of a given population and that could apply,
mutatis mutandis, to consumption distribution. In addition, we consider an index of
material deprivation (Townsend, 1987; Whelan et al., 2004; Whelan and Maître,
2007; Eurostat, 2012a) that refers to a state of economic strain and the
impossibility of acquiring a certain set of durables and services.
What is interesting in the material deprivation approach is the possibility of
comparing two individuals, households or western communities on the objective
basis of a set of dichotomous variables and define the unit that is unable to obtain a
certain basket of the involved goods/services4. We refer to Eurostat EU-SILC
(European Union – Statistics on Income and Living Conditions) data, in which the
examined items are nine and a family is considered “deprived” if it does not get
three items and “severely deprived” if the missing items are four. The concerned
goods and services are: the enforced inability to pay unexpected expenses; afford a
one-week annual holiday away from home; eat a meal involving meat, chicken or
fish every second day; afford adequate heating of a dwelling; durable goods such
as a washing machine, colour television, telephone or car; and being confronted
with payment arrears, such as mortgage or rent, utility bills, hire purchase
instalments or other loan payments.
The observational rationale for chronic poverty is the repetitiveness of poverty
measures. We analysed Italian EU-SILC data on households collected for three
panels of Italian households for four consecutive years beginning 2004, 2005 and
2006, respectively, thereby making easy to obtain annual data on a household’s
4 Mutatis mutandis, Alkire and Santos (2010) propose a similar approach to measure
multidimensional poverty. The authors also assume that the data may be collected from the same
survey. The considered items, which are believed to be appropriate for developing countries, may not
apply to the analysis of living standards in an OECD country. A common set of indices could be used
for the analysis of poverty in both developed and developing countries only if aspects of deprivation
are given weights that differentiate their importance in various countries. Moreover, the problem of
compensability of various aspects must also be considered; for example, the possession of a
commodity should not be used to compensate infant mortality.
Rivista Italiana di Economia Demografia e Statistica 101
equivalised income5; from this it was possible to establish if and when the
household is to be considered poor. Precisely, one cohort of households began in
2004 and ended in 2007, a second began in 2005 and lasted till 2008, and a third
began in 2006 and lasted till 2009.
The principles adopted for constructing the new indices were: (a) use all the
data collected to measure the annual estimates, to make the longitudinal index
smooth and representative of the entire period it represents, (b) recognise the
meaning ascribed to the index by analysts accustomed to work on poverty
indicators, (c) ensure that it is as easy to construct and understand as possible so
that even laymen can compute and use it, (d) if possible, ensure that it is a
continuous numerical variable, rather than a simple in or out of chronic poverty; (e)
ensure that it makes sense if compared across years, OECD countries and (Italian)
sub-populations, and (f) ensure that it would be of help to orientate policy-makers
who are willing to eradicate poverty or mitigate its effects.
The remainder of this paper is organised in the following manner. In Section 2,
we systematically describe the current and new types of measures of chronic
poverty. In Section 3, we provide certain criteria to evaluate the quality of the
proposed indices. In Section 4, we present an application of the new indices to
Italian households with reference to EU-SILC data, and in Section 5 we present the
conclusions.
2. New measures of chronic poverty
To ascertain poverty duration, households or individuals have to be observed at
length. Poverty duration is relevant in defining a unit as being either chronically
poor or merely transitionally poor. Corcoran (1995) and Alber (2001) suggest a
five-year survey for ascertaining the type of poverty, but the time horizon can be
shorter or longer depending on measurement purposes. In technical terms, the
observation interval must be sufficiently long to be able to evaluate either
individual spans of poverty from fall to end, or detect spans that are long enough to
enable researchers to estimate the parameters of the poverty-periods distribution.
In a perspective framework, the poverty duration can be measured by observing
the condition of the same set of families/individuals on a regular basis. The EU-
SILC data collection is conducted on an annual basis, that is, every year a panel of
families is observed with a common methodology to evaluate their economic and
social conditions and detect if these conditions represent a cross-sectional state of
poverty. A series of poverty spells permit the researcher to surmise the continuity 5 The equivalent income is computed starting from the total income entering a household and
changing it depending on the number of adults and children belonging to the household.

102 Volume LXVII n. 2 Aprile-Giugno 2013
of the phenomenon, while a variety of states makes it evident that observational
units fluctuate around the poverty threshold; moreover, a repeated assessment that
units never fall below the poverty line highlights the most favourable condition of
units being free from economic uneasiness during the period under analysis.
The extent to which recurrent spells of poverty can be considered as a form of
chronic poverty is important. For instance, at what point does a change in welfare
shifts from being transitory to being a part of the norm, that is, a permanent
component of poverty? Even people who ‘churn’ during a particular period of time
may be a component of poverty because this may imply that they are unable to
escape poverty (Hulme et al., 2001).
To analyse the dynamics of poverty, it is necessary to distinguish between the
‘spells’ and the ‘components’ approach. The former approach is appropriate for
identifying the chronically poor, the latter to understand the causes of chronic
poverty (Hulme et al., 2001; Yaqub, 2000). In fact, the spells analysis focuses on
transitions between welfare states, while the components analysis aims at
highlighting the relative contributions made by structural factors and events to a
household in poverty. In all countries, a quota of people whose mean income drops
below the poverty line (‘components approach’) is also chronically poor in all the
years that the household is below the poverty line (‘spells approach’).
In the following sections, we propose indices of chronic poverty diffusion
(Section 2.1), chronic poverty severity (Section 2.2), income inequality (Section
2.3) and chronic deprivation among the poor (Section 2.4).
2.1. Diffusion of chronic poverty
A unit can be classified into one of the following three categories according to the
number of times it falls below the poverty line in a particular period:
- never poor, if the household income was systematically above the poverty
line in the four survey occasions;
- temporary, or transient poor, if the household income fell below the poverty
line during one or two survey periods, not necessarily consecutive;
- chronically poor, if the household income was below the poverty threshold
for three years, not necessarily consecutive, or for all four survey occasions.
If the unit’s income was below the poverty line for three years, it is
considered as chronically poor since three years is the majority of the
surveyed time; this implies that the mean income during the four years of

Rivista Italiana di Economia Demografia e Statistica 103
survey was in general below the poverty line6. If the surveyed unit was poor
for all survey occasions, it is possible to assert that is was poor for at least
four years, the poverty span being a censored period7.
Household j belonging to the n*-sized sample (n* is the number of sampling
units who respond in all four survey occasions) is considered poor if its income, yij,
falls below the stated poverty threshold at least three times out of four survey
occasions. For occasion i (i=1, …, 4), the ‘head count ratio’ is
* *
**
n
j
iij
in
q
n
yH (1)
This index is analogous to that suggested in Eurostat (2012a). It takes any value
between zero and one: it is zero if there are no chronically poor households in the
population and one if the entire population lives in chronic poverty conditions.
Our index permits us to distinguish between chronic and transient forms of
poverty according to the number of survey occasions for which the units have
endured an insufficient annual income. The rationale of this index may be referred
to as the ‘spell approach’ (Bane and Ellwood, 1986; Stevens, 1994; Cappellari and
Jenkins, 2004). The basic principle of this approach is that income can be
transferred within a year, but not between years (Rodgers and Rodgers, 1993); this
may conflict with empirical evidence that households undertake inter-temporal
income transfers (savings and borrowings) to smoothen their consumption style
(Browning and Crossley, 2001) and also that poverty depth as well as inequality in
the distribution of income among the poor remain hidden within measures (see
Sections 2.2 and 2.3).
6 In Jalan and Ravaillon (2000) four classes of poverty are hypothesised. Hulme et al. (2001) use the
following five categories: (i) always poor, if income or consumption in each period below the poverty
line; (ii) usually poor, if mean expenditures over a period are below the poverty line, but not always
poor; (iii) churning poor, if mean expenditures are close to the poverty line but occasionally below
and other times above the line; (iv) occasionally poor, if mean expenditures over a period are above
the poverty line but below in at least one period; and (v) never poor, if mean expenditures are always
above the poverty line. Further, a threefold categorisation is also possible: (a) always severely poor,
combining classes (i) and (ii), (b) vulnerable to poverty with reference to the churning class, and (c)
wealthy non-poor obtained by combining classes (iv) and (v). The indicator known as “persistent risk-
of-poverty rate (60% median)”, suggested by the EU as a measure of social exclusion (Atkinson et al.,
2004), is constructed in the same manner as ours. 7 Both three or four years of poverty make the emergence from poverty very unlikely: Yaqub (2000),
analysing the poverty in the United States, found that those who have been in poverty for over four
years have a 90% probability of remaining poor the rest of their lives.

104 Volume LXVII n. 2 Aprile-Giugno 2013
2.2. Severity of Chronic Poverty
The severity of chronic poverty can be measured using several indices, all of which
refer to the relative mean distance of poor households from the poverty threshold.
The mean distance from the poverty threshold zi, in year i (i=1, …, k), relative to
the threshold itself, is a measure of the severity of poverty. The formula can be
written in the following manner:
i
iji
j
q
j i
iji
i
iz
yzE
z
yz
qP
i1 (2)
where qi is the number of units whose income is below the poverty line and Ej(.)
denotes the expected value of the argument pertaining to poor units. The index
belongs to the class of ratios between a distance and its maximum value:
.)max(
ij
ij
j
i
iji
jid
dE
z
yzEP (3)
Index Pi ranges between zero and one, where zero is the case in which all units
equal the threshold and one is the case when all incomes below the threshold are
null. Hence, the index –also known as the ‘income gap ratio’ or ‘intensity of
chronic poverty’– measures ‘how poor are the poor’, that is, the distance of the
average income of chronically poor units from the poverty line. In fact, the
numerator of the index is the amount of economic resources that must be invested
for all poor units to achieve the threshold income. This is why this index is
particularly sensible if applied to the measurement of absolute poverty.
Applied to a multi-annual period, the gap estimate is the weighed average of
the annual indices for q* chronically poor units, *)|(/ qPEkPP iii i .
Intense poverty may make income mobility of the poor and, in general, their
exit from poverty more difficult, given the reinforcing nature of the different
dimensions of deprivation. In fact, the longer the duration of poverty, the more
difficult it is for the poor to emerge from chronic poverty independently.
It may be opportune to use a different indicator, based on the product of the
diffusion, Hi, and the severity of poverty, Pi:
)...,,1(11
kiz
y
n
q
z
yz
nPHPG
i
i
i
i
q
j i
iji
i
iii
i
(4)

Rivista Italiana di Economia Demografia e Statistica 105
which becomes the income gap computed over ni units, instead of qi. This index is
also termed ‘poverty gap of the poor’.
The PG index, computed as an average of k annual PGi indices, is at all similar
to P: )|(/ iiii ii nPEkPHPG . It is easy to show that both P and PG indices
can be negative if the temporarily poor units are considered, while it is, in general,
positive for chronically poor units but could be negative for ‘churning’ units.
Foster et al. (1984) suggested an even more general index of poverty based on
the average power of the argument of the income gap:
)...,,1(01
kiz
yz
nPG
iq
j i
iji
i
i
(5)
This index, called ‘poverty aversion’ by Foster and co-authors, coincides with
the diffusion index Hi (formula 1) for = 0 and the poverty gap PGi (formula 4)
for = 1. Values of greater than one imply that lower incomes become more
important in evaluating the poverty gap. The authors suggest computing the gap by
squaring the relative distance of the poor units from the threshold, thereby
ascribing greater importance to units with very low or null income. All indices
based on formula (5) vary between zero and one and can be interpreted as the
parallel index PG.
We propose to compute the quadratic index of chronic poverty gap as the
simple average of the k annual estimates, that is, 2PG=Ei(2PGi).
2.3. Income Inequalities and Poverty
Sen (1976) proposes an index that is based both on the average income and on
Gini’s inequality measure of income distribution (Gini, 1912) below the poverty
line. Indexing the units in a non-decreasing order of income (yij ≤ yi,j+1), the Gini
index is computed in the following manner:
iq
j i
iij
i
i kiy
yyj
qG )...,,1(
22
(6)
where iy denotes the mean of the incomes below the poverty line. The Gini index,
as a measure of the concentration of the incomes of the poor, is invariant with
respect to scale transformation of income distributions and ranges between zero

106 Volume LXVII n. 2 Aprile-Giugno 2013
and one: the null value is the case in which all units below the poverty line earn the
same income and the unit value is the opposite case in which all the income below
the poverty line is obtained by a single unit and everyone else has zero income.
Further, Sen’s index is constructed in the following manner:
)...,,1()]1(1[])1([ 1 kiPGPGGPPHS iiiiiiii (7)
where all symbols are known. All components of the index assume values between
zero and one and the composite index varies between zero and one, too. The
composite index is null if all poor units possess the same income and this income
equals the threshold, and one if all q poor people have no income. Moreover, if Gi
= 0, then Si = PGi.
The multi-annual index of poverty and income inequalities is given by the
simple average of k annual estimates, that is, S=Ei(Si).
2.4. Chronic Deprivation and Poverty
The concept of deprivation is analogous to that of absolute poverty, as both
concepts imply the difficulty for families to obtain a basket of durables and
services that are identified as necessities in a reference community. Whether
multiple deprivations are to be considered a direct measure of poverty or merely
risk indicators, is a matter of scientific debate and cultural tension (Watts, 1968;
Ringen, 1988; Atkinson, 1998; Tsui, 2002; Bourguignon and Chakravarty, 2003;
Berthoud et al., 2004; Duclos et al., 2006; Alkire and Foster, 2007; Ravallion,
2011).
Measures of deprivation severity can be constructed as lack-of-income ones
presented in Section 2.2. The ‘diffusion of material deprivation’ can be estimated
with EU-SILC data by applying either the formula:
)...,,1(19
1
)min()max(
)min(ki
x
nxx
xxED
in
j
ij
iijij
ijij
ii
, (8)
which applies to the entire sample of ni (i=1, …, k) units, or the formula:
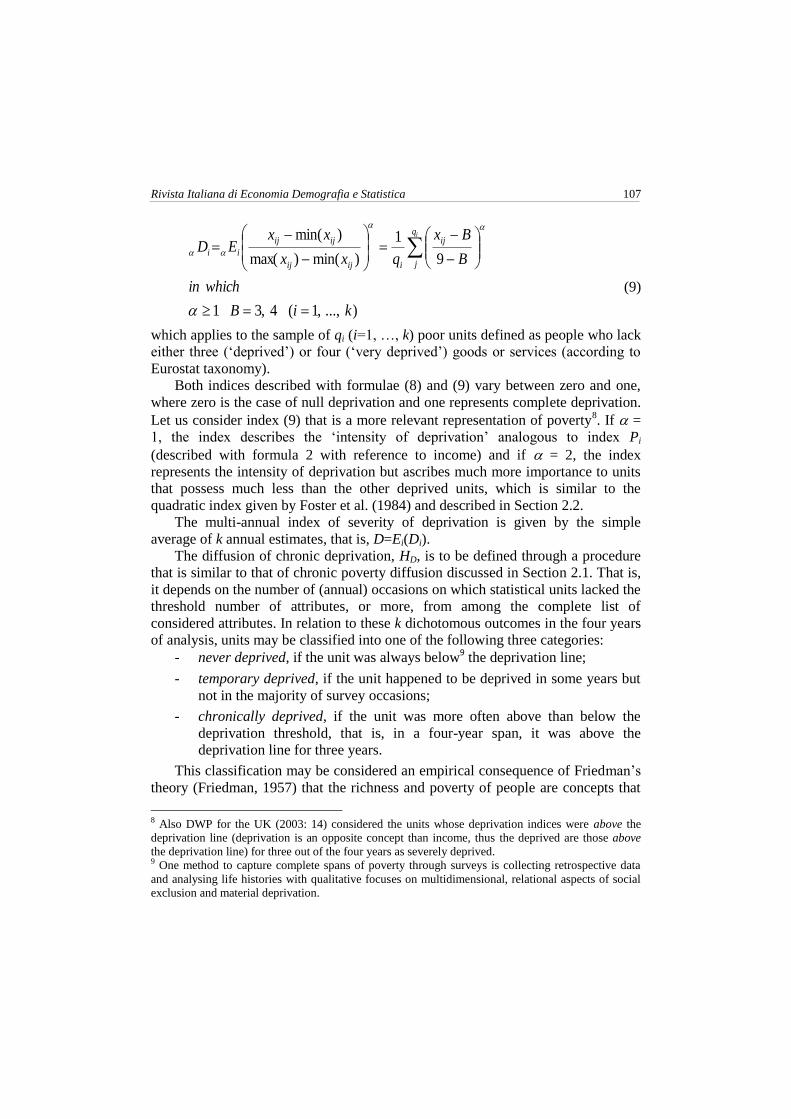
Rivista Italiana di Economia Demografia e Statistica 107
)...,,1(4,31
9
1
)min()max(
)min(
kiB
whichin
B
Bx
qxx
xxED
iq
j
ij
iijij
ijij
ii
(9)
which applies to the sample of qi (i=1, …, k) poor units defined as people who lack
either three (‘deprived’) or four (‘very deprived’) goods or services (according to
Eurostat taxonomy).
Both indices described with formulae (8) and (9) vary between zero and one,
where zero is the case of null deprivation and one represents complete deprivation.
Let us consider index (9) that is a more relevant representation of poverty8. If =
1, the index describes the ‘intensity of deprivation’ analogous to index Pi
(described with formula 2 with reference to income) and if = 2, the index
represents the intensity of deprivation but ascribes much more importance to units
that possess much less than the other deprived units, which is similar to the
quadratic index given by Foster et al. (1984) and described in Section 2.2.
The multi-annual index of severity of deprivation is given by the simple
average of k annual estimates, that is, D=Ei(Di).
The diffusion of chronic deprivation, HD, is to be defined through a procedure
that is similar to that of chronic poverty diffusion discussed in Section 2.1. That is,
it depends on the number of (annual) occasions on which statistical units lacked the
threshold number of attributes, or more, from among the complete list of
considered attributes. In relation to these k dichotomous outcomes in the four years
of analysis, units may be classified into one of the following three categories:
- never deprived, if the unit was always below9 the deprivation line;
- temporary deprived, if the unit happened to be deprived in some years but
not in the majority of survey occasions;
- chronically deprived, if the unit was more often above than below the
deprivation threshold, that is, in a four-year span, it was above the
deprivation line for three years.
This classification may be considered an empirical consequence of Friedman’s
theory (Friedman, 1957) that the richness and poverty of people are concepts that
8 Also DWP for the UK (2003: 14) considered the units whose deprivation indices were above the
deprivation line (deprivation is an opposite concept than income, thus the deprived are those above
the deprivation line) for three out of the four years as severely deprived. 9 One method to capture complete spans of poverty through surveys is collecting retrospective data
and analysing life histories with qualitative focuses on multidimensional, relational aspects of social
exclusion and material deprivation.

108 Volume LXVII n. 2 Aprile-Giugno 2013
refer to their expected income over a lifetime or a large proportion thereof. This
implies that durable goods may remain available for many years and thus the
diffusion index of chronic deprivation reflects the length of possibly censored
deprivation periods.
3. Criteria for index selection
The poverty indicators proposed in Section 2 can be classified as either
possessing or not possessing certain mathematical properties, also called axioms
(Sguotti, 2013). Let us denote the income of a population of N units with y, its
poverty line with z and a measure of chronic poverty with P(y; z), function of y and
z. Poverty indicators could possess one or more of the following properties:
a) Linear invariance. This implies that indices should not vary if income is
measured either in a different currency or using indirect scales. Thus, any
linear transformation of the income of the j-th unit jj byax , with
positive b, maintains the order of income owners and, in particular, both
the proportion and the severity of poverty are equal to those of y:
);();( bzaxHzyH and );();( bzaxPzyP . Mutatis mutandis,
this property is similar to that of ‘population invariance’, as described in
Baldini and Toso (2004), that entails the invariance of both the frequency
and severity indices that can be obtained by replicating t times (t > 1) the
initial distribution, y, of incomes below the poverty line. If only the
incomes below the poverty line are considered, any decrease in income of
one or more of these units should increase the severity of poverty. If, for
example, xj = yj - k, with k > 0 and j = 1, …, q, then );();( zxPzyP . Sen
(1976) terms this latter property monotonicity.
b) Additive decomposability. Suppose the population is divided into G groups
and a poverty index is computed for each. An indicator is additively
decomposable if it can be obtained through a weighed average of group
poverty indices. Suppose wg denotes the weight of group g (g=1, …, G)
and P(yg; z) its poverty index, the decomposable population index is given
by: g
G
g
g wzyPzyP );();( .
c) Anonymity, or symmetry, implies that poverty indices are indifferent to
units’ identifiers. Thus, if units j and k (j k = 1, …, q) swap their
incomes, the index of poverty frequency does not vary after the swap if the
units are either both below or above the poverty line, or if they are one
Rivista Italiana di Economia Demografia e Statistica 109
above and the other below the line: );();( zxHzyH , where x denotes
the income distribution of newly-labelled units10
. The same holds for
measuring the severity of poverty for units below the poverty line:
);();( zxPzyP .
d) Transfer sensitivity. This implies that if a quota c of the unit j income, yj, is
transferred to another unit k, which has a greater income (yj < yk z; xj = yj
- c; xk = yk + c; j k = 1, …, q), the measure of poverty of the former unit
increases and so should do the overall measure of poverty intensity:
);();( zxPzyP . The symmetric expression of this property is the
identification axiom, as described in Baldini and Toso (2004), which
claims the invariance of the measure of poverty to any monetary re-
distribution among units that are above the poverty line and remain above
it after re-distribution:
);();( zxPzyP ; zxxkykyyx mlmlj ),(;...)..,;..,,( .
In the following account, the indicators of the classes H, P, PG, G and S, as
presented in Section 2, will be defined according to the aforementioned properties.
In particular, in Section 3.1 the indices based on the head count of the poor are
examined, in Section 3.2 linear and the quadratic measures of chronic poverty
intensity are examined, and in Section 3.3 measures of the intensity of chronic
poverty and the Gini inequality measure among the poor are juxtaposed.
3.1. Head Count Measures of Chronic Poverty
The indicators of chronic poverty based on the headcount of those who possess a
given characteristic, that is, H (formula 1) and HD (Section 2.4), require a count of
the units with insufficient income and materially deprived, respectively.
With reference to the three categories of never, temporary or always
poor/deprived, both longitudinal indicators possess the properties of anonymity,
insensitivity to linear variation of the basic (annual) data, and also among-group
additivity, provided we confine the statistical analysis to units with valid values at
any survey occasion and maintain a single poverty line. The indicators are
insensitive to any intra-year between-units transfer of income/durables that occurs
above the poverty line. They are also insensitive to income transfers below the
poverty line unless it permits the poor during one or more survey occasions to cross
the poverty line.
10 See also Baldini and Toso (2004) for comments on anonymity.

110 Volume LXVII n. 2 Aprile-Giugno 2013
The possibility of decomposing a longitudinal index into group indices
qualifies it as a malleable measure of poverty diffusion. Since total poverty is a
weighted average of subgroup levels, a decrease in the poverty level of a subgroup
should lead, ceteris paribus, to less poverty in the population as a whole.
According to poverty-reduction policies, it is then possible to anticipate the level of
poverty in the entire population.
3.2. Linear and Quadratic Intensity of Chronic Poverty
The indices based on the relationship between either the absolute distance or the
quadratic distance from the poverty line –that is the indices P1 = PG (formula 4)
and P2 (formula 5) for a standard comparison– in general provide similar
indications even though their values differ.
Both linear and quadratic indices of chronic poverty possess, at the very least,
the properties of the class of decomposable indices of poverty proposed by Foster
et al. (1984). They possess the properties of anonymity of units and insensitivity to
income transfer that occur above the poverty line. Since they are also invariant to
positive linear transformations of (basic) annual data, the following identities are
found: );();( iijiij zbaxPzyP and 22 );();( iijiij zbaxPzyP , where xij =
a + b yij and zi is the poverty line of year i (i = 1, …, 4).
Linear and quadratic indicators are also additively decomposable into group
indicators if the population is stratified into groups, provided the poverty line of a
given annual distribution is fixed. It is worth noting that measures relying on rank-
order of the population units (as Sen’s measures do) fail to satisfy the basic
condition that an increase in subgroup poverty must increase total poverty.
3.3. Intensity of Chronic Poverty and Inequality among the Poor
Using a similar notation to ease understanding, Sen’s index contains the
intensity of poverty and the Gini inequality index proportional to P + G P × G,
where P is the intensity of poverty (formula 2) and G is the Gini inequality index
among the poor (formula 6).
What sets apart the Gini inequality index from both linear and quadratic
measures of lack-of-income severity is that inequality is computed as the distance
from a distribution mean and not from a poverty line. This implies that most
severity measures are negatively correlated with inequality measures. Moreover,
inequality is a mean of individual income values multiplied by the rank order of

Rivista Italiana di Economia Demografia e Statistica 111
that value in the income distribution. This implies that we can expect a good
correlation between the Gini index and quadratic measures of severity, as
expressed in formula (5) with = 2.
Measures defined by formula (5), for = 1 or 2, retain the property of group
decomposability if a common set of units, n*, is followed up during the
observational period. Instead, group decomposition of inequality measures involves
a ‘between-group’ term to account for the differences among group mean incomes
(also see Bourguignon, 1979; Shorrocks, 1980).
4. Chronic poverty in Italy
The indicators proposed as measures of chronic poverty have been applied to
EU-SILC data collected for various years in Italy. The data pertain to three cohorts
of Italian families (2204, 2005 and 2006 samples), each one followed up for four
years. Incomplete observational periods have been excluded. The sample size of
the three cohorts is 12,260 families. Out of this large sample, 3,652 families fell
below the poverty line referred to the ‘relative’ distribution of income, and 1,487
fell below the ‘absolute’ poverty line of the same sample distribution at least one.
The distribution of income is characterised by a moderate variability in time.
Tables 1, 2 and 3 show that a large proportion of income earners remain within the
same distributional quintile, but it is much more likely that they remain within the
lowest quintile (with a 64% probability, four years apart) or within the highest
quintile (64.8% probability) than within intermediate quintiles (46.3%). In other
words, it is much more likely that the poorest proportion of the population remains
the poorest and that the richest remains the richest.
Table 1 ‒ Transitions between income quintiles of EU-SILC panels of Italian families at
first* and last** survey occasion (sample size of 2004, 2005 and 2006 cohorts
of households: 12,260).
First occasion
Last occasion Total
I II III IV V
I 64.0 21.5 8.8 3.5 2.2 100.0
II 20.3 48.4 19.5 8.6 3.2 100.0
III 8.8 18.7 44.0 20.3 8.2 100.0
IV 4.1 7.8 19.9 46.6 21.6 100.0
V 2.9 3.5 7.9 21.0 64.8 100.0
Note: (*) Q1=8655.7 Q2=12212.4 Q3=16145.0 Q4=21680.6
(**) Q1=9629.4 Q2=13557.7 Q3=17753.0 Q4=23851.4

112 Volume LXVII n. 2 Aprile-Giugno 2013
Table 2 ‒ Transitions between income quintiles of EU-SILC panels of the Italian poor at
first* and last** survey occasion (sample size of 2004, 2005 and 2006 cohorts
of households that fell at least once below the “relative” poverty line: 3,652)
First occasion
Last occasion Total
I II III IV V
I 40.2 16.8 9.3 15.8 17.9 100.0
II 17.6 33.1 11.7 17.3 20.3 100.0
III 9.2 18.3 33.3 20.5 18.7 100.0
IV 14.9 16.3 23.2 30.1 15.5 100.0
V 18.3 15.6 22.2 16.3 27.6 100.0
Note: (*) Q1=5350.8 Q2=7072.0 Q3=8292.2 Q4=11091.5
(**) Q1=6256.2 Q2=7908.0 Q3=9200.6 Q4=12295.6
A similar ‘absorbing’ effect can be observed if the analysis is confined to
families that fell at least once below the poverty line: the poorer families among the
poorest ones are much more likely to remain poor for the entire observational
period than families who churn around the poverty line. The phenomenon is more
evident if a broader (i.e. ‘relative’) definition of chronic poverty is adopted: the
lower quintile of the relatively poor can be found in the same distributional quintile
four years apart with a 40.2% probability, while the quintile close to the poverty
line is stuck to the same position with 27.6% probability (Table 2). This
phenomenon is confirmed, although it is less evident, for the absolute poor (Table
3).
Table 3 ‒ Transitions between income quintiles of EU-SILC panels of the Italian
poor at first* and last** survey occasion (sample size of 2004, 2005
and 2006 cohorts of households that fell at least once below the
“absolute” poverty line: 1,487)
First occasion
Last occasion Total
I II III IV V
I 32.9 13.1 11.4 19.8 22.8 100.0
II 14.5 24.9 18.5 22.9 19.2 100.0
III 8.9 17.0 29.7 21.5 22.9 100.0
IV 20.6 25.6 24.3 19.9 9.6 100.0
V 23.2 19.1 16.1 15.8 25.8 100.0
Note: (*) Q1=4229.6 Q2=5980.0 Q3=7072.0 Q4=10529.1
(**) Q1=5047.3 Q2=6948.7 Q3=8406.9 Q4=11936.0
The estimates of the chronic poverty indices and chronic deprivation indices are
presented in Tables 4 (relative poverty approach) and 5 (absolute poverty
approach). It is evident that:

Rivista Italiana di Economia Demografia e Statistica 113
Table 4 ‒ Indices of relative chronic poverty and chronic material deprivation
(missing 3 items) in Italy by cohort (EU-SILC data)
2004-2007 2005-2008 2006-2009 All samples
Chronic poverty diffusion 14.83 14.83 15.33 14.99
Severity of chronic poverty 23.00 25.52 25.14 24.54
Poverty gap index 3.41 3.79 3.85 3.68
Sen’s chronic poverty index 6.06 6.49 6.55 6.36
P2 index of chronic poverty 3.15 3.14 3.43 3.24
Transitory poverty diffusion 14.87 14.88 14.63 14.80
Severity of transitory poverty -28.16 -25.75 -27.44 -27.44 Chronic deprivation diffusion 22.73 23.56 20.15 22.16
Severity of chronic deprivation 12.82 11.83 11.41 12.06
P2 index of chronic deprivation 1.36 1.21 1.16 1.25
- Chronic poverty is much less frequent than cross-sectional poverty and even
than chronic deprivation. Chronic poverty involves approximately 15% of the
Italian families, while material deprivation exhibits larger figures
(approximately 22%). Of course, we can surmise that the material deprivation
index also includes transitory poverty, which involves approximately another
15% of the families. The indicators of severity of chronic poverty differ
slightly from those of chronic deprivation and Sen’s index after
standardisation by sample size: the poverty gap index is 3.7% on average
versus 12.1% of deprivation and 6.4% of Sen’s index, the latter aimed at
indicating both lack of income and income inequality.
Table 5 ‒ Indices of absolute chronic poverty and severe chronic deprivation
(missing 4 items) in Italy by cohort (EU-SILC data)
2005-2008 2006-2009 All samples
Chronic poverty diffusion 5.89 6.08 5.98
Severity of chronic poverty 30.63 29.06 29.84
Poverty gap index 1.80 1.77 1.79
Sen’s chronic poverty index 3.15 3.15 3.15
P2 index of chronic poverty 1.92 1.85 1.89
Transitory poverty diffusion 12.05 12.90 12.47
Severity of transitory poverty -34.21 -37.80 -36.27 Severe chronic deprivation diffusion 9.57 9.73 9.07
Severity of chronic deprivation -11.48 9.46 10.16
P2 index of chronic deprivation 0.71 0.57 0.61

114 Volume LXVII n. 2 Aprile-Giugno 2013
- All figures concerning measures of chronic poverty in absolute terms are
lower than those representing relative poverty. Hence, absolute poverty
indices tend to assume values that are more similar to each other, but
differences are still important: the diffusion of poverty is approximately 6%
with reference to lack of income and approximately 9% with reference to
material deprivation. The severity of lack of income is 1.8%, Sen’s index
3.2% and the severity of material deprivation of the poor is 10.2%. Some
estimates of severe chronic deprivation have a negative sign. This implies that
a measure of the diffusion of chronic material deprivation cannot be taken as a
substitute of a measure for lack of income if the chronic poverty of families is
to be ascertained.
- Quadratic indices of severity of lack of income are similar in value or lower
than the linearly constructed ones: this implies that the poorest of the poor are
not that poor and, similarly, the poorest of the poor are not that deprived (of
course, the quadratic form is always positive).
To focus on differences between lack of income and deprivation, we attempted
a cross-comparison of their distributions with reference to the relative and absolute
poverty of families. The results are presented in Tables 6 and 7.
Table 6 ‒ Cross-tabulation of EU-SILC 2004, 2005 and 2006 cohorts of Italian
families according to relative poverty and severe (4 items) material
deprivation in 4 survey occasions (n=12,260)
Relatively poor
Materially deprived
Never Transitory Chronically Total
Never 58.5 8.5 3.2 70.2
Transitory 9.5 3.5 1.8 14.8
Chronically 6.1 4.8 4.1 15.0
Total 74.1 16.8 9.1 100.0
Table 7 ‒ Cross-tabulation of EU-SILC 2005 and 2006 samples of Italian families
according to absolute poverty and severe (4 items) material deprivation
in 4 survey occasions (n=8058)
Absolutely poor
Materially deprived
Never Transitory Chronically Total
Never 65.5 11.1 4.9 81.5
Transitory 6.7 3.6 2.2 12.5
Chronically 2.2 2.1 1.7 6.0
Total 74.4 16.8 8.8 100.0

Rivista Italiana di Economia Demografia e Statistica 115
A majority of poor families show greater symptoms of deprivation than better-
off families. Nevertheless, there are substantial exceptions: some households
experience low income and no sign of deprivation, while others experience higher
income and signs of material deprivation. Hence, the correlation between income
and material deprivation with reference to the entire sample is less that expected: in
fact, the correlation coefficient between the number of episodes of poverty and the
mean number of material items families were deprived in four years is 0.35 for the
absolute poor and 0.45 for the relative poor.
Then why households with low incomes occasionally experience periods where
they can enjoy high living standards? A similar result was also found by Berthoud
et al. (2004) who hypothesise that it may depend on families with a very low
interest in material consumption, on other families with temporary shortage of
income that had previously accumulated durables –for example household goods–
and also on respondents who under-stated their income to interviewers.
Table 8 ‒ Correlation coefficients between indices of severity of chronic poverty
from EU-SILC 2005 and 2006 samples of Italian families according
(relative poverty coefficients above the main diagonal, n=12260;
absolute poverty below the diagonal, n=8058; only severe material
deprivation is considered)
Severity of
poverty (I)
Quadratic
severity (P2)
Gini ine-
quality (G)
Severe de-
privation (D)
Quadratic
deprivation
Severity of poverty (P1) = -0.56 -0.89 0.33 -0.06
Quadratic severity of
poverty (P2)
0.32 = 0.78 -0.14 0.10
Gini inequality (G) -0.90 0.82 = -0.31 0.11
Severe deprivation (D) 0.31 -0.17 -0.31 = =
Quadratic severe
deprivation (D2)
-0.06 0.13 0.14 = =
Finally, we computed the correlation among indices. Since correlation
coefficients can be evaluated merely on common units, the indices of diffusion
have been excluded from this analysis. The results, presented in Table 8, show that
- the correlation coefficient between indicators based on linear intensity
measures is high, in particular, the correlation is –0.9 between the P1 severity
index and Gini inequality index, irrespective of whether the entire set of
relatively poor families or just the absolutely poor ones are included in the
computation. The inequality index is also highly correlated (approximately
0.80) with P2, the quadratic measure of severity of chronic poverty.
116 Volume LXVII n. 2 Aprile-Giugno 2013
- Linear and quadratic measures of the severity of poverty measured with
reference to income and the analogous measures of the severity of deprivation
measured with reference to a set of nine goods or services are mildly
correlated (approximately 0.30).
5. Conclusions
In this study we suggested a set of indicators for measuring the diffusion and
severity of chronic poverty in a community. The indicators were evaluated using a
set of mathematical properties that revealed that both the indicators of diffusion
and those of severity of chronic poverty do not depend on the scale adopted for
measuring income, consumption or deprivation. Moreover, these indicators enable
a researcher to differentiate the estimates for subgroups of units and are sensitive in
representing the effects of interventions for eradicating poverty in the entire
population or parts of it.
We examined two classes of chronic-poverty diffusion indicators and three
classes of measures of severity of poverty among the poor. The diffusion indicators
referred to the income necessary to reach the poverty line and assess the economic
possibility for them to attain a given basket of durables and services. We verified
that the two aspects of poverty, lack of income and material deprivation, are not
equivalent. In fact, the two measures are mildly correlated.
Hence, an effort should be made to create a greater overlap between the concept
of chronic monetary poverty and short-to-medium-term spending capacity of
families. Some scholars started a European research in connection with Eurostat
(2012b) to fill this need by evaluating much a larger number of items to make
material deprivation a more meaningful dimension of poverty. Moreover, we put
forward that other attempts should be realised at the national level to make the
overlap between the monetary and material deprivation independent of local
cultures.
A measure of severity based on Gini inequality index was compared to the two
above-mentioned dimensions and this yielded rather interesting results: the
inequality measure was found to substantially correlate with lack of income but not
with material deprivation. This is a further proof that severe material deprivation
does not represent the same social phenomenon as severe lack of income.
The high correlation between monetary and material deprivation may depend on
the fact that the lack of income and the Gini inequality index both deal with income
data, although the product of the individual income and its rank order within the
distribution of incomes, on which the Gini index is based, is not the same as the
population of just incomes. Moreover, since the data for the estimation of the two

Rivista Italiana di Economia Demografia e Statistica 117
indices are confined to the lowest portion of the income distribution, the distances
(both linear and quadratic) between individual incomes and the poverty line are
comparable (though with opposite sign) to Gini-type inequalities that are weighted
distances from the mean.
The application of these indicators to the Italian context highlighted that
measures of chronic poverty yield more robust figures than annually measured
poverty. In fact, the chronic poor belong to the lowest portion of the distribution of
incomes, which is so far from the poverty line that indices based on repeated lack
of income are more stable than indices based on cross-sectional, episodic lack of
income. The instability of cross-sectional measures depends on those units that
transient poverty is composed of. This implies that all measurement criteria of
chronic poverty indicate a group of poor that is, at the utmost, socially relevant.
If poverty measures were based only on income, it would be taken for granted
that one dimension is sufficient to describe poverty. However, poverty is a
multidimensional concept, since an income below the poverty line could be
associated with house and durables possession, preparing own food, good health,
literacy, security, and social participation, so positive effects of other dimensions
could mitigate the effect of a low income. Conversely, a sufficient income does not
guarantee that individuals consider themselves non-poor if they struggle because of
other social problems11
. However, multidimensional poverty and chronic poverty
are related phenomena. Chronic poverty reflects a persistently low income, which
is the most deprived situation that might entail moving in and out of other forms of
uneasiness.
Chronic poverty makes it difficult to collect data on those who suffer from
multiple disadvantages. This, in turn, implies that survey data on these units could
be underestimated and also that the representation of the multiplicity of poverty
may be inadequate. Instead, understanding people’s perceptions and strategies is
vital; through data collection on the poor, it may be possible to develop multi-
11 In this study, the possibility of representing the multi-dimensionality of poverty was not a priority.
We also did not consider the fact that deprivation may be transmitted across generations through
economic, social and cultural isolation and that the stigma attached to living in a ‘place of the poor’
could add vulnerability to the poor (Bird et al., 2001; Cattell, 2001). Readers interested in
multidimensional approach can consult, among others, Layte et al. (2000), Yeo (2001); MDS (2002),
Kuklys (2004), Dewilde (2004), Haase and Pratchke (2005), Jenkins and Cappellari (2007),
Tomlinson et al. (2007), and Whelan and Maître (2007). Further, Ringen (1988) and Atkinson et al.
(2007) argue that a low income is merely an indirect measure of poverty and that a direct measure of
social exclusion is necessary. It may be worth adding that here one-dimensionality or multi-
dimensionality does not refer to the outcomes of a statistical testing of the dimensions that describe
the multivariate status of the population (see, among others, Kirishi et al., 2001), but to the
perspectives from which poverty is considered.
118 Volume LXVII n. 2 Aprile-Giugno 2013
dimensional indicators of the width and severity of sources and consequences,
drawing when possible upon existing qualitative research (Hulme et al., 2001).
Finally, it could be interesting to evaluate the conjoint measurement of poverty
since, as Nolan and Whelan (1996), Layte et al. (2000), Perry (2002), Bradshaw
and Finch (2003) and Berthoud et al. (2004) argue, it is not safe to rely on one
measure of poverty alone. The overlapping dimensions that must be considered to
obtain a reliable result include: lacking socially perceived necessities, being
subjectively poor and having a relatively low income. In other words, a poor is a
person who also perceives him/her as deprived.
References
AABERGE R., MOGSTAD, M. 2007. On the Definition and Measurement of
Chronic Poverty, IZA DP No. 2659, IZA, Bonn, Germany.
ALKIRE S., FOSTER, J. 2007. Counting and Multidimensional Poverty
Measurement, Oxford Poverty and Human Development Initiative, Working
Paper 7, University of Oxford, UK.
ALKIRE S., and SANTOS M.E. 2010. Acute Multidimensional Poverty: A New
Index for Developing Countries, Oxford Poverty and Human Development
Initiative, Working Paper 38, University of Oxford, UK.
ALIBER M. 2001. Study of the Incidence and Nature of Chronic Poverty and
Development Policy in South Africa: An Overview, CPRC Working Paper 3,
IDPM, University of Manchester, UK.
ATKINSON A.B. 1998. Social exclusion, poverty and unemployment. In:
ATKINSON A.B., HILLS, J. (Eds.) Exclusion, Employment and Opportunity,
Centre for Analysis and Social Exclusion, CASE Paper 4, London School of
Economics: 1-20 (Ch. 1).
ATKINSON T., ATKINSON A.B., NOLAN B., CANTILLON B. 2007. The EU
and Social Inclusion: Facing the Challenges, The Policy Press, Bristol, UK.
BALDINI M., TOSO S. 2006. La misura della povertà, In: BOSI P. (Ed.) Corso di
Scienze delle Finanze, Il Mulino, Bologna: Cap. 7, lezione 4.
BANE M.J., ELLWOOD D. 1986. Slipping into and out of poverty: The dynamics
of spells, Journal of Human Resources, 21(1): 2-23.
BAULCH B., McCULLOCH N. 1998. Being Poor and Becoming Poor: Poverty
Status and Poverty Transitions in Rural Pakistan, Working Paper 79, Institute of
Development Studies, University of Sussex, UK.
BERTHOUD R., BRYAN M., BARDASI E. 2004. The Dynamics of Deprivation:
The Relationship between Income and Material Deprivation over Time,

Rivista Italiana di Economia Demografia e Statistica 119
Department for Work and Pensions, Research Report No. 219, Institute for Social
and Economic Research, University of Essex, UK.
BIRD K., HULME D., MOORE K., SHEPHERD A. 2001. Chronic Poverty and
Remote Rural Areas, CPRC Working Paper no. 13, IDPM, University of
Manchester.
BOURGUIGNON F. 1979. Decomposable income inequality measures,
Econometrica, 47: 901-920.
BOURGUIGNON F., CHAKRAVARTY S. 2003. The measure of multidimensional
poverty, Journal of Economic Inequality, 1: 25-49.
BRADSHAW J., FINCH N. 2003. Overlaps in dimensions of poverty, Journal of
Social Policy, 32(4): 513-525
BROWNING M., CROSSLEY T. 2001. The life-cycle model of consumption and
saving, Journal of Economic Perspectives, 15: 3-22.
CAPPELLARI L., JENKINS S.P. 2004. Modelling low income transitions, Journal
of Applied Econometrics, 19: 593-610.
CAPPELLARI L. JENKINS S.P. 2007. Summarizing multiple deprivation
indicators. In: JENKINS S.P. and MICKLEWRIGHT J. (Eds) Inequality and
Poverty: Re-Examined, Oxford University Press, Oxford: 166-184.
CATTELL V. 2001. Poor people, poor places, and poor health, the mediating role
of social networks and social capital, Social Science and Medicine, 52: 1501-
1516.
CHAUDHURY S., RAVALLION M. 1994. How well do static indicators identify
the chronically poor?, Journal of Public Economics, 53(3): 367-394.
CHRONIC POVERTY RESEARCH CENTRE. 2001. CPRC Methods Toolbox,
CPRC, Universities of Manchester and Birmingham, UK,
http://www.chronicpoverty.org/uploads/publication_files/Methods%20toolbox.pdf
CITRO C.F., MICHAEL R.T. 1995. Measuring Poverty: A New Approach,
National Academy Press, Washington, DC.
CORCORAN M. 1995. Rags to riches: Poverty and mobility in the United States,
Annual Review of Sociology, 21: 237-267.
DEVINE J.A., PLUNKETT M., WRIGHT J.D. 1992. The chronicity of poverty:
Evidence from the Psid, 1968-1987, Social Forces, 70(3): 787-812.
DEWILDE C. 2004. The multidimensional measurement of poverty in Belgium
and Britain: A categorical approach, Social Indicators Research, 68(3): 31-369.
DUCLOS J.Y., SAHN D., YOUNGER S. 2006. Robust multidimensional poverty
comparisons, Economic Journal, 116: 943-968.
DWP. 2003. Measuring Child Poverty, Department for Work and Pensions,
Stationery Office, London, UK
120 Volume LXVII n. 2 Aprile-Giugno 2013
EUROSTAT. 2012a. Income Poverty and Material Deprivation in European
Countries, 2010 Edition (last update 2012), Methodologies and Working Papers,
Eurostat – European Commission, Luxembourg.
EUROSTAT. 2012b. Measuring Material Deprivation in the EU: Indicators for
the Whole Population and Child-Specific Indicators, Methodologies and Working
Papers, Eurostat – European Commission, Luxembourg.
FOSTER J., GREER J., THORBECKE E. 1984. A class of decomposable poverty
measures, Econometrica, 81(2): 761-766.
FRIEDMAN M. 1957. A Theory of the Consumption Function, Princeton
University Press, Princeton
GINI C. 1912. Variabilità e mutabilità. (Reprinted In: PIZZETTI E., SALVEMINI
T. (Eds.) Memorie di metodologica statistica, Libreria Eredi Virgilio Veschi,
Roma, 1955).
HAASE T., PRATSCHKE J. 2005. Deprivation and its Spatial Articulation in the
Republic of Ireland, NDP, Ireland.
HEADEY B., WARREN D. 2008. Families, Incomes and Jobs, Volume 3: A
Statistical Report on Waves 1 to 5 of the Hilda Survey, Melbourne Institute of
Applied Economic and Social Research, The University of Melbourne, AUS.
HULME D., MOORE K., SHEPHERD A. 2001. Chronic Poverty. Meanings and
Analytical Frameworks, CPRC Working Paper 2, Chronic Poverty Research
Centre, Universities of Manchester and Birmingham, UK
ISTAT 2009. La misura della povertà assoluta, Metodi e norme n. 39,
http://www3.istat.it/dati/catalogo/20090422_00/misura_della_poverta_assoluta.p
df.
JALAN J., RAVALLION M. 2000. Is transient poverty different? Evidence from
rural China, Journal of Development Studies, 36(6): 82-99.
JENKINS S.P., CAPPELLARI L. 2007. Summarizing multiple deprivation
indicators. In: JENKINS S.P., MICKLEWRIGHT J. (Eds) Inequality and Poverty
Re-Examined, University of Oxford Press, Oxford: 166-184 (Chapter 8).
KIRISHI L., HSU T.C., YU L. 2001. Robustness of item parameter estimation
programs to assumptions of unidimensionality and normality, Applied
Psychological Measurement, 25: 146-162.
KUKLYS W. 2004. Measuring Standards of Living in the UK: An Application of
Sen’s Functioning Approach Using Structural Equation Models, Working Paper
on Strategic Interaction 11-2004, Max Planck Institute, Jena, Germany.
LAYTE R., NOLAN B., WHELAN C. 2000. Targeting poverty: Lessons from
monitoring Ireland’s national anti-poverty strategy, Journal of Social Policy,
29(4): 553-575.
LIPTON M. 1997. Defining and Measuring Poverty: Conceptual Issues, UNDP,
New York.

Rivista Italiana di Economia Demografia e Statistica 121
NORD M. 1997. Overcoming persistent poverty – and sinking into it: Income
trends in persistent-poverty and other high-poverty rural counties, 1989-94, Rural
Development Perspectives, 12(3): 2-10.
MDS. 2002 Direct Measurement of Living standards: The New Zealand ELSI
Scale, New Zealand Ministry of Social development, Wellington, NZ.
NOLAN B., WHELAN C.T. 1996. Measuring poverty using income and
deprivation indicators: Alternative approaches, Journal of European Social
Policy, 6(3): 225-240.
PERRY B. 2002. The Mismatch between Income Measures and Direct Outcome
Measures of Poverty, Centre for Social Research and Evaluation, Ministry of
Social Development, New Zealand.
RAVALLION M. 2011. On multidimensional indices of poverty, The Journal of
Economic Inequality, 9(2): 235-248.
RINGEN S. 1988. Direct and indirect measures of poverty, Journal of Social
Policy, 16: 147-164.
RODGERS J.L. and RODGERS J.R. 1993. Chronic poverty in the United States,
Journal of Human Resources, 28(1): 25-54.
RODGERS J.L., RODGERS J.R. 2009. Chronic and Transitory Poverty over the
Life Cycle, Centre for Human and Social Capital Research, School of Economics,
University of Wollongong, NSW, Australia.
SEN A. 1976. Poverty: An ordinal approach to measurement, Econometrica, 44(2):
219-231.
SGUOTTI I. 2013. The Measurement of Poverty (in Italian), Graduation Thesis,
Statistics Department, University of Padua, Italy.
SHORROCKS A.F. 1980. The class of additively decomposable inequality
measures, Econometrica, 48: 613-625.
STEVENS A.H. 1994. The dynamics of poverty spells: Updating Bane and
Ellwood, American Economic Review, 84: 34-37.
STEVENS A. 1999. Climbing out of poverty, falling back in, Journal of Human
Resources, 34: 557-588.
TOMLINSON M., WALKER R., WILLIAMS, G. 2007. Measuring Poverty in
Britain as a Multi-Dimensional Concept, 1991 to 2003, Barnett Paper in Social
Research No. 2007/6, Department of Social Policy and Social Work, Barnett
House, University of Oxford, UK.
TOWNSEND P. 1987. Deprivation, Journal of Social Policy, 16(2): 125-146.
TSUI K.Y. 2002. Multidimensional poverty indices, Social Choice and Welfare,
19: 69-93.
UNDP. Various years. Human Development Report, Oxford University Press, New
York.

122 Volume LXVII n. 2 Aprile-Giugno 2013
WATTS H.W. 1968. An economic definition of poverty. In: Moynihan, D.P. (ed.)
On Understanding Poverty, Basic Books, New York: 316-329.
WHELAN C.T., LAYTE, R., MAÎTRE, B. 2004. Multiple deprivation and
persistent poverty in the European Union, Journal of European Social Policy,
12(2): 91-105.
WHELAN C., MAÎTRE B. 2007. Measuring material deprivation with EU-SILC:
Lessons from the Irish survey, European Societies, 9(2): 147-173.
WHELAN C.T., NOLAN B., MAÎTRE B. 2002. Measuring material deprivation in
an enlarged EU, ESRI Working Paper No. 249.
YAQUB S. 2000. Intertemporal Welfare Dynamics: Extent and Causes,
Background paper for Human Development Report, University of Sussex, UK.
YEO R. 2001. Chronic Poverty and Disability, CPRC Working Paper, IDPM,
University of Manchester.
SUMAMRY
Academic researchers, national statistical offices, the Eurostat and the international
organisations concerned with fighting poverty globally have proposed various measures of
poverty. Some measures address cross-sectional or short-interval poverty; others represent
long-lasting poverty. In this study, we suggest indices to measure the diffusion and severity
of medium-to-long-lasting deprivation of units in a developed community. The indices we
suggest refer to income insufficiency and material deprivation and to the consequences of
economic and social distress on the poor with the hidden purpose of identifying groups that
are at risk of chronic poverty. Further, the severity of poverty in a community is evaluated
according to certain technical properties, particularly the substitutability and discriminatory
capability of the indices.
_________________________
Luigi FABBRIS, Statistics Department, Padua University, [email protected].
Irene SGUOTTI, Padua University, Padua University, [email protected]
Related Documents