Measuring Business Cycles with Structural Breaks and Outliers: Applications to International Data ∗ Pierre Perron † Boston University Tatsuma Wada ‡ Keio University This Version: October 29, 2015 Abstract This paper first generalizes the trend-cycle decomposition framework of Perron and Wada (2009) based on unobserved components models with innovations having a mixture of normals distribution, which is able to handle sudden level and slope changes to the trend function as well as outliers. We investigate how important are the differences in the implied trend and cycle compared to the popular decomposition based on the Hodrick and Prescott (HP) (1997) filter. Our results show important qualitative and quantitative differences in the implied cycles for both real GDP and consumption series for the G7 countries. Most of the differences can be ascribed to the fact that the HP filter does not handle well slope changes, level shifts and outliers, while our method does so. Then, we reassess how such different cycles affect some so- called “stylized facts” about the relative variability of consumption and output across countries. JEL Classification: C22, E32. Key Words: Trend-Cycle Decomposition, Unobserved Components Model, Inter- national Business Cycle, Non Gaussian Filter. ∗ This paper has been circulated under the title “An Alternative Trend-Cycle Decomposition using a State Space Model with Mixtures of Normals: Specifications and Applications to International Data.” We are grateful to James Morley, Charles Nelson, Tara Sinclair and seminar participants at the 11th World Congress of the Econometric Society, Purdue and Simon Fraser Universities, the Federal Reserve Banks of Dallas and Richmond, the Society for Nonlinear Dynamics and Econometrics Annual Meeting at Washington University for their useful comments. † Department of Economics, Boston University, 270 Bay State Road, Boston MA 02215 ([email protected]) ‡ Faculty of Policy Management, Keio University, 5322 Endo, Fujisawa, Japan ([email protected])

Welcome message from author
This document is posted to help you gain knowledge. Please leave a comment to let me know what you think about it! Share it to your friends and learn new things together.
Transcript

Measuring Business Cycles with Structural Breaks and
Outliers: Applications to International Data∗
Pierre Perron†
Boston University
Tatsuma Wada‡
Keio University
This Version: October 29, 2015
Abstract
This paper first generalizes the trend-cycle decomposition framework of Perron
and Wada (2009) based on unobserved components models with innovations having
a mixture of normals distribution, which is able to handle sudden level and slope
changes to the trend function as well as outliers. We investigate how important are
the differences in the implied trend and cycle compared to the popular decomposition
based on the Hodrick and Prescott (HP) (1997) filter. Our results show important
qualitative and quantitative differences in the implied cycles for both real GDP and
consumption series for the G7 countries. Most of the differences can be ascribed to
the fact that the HP filter does not handle well slope changes, level shifts and outliers,
while our method does so. Then, we reassess how such different cycles affect some so-
called “stylized facts” about the relative variability of consumption and output across
countries.
JEL Classification: C22, E32.
Key Words: Trend-Cycle Decomposition, Unobserved Components Model, Inter-
national Business Cycle, Non Gaussian Filter.
∗This paper has been circulated under the title “An Alternative Trend-Cycle Decomposition using aState Space Model with Mixtures of Normals: Specifications and Applications to International Data.” We
are grateful to James Morley, Charles Nelson, Tara Sinclair and seminar participants at the 11th World
Congress of the Econometric Society, Purdue and Simon Fraser Universities, the Federal Reserve Banks of
Dallas and Richmond, the Society for Nonlinear Dynamics and Econometrics Annual Meeting at Washington
University for their useful comments.†Department of Economics, Boston University, 270 Bay State Road, Boston MA 02215 ([email protected])‡Faculty of Policy Management, Keio University, 5322 Endo, Fujisawa, Japan ([email protected])
1 Introduction
Studies of business cycles have been one of the most important and attractive fields in
macroeconomics. Since, at least Burns and Mitchell (1946), a variety of methods have
been utilized to measure business cycle, thereby inspiring theoretical models that explain
the features of the business cycles; alternatively, models are often evaluated on how well
they mimic the characteristics of the business cycles that are observed in the data. The
seminal work of Burns and Mitchell (1946) initiated the modern study of business cycle
measurement. However, subsequently researchers adopted a different approach focusing
more on easily applicable mechanical methods that obviate subjective evaluations. A major
reason why economists have focused on this measurement issue is that most macroeconomic
models pertain to business cycles or cyclical component. Faced with trending data, there is
accordingly a need to separate the trend and the cycle.
Among others, popular decomposition methods are: the Beveridge-Nelson (1981) decom-
position based on unconstrained ARIMA models (Campbell and Mankiw, 1987, Watson,
1986, Cochrane, 1988, for example); the Unobserved Components models (Clark, 1987, Mor-
ley et al., 2003; hereafter UC models); the Hodrick and Prescott (1997) (hereafter HP) filter;
and the Band-Pass filter (Baxter and King, 1999).
Recently, Perron and Wada (2009) showed the importance of accounting for structural
changes in the trend function of a time series when performing a trend-cycle decomposition.
They considered the US real GDP series and argued that once a change in the slope of
the trend function is allowed in 1973:1, standard unobserved components models and the
Beveridge-Nelson decomposition deliver the same trend and cycle, the trend being a simple
piecewise deterministic linear function. They also proposed a generalized unobserved com-
ponents model where the errors affecting the slope of the trend function are drawn from a
mixture of normals distribution.1 This permits sudden changes in the slope occurring occa-
sionally at dates that need not be pre-specified but which are the outcome of the smoothed
trend estimate. Notably, Luo and Startz (2013) recently confirmed Perron andWada’s (2009)
finding using a Bayesian methodology.
While a number of previous studies have considered allowing for a change in the slope
of the trend within the context of UC models, e.g., Mitra and Sinclair (2012) for the G7
countries, in our view allowing for the possibility of changes in only the slope of the trend
1They also consider such a distribution for the shock to the cyclical component to allow different variances
in expansions and recessions.
1

function is insufficient. As discussed in Section 2, when dealing with real GDP series for the
G7 countries, one is also faced with the problems of level shifts and severe outliers. Our aim is,
therefore, first to generalize the trend-cycle decomposition framework of Perron and Wada
(2009) and extend their algorithm to estimate the resulting structural models. Secondly,
we wish to investigate how important are the differences in the implied trend and cycle
for the various countries compared to other methods. Since, in empirical macroeconomic
analyses, the most frequently used detrending procedure is the HP filter, we shall restrict
our comparative analysis to our detrending procedure and the HP filter. Our results will
show important qualitative and quantitative differences in the implied cycles for both real
GDP and consumption series for the G7 countries. As also pointed out by Dueker and
Nelson (2006), who compared their method which uses a latent business-cycle index that is
negative during recessions and positive during expansions based on the NBER classification,
most of the differences can be ascribed to the fact that the HP filter does not handle well
slope changes, level shifts and outliers, while our method does so. Hence, our results first
lead to a different picture of the cyclical component of important macroeconomic time series.
Third, we assess how such different cycles affect some so called “stylized facts” about the
relative variability of consumption and output across countries. Our results show again
some important differences. In particular, we find that i) the volatility of consumption
is not necessarily smaller than that of output, ii) compared to the results using the HP
filter, there are more cases for which cross-country correlation in consumption is higher than
that in output; and iii) unlike the majority of previous studies, including Canova et al.
(2007) and Stock and Watson (2005), there is not much evidence for the hypothesis that the
characteristics of countries’ business cycles can be categorized into three groups of countries,
namely, European (France, Germany, and Italy), Japan, and English speaking countries
(Canada, UK and US).2
The plan of the paper is the following. Section 2 motivates the subsequent analyses by
looking at the salient features of real GDP series for the G7 countries. We establish the
theoretical framework for the trend-cycle decompositions and the selection of models for
each country in Section 3. Section 4 presents the results for the trend-cycle decomposition of
the real GDP and consumption series or the G7 countries and compare the results to those
obtained with an HP filter. Section 5 reassesses the findings about important measures of
cyclical movements in output and consumption across the G7 countries using our trend-
2Doyle and Faust (2005) considered structural breaks in the growth rates of G7 output, consumption,
and investment. They also document a reduced cross-country correlation within the groups.
2

cycle decomposition, with emphasis on the relative volatilities of the cyclical components of
output (real GDP) and consumption, and the cross-country correlations in these components.
Section 6 offers brief concluding comments. An appendix contains technical details.
2 Motivation
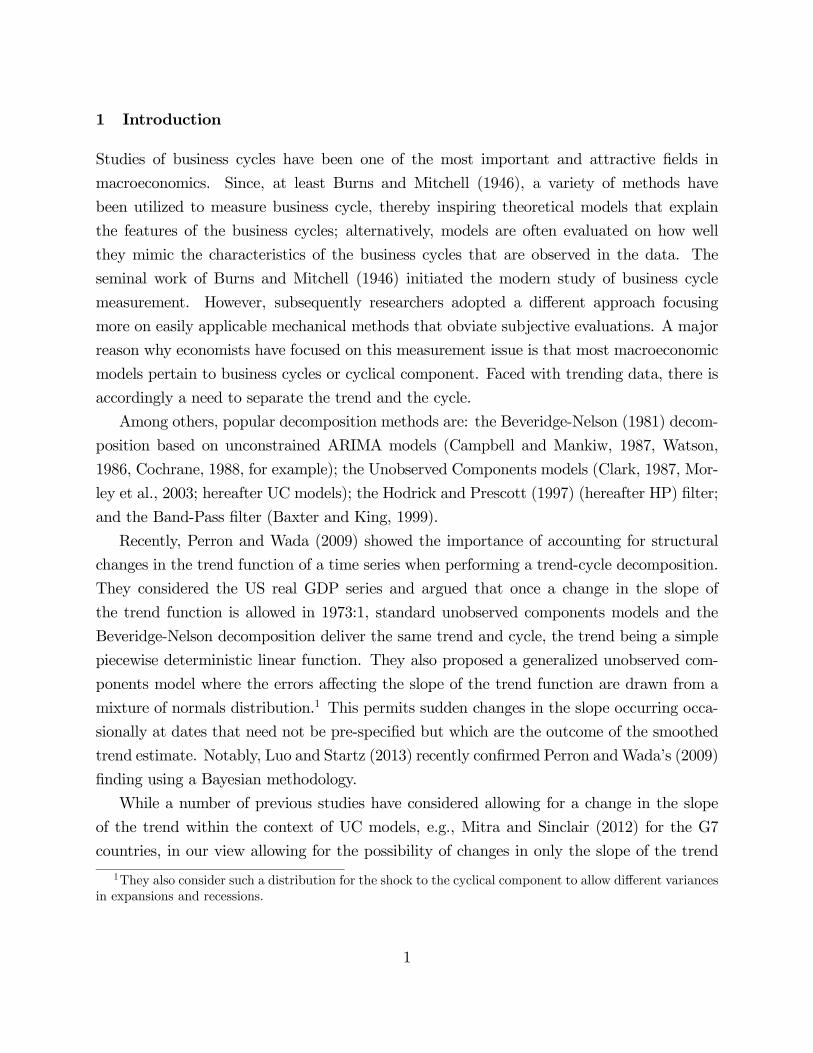
Figures 1 and 2 present the seasonally adjusted (log) real GDP and real consumption series
for the G7 countries using postwar quarterly series from 1960.I through 2011.IV. The data3
are from the Organization for Economic Co-operation and Development’s (OECD) Quar-
terly National Accounts. These graphs reveal a number of interesting features. First, most
countries show a decline in the rate of growth occurring near 1973. This is a feature that
has received a lot of attention. For example, Perron (1989) argues that once one allows for
a change in the slope of the trend function in 1973:1, one can reject the hypothesis that
the US real GDP series contains a unit root (see Perron, 1997, for evidence pertaining to
real GDP series for the G7 countries). Also, Bai, Lumsdaine and Stock (1998) estimate a
multivariate model of the growth rates of real GDP for the G7 countries imposing a common
break. They find statistical evidence for a change in mean with a 90% confidence interval
that covers the period 1972:2-1975:2. More evidence is presented in Perron and Yabu (2009)
who find a statistically significant change in the slope of the trend function for all countries
allowing the noise component to be stationary or to have an autoregressive unit root. In
all such studies the change is modelled as being sudden (i.e., a structural change at some
date).4 This is important since standard detrending methods such as the HP filter are able
to allow for a decrease in the rate of growth through time but not in a sudden fashion.
Another feature that is present in many series are more or less sudden level shifts. Such
level shifts occur for Germany in the late 1970s and early 1990s; and for the UK in the
early 1980s. It is especially evident for the case of the German data retrieved in 2004 prior
to a revision to account for the re-unification (labeled “Germany-unrevised”), which shows
a dramatic increase in 1991 at the time of the re-unification.5 Another type of aberrant
pattern is present in the case of France for which an extreme outlier occurs in 1968 in the
3Real GDP data are: Gross Domestic Product, Expenditure approach, Millions of national currency, vol-
ume estimates, OECD reference year, annual levels, seasonally adjusted (VOBARSA). For consumption, we
use Private final consumption expenditure, millions of national currency, volume estimates, OECD reference
year, annual levels, seasonally adjusted (VOBARSA); hence durable, non durables and services are included.4See Perron (2006) for a comprehensive survey related to time setries models with structural breaks.5One could use GDP per capita instead of GDP to avoid the “re-unification effect.” Although it could
mitigate the problem, the issue would still present. Indeed, Stock and Watson (2005) use interpolations to
deal with the “re-unification outlier” in the growth rates of per capita GDP.
3

form of a sudden temporary drop due to the general strike in May 1968. Not surprisingly,
the consumption data for each country show some degree of similarity to their corresponding
GDP data.
Finally, the impact of the recent world recession that started in 2008 should be taken
into consideration. Although it is close to the end of our sample period, Figure 1 clearly
shows the decline in output for almost all countries. It may be a slope change, a level shift,
or an outlier. We shall consider the treatment for this event within our framework in order
to measure business cycles.
What we wish to highlight from this visual inspection of the series are the following
facts: structural changes in the slope and level of the trend function and outliers seem to
be features affecting all real GDP and consumption series for the G7 countries (though not
all features are present for all series). Also, large occurrences of such features are relatively
rare, mostly once and at most a few times in the postwar sample.
These features first suggest the distinct possibility that standard methods of detrending
such as the HP filter will provide a distorted picture of the cyclical component. Take for
instance the case of Germany. As we shall see, the HP detrending procedure is unable to
account for the sudden increase at the time of the re-unification. Instead a smooth trend is
fitted with the implication that the period a few quarters before 1991 was a deep recession
and the period a few quarters after was a drastic short-lived expansion. Perron and Wada
(2009) documents extensively, for the case of the US, how a single change in slope can
affect the outcome of various detrending procedures and that accounting for such a change
can drastically alter the resulting cyclical component. So, clearly, slope and level changes,
as well as major outliers, can have a substantial impact on what a detrending procedure
delivers as the cycle.
In many instances researchers aware of such problems will use ad hoc methods to provide
a remedial; e.g., avoiding the period contaminated by such effects, interpolating (c.f., Stock
and Watson, 2005) or using sub-samples. But these involve a substantial loss of information.
One would therefore like to have a detrending method that is able to account for such features
in an endogenous fashion, i.e., without having to specify a break date, a type or a number
of changes, and deliver a cyclical component uncontaminated by these events. On this front
little has been done 6 and our aim is to suggest a procedure for doing so.
6A recent exception is Giordani, Kohn and van Dijk (2007) who use a Bayesian methodology applied to
an extended state space model to deal with structural breaks and outliers for the variables in growth rates.
4

3 The trend-cycle decomposition framework
In this section, we present the statistical model adopted. We start with the most general
specification in Section 3.1 and discuss how we selected relevant special cases for each country
in Section 3.2.
3.1 The model
The most general specification of the class of models considered is the following:
= + + (1)
= −1 + + (2)
= −1 + (3)
() = (4)
where is the observed series, is the trend function, is the cyclical component and the
measurement errors. The shocks , , and are assumed to be mutually uncorrelated
as well as serially uncorrelated. If the errors were normally distributed, this would be a
standard unobserved components model which has already been used extensively in the
literature under various levels of generality (see, among others, Clark, 1987, Morley et al.,
2003, Harvey and Jaeger, 1993). Our departure from the basic specification is to model the
errors as having a mixture of normals distributions.7 Let represent either , , or ,
the distribution of is specified to be
= 1 + (1− ) 2
where
∼ (0 2 )
and ∼ (). Hence, with probability , the error at time is drawn from a
(0 21) and with probability (1− ) it is drawn from a (0 22). This will permit sudden
changes if is close to 1 and 22 is much larger than 21. In this case, most of the time
the errors are drawn from a low variance distribution which characterizes “normal periods”;
but occasionally a large shock occurs, which characterizes “atypical events.” This type of
model has been used in Kitagawa (1989) who considers seasonal adjustments, Giordani et
al. (2007) who pay most attention to growth rate changes using data from the G7 countries,
7Notable previous studies regarding this type of models include Kitagawa (1987), among others.
5

Perron and Wada (2009), among others. Yet, in this paper, our main focus is the trend-
cycle decomposition or measuring business cycle, allowing and taking into account significant
shocks that cause structural changes or outliers.
Consider the implications of such a specification for the various error terms in the model.
First, if this scenario applies to the measurement errors , this would imply small or zero
measurement errors in “normal periods” and occasional outliers. Second, for the error
affecting the trend function, this would allow a random walk component (or a deterministic
trend if 21 = 0) with occasional level shifts. Third, for the error affecting the slope of
the trend function, this allows small or null changes in the slope in “normal periods” with
occasional large changes. Finally, a mixture of normals distribution for the error can allow
for different variances in recessions and expansions (though here would be the probability
of being in an expansion and one would expect 22 to be larger than 21 but not by a large
factor; see Perron and Wada, 2009).
Hence, the use of mixture of normal distributions for the errors is potentially a powerful
tool to permit structural changes in the slope and level of the trend function as well as
outliers. In contrast to the popular Markov switching type model (Hamilton, 1989, for
example), it is important to note that the probabilities of the errors being drawn from one
regime or the other are independent of past realizations. In our model, different regimes
affect the magnitude of the shocks. This is because our goal is to have a framework that
allows special events such as productivity slowdown and brief but large declines of output.
In such cases, the probability that we draw errors from the large variance distribution should
not be dependent of whether past draws for the errors were from the small or large variance
distributions. Therefore, it is more appropriate to postulate that the probabilities for the
errors being in one regime or another are independent from past realizations.
3.2 The model selection procedure
Such mixtures of normals distributions for the errors introduce considerable additional com-
plexities for the estimation of the model. In particular, allowing such mixtures distributions
for all components leads to an unstable algorithm. Hence, we need to restrict the model
somewhat to obtain sensible outcomes. Our choice of restrictions follows from our discussion
of the main features of the GDP series for the various G7 countries. In all cases, the errors
affecting the slope of the trend function is modelled with a mixture of normals distribution
given that slope changes are likely to be present for all countries. Then, restricting the max-
imum number of the errors that are mixture of normals distribution to be two, together with
6

the observations described in the previous subsection, we apply the trend-cycle decomposi-
tion model with the cyclical component specified by an AR(2), i.e., () = 1− 1− 22,
for all countries. If this specification does not fit well, more precisely the estimated slope
of the trend is more volatile than the estimated cycle (i.e., () (), measured by
the sample variance of the filtered estimates), then we proceed with the following steps: 1)
Preserving the mixture of normal errors , we consider another error (one of , , and )
to be a mixture of normals. If 1) fails, then 2) we use a mixture of normals distribution only
for and all other errors are assumed to be normally distributed. If 2) fails also, then, 3)
we select an AR(1) cycle component and repeat 1) and 2), until the estimated slope of the
trend becomes less volatile than the cycles.
The models selected are presented in Table A1 (in the appendix) together with additional
restrictions needed. In all cases, except Italy and the US, the errors for the cyclical
component are specified as normally distributed. By allowing a mixture of normals for the
US, we relate our results to those of Perron and Wada (2009).8 We also allow a mixture of
normals distribution for the error affecting the level of the trend function for Germany,
Japan, and the UK. Finally, we allow a mixture of normals for the measurement error
only for France since it seems the only country to have been subject to a large one-time
decrease in GDP caused by the May 1968 strike. The maximum likelihood estimates for all
models are presented in Table A-2.
4 Results for the trend-cycle decompositions.
We now present results pertaining to the trend-cycle decompositions of the Real GDP and
Consumption series. We start in Section 4,1 with the Real GDP series followed by the
Consumption series in Section 4.2. In both cases, we highlight the main features and the
differences between our decomposition, labelled MN for Mixtures of normals, and the HP
filter. The volatility of the cyclical component is analyzed in Section 4.3. Section 4.4 presents
a summary and interpretation of the results along with a discussion of some features of
interest.
4.1 Real GDP
We now present the MN trend-cycle decompositions obtained for the Real GDP series of the
G7 countries. These will also be compared to the decompositions obtained using the Hodrick-
8For the US GDP, we impose the same set of restrictions as in Perron and Wada (2009). See Table A-1.
7

Prescott filter (denoted HP) (we set the smoothed parameter to be 1600, as usual). The
results are presented in Figures 3 through 5.
Consider first the case of Canada. The MN decomposition shows a decrease in the rate
of growth after the mid 70s, early and late 80s, for all of which increases in the growth rate
follow. Overall, the fitted trend is quite similar to that using the HP filter. In the case of
France, the MN decomposition easily accounts for the outlier in 1968, which the HP filter
assigns to the cyclical component. Otherwise, the trend function is a straight line with a
change in slope near 1973. Since the trend obtained with the HP filter follows the actual
series more closely and thereby ascribes less movements to the cycle, the variance of the
cycle with the MN decomposition is larger.
Next, the MN trend for Germany accounts for several level shifts as well as the level
shift after the 1991 German reunification. The HP filter, on the other hand, yields a much
smoother trend function, leaving a large part of economic fluctuations, especially downward
ones, to the cycle.
In the case of Italy, the MN decomposition yields a smoother trend than the HP filter
until the late 70s, while the decline in the growth rate after the 80s is accompanied with
a more volatile trend for the MN decomposition, leaving smaller cycles than with the HP
filter.
The trend function implied by the MN decomposition for Japan is very smooth. It
consists in roughly three parts: a linear trend with high growth until 1973, followed by a
linear trend with much reduced slope until the early 90s after which it exhibits a further
gradual decline. The HP trend is similar, with again the exception that it is less smooth and
follows the series more closely so that the cycle is somewhat less variable.
For the United Kingdom, the MN and HP trends and cycles are very different. The MN
trend shows important level shifts in the early and late 80s, after which it is simply a stable
straight line, except for another level shift in the late 2000s. The difference can most easily
be seen by looking at the implied cycle. According to the MN decomposition almost all
the period from 1960 to the mid 80s is characterized by above trend activity, while the HP
cycle shows large swings. After 1990, the HP trend is close to the MN trend, yet the large
decline occurring in the late 2000s is not treated as a level shift but is attributed to the
cycle. Finally, in accordance with what is documented in Perron and Wada (2009), the US
trend is simply a deterministic function with a change in slope occurring in the 1970s. The
HP filter again follows the actual data more closely so that the implied cycle is much less
volatile than the MN cycle.
8

It should be noticed, however, that historical data series are often revised. One example
is Germany. An old data series taken from the same source in 2004 clearly incorporates the
effect of the German reunification in 1990 (see “Germany-unrevised” in Figure 1). When
applying the MN decomposition, the trend function for Germany is, as demonstrated in
Figure 5, a smooth trend with two major changes: a decrease in slope near 1973 and a large
increase in level in 1991 associated with the re-unification. The trend function obtained from
the HP filter again follows the series closely until the early 80s (so that the cycle is again less
variable) but it misses the level shift. This gives a completely different characterization of
the cyclical component after the early 80s. The HP cycle shows a mild expansion for much
of the 80s while the MN cycle shows an important recession. From the late 80s to the early
90s, the HP cycle shows a decrease in activity while the MN cycle shows an increase. The
period a few quarters before the re-unification is characterized by a sharp recession with the
HP cycle and by an expansion with the MN decomposition. The period a few quarters after
the re-unification is characterized by an impressive boom with the HP cycle and by a more
reasonable expansion with the MN cycle. The HP cycle shows much of the later part of the
90s to be below trend activity while the MN cycle shows a performance roughly on par with
the trend level. Hence, it is clear that the failure to account for the sudden upward level shift
at the time of the re-unification leads to a very different picture of the cyclical component,
and as we shall see below this also has implications for cross-country correlation analyses.
4.2 Consumption
The trend-cycle decompositions for the consumption series are presented in Figures 6 to 8.
Consider first the case of Canada. The actual series is quite smooth but exhibits sudden
changes in level and slope (early 70s, mid-70s and especially the early 80s and early 90s).
Such shifts are ascribed to the trend function by the MN decomposition, with the implication
that little is left for the cyclical component. A way to interpret this result is to note that the
actual series is affected by important shocks that are large enough to be viewed as having a
permanent effect and hence are part of the trend. The fact that little is left to the cyclical
component implies that the Canadian economy adapts quickly to such permanent shocks.
The HP cycle is more volatile but it is interesting to note that most of the movements occur
near these periods of sudden changes in level and slope.
The French MN trend is somewhat smoother than the HP trend, albeit unlike its GDP
series, the abrupt decline in 1968 is not entirely removed as an outlier, resulting in a drop in
cyclical consumption. Unlike its GDP series, the German MN trend for consumption is much
9

smoother than the HP trend, while with the old data set (unrevised) the result is similar
to that for output: a clear level shift in the trend function is detected. It therefore shows
important differences between the MN and HP cycles. This is again due to the sudden level
shift at the time of the re-unification, which has a profound impact on the HP cycle, which
cannot account for it. For Italy, the HP andMN trends have roughly the same characteristics,
as in the case for output, with the MN cycle having slightly higher variability than the HP
cycle. In the case of Japan, the MN and HP give similar decompositions, yet the MN trend
better accounts for the rapid change in growth rate occurring near 1973, as well as growth
rate changes at the beginning and the middle of the 1990s.
For the United Kingdom, the MN and HP decompositions reveal quite different results.
The MN trend is variable prior to the early 80s after which it becomes smoother, and the
cyclical component is accordingly more variable with the MN than with the HP filter. Finally,
the US trend function is again very smooth (basically a straight line with a blip in the early
80s) and, since the HP trend follows more closely the series, the cycle is accordingly more
variable with MN than with HP.
4.3 Volatilities
Table 1 presents summary measures of the volatility in the cyclical components of output
and consumption for the full sample period 1961:1-2011:1 and five 10-years sub-periods: the
1960s (1961:1-1969:4), 1970s (1970.1-1979.4), 1980s (1980.1-1989.4), 1990s (1990.1-1999.4),
2000s (2000.1-2011.1). Correspondingly, Figures 9 and 10 plot the standard deviations of
output on the horizontal axis and those of consumption on the vertical axis. The area below
the 45-degree line corresponds to cases for which consumption is less volatile than output.
For the full period, the volatilities of output and consumption are similar using either MN
or HP, except for the output of the UK and the consumption of Canada for which MN yields
small cycles; and the consumption of the US and UK for which HP yields small cycles. For
the sub-samples, we generally find larger volatilities of cycles when MN is used.
Consider now the relative volatility of the cyclical components of output and consump-
tion. Standard business cycle models suggest that the volatility of consumption should be
smaller than the volatility of output since agents wish to smooth out their consumption over
time. Using the MN decomposition with the full sample, this is the case for all countries
but the UK and US. With the HP filter, the only difference is that the US is no longer an
exception. Comparing Figures 9 with 10, we find that when MN is used the UK and US are
often exceptions for the consumption smoothing, but less so when HP is used.
10

Figures 11 and 12 present rolling estimates of these volatilities over the period 1961:1-
2011:4, for output and consumption, respectively. These show, for both the MN and HP
decompositions that there is a clear tendency for a decline after the mid-80s (if the World
Financial Crisis of 2008 and the subsequent recession are excluded) in the volatility of output
for Italy and the US. This is mostly consistent with the concept of the “Great Moderation”
and the finding of Stock and Watson (2002). The same is true for consumption, but only for
Germany and Italy. Hence, a finding of interest is that for most countries the decline in the
variability of output and consumption is due to a decline in the variability of the trend, not
the cyclical component. In most cases, the trend has become smoother during the 80s.
4.4 Summary and interpretation of the results
In summary, the main qualitative differences between the MN and HP trend cycle decom-
positions are the following. First, the MN trend function accounts well for sudden level or
slope changes and outliers, and hence it yields a much smoother trend than the HP filter.
In statistical terms, the random walk component is much less important, if at all present,
for the majority of the countries. The HP trend follows the actual series much more closely
with the implication that more of the movements in the series are characterized as being of
a permanent nature, i.e., the random walk component is much more important.
Secondly, as a consequence of this last feature, the HP filter often ascribes less movements
to the cyclical component compared to the MN cycle, which shows higher variability. In
particular, the rolling-averages of standard deviations (Figures 11 and 12) show that MN
consumption cycles have higher volatilities than HP consumption cycles, except for Canada.
Third, the MN decomposition is able to capture sudden occasional changes in the level
and slope of the trend function, while the HP filter does so in a much more gradual fashion.
In such cases, especially with large level shifts, the implied cycle can be very different. The
failure to account for such shifts in the trend function by the HP filter is largely responsible
for the fact that HP trend contains a larger random walk component and ascribes less
movements to the cycle. This follows from the results in Perron (1989, 1990) to the effect
that unaccounted changes in a trend function biases usual statistical procedures towards
accounting for such changes via a random walk or autoregressive unit root characterization.
We shall see in the next section that these features have implications for the cross-countries
comparisons of cyclical volatility and correlations.
11

4.4.1 Why do MN cycles have higher consumption volatilities?
At least since Backus et al. (1992), it is a well known — or stylized — fact that fluctuations
in consumption should be less volatile than those in output. This is due to a rational
household’s choice of smoothing consumption. Indeed, the HP cycles are generally in line
with this explanation although our MN cycles shows otherwise. Even with the HP filter,
consumption in emerging market is known to be more volatile than output because, as
Aguiar and Gopinath (2007) argue, most shocks are permanent and, hence, households are
unable to smooth their consumption. On the other hand, for developed countries the shocks
are mostly transitory and, accordingly, households do not alter their consumption plans in
response to such shocks. This argument explains the documented features we have. Recall
that our decomposition appropriately removes sudden shocks that cause structural changes or
outliers. Therefore, unless households change their consumption plan drastically in response
to large shocks that create structural change or outliers in output, it is expected that cyclical
consumption has a greater variability than cyclical output. In fact, in the case of France, the
abrupt decline in output is removed from its cycle, whereas cyclical consumption is affected
by this shock since the decline in consumption is not large enough to be removed. Another
example is the UK for which changes in the trend are accounted for in output, but not
in consumption; so that changes in consumption does not abruptly change, despite such
changes in output.
4.4.2 Similarities across groups
It is generally believed that some groups of countries share similarities in business cycles:
i) European (France, Germany, and Italy); and ii) English speaking countries (or Anglo-
Saxon countries: Canada, US and UK); see, e.g., Canova et al. (2007). From Figure 10,
we confirm that, over time, there is across-the-board convergence in the volatilities of HP
cycles. Yet, the MN cycles in Figure 9 indicate that: i) there is convergence in the volatilities
for European cycles; but ii) there is no convergence for English speaking countries; and iii)
Japan is consistently smoothing its consumption.
5 Cross-country comparisons of cyclical movements in output and consumption
In this section, we wish to reassess the findings about important measures of cyclical move-
ments in output and consumption across the G7 countries using our trend-cycle decomposi-
tion. The issues to be addressed are the volatility of the cyclical components of output (real
12

GDP) and consumption, and the cross-country correlations in these components.
5.1 Consumption correlation puzzle
Since the influential work by Backus et al. (1992), one of the well known features or “stylized
facts” of the international business cycle is that cross-country consumption correlations are
lower than cross-country output correlations (from an empirical analysis using an HP filter to
extract the trend component). However, a general equilibrium model with risk averse agents
implies that the consumption correlation should be larger than the output correlation, due
to the consumption smoothing behavior of agents (see, e.g., Baxter, 1995, and Backus et
al., 1995). To try to disentangle this puzzle, two avenues have been followed. The first is
to introduce market frictions to the basic model which imply lower consumption correlation
than with complete market. Baxter and Crucini (1995) show that if the productivity shock
is a random walk without international spillover, incomplete market economies would have
smaller consumption correlation than output correlation, while Lewis (1996) requires non
separabilities between tradables and non tradable leisure or goods, as well as capital market
restrictions to reconcile the discrepancy. Another example is Kehoe and Perri (2002), who
suppose that international loans are imperfectly enforceable. In that case, also due to market
frictions, the consumption correlation is not necessarily higher than that of output. Recently,
Wada (2014) considers the case for which agents in a two-country model do not have perfect
information about the persistence of the technology shock and shows that the puzzle can be
partly explained by the agents’ gradual learning about the persistence.
A second approach is to assess the reliability of the “stylized facts” using alternative
econometric techniques. Ambler et al. (2004) consider the reliability of the results to using
different sub-samples with a wide variety of countries. They use a standard HP filter to ex-
tract the cyclical components and their results show that the consumption-output correlation
puzzle is even more pronounced, i.e., the cross-country consumption correlations are much
smaller than the output correlations than previously reported. Pakko (2004) shows that the
consumption correlation is not always smaller than the output correlation, depending on
the frequency bands used to extract the cyclical component using a band pass type filtering
procedure. It is, nevertheless, smaller when using frequency bands usually associated with
the business cycle. We here pursue this sensitivity analysis to see if the detrending procedure
used can yield different results or provide additional evidence for the “stylized facts.”
The results of the cross-country correlations for output and consumption are presented in
Tables 2-3 and Figures 13-14, where the horizontal axis measures the cross-country output
13

correlation and the vertical axis measures the cross-county consumption correlation. The
area above the 45-degree line indicates that the consumption correlation is higher than the
output correlation. The results with the HP filter confirm the stylized fact that output
correlations are higher than consumption correlations. Of the 21 cases, only one pair of
countries have consumption correlation higher than output correlation, and only by a rather
small margin. The results with the MN decomposition are more “encouraging” in that 5
pairs of countries have consumption correlation higher than output correlation. Still, the
evidence is not entirely convincing.
Let us look at the cross-country correlations in output and consumption for different
sub-periods: 1961:1-1969:4, 1970:1-1979:4, 1980:1-1989:4, 1990:1-1999:4, and 2000:1-2011:1.
The results show interesting differences across sub-samples and across methods of detrend-
ing. The number of pairs of countries showing consumption correlation higher than output
correlation are as follows: 7 with MN for the 1960s (6 with HP), 3 with MN for the 1970s
(4 with HP), 5 with MN for the 1980s (8 with HP), 11 with MN for the 1990s (8 with HP),
and 7 with MN for the 2000s (2 with HP). Hence, if one considers our trend-cycle decompo-
sition, the evidence about the consumption-output correlation is much less at odds with the
theoretical implications and in that sense less puzzling in the last two decades. Hence, our
results provide evidence that the cross-country consumption correlation is greater than the
output correlation.
6 Concluding Remarks
Our paper presented an alternative detrending procedure that allows for trend functions
having level and slope shifts and series affected by important outliers. When applied to
postwar quarterly real GDP and consumption series, we have shown that it performs well, is
able to account for sudden changes and yields reasonable estimates of the cyclical component.
When compared with the HP filter, a major difference is the fact that our cyclical component
is more variable. This is due to the fact that the HP filter does not account well for the
level and slope shifts that are present and, accordingly, often ascribes more movements to
the trend leaving little to the cyclical component. Some exceptions to this rule occurs, for
example with the unrevised German data for which the sudden increase in level at the time
of the re-unification substantially contaminates the cyclical component obtained with the
HP filter so that the latter show huge spikes near the time of the level shift.
Our decomposition can make a difference when assessing the reliability of some so-called
stylized facts. When considering the relative variability of the cyclical components of con-
14

sumption and output across countries, our decomposition shows some important differences.
In particular, we find that i) the volatility of consumption is not necessarily smaller than
that of output, ii) compared to the results obtained with the HP filter, there are more cases
for which the cross-country correlation in consumption is higher than that in output, in
accordance with the standard theory; and iii) unlike a majority of previous studies including
Canova et al. (2007) and Stock and Watson (2005), there is not much evidence for the
hypothesis that the characteristics of countries’ business cycles can be categorized into three
groups of countries, namely, European (France, Germany, and Italy), Japan, and English
speaking countries (Canada, UK and US).
References
[1] Aguiar, M. and G. Gopinath (2007) “Emerging Market Business Cycles: The Cycle is
the Trend,” Journal of Political Economy 115, 69-102.
[2] Ambler, S., E. Cardia, and C. Zimmermann (2004) “International Business Cycles:
What are Facts?” Journal of Monetary Economics 51, 257-276.
[3] Backus, D.K., P.J. Kehoe, and F.E. Kydland (1992) “International Real Business Cy-
cles,” Journal of Political Economy 101, 745-775.
[4] Backus, D.K., P.J. Kehoe, and F.E. Kydland (1995) “International Business Cycles:
Theory and Evidence,” in: Cooley, T.F. (Ed.), Frontier of Business Cycle Research,
Princeton University Press, 331-356.
[5] Bai, J., R.L. Lumsdaine and J.H. Stock (1998) “Testing for and Dating Breaks in
Multivariate Time Series,” Review of Economic Studies 65, 395-432.
[6] Baxter, M. (1995) “International Trade and Business Cycles,” in: Grossman, G.M.,
Rogoff, K. (Eds.), Handbook of International Economics, Vol. 3. North Holland, 1801-
1864.
[7] Baxter, M. and M. Crucini (1995) “Business Cycles and the Asset Structure of Foreign
Trade,” International Economic Review 36, 821-854.
[8] Baxter, M. and R.G. King (1999) “Measuring Business Cycles: Approximate Band-Pass
Filter for Economic Time Series,” The Review of Economics and Statistics 79, 551-563.
15

[9] Beveridge, S. and C.R. Nelson (1981) “A New Approach to Decomposition of Economic
Time Series into Permanent and Transitory Components with Particular Attention to
Measurement of the ‘Business Cycle,’” Journal of Monetary Economics 7, 151-74.
[10] Burns, A.M. and W.C. Mitchell (1946) Measuring Business Cycles, National Bureau of
Economic Research: New York.
[11] Campbell, J. and N.G. Mankiw (1987) “Are Output Fluctuations Transitory?,” Quar-
terly Journal of Economics 102, 857-880.
[12] Canova, F., M. Ciccarelli and E. Ortega (2007) “Similarities and Convergence in G-7
Cycles,” Journal of Monetary Economics 54, 850-878.
[13] Clark, P.K. (1987) “The Cycle Component of the U.S. Economic Activity,” Quarterly
Journal of Economics 102, 797-814.
[14] Cochrane, J. (1988) “How Big Is The Random Walk in GNP?,” Journal of Political
Economy 96, 893-920.
[15] Doyle, B.M. and J. Faust (2005) “Breaks in the Variability and Co-movement of G-7
Economic Growth,” Review of Economics and Statistics 87, 721-740.
[16] Dueker, M. and C.R. Nelson (2006) “Business Cycle Filtering of Macroeconomic Data
Via a Latent Business Cycle Index,” Macroeconomic Dynamics 10, 573-94.
[17] Giordani, P., R. Kohn, and D. van Dijk (2007) “A Unified Approach to Nonlinearity,
Structural Change and Outliers,” Journal of Econometrics 137, 112—133..
[18] Hamilton, J.D. (1989) “A New Approach to the Economic Analysis of Nonstationary
Time Series and Business Cycles,” Econometrica 57, 357-384.
[19] Hamilton, J.D., D.F. Waggoner and T. Zha (2007) “Normalization in Econometrics,”
Econometric Reviews 26, 221-252
[20] Harrison, P.J. and C.F. Stevens (1976) “Bayesian Forecasting,” Journal of the Royal
Statistical Society, Series B, 38, 205-247.
[21] Harvey, A.C. and A. Jaeger (1993) “Detrending, Stylized Facts and the Business Cycle,”
Journal of Applied Econometrics 8, 231-247.
16

[22] Harvey, A.C. and G.D.A. Phillips (1979) “The Estimation of Regression Models with
Autoregressive-Moving Average Disturbances,” Biometrika 66, 49-58.
[23] Hodrick, R. and E. Prescott (1997) “Postwar US Business Cycles: An Empirical Inves-
tigation,” Journal of Money, Credit, and Banking 29, 1-16.
[24] Kailath, T., A. H. Sayed, and B. Hassibi (2000) Linear Estimation, Prentice Hall.
[25] Kehoe, P. and F. Perri (2002) “International Business Cycles with Endogenous Incom-
plete Markets,” Econometrica 70, 907-928.
[26] Kim, C.-J. (1994) “Dynamic Linear Models with Markov Switching,” Journal of Econo-
metrics 60, 1-22.
[27] Kim, C.J. and C. Nelson (1999) State-Space Models with Regime Switching. Cambridge:
MIT Press.
[28] Kitagawa, G. (1987) “Non-Gaussian State-Space Modeling of Nonstationary Time Se-
ries,” Journal of the American Statistic Association 82, 1032-1063.
[29] Kitagawa, G. (1989) “Non-Gaussian Seasonal Adjustment,” Computers and Mathemat-
ics with Applications 18, 503-514.
[30] Kitagawa, G. (1994) “Two-Filter Formula for Smoothing and an Implementation of the
Gaussian-Sum Smoother,” Annals of Institute of Mathematical Statistics 46, 605-623.
[31] Koopman, S. J. (1997) “Exact Initial Kalman Filtering and Smoothing for Non-
stationary Time Series Models,” Journal of the American Statistical Association, 92,
1630-1638.
[32] Lewis, K. (1996) “What Can Explain the Apparent Lack of International Consumption
Risk Sharing?” Journal of Political Economy 104, 267-297.
[33] Luo, S. and R. Startz (2013) “Is It One Break or Ongoing Permanent Shocks That
Explains U.S. Real GDP,” University of California, Santa Barbara, Working Paper.
[34] Mitra, S. and T.M. Sinclair (2012) “Output Fluctuations In The G-7: An Unobserved
Components Approach,” Macroeconomic Dynamics 16, 396-422.
17

[35] Morley, J.C., C.R. Nelson and E. Zivot (2003) “Why are Beveridge-Nelson and
Unobserved-Component Decompositions of GDP so Different?,” Review of Economics
and Statistics 85, 235-243.
[36] Pakko, M. R. (2004) “A Spectral Analysis of the Cross-Country Consumption Correla-
tion Puzzle,” Economics Letters 84, 341-347.
[37] Perron, P. (1989) “The Great Crash, the Oil Price Shock and the Unit Root Hypothesis,”
Econometrica 57, 1361-1401.
[38] Perron, P. (1990) “Testing for a Unit Root in a Time Series with a Changing Mean,”
Journal of Business and Economic Statistics 8, 153-162.
[39] Perron, P. (1997) “Further Evidence on Breaking Trend Functions in Macroeconomic
Variables,” Journal of Econometrics 80, 355-385.
[40] Perron, P. (2006) “Dealing with Structural Breaks”. In Palgrave Handbook of Econo-
metrics, vol. 1: Econometric Theory, K. Patterson and T.C. Mills (eds.), Palgrave
Macmillan, 278-352.
[41] Perron, P. and T. Wada (2009) “Let’s Take a Break: Trends and Cycles in US Real
GDP,” Journal of Monetary Economics 56, 749-765.
[42] Perron, P. and T. Yabu (2009) “Testing for Shifts in Trend with an Integrated or
Stationary Noise Component,” Journal of Business and Economic Statistics 27, 369-
396.
[43] Stock, J.H. and M.W. Watson (2002) “Has the Business Cycle Changed and Why?”
in NBER Macroeconomics Annual 17, M. Gertler and K. Rogoff (eds.), MIT press,
159-218.
[44] Stock, J.H. andM.W.Watson (2005) “Understanding Changes in International Business
Cycle Dynamics,” Journal of the European Economic Association 3, 968-1006.
[45] Wada, T. (2014) “The Role of Transitory and Persistent Shocks in the Consumption
Correlation and International Comovement Puzzles,” Macroeconomic Dynamics, forth-
coming.
[46] Watson, M.W. (1986) “Univariate Detrending Methods with Stochastic Trend,” Journal
of Monetary Economics 18, 49-75.
18

A-1 Appendix: Estimation method9
For concreteness, we discuss the method for the case where the shocks (to the level of
the trend) and (to the slope of the trend) have a mixture of normals distributions and
the measurement errors and shock to the cyclical component are normally distributed
(for the other cases, only minor modifications are needed). As a matter of notation we let
1 (resp., 2) be the probability that a draw for (resp., ) comes from the low variance
regime denoted 21 and 21 (while the higher variances are denoted
22 and
22). The State
Space model is of the form
= +
= −1 +
where = [ −1]0, = [1 0 1 0]
=
⎡⎢⎢⎢⎢⎢⎢⎣1 1 0 0
0 1 0 0
0 0 1 2
0 0 1 0
⎤⎥⎥⎥⎥⎥⎥⎦ =
⎡⎢⎢⎢⎢⎢⎢⎣1 0 0
0 1 0
0 0 1
0 0 0
⎤⎥⎥⎥⎥⎥⎥⎦and = [ ]
0. What is different from the usual State Space model is that the distri-
bution of is not normal. However, we can view the specification as a State Space model
with normal errors but with four possible states. These states are defined by the combined
values of the Bernoulli random variables and imply four possible covariance matrices for the
vector of errors , namely
=
⎧⎪⎪⎪⎨⎪⎪⎪⎩⎡⎢⎢⎢⎣
21 0 0
0 21 0
0 0 2
⎤⎥⎥⎥⎦ ⎡⎢⎢⎢⎣
21 0 0
0 22 0
0 0 2
⎤⎥⎥⎥⎦ ⎡⎢⎢⎢⎣
22 0 0
0 21 0
0 0 2
⎤⎥⎥⎥⎦ ⎡⎢⎢⎢⎣
22 0 0
0 22 0
0 0 2
⎤⎥⎥⎥⎦⎫⎪⎪⎪⎬⎪⎪⎪⎭
where each component occurs with probabilities 12, 1 (1− 2), (1− 1)2, and
(1− 1) (1− 2), respectively. This interpretation is helpful in constructing an algorithm
for estimation.
Our generalization complicates the estimation procedure considerably. The basic prin-
ciples are, however, the same as for the estimation of the usual State Space model with
9Some explanations and descriptions of the model in this section are from Section 5 of Perron and Wada
(2009).
A-1

normal errors. The likelihood function is estimated using a variant of the Kalman filter
and a by-product is an estimate of the conditional expectation of the state vector using
information available up to time . These are denoted | and are called filtered estimates.
One can also construct estimates using the full sample, i.e., | which are obtained using a
smoothing algorithm and are, accordingly, called smoothed estimates. The main goal here
is to obtain smoothed estimates of the trend function and of the cyclical component .
We describe the main steps below.
Since this estimation and the filtering procedure are similar to the ones for Markov
switching models, the basis for the construction of our computer codes was the GAUSS
programwritten by Chang-Jin Kim (KIM_JE1.OPT) as discussed in Kim and Nelson (1999).
The code is available from the book’s website. Let = (1 ) be the vector of data
available up to time . The objective function to be maximized is
ln() =
X=1
ln (|−1)
(|−1) =
4X=1
4X−1=1
(|−1 −1) Pr (−1 = = |−1)
Also, let the prediction errors be
|−1 = −[|−1 −1 = = ] = −
|−1
Here, and throughout, the superscripts () refers to the value of the variable conditional on
the process being in state at time − 1 and state at time . Conditional on the states atperiods and − 1 taking values and , respectively, and the value of −1, the prediction
errors are such that
(
|−1|−1 = = −1) ∼ ³0
|−1
´(A.1)
with
|−1 = ³
|−10−1´=
|−10
so that
(|−1 −1) = 1√2
¯
|−1
¯−12exp
(−0|−1(
|−1)−1−1
2
)
A-2

Also,
Pr (−1 = = |−1) = Pr ( = |−1 = ) Pr (−1 = |−1)= Pr ( = ) Pr (−1 = |−1)
Pr (−1 = = |) = Pr (−1 = = | −1) = ( −1|−1) ( | −1)
= (| −1−1) Pr (−1 = = |−1)
(|−1)
Pr ( = |) =
4X=1
Pr (−1 = = |)
The basic inputs are therefore the best estimates of the sate vector and their mean squared
errors, namely
|−1 = −1|−1
|−1 = −1|−1
0 +0
where
|−1 = [|−1 −1 = = ]
−1|−1 = [−1|−1 −1 = ]
|−1 = h¡ − |−1
¢ ¡ − |−1
¢0 |−1 −1 = = i
−1|−1 =
h¡−1 − −1|−1
¢ ¡−1 − −1|−1
¢0 |−1 −1 = i
for = 1 2 3 4. The problem that arises with four possible states is that the number of
estimates for the state vector and their mean square error matrices grows exponentially with
time. Indeed, at a given time , we have 4 estimates of the state vector to compute. The
solution we adopt is to use the re-collapsing procedure suggested by Harrison and Steven
(1976) which effectively provides re-approximations at each time . These are given by:
| =
P4
=1 Pr (−1 = = |)|Pr ( = |)
| =
P4
=1 Pr (−1 = = |)½
| +³
| −
|
´³
| −
|
´0¾Pr ( = |)
where now a single superscript refers to the value of the variable conditional on the process
being in state at period . The filtered estimate of the state vector is then obtained as:
| =4X
=1
Pr ( = |)|
A-3

A-2 Initial values
Since one component of the state vector is non-stationary, we cannot initialize all components
of the state vector and its covariance matrix to their unconditional expected values. Although
theoretically, any value can be used for the state vector as a diffuse prior (see Kim and Nelson,
1999 or Koopman 1997, for example), we use the following approach. First, the UC model
with constant drift term is estimated. From the estimated trend, we compute the mean and
the variance of the slope of the trend, say, 0 and 0, respectively. To obtain these initial
values, following Perron and Wada (2009), we first estimate the unobserved components
model with the errors having normal distributions and a constant drift term in the trend
function:
= +
= + −1 +
() =
where () is an AR(1) or AR(2) lag-polynomial. Then, compute the filtered trend process,
|, and we set 0 = ∆ 2|2 = 2|2 − 1|1 and 0 = ¡∆ |
¢, the sample variance of the
first-differences of the filtered estimate of the element of the state vector. More precisely,
for the AR(2) cycle case, the initial values we used are:
0|0 =h1 ∆ 2|2 0 0
i0and
0|0 =
⎡⎢⎢⎢⎣1+ 08 0 0
0 ¡∆ |
¢0
0 0
⎤⎥⎥⎥⎦where the submatrix is given by
( ) = [2 − 1⊗ 1]−1
(1)
with
1 =
⎡⎣ 1 2
1 0
⎤⎦ 1 =
⎡⎣ 2 0
0 0
⎤⎦ The initial value of the trend is set to the first observation of the series and we set its
variance to a very large number to reflect a diffuse prior on its value, following Harvey and
A-4

Phillips (1979). Note that the results are not sensitive to these particular specifications. The
other components of the state vector are stationary and we use their steady state values as
initial conditions.
A-3 Restrictions, Initial conditions and computations
A practical difficulty in the estimation of such Gaussian mixture models is the so called
“label-switching problem” (see, e.g., Hamilton, Waggoner and Zha, 2007). This problem
is due to the fact that the likelihood function (|−1) does not change if the individualcomponents of (|−1 −1) Pr (−1 = = |−1) are interchanged, and likewise for (|−1 −1) Pr (−1 = = |−1), so that
(|−1 −1) Pr (−1 = = |−1) + (|−1 −1) Pr (−1 = ∗ = |−1)= (|−1 −1) Pr (−1 = ∗ = |−1) + (|−1 −1) Pr (−1 = = |−1)
Hence, we cannot identify the sates and ∗ without some normalization. To overcome this
problem, we impose some restrictions discussed next.
First, we impose 21 22 for the variance of , with either , , or . It is
important to note that not all parameters are identified, though the trend-cycle decompo-
sition is. To get parameter estimates we impose the following restrictions pertaining to the
parameters in the mixtures of normal distributions.
Table A1. Model Selection
Output Consumption
Country AR Changes Restrictions AR Changes Restrictions
Canada 1 S - 1 S -
France 2 O, S (slope) 05 2 O, S -
Germany 1 L, S - 2 S -
Italy 2 C, S - 2 L, S -
Japan 1 L, S - 1 S -
UK 1 L, S - 2 O, S -
US 2 C, S - 2 C, S -
Germany (Old) 2 L,S 001 2 L,S 001
C: Asymmetric Cycle L: Level Shifts, O: Outliers, S: Slope Change.
A-5

Note also that most of these restrictions are non-binding, with some exceptions. Though
such restrictions are needed to get parameter estimates, the implied trend-cycle decomposi-
tion is not sensitive to them.
All estimations are implemented using the programming language GAUSS, UNIX version
10.0. To maximize the chances of obtaining parameter estimates that correspond to the
global maximum of the likelihood function, we re-estimate the model 300 times with different
initial values for the parameters that are drawn from a (0 9). The convergence criterion is
set at 1−5 in the GAUSS command ‘optmum’. Finally, we compute the likelihood functionfor observations = 3 onwards because of potential nonstationarity.
A-4 Quasi-smoothing: two filter formula
The smoothing algorithm used is that suggested by Kitagawa (1994), which is slightly dif-
ferent from Kim’s (1994) popular method. See also Kailath et al. (2000) for detailed expla-
nations. We outline the main steps here. Let = (1 ) and = +1 · · · ,the smoothed density is then
(| ) = ¡|−1
¢=
( | −1) ( −1) (−1 )
= ( |−1 ) (|−1)
( |−1)∝
¡ |
¢ (|−1) (A.2)
Note that ( |−1) does not depend on , and the smoothed density is obtained by the
one step ahead projection density (|−1) and the backward filtering density, ( |).The latter is given by the backward recursion, the “updating” step
¡ |
¢=
¡ +1 |
¢=
¡ +1|
¢¡| +1
¢=
¡ +1|
¢ (|)
and the preceding “one-step ahead predictor” step
¡ +1|
¢=
Z ∞
−∞¡ +1 +1|
¢+1
=
Z¡ +1|+1
¢ (+1|) +1
A-6

given the initial condition ¡ |
¢= ( | ). Suppose the backward filtering density is
given by
¡ |
¢ ∝ exp½−12
¡0Ω| − 20|
¢¾then, the backward filtering is computed by the following procedure. First, set Ω+1| = 0,
+1| = 0. Then,
Ω| = Ω+1| + 0−1
| = +1| + 0−1
Ω+1| = 0−1+1 − 0−1+1¡Ω+1|+1 +−1+1
¢−1−1+1
0+1| = 0+1|+1¡Ω+1|+1 +−1+1
¢−1−1+1
Equivalently, by setting | = Ω−1| and | = Ω−1
| |, this backward filter is computed by
the following backward recursion from = to = 1:
|+1 = −1+1|+1 (A.3)
| = |+1 +
¡ −|+1
¢(A.4)
where
= |+10 ¡|+1
0 +¢−1
(A.5)
and
|+1 = −1+1|+1−10 + −1+1
0−10 (A.6)
| = |+1 −|+1 (A.7)
Since the one step ahead projection density (|−1) is
(|−1) ∝ exp½−12
³0
−1|−1 − 20|−1−1|−1
´¾
the density for (A.2) is
(| ) ∝ exp½−12
³0³Ω| + −1
|−1
´ − 2
³0| + 0|−1
−1|−1
´
´¾
and, hence, the smoothed vector | is given by
| = |−1 + |−1³Ω−1| + |−1
´−1 ³Ω−1| | − |−1
´A-7

or
| = |−1 + ¡| − |−1
¢where
= |−1¡|−1 + |
¢−1;
and its mean-squared error matrix | is
| = |−1 − |−1³Ω−1| + |−1
´−1|−1
This involves the same algorithm as for the forward filtering procedure and we use the same
collapsing method. In practice, the collapsing method is implemented using
| =X
X
Pr¡
¢
|
where
| = |−1 +
³
| − |−1´
=
|−1³
|−1 + |´−1
and
Pr¡
¢ ≡ Pr ( = |−1) Pr¡ = |
¢=
ÃX
Pr ( = −1 = |−1)!ÃX
Pr¡ = +1 = |
¢!
A-8

Table A-2: Maximum Likelihood Estimates ∗ ∗ ∗ ∗ 1 2 1 (Pr 1) 2 (Pr 2) LL
CA Y 0000(0456)
0076(0174)
0812(0196)
0727(0067)
0000(0120)
0976(0125)
0937(0102)
() -258.713
C 0000(0001)
0000(0000)
0847(0019)
0555(0149)
0293(0167)
0666(0030)
0933(0030)
() -260.577
FR Y 0000(0402)
0000(0101)
0248(0301)
0319(0018)
0144(0034)
3270(0761)
1604(0129)
−0650(0098)
0952(0138)
()40950(0020)
() -178.123
C 0000(0355)
0032(0040)
2378(2270)
0387(0052)
0000(0148)
0769(0117)
1406(0145)
−0433(0132)
0997(0004)
() 0690(0080)
() -225.321
GE Y 0067(0028)
1823(0296)
0000(0005)
0414(0510)
0706(0107)
0000(0023)
0998(0244)
0966(0137)
() 0800(0085)
() -300.807
C 0000(0255)
0000(0470)
0231(0721)
0187(0042)
0630(0037)
1817(0057)
−0858(0058)
0900(0598)
() -280.836
IT Y 0445(0138)
0000(0127)
0738(0781)
0101(0181)
1939(0140)
0227(0102)
1571(0057)
−0672(0055)
0993(0016)
() 0888(0038)
() -255.018
C 0000(0375)
1342(0439)
0057(1661)
0057(0019)
0366(0071)
0191(0042)
1614(0086)
−0684(0075)
0002(3174)
() 0917(0060)
() -201.218
JA Y 0031(0286)
2120(0937)
0000(0092)
0787(0546)
0854(0109)
0000(0288)
0957(0225)
0981(0027)
() 0917(0072)
() -307.606
C 0000(1810)
0000(0033)
7042(3725)
0759(0078)
0348(0096)
0917(0076)
0990(0006)
() -296.390
UK Y 0000(0020)
1489(0232)
0082(0030)
0082(0014)
0444(0185)
0000(0025)
0991(0319)
0069(0145)
() 0678(0206)
() -265.666
C 0714(0082)
0000(0020)
0000(0131)
0000(0166)
2279(0763)
1832(0112)
−0840(0113)
1000(−)
() 0958(0025)
() -285.686
US Y 0000(0330)
0000(−)
0168(0157)
0211(0107)
1074(0156)
0216(0035)
1349(0076)
−0438(0073)
0900(−)
() 0621(0103)
() -235.839
C 0000(0051)
0019(0013)
0019(0027)
0000(0058)
0700(0004)
0249(0001)
1640(0004)
−0653(0003)
1000(−)
() 0590(0004)
() -194.323
GE (unrevised) Y 0000(0994)
5382(0278)
00005(0083)
0659(0582)
0388(0008)
0503(0056)
1637(0089)
−0699(0065)
0994(0010)
() 0968(0021)
() -258.919
C 0010(1262)
16300(11151)
00105(−)
0066(0126)
0243(0065)
0621(0043)
1792(0074)
−0824(0078)
0002(3664)
() 0994(0006)
() -255.488
Notes: 1) The values in the “LL”columns are the log likelihood values. 2) The values in parentheses are
standard errors that are computed by the purturbation method. Due to the ill-behaved likelihood surface, we
do not use the standard errors for determining whether the parameters are statistically significant. 3) “∗”stands for the larger standard diviation for the error . 4) For France Y, we impose the restriction 095
for the probability of and the estimate is = 09521. 5) We impose 001 for unrevised-Germany C
and Y.

Table 1: Standard Deviations of the Cyclical Component of Real GDP and Consumption
a. Whole Sample
a) 1961:1-2011:1 CA FR GE IT JP UK US
Output MN 1.14 1.34 1.49 1.67 1.49 0.65 2.22
HP 1.40 1.16 1.60 1.49 1.59 1.51 1.55
Consumption MN 0.55 1.09 1.43 1.39 1.19 4.34 3.36
HP 1.17 0.90 1.26 1.26 1.20 1.62 1.26
Relative Std. MN 0.48 0.81 0.96 0.83 0.80 6.68 1.51
HP 0.84 0.78 0.79 0.85 0.75 1.07 0.81
Notes: 1) “MN ” and “HP ” are the Mixture of Normals decomposition and HP filter, respectively.
2) “Relative Std.” is the standard deviation of consumption divided by the standard deviation of output.

b. Subsamples
b-1) 1961:1-1969:4 CA FR GE IT JP UK US
Output MN 1.04 0.72 1.09 1.76 1.40 0.39 2.50
HP 1.04 1.64 1.85 1.61 1.57 1.17 1.14
Consumption MN 0.59 0.99 1.83 1.34 1.09 0.79 3.21
HP 0.94 1.11 1.69 1.22 1.13 1.24 0.92
Relative Std. MN 0.57 1.38 1.68 0.76 0.78 2.03 1.28
HP 0.90 0.68 0.91 0.76 0.72 1.06 0.81
b-2) 1970:1-1979:4 CA FR GE IT JP UK US
Output MN 0.91 1.20 1.25 2.60 1.53 0.65 2.07
HP 1.20 1.09 1.65 1.99 1.92 2.02 2.20
Consumption MN 0.64 0.86 1.81 1.35 1.51 2.72 1.93
HP 1.30 1.03 1.61 1.28 1.86 2.38 1.80
Relative Std. MN 0.70 0.72 1.45 0.52 0.99 4.18 0.93
HP 1.08 0.94 0.98 0.64 0.97 1.18 0.82
b-3) 1980:1-1989:4 CA FR GE IT JP UK US
Output MN 1.43 1.30 1.18 0.74 1.22 0.83 2.59
HP 2.00 0.84 1.14 1.18 1.10 1.52 1.75
Consumption MN 0.61 1.10 1.32 1.79 0.80 4.26 2.34
HP 1.67 0.84 1.08 1.54 0.73 1.88 1.33
Relative Std. MN 0.43 0.85 1.12 2.42 0.66 5.13 0.90
HP 0.84 1.00 0.95 1.31 0.66 1.24 0.76
b-4) 1990:1-1999:4 CA FR GE IT JP UK US
Output MN 1.04 1.57 1.23 0.73 1.60 0.67 1.16
HP 1.26 0.92 1.33 0.98 1.46 1.09 0.87
Consumption MN 0.47 1.44 0.97 1.46 1.29 2.15 1.86
HP 0.95 0.89 0.99 1.37 1.10 1.07 0.79
Relative Std. MN 0.45 0.92 0.79 2.00 0.81 3.21 1.60
HP 0.75 0.97 0.74 1.40 0.75 0.98 0.91
b-5) 2000:1-2011:1 CA FR GE IT JP UK US
Output MN 1.00 1.45 1.33 1.66 1.25 0.43 2.03
HP 1.29 1.21 1.91 1.57 1.77 1.53 1.50
Consumption MN 0.47 0.60 0.63 0.90 0.96 3.82 3.38
HP 0.83 0.64 0.65 0.85 0.85 1.14 1.18
Relative Std. MN 0.47 0.41 0.47 0.54 0.77 8.88 1.67
HP 0.64 0.53 0.34 0.54 0.48 0.75 0.79
Notes: 1) “MN ” and “HP ” are the Mixture of Normals decomposition and HP filter, respectively.
2) “Relative Std.” is the standard deviation of consumption divided by the standard deviation of output.

Table 2: Cross-Country Output and Consumption Correlations: Mixture of Normals
Decomposition
(Upper triangle: Consumption, Lower Triangle: Output)
(Underlined numbers indicate consumption correlation greater than output correlation)
Whole Sample: 1961:1-2011:1
CA FR GE IT JP UK US
CA .44 .17 .25 .07 .44 .60
FR .15 .60 .46 .41 .37 .47
GE .07 .29 .29 .50 .15 .38
IT .19 .47 .31 .37 .05 .24
JP -.02 .38 .16 .36 .13 .19
UK .11 .42 .13 .25 .08 .42
US .25 .27 .14 .15 .02 .49
1961:1-1969:4
CA FR GE IT JP UK US
CA .43 .10 .09 -.05 -.46 .68
FR .29 .42 .11 .09 -.11 .39
GE .06 .02 -.04 -.03 -.01 -.11
IT .04 .19 -.42 .60 -.28 -.24
JP -.03 -.10 -.33 .40 .00 -.18
UK -.21 .39 .28 -.12 -.35 -.20
US .44 .06 -.52 -.03 .07 -.42
1970:1-1979:4
CA FR GE IT JP UK US
CA .59 .56 .24 .31 .35 .60
FR .54 .82 .71 .51 .40 .76
GE .00 .36 .47 .55 .61 .78
IT .04 .36 .36 .52 .06 .33
JP -.12 .23 .10 .22 .28 .48
UK .09 .21 .09 .49 -.10 .44
US .28 .68 .48 .43 -.06 .54
1980:1-1989:4
CA FR GE IT JP UK US
CA .29 .54 .49 .52 .46 .77
FR -.19 .62 .49 .63 .31 .24
GE .38 .27 .81 .52 .29 .59
IT .44 .44 .90 .46 .02 .44
JP -.13 .72 .43 .57 .28 .38
UK .24 .48 .24 .28 .24 .73
US .47 -.11 .31 .17 -.08 .70
1990:1-1999:4
CA FR GE IT JP UK US
CA .26 -.08 -.07 -.22 .78 .71
FR -.08 .78 .70 .50 .38 .07
GE -.29 .79 .81 .67 .15 -.33
IT -.09 .73 .68 .69 .17 -.36
JP -.06 .71 .78 .53 .10 -.39
UK .17 .34 -.06 .52 -.03 .61
US .24 .16 -.27 .26 -.28 .90
2000:1-2011:1
CA FR GE IT JP UK US
CA .83 .48 .79 .28 .49 .84
FR .56 .58 .85 .30 .56 .90
GE .20 .35 .55 .20 .47 .43
IT .55 .74 .71 .21 .50 .91
JP .35 .62 -.19 .36 .60 .23
UK .07 .32 .30 .28 .34 .52
US .24 .43 .53 .54 .31 .94

Table 3: Cross-Country Output and Consumption Correlations: HP Filter
(Upper triangle: Consumption, Lower Triangle: Output)
(Underlined numbers indicate consumption correlation greater than output correlation)
Whole Sample: 1961:1-2011:1
CA FR GE IT JP UK US
CA .39 .34 .43 .24 .55 .75
FR .18 .63 .56 .44 .51 .37
GE .07 .35 .47 .53 .44 .41
IT .16 .38 .17 .52 .36 .33
JP .06 .37 .17 .23 .43 .35
UK .48 .37 .14 .22 .46 .63
US .58 .30 .30 -.03 .28 .46
1961:1-1969:4
CA FR GE IT JP UK US
CA .07 .26 -.22 -.23 -.02 .72
FR .04 .42 .11 .14 .26 -.06
GE .10 .26 -.25 .14 .39 .10
IT -.39 .41 -.34 .52 -.28 -.20
JP -.28 .19 -.30 .30 .13 -.38
UK -.08 .06 -.15 .07 -.12 .00
US .73 -.19 .16 -.59 —.28 -.15
1970:1-1979:4
CA FR GE IT JP UK US
CA .62 .53 .40 .37 .71 .72
FR .39 .83 .72 .57 .66 .63
GE -.18 .54 .56 .70 .73 .62
IT -.16 .28 .18 .33 .32 .23
JP .18 .51 .48 .36 .59 .57
UK .40 .40 .35 .19 .76 .79
US .51 .75 .55 -.01 .59 .50
1980:1-1989:4
CA FR GE IT JP UK US
CA .19 .32 .70 .41 .41 .83
FR -.09 .08 .47 .43 .39 -.01
GE .52 -.07 .49 .30 -.20 .41
IT .51 .27 .55 .42 .31 .52
JP -.10 .43 -.02 .06 -.04 .23
UK .59 .48 .22 .37 .34 .42
US .60 -.36 .17 -.19 -.00 .38
1990:1-1999:4
CA FR GE IT JP UK US
CA .34 -.25 .17 -.26 .84 .76
FR .11 .65 .70 .28 .31 .20
GE -.36 .41 .61 .49 -.20 -.40
IT -.00 .43 .31 .56 .37 -.15
JP .17 .32 .21 .13 .05 -.30
UK .72 .31 -.28 -.17 .24 .60
US .54 .29 -.19 -.22 -.13 .62
2000:1-2011:1
CA FR GE IT JP UK US
CA .90 .81 .88 .74 .78 .90
FR .72 .92 .95 .75 .84 .88
GE .32 .61 .96 .75 .85 .76
IT .72 .82 .58 .83 .87 .85
JP .33 .38 -.01 .43 .90 .86
UK .80 .68 .24 .69 .63 .86
US .73 .75 .47 .89 .49 .81

1960 1970 1980 1990 2000 201012
13
14
15Canada
1960 1970 1980 1990 2000 201013
13.5
14
14.5
15Germany
1960 1970 1980 1990 2000 201012
13
14
15France
1960 1970 1980 1990 2000 201012
13
14
15Italy
1960 1970 1980 1990 2000 201016
18
20
22Japan
1960 1970 1980 1990 2000 201012
13
14
15UK
1960 1970 1980 1990 2000 201014
15
16
17US
1960 1970 1980 1990 200020
20.5
21
21.5Germany−unrevised
G7 Output
Figure 1: Postwar Quaterly (log) Real GDP Series for the G7 Countries.

1960 1970 1980 1990 2000 201012
12.5
13
13.5
14Canada
1960 1970 1980 1990 2000 201012
13
14
15Germany
1960 1970 1980 1990 2000 201012
12.5
13
13.5
14France
1960 1970 1980 1990 2000 201012
12.5
13
13.5
14Italy
1960 1970 1980 1990 2000 201017
18
19
20Japan
1960 1970 1980 1990 2000 201012
12.5
13
13.5
14UK
1960 1970 1980 1990 2000 201014
15
16
17US
1960 1970 1980 1990 200019
19.5
20
20.5
21Germany−unrevised
G7 Consumption
Figure 2: Postwar Quaterly (log) Real Consumption Series for the G7 Countries.

1960 1970 1980 1990 2000 201014.5
15
15.5
16
16.5US−Y
MN HP DATA
1960 1970 1980 1990 2000 2010−10
−5
0
5US−Y
1960 1970 1980 1990 2000 201012.5
13
13.5
14
14.5Canada−Y
1960 1970 1980 1990 2000 2010−6
−4
−2
0
2
4Canada−Y
1960 1970 1980 1990 2000 201012.5
13
13.5
14
14.5UK−Y
1960 1970 1980 1990 2000 2010−4
−2
0
2
4
6UK−Y
Figure 3: Trend and Cycle of Output for English Speaking Countries

1960 1970 1980 1990 2000 201012.5
13
13.5
14
14.5France−Y
MN HP DATA
1960 1970 1980 1990 2000 2010−10
−5
0
5France−Y
1960 1970 1980 1990 2000 201012.5
13
13.5
14
14.5Italy−Y
1960 1970 1980 1990 2000 2010−10
−5
0
5Italy−Y
1960 1970 1980 1990 2000 201013
13.5
14
14.5
15Germany−Y
1960 1970 1980 1990 2000 2010−5
0
5Germany−Y
Figure 4: Trend and Cycle of Output for European Countries

1960 1970 1980 1990 2000 201017
17.5
18
18.5
19
19.5
20
20.5
21Japan−Y
MN HP DATA
1960 1970 1980 1990 2000 2010−10
−5
0
5
1960 1970 1980 1990 200020
20.5
21
21.5Germany−unrevised−Y
1960 1970 1980 1990 2000−5
0
5
10
Figure 5: Trend and Cycle of Output for Japan and Unrevised German Data

1960 1970 1980 1990 2000 201014
14.5
15
15.5
16
16.5US−C
1960 1970 1980 1990 2000 2010−10
−5
0
5
10US−C
1960 1970 1980 1990 2000 201012
12.5
13
13.5
14Canada−C
MN HP DATA
1960 1970 1980 1990 2000 2010−6
−4
−2
0
2
4Canada−C
1960 1970 1980 1990 2000 201012
12.5
13
13.5
14UK−C
1960 1970 1980 1990 2000 2010−10
−5
0
5
10UK−C
Figure 6: Trend and Cycle of Consumption for English Speaking Countries

1960 1970 1980 1990 2000 201012
12.5
13
13.5
14France−C
MN HP DATA
1960 1970 1980 1990 2000 2010−6
−4
−2
0
2
4France−C
1960 1970 1980 1990 2000 201012
12.5
13
13.5
14Italy−C
1960 1970 1980 1990 2000 2010−4
−2
0
2
4
6Italy−C
1960 1970 1980 1990 2000 201012.5
13
13.5
14
14.5Germany−C
1960 1970 1980 1990 2000 2010−4
−3
−2
−1
0
1
2
3
4Germany−C
Figure 7: Trend and Cycle of Consumption for European Countries

1960 1970 1980 1990 2000 201017.5
18
18.5
19
19.5
20Japan−C
MN HP DATA
1960 1970 1980 1990 2000 2010−4
−2
0
2
4
6
1960 1970 1980 1990 200019
19.5
20
20.5
21Germany−unrevised−C
1960 1970 1980 1990 2000−10
−5
0
5
10
Figure 8: Trend and Cycle of Consumption for Japan and Unrevised German Data

0 1 2 3 4 50
1
2
3
4
5
Std(Y)
Std
(C)
MN, 1960s
0 1 2 3 4 50
1
2
3
4
5
Std(Y)
Std
(C)
MN, 1970s
0 1 2 3 4 50
1
2
3
4
5
Std(Y)
Std
(C)
MN, 1980s
0 1 2 3 4 50
1
2
3
4
5
Std(Y)
Std
(C)
MN, 1990s
0 1 2 3 4 50
1
2
3
4
5
Std(Y)
Std
(C)
MN, 2000s
0 1 2 3 4 50
1
2
3
4
5
Std(Y)
Std
(C)
MN, whole
: EU : English : Japan
Standard Deviations: MN
Figure 9: Standard deviations of MN filtered output (Y) and consumption (C).
Daimond: EU; Square: English; Circle: Japan.

0 1 2 3 4 50
1
2
3
4
5
Std(Y)
Std
(C)
HPF, 1960s
0 1 2 3 4 50
1
2
3
4
5
Std(Y)
Std
(C)
HPF, 1970s
0 1 2 3 4 50
1
2
3
4
5
Std(Y)
Std
(C)
HPF, 1980s
0 1 2 3 4 50
1
2
3
4
5
Std(Y)
Std
(C)
HPF, 1990s
0 1 2 3 4 50
1
2
3
4
5
Std(Y)
Std
(C)
HPF, 2000s
0 1 2 3 4 50
1
2
3
4
5
Std(Y)
Std
(C)
HPF, whole
: EU : English : Japan
Standard Deviations: HPF
Figure 10: Standard deviations of HP filtered output (Y) and consumption (C).
Daimond: EU; Square: English; Circle: Japan.

1970 1980 1990 20000
2
4
6Canada
1970 1980 1990 20000
2
4
6Germany
1970 1980 1990 20000
2
4
6France
1970 1980 1990 20000
2
4
6Italy
1970 1980 1990 20000
2
4
6Japan
1970 1980 1990 20000
2
4
6UK
1970 1980 1990 20000
2
4
6US
Standard Deviation: Y
Figure 11: 10 years rolling standard deviations of the cyclical component of GDP:
MN (solid) and HP (dash).

1970 1980 1990 20000
2
4
6Canada
1970 1980 1990 20000
2
4
6Germany
1970 1980 1990 20000
2
4
6France
1970 1980 1990 20000
2
4
6Italy
1970 1980 1990 20000
2
4
6Japan
1970 1980 1990 20000
2
4
6UK
1970 1980 1990 20000
2
4
6US
Standard Deviation: C
Figure 12: 10 years rolling standard deviations of the cyclical component of Consumption:
MN (solid) and HP (dash).

−1 −0.5 0 0.5 1−1
−0.5
0
0.5
1
Corr(Y)
Co
rr(C
)
MN, 1960s
−1 −0.5 0 0.5 1−1
−0.5
0
0.5
1
Corr(Y)
Co
rr(C
)
MN, 1970s
−1 −0.5 0 0.5 1−1
−0.5
0
0.5
1
Corr(Y)
Co
rr(C
)
MN, 1980s
−1 −0.5 0 0.5 1−1
−0.5
0
0.5
1
Corr(Y)
Co
rr(C
)
MN, 1990s
−1 −0.5 0 0.5 1−1
−0.5
0
0.5
1
Corr(Y)
Co
rr(C
)
MN, 2000s
−1 −0.5 0 0.5 1−1
−0.5
0
0.5
1
Corr(Y)
Co
rr(C
)
MN, whole
: EU : English : Japan
Correlations: MN
Figure 13: Correlation coefficients of MN filtered output (Y) and consumption (C).
Daimond: EU; Square: English; Circle: Japan.

−1 −0.5 0 0.5 1−1
−0.5
0
0.5
1
Corr(Y)
Co
rr(C
)
HPF, 1960s
−1 −0.5 0 0.5 1−1
−0.5
0
0.5
1
Corr(Y)
Co
rr(C
)
HPF, 1970s
−1 −0.5 0 0.5 1−1
−0.5
0
0.5
1
Corr(Y)
Co
rr(C
)
HPF, 1980s
−1 −0.5 0 0.5 1−1
−0.5
0
0.5
1
Corr(Y)
Co
rr(C
)
HPF, 1990s
−1 −0.5 0 0.5 1−1
−0.5
0
0.5
1
Corr(Y)
Co
rr(C
)
HPF, 2000s
−1 −0.5 0 0.5 1−1
−0.5
0
0.5
1
Corr(Y)
Co
rr(C
)
HPF, whole
: EU : English : Japan
Correlations: HPF
Figure 14: Correlation coefficients of HP filtered output (Y) and consumption (C).
Daimond: EU; Square: English; Circle: Japan.
Related Documents