1 PNNL-SA-121080/SAND2016-9456 PE Measuring and Expressing the Performance of Energy Storage Systems DOE/OE Peer Review September 27, 2016 Washington, DC Vilayanur Viswanathan Dave Conover Vince Sprenkle Pacific Northwest National Laboratory David Schoenwald Summer Ferreira Sandia National Laboratories We gratefully acknowledge support from the DOE Office of Electricity Delivery and Energy Reliability Energy Storage Program managed by Dr. Imre Gyuk. Sandia National Laboratories is a multi-program laboratory managed and operated by Sandia Corporation, a wholly owned subsidiary of Lockheed Martin Corporation, for the U.S. Department of Energy’s National Nuclear Security Administration under contract DE-AC04-94AL85000.

Welcome message from author
This document is posted to help you gain knowledge. Please leave a comment to let me know what you think about it! Share it to your friends and learn new things together.
Transcript

1
PNNL-SA-121080/SAND2016-9456 PE
Measuring and Expressing the
Performance of Energy Storage Systems
DOE/OE Peer Review
September 27, 2016
Washington, DC
Vilayanur Viswanathan
Dave Conover
Vince Sprenkle
Pacific Northwest National Laboratory
David Schoenwald
Summer Ferreira
Sandia National Laboratories
We gratefully acknowledge support from the DOE
Office of Electricity Delivery and Energy Reliability
Energy Storage Program managed by Dr. Imre Gyuk. Sandia National Laboratories is a multi-program laboratory managed and operated by Sandia
Corporation, a wholly owned subsidiary of Lockheed Martin Corporation, for the U.S. Department
of Energy’s National Nuclear Security Administration under contract DE-AC04-94AL85000.

2
Purpose and Expected Outcome
2
Purpose • Develop duty cycles and metrics for 5 new applications • Enhance existing protocol • Facilitate use of Protocol by SDOs and stakeholders
Progress
• March 2012 – project initiated under DOE OE ESS Program to involve all interested
stakeholders in the development of a protocol/pre-standard for immediate use and
as a basis for US and international standards
• November 2012 – first version of the protocol completed (2 applications 7
performance metrics)
• June 2014 – second version completed (added 1 more application and enhanced
selected provisions)
• April 2016 – third version completed (added 5 more applications, more metrics and
revised format for ease of use)

3
Key Accomplishments
Five new applications
Released version 2 of the Protocol
http://www.pnnl.gov/main/publications/external/technical_reports/PNNL-22010Rev2.pdf
http://www.sandia.gov/ess/sandia-national-laboratories-publications/
Most duty cycles embedded in the pdf as Excel sheets
http://www.sandia.gov/ess/publications/SAND2013-7315P.xlsx
http://www.sandia.gov/ess/publications/SAND2016-2543R.xlsx
http://www.sandia.gov/ess/publications/SAND2016-2544R.xlsx
Held webinar hosted by CESA on June 30
http://cesa.org/webinars/measuring-energy-storage-system-performance/ (PNNL-SA-118995/SAND2016-6155 PE)
457 registrations from 354 organizations, 206 attendees
Released Webinar Questions and Answers (PNNL-25540/SAND2016-6668 O)
EPRI/ESIC and IEC TC120 incorporating this work
3

4
Applications Addressed
Volt/var support
Power quality (PQ)
Frequency control (FC)
PV Smoothing
PV Firming
Peak shaving
Frequency regulation
Islanded microgrids
Old
Work for each new application
Describe and define the application
Develop appropriate duty cycle(s)
Confirm which existing metrics are applicable and if necessary
adjust them for the application
Identify new metrics that are relevant and needed
NEW

5
PV Smoothing
ESS mitigates rapid fluctuations in PV power output that occur during periods with transient shadows on the PV array by adding power to or subtracting power from PV system output to smooth out the high frequency components of the PV power
Reference performance metrics apply as they are ‘blind’ to application and duty-cycle
Duty-cycle performance metrics apply with tests for each run using PV smoothing duty cycle
6
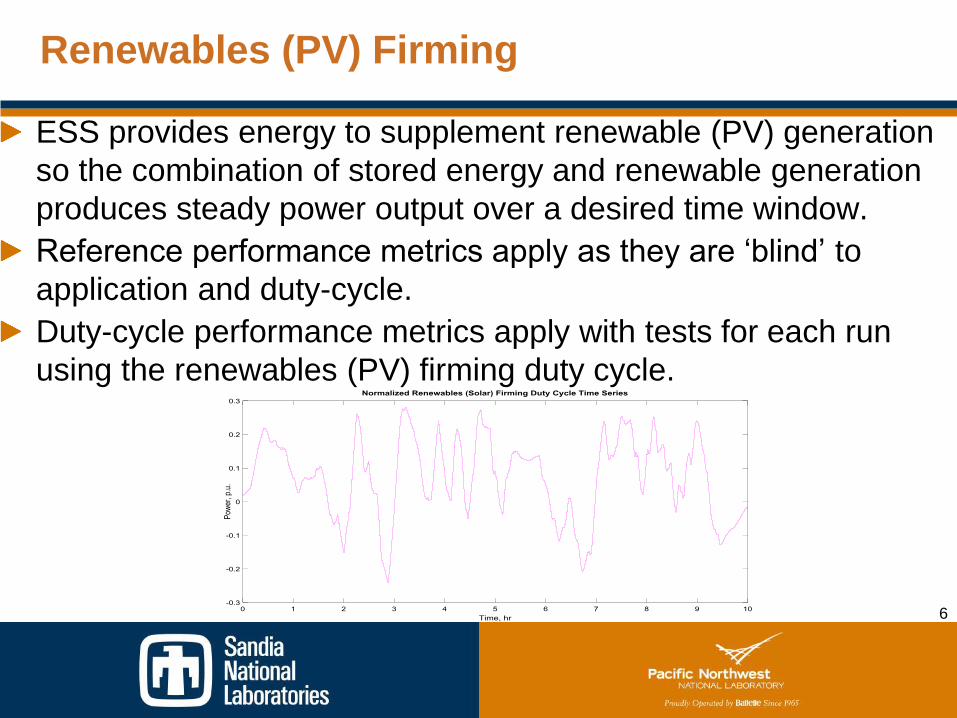
Renewables (PV) Firming
ESS provides energy to supplement renewable (PV) generation
so the combination of stored energy and renewable generation
produces steady power output over a desired time window.
Reference performance metrics apply as they are ‘blind’ to
application and duty-cycle.
Duty-cycle performance metrics apply with tests for each run
using the renewables (PV) firming duty cycle.

7
Volt-var summary ESS power as f(grid voltage)
Developed for smart inverters (1), easily adapted for ESS
PV farm at end of a 4 kW feeder
Repeated for simulated grid voltage using GridLAB-D
24 hours continuous balancing signal
Aggressive
Moderate
(1) Smart Inverter Working Group,
SAND2013-9875, EPRI

8
Power Quality
ESS can mitigate a sag or interruption in voltage that can cause power disturbances that negatively impact power quality (mostly on distribution systems) by injecting real power for up to a few tens of seconds
This application does not require storage to provide enough power for customers to ride through an outage w/o power loss
The duty cycle consists of continuous discharge at peak power for 1 min, 5 min and 10 min, where peak power is defined as maximum power for 1 minute, 5 min and 10 min.

9
Primary and Secondary Frequency Control
Sudden loss of generation – injection of real power
Duty cycle (charge for sudden loss of load)
Discharge at 30-s peak power for 30 sec (primary frequency control)
Discharge at rated power for 20 min (secondary frequency control)
Same approach used to charge ESS for sudden of load
• Primary frequency
control (30-sec)
• Secondary
frequency control -
similar duty cycle
for 20 min
• Dynamic frequency
control – ESS
response f(grid
frequency) (1)
• Obtained grid
frequency data
from utility for 4
seasons
(1) ERDF/SAFT/Schneider Electric and others, Venteea 2 MW 1.3 MWh battery system, results
presented by Bruno Prestat (EDF), Chair EPRI-ESIC WG4 Grid Integration. July 10, 2015

10
Duty-cycle New Metrics
Subject Description
SOC_Volt-VAr (Section
5.4.5.1)
The difference between the final and initial SOC shall be reported,
along with the initial SOC
SOC_active standby
(Section 5.4.5.1)
The change in SOC at the end of an active standby of same
duration as Volt-var duty cycle with auxiliary load turned on.
Wh_discharge (Section
5.4.5.1) The real energy injected (with and without Volt-var duty cycle)
Wh_charge (Section
5.4.5.1) The real energy absorbed (with and without Volt-var duty cycle)
Wh_net (Section 5.4.5.1) The net energy (injected or absorbed) (with and without Volt-var
duty cycle)
Peak Power (Section
5.4.5.2 for PQ, Section
5.4.5.3 for FC)
The peak power the ESS can provide for a specific duration.

11
Enhancements Related to Duty-cycle Performance
Run duty-cycle tests in conjunction with reference performance tests
Use same test set up and data gathering scheme – just run the duty-cycle tests using the duty-cycle for each intended ESS application
For peak shaving tests the duty cycle may begin with charge OR discharge.
Result tables for the peak shaving test specify maximum power and average power during charge and discharge
For charge, since charge duration is 12 hours, the charge power may taper at some point.
For discharge at various powers (6, 4, 2h), the power may taper off towards the end.
12
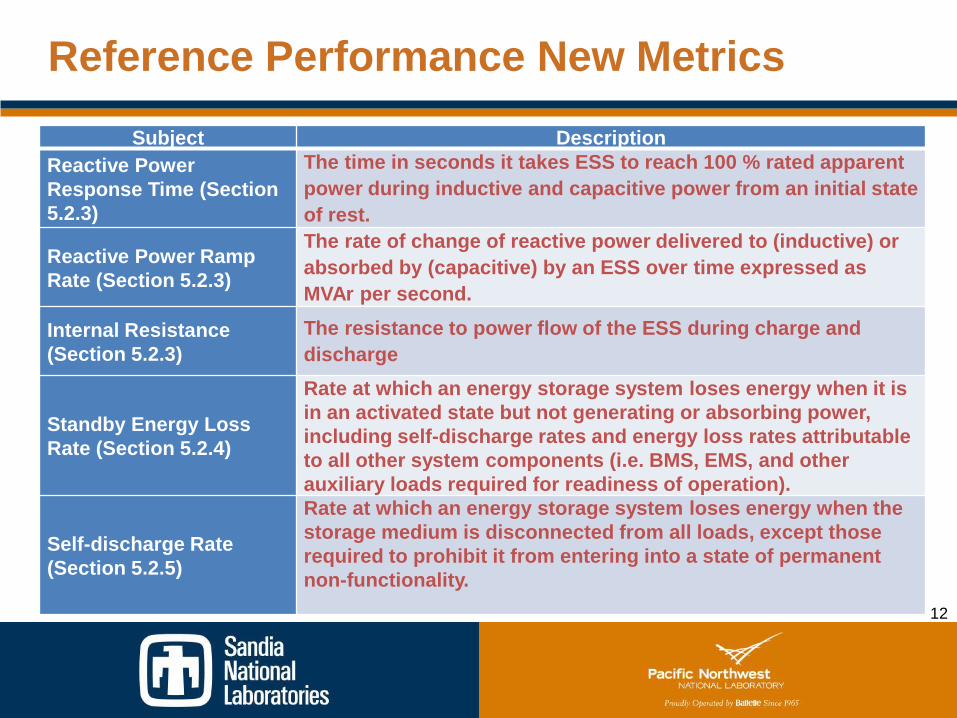
Reference Performance New Metrics
Subject Description
Reactive Power
Response Time (Section
5.2.3)
The time in seconds it takes ESS to reach 100 % rated apparent
power during inductive and capacitive power from an initial state
of rest.
Reactive Power Ramp
Rate (Section 5.2.3)
The rate of change of reactive power delivered to (inductive) or
absorbed by (capacitive) by an ESS over time expressed as
MVAr per second.
Internal Resistance
(Section 5.2.3)
The resistance to power flow of the ESS during charge and
discharge
Standby Energy Loss
Rate (Section 5.2.4)
Rate at which an energy storage system loses energy when it is
in an activated state but not generating or absorbing power,
including self-discharge rates and energy loss rates attributable
to all other system components (i.e. BMS, EMS, and other
auxiliary loads required for readiness of operation).
Self-discharge Rate
(Section 5.2.5)
Rate at which an energy storage system loses energy when the
storage medium is disconnected from all loads, except those
required to prohibit it from entering into a state of permanent
non-functionality.

13
Enhancements Related to Reference Performance
In Rev. 1, the 1st cycle was excluded from cumulative RTE
calculation. Included 1st cycle in Rev. 2
In Rev 1, individual cycle RTE was excluded - it is now included
Added separate equations for the case when auxiliary load is
powered by a separate line (EPRI ESIC input)
For capacity test, the test may begin with charge OR discharge
Result tables for capacity test specify maximum power and
average power during charge and discharge
This takes care of cases when power tapers towards he end of
charge or discharge

14
Summary
Revision 2 was released April 2016
Revision 1 has been used as a basis for US and International (IEC TC 120) standards and is being applied by proponents and users of ESS
Provided input to EPRI ESIC Performance WG
Working with ASME and NEMA to adapt these findings
Revision 2 adds key information and technical specifications, new applications, new metrics and significant formatting and use enhancements
All proponents and users of ESS benefit when performance can be measured and expressed with confidence in a uniform, comparable and consistent manner
15
Acknowledgement
Dr. Imre Gyuk, DOE-Office of Electricity Delivery and Energy Reliability
All the participants of the working groups
Related Documents