Sodality: Jurnal Sosiologi Pedesaan Vol. 09 (02) 2021 | 33896 https://doi.org/10.22500/9202133896 Content from this work may be used under the terms of the Creative Commons Attribution-ShareAlike 4.0 International. Any further distribution of this work must maintain attribution to the author(s) and the title of the work, journal citation and DOI. Published under Department of Communication and Community Development Science, IPB University and in association with Ikatan Sosiologi Indonesia E-ISSN: 2302-7525 | P-ISSN: 2302-7157 Measuring Achievement of Sustainable Development Goals in Rural Area: A Case Study of Sukamantri Village in Bogor District, West Java, Indonesia Mengukur Pencapaian Tujuan Pembangunan Berkelanjutan di Pedesaan: Studi Kasus Desa Sukamantri di Kabupaten Bogor, Jawa Barat, Indonesia Sofyan Sjaf 1 , Nia Kuniawati Hidayat 2 , Kaswanto 3 , Zessy Ardinal Barlan 1 , La Elson 4 , Sampean 4 , Hanifa Firda F. Gunadi 1 1 Departemen Sains Komunikasi dan Pengembangan Masyarakat, Fakultas Ekologi Manusia, IPB University 2 Departemen Ekonomi dan Sumberdaya Lingkungan, Fakultas Ekonomi dan Manajemen, IPB University 3 Departemen Arsitektur Lanskap, Fakultas Pertanian, IPB University 4 Pusat Studi Pembangunan Pertanian dan Pedesaan - Lembaga Penelitian dan Pengabdian Masyarakat (PSP3-LPPM), IPB University *) Corresponding email [email protected] Received: December 27, 2020 | Revised: June 25, 2021 | Accepted: July 9, 2021 | Online publication: July 26, 2021 ABSTRACT A village is an arena for sustainable development where economic, social, cultural, environmental and political interactions occur. It has a strategic meaning for the successful achievement of the 17 indicators of Sustainable Development Goals (SDGs). However, villages have limitations in providing data and indicators to measure the achievement of SDGs based on RW. The aims of this study are to provide Precision Village Data (DDP) and use it to measure and analyze the achievement indicators of 16 out of 17 village SDGs. One of SDGs 14, namely the marine ecosystem is not measured because the research location is a terrestrial village with an altitude of 423-902 m ASL. The use of DDP in the research location with normalization and aggregation methods based on arithmetic averages made this study successful in calculating the scores of each village SDGs. Then the results of the analysis of the village DDP and SDGs were combined with spatial mapping. The results showed that the SDGs in Sukamantri Village cumulatively achieved quite good results. A total of 3 SDGs was classified as very good, 4 SDGs were classified as good, 3 SDGs were classified as good enough, 5 SDGs were lacking, and 2 SDGs were poorest. Referring to the SDGs index calculation for Sukamantri Village, the environmental pillar has the highest score and is on average very good. However, the social and economic pillars are in the poor category, the law and governance pillars are in the poorest category. This means that sustainable development in Sukamantri Village has not been achieved. The natural wealth in Sukamantri Village has not been managed to achieve the fulfillment of basic human rights that are of a just and equal quality, for the well-being of the villagers and the realization of inclusive and quality economic growth. Keywords: precision village data (DDP), RW-based villages, village SDGs ABSTRAK Desa adalah arena pembangunan berkelanjutan dimana terjadinya interaksi ekonomi, sosial, budaya, lingkungan, dan politik. Desa memiliki arti strategis untuk keberhasilan pencapaian 17 indikator Sustainable Development Goals (SDGs). Tetapi desa memiliki keterbatasan dalam menyediakan data dan indikator untuk mengukur pencapaian SDGs berbasis Rukun Warga (RW). Penelitian ini bertujuan menyediakan Data Desa Presisi (DDP) dan memanfaatkannya untuk mengukur serta menganalisis indikator pencapaian 16 dari 17 SDGs desa. Satu SDGs ke-14, yaitu ekosistem laut tidak diukur, karena lokasi penelitian merupakan desa teresterial dengan ketinggian 423-902 m dpl. Penggunaan DDP di lokasi penelitian dengan metode normalisasi dan agregasi berdasarkan rata-rata aritmetika, menjadikan penelitian ini berhasil menghitung skor masing-masing SDGs desa. Kemudian hasil analisis DDP dan SDGs desa dikombinasikan dengan pemetaan spasial. Hasil penelitian menunjukkan SDGs Desa Sukamantri secara kumulatif mencapai hasil cukup baik. Sebanyak 3 SDGs tergolong sangat baik, 4 SDGs tergolong baik, 3 SDGs tergolong cukup baik, 5 SDGs yang kurang, dan 2 SDGs sangat kurang. Mengacu perhitungan indeks SDGs Desa Sukamantri, pilar lingkungan memiliki skor yang paling tinggi dan secara rata- rata terkategori sangat baik. Tetapi pilar sosial dan ekonomi termasuk kategori kurang, pilar hukum dan tatakelola tergolong kategori sangat kurang. Artinya pembangunan berkelanjutan di Desa Sukamantri belum tercapai. Kekayaan alam yang ada di Desa Sukamantri belum terkelola untuk mencapai pemenuhan hak dasar manusia yang berkualitas secara adil dan setara, bagi kesejahteran warga desa dan terwujudnya pertumbuhan ekonomi yang inklusif dan berkualitas. Kata kunci: data desa presisi (DDP), desa berbasis RW,SDGs desa

Welcome message from author
This document is posted to help you gain knowledge. Please leave a comment to let me know what you think about it! Share it to your friends and learn new things together.
Transcript

Sodality: Jurnal Sosiologi Pedesaan Vol. 09 (02) 2021 | 33896
https://doi.org/10.22500/9202133896
Content from this work may be used under the terms of the Creative Commons Attribution-ShareAlike
4.0 International. Any further distribution of this work must maintain attribution to the author(s) and the
title of the work, journal citation and DOI.
Published under Department of Communication and Community Development Science, IPB University and in association
with Ikatan Sosiologi Indonesia
E-ISSN: 2302-7525 | P-ISSN: 2302-7157
Measuring Achievement of Sustainable Development Goals in Rural Area: A Case
Study of Sukamantri Village in Bogor District, West Java, Indonesia
Mengukur Pencapaian Tujuan Pembangunan Berkelanjutan di Pedesaan: Studi Kasus
Desa Sukamantri di Kabupaten Bogor, Jawa Barat, Indonesia
Sofyan Sjaf1, Nia Kuniawati Hidayat2, Kaswanto3, Zessy Ardinal Barlan1, La Elson4, Sampean4, Hanifa Firda F.
Gunadi1
1 Departemen Sains Komunikasi dan Pengembangan Masyarakat, Fakultas Ekologi Manusia, IPB University 2 Departemen Ekonomi dan Sumberdaya Lingkungan, Fakultas Ekonomi dan Manajemen, IPB University 3 Departemen Arsitektur Lanskap, Fakultas Pertanian, IPB University 4 Pusat Studi Pembangunan Pertanian dan Pedesaan - Lembaga Penelitian dan Pengabdian Masyarakat (PSP3-LPPM), IPB University *)Corresponding email [email protected]
Received: December 27, 2020 | Revised: June 25, 2021 | Accepted: July 9, 2021 | Online publication: July 26, 2021
ABSTRACT
A village is an arena for sustainable development where economic, social, cultural, environmental and political interactions occur. It has a
strategic meaning for the successful achievement of the 17 indicators of Sustainable Development Goals (SDGs). However, villages have
limitations in providing data and indicators to measure the achievement of SDGs based on RW. The aims of this study are to provide
Precision Village Data (DDP) and use it to measure and analyze the achievement indicators of 16 out of 17 village SDGs. One of SDGs 14,
namely the marine ecosystem is not measured because the research location is a terrestrial village with an altitude of 423-902 m ASL. The
use of DDP in the research location with normalization and aggregation methods based on arithmetic averages made this study successful
in calculating the scores of each village SDGs. Then the results of the analysis of the village DDP and SDGs were combined with spatial
mapping. The results showed that the SDGs in Sukamantri Village cumulatively achieved quite good results. A total of 3 SDGs was
classified as very good, 4 SDGs were classified as good, 3 SDGs were classified as good enough, 5 SDGs were lacking, and 2 SDGs were
poorest. Referring to the SDGs index calculation for Sukamantri Village, the environmental pillar has the highest score and is on average
very good. However, the social and economic pillars are in the poor category, the law and governance pillars are in the poorest category.
This means that sustainable development in Sukamantri Village has not been achieved. The natural wealth in Sukamantri Village has not
been managed to achieve the fulfillment of basic human rights that are of a just and equal quality, for the well-being of the villagers and
the realization of inclusive and quality economic growth.
Keywords: precision village data (DDP), RW-based villages, village SDGs
ABSTRAK
Desa adalah arena pembangunan berkelanjutan dimana terjadinya interaksi ekonomi, sosial, budaya, lingkungan, dan politik. Desa
memiliki arti strategis untuk keberhasilan pencapaian 17 indikator Sustainable Development Goals (SDGs). Tetapi desa memiliki
keterbatasan dalam menyediakan data dan indikator untuk mengukur pencapaian SDGs berbasis Rukun Warga (RW). Penelitian ini bertujuan menyediakan Data Desa Presisi (DDP) dan memanfaatkannya untuk mengukur serta menganalisis indikator pencapaian 16 dari
17 SDGs desa. Satu SDGs ke-14, yaitu ekosistem laut tidak diukur, karena lokasi penelitian merupakan desa teresterial dengan ketinggian
423-902 m dpl. Penggunaan DDP di lokasi penelitian dengan metode normalisasi dan agregasi berdasarkan rata-rata aritmetika,
menjadikan penelitian ini berhasil menghitung skor masing-masing SDGs desa. Kemudian hasil analisis DDP dan SDGs desa
dikombinasikan dengan pemetaan spasial. Hasil penelitian menunjukkan SDGs Desa Sukamantri secara kumulatif mencapai hasil cukup
baik. Sebanyak 3 SDGs tergolong sangat baik, 4 SDGs tergolong baik, 3 SDGs tergolong cukup baik, 5 SDGs yang kurang, dan 2 SDGs sangat kurang. Mengacu perhitungan indeks SDGs Desa Sukamantri, pilar lingkungan memiliki skor yang paling tinggi dan secara rata-
rata terkategori sangat baik. Tetapi pilar sosial dan ekonomi termasuk kategori kurang, pilar hukum dan tatakelola tergolong kategori
sangat kurang. Artinya pembangunan berkelanjutan di Desa Sukamantri belum tercapai. Kekayaan alam yang ada di Desa Sukamantri belum terkelola untuk mencapai pemenuhan hak dasar manusia yang berkualitas secara adil dan setara, bagi kesejahteran warga desa dan terwujudnya pertumbuhan ekonomi yang inklusif dan berkualitas.
Kata kunci: data desa presisi (DDP), desa berbasis RW,SDGs desa

Jurnal Sosiologi Pedesaan | Vol. 9 (02) 2021
INTRODUCTION
Era 4.0 is a challenge for stakeholders to develop villages as the nation's economic strength. In the
context of Agro-Maritime 4.0, as many as 73.14% of villages in Indonesia are villages with agricultural
typologies (Sjaf, 2017). This means that most of the Indonesian population who live in rural landscapes
rely their livelihoods on the agricultural sector. As for the size of the nation's economic strength, it is
very much determined by the seriousness of the stakeholders in managing the agricultural and rural
sectors as their economic base. Thus, opening access to rural development as widely as possible has an
impact on reducing underdevelopment, poverty, and inequality that occur in rural areas in particular and
Indonesia in general (Chambers 2008).
In rural development, a common problem that is often encountered is the absence of precise data (Sjaf,
2019; Sjaf et al. 2020). In fact, precise data is very much needed and important for accuracy in planning
and implementing agricultural and rural development. Inaccuracies in identifying village potential and
the willingness to build precise data make important village development documents, both the Village
Government Work Plan and the Village Medium Term Development Plan just a rural development
document that has no meaning for the authenticity of rural development. This is the reason why rural
development is far from achieving the expected targets 1 . Therefore, conventional patterns (old
traditions) in carrying out village development must be abandoned. The village development must go
through two ways: first, village development is carried out by using the precise, accurate, and actual
data based on the results of research and studies conducted by government agencies, Educational
institutions, and Civil Society Organizations (CSO) (Sampean, Wahyuni, and Sjaf 2019); and second, it
is carried out by using a smart system that integrates infrastructure development and public services
based on the use of technology and information (Maja, Meyer, and Von Solms 2020). The results of this
elaboration were used to design the Smart Precision Village (SPV).
SPV is a room for ideas (research) that becomes an action to support the acceleration of rural and
agricultural landscape development in realizing the achievement of the Sustainable Development Goals
(SDGs). The SDGs agenda is to answer problems faced by society, especially community welfare,
economic prosperity, and environmental protection. The SDGs Agenda has 17 goals and 166 targets
which are used as the basis for the world to carry out sustainable development (Pradhan et al. 2020). In
several studies, SDGs measurements were only carried out sectorally and partially, measuring only one
SDGs objective. Research results from De Neve and Sachs (2020) measure the correlation of the SDGs
with the level of welfare and international trade relations. The SDGs measurement was also carried out
by Moyer and Hedden (2020) who found that countries in the world would only make limited progress
towards achieving the SDGs with a set of policy priorities and projected target values. Meanwhile,
research by Izzo, Ciaburri, and Tiscini (2020); Secundo et al. (2020) find explicit specialization and
findings highlight “sustainability imperatives” and convergence towards the following areas of research:
components of the intellectual capital for sustainable development of the private sector, intellectual
capital for sustainable regional development in the knowledge economy, and intellectual capital for
sustainable development in the public sector. The implications of technology policy have been
highlighted to frame future research agendas for academics and practitioners (Filho 2020; Secundo et
al. 2020).
Research results from Costanza et al. (2016) and Jiménez-Aceituno et al. (2020) found the complexity
of measuring SGDs at the local level; measuring SDGs requires diversity and alignment of community
participation (bottom-up) and government involvement (top-down) approaches to achieve SDGs goals.
This is because each achievement of the SDGs requires different interventions and ways to fulfill these
prerequisites. A pessimistic attitude towards SDGs is also shown in several studies that the SDGs goals
cannot avoid environmental destruction because they prioritize socio-economic achievement (Gain,
Giupponi, and Wada 2016; Menton et al. 2020; Zeng et al. 2020). Difficulties in measuring the SDGs
are also experienced by several countries, namely the existence of sanitation, dropping out of school,
and malnutrition / stunting (Moyer and Hedden 2020; Muff, Kapalka, and Dyllick 2017).
Furthermore, the fundamental problems in achieving the SDGs have been shown from the results of
previous research. This research uses Precision Village Data (PVD) in measuring the village SGDs.
PVD is compiled in an actual and accurate manner through a synthesis of a spatial approach (drone-
1 The government states that since the village fund was rolled out from 2015 to 2018 it has only succeeded in reducing the
inequality rate in the village from 0.41 to 0.39.

Jurnal Sosiologi Pedesaan | Vol. 9 (02) 2021
based imagery), census, and community participation called Drone Participatory Mapping (DPM). By
using PVD, villages will be more precise in compiling and implementing development plans as outlined
in the Village Government Work Plan and the Village Medium Term Development Plan. In addition,
the use of PVD makes it easier for villages to measure the level of success of village development that
comes from a variety of financing. Thus, the SPV model to be designed is different from the Smart
Village (SV) concept designed by the European commission and parliament in 2017. The SV concept is
a concept that adopts Smart City by utilizing information and technology networks, as well as
digitization. (Maja et al. 2020; Zavratnik, Kos, and Duh 2018).
The SV concept according to Zavratnik et al. (2018), has a problem because the conditions of rural areas
both in Europe and in other parts of the world are very diverse. SV development must consider the
conditions of the community and social culture. This concept was developed by Maja et al. (2020) by
using the term Smart Rural Village (SRV) which emphasizes improving the quality of life of rural
communities. The difference between SPV from the previous concept is that SPV is designed from the
results of research, collaboration with the community, and digitization in building villages that consider
ecology and the sustainability of community culture. Therefore, SPV is a system or model of sustainable
development based on SDGs indicators and the cultural context of society in Indonesia.
As a first step in developing the SPV concept, this study starts from measuring the achievement of the
village SDGs. Measuring the village SDGs requires a PVD which provides a complete and accurate
picture of the village. PVD answered public doubts about the unavailability of village data to measure
village SDGs (Iskandar 2020). Starting from knowing the position of village SDGs, it will be easier in
the future to build SPV modeling and information systems for village development policies. Villages in
Indonesia must have the ability to respond to era 4.0 which has an impact on fundamental changes in
rural areas.
METHOD
The data used to calculate the SDGs index for the village in this study was the PVD with 66 thematic
obtained from spatial mapping and village censuses involving the participation of residents (village
youths). Spatial mapping produces 10 types of maps, consisting of: 5 base maps and 5 thematic maps.
The types of maps generated from the PVD are presented in Table 1.
Table 1. Types of maps generated from the PVD.
No. Types of Maps Usability
1. Orthophoto Knowing the current condition of the village with precision
2. Administration map Division of administrative areas
3. Land use Knowing the type and area of land use in the village and in the
neighborhood community
4. Village economic
potential
Knowing the economic potential based on natural resources in the
village and in the neighborhood community
5. Demography Knowing the demographic distribution of villagers, such as:
population density, age, and others
6. Infrastructure Knowing the type and amount of infrastructure
7. Socio-cultural
Knowing the socio-cultural characteristics of the community such as
the condition of residents' income, poverty, and the level of household
ownership of goods
8. Topography Knowing the topographic conditions
9. Health Knowing the status and types of illnesses suffered by residents
10. Education Knowing the status and amount of education infrastructure
11. Etc. Types of maps according to village needs
Furthermore, basic and thematic maps are used to describe the condition and potential of the Sukamantri
Village as a whole. The output of PVD is spatial data and numerical data obtained from the family
Jurnal Sosiologi Pedesaan | Vol. 9 (02) 2021
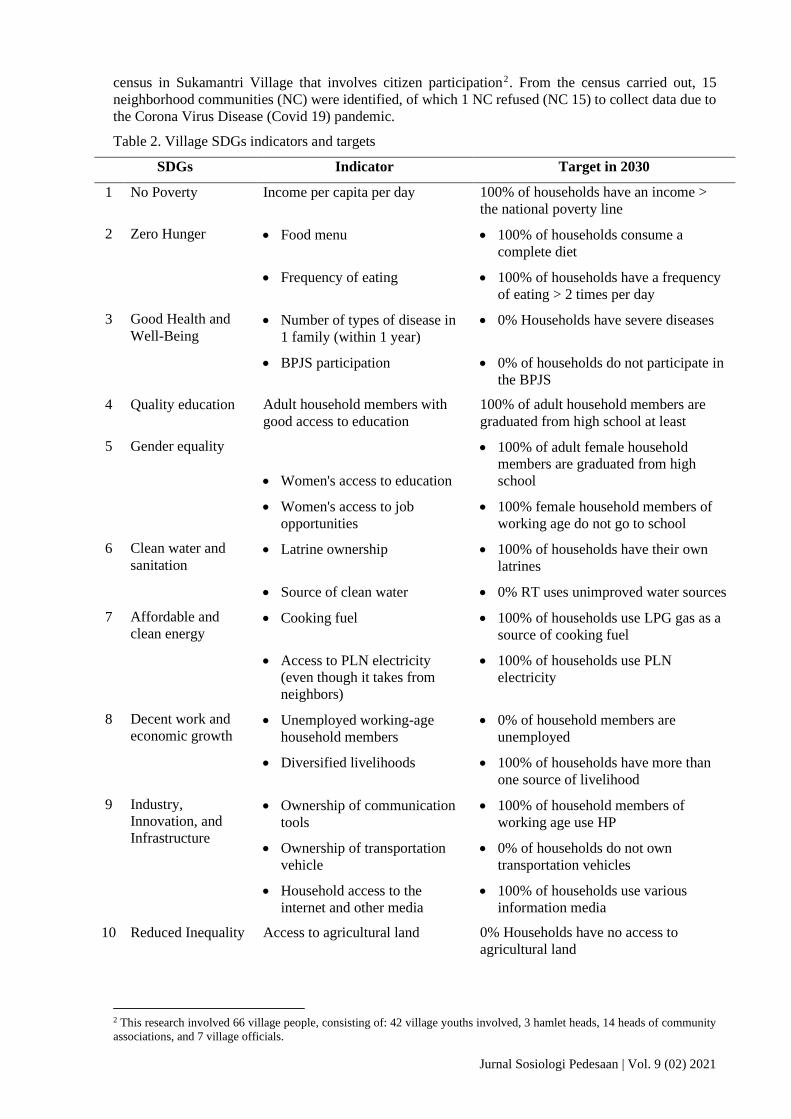
census in Sukamantri Village that involves citizen participation2. From the census carried out, 15
neighborhood communities (NC) were identified, of which 1 NC refused (NC 15) to collect data due to
the Corona Virus Disease (Covid 19) pandemic.
Table 2. Village SDGs indicators and targets
SDGs Indicator Target in 2030
1 No Poverty Income per capita per day 100% of households have an income >
the national poverty line
2 Zero Hunger • Food menu • 100% of households consume a
complete diet
• Frequency of eating • 100% of households have a frequency
of eating > 2 times per day
3 Good Health and
Well-Being • Number of types of disease in
1 family (within 1 year)
• 0% Households have severe diseases
• BPJS participation • 0% of households do not participate in
the BPJS
4 Quality education Adult household members with
good access to education
100% of adult household members are
graduated from high school at least
5 Gender equality
• Women's access to education
• 100% of adult female household
members are graduated from high
school
• Women's access to job
opportunities
• 100% female household members of
working age do not go to school
6 Clean water and
sanitation • Latrine ownership • 100% of households have their own
latrines
• Source of clean water • 0% RT uses unimproved water sources
7 Affordable and
clean energy • Cooking fuel • 100% of households use LPG gas as a
source of cooking fuel
• Access to PLN electricity
(even though it takes from
neighbors)
• 100% of households use PLN
electricity
8 Decent work and
economic growth • Unemployed working-age
household members
• 0% of household members are
unemployed
• Diversified livelihoods • 100% of households have more than
one source of livelihood
9 Industry,
Innovation, and
Infrastructure
• Ownership of communication
tools
• 100% of household members of
working age use HP
• Ownership of transportation
vehicle
• 0% of households do not own
transportation vehicles
• Household access to the
internet and other media
• 100% of households use various
information media
10 Reduced Inequality Access to agricultural land 0% Households have no access to
agricultural land
2 This research involved 66 village people, consisting of: 42 village youths involved, 3 hamlet heads, 14 heads of community
associations, and 7 village officials.

Jurnal Sosiologi Pedesaan | Vol. 9 (02) 2021
SDGs Indicator Target in 2030
11 Sustainable cities
and communities
Building area (house) per number
of family members
100% of households have decent housing
12 Responsible
consumption and
production
• Commodity history • 100% of households produce various
agricultural commodities
• Garbage disposal location • 0% of households do not have
unmanaged landfills
13 Climate action Availability of green open areas at
the neighborhood level
The availability of green open areas at the
neighborhood level is at least 60% of the
total area
14 Life below water None
15 Life on land Farmland management level at
household level
0% of agricultural land is idle at the
household level
16 Peace, justice, and
strong institution
Participation in community
organizations
100% of the people participate in
community organizations
17 Partnerships for the
goals
Household external network level 0% of households have no external
network
The results of the PVD census were used to measure the achievement of SDGs in Sukamantri Village.
The village SDGs measurement was carried out in several stages. The first is the village SDGs
calculation. This stage focuses on determining indicators and targets for each of the sustainable
development goals (SDGs). The indicators and targets were formulated from the Indonesian SDGs
Indicators (BPS 2014) which were adapted according to the village context and the availability of PVD.
With the support of FGDs with experts3, sensitive indicators for each sustainable development goal were
formulated which were then used to calculate the village SDGs index (see Table 2).
The second stage is processing the raw PVD data according to the sensitive indicators formulated in
Table 2. After the raw PVD is calculated according to the sensitive indicators, then normalization is
carried out, so that the data can be compared and aggregated with each other. In line with research by
Nagy, Benedek, and Ivan (2018), because this research involves data at the RW level in a relatively
homogeneous characteristic in almost all data displays, the normalization method used in this study is
the min-max method.
Figure 1. Steps for calculating the village SDGs index.
Each SDG variable is then equalized onto a scale of 0 to 10, where 0 represents the lowest performance
and 10 represents the highest performance. Before balancing between 0 and 10, the lower and upper
limits for each variable are determined from the target indicators to be achieved in each SDGs (see 2030
targets in Table 2). For several indicators, the higher the score indicates the better performance (good
3 This study involved several experts in their respective fields, including: rural institutional experts (Faculty of Human
Ecology, IPB University), community development experts (Faculty of Human Ecology, IPB University), and systems
experts (Faculty of Agriculture Technology, IPB University).
Matching indicators
Determination of
sensitive indicators
processing raw PVD into
sensitive indicators
Normalization
Aggregation
Village SDG
Index
Classification

Jurnal Sosiologi Pedesaan | Vol. 9 (02) 2021
performance), for example, education level and access to communication tools. On the other hand, for
other indicators, the higher the performance, the worse (bad performance), such as poverty level.
Therefore, in carrying out normalization, the indicators will be divided into two categories, namely 𝑥 to
describe indicators including good performance and 𝑥 which describes indicators including bad
performance. This is done to ensure that the higher the score for each indicator shows the better
performance. The following is the formula used to carry out normalization.
𝑥 = (𝑥−𝑚𝑖𝑛(𝑥)
𝑚𝑎𝑥(𝑥)−𝑚𝑖𝑛(𝑥)) × 10……..(1)
𝑥 = (𝑚𝑎𝑥(𝑥)−𝑥
𝑚𝑎𝑥(𝑥)−𝑚𝑖𝑛(𝑥)) × 10…….(2)
𝑥 is the value of the raw data, while 𝑚𝑎𝑥(𝑥) and 𝑚𝑖𝑛(𝑥) shows the upper and lower limit values of the
measured indicator, respectively. 𝑥 and 𝑥 is the normalized value of the indicator.
After the data has been normalized and changed in the same scale, then the aggregation is carried out.
The aggregation method adopted by Nagy et al (2018), namely by using the arithmetic average method
and by applying the same weight to each indicator. The following is a formula for calculating the whole
/ total SDGs for villages based on neighborhood communities.
𝑖𝑗(𝑃𝑗 , 𝑃𝑗𝑘 , 𝑖𝑗𝑘𝑙 = ∑1
𝑃𝑗
𝑃𝑗
𝑘=1∑
1
𝑃𝑗𝑘𝑖𝑗𝑘𝑙
𝑃𝑗𝑘
𝑙=1 ……….(3)
𝑖𝑗 is the overall SDGs score for the jth neighborhood in the village area being analyzed. 𝑃𝑗 is the number
of SDGs for which data are available in the villages analyzed. In this study there are 16 SDGs because
the villages analyzed are not villages in the coastal area. 𝑖𝑗𝑘𝑙 is the score for the indicator 𝑙 in the SDG
𝑘 for NC 𝑗.
Table 3. Class intervals based on Jenks Natural Breaks Optimization
class lower Upper Count Information:
1 0.05 1.75 31 Class 1 Very bad
2 2.56 5.19 70 Class 2 Bad
3 5.37 7.19 54 Class 3 Sufficient
4 7.26 8.92 34 Class 4 Good
5 8.96 10.00 66 Class 5 Very good
GVF 50.63592 2281.775 0.977809
Then the third stage is the classification of the village SDGs index using the Jenk Natural Break
Optimization method. This method is used to ensure maximum uniformity is achieved by minimizing
variance in classes and maximizing variance between classes. Overall the village SDGs scores are in the
range of 0-10, and this study divides the 0-10 range into 5 classes (see Table 3).
RESULTS AND DISCUSSION
Precision Village Data and Sustainable Village Development
The results of the second amendment of 2000, the 1945 Constitution in Article 28 points a to j, state that
the right to guarantee people's welfare, fulfillment of the right to life, includes clothing, food, housing,
education, culture, health, work, and social security, social life protection of law and human rights,
infrastructure and the environment. The mandate of the 1945 Constitution was compiled and formulated
into 116 parameters and questions for the preparation of DDP for sustainable village development.
The formulation and preparation of the PVD is an answer to doubts from Iskandar (2020) regarding the
absence of data at the village level, including the area of the neighborhood communities, the availability
of data presented by the village government, as well as data on citizenship of family and individual
conditions. These doubts were answered in the PVD which was compiled at the family level with the

Jurnal Sosiologi Pedesaan | Vol. 9 (02) 2021
unit of analysis at the neighborhood level of the residents of Sukamatri Village. One of the further
analyzes of PVD is land use data and population data.
For land use data, a total of 467.13 ha of Sukamantri Village was identified. The area of this village is
distributed to each NC, where NC 12 is the NC with the largest area, which is 152.08 ha (32.56%). Then
followed by NC 14 (52.20 or 11.17%), NC 15 (39 ha or 8.35%), NC 11 (26.25 ha or 5.62%), NC 08
(24.25 ha or 5 , 19%), and NC 07 (23.92 ha or 5.12%). Then from the total land area, it is divided into
18 types of land use, namely streets, settlements and other buildings, yards, palawija (second planted
crops) agriculture, horticultural gardens, mixed gardens, rice fields, irrigation canals, fisheries ponds,
meadow, garden/parks, fields, empty fields, house-plants, forests, Japvva farms, dumpsters, and
cemeteries.
Mixed garden is the widest type of land use, namely 147.65 ha or 31.61% of the total land area of
Sukamantri Village. This was followed by types of land use for settlements and other buildings covering
an area of 104.06 or 22.28% of the total village land area, and forests covering an area of 65.23 ha
(13.96% of the total village land area). In contrast, the types of land use that are narrowest are dumpsters
(0.05 ha or 0.01% of the total village area), irrigation canals (0.07 ha or 0.02% of the total village area),
and empty fields (0 , 44 ha or 0, 10% of the total village area). Spatial information on land use types in
Sukamantri Village can be seen in Figure 2.
Figure 2. Map of land use in Sukamantri Village.

Jurnal Sosiologi Pedesaan | Vol. 9 (02) 2021
Figure 3. Map of population density in Sukamantri Village.
Then based on the analysis of population data in Sukamantri Village, the number of heads of households
was 3,461 households and 12,009 people spread across 14 NCs with a population density level of 2,571
people / km2. Of the fourteen NCs studied, the highest population densities of NC were NC 02 (5,180
people / km2), NC 03 (6,712 people / km2), and NC 08 (5,684 people / km2). For NC 10, the population
density is classified as moderate (3,470 people / km2). Meanwhile, NCs with low population density
were NC 05 (3,822 people / km2), NC 06 (3,274 people / km2), NC 07 (2,554 people / km2), NC 11
(3,169 people / km2), NC 12 (802 people / km2), NC 13 (4,088 people / km2), and NC 14 (511 people
/ km2). The map of the population density distribution in Sukamantri Village can be seen in Figure 3.
Figure 4. The layer of the Indonesian government administration unit
PVD can also be used to prepare sustainable village development plans. PVD is able to identify the right
to guarantee people's welfare, fulfillment of the right to life, including food, clothing, housing,
education, culture, health, employment, and social security, social life protection of law and human
rights, infrastructure and the environment in every village.
PVD strengthens the existence of the village as the smallest government system in the concept of a state.
From the results of the PVD analysis, the success of national development can be portrayed from the
success of NC-based village / whole development (Figure 4). PVD can also show the inequality of NC-
based rural development and confirm the existence of sustainable village development in Sukamantri
Village. Thus, the need for SDGs measurement (Iskandar 2020) emphasized that the government needs
SDGs measurements capable of capturing the success of rural development from the results of
national
province
district
sub district
village

Jurnal Sosiologi Pedesaan | Vol. 9 (02) 2021
measuring the achievement of the national and global SDGs. This need can only be answered, if the
village has PVD.
Village SDGs Measurement
The results of measuring the achievement of SDGs in Sukamantri Village can be seen in Table 4. This
index is used to measure rural sustainable development at the NC level using the Sukamantri PVD. The
results showed that the SDGs index of Sukamantri Village as a whole was in a fairly good category with
an average score of 6.17. The highest overall score for the SDGs index was NC 06 at 6.65 and the lowest
overall score for the SDGs index was NC 14 at 5.78.
The SDGs of Sukamantri Village have performed very well, namely goal 12 for sustainable consumption
and production, goal 13 related to addressing climate change, and goal 15 concerning the use of
terrestrial ecosystems. However, for the purpose of goal 15 there are 2 NCs classified as bad and
sufficient, namely NC 12 and NC 09. This is because respectively about 51% and 31% of the existing
agricultural land are not utilized.
Meanwhile, there are 4 objectives that are classified as good, namely: goal 3 concerning a healthy life
and welfare, goal 6 clean water and proper sanitation, goal 7 clean and renewable energy and goal 11
decent housing. Several other goals are categorized as sufficient, namely goal 5 on gender equality, and
goal 9 on infrastructure.
The underperformance in achieving the SDGs at the NC level can be used as a basis for developing
programs that can improve the quality of the SDGs in the village. Table 5 also shows that the
achievement of the tenth SDGS is still bad in all NCs in Sukamantri Village, the lowest figure is NC 03
at 0.01 and the highest is only 1.18 in NC 14. Even though, NC 14 has the highest score in the tenth
SDGs. However, NC 04 shows a level of education that is at least 1.75 compared to other NC which is
in the bad category.
However, there are 5 SDGs that are still classified as bad and still far from the target to be achieved,
even the other 2 SDGs are classified as very vad. The five goals, namely: goal 1 no poverty, goal 2 zero
hunger, goal 4 of quality education, goal 8 of decent work and economic growth, and goal 17 of
partnerships. Two SDGs goals that are still far from being achieved, or the performance is very bad,
namely goal 10 about reduced inequality and goal 16 about strong institutions.
The difference in the achievement of the SDGs in the villages in each NC confirms that village
development policies are not carried out in a planned and structured manner. This weakness is shown in
the SDGs objectives of the six governance systems which are classified as very low. This indicates that
village government institutions and communities are unable to maximize their institutional model in
developing villages. This capability is actualized or internalized in the planning and implementation
system of development and public services. The governance system is measured based on a network
system and community participation in government institutions and other social institutions. The highest
number of governance systems is only 1.1 in NC 02 and the lowest is NC 05 of 0.35.
The results of measuring the achievement of the village SDGs can be used as the basis for planning and
equitable NC-based development. The thing that is important to get the main attention for managing
development in Sukamantri Village is the system of governance and alleviating gaps that occur in almost
all NCs. These two village SDGs require special improvements to increase community participation in
village government institutions and civil society organizations. In addition, for the 15th goal, there are 2
NCs which can be classified as bad and sufficient, namely NC 12 and NC 09, respectively, it is necessary
to intervene in the use of abandoned agricultural land. The utilization of this land resource which is
important for small-scale agriculture is the key to the availability of nutritional resources in the
community, especially in rural areas (Abraham and Pingali 2020; Hazell 2020).
Furthermore, the summary results in Table 5 show that the overall position of NC in the SDGs category
of Sukamantri Village has been compiled. Table 5 describes that the economic growth and decent work
of all NCs of 100% is still very low, followed by the education level of 92.85% which is also very low,
namely NC 14. Meanwhile, the good category comes from health, gender, energy, infrastructure,
housing, sustainable production and consumption, and utilization of terrestrial ecosystems.

Jurnal Sosiologi Pedesaan | Vol. 9 (02) 2021
Table 4. SDGs Index for Sukamantri Village
SDGs NC
Total Pillar 1 2 3 4 5 6 7 8 9 10 11 12 13 14
1. No poverty Social 3.41 4.17 3.97 4.07 4.42 5.41 4.97 4.3 5.1 4.12 3.07 5.39 5.19 4.24 4.36
2. Zero hunger Social 4.09 3.94 3.56 4.1 4.12 4.26 4.44 3.58 3.39 3.36 3.38 4.41 3.74 2.65 3.83
3. Good Health and Well-
being
Social 7.78 7.66 6.66 7.33 7.51 8.14 8.02 7.1 7.65 7.02 6.89 7.51 7.56 7.82 7.41
4. Quality education Social 4.46 4.12 2.92 3.09 4.55 4.99 3.74 3.88 3.23 3.18 2.56 4.05 4.3 1.75 3.73
5. Gender equality Social 6.35 6.09 6.12 5.94 6.89 6.53 6.26 6.39 6.05 6.23 5.72 6.59 6.56 5.8 6.29
6. Clean water and sanitation Environment 9.28 9.2 9.9 9.86 9.94 9.9 9.8 9.88 9.68 9.22 9.34 9.61 9.84 7.06 9.58
7. Affordable and Clean
energy
Economic 9.97 9.82 9.81 9.75 9.84 9.97 9.75 9.83 9.83 9.81 9.81 9.83 9.75 9.65 9.83
8. Decent work and
economic growth
Economic 3.95 4 4.31 4.19 4.31 4.13 3.96 4.2 4.25 4.21 4.28 4.15 4.3 4.34 4.18
9. Industry, Innovation and
Infrastructure
Economic 6.94 6.48 6.52 6.39 7.36 7.19 6.89 6.7 6.23 6.23 7 7.26 7.04 5.93 6.78
10. Reduced Inequality Economic 0.05 0.18 0.1 0.32 0.48 0.14 0.62 0.55 0.89 0.5 0.5 0.52 0.7 1.18 0.44
11. Sustainable Cities and
Communities
Environment 8.54 8.64 7.46 8.92 7.42 8.9 8.7 8.21 7.92 8.31 8.96 8.87 8.76 8.57 8.41
12. Responsible Consumption
and Production
Environment 9.95 9.86 9.9 9.82 9.52 9.86 9.89 9.45 9.21 9.66 9.88 9.59 9.42 8.82 9.66
13. Climate Action Environment 8.32 8.25 9.37 7.95 10 10 10 10 10 10 10 10 10 10 10
14 . Life Below Water Environment
15. Life on Land Environment 10 10 10 10 10 10 10 8.18 6.89 10 9 4.29 8.57 10 8.56
16. Peace, Justice, and Strong
institution
Governance 1.05 1.1 0.81 0.77 0.32 1.01 0.62 0.95 0.84 0.84 0.17 1.07 0.97 0.47 0.82
17. Partnerships for the Goals Economic 5.14 4.17 4.71 4.21 5.18 5.95 3.73 5.37 4.6 4.71 6.22 4.2 3.64 4.24 4.76
Total SDGs 6.21 6.11 6.01 6.04 6.37 6.65 6.34 6.16 5.98 6.09 6.05 6.08 6.27 5.78 6.17

Jurnal Sosiologi Pedesaan | Vol. 9 (02) 2021
Development can be said to be sustainable if it can balance the three pillars of development, namely social,
economic and environmental. Referring to the distribution of targets and goals for the Indonesian SDGs issued
by the Ministry of National Development Planning (MNDP), there are four pillars (social, economic,
environmental, and law and governance). The SDGs social pillar is the achievement of the fulfillment of basic
human rights that are of a fair and equal quality to improve welfare for all communities. These social pillars
include goal 1 for No Poverty, goal 2 for Zero Hunger, goal 3 for Good Health and Well-Being, goal 4 for
Quality Education, goal 5 for Gender Equality. SDGs economic development is the achievement of quality
economic growth through sustainable employment and business opportunities, innovation, inclusive industries,
adequate infrastructure, affordable clean energy and is supported by partnerships. The economic pillar includes
goal 7 for Clean and Affordable Energy, goal 8 for Decent Work and Economic Growth.
Table 5. Summary of SDGs index for Sukamantri Village SDGs Very Bad Bad Sufficient Good Very good
1. No Poverty - 85.71
(12 NC)
14.29
(2 NC)
- -
2. Zero Hunger - 100
(14 NC)
- - -
3. Good Health and Well-
being
- - 28.57
(4 NC)
71.43
(10 NC)
-
4. Quality education 7.14
(1 NC)
92.85
(13 NC)
- - -
5. Gender equality - - 92.86 (13 NC) 7.14
(1 NC)
-
6. Clean water and
sanitation
- - 7.14
(1 NC)
92.86
(13 NC)
-
7. Affordable and Clean
energy
- - - 100
(14 NC)
-
8. Decent work and
economic growth
- 100
(14 NC)
- - -
9. Industry, Innovation and
Infrastructure
- - 85.71 (12 NC) 14.29
(2 NC)
-
10. Reduced Inequality 100
14 NC)
- - - -
11. Sustainable Cities and
Communities
- - - 85.71
(14 NC)
14.29
(2 NC)
12. Responsible
Consumption and
Production
- - - 7.14
(1 NC)
92.86 (13 NC)
13. Climate Action - - - 21.42
(3 NC)
78.57
(11 NC)
14. Life Below Water - - - - -
15. Life on Land - 7.14
(1 NC)
7.14
(1 NC)
14.28
(2 NC)
71.43
(10 NC)
16. Peace, Justice, and
Strong institution
100
(14 NC)
- - - -
17. Partnerships for the
Goals
- 71.43
(10 NC)
28.57
(4 NC)
- -
Total - - 100
(14 NC) - -
Meanwhile, environmental development in the SDGs is the achievement of sustainable management of natural
resources and the environment as a buffer for all life. The environmental pillar consists of goal 6 for clean
water and proper sanitation, goal 11 for sustainable cities and communities, goal 12 for responsible
consumption and production, goal 13 for addressing climate change, goal 14 for marine ecosystems and goal
15 for terrestrial ecosystems. The last is the pillar of legal development and governance of the SDGs, namely
the realization of legal certainty and governance that is effective, transparent, accountable and participatory to
create security stability and achieve a state based on law. As for what is included in the pillars of law and
governance are the goals of peace, justice, and strong institutions.
Then, if aggregated into the four pillars, the environmental pillar is the highest pillar and on average it is
categorized as very good. Meanwhile, the social and economic pillars are in the bad category, and the law and

Jurnal Sosiologi Pedesaan | Vol. 9 (02) 2021
governance pillars are in the very bad category (Table 6). Thus, sustainable development in Sukamantri Village
has not been achieved. The natural wealth in the village area has not been optimally managed to achieve the
fulfillment of basic human rights that are of a fair and equal quality, for the welfare of all rural communities
and the realization of inclusive and quality economic growth. The inaccessibility of the social and economic
pillars shows a difference in the results of the research from Zeng et al. (2020) in rural area. Research result of
Zeng et al. (2020) emphasized that environmental destruction cannot be avoided from the SDGs achievements.
This thesis is in contrast to the situation in Sukamantri Village, where the pillars of the environment are very
good. This environmental pillar comprises sustainable production and consumption, climate change action,
and utilization of terrestrial ecosystems.
The achievement of the environmental pillar in the village SDGs is inversely proportional to the low utilization
of land resources and the availability of green open space. This shows a dilemma in the formulation of
regulations. From these findings, it is necessary to formulate a sustainable development agenda to achieve the
Table 6. Pillars of sustainable development in Sukamantri Village
NC Social Economy Environment Governance
1 5.218 5.21 9.218 1.05
2 5.196 4.93 9.19 1.1
3 4.646 5.09 9.326 0.81
4 4.906 4.972 9.31 0.77
5 5.498 5.434 9.376 0.32
6 5.866 5.476 9.732 1.01
7 5.486 4.99 9.678 0.62
8 5.486 5.33 7.08 0.95
9 5.084 5.16 8.74 0.84
10 4.782 5.092 9.438 0.84
11 4.324 5.562 9.436 0.17
12 5.59 5.192 8.472 1.07
13 5.47 5.086 9.318 0.97
14 4.452 5.068 8.89 0.47
Village 5.12 5.198 9.242 0.82
Min. 4.324 4.93 7.08 0.17
Max. 5.866 5.562 9.732 1.1

Jurnal Sosiologi Pedesaan | Vol. 9 (02) 2021
pillars of the economy and a good governance system, without damaging the environment and exploiting
natural resources. When compared with the achievement of the SDGs measurement in the human resource
aspects of the village, such as education and the quality of public health, it is necessary to improve various
empowerment programs and creative economy (Schramade 2017). In addition, according to Armin Razmjoo,
Sumper, and Davarpanah (2020), one of the strategies to maintain environmental sustainability is through the
development of local renewable energy electrification by investing in clean energy for electricity production.
The results of measuring the achievement of the village SDGs must be carried out by a monitoring and
evaluation process every year or every five years. This step is proposed in the study of Saner, Yiu, and Nguyen
(2020) who proposed the process of evaluating the achievement of the SDGs involving the community through
a digital usage monitoring process. The monitoring and evaluation process must be ensured to be transparent,
inclusive, and with citizen participation. A rigorous multi-stakeholder review and monitoring process can be
undertaken with the help of advances in information technology and analytical tools (Kumi, Yeboah, and Kumi
2020). These developments, help countries better track the achievement of the village SDGs and equip them
with the tools they need to dig deeper and reach them with a level of fundamental trust (ground truth) (Kumi
et al. 2020; Schmidt-Traub et al. 2017).
Figure 5. Examples of NC-based SDGs achievement map for Sukamantri Village (objectives 1, 2, 10, and 12)
Figure 5 shows an example of spatial information, or an NC-based SDGs map of SDGs in Sukamantri Village.
For the 1st objective, it is seen that only 2 NCs have Good SDGs measurement. The rest, as many as 12 NC
measurements of the SDGs were identified as Bad. On the other hand, for the 3rd objective, 10 NC SDGs
measurements were identified as Good and only 4 NCs were identified as Sufficient. Meanwhile, for goal 10
(regarding gaps), all NCs (except NC 15) in Sukamantri Village were identified to be Very Bad. The conditions
differ for the 12th goal, as many as 13 NC were identified as Very Good and 1 NC was identified as Good
(Figure 5).

Jurnal Sosiologi Pedesaan | Vol. 9 (02) 2021
CONCLUSION
The conclusion of this study is that the SDGs of Sukamantri Village cumulatively achieve quite good results.
As many as 9 out of 16 village SDGs were classified as Sufficient to Very Good, but there were still 7 village
SDGs that were still Bad to Very Bad. A total of 5 village SDGs were classified as Bad and 2 other SDGs were
classified as Very Bad. The five goals are: goal 1 No Poverty, goal 2 Zero Hunger, goal 4 for Quality Education,
goal 8 for Decent Work and Economic Growth, and goal 17 on Partnerships. Then 2 SDGs that are still far
from being achieved or are performing Very Bad, namely goal 10 Reduced Inequality and goal 16 Strong
Institutions.
Referring to the distribution of targets and goals for the Indonesian SDGs issued by the Ministry of National
Development Planning, there are four pillars (social, economic, environmental, and governance). The results
of the SDGs index calculation in Sukamantri Village show that the environment is the highest pillar and on
average it is categorized as Very Good. Meanwhile, the social and economic pillars are categorized as Bad,
and the governance pillars are in the Very Bad category. This means that sustainable development in
Sukamantri Village has not been achieved. Natural wealth in rural areas has not been optimally managed to
achieve the fulfillment of basic human rights that are of a just and equal quality for the welfare of all villagers
and the realization of inclusive and quality economic growth.
ACKNOWLEDGE
We would like to thank DIKTI and LPPM IPB University who have provided fund for this research through
the PDUPT scheme. This paper is one of the first-year research results (2020). We also express our gratitude
to all those who have assisted in this research, including the DDP (PVD) Team, village government, village
youth, and community members of Sukamantri Village, Bogor Regency, West Java Province, Indonesia.
REFERENCE
Abraham, Mathew, and Prabhu Pingali. 2020. “Transforming Smallholder Agriculture to Achieve the SDGs.”
in The Role of Smallholder Farms in Food and Nutrition Security, edited by K. Louhichi, L. Riesgo, and
S. G. y Paloma. London: Springer International Publishing.
Armin Razmjoo, A., Andreas Sumper, and Afshin Davarpanah. 2020. “Energy Sustainability Analysis Based
on SDGs for Developing Countries.” Energy Sources, Part A: Recovery, Utilization and Environmental
Effects. doi: 10.1080/15567036.2019.1602215.
Chambers, Robert. 2008. Revolutions in Development Inquiry. London: Earthscan Dunstan House.
Costanza, Robert, Lew Daly, Lorenzo Fioramonti, Enrico Giovannini, Ida Kubiszewski, Lars Fogh Mortensen,
Kate E. Pickett, Kristin Vala Ragnarsdottir, Roberto De Vogli, and Richard Wilkinson. 2016. “Modelling
and Measuring Sustainable Wellbeing in Connection with the UN Sustainable Development Goals.”
Ecological Economics. doi: 10.1016/j.ecolecon.2016.07.009.
Filho, Walter Leal. 2020. “Viewpoint: Accelerating the Implementation of the SDGs.” International Journal
of Sustainability in Higher Education. doi: 10.1108/IJSHE-01-2020-0011.
Gain, Animesh K., Carlo Giupponi, and Yoshihide Wada. 2016. “Measuring Global Water Security towards
Sustainable Development Goals.” Environmental Research Letters. doi: 10.1088/1748-
9326/11/12/124015.
Hazell, Peter. 2020. “Importance of Smallholder Farms as a Relevant Strategy to Increase Food Security.” Pp.
29–43 in The Role of Smallholder Farms in Food and Nutrition Security, edited by K. Louhichi, L.
Riesgo, and S. G. y Paloma. London: Springer Science & Business Media.
Iskandar, Halim A. 2020. SDGs Desa Percepatan Pencapaian Tujuan Pembangunan Nasional Berkelanjutan.
Jakarta: Yayasan Pustaka Obor Indonesia.
Izzo, Maria Federica, Mirella Ciaburri, and Riccardo Tiscini. 2020. “The Challenge of Sustainable
Development Goal Reporting: The First Evidence from Italian Listed Companies.” Sustainability
(Switzerland). doi: 10.3390/SU12083494.
Jiménez-Aceituno, Amanda, Garry D. Peterson, Albert V. Norström, Grace Y. Wong, and Andrea S. Downing.
2020. “Local Lens for SDG Implementation: Lessons from Bottom-up Approaches in Africa.”

Jurnal Sosiologi Pedesaan | Vol. 9 (02) 2021
Sustainability Science. doi: 10.1007/s11625-019-00746-0.
Kumi, Emmanuel, Thomas Yeboah, and Yaa Ankomaa Kumi. 2020. “Private Sector Participation in
Advancing the Sustainable Development Goals (SDGs) in Ghana: Experiences from the Mining and
Telecommunications Sectors.” Extractive Industries and Society. doi: 10.1016/j.exis.2019.12.008.
Maja, Pontsho William, Johan Meyer, and Sune Von Solms. 2020. “Development of Smart Rural Village
Indicators in Line With Industry 4.0.” IEEE Access 8:152017–33. doi: 10.1109/ACCESS.2020.3017441.
Menton, Mary, Carlos Larrea, Sara Latorre, Joan Martinez-Alier, Mika Peck, Leah Temper, and Mariana
Walter. 2020. “Environmental Justice and the SDGs: From Synergies to Gaps and Contradictions.”
Sustainability Science. doi: 10.1007/s11625-020-00789-8.
Moyer, Jonathan D., and Steve Hedden. 2020. “Are We on the Right Path to Achieve the Sustainable
Development Goals?” World Development. doi: 10.1016/j.worlddev.2019.104749.
Muff, Katrin, Agnieszka Kapalka, and Thomas Dyllick. 2017. “The Gap Frame - Translating the SDGs into
Relevant National Grand Challenges for Strategic Business Opportunities.” International Journal of
Management Education. doi: 10.1016/j.ijme.2017.03.004.
Nagy, Júlia A., József Benedek, and Kinga Ivan. 2018. “Measuring Sustainable Development Goals at a Local
Level: A Case of a Metropolitan Area in Romania.” Sustainability (Switzerland) 10(11):2–15. doi:
10.3390/su10113962.
De Neve, Jan Emmanuel, and Jeffrey D. Sachs. 2020. “The SDGs and Human Well-Being: A Global Analysis
of Synergies, Trade-Offs, and Regional Differences.” Scientific Reports 10(1):1–12. doi:
10.1038/s41598-020-71916-9.
Pradhan, Prajal, Luís Costa, Diego Rybski, Wolfgang Lucht, and Jürgen P. Kropp. 2020. “A Systematic Study
of Sustainable Development Goal (SDG) Interactions.” Earth’s Future 5(1):1169–79. doi:
10.1155/2010/706872.
Sampean, Ekawati Sri Wahyuni, and Sofyan Sjaf. 2019. “The Paradox of Recognition Principles in Village
Law in Ammatoa Kajang Indigenous Community.” Sodality: Jurnal Sosiologi Pedesaan 7(2):195–211.
doi: 10.22500/sodality.v7i3.28630.
Saner, Raymond, Lichia Yiu, and Melanie Nguyen. 2020. “Monitoring the SDGs: Digital and Social
Technologies to Ensure Citizen Participation, Inclusiveness and Transparency.” Development Policy
Review. doi: 10.1111/dpr.12433.
Schmidt-Traub, Guido, Christian Kroll, Katerina Teksoz, David Durand-Delacre, and Jeffrey D. Sachs. 2017.
“National Baselines for the Sustainable Development Goals Assessed in the SDG Index and
Dashboards.” Nature Geoscience.
Schramade, Willem. 2017. “Investing in the UN Sustainable Development Goals: Opportunities for
Companies and Investors.” Journal of Applied Corporate Finance. doi: 10.1111/jacf.12236.
Secundo, Giustina, Valentina Ndou, Pasquale Del Vecchio, and Gianluigi De Pascale. 2020. “Sustainable
Development, Intellectual Capital and Technology Policies: A Structured Literature Review and Future
Research Agenda.” Technological Forecasting and Social Change. doi: 10.1016/j.techfore.2020.119917.
Sjaf, Sofyan. 2017. “Merebut Masa Depan Pertanian.” Kompas, December 15, 6–7.
Sjaf, Sofyan. 2019. Involusi Republik Merdesa. Bogor: IPB Press.
Sjaf, Sofyan, La Elson, Lukman Hakim, and I. Made Godya. 2020. Data Desa Presisi. Bogor: LPPM IPB
University.
Zavratnik, Veronika, Andrej Kos, and Emilija Stojmenova Duh. 2018. “Smart Villages: Comprehensive
Review of Initiatives and Practices.” Sustainability (Switzerland) 10(7):2–14. doi: 10.3390/su10072559.
Zeng, Yiwen, Sean Maxwell, Rebecca K. Runting, Oscar Venter, James E. M. Watson, and L. Roman
Carrasco. 2020. “Environmental Destruction Not Avoided with the Sustainable Development Goals.”
Nature Sustainability 3(10):795–98. doi: 10.1038/s41893-020-0555-0.
Related Documents


