MORTALITY AND ITS MEASURES Mortality is defined as the demographic event of death. Since death is a biological phenomenon that occurs just once to each individual, the analysis is simpler than, say, the study of fertility wherein the event of birth can occur with varying frequency among women. Mortality analysis begins with good quality data on deaths and population. These data are conventionally obtained from vital registration systems and population censuses respectively. The crude death rate and the specific death rates (age, sex, age-sex, age- sex-cause of death specific) are simple measures of mortality. The other measures are based on the life tables. Measures of Mortality Crude Death Rate The crude death rate is calculated by dividing the number of registered deaths in a year by the mid-year population for the same year. The rate is expressed as per 1,000 population. Crude Death rate = !"#$% !"#$%& !" deaths !"#$% !"# − !"#$ !"!#$%&!"# ! 1000 This rate has a simple interpretation, for it gives the number of deaths that occur, on the average, per 1,000 people in the community. Further, it is relatively easy to compute, requiring only the total population size and the total number of deaths. Besides, it is a probability rate in the true sense of the term. It represents an estimate of the chance of dying for a person belonging to the given population, because the whole population may be supposed to be exposed to the risk of dying of something or the other. However, it has also some serious drawbacks. In using the CDR, we ignore the fact that the chance of dying is not the same for the young and the old or for males

Welcome message from author
This document is posted to help you gain knowledge. Please leave a comment to let me know what you think about it! Share it to your friends and learn new things together.
Transcript
MORTALITY AND ITS MEASURES
Mortality is defined as the demographic event of death. Since death is a biological
phenomenon that occurs just once to each individual, the analysis is simpler than, say,
the study of fertility wherein the event of birth can occur with varying frequency
among women.
Mortality analysis begins with good quality data on deaths and population. These data
are conventionally obtained from vital registration systems and population censuses
respectively. The crude death rate and the specific death rates (age, sex, age-sex, age-
sex-cause of death specific) are simple measures of mortality. The other measures are
based on the life tables.
Measures of Mortality
Crude Death Rate
The crude death rate is calculated by dividing the number of registered deaths in a year by the mid-year population for the same year. The rate is expressed as per 1,000 population.
Crude Death rate = !"#$% !"#$%& !" deaths!"#$% !"# − !"#$ !"!#$%&!"# ! 1000
This rate has a simple interpretation, for it gives the number of deaths that
occur, on the average, per 1,000 people in the community. Further, it is relatively easy
to compute, requiring only the total population size and the total number of deaths.
Besides, it is a probability rate in the true sense of the term. It represents an estimate
of the chance of dying for a person belonging to the given population, because the
whole population may be supposed to be exposed to the risk of dying of something or
the other.
However, it has also some serious drawbacks. In using the CDR, we ignore
the fact that the chance of dying is not the same for the young and the old or for males
and females, and the fact that it may also vary with respect to race, occupation or
locality of dwelling.
Specific Death Rate
The crude death rates for specific causes of death are calculated in a similar
way by selecting deaths due to specific cause as the numerator and mid-year
population as the denominator. Thus,
!"#$% − !"#$%&%$ !"#$ℎ !"#$ = !"#$% !"#$%& !" !"#$!! !"# !" !"#$ !"#$%&'("# !"#$%!"#$% !"#!!"#$ !"!#$%&'"(
The rates could be made specific to sex by selecting the numerator and the
denominator for each sex of the population.
Age Specific Death Rates (ASDR)
The age-specific death rates are calculated from deaths and population both
specific to each age (or age group) of the population. Thus,
!"# !"#$%&%$ !"#$% !"#$ = !"!!"# ! !"""
Where 'x' indicates the age and 'n' the class interval of age.
The age-cause-specific death rates are obtained by selecting deaths in specific age and cause group of the population as the numerator
It should be noted that the sum of the cause-specific rates over all causes
equals the crude death rate. Similarly, the sum of the age-cause-specific death rates
equals the age-specific death rate at a given age.
Standardization is a technique, which provides a summary measure of the
rates (similar to the crude rates) while controlling for the compositional variation
between the populations being compared. Thus, a comparison of the standardized
rates gives a 'true' comparison of the phenomenon studied. We shall illustrate the
calculations of the standardized rates with the help of the death rates.
The ASDR is a type of central death rate, that is, a rate relating to the events in
a given category during a year to the average population of the category. In a high
mortality situation, the death rates by age, that is, the age specific death rates, form a
U-shaped curve indicating a high mortality in early and old ages. At low levels of
mortality, the pattern of ASDR changes to J-shaped indicating a relatively higher
mortality in the very early period of life, which drops to a low level after the hazards
of early life and extends over a long period of life, and finally it rises sharply in old
ages.
Standardized Death Rate
Method of Direct Standardization
In this method the distributions of the compositional variables (age, sex,
marital status etc.) of the populations that are being compared, are made identical and
the standardized rates (similar to the crude rates) are calculated such that the
difference between them is only due to the variation in the age-specific rates of their
population.
A Standard population is selected which is employed for deriving all the
standardized rates in a set to be compared.
Data Needed
(1) For one compositional variable (say age) standardization, age distribution of
the standard population, and
(2) Age-specific death rates in all populations to be compared.
Calculations
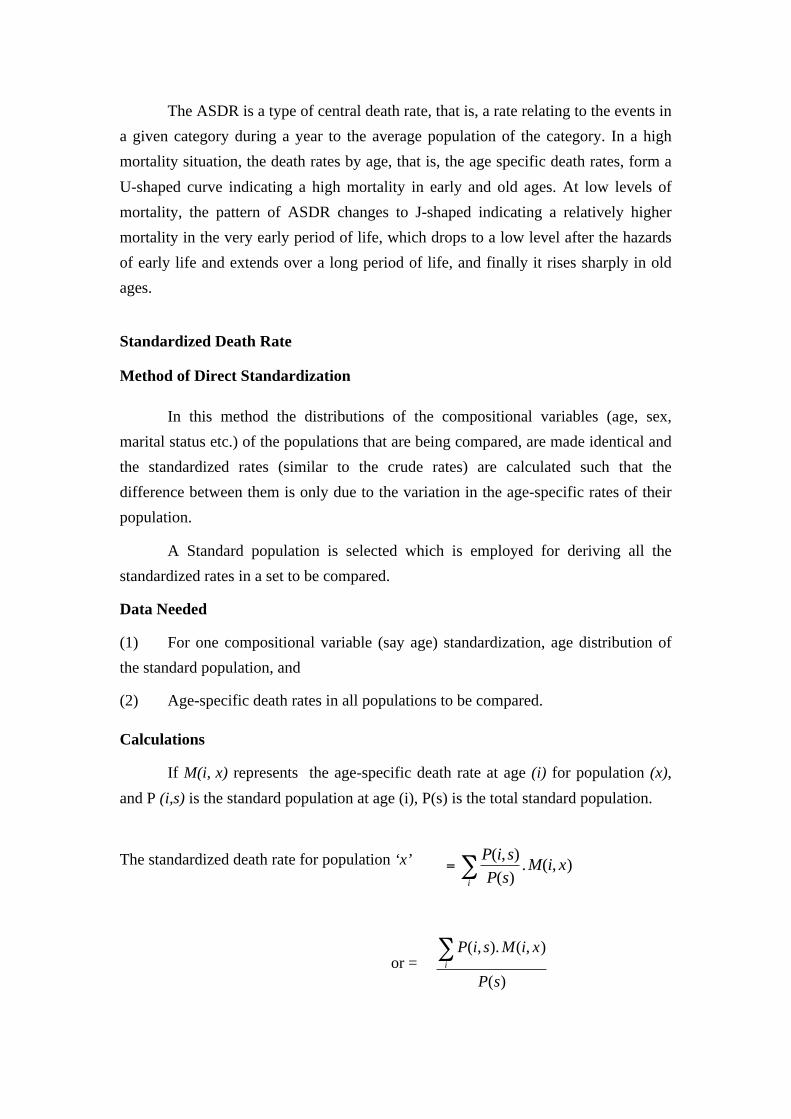
If M(i, x) represents the age-specific death rate at age (i) for population (x),
and P (i,s) is the standard population at age (i), P(s) is the total standard population.
The standardized death rate for population ‘x’
or =
=∑P i s
P sM i x
i
( , )
( ). ( , )
P i s M i x
P si
( , ). ( , )
( )
∑
The numerator is the number of expected deaths in the standard population
had the age-specific death rates of population (x) applied to the standard population,
and the denominator is the total standard population. The rate is multiplied by 1,000
to express the rate as per 1,000 population.
(All the calculations are done with the rates per person. Finally, the
standardized death rate is multiplied by the constant 1,000).
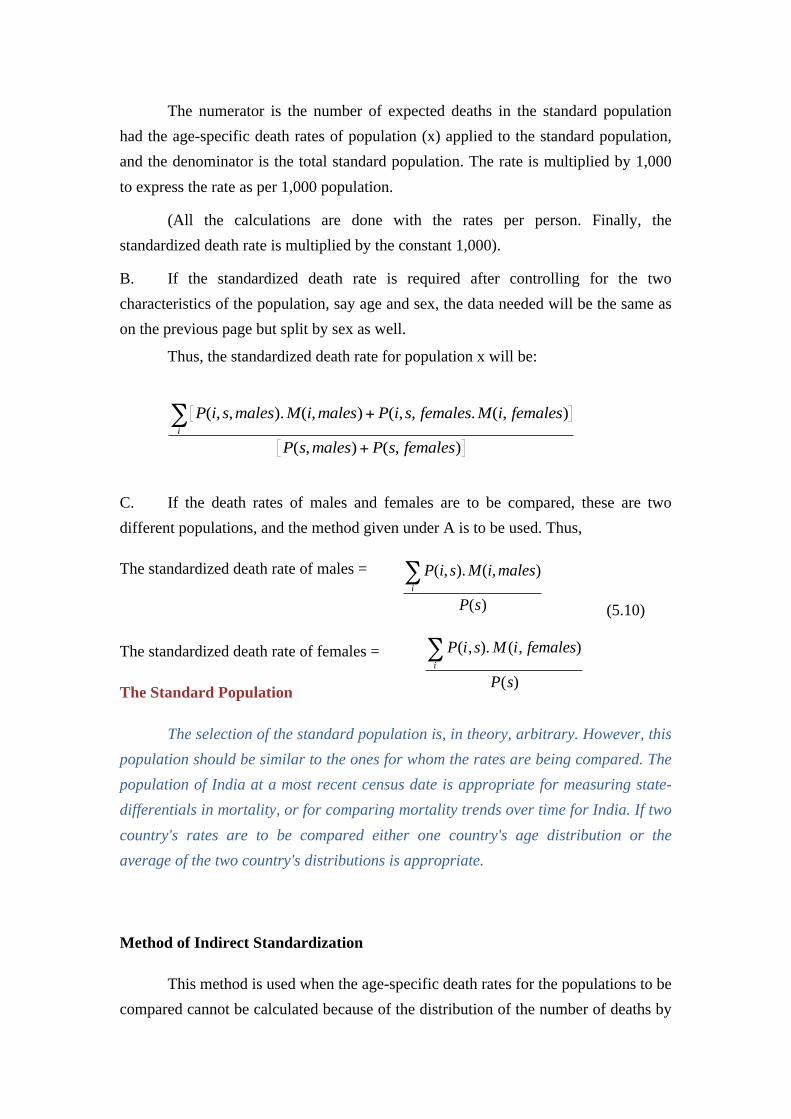
B. If the standardized death rate is required after controlling for the two
characteristics of the population, say age and sex, the data needed will be the same as
on the previous page but split by sex as well.
Thus, the standardized death rate for population x will be:
C. If the death rates of males and females are to be compared, these are two
different populations, and the method given under A is to be used. Thus,
The standardized death rate of males =
(5.10)
The standardized death rate of females =
The Standard Population
The selection of the standard population is, in theory, arbitrary. However, this
population should be similar to the ones for whom the rates are being compared. The
population of India at a most recent census date is appropriate for measuring state-
differentials in mortality, or for comparing mortality trends over time for India. If two
country's rates are to be compared either one country's age distribution or the
average of the two country's distributions is appropriate.
Method of Indirect Standardization
This method is used when the age-specific death rates for the populations to be
compared cannot be calculated because of the distribution of the number of deaths by
P i s males M i males P i s females M i females
P s males P s femalesi
( , , ). ( , ) ( , , . ( , )
( , ) ( , )
+
+
∑
P i s M i males
P si
( , ). ( , )
( )
∑
P i s M i females
P si
( , ). ( , )
( )
∑

age is unavailable or not reliably available, but the total number of deaths and the age
distribution of populations whose rates are to be compared are available.
Data Needed
(1) Observed number of deaths in all populations whose death rates are to be
compared.
(2) Age distribution of all populations whose death rates are to be compared.
(3) Age-specific death rates for a population to be used as standard.
(4) Crude death rate in the standard population.
Calculations
A. If P(i,x) represents the population ‘x’ at age (i), M(i,s) is age-specific death
rate at age ‘i’ in standard population, M(s) is the crude death rate in the standard
population, O(x) is the observed number of deaths in population ‘x’, and E(x) is the
expected deaths in population ‘x’, then
The standardized death rate for population x =
The expected deaths in population x = E(x) =
(All the calculations are done with the rates per person. Finally, the standardized
death rate is multiplied by the constant 1,000).
Maternal Mortality Rate
MMR may be looked upon as an alternative to, or a refined version of the
corresponding cause-of-death rate. This rate is defined by the formula-
MMR=
O x
E xM s
( )
( ). ( )
P i x M i si
( , ). ( , )∑
1 000, ,×D
B
P
where DP = Total number of deaths from puerperal causes occurring within 42
days of delivery among the female population aged 15-49 in the given
period in the given community.
Puerperal infection occurs when bacteria infect the uterus and
surrounding areas after a woman gives birth and hence becomes the
cause of death.
B = Total number of live births occurring in the given period in the
community.
INCIDENCE RATE
This rate measures the annual incidence of a disease. The numerator of the rate is the number of times attacks of a certain disease are reported in a year, and the denominator is the population exposed to the disease during the same year. Note that the rate can exceed 1, as there could be repeated attacks of the disease to the same person.
Incidence rate =Number of new cases of specialized disease during a give time period / population at risk * 1000
!"#$%&"#& !"#$= !"#$%& !" !"# !"#$# !" !"#$%&'%(#) !"#$%#$ !"#$%& ! !"#$% !"#$ !"#$%&
!"#$%&'(") !" !"#$ ! 1000
PREVALENCE RATE
This rate is the proportion of the number of people reported as having a disease at a specific point in time. The numerator is the number of people with a disease and the denominator is the total population.
!"#$%&#'(# !"#$= !"#$%& !" !"# !"#$ !"# !"#$# !" !"#$%&%#' !"#$!"# !"#$%#&' !" ! !"#$% !"#$% !" !"#$
!"#$%&#'( !"!#$%&'"( !" !ℎ! !"#$ !"#$% !" !"#$ ! !
k= 1000
Infant Mortality Rate
The infant mortality rate (IMR), too, is an alternative to, and in a sense an
improvement upon, the age-specific death rate for age 0, in other words, upon the
death rate for infants (i.e. children under 1 year of age). It is defined as
(5.17)
Where D0 = number of deaths among children of age 0, 1.b.d. (last birth day)
and B = number of live births.
Child Mortality Rate: It is define as the total number of deaths of children aged 1 to 4 in the given year and geographical region and to the 1000 population of the same age in that year and same geographical regions.
Under 5 Mortality= Number of deaths of children aged 0 to 4 year in the given year and region
Total population aged 0 to 4 in the given year and region ! 1000
Neonatal Mortality Rate (NMR): NMR measures the Number of infants dying within the first month (4 weeks)/(Upto 28 days) of life in a year and geographical region per thousand live births of same year and geographical region.
!"# = Deaths of Infants upto 4 weeks!"#$% !"#$%& !" !"#$ !"#!ℎ! ! 1000
Post Neonatal Mortality Rate (PNMR): Number of infant deaths after 28 days to less than one year (between 4 weeks to 52 weeks) of age per thousand live births in a given year.
IMRD
B= ×1 000 0,
!"#$= Number of deaths of newborns between 4 weeks and less than one year of age
!"#$%& !" !"#$ !"#$ℎ! !"#$%& !ℎ! !"#$ !"#$ ! 1000
Foetal Death: It is known as the death prior to the complete expulsion or extraction from its mother of a product of conception at any point of time of pregnancy.
Still Birth: It is used for death of foetus after completing 28 weeks and till the time of birth.
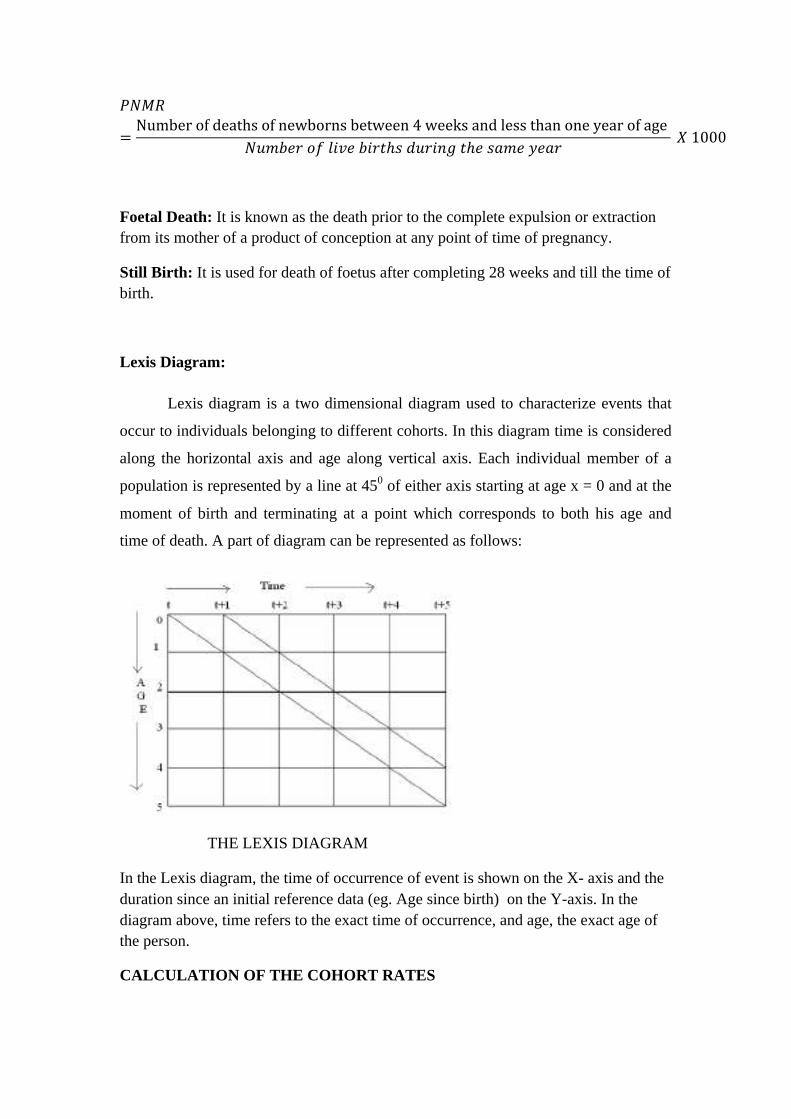
Lexis Diagram:
Lexis diagram is a two dimensional diagram used to characterize events that
occur to individuals belonging to different cohorts. In this diagram time is considered
along the horizontal axis and age along vertical axis. Each individual member of a
population is represented by a line at 450 of either axis starting at age x = 0 and at the
moment of birth and terminating at a point which corresponds to both his age and
time of death. A part of diagram can be represented as follows:
THE LEXIS DIAGRAM
In the Lexis diagram, the time of occurrence of event is shown on the X- axis and the duration since an initial reference data (eg. Age since birth) on the Y-axis. In the diagram above, time refers to the exact time of occurrence, and age, the exact age of the person.
CALCULATION OF THE COHORT RATES

The rates for the cohorts are usually based on the probability concept. However, cross-section rates for the cohorts (Known as Central rates) are also calculated. Consider the following Lexis diagram.
If we know the population at exact age X during time t- t+1 (say PX) and at exact age X+1 (say PX+1) during time t+1- t+2, and the deaths occurring to this cohort in the parallelogram abcd (say DX),
The probability of dying between exact ages X and X+1 will be= Dx /P
The central death rate at age X will be =
!!!! + !!!! 2
(Px +Px+1)/2 will be the average or mid - year population (represented by the vertical line ‘db’) on the assumption that the deaths have occurred uniformly over the parallelogram ‘abcd’. However, this is not true for deaths, which occur at very early ages, especially among the infants in their first 12 months of life. The mid-year population is estimated by the use of the separation factors.
Related Documents