Measures of central tendency and dispersion Tunis, 28th October 2014 Dr Ghada Abou Mrad Ministry of Public Health, Lebanon [email protected]

Welcome message from author
This document is posted to help you gain knowledge. Please leave a comment to let me know what you think about it! Share it to your friends and learn new things together.
Transcript

Measures of central tendency and
dispersion Tunis, 28th October 2014
Dr Ghada Abou Mrad Ministry of Public Health, Lebanon

Learning objectives
• Define the different types of variables and data within a population or a sample
• Describe data using the common measures of central tendency (Mode, Median, arithmetic Mean)
• Describe data in terms of their measures of dispersion (range, standard deviation/variance, standard error)

Variable • A population is any complete group of units (such as
person or business) with at least one characteristic in common. It needs to be clearly identified at the beginning of a study.
• A sample is a subset group of units in a population, selected to represent all units in a population of interest
• A variable is any characteristics, number, or quantity that can be measured or counted. It is called a variable because its value may vary in the population and over time; it is represented by “X” in a population and “x” in a sample

Data
• Data are the measurements or observations or values that are collected for a specific variable in a population or a sample; an observation can be represented by “Xi “ in a population and “xi“ in a sample – A data unit (or unit record or record) is one entity (such as a person or
business) in the population being studied, for which data are collected.
– A data item (or variable) is a characteristic (or attribute) of a data unit which is measured or counted, such as height.
# age sex height
1 20 M 175
2 16 F 163
3 23 F 170
Data unit
Data item

Dataset
• A dataset is a complete collection of all observations for a specific variable in a population or a sample; it is called a raw dataset if the data have not been organized; the total number of observation in a dataset can be represented by “N” for a population and “n” for a sample
• Example: Ages of students in a class (years)
Obs Age
27
30
28
31
28
36
29
37
29
34
30
30
27
30
28
31
32
30
29
29

Types of variables
Variable
Qualitative
nominal ordinal
Quantitative
discrete continuous
Types of variables
• Qualitative variable: have value that describe a 'quality' ; it is also called a categorical variable – Nominal: Observations can take a value that is not
able to be organized in a logical sequence like sex or eye color
– Ordinal: Observations can take a value that can be logically ordered from lowest to highest like clothing size (i.e. small, medium, large)
• The data collected for a qualitative variable are qualitative data

Types of variables
• Quantitative variable: have values that describe a measurable quantity ; it is also called numeric variable; it can be ordered from lowest to highest – Discrete: Observations can take a value based on a
count from a set of values. It cannot take the value of a fraction between one value and the next closest value. Ex: number of children in a family
– Continuous: Observations can take any value between a certain set of real numbers. Ex: height
• The data collected for a quantitative variable are quantitative data

Descriptive statistics
Statistics describe or summarize data • Most data can be ordered from lowest to highest • The frequency is the number of times an
observation occurs for a variable; the frequency distribution can be shown in a table or in a graph such as histogram
• Quantitative data can be described using the common measures of central tendency (Mode, Median, Mean) and the measures of dispersion (range, standard deviation/variance, standard error)
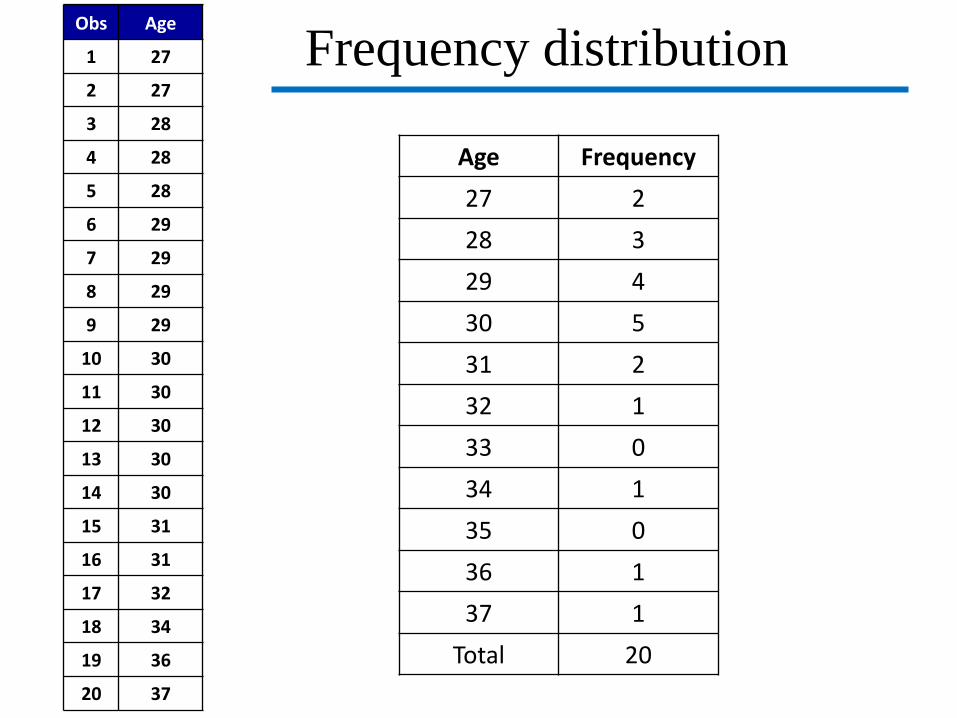
Age Frequency
27 2
28 3
29 4
30 5
31 2
32 1
33 0
34 1
35 0
36 1
37 1
Total 20
Obs Age
1 27
2 27
3 28
4 28
5 28
6 29
7 29
8 29
9 29
10 30
11 30
12 30
13 30
14 30
15 31
16 31
17 32
18 34
19 36
20 37
Frequency distribution
Obs Age
1 27
2 27
3 28
4 28
5 28
6 29
7 29
8 29
9 29
10 30
11 30
12 30
13 30
14 30
15 31
16 31
17 32
18 34
19 36
20 37
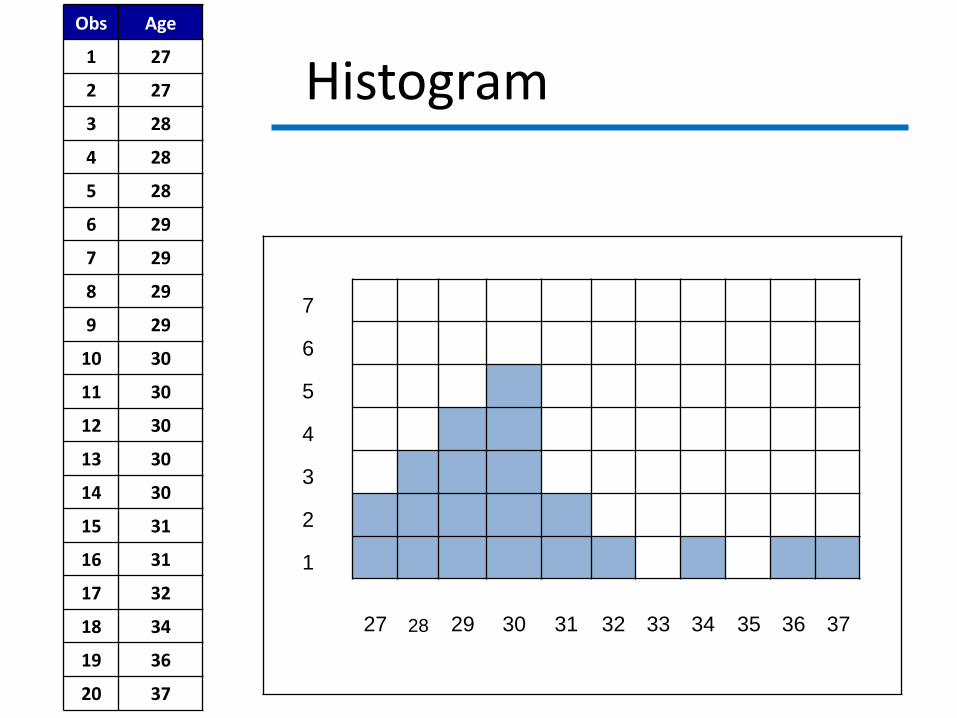
Histogram
7
6
5
4
3
2
1
27 28 29 30 31 32 33 34 35 36 37

Histogram - Outliers
0
1
2
3
4
5
6
0 5 10 15 20 25 30 35 40 45 50
Nights of stay
Num
ber
of p
atie
nts
Outliers are extreme, or atypical data value(s) that are notably different from the rest of the data.

0
5
10
15
20
0-9 10-19 20-29 30-39 40-49 50-59 60-69 70-79 80-89 90-99
Central Location
Spread
Nu
mb
er o
f p
eop
le
Age
? ?
Epidemic curve

Measures of central tendency and spread
Central Location / Position / Tendency
A single value that is a good summary of an entire distribution of data
Spread / Dispersion / Variability
How much the distribution is spread or dispersed from its central location

Measure of Central Tendency
Also known as measure of central position or location
It is a single value that summarizes an entire distribution of data
Common measures – Mode – Median – Arithmetic mean

Method for identification 1. Arrange data into frequency distribution or
histogram, showing the values of the variable and the frequency with which each value occurs
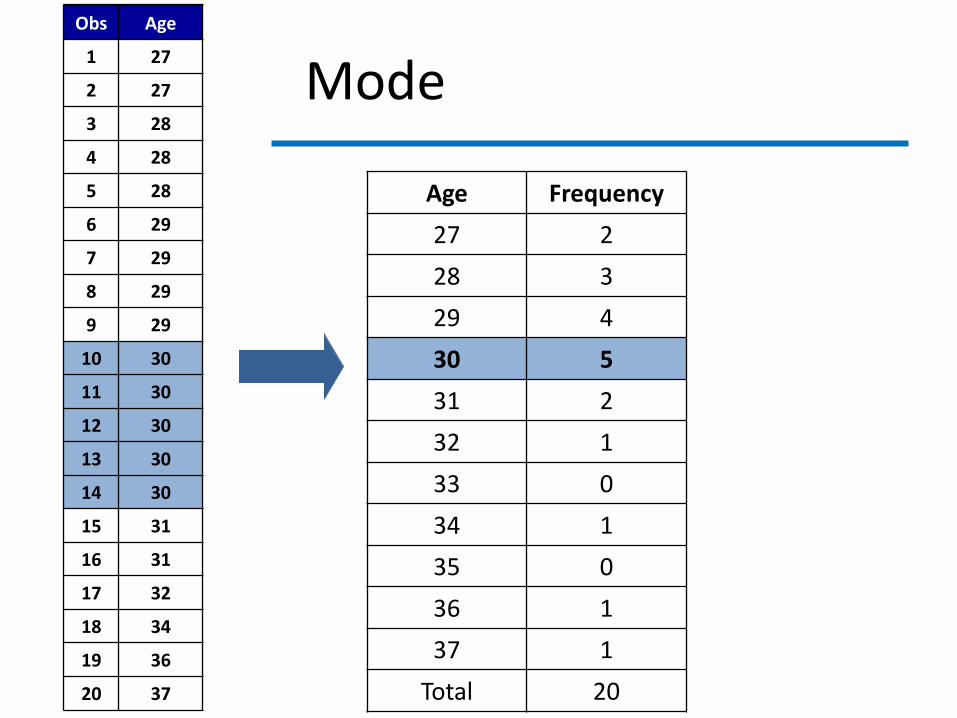
2. Identify the value that occurs most often
Mode is the value that occurs most frequently
Mode
Age Frequency
27 2
28 3
29 4
30 5
31 2
32 1
33 0
34 1
35 0
36 1
37 1
Total 20
Obs Age
1 27
2 27
3 28
4 28
5 28
6 29
7 29
8 29
9 29
10 30
11 30
12 30
13 30
14 30
15 31
16 31
17 32
18 34
19 36
20 37
Mode

Obs Age
1 27
2 27
3 28
4 28
5 28
6 29
7 29
8 29
9 29
10 30
11 30
12 30
13 30
14 30
15 31
16 31
17 32
18 34
19 36
20 37
Mode
7
6
5
4
3
2
1
27 28 29 30 31 32 33 34 35 36 37
Mode = 30

Po
pu
lati
on
0
2
4
6
8
10
12
14
16
18 Bimodal Distribution
Unimodal Distribution
0
2
4
6
8
10
12
14
16
18
20
Po
pu
lati
on

Mode – Properties / Uses
• Easiest measure to understand, explain, identify
• Always equals an original value
• Does not use all the data
• Insensitive to extreme values (outliers)
• May be more than one mode
• May be no mode

Median
Median is the middle value; it splits the distribution into two equal parts
– 50% of observations are below the median – 50% of observations are above the median
Method for identification
1. Arrange observations in order 2. Find middle position as (n + 1) / 2 3. Identify the value in the middle

Obs Age
1 27
2 27
3 28
4 28
5 28
6 29
7 29
8 29
9 29
10 30
11 30
12 30
13 30
14 30
15 31
16 31
17 32
18 34
19 36
Median: uneven number of values
Median Observation
n = 19
n+1 2 =
19+1 2 =
20 2
=
10 =
Median age = 30 years

Obs Age
1 27
2 27
3 28
4 28
5 28
6 29
7 29
8 29
9 29
10 30
11 30
12 30
13 30
14 30
15 31
16 31
17 32
18 34
19 36
20 37
Median: even number of values
n = 20 Median Observation
n+1 2 =
20+1 2 =
21 2
=
10.5 =
Median age = Average value between 10th and 11th observation
30+30 2
30 years =

Median – Properties / Uses
• Does not use all the data available
• Insensitive to extreme values (outliers)
• Measure of choice for skewed data
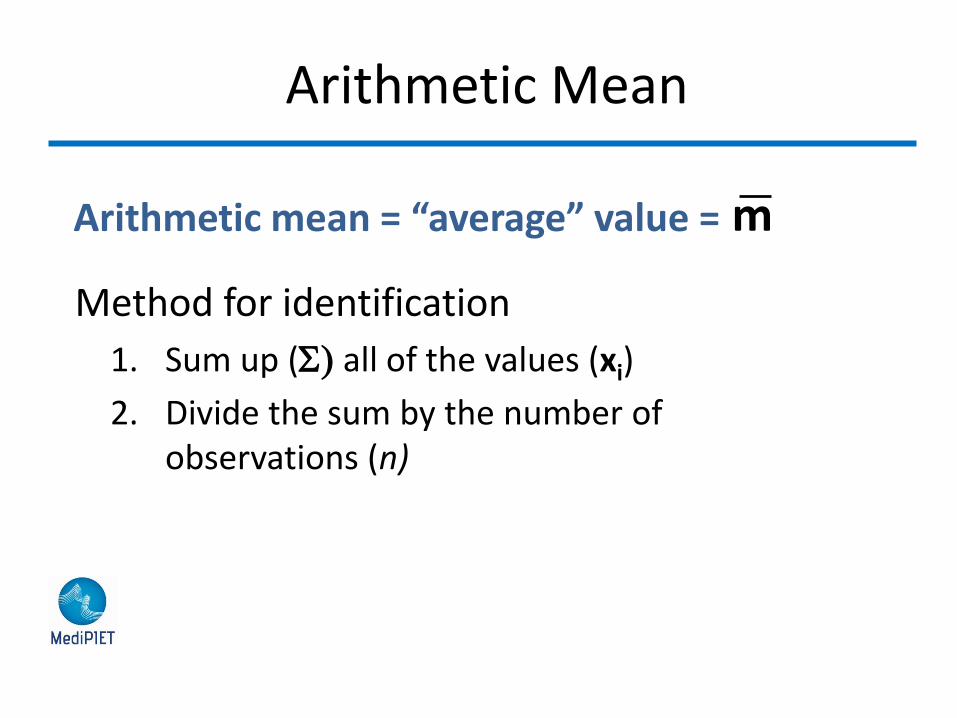
Arithmetic Mean
Method for identification
1. Sum up (S) all of the values (xi)
2. Divide the sum by the number of observations (n)
Arithmetic mean = “average” value = m

Obs Age
1 27
2 27
3 28
4 28
5 28
6 29
7 29
8 29
9 29
10 30
11 30
12 30
13 30
14 30
15 31
16 31
17 32
18 34
19 36
20 37
Arithmetic Mean
n = 20 Sxi = 605
30.25
20
605 m = =
n
x m
i =
0
1
2
3
4
5
6
0 5 10 15 20 25 30 35 40 45 50
Nights of stay
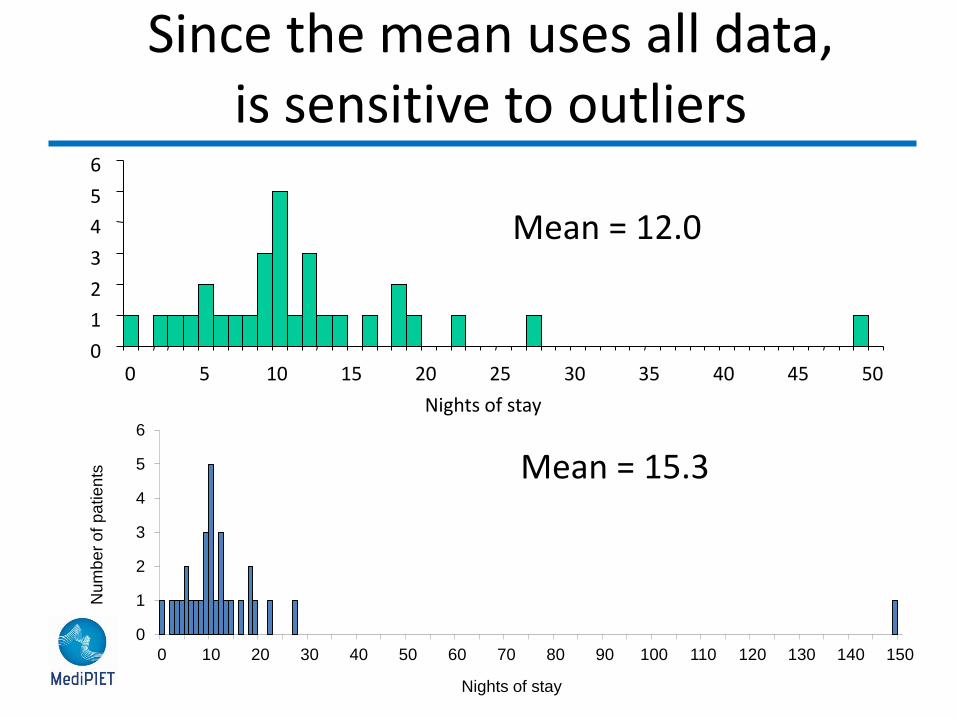
Mean = 12.0
Mean = 15.3
Since the mean uses all data, is sensitive to outliers
0
1
2
3
4
5
6
0 10 20 30 40 50 60 70 80 90 100 110 120 130 140 150
Num
be
r of
pa
tien
ts
Nights of stay

Centered distribution Approximately symmetrical Few extreme values (outliers)
When to use the arithmetic mean?

OK!
When to use the arithmetic mean? (ii)
1 2
4 3

Arithmetic Mean – Properties / Uses
• Use all of the data
• Affected by extreme values (outliers)
• Best for normally distributed data
• Not usually equal to one of the original values

How does the shape of a distribution influence
the Measures of Central Tendency?
Symmetrical: Mode = Median = Mean
Skewed right: Mode < Median < Mean
Skewed left: Mean < Median < Mode

0
5
10
15
20
0-9 10-19 20-29 30-39 40-49 50-59 60-69 70-79 80-89 90-99
Central Location
Spread
Nu
mb
er o
f p
eop
le
Age
? ?
Epidemic curve

Same center but … different dispersions
Measures of Spread
Measures that quantify the variation or dispersion of a set of data from its central location
• Also known as “Measure of dispersion/ variation” • Common measures
• Range • Variance / standard deviation • Standard error

Range
Properties / Uses:
– Greatly affected by outliers
– Usually used with median
Range = Difference between largest and smallest values in a dataset
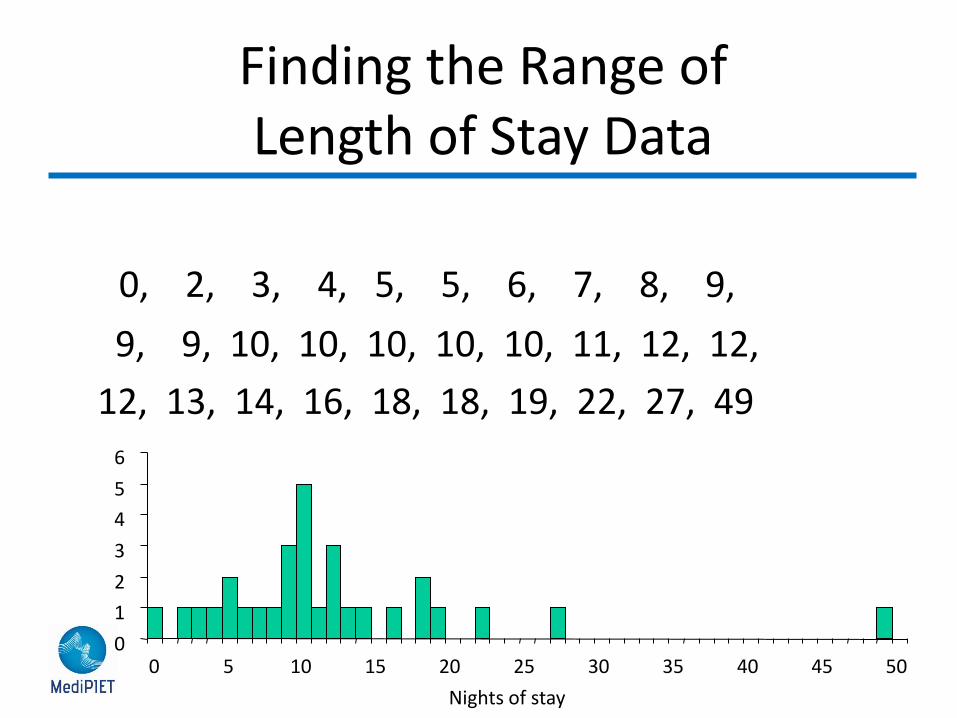
Finding the Range of Length of Stay Data
0, 2, 3, 4, 5, 5, 6, 7, 8, 9,
9, 9, 10, 10, 10, 10, 10, 11, 12, 12,
12, 13, 14, 16, 18, 18, 19, 22, 27, 49
0
1
2
3
4
5
6
0 5 10 15 20 25 30 35 40 45 50
Nights of stay

Range = 49 - 0 = 49
Range = 149 - 0 = 149
Range – Sensitive to Outliers?
0
1
2
3
4
5
6
0 10 20 30 40 50 60 70 80 90 100 110 120 130 140 150
Nights of stay
Numb
er of
patie
nts
0
1
2
3
4
5
6
0 5 10 15 20 25 30 35 40 45 50
Nights of stay

Variance = average of squared deviations from mean = Sum (each value – mean)2 / (n-1) Standard deviation = square root of variance
Measures of variation that quantifies how closely clustered the observed values are to the mean; measures of the spread of the data around the mean
Variance and Standard Deviation

x : mean xi : value n : number s²: variance s : standard deviation
s² =
s =
( ) n-1
²
( ) n-1
² - x x i
- x x i
Variance and Standard Deviation (ii)

1. Calculate the arithmetic mean
2. Subtract the mean from each observation.
3. Square the difference.
4. Sum the squared differences
5. Divide the sum of the squared differences by n – 1
6. Take the square root of the variance
x
( ) ² ( ) ²
- x x i
s² = n-1
( ) ² - x x i
- x x i
- x x i
s = s2
Steps to Calculate Variance and Standard Deviation
x : mean xi : value n : number s²: variance s : standard deviation

Length of Stay Data
(0 – 12)2 = 144 (9 – 12)2 = 9 (12 – 12)2 = 0 (2 – 12)2 = 100 (9 – 12)2 = 9 (13 – 12)2 = 1 (3 – 12)2 = 81 (10 – 12)2 = 4 (14 – 12)2 = 4 (4 – 12)2 = 64 (10 – 12)2 = 4 (16 – 12)2 = 16 (5 – 12)2 = 49 (10 – 12)2 = 4 (18 – 12)2 = 36 (5 – 12)2 = 49 (10 – 12)2 = 4 (18 – 12)2 = 36 (6 – 12)2 = 36 (10 – 12)2 = 4 (19 – 12)2 = 49 (7 – 12)2 = 25 (11 – 12)2 = 1 (22 – 12)2 = 100 (8 – 12)2 = 16 (12 – 12)2 = 0 (27 – 12)2 = 225 (9 – 12)2 = 9 (12 – 12)2 = 0 (49 – 12)2 = 1369 Sum = 2448; Var = 2448 / 29 = 84.4; SD = 84 = 9.2

Standard Deviation
Standard deviation usually calculated only when data are more or less normally distributed (bell shaped curve)
For normally distributed data, • 68.3% of the data fall within plus/minus 1 SD • 95.5% of the data fall within plus/minus 2 SD • 95.0% of the data fall within plus/minus 1.96 SD • 99.7% of the data fall within plus/minus 3 SD
The standard deviation of a normal distribution enables the calculation of confidence intervals

Standard deviation
2.5% 2.5%
68%
Mean
95%
Normal Distribution
Properties of Measures of Central Location and Spread
• For quantitative / continuous variables
• Mode – simple, descriptive, not always useful
• Median – best for skewed data
• Arithmetic mean – best for normally distributed data
• Range – use with median
• Standard deviation – use with mean
• Standard error – used to construct confidence intervals
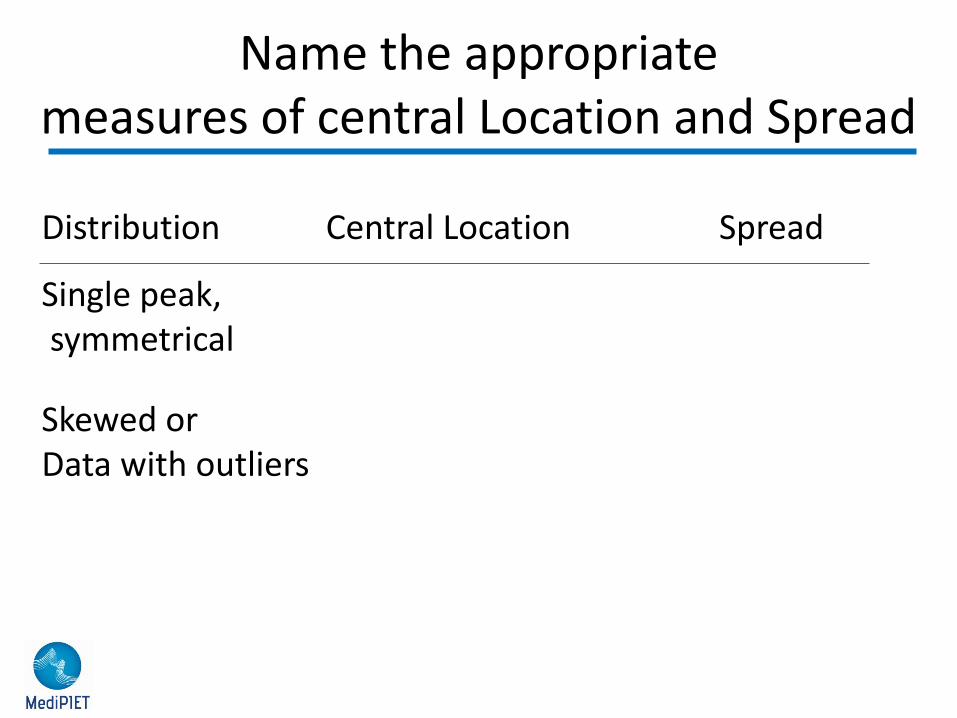
Distribution Central Location Spread
Single peak, symmetrical
Skewed or Data with outliers
Name the appropriate measures of central Location and Spread

Distribution Central Location Spread
Single peak, Mean* Standard symmetrical deviation
Skewed or Median Range or Data with outliers Interquartile range
Name the appropriate measures of central Location and Spread
* Median and mode will be similar
0
2
4
6
8
10
12
14
Po
pu
lati
on
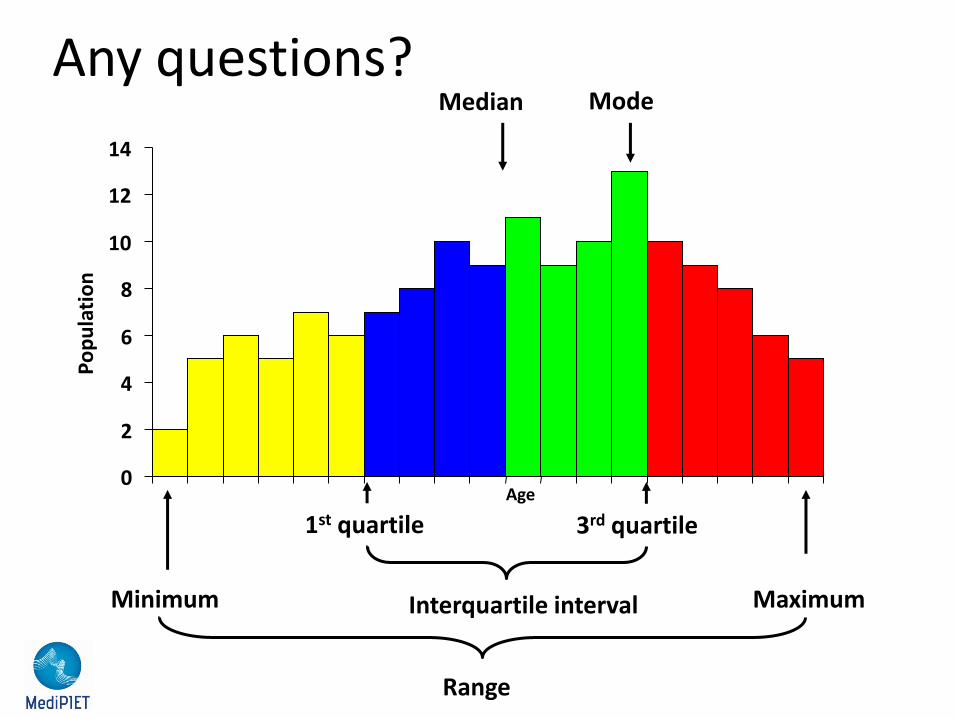
1st quartile 3rd quartile
Minimum Maximum
Range
Mode Median
Interquartile interval
Age
Any questions?

Thank you!
Dr Ghada Abou Mrad Ministry of Public Health, Lebanon
Related Documents