Atmos. Meas. Tech., 6, 917–925, 2013 www.atmos-meas-tech.net/6/917/2013/ doi:10.5194/amt-6-917-2013 © Author(s) 2013. CC Attribution 3.0 License. Atmospheric Measurement Techniques Open Access Measurements of hydrogen cyanide (HCN) and acetylene (C 2 H 2 ) from the Infrared Atmospheric Sounding Interferometer (IASI) V. Duflot 1 , D. Hurtmans 1 , L. Clarisse 1 , Y. R’honi 1 , C. Vigouroux 2 , M. De Mazi` ere 2 , E. Mahieu 3 , C. Servais 3 , C. Clerbaux 1,4 , and P.-F. Coheur 1 1 Spectroscopie de l’Atmosph` ere, Service de Chimie Quantique et Photophysique, Universit´ e Libre de Bruxelles, 50 Av. F. D. Roosevelt, 1050, Brussels, Belgium 2 Belgian Institute for Space Aeronomy (BIRA-IASB), 3, Av. Circulaire, 1180, Brussels, Belgium 3 Institut d’Astrophysique et de G´ eophysique, Universit´ e de Li` ege, 17, All´ ee du 6 Ao ˆ ut, 4000, Li` ege, Belgium 4 Universit´ e Paris 06, Universit´ eVersailles-St. Quentin, CNRS/INSU, LATMOS-IPSL, Paris, France Correspondence to: V. Duflot ([email protected]) Received: 5 October 2012 – Published in Atmos. Meas. Tech. Discuss.: 16 October 2012 Revised: 19 March 2013 – Accepted: 20 March 2013 – Published: 9 April 2013 Abstract. Hydrogen cyanide (HCN) and acetylene (C 2 H 2 ) are ubiquitous atmospheric trace gases with medium life- time, which are frequently used as indicators of combustion sources and as tracers for atmospheric transport and chem- istry. Because of their weak infrared absorption, overlapped by the CO 2 Q branch near 720 cm -1 , nadir sounders have up to now failed to measure these gases routinely. Taking into account CO 2 line mixing, we provide for the first time exten- sive measurements of HCN and C 2 H 2 total columns at Re- union Island (21 ◦ S, 55 ◦ E) and Jungfraujoch (46 ◦ N, 8 ◦ E) in 2009–2010 using observations from the Infrared Atmo- spheric Sounding Interferometer (IASI). A first order com- parison with local ground-based Fourier transform infraRed (FTIR) measurements has been carried out allowing tests of seasonal consistency which is reasonably captured, except for HCN at Jungfraujoch. The IASI data shows a greater ten- dency to high C 2 H 2 values. We also examine a nonspecific biomass burning plume over austral Africa and show that the emission ratios with respect to CO agree with previously reported values. 1 Introduction Biomass burning is a considerable source of atmospheric trace gases and aerosols at a global scale (Crutzen and An- dreae, 1990). Examples include hydrogen cyanide (HCN) and acetylene (or ethyne, C 2 H 2 ). While the primary sources for HCN are attributed to biomass burning, other sources ex- ist, including emissions by fossil fuel combustion and higher plants, bacteria and fungi. The primary sink of HCN is thought to be ocean uptake (Cicerone and Zellner, 1983; Li et al., 2000). However, the magnitudes of these sources and sinks remain uncertain (Li et al., 2009). For C 2 H 2 , Xiao et al. (2007) evaluated biofuel combustion to be the dominant source, followed by fossil fuel combustion and biomass burn- ing. Reaction with hydroxyl radical (OH) is the main sink for C 2 H 2 , which may also act as a precursor of secondary organic aerosols (Volkamer et al., 2009). Aside from their chemical properties, HCN and C 2 H 2 are useful tracers of atmospheric transport. Indeed, with a life- time of 2–4 weeks (C 2 H 2 ) (Logan et al., 1981) to 2–4 months (HCN) (Li et al., 2000), they are effective indicators of how the large-scale distribution of atmospheric pollutants is in- fluenced by long-range transport of biomass and fossil fuel burning. Moreover, the study of the ratio C 2 H 2 /CO (car- bon monoxide) can also help estimate the age of combustion plumes (Xiao et al., 2007). There are only a limited number of long-term local mea- surements of HCN and C 2 H 2 , mainly from ground-based FTIR at selected stations of the Network for the Detec- tion of Atmospheric Composition Change (NDACC, http: //www.ndacc.org), even if C 2 H 2 is not a regular NDACC target species. Hence, strong uncertainties remain with re- gard to the magnitude of sources and sinks of HCN and C 2 H 2 , as well as to their spatial distribution and seasonality Published by Copernicus Publications on behalf of the European Geosciences Union.

Welcome message from author
This document is posted to help you gain knowledge. Please leave a comment to let me know what you think about it! Share it to your friends and learn new things together.
Transcript

Atmos. Meas. Tech., 6, 917–925, 2013www.atmos-meas-tech.net/6/917/2013/doi:10.5194/amt-6-917-2013© Author(s) 2013. CC Attribution 3.0 License.
EGU Journal Logos (RGB)
Advances in Geosciences
Open A
ccess
Natural Hazards and Earth System
Sciences
Open A
ccess
Annales Geophysicae
Open A
ccess
Nonlinear Processes in Geophysics
Open A
ccess
Atmospheric Chemistry
and Physics
Open A
ccess
Atmospheric Chemistry
and Physics
Open A
ccess
Discussions
Atmospheric Measurement
TechniquesO
pen Access
Atmospheric Measurement
Techniques
Open A
ccess
Discussions
Biogeosciences
Open A
ccess
Open A
ccess
BiogeosciencesDiscussions
Climate of the Past
Open A
ccess
Open A
ccess
Climate of the Past
Discussions
Earth System Dynamics
Open A
ccess
Open A
ccess
Earth System Dynamics
Discussions
GeoscientificInstrumentation
Methods andData Systems
Open A
ccess
GeoscientificInstrumentation
Methods andData Systems
Open A
ccess
Discussions
GeoscientificModel Development
Open A
ccess
Open A
ccess
GeoscientificModel Development
Discussions
Hydrology and Earth System
Sciences
Open A
ccess
Hydrology and Earth System
Sciences
Open A
ccess
Discussions
Ocean Science
Open A
ccess
Open A
ccess
Ocean ScienceDiscussions
Solid Earth
Open A
ccess
Open A
ccess
Solid EarthDiscussions
The Cryosphere
Open A
ccess
Open A
ccess
The CryosphereDiscussions
Natural Hazards and Earth System
Sciences
Open A
ccess
Discussions
Measurements of hydrogen cyanide (HCN) and acetylene (C2H2)from the Infrared Atmospheric Sounding Interferometer (IASI)
V. Duflot1, D. Hurtmans1, L. Clarisse1, Y. R’honi1, C. Vigouroux2, M. De Maziere2, E. Mahieu3, C. Servais3,C. Clerbaux1,4, and P.-F. Coheur1
1Spectroscopie de l’Atmosphere, Service de Chimie Quantique et Photophysique, Universite Libre de Bruxelles,50 Av. F. D. Roosevelt, 1050, Brussels, Belgium2Belgian Institute for Space Aeronomy (BIRA-IASB), 3, Av. Circulaire, 1180, Brussels, Belgium3Institut d’Astrophysique et de Geophysique, Universite de Liege, 17, Allee du 6 Aout, 4000, Liege, Belgium4Universite Paris 06, Universite Versailles-St. Quentin, CNRS/INSU, LATMOS-IPSL, Paris, France
Correspondence to:V. Duflot ([email protected])
Received: 5 October 2012 – Published in Atmos. Meas. Tech. Discuss.: 16 October 2012Revised: 19 March 2013 – Accepted: 20 March 2013 – Published: 9 April 2013
Abstract. Hydrogen cyanide (HCN) and acetylene (C2H2)are ubiquitous atmospheric trace gases with medium life-time, which are frequently used as indicators of combustionsources and as tracers for atmospheric transport and chem-istry. Because of their weak infrared absorption, overlappedby the CO2 Q branch near 720 cm−1, nadir sounders have upto now failed to measure these gases routinely. Taking intoaccount CO2 line mixing, we provide for the first time exten-sive measurements of HCN and C2H2 total columns at Re-union Island (21◦ S, 55◦ E) and Jungfraujoch (46◦ N, 8◦ E)in 2009–2010 using observations from the Infrared Atmo-spheric Sounding Interferometer (IASI). A first order com-parison with local ground-based Fourier transform infraRed(FTIR) measurements has been carried out allowing tests ofseasonal consistency which is reasonably captured, exceptfor HCN at Jungfraujoch. The IASI data shows a greater ten-dency to high C2H2 values. We also examine a nonspecificbiomass burning plume over austral Africa and show thatthe emission ratios with respect to CO agree with previouslyreported values.
1 Introduction
Biomass burning is a considerable source of atmospherictrace gases and aerosols at a global scale (Crutzen and An-dreae, 1990). Examples include hydrogen cyanide (HCN)and acetylene (or ethyne, C2H2). While the primary sources
for HCN are attributed to biomass burning, other sources ex-ist, including emissions by fossil fuel combustion and higherplants, bacteria and fungi. The primary sink of HCN isthought to be ocean uptake (Cicerone and Zellner, 1983; Liet al., 2000). However, the magnitudes of these sources andsinks remain uncertain (Li et al., 2009). For C2H2, Xiao etal. (2007) evaluated biofuel combustion to be the dominantsource, followed by fossil fuel combustion and biomass burn-ing. Reaction with hydroxyl radical (OH) is the main sinkfor C2H2, which may also act as a precursor of secondaryorganic aerosols (Volkamer et al., 2009).
Aside from their chemical properties, HCN and C2H2 areuseful tracers of atmospheric transport. Indeed, with a life-time of 2–4 weeks (C2H2) (Logan et al., 1981) to 2–4 months(HCN) (Li et al., 2000), they are effective indicators of howthe large-scale distribution of atmospheric pollutants is in-fluenced by long-range transport of biomass and fossil fuelburning. Moreover, the study of the ratio C2H2/CO (car-bon monoxide) can also help estimate the age of combustionplumes (Xiao et al., 2007).
There are only a limited number of long-term local mea-surements of HCN and C2H2, mainly from ground-basedFTIR at selected stations of the Network for the Detec-tion of Atmospheric Composition Change (NDACC,http://www.ndacc.org), even if C2H2 is not a regular NDACCtarget species. Hence, strong uncertainties remain with re-gard to the magnitude of sources and sinks of HCN andC2H2, as well as to their spatial distribution and seasonality
Published by Copernicus Publications on behalf of the European Geosciences Union.

918 V. Duflot et al.: Measurements of HCN and C2H2 from IASI
in the atmosphere (Li et al., 2009; Parker et al., 2011). Satel-lite sounders have provided considerable new informationin the past years, with measurements from the AtmosphericChemistry Experiment (ACE-FTS) (Lupu et al., 2009), theMichelson Interferometer for Passive Atmospheric Sound-ing (MIPAS) (Wiegele et al., 2012) and the Microwave LimbSounder (MLS) (Pumphrey et al., 2011). These measure-ments were all made in limb geometry and consequentlymostly in the upper troposphere or higher; also the spatialsampling from these instruments is limited. HCN and C2H2have recently been observed using the IASI infrared nadir-looking hyperspectral sounder in a specific biomass burningplume (Clarisse et al., 2011a), as well as in an anthropogenicpollution plume uplifted in the free troposphere (Clarisse etal., 2011b). The purpose of this paper is to show that HCNand C2H2 columns can indeed be routinely retrieved fromIASI spectra, even in absence of exceptional columns or up-lift mechanisms. Having a twice daily global coverage and a12 km diameter footprint at nadir, the IASI infrared sounder(Clerbaux et al., 2009) aboard the MetOp-A has an obviouspotential for providing measurements of these two speciesglobally, and with higher spatial resolution and temporalsampling than what has been obtained up to now. We de-scribe time series and analyze the seasonality of the columnsof these two species above two ground-based FTIR observa-tion sites. We also look into the retrieval performances in atypical biomass burning plume.
2 Retrievals
HCN and C2H2 are retrieved from IASI radiance spectrawith an optimal estimation method (Rodgers, 2000) imple-mented in the radiative transfer modelAtmosphit(Coheuret al., 2005), using absorption bands centered at 713 (ν2)
and 729 (ν5) cm−1, respectively. Both bands are close tooneQ branch of CO2 centered near 720 cm−1, affected byline mixing and hence hampering the retrievals of HCNand C2H2 when the CO2 bands cannot be properly simu-lated. For instance, Clarisse et al. (2011a) had to removethe 715–725 cm−1 spectral range from their fits for HCNand C2H2 as their forward model did not take into accountCO2 line mixing.
The line mixing effect is due to the increasing overlap ofQ lines with increasing pressure, which is such that the con-tributions of the various transitions are no more additive andthe spectrum cannot be simulated by simply summing up theindividual line profiles. This is explained theoretically by thefact that intermolecular collisions induce transfer of absorp-tion intensity among the internal levels defining the opticaltransitions, thus resulting in intensity exchanges between thevarious spectral components (Hartmann et al., 2008).
The CO2 line mixing effects are now taken into accountin Atmosphitup to 30 km for a wide range of atmospheres(i.e. for a wide range of pressure-temperature profiles up to
Fig. 1. (a) The red line shows the difference between the forwardmodels with and without CO2 line mixing considered. To makethem visible, contributions of HCN (green line) and C2H2 (blueline) are shown for background concentrations multiplied by 40.(b) Contribution of CO2 (black line), O3 (ochre line) and H2O (deepblue line) to a simulated spectrum for background concentrationsin a standard atmosphere. Calculations have been made for the USStandard Atmosphere (US Government Printing Office, 1976) withCO2 concentrations scaled to 390 ppmv.
30 km in order to cover all kind of atmospheres that can beencountered on earth) by calculating absorption cross sec-tions of CO2 following the method given in Gamache etal. (2012) and Lamouroux et al. (2012a, b). From 30 km tothe top of the atmosphere, where collisions are less frequent,the individual line parameters from the HITRAN spectro-scopic database (Rothman et al., 2009) are used. These arealso used for all the other species in the line-by-line radiativetransfer model.
Figure 1a (red line) shows the difference in the forwardmodel between a spectrum simulated with and without linemixing, along with the spectral signature of HCN (ν2) andC2H2(ν5) (green and blue lines, respectively). It is clearfrom the residual spectrum that the spectral fits of HCN andC2H2 (and thus the retrievals of their abundance) are stronglydependent on the accuracy in the simulation of the CO2Q
branch. For this study, line mixing is included throughout.The inversion parameters detailed hereafter have been cho-
sen to be the most general as possible. The purpose is to eval-uate the capability of the retrieval strategy to detect HCN andC2H2 routinely, without any specific assumptions on the ver-tical distribution of the target and interfering species. Theretrievals are performed over the 675 to 775 cm−1 spectralrange and CO2, H2O and O3 are fitted simultaneously as in-terfering species. Figure 1b shows the contributions of each
Atmos. Meas. Tech., 6, 917–925, 2013 www.atmos-meas-tech.net/6/917/2013/

V. Duflot et al.: Measurements of HCN and C2H2 from IASI 919
of these interfering species assuming background concentra-tions. For HCN and C2H2, we use an ad hoc covariance ma-trix with a 100 % variability and we assume the correlationfrom layer to layer being a 7 km-length exponential decay.These admittedly over simplistic assumptions allow stabiliz-ing the retrieval without too much influence from the a prioriinformation. The a priori profiles used for the forward modeland the retrievals withAtmosphitare from the US standardatmospheres when spectra are analyzed over temperate lat-itudes, and from the standard tropical modeled atmosphere(Anderson et al., 1986) when spectra are analyzed over sub-tropical latitudes. HCN and C2H2 are fitted as profiles, de-fined by 3 km thick layers from the ground up to 18 km, andby 7 km thick layers from 18 km up to 60 km. However, as thenumber of degrees of freedom for signal (DOFS) (Rodgers,2000) is not larger than one for the two species, we analyzein the following only total columns.
3 Comparison with ground based FTIR measurements
We compare in this section HCN and C2H2 total columns re-trieved from IASI spectra and from ground-based FTIR spec-tra for the years 2009 and 2010 for two selected NDACC ob-servation sites: Reunion Island (21◦ S, 55◦ E) and Jungfrau-joch (46◦ N, 8◦ E). Note that for both sites and both targetspecies ground-based retrievals are performed in a spectralrange between 3250 and 3332 cm−1, which is outside therange covered by IASI. There, the main interfering speciesis H2O and the CO2 line mixing effects are less critical andare not accounted for. Total errors for ground-based measure-ments at Reunion Island are 17 % for both species and to-tal errors for HCN and C2H2 ground-based measurementsat Jungfraujoch are 5 and 7 %, respectively. Detailed de-scription of ground-based FTIR data set, retrieval methodand error budget can be found in Vigouroux et al. (2012)for Reunion Island and in Mahieu et al. (2008) and Li etal. (2009) for Jungfraujoch. Abundances retrieved from IASIspectra are calculated as columns above the altitude of thestations: 50 m and 3580 m a.m.s.l. (above mean sea level) forReunion Island and Jungfraujoch, respectively. IASI cloudyspectra were removed from the data set using a 10 % con-tamination threshold on the cloud fraction in the pixel, anda posterior filter was also applied to remove poor fits, cor-responding to a residual root mean square (RMS) greaterthan 4×10⁻⁶ Wm−2 msr−1. In all, 31 % of the total clearsky spectra fits were removed because of a high RMS fiterror. The resulting mean total retrieval errors on the totalcolumns for HCN and C2H2 are 53 and 47 % at ReunionIsland, and 92 and 77 % at Jungfraujoch. The random (in-cluding smoothing) and systematic errors were taken into ac-count. The smoothing error was found to be the most signifi-cant for HCN at Reunion Island and for C2H2 at Jungfrau-joch (32 and 54 %, respectively), and the systematic error
Fig. 2. (a) Residual averaged over the whole set of fits (red line)with its standard deviation (gray lines).(b) Difference (red line) be-tween an observed spectrum on 10 October 2010 at 22.35◦ S and33.63◦ E and the corresponding fitted spectrum when HCN andC2H2 have been excluded from the fit. The green and blue linesshow the contributions at the top of the atmosphere of HCN andC2H2, respectively.
was found to be the major one for C2H2 at Reunion Islandand for HCN at Jungfraujoch (42 and 75 %, respectively).
Figure 2a shows the residual averaged over the whole setof fits with its standard deviation. One can see that there isno noticeable residual bias except at∼720 cm−1 where itreaches−0.3 K, which is close in absolute value to the in-strumental noise of 0.2 K in this spectral region (Clerbaux etal., 2009).
Figure 3 shows the mean total column averaging kernelsfor IASI and for the ground-based FTIR at each of thesesites, as well as the a priori profiles used in the retrievals(Fig. 3d). We find that the retrieved profiles from IASI spec-tra are mostly sensitive to the target species abundance inthe mid-upper troposphere, with total column averaging ker-nels peaking at∼9 km for C2H2 for both sites, at∼10 kmfor HCN at Jungfraujoch and at∼14 km for HCN at Re-union Island. We also find that the retrieved profiles fromIASI spectra are more sensitive to HCN abundance at Re-union Island than at Jungfraujoch, while the sensitivity toC2H2 abundance is quite similar at both sites. Note that bothground-based instruments have a good sensitivity to HCN
www.atmos-meas-tech.net/6/917/2013/ Atmos. Meas. Tech., 6, 917–925, 2013

920 V. Duflot et al.: Measurements of HCN and C2H2 from IASI
Fig. 3. (a)Total column averaging kernels of IASI and(b) ground-based FTIR in molecules cm−2 for C2H2 at Jungfraujoch (blue squaresand lines), HCN at Jungfraujoch (green circles and lines), C2H2 at Reunion and HCN at Reunion (black dots and lines).(c) Detectableconcentrations by IASI as function of altitude for C2H2 in a temperate atmosphere (blue squares and line), C2H2 in a tropical atmosphere(red crosses and lines), HCN in a temperate atmosphere (green circles and lines) and HCN in a tropical atmosphere (black dots and line).(d) A priori profiles used in the retrievals for Reunion Island (blue lines), Jungfraujoch (black lines) and IASI (red lines) for HCN (solidlines) and C2H2 (dotted lines).
abundance in the stratosphere, while IASI total column aver-aging kernels decrease rapidly to zero above the tropopause.
To further analyze the sensitivity of IASI to the targetspecies, we simulated spectra with various HCN and C2H2concentrations for the standard temperate and tropical mod-eled atmospheres with CO2 concentration scaled to a volumemixing ratio (vmr) of 390 ppmv. For this sensitivity analy-sis, HCN and C2H2 profiles have been constructed, with en-hanced concentrations of the species located in a 1 km thicklayer, whose altitude is varied from the ground up to 18 km(mean maximal tropical tropopause height). The simulatedspectra were compared one by one to a standard spectrum(i.e. with background concentrations of the trace gases) andif the difference between the two spectra was higher than theinstrumental spectral noise in this region (0.2 K), then theenhanced concentration was tagged as detectable. Figure 3csummarizes the results. We find that IASI is able to detect
HCN (C2H2) concentrations lower than 20×1015 mol cm−2
above 4 km (3 km) for a tropical atmosphere, and above5 km (4 km) for a temperate atmosphere. For the tropicalatmosphere, the maximum sensitivity is reached for HCN(C2H2) at 15 km (11 km) with a detectable concentration of1.4×1015 (0.25×10¹⁵) mol cm−2, while for the temperateatmosphere, the maximum sensitivity is reached for HCN(C2H2) at 11 km (13 km) with a detectable concentration of2.8×1015 (0.4×10¹⁵) mol cm−2.
Figure 4 shows the comparison between the IASI and theground-based measurements. IASI retrieved total columnswere averaged on a daily basis and on a 1◦
×1◦ area aroundthe observation sites. The comparison of the space andground-based retrievals was performed taking into accountthe differences in the a priori profiles and in the sensitivityof the instruments. This has been done following the methodgiven in Rodgers and Connor (2003): the retrieval sets have
Atmos. Meas. Tech., 6, 917–925, 2013 www.atmos-meas-tech.net/6/917/2013/
V. Duflot et al.: Measurements of HCN and C2H2 from IASI 921
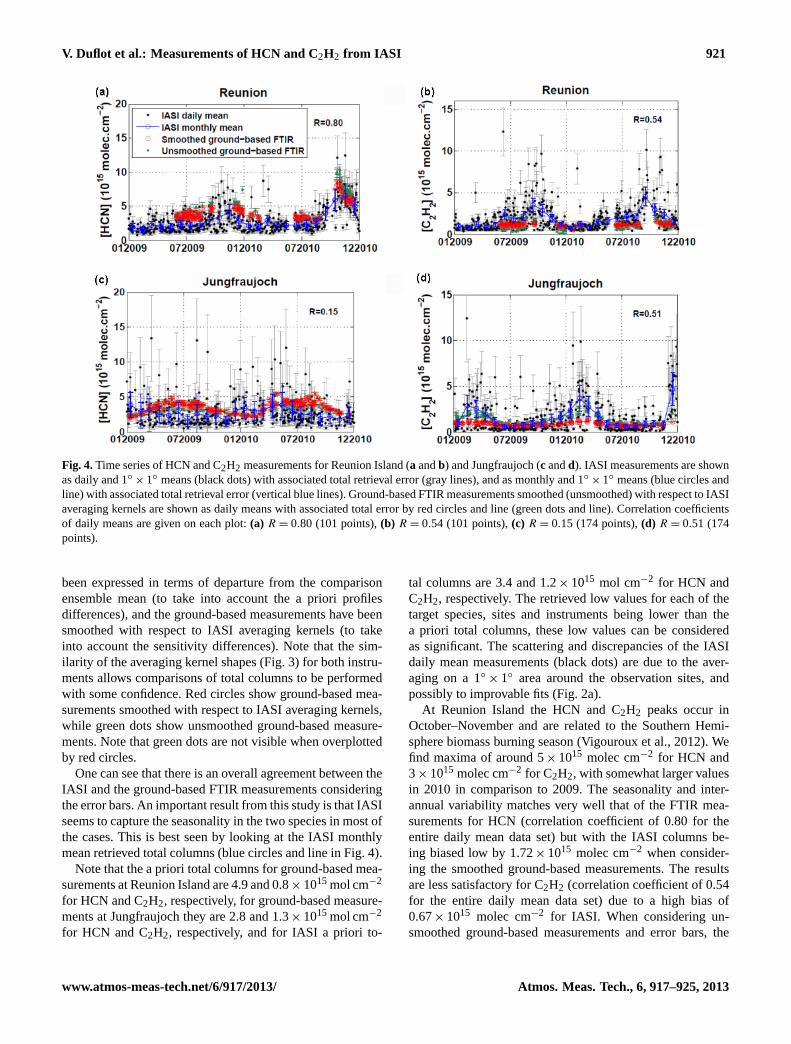
Fig. 4.Time series of HCN and C2H2 measurements for Reunion Island (a andb) and Jungfraujoch (c andd). IASI measurements are shownas daily and 1◦×1◦ means (black dots) with associated total retrieval error (gray lines), and as monthly and 1◦
×1◦ means (blue circles andline) with associated total retrieval error (vertical blue lines). Ground-based FTIR measurements smoothed (unsmoothed) with respect to IASIaveraging kernels are shown as daily means with associated total error by red circles and line (green dots and line). Correlation coefficientsof daily means are given on each plot:(a) R = 0.80 (101 points),(b) R = 0.54 (101 points),(c) R = 0.15 (174 points),(d) R = 0.51 (174points).
been expressed in terms of departure from the comparisonensemble mean (to take into account the a priori profilesdifferences), and the ground-based measurements have beensmoothed with respect to IASI averaging kernels (to takeinto account the sensitivity differences). Note that the sim-ilarity of the averaging kernel shapes (Fig. 3) for both instru-ments allows comparisons of total columns to be performedwith some confidence. Red circles show ground-based mea-surements smoothed with respect to IASI averaging kernels,while green dots show unsmoothed ground-based measure-ments. Note that green dots are not visible when overplottedby red circles.
One can see that there is an overall agreement between theIASI and the ground-based FTIR measurements consideringthe error bars. An important result from this study is that IASIseems to capture the seasonality in the two species in most ofthe cases. This is best seen by looking at the IASI monthlymean retrieved total columns (blue circles and line in Fig. 4).
Note that the a priori total columns for ground-based mea-surements at Reunion Island are 4.9 and 0.8×10¹⁵ mol cm−2
for HCN and C2H2, respectively, for ground-based measure-ments at Jungfraujoch they are 2.8 and 1.3×10¹⁵ mol cm−2
for HCN and C2H2, respectively, and for IASI a priori to-
tal columns are 3.4 and 1.2×10¹⁵ mol cm−2 for HCN andC2H2, respectively. The retrieved low values for each of thetarget species, sites and instruments being lower than thea priori total columns, these low values can be consideredas significant. The scattering and discrepancies of the IASIdaily mean measurements (black dots) are due to the aver-aging on a 1◦×1◦ area around the observation sites, andpossibly to improvable fits (Fig. 2a).
At Reunion Island the HCN and C2H2 peaks occur inOctober–November and are related to the Southern Hemi-sphere biomass burning season (Vigouroux et al., 2012). Wefind maxima of around 5×10¹⁵ molec cm−2 for HCN and3×1015 molec cm−2 for C2H2, with somewhat larger valuesin 2010 in comparison to 2009. The seasonality and inter-annual variability matches very well that of the FTIR mea-surements for HCN (correlation coefficient of 0.80 for theentire daily mean data set) but with the IASI columns be-ing biased low by 1.72×10¹⁵ molec cm−2 when consider-ing the smoothed ground-based measurements. The resultsare less satisfactory for C2H2 (correlation coefficient of 0.54for the entire daily mean data set) due to a high bias of0.67×1015 molec cm−2 for IASI. When considering un-smoothed ground-based measurements and error bars, the
www.atmos-meas-tech.net/6/917/2013/ Atmos. Meas. Tech., 6, 917–925, 2013

922 V. Duflot et al.: Measurements of HCN and C2H2 from IASI
magnitudes of the annual cycles for C2H2 at Reunion Islandcaptured by IASI and by ground-based FTIR are quite sim-ilar, except for two simultaneous measurements in Septem-ber 2009. However, there is a lack of ground-based measure-ments during the biomass burning seasons (especially in Oc-tober) to check the accordance between the IASI and ground-based measured amplitudes. Ground-based measurementsperformed in October 2004 and 2007 at Reunion Island showC2H2 total columns values up to∼4.5×10¹⁵ molec cm−2
(Fig. 4 in Vigouroux et al., 2012), which agree with the IASImonthly mean measured columns in October 2009 and 2010.This gives some confidence in the monthly mean peak valuesobserved by IASI. Comparison of additional simultaneousmeasurements during the biomass burning season is neededto further analyze this.
For the Jungfraujoch site, the agreement between IASIand the FTIR retrieved columns is acceptable for C2H2(R = 0.51) and the seasonality is similar. The larger columnscaused by the increased C2H2 lifetime in winter (Zander etal., 1991) are indeed retrieved in February by both instru-ments. Similarly to the measurements at Reunion Island, wenote an apparent tendency of the ground-based FTIR towardslower columns of C2H2 than IASI in the season of peak val-ues: we find a maximum of about 3×10¹⁵ molec cm−2 forthe IASI monthly mean and the unsmoothed ground-basedmeasurements, and of about 1.8×10¹⁵ molec cm−2 for thesmoothed ground-based measurements. The most importantdisagreement is found for HCN at the Jungfraujoch site. Thecorrelation coefficient is only 0.15 and the seasonality ob-served from the ground, showing higher values from springto autumn due to northern African and boreal Asian biomassburning activity (Li et al., 2009), is not captured by IASI,which in fact does not seem to show any clear seasonal vari-ation. This is likely to be due to the fact that in a temper-ate mid-latitude atmosphere, the IASI sensitivity to tropo-spheric HCN is lower than in a tropical atmosphere as shownin Fig. 3a and c. Moreover, stratospheric variations in HCNabundance, which are likely seen in the FTIR time series(Fig. 3b), are not captured by IASI.
To figure out the precision gained when including the CO2line mixing effects in the retrievals, we performed a set ofretrievals without CO2 line mixing on 500 randomly cho-sen spectra measured above the two sites. We found that in-cluding CO2 line mixing effects in the retrievals decreasesthe residual of a factor three and increases the percentage ofconverging retrievals from 52 to 86 %. Moreover, note thatif CO2 line mixing effects are not considered in the IASIretrievals, retrieved total columns from IASI spectra do notagree any more with ground-based measurements: for bothsites and both target species, IASI measurements becomearound one order of magnitude higher than the ground-basedones. This shows the importance of taking into account CO2line mixing effects in the forward and inverse models ofthe retrieval method when using absorption bands close to720 cm−1.
4 Case study: an austral African biomass burningplume
To further illustrate what can be achieved with the measure-ments of HCN and C2H2 total columns from IASI spectra,this section expounds the study of Clarisse et al. (2011a) foran exceptional fire event, to a regular biomass burning plume.We choose an event that took place over austral Africa andsouthern Mozambique Channel on 10 October 2010, whichconstitutes a typical biomass burning plume within the so-called “River of smoke” yearly exiting southern Africa to-ward the southern Indian Ocean during the Southern Hemi-sphere biomass burning season (Annegarn et al., 2002; Du-flot et al., 2010). To test the validity of the retrieval methodfor the widest range of situations, the retrievals were per-formed as exposed in Sect. 2, without any assumption on thealtitude of the plume.
Figure 2b shows in red the difference between an observedspectrum on 10 October AM at 22.35◦ S and 33.63◦ E andthe corresponding fitted spectrum with HCN and C2H2 ex-cluded. A number of absorption features (most notably at713 and 729 cm−1) exceed the instrumental noise and canbe attributed to HCN and C2H2 when compared to the top ofthe atmosphere contribution of these species (shown in greenand blue for HCN and C2H2, respectively). In fact, the max-imum radiance difference reaches 1.5 K for HCN and C2H2,which is an order of magnitude larger than the instrumentalnoise of 0.2 K in this region (Clerbaux et al., 2009).
Figure 5 shows the total columns (in molecules cm−2) ofCO (retrieved in near-real-time from FORLI software (Hurt-mans et al., 2012)), HCN and C2H2, respectively, on 10 Oc-tober. Note that to produce the distributions, the cloudy spec-tra were removed from the data set and retrievals with er-rors greater than 100 % were also excluded. The resultingmean total retrieval errors for HCN and C2H2 total columnsare 26 and 68 %. We see in Fig. 5 that the plume is sim-ilar in shape for the 3 species and extends from∼ (15◦ S,20◦ E) to ∼ (35◦ S, 45◦ E). The biomass burning spots de-tected by the Moderate Resolution Imaging Spectroradiome-ter (MODIS) in Zambia, Mozambique, Zimbabwe, Botswanaand South Africa on 9 and 10 October are shown by blackdots in these figures. Due to the closeness of the fires andthe typical seasonality of such an event, the detected plumeoriginates very likely from those fires. Maximum columns inthe plume reach 5.9×10¹⁸ for CO, 4.8×10¹⁶ for HCN and3.2×1016 molecules cm−2 for C2H2.
Figure 6 shows the correlation plot between CO and HCN(black dots) and C2H2 (green circles) total columns. The cor-relation coefficients are 0.72 and 0.68 for HCN and C2H2,respectively, for a total of 1397 retrieval points. This highcorrelation between the three species, which share biomassburning as an important source, confirms the fire origin ofthe plume. Given the relatively long lifetimes of the species(several weeks to several months) and the vicinity of thefire sources, the slope of each correlation line gives the
Atmos. Meas. Tech., 6, 917–925, 2013 www.atmos-meas-tech.net/6/917/2013/

V. Duflot et al.: Measurements of HCN and C2H2 from IASI 923
Fig. 5. Total columns of CO(a), HCN (b) and C2H2 (c) on 10 Oc-tober 2010. Fires spots detected by MODIS on 9 and 10 October areshown by the black dots.
emission ratio of the corresponding species: 0.0092±0.0016and 0.0055±0.0034 for HCN and C2H2, respectively. Thesevalues compare very well with the emission ratios withrespect to CO derived by Sinha et al. (2003) from air-craft measurements over savanna fires in Southern Africa(0.0085±0.0029 for HCN and 0.0043±0.0013 for C2H2).
29
510
Figure 6 511 Fig. 6.Correlation plot between CO total columns and HCN (blackdots) and C2H2 (green circles) total columns for the day and regionshown on Fig. 5. The correlation coefficients are 0.72 (1397 points)and 0.68 (1397 points) for HCN and C2H2, respectively.
5 Conclusion and outlooks
We have demonstrated the possibility of retrieving HCN andC2H2 columns from IASI radiance spectra in the 720 cm−1
region, by properly incorporating CO2 line mixing in the ra-diative transfer model. This study shows that the sensitiv-ity of IASI to the two species is mostly in the mid-uppertroposphere above 6 km. Total columns have been retrievedfor a two year period above Reunion Island and Jungfrau-joch, where routine FTIR measurements are available. Thecomparison between IASI and FTIR retrieved total columnsdemonstrates the capabilities of IASI to capture the season-ality in HCN and C2H2 in most cases (HCN and to lesserextent C2H2 at Reunion Island; and C2H2 at Jungfraujoch).We also note a greater tendency of IASI data to high C2H2values. The absence of seasonality of HCN at Jungfraujochcould be rationalized by the low sensitivity of IASI to HCNabundance at mid-latitudes. The IASI total columns of HCN(C2H2) are shown in this preliminary comparison to be bi-ased low (high) as compared to the smoothed ground-basedmeasurements. A more complete validation study should becarried out to confirm this.
In addition, HCN and C2H2 total columns were re-trieved within a biomass burning plume over austral Africaand emission ratios with respect to CO were derived fromthese measurements. The values of 0.0092±0.0016 and0.0055±0.0034 for HCN and C2H2, respectively, agree withvalues reported in the literature for biomass burning plumesabove austral Africa.
In summary, the results presented in this paper have shownfor the first time that IASI spectra can be used to estab-lish time series and trends of HCN columns at tropical lat-itudes and C2H2 columns at tropical and temperate latitudes,and both for background or highly concentrated (biomass
www.atmos-meas-tech.net/6/917/2013/ Atmos. Meas. Tech., 6, 917–925, 2013
924 V. Duflot et al.: Measurements of HCN and C2H2 from IASI
burning plume) environments. Due to a low sensitivity ofIASI to HCN in a temperate atmosphere, this target speciecannot be considered as retrievable over mid-latitudes areasin background conditions. Work is ongoing to fully exploitthe IASI spatial resolution and temporal sampling, to pro-vide global distributions of these two species wherever itssensitivity to background conditions is sufficient.
Acknowledgements.IASI has been developed and built under theresponsibility of the Centre National d’Etudes Spatiales (CNES,France). It is flown onboard the Met-Op satellites as part of theEUMETSAT Polar System. The IASI L1 data are received throughthe EUMETCast near real time data distribution service. Part ofthe research is supported by EUMETSAT through the O3SAFproject. P. F. C. and L. C. are, respectively, Scientific ResearchWorker and Research Associate at the F.R.S.-FNRS. The researchin Belgium was funded by the F.R.S.-FNRS, the Belgian StateFederal Office for Scientific, Technical and Cultural Affairs and theEuropean Space Agency (ESA Prodex arrangements C4000103226and the AGACC-II project). Financial support by the “Actionsde Recherche Concertees” (Communaute Francaise de Belgique)is also acknowledged. The Liege team further acknowledgesthe Federation Wallonie-Bruxelles for supporting travel costs tothe Jungfraujoch station and wishes to thank the InternationalFoundation High Altitude Research Stations Jungfraujoch andGornergrat (HFSJG, Bern) for supporting the facilities needed toperform the observations.
Edited by: H. Worden
References
Anderson, G. P., Clough, S. A., Kneizys, F. X., Chetwynd, J. H.,and Shettle, E. P.: AFGL Atmospheric Constituent Profiles (0–120 km), Environmental Research Papers no. 954, Air ForceGeophysics Laboratory, Hanscom AFB Massachusetts, AFGL-TR-86-0110, 1986.
Annegarn, H. J., Otter, L., Swap, R. J., and Scholes, R. J.: SouthernAfrica’s ecosystem in a test-tube: A perspective on the SouthernAfrican Regional Science Initiative (SAFARI 2000), S. Afr. J.Sci., 98, 111–113, 2002.
Cicerone, R. J. and Zellner, R.: The atmospheric chemistry of hy-drogen cyanide (HCN), J. Geophys. Res., 88, 10689–10696,1983.
Clarisse, L., R’Honi, Y., Coheur, P.-F., Hurtmans, D., and Clerbaux,C.: Thermal infrared nadir observations of 24 atmospheric gases,Geophys. Res. Lett., 38, L10802,doi:10.1029/2011GL047271,2011a.
Clarisse, L., Fromm, M., Ngadi, Y., Emmons, L., Clerbaux, C.,Hurtmans, D., and Coheur, P.-F.: Intercontinental transport ofanthropogenic sulfur dioxide and other pollutants: An infraredremote sensing case study, Geophys. Res. Lett., 38, L19806,doi:10.1029/2011GL048976, 2011b.
Clerbaux, C., Boynard, A., Clarisse, L., George, M., Hadji-Lazaro,J., Herbin, H., Hurtmans, D., Pommier, M., Razavi, A., Turquety,S., Wespes, C., and Coheur, P.-F.: Monitoring of atmosphericcomposition using the thermal infrared IASI/MetOp sounder, At-
mos. Chem. Phys., 9, 6041–6054,doi:10.5194/acp-9-6041-2009,2009.
Coheur, P.-F., Barret, B., Turquety, S., Hurtmans, D., Hadji-Lazaro,J., and Clerbaux, C.: Retrieval and characterization of ozone ver-tical profiles from a thermal infrared nadir sounder, J. Geophys.Res., 110, D24303,doi:10.1029/2005JD005845, 2005.
Crutzen, P. J. and Andreae, M. O.: Biomass burning in the trop-ics: Impact on atmospheric chemistry and biogeochemical cy-cles, Science, 250, 1669–1678, 1990.
Duflot, V., Dils, B., Baray, J.-L., De Maziere, M., Atti, J.-L., Van-haelewyn, G., Senten, C., Vigouroux, C., Clain, G., and Delmas,R.: Analysis of the origin of the distribution of CO in the sub-tropical southern Indian Ocean in 2007, J. Geophys. Res., 115,D22106,doi:10.1029/2010JD013994, 2010.
Gamache, R. R., Lamouroux, J., Laraia, A. L., Hartmann, J.-M.,and Boulet, C.: Semiclassical calculations of half-widths and lineshifts for transitions in the 30012←00001 and 30013←00001bands of CO2, I: Collisions with N2, J. Quant. Spectrosc. Ra.,113, 976–990, 2012.
Hartmann, J.-M., Boulet, C., and Robert, D.: Collisional Effects onMolecular Spectra, Laboratory Experiments and Models, Con-sequences for Applications, Elsevier Edition, ISBN: 978-0-444-52017-3, 2008.
Hurtmans, D., Coheur, P.-F., Wespes, C., Clarisse, L., Scharf, O.,Clerbaux, C., Hadji-Lazaro, J., George, M., and Turquety, S.:FORLI radiative transfer and retrieval code for IASI, J. Quant.Spectrosc. Ra., 113, 1391–1408, 2012.
Lamouroux, J., Gamache, R. R., Laraia, A. L., Hartmann, J.-M.,and Boulet, C.: Semiclassical calculations of half-widths and lineshifts for transitions in the 30012←00001 and 30013←00001bands of CO2 II: Collisions with O2 and air, J. Quant. Spectrosc.Ra., 113, 991–1003, 2012a.
Lamouroux, J., Gamache, R. R., Laraia, A. L., Hartmann, J.-M.,and Boulet, C.: Semiclassical calculations of half-widths and lineshifts for transitions in the 30012←00001 and 30013←00001bands of CO2. III: Self collisions, J. Quant. Spectrosc. Ra., 113,1536–1546, 2012b.
Li, Q., Jacob, D., Bey, I., Yantosca, R., Zhao, Y., Kondo, Y., andNotholt, J.: Atmospheric hydrogen cyanide (HCN): Biomassburning source, ocean sink?, Geophys. Res. Lett., 27, 357–360,2000.
Li, Q., Palmer, P. I., Pumphrey, H. C., Bernath, P., and Mahieu,E.: What drives the observed variability of HCN in the tropo-sphere and lower stratosphere?, Atmos. Chem. Phys., 9, 8531–8543,doi:10.5194/acp-9-8531-2009, 2009.
Logan, J. A., Prather, M. J., Wofsy, S. C., and McElroy, M. B.: Tro-pospheric chemistry: A global perspective, J. Geophys. Res., 86,7210–7254, 1981.
Lupu, A., Kaminski, J. W., Neary, L., McConnell, J. C., Toyota, K.,Rinsland, C. P., Bernath, P. F., Walker, K. A., Boone, C. D., Naga-hama, Y., and Suzuki, K.: Hydrogen cyanide in the upper tropo-sphere: GEM-AQ simulation and comparison with ACE-FTS ob-servations, Atmos. Chem. Phys., 9, 4301–4313,doi:10.5194/acp-9-4301-2009, 2009.
Mahieu, E., Duchatelet, P., Bernath, P. F., Boone, C. D., De Maziere,M., Demoulin, P., Rinsland, C. P., Servais, C., and Walker, K.A.: Retrievals of C2H2 from high-resolution FTIR solar spec-tra recorded at the Jungfraujoch station (46.5◦ N) and compar-ison with ACE-FTS observations, Geophys. Res. Abstract, 10,
Atmos. Meas. Tech., 6, 917–925, 2013 www.atmos-meas-tech.net/6/917/2013/
V. Duflot et al.: Measurements of HCN and C2H2 from IASI 925
EGU2008-A-00000, 2008.Parker, R. J., Remedios, J. J., Moore, D. P., and Kanawade, V.
P.: Acetylene C2H2 retrievals from MIPAS data and regionsof enhanced upper tropospheric concentrations in August 2003,Atmos. Chem. Phys., 11, 10243–10257,doi:10.5194/acp-11-10243-2011, 2011.
Pumphrey, H. C., Santee, M. L., Livesey, N. J., Schwartz, M. J., andRead, W. G.: Microwave Limb Sounder observations of biomass-burning products from the Australian bush fires of February2009, Atmos. Chem. Phys., 11, 6285–6296,doi:10.5194/acp-11-6285-2011, 2011.
Rodgers, C. D.: Inverse methods for atmospheric sounding: The-ory and Practice, Series on Atmospheric, Oceanic and PlanetaryPhysics – Vol. 2, World Scientific Publishing CO., Singapore,2000.
Rodgers, C. D. and Connor, B. J.: Intercomparison of re-mote sounding instruments, J. Geophys. Res., 108, 4116,doi:10.1029/2002JD002299, 2003.
Rothman, L. S., Gordon, I. E., Barbe, A., Chris Benner, D.,Bernath, P. F., Birk, M., Boudon, V., Brown, L. R., Campar-gue, A., Champion, J.-P., Chance, K., Coudert, L. H., Dana,V., Devi, V. M., Fally, S., Flaud, J.-M., Gamache, R. R., Gold-man, A., Jacquemart, D., Kleiner, I., Lacome, N., Lafferty, W.J., Mandin, J.-Y., Massie, S. T., Mikhailenko, S. N., Miller, C.E., Moazzen-Ahmadi, N., Naumenko, O. V., Nikitin, A. V., Or-phal, J., Perevalov, V. I., Perrin, A., Predoi-Cross, A., Rinsland,C. P., Rotger, M., Simeckova, M., Smith, M. A. H., Sung, K.,Tashkun, S. A., Tennyson, J., Toth, R. A., Vandaele, A. C., andVander Auwera, J.: The HITRAN 2008 molecular spectroscopicdatabase, J. Quant. Spectrosc. Ra., 110, 533–572, 2009.
Sinha, P., Hobbs, P. V., Yokelson, R. J., Bertschi, I. T., Blake,D. R., Simpson, I. J., Gao, S., Kirchstetter, T. W., and No-vakov, T.: Emissions of trace gases and particles from sa-vanna fires in southern Africa, J. Geophys. Res., 108, 8487,doi:10.1029/2002JD002325, 2003.
Standard Atmosphere 1976, National Atmospheric and OceanicAdministration S/T 76-1562, US Government Printing Office,Washington D.C., 1976.
Vigouroux, C., Stavrakou, T., Whaley, C., Dils, B., Duflot, V., Her-mans, C., Kumps, N., Metzger, J.-M., Scolas, F., Vanhaelewyn,G., Muller, J.-F., Jones, D. B. A., Li, Q., and De Maziere, M.:FTIR time-series of biomass burning products (HCN, C2H6,C2H2, CH3OH, and HCOOH) at Reunion Island (21◦ S, 55◦
E) and comparisons with model data, Atmos. Chem. Phys., 12,10367–10385,doi:10.5194/acp-12-10367-2012, 2012.
Volkamer, R., Ziemann, P. J., and Molina, M. J.: Secondary Or-ganic Aerosol Formation from Acetylene (C2H2), seed effect onSOA yields due to organic photochemistry in the aerosol aque-ous phase, Atmos. Chem. Phys., 9, 1907–1928,doi:10.5194/acp-9-1907-2009, 2009.
Wiegele, A., Glatthor, N., Hopfner, M., Grabowski, U., Kellmann,S., Linden, A., Stiller, G., and von Clarmann, T.: Global distri-butions of C2H6, C2H2, HCN, and PAN retrieved from MIPASreduced spectral resolution measurements, Atmos. Meas. Tech.,5, 723–734,doi:10.5194/amt-5-723-2012, 2012.
Xiao, Y., Jacob, D. J., and Turquety, S.: Atmospheric acetylene andits relationship with CO as an indicator of air mass age, J. Geo-phys. Res.-Atmos., 112, D12305,doi:10.1029/2006JD008268,2007.
Zander, R., Rinsland, C. P., Ehhalt, D. H., Rudolph, J., and De-moulin, P. H.: Vertical column abundance and seasonal cycle ofacetylene, C2H2, above the Jungfraujoch station, derived fromIR solar observations (1991), J. Atmos. Chem., 13, 389–372,1991.
www.atmos-meas-tech.net/6/917/2013/ Atmos. Meas. Tech., 6, 917–925, 2013
Related Documents


