Measurements and Distributions of Plankton Biomass Matthew Church OCN 621 Spring 2010

Welcome message from author
This document is posted to help you gain knowledge. Please leave a comment to let me know what you think about it! Share it to your friends and learn new things together.
Transcript

Measurements and Distributions of Plankton Biomass
Matthew ChurchOCN 621
Spring 2010

Food web structure is a key determinant on carbon fluxes:
1) Cell size and geometry influence sinking rate
2) Zooplankton repackage material and vertically migrate
3) Small cells support longer food webs = more carbon recycled to CO2

Sedimentation of diatom‐rich salp fecal pellets > 1 mm long, 350 µm wide, 10 µg C per pellet‐‐‐these things sink
FAST...
Zooplankton repackage plankton into rapidly sinking
fecal material

Direct aggregation and pulsed export is also important
Flux of labile phytodetritus to the deep North
Atlantic

Important things to know about ocean ecosystems
• Population size and biomass (biogenic carbon): provides information on energy available to support the food web
• Growth, production, metabolism:turnover of material through the food web and insight into physiology.
• Controls on growth and population size


In every liter of seawater there are all the organisms for a complete, functional ecosystem.
These organisms form the fabric of life in the sea -the other organisms are embroidery on this fabric.
“Microsystems”

In a “typical” liter of seawater…• Fish None• Zooplankton 10• Diatoms 1,000• Dinoflagellates 10,000• Nanoflagellates 1,000,000• Cyanobacteria 100,000,000• Prokaryotes 1,000,000,000• Viruses 10,000,000,000

Size (µm)
0.01 0.1 1 10 100 1000
Abud
ance
(num
ber p
er li
ter)
10-210-110010110210310410510610710810910101011
Viruses
BacteriaCyanobacteria
Protists
Phytoplankton
Zooplankton
High abundance does not necessarily equate to high
biomass. Size is important.
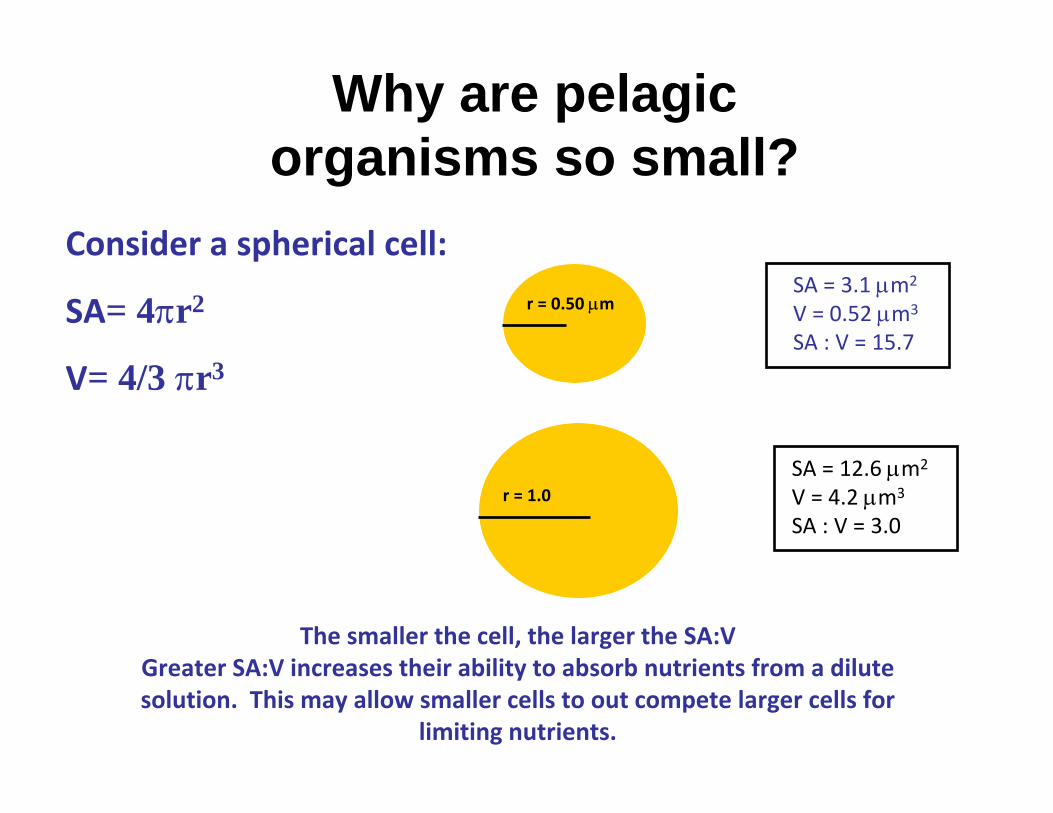
Why are pelagic organisms so small?
Consider a spherical cell:
SA= 4πr2
V= 4/3 πr3
r = 0.50 µm
r = 1.0
SA = 3.1 µm2
V = 0.52 µm3
SA : V = 15.7
SA = 12.6 µm2
V = 4.2 µm3
SA : V = 3.0
The smaller the cell, the larger the SA:VGreater SA:V increases their ability to absorb nutrients from a dilute solution. This may allow smaller cells to out compete larger cells for
limiting nutrients.

• “Typical” concentrations of inorganic nutrients in the open sea:– Subtropical North Pacific:
• Nitrate+nitrite 1-10 nM (0.001-0.01 µM)• Phosphate 10-40 nM (0.01-0.04 µM)
• “Typical” concentrations of inorganic nutrients in soils:
• Nitrate+Nitrite 5-100 µM• Phosphate 5-30 µM

Why do we care about biomass?
• Information on biologically stored energy• Quantify the amount of carbon held in
marine biota (carbon budgeting purposes)• Identify how much “material” is available to
at each step of the food chain.

Primary producers
Primary consumers (herbivores)
Secondary consumers (carnivores)
Tertiary consumers
The way biomass is distributed among trophic levels in the food web provides clues to the efficiency of energy transfer through the ecosystem .
Note: this is a static depiction-it does not provide information on how fast biomass turns over within each trophic level.
Biomass(mg C L-1)

Element % dry Substrate Source Cellular Components
C 55 DOC, CO2 Main constituent of cellular material
O 20 O2, DOM, CO2
Constituent of cell material and cell water; O2 primary electron acceptor
in aerobic respiration
N 10 NH3, NO3-, NO2
-, DON, N2
Constituent of amino acids, nucleic acids, nucleotides, and coenzymes
H 8 DOM, H2Main constituent of organic compounds
and cell water
P 3 PO43-, DOP Constituent of nucleic acids,
nucleotides, phospholipids, LPS
S 1 SO4, H2S, HS, DOM Constituent of cysteine, methionine, glutathione, several coenzymes
K 1 Potassium salts Main cellular inorganic cation and cofactor for certain enzymes
Mg 0.5 Magnesium salts Inorganic cellular cation, cofactor for certain enzymatic reactions
Ca 0.5 Calcium salts Inorganic cellular cation, cofactor for certain enzymes
Fe 0.002 Iron salts,DOM
Component of cytochromes and Fe-proteins; cofactor for many
enzymes
The elemental composition of a typical bacterium

The Struggle for Composition
•Plankton are relatively enriched in P, N, C, Fe compared
to the surface seawater.
•Energy must be expended to acquire
and maintain intracellular
concentrations of these elements.
% cell composition 10-3 10-2 10-1 100 101 102
% s
urfa
ce o
cean
10-1110-1010-910-810-710-610-510-410-310-210-1100101102
C
NP
SKMgCa
Fe
How do we measure plankton biomass?
• Count and measure individuals and calculate carbon
• Weigh (either dry or wet) cells and calculate biomass
• Estimate living carbon using some biomolecule proxy (DNA, ATP, chlorophyll)

Particulate carbon
• Technique: combust (oxidize) organic material and measure resulting CO2.
• Need to concentrate cells: typically glass filters (usually ~0.7 µm pore size) or tangential flow (Fukuda et al. 1998)
• Measurements include living cells and detritus.

Zooplankton• Small zooplankton
are usually enumerated by microscopy and converted to cell carbon
• Larger zooplankton can be weighed for approximation of carbon.
Primary consumers (herbivores)
Secondary consumers (carnivores)

Phytoplankton carbon• Phytoplankton carbon
determinations are most often derived from measurements of chlorophyll; this requires a conversion factor.
• Phytoplankton carbon can also be estimated based on cell size and abundances (microscopy and/or flow cytometry).
Primary producers

Light harvesting photosynthetic pigments
• Chlorophylls• Carotenoids• Biliproteins
• Recently discovered photoreceptor proteins (Proteorhodopsin and Bacteriorhodopsin) serve as proton pumps, but do not appear to harvest energy for oxygenic photosynthesis.

Chlorophylls
• Cyclic tetrapyrolewith a magnesium atom chelated in the center of the ring
Phytol
Chlorophyll c lacks the phytolgroup

• All oxygen evolving photosynthetic plankton contain Chlorophyll a (peak absorption 450 and 660 nm)
• Chl a, b, and c all absorb strongly in the red (between 440-450 nm) and blue wavelengths (~645-660 nm). The presence of Chl b and cincreases the absorption between 450-650 nm.

Carotenoids• Isoprenoid
compounds (lipids)-not water soluble.
• Almost all chlorophyll and carotenoids occur as complexedproteins.
The double bonds absorb strongly in the short wavelength region of the visible spectrum

Carotenoids
• Photosynthetic carotenoids participate in photosynthetic electron transport .
• Non-photosynthetic carotenoids appear to protect photosynthetic reaction centers from oxidation via free radical scavenging

Phycobiliproteins
• Water soluble pigments that capture light energy and pass the energy to chlorophyll.
• Found in Rhodophytes (red algae), Cryptophytes, and Cyanobacteria– Red: phycoerythrin (red algae, often in
cyanobacteria); phycoerythrocyanin– Blue: phycocyanins, allophycocyanins
• Occur as aggregates, termed phycobilisomes, composed of 3 or more phycobiliproteins

Phytoplankton taxonomy
• Phytoplankton include single cells or organized colonies; the vast majority are very small (<10 µm):– Picoplankton: 0.2-2.0 µm– Nanoplankton: 2.0-20 µm– Microplankton: 20-200 µm
The picoplanktonic photosynthetic cyanobacteria comprise a substantial component of plankton biomass and production in low nutrient systems.

Major divisions and classes of photosynthetic plankton in the ocean
• Prokaryotes– Cyanobacteria
• Eukaryotes:– Chlorophyta (green algae); include
the following classes:• Chlorophyceae• Prasinophceae• Euglenophyceae
– Chromophyta (brown algae); include the following classes:
• Chrysophyceae• Pelagophyceae• Prymnesiophyceae• Bacillariophyceae (diatoms)• Dinophyceae (dinoflagellates)• Cryptophyceae (crytophytes)• Phaeophyceae (phaeophytes)
– Rhodophyta (red algae)-mostly macrophytes
1 µmMicromonas
Pelagomonas
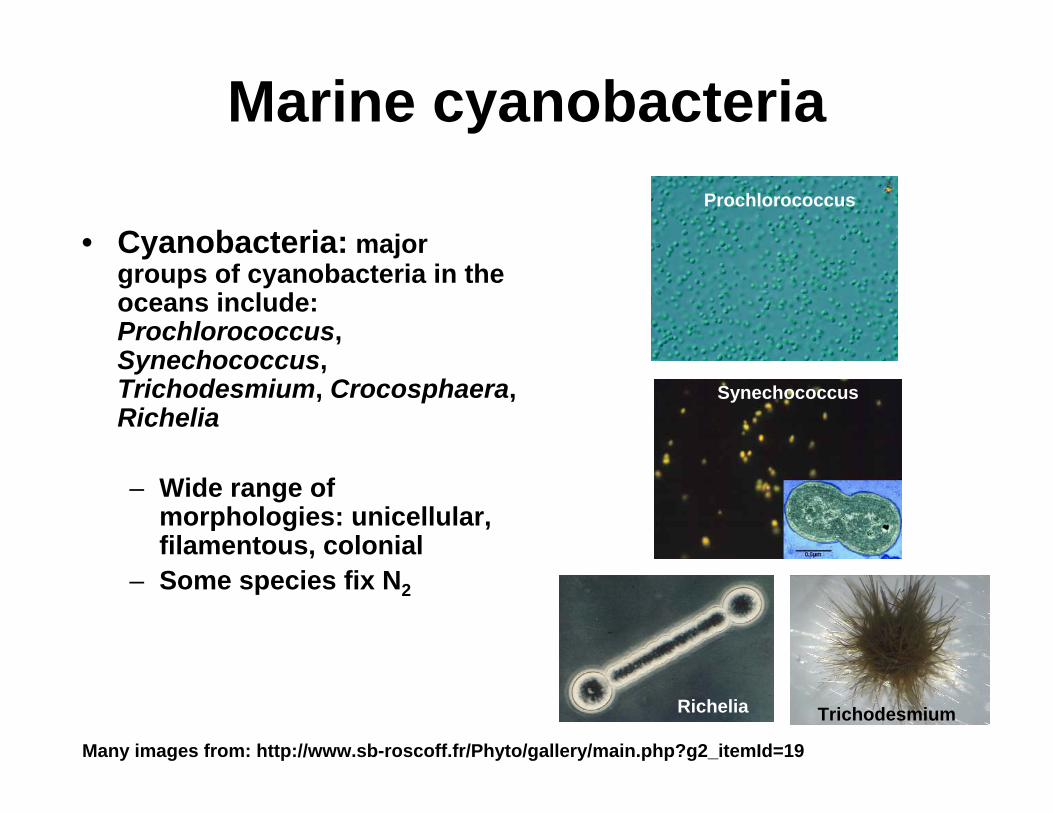
Marine cyanobacteria
• Cyanobacteria: major groups of cyanobacteria in the oceans include: Prochlorococcus, Synechococcus, Trichodesmium, Crocosphaera, Richelia
– Wide range of morphologies: unicellular, filamentous, colonial
– Some species fix N2
Synechococcus
Trichodesmium
Prochlorococcus
Richelia
Many images from: http://www.sb-roscoff.fr/Phyto/gallery/main.php?g2_itemId=19
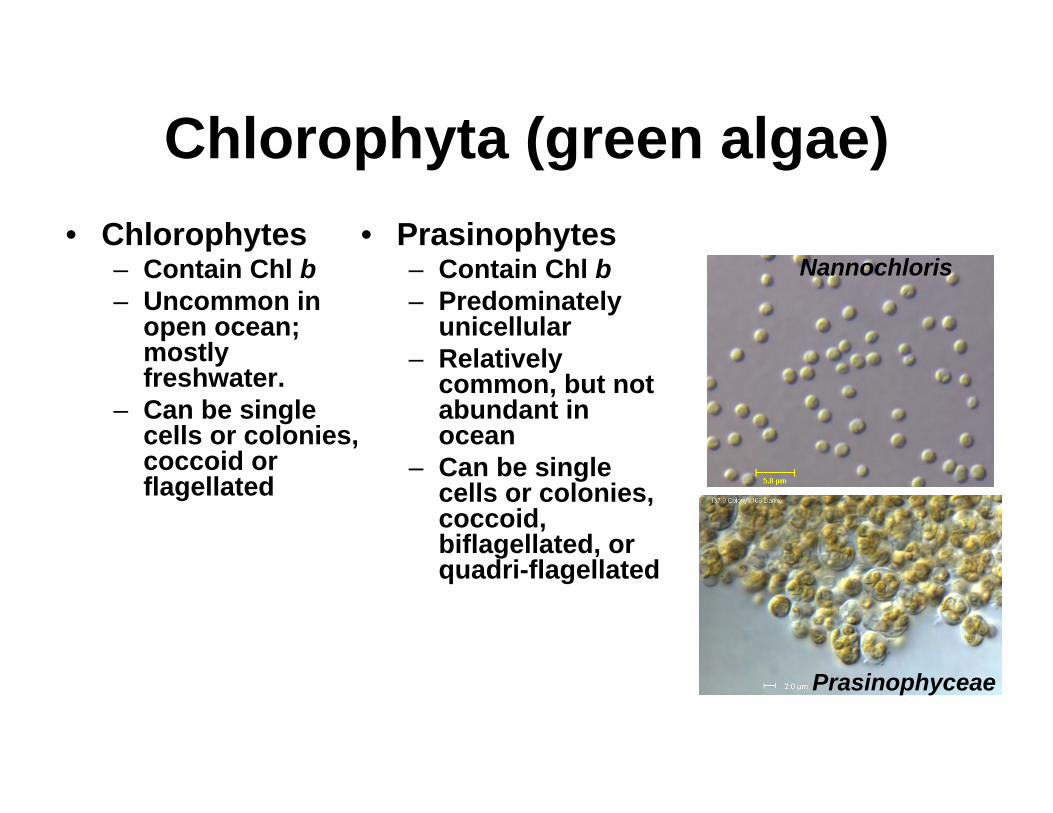
Chlorophyta (green algae)• Chlorophytes
– Contain Chl b– Uncommon in
open ocean; mostly freshwater.
– Can be single cells or colonies, coccoid or flagellated
Nannochloris
Prasinophyceae
• Prasinophytes– Contain Chl b– Predominately
unicellular– Relatively
common, but not abundant in ocean
– Can be single cells or colonies, coccoid, biflagellated, or quadri-flagellated
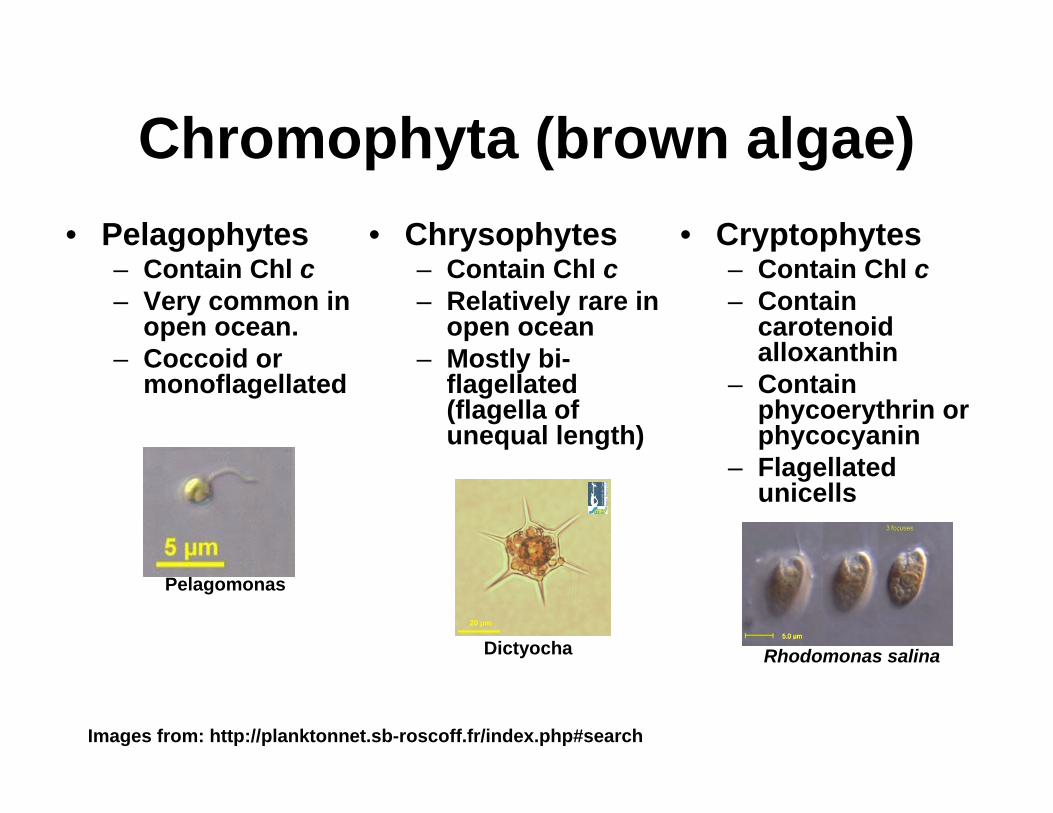
Chromophyta (brown algae)• Pelagophytes
– Contain Chl c– Very common in
open ocean.– Coccoid or
monoflagellated
• Chrysophytes– Contain Chl c– Relatively rare in
open ocean– Mostly bi-
flagellated (flagella of unequal length)
• Cryptophytes– Contain Chl c– Contain
carotenoidalloxanthin
– Contain phycoerythrin or phycocyanin
– Flagellated unicells
Pelagomonas
Images from: http://planktonnet.sb-roscoff.fr/index.php#search
Dictyocha Rhodomonas salina

SkeletonemacostatumDate: 10/10/06 Owner: Gallery Administrator
3 votes4.333 N/A
Chromophyta (brown algae)-Cont.
• Prymnesiophytes– Mainly
biflagellates– Very common
in open ocean
– 2-5 µm– Some
species form CaCO3 plates (coccoliths)
• Bacillariophytes– Ubiquitous– All contain Chl c and
carotenoidfucoxanthin
– Rigid silica-impregnated cell wall
– Many form colonies– 2 prominent cell
morphologies: centric and pennate
Emiliana huxleyi Coscinodiscus Rhizosolenia
• Dinophytes– Possess the
carotenoid peridinin– Widely distributed
(estuaries, open ocean)
– Mostly unicellular and autotrophic, but colorless heterotrophs can also be abundant
– 2 flagella– Many are
bioluminescent and some case toxic red tides blooms
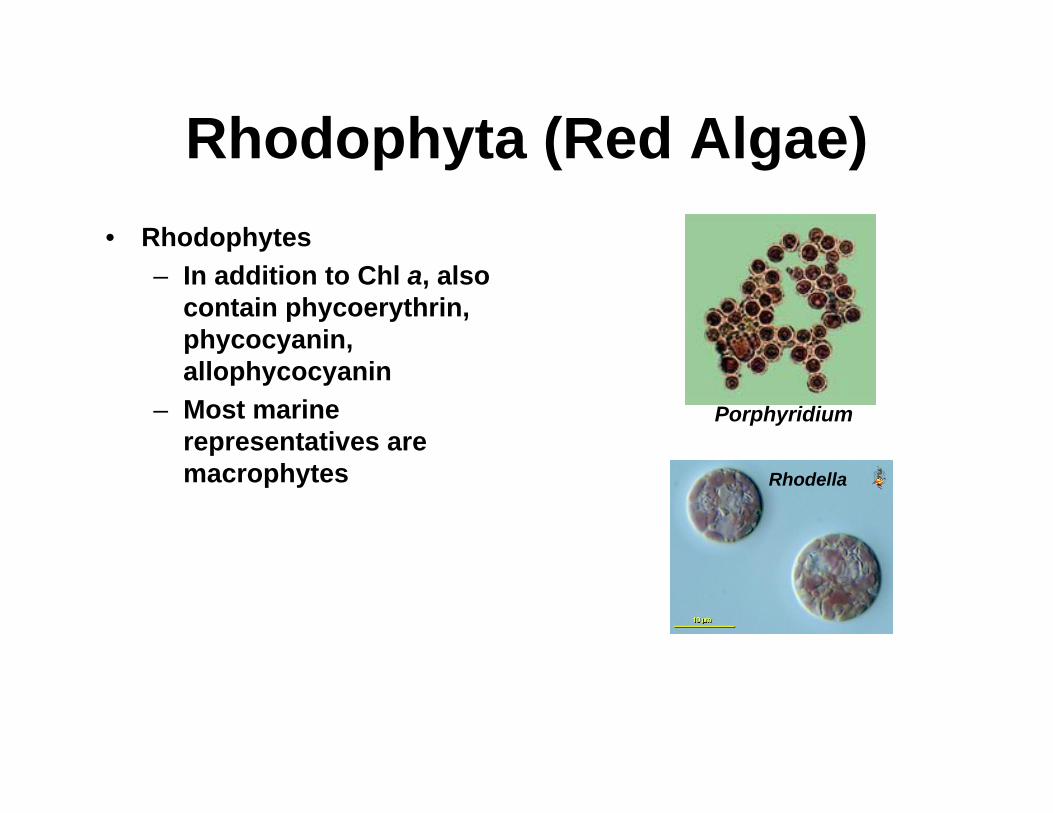
Rhodophyta (Red Algae)• Rhodophytes
– In addition to Chl a, also contain phycoerythrin, phycocyanin, allophycocyanin
– Most marine representatives are macrophytes
Porphyridium
Rhodella

Carotenoids and biliproteins extend the spectral region able to support plankton growth; thus light forms an important environmental control on microorganism evolution.

Carbon to Chlorophyll Conversions• Chlorophyll concentrations can vary depending
on physiological and environmental history of the cells
Chlorophyll a (ng L-1)
0 1000 2000 3000 4000
Dep
th (m
)
0
50
100
150
200
Particulate Carbon (µmol L-1)
0 5 10 15 20 25
C: Chl (mg : mg)
0 500 1000 1500 2000
Arabian SeaNAB
Eq-Pac HOT
How much detritus?
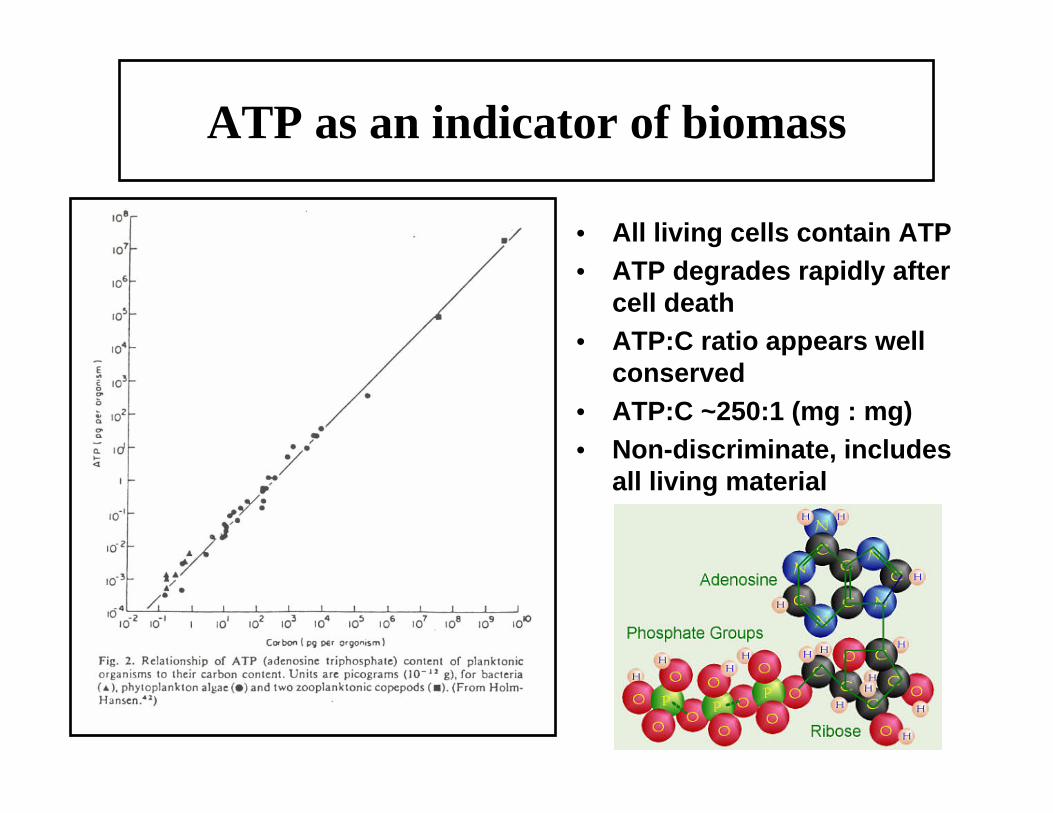
ATP as an indicator of biomass
• All living cells contain ATP• ATP degrades rapidly after
cell death• ATP:C ratio appears well
conserved• ATP:C ~250:1 (mg : mg)• Non-discriminate, includes
all living material

Euphotic zone typically ~30-75% of particulate material contains ATP.

Determining Biomass by Microscopy
• Filter seawater onto polycarbonate filter or concentrate cells by settling (large phytoplankton)
• Stain cells • Visualize cells by
light and/or fluorescence microscopy
• Count cells and measure cell sizes
• Use conversion factors to calculate carbon

Application of flow cytometry to abundance/cell sizing

“Typical” bacterial cell densities in aquatic ecosystems
Habitat Cell density (cells ml-1)
Estuaries >5 x 10⁶
Coastal (near shore) 1-5 x 10⁶
Open Ocean 0.5-1 x 10⁶
Deep Sea <0.01 x 10⁶

Biomass (µg C L-1)
0 2 4 6 8 10
Dep
th (m
)
0
200
400
600
800
1000
PhytoplanktonBacteriaTotal Biomass
Planktonic biomass generally declines with increasing depth-why?

Important exceptions to the logarithmic decline in biomass with depth
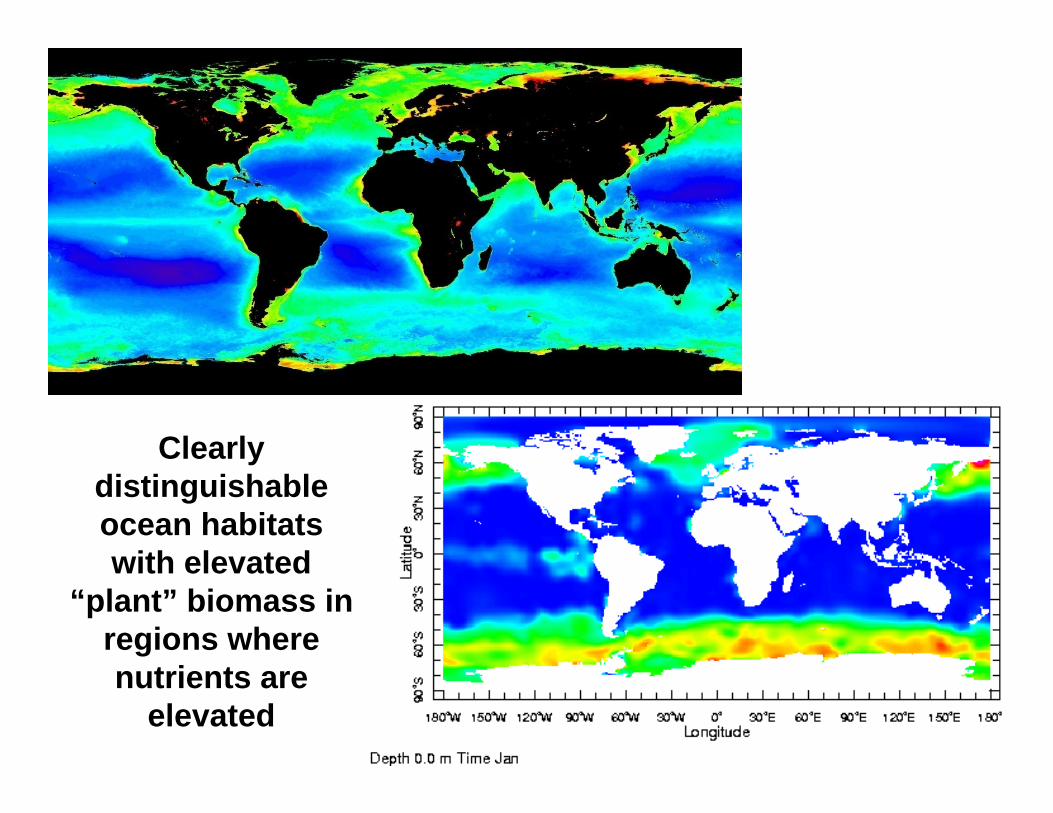
Clearly distinguishable ocean habitats with elevated
“plant” biomass in regions where nutrients are
elevated

In the ocean gyres, chlorophyll concentrations
are low in the surface water, greater at depth (80-150 m).
In contrast, most of the production (=synthesis of
biomass) occurs in the well-lit upper ocean.

Spatial discontinuities at various scales (basin, mesoscale, microscale) in ocean habitats play important roles in controlling plankton growth and distributions.
Yoder, 1994

Buck et al. (1996)
25oN
5oS
45oN

Bacterial and phytoplankton biomass in the upper ocean in various ecosystems
Location Bacterial Biomass(mg C m-2)
Phytoplankton Biomass
(mg C m-2)
Bact:Phyto
Sargasso Sea 659 573 1.2
North Atlantic 500 4500 0.11
Subarctic North Pacific
571 447 1.2
Station ALOHA 750 447 1.7
Arabian Sea 724 1248 0.58
AverageStand dev.
CV (%)
64110516%
14431740120%
0.960.6264%
Bacterial biomass constitutes a large pool of living carbon in marine ecosystems. Note greater variation between ecosystems in phytoplankton biomass relative to bacterial biomass.Bacterial biomass calculated assuming 10 fg C cell‐1; phytoplankton biomass calculated assuming C:Chl of 50:1.

• Biomass pyramids in large areas of the open ocean appear inverted, with secondary
producers comprising a major
fraction of ecosystem biomass.
Plankton biomass relationships
Gasol et al. (1997)

• Over wide range of aquatic ecosystems, bacterial biomass appears correlated with phytoplankton biomass.
• Bacterial biomass is generally less variable than phytoplankton biomass across large gradients in productivity.
• With increasing oligotrophy, bacterial biomass becomes a proportionality larger fraction of total plankton biomass.
Plankton biomass relationships

An inverted food web in low productivity ecosystems?
How is this biomass pyramid sustained? Rapid turnover of phytoplankton biomass.
Primary producers
Primary consumers (Bacteria)
Secondary consumers (microzooplankton)
Tertiary consumers (mesozooplankton)
Related Documents