• PAPER' t. t I • North Sea Measurement Workshop 1998 AN ULTRASONIC GAS FLOW MEASUREMENT SYSTEM WITH INTEGRAL SELF CHECKING. C Letton, Daniel Measurement & Control. D J Pettigrew, Daniel Measurement & Control. S Renwick, Daniel Measurement & Control. J Watson, National Engineering Laboratory •

Welcome message from author
This document is posted to help you gain knowledge. Please leave a comment to let me know what you think about it! Share it to your friends and learn new things together.
Transcript

• PAPER' t.t I
• North Sea
Measurement Workshop1998
AN ULTRASONIC GAS FLOW MEASUREMENT SYSTEM WITHINTEGRAL SELF CHECKING.
C Letton, Daniel Measurement & Control.D J Pettigrew, Daniel Measurement & Control.
S Renwick, Daniel Measurement & Control.J Watson, National Engineering Laboratory
•
1
• 16th NORTH SEA FLOW MEASUREMENT WORKSHOP 1998
AN ULTRASONIC GAS FLOW MEASUREMENT SYSTEM WITHINTEGRAL SELF CHECKING.
Chip Letton, Daniel Measurement and ControlDouglas Pettigrew, Daniel Measurement and ControlBrian Renwick, Daniel Measurement and ControlJames Watson, National Engineering Laboratory
1 INTRODUCTION
Ultrasonic flow meters are becoming increasingly accepted for fiscal measurement of naturalgas, as reflected in the latest standards, regulations, and codes of recommended practicesuch as NPD Regulations and Guidelines 1997 [1] and AGA 9 [2]..
• Since this is a new method of measurement to many operators, there is a need for diagnosticinformation which:
• gives confidence that the equipment is functioning correctly,• shows, e.g. by trending, that there has been no long term shift in the measurement, and• provides, where possible, 'health checks', i.e. advance waming of any future problems
allowing suitable action to be taken in advance.
This need is reflected in the standards, which are moving towards systems which providecontinuous on-line quality control and health checks to verify the correct operation of alldevices. For example:
NPD, 1997 [1]: Guidelines:
"Trending of various critical parameters should be done"
MlNhen using ultrasonic flow computers, the supervisory computer should calculate VOS(velocity of sound) based on P,T, and gas composition to monitor the vas calculated by theultrasonic flow meters ."
• AGA 9 [2): Field Verification Tests:
·Some performance aspects of the UM's condition should be evaluated by comparing theSpeed of Sound (SOS) value reported from the meter to a SOS calculated from the A. G.A.Report No.8, Detail Characterization Method Equation of State. A chromatographic analysis... is required for valid comparison".
For a specific Field Verification Test, this AGA 9 recommendation is met by taking a singlesample of gas for off-line chromatographic analysis.
However, a typical field system for measuring energy and mass flow will include a gaschromatograph to provide the gas composition. In this case, full use of the extra diagnosticinformation available can and should be made by doing the comparison continuously and on-line. Note that the ultrasonic measurement of 50S is a direct measurement based onmeasured times and dimensions, and thus is totally independent of the SOS calculated fromthe gas composition, pressure, and temperature.
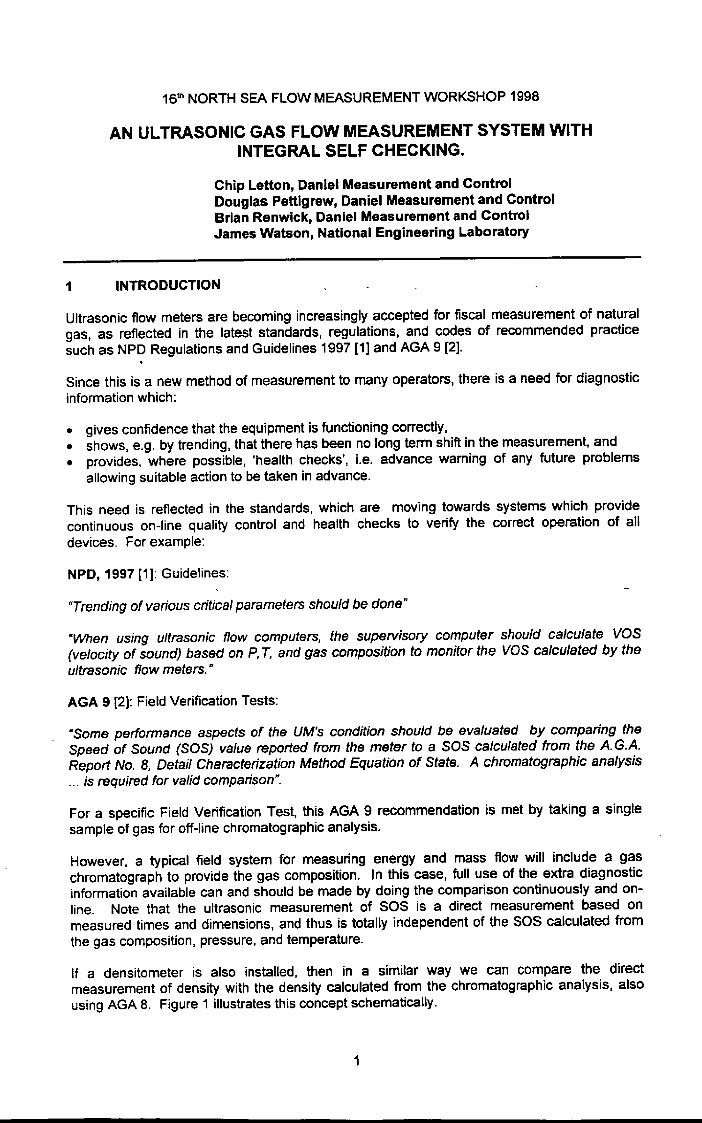
•If a densitometer is also installed, then in a similar way we can compare the directmeasurement of density with the density calculated from the chromatographic analysis, alsousing AGA 8. Figure 1 illustrates this concept schematically.
SUPFRVISCRY CClvIPUIER •
R. Sakariassen [3] has already shown the value of trending Speed of Sound (comparisonbetween 4 paths) and derived density; we now want to look at absolute comparisons using agas chromatograph and densitometer.
With this system (Ultrasonic meter + Gas Chromatograph + Densitometer), the three maininstruments give two independent measures of Speed of Sound and two independentmeasures of density. It is therefore possible to cross check all 3 instruments against eachother, deduce which is the odd one out if there is a disagreement, and also provide someextra redundancy should one of them fail.
The remainder of this paper looks in more detail at the self checking and the diagnosticinformation available in each component of such a system. Also evaluated are theuncertainties in the dual measurements of Speed of Sound (SOS) and density, and thetheoretical limits within which the above components should agree. Finally these theoreticallimits are compared with actual data derived from ultrasonic metering systems, to show howcross checking could be used in operational practice.
SQS(usm)
USM
AGA8.Ioof---- PI+---T
GC •Figure 1 - Ultrasonic gas measurement system
•Specific topics in the rest of this paper include:
review of ultrasonic flow meter basics.self checking in ultrasonic flow meters.self checking and uncertainty in gas chromatographsaccuracy of speed of sound measured by ultrasonic metersuse of the AGA 8 equationthe applicability of AGA 8 to rich natural gasescalculation of the speed of sound using AGA 8an integrated configurable systemexperimental datafield implementation.
•••••••••• •
2

1-X-1I I
• 2 REVIEW OF ULTRASONIC METER BASICS
Before looking at the main topics of consideration here, it is worth reviewing the basics ofultrasonic transit-time flow measurement. Consider the case shown in Figure 2 below.
Figure 2 ~Ultrasonic Meter
If L and X are the direct and lateral (along the pipe axis and in the flowing gas) distancesbetween the two transducers, C is the Speed of Sound and V the flow velocity of themedium, and T12 and T21 are transit times in each direction,
then
~2L
(1)XC+v·~L• and
T2\L (2)
Xc-v':L
Inversion of these two equations yields
V[1 (T" - 7;, J (3)2X T11 . ~2
and
CL (7;, +~, J (4)=2 T21 • T.2•
3

Thus, by measuring dimensions and transit times in pursuit of the average flow velocity alongthe path between transducers, we have also measured the Speed of Sound along this path.This will prove to be an extremely useful parameter in determining the overall performance ofthe meter.
•3 SELF CHECKING IN ULTRASONICMETERS
One of the principal attributes of modern ultrasonic meters is their ability to monitor their ownhealth, and to diagnose any maladies which may be detected. Multipath meters offer theultimate in this regard, as they can compare certain measurements between different paths,as well as checking each path individually.
Measures which can be used in this self-diagnosis include the following.
Gain. One of the simplest indicators of a meter's health is the presence of strong signals onall its paths. Properly designed multipath meters will have automatic gain control on allreceiver channels, hence an increase in gain on any channel indicates a smaller signal on thatchannel, perhaps due to transducer deterioration, fouling of the transducer ports, or evenliquids in the line [4]. Caution must be exercised to normalize for other factors which affectsignal strength, such as pressure and flow velocity. Whatever the cause, if it persists andthreatens good signal detection, it is a cause for further investigation.
Signal Quality. This expression simply refers to the influence a detected signal has on ameter's ability to make a proper detection. Since this is highly dependent on the detectionscheme employed by a given meter, one cannot simply jot down general equations whichdescribe this parameter for any meter. The vendor of any given meter should, however, beable to supply some figure of merit describing how good his signal detection is for eachultrasonic path, i.e. the signal 9!@.!ir£ for this path. Note that this measure may be eitherstatistical (percentage of good detections) or structural. A good instrument will monitor both.
Signal to Noise Ratio. This should also be monitored as an independent indicator. Note thatthe noise may be gas borne, (e.g. from pressure reduction valves), or from coupling of soundfrom the transducer to the meter body, or electrical. Stacking can be used to overcome somekinds of noise problems.
Sanity Checks. Correct meter operation dictates that certain parameters will have well-defined ranges, and that any measurement or estimate outside that range indicates that anerror has occurred. Likewise, ranges exist for parameter changes. Alarms or warnings canbe raised for out-of-range values for either.
Velocity Profile. Once a meter is placed in a specific gas pipeline configuration, the velocityprofile of the gas for a particular average velocity should not vary a great deal. If the multipathmeter in use is capable of measuring the velocity profile, then significant departures of thisprofile from normal should be viewed as a cause for concern.
Speed of Sound. Since an n-path ultrasonic meter has n paths of the type shown in Figure 1,it has n independent means of measuring and comparing the Speed of Sound (SOS) of thegas in the pipeline.
Statistical Measures. An ultrasonic meter will typically fire pulses and measure the transittimes at as high a sampling rate as possible, then average the results from a 'batch' of severalmeasurements. The standard deviation of the individual readings in the batch from the meanvalues can be used to indicate meter operation. Deviations can indicate the onset ofproblems.
•4

5
• 4 SELF CHECKING AND UNCERTAINTY IN GAS CHROMATOGRAPHS
4.1 Self checking in GasChromatographs
Most on line process gas chromatographs have a variety of self checking procedures, theexact details of which are dependent on the manufacturer. Listed below are a set of selfchecks suitable for a process gas chromatograph operating with a thermal conductivitydetector.
Status of Detector. The thermal conductivity detector has to be balanced to provide a goodanalytical measurement. Detector voltage balance is checked at the start of every run whenonly carrier gas is present. Deviations from the balance point indicate a change in detectorcircuit conditions and if the signal drifts beyond pre-set limits this should be-investigated.
Signal from Detector. The analogue signal from the thermal conductivity detectors issubjected to various degrees of amplification. Limits on the allowable range of this Signal, forexample, between 5% and 95% of full scale, are automatically set and checked during dataacquisition. Values outside the limits will indicate a fault condition.
• Analysis Results - Un-normalised Total. There are always small variations betweensuccessive gas chromatograph analyses of the same gas. Furthermore, with atmosphericpressure sample injection systems the size of sample injected changes proportionally withvariations in ambient pressure. However, in a correctly configured and calibrated system theun-normalised component total (i.e. the actual quantity of component detected) should alwaysbe close to 100%. Significant deviations from 100% indicate that there is a potential problemwith the analytical set up. In the UK it is normal fiscal metering practice to set the un-normalised total limits for gas chromatograph analysis to ± 2%.
Analysis Results - Range Lirnits. If the gas composition is known to be relatively stable thenlimits for the ranges of individual component measurements or calculated physical propertiescan be set.
Calibration. Regular calibration of process gas chromatographs provides a method ofupdating response factors for small changes in local conditions. However, for most processgas chromatographs detector response is constant over a long time period. Perhaps the mostSignificant feature of regular calibration is that it gives a performance check, i.e. a comparisonof current performance with a known standard against the last good calibration with thatstandard. Limits are set on response factor and retention time deviation, and changes outsidethese indicate a significant change in the performance of the analytical unit.
4.2 Uncertainties in GasChromatographAnalysis
It is outside the scope of the current paper to discuss the uncertainties associated with on linegas chromatograph analysis, and a fuller discussion can be found elsewhere [5, 6]. Briefly,the principal causes of uncertainty in process gas chromatographs measurement are thefollowing. First are uncertainties in the calibration gas concentrations. Next are uncertaintiesdue to variation in instrument response, i.e. repeatability of the process gas chromatographs.Third are bias errors caused by non-linearity of detector response. Fourth are uncertaintiesassociated with the values used in the calculation of physical properties, such as density. Atbest, with no bias errors and a top quality approved calibration gas, -this can give a densityuncertainty of 0.05%. However, when bias errors are introduced and/or poor qualitycalibration gases are used, errors of 0.3% or greater are possible.
5 ACCURACY OF SPEED OF SOUND MEASUREMENT BY ULTRASONIC METERS
•The Mdrycalibration" of ultrasonic meters is accomplished by making precision measurementsof the meter geometry and transducer delay times. The transducer delay times aredetermined by measurements taken in a test cell filled with a known gas (nitrogen) at known

temperature and pressure. The speed of sound of nitrogen is thus known to within 0.1%.When the complete ultrasonic meter is later assembled, a final check is done by filling themeter with nitrogen. Measured speeds of sound on all chords must agree within 0.1%, whichtakes into account the uncertainty in the geometry (chord length) and transit timemeasurements.
•For a flowing gas, there may be additional effects due to the inability of simple ray theory tofully describe the complex interaction of the ultrasonic pressure wave with the flow. (For amore complete explanation, see AGA 9 [2J, Appendix C.) This phenomenon is evident bylooking at how the velocity of sound values vary from inner to outer paths. In the datapresented later in this paper, using four-path meters, it was found that at the highest flowvelocities (28 mls), the four individual speed of sound readings fell within a range of 0.1% ofthe average. At lower velocities this figure dropped to 0.05%. It therefore seems reasonableto bound these errors in flowing gas to about 0.1%.
Overall then, the uncertainty in the speed of sound measured by a multi-path ultrasonic meterfrom these three kinds of errors is estimated to be ±..J(0.12 + 0.12+ 0.12
) = ± 0.17%.
6 USE OF THE AGA 8 EQUATIONS.
If the gas composition, pressure, and temperature are known, then both the gas density andthe Speed of Sound can be calculated from the gas equation of state. The accepted standardequation of state for lean natural gases is the current revision of AGA Report No 8 [7), usingthe Detail Characterization Method (complete gas composition).
•This equation is valid for lean natural gas mixtures over a wide range of conditions.
In principle, the gas chromatographic technique for the determination of density should be aseffective as that using a fully calibrated and traceable densitometer, given that themeasurements of pressure, temperature, and the gas composition are made to a sufficientlyhigh standard.
6.1 AGA 8 Accuracy· Lean Natural Gases
The accuracy of the AGA 8 equation of state depends on the composition of the natural gasand on the temperature and pressure at the metering conditions. The targeted uncertainties(at two standard deviations) for the AGA 8 equation of state in terms of temperature andpressure are:
Table 1 •. Region Temperature Absolute Pressure c.Uncertainty in .
Range Range Density~ "
1 -8 to 62°C o to 120 bar 0.1%2 -60 to 120°C o to 170 bar 0.3%3 -130 to 200°C o to 700 bar 0.5%4 ·130 to 200°C o to 1400 bar 1.0%
The AGA 8 equation is claimed to meet these expected or targeted uncertainties for gasmixtures having a normal range of compositions, see below, within Region 1, and in parts ofRegions 2, 3, and 4. For the expanded range of compositions given in the following Table, theuncertainties are expected to be higher.
•6

7
• Table 2
Normal Composition Range Expanded .Composition RangeComponent Lower limit Upper limit Lower limit Upper limit
(mole%)· .. (mole%) (mole%) (mole%)Methane 45 100 0 100Nitrogen 0 50 0 100
Carbon dioxide 0 30 0 100Ethane 0 10 0 100
Propane 0 4 0 12Butanes 0 1 0 6
Pentanes 0 0.3 0 4Hexane's plus 0 0.2 .. 0 dew point
7 THE APPLICABILITY OF AGA 8 TO RICH NATURAL GASES.
•The application of the AGA 8 equation to rich natural gases (approximately 60% methane withthe balance being heavier hydrocarbons), as encountered in gas condensate fields in theNorth Sea, has only recently been tested.
The UK National Engineering Laboratory (NEL) has been involved in a Joint Industry Projectto investigate the applicability of the AGA 8 equation to rich natural gas mixtures. Ameasurement program was launched, firstly, to determine the magnitude of the differencesbetween AGA 8 and reference-quality density data for ten natural gas mixtures in the range 80to 180 bar and 40 to 80°C; and secondly, to provide reference-quality density data forsubsequent refinements to the AGA 8 equation. The reference-quality data were obtainedusing NEL's primary standard densitometer.
The evidence from this major research program has established that:
• calculated densities for mixtures with compositions in the expanded range are betterthan expected.
• the maximum differences between measured and calculated densities occur for thosemixtures with component compositions above, or close to. the upper limit of theexpanded range of compositions; and
• the upper composition limit for carbon dioxide (30%) for normal range application ismuch too high.• 8 CALCULATION OF THE SPEED OF SOUND.
The Speed of Sound of the gas mixture can be calculated by an extension of the equationsgiven in the AGA 8 standard.
The necessary equations are detailed in a GRI report [8], which uses essentially the sameequation of state as found in the 1985 version of the AGA 8 standard. These equationsshould be upgraded to be consistent with the latest (1994) edition of AGA 8. Also, theequations require a knowledge of Cp, the ideal specific heat of the gas at constant pressure.
All calculated values of Speed of Sound in this paper were derived using the implementationof the AGA 8 equations by Daniel Measurement and Control for use on their systems. Similarcalculations are available as PC based programs from various sources, e.g. the AGA 8package from NEL, which supplies a complete range of calculated properties, including Speedof Sound, and is supplied in Excel compatible form.
•

8.1 Uncertainty of the calculated Speed of Sound •The uncertainty in the calculated Speed of Sound depends upon:
• the uncertainty inherent in the equation of state calculations.• the uncertainty in line pressure and temperature• the uncertainties in the measured gas composition
The accuracy of the AGA 8 equation of state depends on the gas composition, pressure andtemperature. The equations are less accurate at high gas density (lower temperatures andhigher pressures), and with richer gases, or gases containing relatively large amounts of CO2,
The accuracy of the Speed of Sound calculation (Daniel implementation) has been quantifiedby comparing the calculated values with experimental data published by NIST [9], which has astated accuracy of ± 0.05% on measured Speed of Sound values.
The NIST data uses 4 natural gas mixtures, 2 of which (Gulf Coast and Amarillo) are leangases within the normal range of AGA 8. The third mixture used (Statoil Dry gas) is onlyslightly outside the normal range (ethane = 13%), and is included in the results below as anormal gas. The final mixture is Statoil Statvordgass, which is a richer gas in the AGA 8expanded range. •For lean natural gas above O°C and below 130 bar, the agreement (95% limit) betweencalculation and measurement was found to be ± 0.07%.
The results for a wider range of conditions are summarised in Table 3.
Table 3
Gas Composition Temperature Pressure Uncertaintyin calculated SOS
(95% limit)Normal > O°C < 100 bar 0.07%
u u 100 to 130 bar 0.16%u -23"C to O°C < 100 bar 0.13%u u 100 to 130 bar 0.64%
Statoil Statvordgass* 25°C to 75"C < 60 bar 0.11%A .. 60 to 105 bar 0.90% •* The Statoil Statvordgass composition is:
methane 74.348%ethane 12.005%propane 8.251%normal butane 3.026%normal pentane 0.575%normal hexane 0.230%nitrogen 0.537%carbon dioxide 1.028%
Similarly, the uncertainties due to measurement of gas composition, pressure andtemperature have been estimated numerically by observing the effect on the calculated Speedof Sound, independently varying each parameter. If we postulate uncertainties of 0.3"C and0.2 bar in the measurement of pressure and temperature (maximum allowed by NPDrequirements for fiscal systems) and feed these into the Speed of Sound calculations, theadded uncertainty in Speed of Sound is roughly 0.07%. •
8
from NIST measurement:from equation of state:from P and T:from gas analysis:
0.05%0.07%0.07%0.05%
• Similarly, the uncertainties in composition from a typical gas analysis system results in anadded error of roughly ± 0.05%.
In summary then, the overall uncertainty (95% confidence limit) in calculated (AGA 8) Speedof Sound, for a normal gas below 100 bar and above O°C, is:
Total (square root rule) = 0.12%
-For richer gases, lower temperatures or higher pressures, the uncertainty will be greater, asindicated above.
9 AN INTEGRATED CONFIGURABLE SYSTEM
• Refer to the system shown in Figure 1. This is an integrated system for volume, mass andenergy flow with additional checking, in the sense that the three main components provide twoindependent measures of both Speed of Sound and density. They can therefore cross-checkone another, as well as provide an extra level of redundancy. However it is also configurablein the sense that various components can be switched off, or even omitted entirely to givereduced cost for suitable applications.
It is worth noting that the Speed of Sound is used as a correction to the densitometermeasurement, and therefore in this system, the densitometer accuracy can be increased byusing the Jive Speed of Sound measurement from the ultrasonic meter (backed up by the gaschromatograph).
Possible reduced configurations are:
1) USM +GC (no densitometer):Still provides volume, mass and energy measurement with cross checking on Speedof Sound.
2) USM + densitometer (no GC):Provides volume and mass flow. The 'fall back' for energy would be to enter a fixedgas composition, or fixed heating value.• 3) USM only.This is suitable for certain kinds of systems, and can be useful if the gas compositionis well known and does not vary significantly from week to week.
10 EXPERIMENTAL DATA COMPARING SPEED OF SOUND AND DENSITY
In order to investigate the degree of agreement that can be expected in normal operation,between the dual measurements of Speed of Sound and density, data has been collectedfrom flow calibration tests of Daniel 4-path ultrasonic meters with nominal sizes of 6", 8", 10"and 12". In each case the data covers flow velocity ranges of approximately 2 to 28 mlsec,using typical lean natural gases, pressure ranges of roughly 30 to 50 bar. The 8" meter datawas obtained during approval tests at the Gaz de France facility at Alfortville, Paris. Theremaining data were obtained during flow calibrations carried out at the British Gas flow testand calibration facility at Bishop Auckland. UK. The gas chromatograph at Bishop Aucklandwas a Danalyzer, that at Alfortville was by another manufacturer. The authors gratefullyacknowledge the help and co-operation received at both of these sites.
•9

10.1 Speed of Sound •The preceding sections show that the expected uncertainties (2 standard deviations) inSpeed of Sound are:
USM measurementCalculated (AGA 8)
± 0.17%± 0.12% (lean gas, P < 100bar)
In actual practice, using lean natural gas below 100 bar, we would therefore hope to find that95% of readings agree within about 0.21% (about 0.8 m/sec).
The actual data for the 4 meter sizes is summarised in what follows. Each figure showstrended values covering 2 to 3 hours.
First shown is data from the 8" meter in Figure 3, comparing the average Speed of Soundover the 4 paths with the AGA 8 calculated value.
400
4ffi.5o....E 4ffi<Ii0UJ
404.5
404
403.5
403
402.50
•-- USW(rrin)
., USW(rrax)--f¥3,A8
5 10 15
Time
20 25 JO •Figure 3 - 8" meter. Measured vs. calculated SOS
At each measurement point, ten successive values of the ultrasonic meter Speed of Soundwere logged. The two curves which show the minimum and maximum values from each ofthese sets demonstrate a repeatability in the SOS measurements of better than 0.03%.
Figures 4 through 6 show the AGA 8 calculated Speed of Sound trended against theindividual Speed of Sound readings from the four paths. Note that in each case theagreement on all chords is roughly as expected, but that the agreement on the two centralpaths (chords B and C) is significantly better than on the outer paths (chords A and D).
•10

• 3E05J
393m
379.5J
-+-vc:sA fT1I!E379m -0- vasB nVsec
.' va;Cm's3::
~ 3785J-l<-VOiD m'sec
.!(! -+-V(agaB) mIsecEiiig 378.m
:m.5J
377m
• 3765J
376.m0 5 10 15 20 25
TIrre
Figure 4 -Six-inch meter. Measured Speed of Sound on four chords vs. AGA 8 calculation
-+- va:A m's!:;c
-Q-- vcd3 m's!:;c
~ VJ:1£m'sEc-l<- vosDrrlse::-+- V(<qi8} m'SlC
TIrreFigure 5 - Ten-inch meter. Measured Speed of Sound on four chords vs. AGA 8 calculation
•11

•377.ffJ
-+- 'C3A rrisa;_____\058 rTrsa;
~";-\05C rrisa;
~1CJ6O rrrseo-+- V(Bg38) rrlsa;
377.00
376.ffJ
376.00
~ 375.ffJ V:{/:::)i\}:iNEui .£ 375.00 ..
374.ffJ
374.00
373 eo
37300
TiJre
Figure 6 - Twelve-inch meter. Measured Speed of Sound on four chords vs. AGA 8calculation
From the above results, it is clear that on a multi-path meter, absolute Speed of Soundcomparison is best done using the central paths. As pointed our in our earlier discussion, thisis due to the complex nature of wave propagation in the flowing medium, which seems tomost greatly affect the outer chords.
The Table below shows the rms and maximum deviations between AGA 8 and USMobserved, using the mean values of SOS on the central (8 and C) chords for each meter(except the eight-inch, for which individual chord readings were not recorded).
This suggests that when using on-line cross-checking of Speed of Sound, a reasonableapproach would be to set an alarm limit of about ± 0.3%.
10.2 Test Data - Density
The expected uncertainties (2 standard deviations) in density are:
Densitometer measurement: ± 0.3%Calculated (AGA 8) density: ± 0.1% (normal gas, region 1)
In real operation, using lean natural gas, we would therefore expect the difference betweenthe two derivations of density to fall within ± 0.33%. (95% limit).
•12
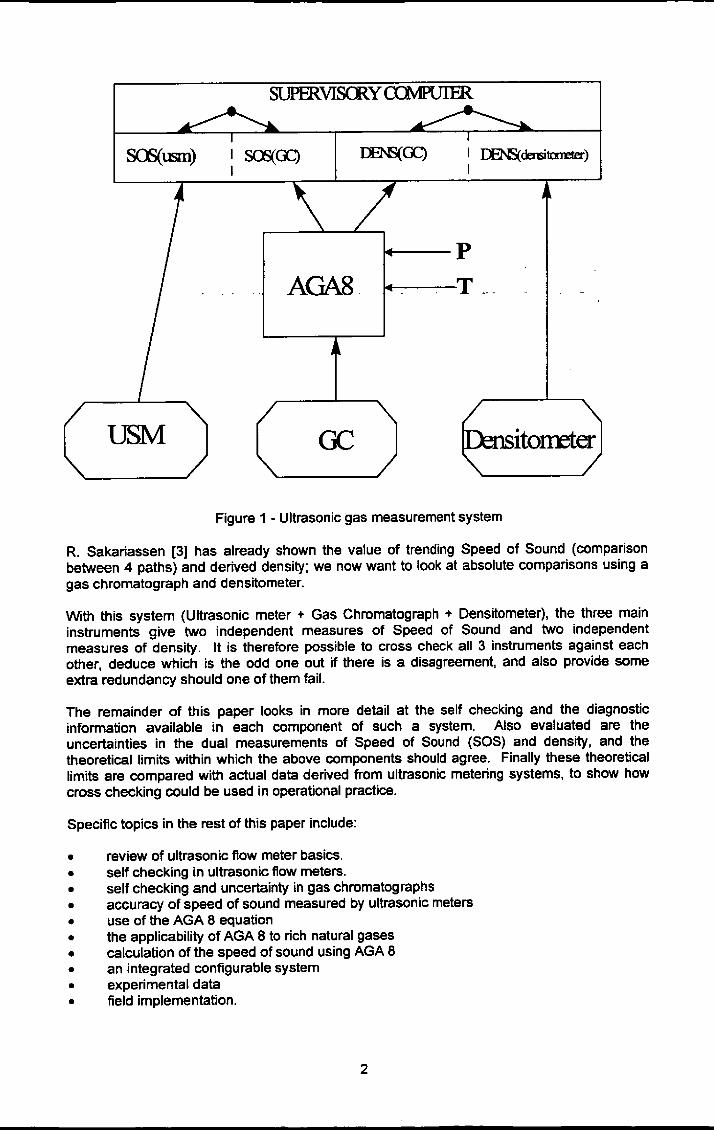
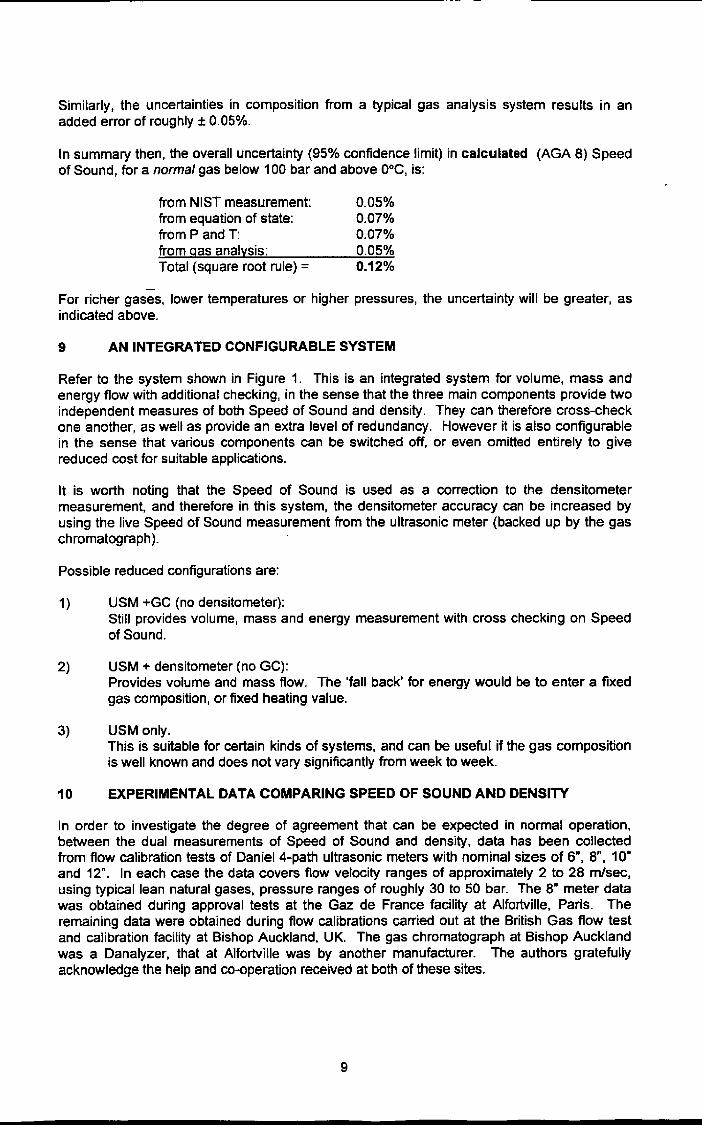
• Figures 7 and 8 show density data (densitometer v. AGA 8) from the tests of the eight-inchmeter at Alfortville. The second figure shows the same data set as the first, expanded toshow more detail.
Density, kgfm3
•__ AGAB
-0- Densito meter
Time
Figure 7 - Measured density vs. calculated density (AGA 8)
Density, kg/m3( Zoom of part of Density chart I
16.6
16.7
16.6
16.5
16.4..,EOa. 16.3
><
~ 16.2c..0
16.1
16
159
158
1570 5 10 15 20 25
Time
•
Figure 8 - Measured density vs. calculated density (AGA 8)
•13

[9] Younglove, B.A., Frederick, N.V. and R.D. McCarty, National Institute of Standardsand Technology, Monograph 178, Speed of Sound and Related Models for Mixturesof Natural Gas Constituents, January 1993. •
Once again, the two measurements track well, with a small systematic offset. The deviationsbetween the two measurements range from 0.45% to 0.24%, slightly outside the theoreticalpredictions, but broadly as expected. •The result and theory both suggest that when using density as a health check, a reasonablelimit for raising an initial warning alarm would be a difference of ± 0.9%. This may depend onthe specific densitometer being used.
11 FIELDIMPLEMENTATION
What we have shown here is a method whereby three instruments can yield independentestimates of two key parameters, thereby permitting the user to detect a malfunction in any ofthe three. The calculations shown were all performed on a PC, which raises the question ofhow the method will be implemented in field operation. Must a PC, either standalone or aspart of a supervisory system be present in order to perform the algorithms?
Fortunately, the next generation of panel-mounted flow computers will be capable ofperforming tasks such as this, which formerly required a standalone computer. One recentintroduction incorporates a fast 32-bit processor, and is thus fully capable of performing theAGA 8 calculations, as well as interfacing to the ultrasonic meter, the gas chromatograph, andthe gas densitometer. •12 CONCLUSION
The above results indicate that, in addition to the internal checks available within an ultrasonicmeter, it is both practical and useful to incorporate both gas chromatographs anddensitometers to give independent checks. Practical operational limits for initial warningalarms would appear to be about ± 0.3% deviation in Speed of Sound, and ± 0.9% in density.
13 REFERENCES
[1] Norwegian Petroleum Directorate, Regulations Relating to Fiscal Measurement of Oiland Gas, January 1997.
[2] AGA Report No.9, Measurement of Gas by Multipath Ultrasonic Meters, June 1998.
(3] Sakariassen, R., On-Line Quality Control of Ultrasonic Gas Flow Meters, North SeaFlow Measurement Workshop, Kristiansand, Norway, October 1997. •[4] Wilson, M.B., Ultraflow Wet Gas Development Project, NEL Seminar on theMeasurement of Wet Gas, East Kilbride, Glasgow, Scotland, October 1996
[5] Cowper, C. J. and R. J. Mounce, Evaluation of On-Line Chromatograph Performance,North Sea Flow Measurement Workshop, Kristiansand, Norway, October 1997
[6] ISO 10723 (1995), Natural Gas - Performance Evaluation for On-Line AnalyticalSystems, International Organization for Standardization, Geneva.
[7] AGA Report No.8, Compressibility Factors of Natural Gas and Other RelatedHydrocarbon Gases, July 1994.
[8] Gas Research Institute, High Accuracy Natural Gas Equation of State for GasMeasurement Applications, June 1991.
14
Related Documents


