The Cryosphere, 3, 167–182, 2009 www.the-cryosphere.net/3/167/2009/ © Author(s) 2009. This work is distributed under the Creative Commons Attribution 3.0 License. The Cryosphere Measurement of the specific surface area of snow using infrared reflectance in an integrating sphere at 1310 and 1550 nm J.-C. Gallet 1,2 , F. Domine 1,2 , C. S. Zender 1,3 , and G. Picard 1,2 1 CNRS-INSU, Laboratoire de Glaciologie et G´ eophysique de l’Environnement, BP 96, 38402 Saint-Martin d’H` eres, France 2 Universit´ e Joseph Fourier, Grenoble I, France 3 Department of Earth System Science, University of California, Irvine, USA Received: 17 November 2008 – Published in The Cryosphere Discuss.: 21 January 2009 Revised: 26 May 2009 – Accepted: 28 July 2009 – Published: 3 August 2009 Abstract. Even though the specific surface area (SSA) and the snow area index (SAI) of snow are crucial variables to determine the chemical and climatic impact of the snow cover, few data are available on the subject. We propose here a novel method to measure snow SSA and SAI. It is based on the measurement of the hemispherical infrared re- flectance of snow samples using the DUFISSS instrument (DUal Frequency Integrating Sphere for Snow SSA measure- ment). DUFISSS uses the 1310 or 1550 nm radiation of laser diodes, an integrating sphere 15 cm in diameter, and InGaAs photodiodes. For SSA<60 m 2 kg -1 , we use the 1310 nm ra- diation, reflectance is between 15 and 50% and the accuracy of SSA determination is 10%. For SSA>60 m 2 kg -1 , snow is usually of low density (typically 30 to 100 kg m -3 ), resulting in insufficient optical depth and 1310 nm radiation reaches the bottom of the sample, causing artifacts. The 1550 nm ra- diation is therefore used for SSA>60 m 2 kg -1 . Reflectance is then in the range 5 to 12% and the accuracy on SSA is 12%. We propose empirical equations to determine SSA from re- flectance at both wavelengths, with that for 1310 nm taking into account the snow density. DUFISSS has been used to measure the SSA of snow and the SAI of snowpacks in polar and Alpine regions. Correspondence to: F. Domine ([email protected]) 1 Introduction Snow is a porous medium that strongly impacts the energy budget of the Earth (Warren, 1982; Hall, 2004) and the chem- istry of the lower troposphere (Domine and Shepson, 2002; Grannas et al., 2007). An important physical property of snow that contributes to these impacts is its specific surface area (SSA). Snow SSA is defined as the surface area per unit mass (Legagneux et al., 2002), i.e. SSA=S/M=S/ρ ice V , where S is the surface area of a given mass of snow particles, M its mass, V is the volume of the snow particles, and ρ ice is the density of ice (917 kg m -3 at 0 ◦ C). SSA values range typ- ically from 2 m 2 kg -1 for melt-freeze layers to 156 m 2 kg -1 for fresh dendritic snow (Domine et al., 2007a). Light scattering by snow is determined by the size of the snow grains. Grenfell and Warren (1999) showed that the hemispherical reflectance of non-spherical particles could be well represented by a collection of independent spheres hav- ing the same S/V ratio as the particles. In this case, the important variable to calculate scattering is the diameter of the spheres, d eff , also called the effective grain size, which is simply related to SSA by: SSA = 6/ρ ice d eff (1) This demonstrates that SSA is a crucial variable to model snow optics, and therefore the energy budget of snow- covered surfaces. For example, using the DISORT radia- tive transfer model of Stamnes et al. (1988), we calculated light transmission through the troposphere and in the snow- pack, and found that a reduction in SSA of snow from 32 to 16 m 2 kg -1 at the summer solstice at noon, 65 ◦ N, causes an instantaneous forcing of 22 W m -2 at the tropopause, in- creasing column solar absorption by about 6.5%. Published by Copernicus Publications on behalf of the European Geosciences Union.

Welcome message from author
This document is posted to help you gain knowledge. Please leave a comment to let me know what you think about it! Share it to your friends and learn new things together.
Transcript

The Cryosphere, 3, 167–182, 2009www.the-cryosphere.net/3/167/2009/© Author(s) 2009. This work is distributed underthe Creative Commons Attribution 3.0 License.
The Cryosphere
Measurement of the specific surface area of snow using infraredreflectance in an integrating sphere at 1310 and 1550 nm
J.-C. Gallet1,2, F. Domine1,2, C. S. Zender1,3, and G. Picard1,2
1CNRS-INSU, Laboratoire de Glaciologie et Geophysique de l’Environnement, BP 96, 38402 Saint-Martin d’Heres, France2Universite Joseph Fourier, Grenoble I, France3Department of Earth System Science, University of California, Irvine, USA
Received: 17 November 2008 – Published in The Cryosphere Discuss.: 21 January 2009Revised: 26 May 2009 – Accepted: 28 July 2009 – Published: 3 August 2009
Abstract. Even though the specific surface area (SSA) andthe snow area index (SAI) of snow are crucial variables todetermine the chemical and climatic impact of the snowcover, few data are available on the subject. We proposehere a novel method to measure snow SSA and SAI. It isbased on the measurement of the hemispherical infrared re-flectance of snow samples using the DUFISSS instrument(DUal Frequency Integrating Sphere for Snow SSA measure-ment). DUFISSS uses the 1310 or 1550 nm radiation of laserdiodes, an integrating sphere 15 cm in diameter, and InGaAsphotodiodes. For SSA<60 m2 kg−1, we use the 1310 nm ra-diation, reflectance is between 15 and 50% and the accuracyof SSA determination is 10%. For SSA>60 m2 kg−1, snow isusually of low density (typically 30 to 100 kg m−3), resultingin insufficient optical depth and 1310 nm radiation reachesthe bottom of the sample, causing artifacts. The 1550 nm ra-diation is therefore used for SSA>60 m2 kg−1. Reflectanceis then in the range 5 to 12% and the accuracy on SSA is 12%.We propose empirical equations to determine SSA from re-flectance at both wavelengths, with that for 1310 nm takinginto account the snow density. DUFISSS has been used tomeasure the SSA of snow and the SAI of snowpacks in polarand Alpine regions.
Correspondence to:F. Domine([email protected])
1 Introduction
Snow is a porous medium that strongly impacts the energybudget of the Earth (Warren, 1982; Hall, 2004) and the chem-istry of the lower troposphere (Domine and Shepson, 2002;Grannas et al., 2007). An important physical property ofsnow that contributes to these impacts is its specific surfacearea (SSA). Snow SSA is defined as the surface area per unitmass (Legagneux et al., 2002), i.e. SSA=S/M=S/ρiceV ,whereS is the surface area of a given mass of snow particles,M its mass,V is the volume of the snow particles, andρice isthe density of ice (917 kg m−3 at 0◦C). SSA values range typ-ically from 2 m2 kg−1 for melt-freeze layers to 156 m2 kg−1
for fresh dendritic snow (Domine et al., 2007a).Light scattering by snow is determined by the size of the
snow grains. Grenfell and Warren (1999) showed that thehemispherical reflectance of non-spherical particles could bewell represented by a collection of independent spheres hav-ing the sameS/V ratio as the particles. In this case, theimportant variable to calculate scattering is the diameter ofthe spheres,deff, also called the effective grain size, which issimply related to SSA by:
SSA= 6/ρicedeff (1)
This demonstrates that SSA is a crucial variable to modelsnow optics, and therefore the energy budget of snow-covered surfaces. For example, using the DISORT radia-tive transfer model of Stamnes et al. (1988), we calculatedlight transmission through the troposphere and in the snow-pack, and found that a reduction in SSA of snow from 32to 16 m2 kg−1 at the summer solstice at noon, 65◦ N, causesan instantaneous forcing of 22 W m−2 at the tropopause, in-creasing column solar absorption by about 6.5%.
Published by Copernicus Publications on behalf of the European Geosciences Union.

168 J.-C. Gallet et al.: Measuring snow specific surface area by infrared reflectance
Because of its porous nature, the snowpack adsorbs largeamounts of volatile and semi-volatile chemical species. Inparticular the uptake of persistent organic pollutants (POPs)by the snowpack from the atmosphere has generated consid-erable interest (Daly and Wania, 2004; Herbert et al., 2005;Domine et al., 2007b; Burniston et al., 2007). If the surfacecoverage of a POP adsorbed on the surface of snow crystalsremains significantly less than a monolayer, its concentrationin snow, [POP]snow, can be expressed as a function of snowSSA, of the partial pressure of the POP,PPOP, and of temper-atureT , according to Domine et al. (2007b):
[POP]snow = PPOP× SSA/HPOP(T ) (2)
where HPOP(T ) is the surface Henry’s law constant atthe snow temperature, expressed in Pa m2 mol−1, while[POP]snow is in mol kg−1. The knowledge of SSA is there-fore essential to quantify POP concentrations in snow.
The chemical impact of snow is not limited to the adsorp-tion of species. Photochemical reactions also take place insnow. The photolysis of the nitrate ion in snow, resulting inthe emission of NO and NO2 to the atmosphere, has been thesubject of numerous studies (Honrath et al., 1999; Jones etal., 2001; Beine et al., 2002). If it is assumed that nitrate ionsare adsorbed on the surface of snow particles, a subject ofdebate (Beine et al., 2006; Jacobi and Hilker, 2007; Grannaset al., 2007) then the rate of nitrate photolysis also dependson snow SSA, as detailed in Domine et al. (2008).
Despite the importance of snow for both the energy budgetof the Earth, and therefore climate, and atmospheric chem-istry, and despite the fact that knowing snow SSA is crucial toevaluate quantitatively both aspects, very few data are avail-able on snow SSA. Furthermore, snow SSA changes withtime because of snow metamorphism (Flanner and Zender,2006; Taillandier et al., 2007), but many aspects of its rate ofchange are not elucidated. This is because up to recently, arapid and accurate method to measure snow SSA was lack-ing. This has impeded both the measurement of snow SSAin studies motivated by climate and chemistry issues, and thestudy of the rate of change of snow SSA in the field and dur-ing cold room experiments.
Snow grain size has long been used as a substitute for SSA(Gow, 1969), but given the variety of grain shapes, from den-dritic to rounded to hollow, the definition of grain size is am-biguous and observer-dependent (Aoki et al., 2000). Withthe example of hollow depth hoar crystals, Taillandier etal. (2007) have shown that effective grain size deduced fromSSA (Eq. 1) could differ by as much as a factor of 6 fromintuitive grain size, which demonstrates that using grain sizedata can lead to large errors when SSA is needed.
Most published SSA measurements to date have been ob-tained using methane adsorption at 77 K (Legagneux et al.,2002; Domine et al., 2007a). Briefly, snow placed in a vac-uum container is immersed in liquid nitrogen and the ad-sorption isotherm of methane on snow is measured, allow-
ing the determination of snow SSA. While this method isreliable and accurate, with a reproducibility of 6%, obtain-ing one value takes three hours and requires liquid nitrogen,a problem in field studies. Another method is stereology(Narita, 1971). Briefly, a snow block is filled with a water-insoluble liquid that freezes atT<0◦C to harden it. Polish-ing the sample produces serial sections (Perla et al., 1986)that are photographed. The images are then analyzed (Daviset al., 1987) to yield a SSA value after about four hours ofwork. This method is also well established, but does notwork well for fresh snow with high SSA, which cannot bemanipulated easily. The smaller structures are easily per-turbed by the liquid and by microtoming, and are often un-resolved by optical photography. Lastly, X-ray tomographycan also produce SSA values (Flin et al., 2003; Kerbrat et al.,2008; Kaempfer and Schneebeli, 2007) but this is not easyto use in the field and the resolution is currently insufficientif SSA>70 m2 kg−1 (Kerbrat et al., 2008), a value frequentlyexceeded in fresh snow.
Theory predicts that the spectral and hemispherical re-flectance of snow,Rs , (i.e. spectral albedo), depends onsnow grain size and therefore on snow SSA (Warren, 1982;Grenfell and Warren, 1999). By using the term “hemi-spherical reflectance”, we refer to the terminology recom-mended by Schaepman-Strub et al. (2006). Here hemispher-ical reflectance therefore means reflectance integrated over2π steradians, regardless of the geometry of the incident il-lumination. By measuring simultaneously the biconical re-flectance at several wavelengths and the SSA of snow sam-ples, Domine et al. (2006) have verified experimentally thatin the short wave infrared (SWIR, 1300 to 3000 nm), mostvariations in snow directional reflectance could be explainedby variations in snow SSA, in good agreement with theory.Theory also predicts that grain shape affects hemisphericalreflectance (Kokhanovsky, 2006; Picard et al., 2009) but thisappeared to be a second order effect in the study of Domineet al. (2006). Those authors also showed plots of biconi-cal reflectance versus SSA for several wavelengths between1310 and 2260 nm, and suggested that reflectance measure-ments in that range could be used for SSA determination.Matzl and Schneebeli (2006) used near infrared (NIR) re-flectance around 900 nm to determine SSA vertical profilesin a snow pit with a camera, the SSA–Rs calibration beingdone with stereological measurements. The interest of thatmethod is that it yields vertical SSA profiles rapidly. Painteret al. (2007a) also designed an optical system to rapidly mea-sure snow reflectance around the absorption line at 1030 nm,from which they deduced effective grain size, using the mod-eling approach of Nolin and Dozier (2000).
Both these latter techniques clearly have enormous poten-tial for stratigraphic studies, but they can be improved byoperating at longer wavelength. Reflectance is indeed lessdependent on SSA in the NIR than in the SWIR. Figure 1ashows the bihemispherical reflectance of semi-infinite snowlayers for four wavelengths: 900, 1030, 1310 and 1550 nm.
The Cryosphere, 3, 167–182, 2009 www.the-cryosphere.net/3/167/2009/

J.-C. Gallet et al.: Measuring snow specific surface area by infrared reflectance 169
Calculations were performed using DISORT under diffuselight conditions. The SSA-reflectance relationship is highlywavelength-dependent and Fig. 1a shows that a given changein SSA will produce a smaller change in albedo at 900 nmthan at longer wavelength. This is even more obvious inFig. 1b, where the derivative of the curve in Fig. 1a is plot-ted as a function of SSA. A given error in measured re-flectance translates into a larger error on SSA at 900 nm thanat 1030 nm and at 1310 nm. Figure 1b shows that for a givenprecision in reflectance measurement, deriving SSA from re-flectance will be about twice as accurate at 1030 nm than at900 nm, and three times more accurate at 1310 nm. Workingat 1550 nm further improves precision, but only for snows ofhigh SSAs.
Another advantage to work in the SWIR is that ice ab-sorption is greater (Warren and Brandt, 2008), so that theeffect of absorbing impurities such as mineral dust and sootdecreases as wavelength is increased for values 900, 1030,1310, 1550 nm. For example, we calculate with DISORT thatadding 500 ppb of soot particles (100 nm in diameter, density1800 kg m−3 and of optical properties 1.73077+i0.612288)to snow of SSA=30 m2 kg−1 changes its bihemispherical re-flectance from 0.850 to 0.827 at 900 nm, from 0.701 to 0.693at 1030 nm, from 0.483 to 0.481 at 1310 nm and remainedunchanged at 0.0475 at 1550 nm. By working at 1310 or1550 nm, we are therefore unaffected by any likely amount ofimpurities in snow. Indeed, soot concentrations in snow onlyrarely exceed 500 ppb (Flanner et al., 2007). Other impuri-ties such as soil dust can at times reach greater amounts, butthese are less absorbing than soot, and even concentrationsof several ppm have a negligible effect of snow reflectancebeyond 1000 nm (Painter et al., 2007b).
Figure 1 also shows that the accuracy decreases at higherSSA. For studies that focus on monitoring fresh snow SSA,it is therefore particularly useful to work at long wavelength.Moreover, since fresh snow SSA evolves rapidly (Cabaneset al., 2002 and 2003; Taillandier et al., 2007), this is wherethe exchange of energy and adsorbed species with the atmo-sphere will change the most rapidly, and there is therefore anenhanced need for an accurate determination of high snowSSA values.
Since snow is not a lambertian reflector, the reflectancesmeasured in many previous studies are not directly com-parable with the hemispherical reflectanceRs . Domine etal. (2006) measured biconical reflectance at a single configu-ration. The illumination came from the sun with a high solarzenith angle and nadir viewing. Painter et al. (2007a) alsomeasured biconical reflectances, with the source and the re-ceiver fixed at 23◦ and 35◦ zenith angles respectively. In thephotography technique of Matzl and Schneebeli (2006), theviewing angle was normal to the wall but the illuminationcame from the sun and clouds and was diffused by a clothlaid over the snowpit and by the 4 faces of the snowpits. Thecamera measured hemispherical-conical reflectances if the il-lumination was perfectly diffuse but in practice the illumina-
Fig. 1. (a)Relationship between snow specific surface area and bi-hemispherical reflectance, at four IR wavelengths, calculated withDISORT. (b) Sensitivity of the SSA determination to errors in bi-hemispherical reflectance at those wavelengths. For a given changein bihemispherical reflectancedRs , the change in SSA, dSSA, isgreater at 1030 nm than at 1310 nm, and even greater at 900 nm.For snow of SSA>110 m2 kg−1, the lowest sensitivity is obtainedat 1550 nm.
tion was dominantly downward and possibly heterogeneous(Matzl and Schneebeli, 2006).
These different optical configurations make intercompar-isons between the various systems used difficult at best.Moreover, each system requires its own calibration betweenreflectance and SSA. Furthermore, the non-lambertian char-acter of snow and its complex bi-directional reflection dis-tribution function (BRDF, Grenfell et al., 1994) imply thatbiconical reflectance may strongly depend on grain shape.Measuring the hemispherical instead of the biconical re-flectance is recommended to measure SSA accurately be-cause hemispherical reflectance is better related to the effec-tive diameter (equivalent to the SSA for optical purposes)than the biconical reflectance (Grenfell and Warren, 1999)and it is less affected by grain shape. The scaled integralapproach of Nolin and Dozier (1999) used by Painter etal. (2007a) is also probably less sensitive to grain shape thansingle band methods but it requires a spectrometer. In any
www.the-cryosphere.net/3/167/2009/ The Cryosphere, 3, 167–182, 2009

170 J.-C. Gallet et al.: Measuring snow specific surface area by infrared reflectance
Fig. 2. Schematic of the DUFISSS integrating sphere and compo-nents.
case, a stable and reproducible illumination is also importantfor the reproducibility of measurements, which excludes thesun as the illumination source.
We report here the development of a novel optical sys-tem (DUFISSS : DUal Frequency Integrating Sphere forSnow SSA measurements) to measure the hemispherical re-flectance of snow samples at 1310 and 1550 nm, the shorterwavelength being optimal for SSA<60 m2 kg−1 while thelonger one is more efficient for SSA>60 m2 kg−1. This newoptical system allows one SSA value to be determined in thefield in about one minute, and it successfully operates out-doors in polar conditions.
2 Experimental apparatus
The system used is shown in Fig. 2. Its main componentis a 15 cm inner diameter (i.d.) integration sphere fromSphere Optics made of Zenith®, a polymer with a nomi-nal reflectance near 0.985 in the SWIR. The snow sample isplaced in a black sample holder 63 mm i.d. and 13 or 25 mmdeep. The opening in the sphere towards the snow sampleis 38 mm in diameter. The snow is illuminated directly bythe collimated beam from a laser diode at 1310 or 1550 nm(both supplied by Mitsubishi, and of nominal power 6 mW).The beam diameter is about 10 mm at 1310 nm, as deter-mined using an IR visualization card. As reported in moredetail in Sect. 3, there is a detectable flux of photons thatdirectly hit the sphere, so that the actual beam diameter is>38 mm, even though it is more intense near the center. At1550 nm, we initially used a beam diameter of 4 mm, later in-creased to 8 mm. The beam diameter chosen is a compromisebetween illuminating a representative area and minimizingthe numbers of photons hitting directly the sphere. The out-
Fig. 3. Calibration curves used to determine snow hemisphericalreflectance from the photodiode signals. Graphite-doped Zenith®
reflectance standards were used. The curves are not linear becauseof the reillumination of the standards by their reflected light. Thefit to the points was made using Eq. (6), wheref=0.962 at 1310 nmandf=0.807 at 1550 nm.
side of the sphere in contact with the snow (Fig. 2) is black,with a reflectance of 3% in the SWIR. Light reflected by thesnow is collected by an InGaAs photodiode, whose currentis converted to voltage and amplified before measurementby a high precision voltmeter. Reflectance standards madeof graphite-doped Zenith®, calibrated by Sphere Optics, areused to determined the reflectance from the photodiode sig-nal. The calibration curve of the photodiode signal is shownin Fig. 3. It is not linear because the sample is re-illuminatedby multiple scattering between the sample and the sphere in-ner surface. The equation used to fit the calibration curveis described in more detail in Sect. 3. Calibration of the re-flectance signal to determine SSA was done by measuringsuccessively the snow reflectance, its SSA using methane ad-sorption, and its reflectance again to detect any change inSSA caused by manipulating the sample.
As mentioned above, crystal shape also affects hemispher-ical reflectance. Picard et al. (2008) modeled the reflectanceof snow crystals of different model shapes (spheres, cubes,cylinders, etc.) using a ray-tracing method at 1310 nm andobserved that for a given SSA, hemispherical reflectancecould vary within±25% by changing the crystal shape. Thiscontrasts with the experimental data of Domine et al. (2006)who however studied only 12 samples. To further investigatethis crucial issue, the snow samples that we used in the SSA-reflectance calibration therefore had a wide range of shapesand included highly faceted depth hoar, rounded grains, nee-dles and fresh dendrites.
Two aspects of the reproducibility of our reflectance mea-surements were determined. The first one was the repro-ducibility of the measurement of a given snow sample placedin a given sample holder. This was done by placing the sam-ple under the sphere, then removing it and replacing it aftera random rotation about a vertical axis. Relative variations
The Cryosphere, 3, 167–182, 2009 www.the-cryosphere.net/3/167/2009/

J.-C. Gallet et al.: Measuring snow specific surface area by infrared reflectance 171
of reflectance were within 0.3% at 1310 nm and 1.5% at1550 nm. The second one was to fill the sample holder withsnow from one layer sampled in the field in a large container,homogeneized by mixing, and taken to our cold room. Thesample-holder container was then emptied and refilled withnew snow from the same container. Heterogeneities in thesnow layer as well as variations in the way snow was ma-nipulated may then cause signal variations. In that secondcase, relative variations were within 1% at 1310 nm and 2%at 1550 nm, showing that our reflectance measurements arehighly reproducible.
The actual volume of the snow sample probed by the IRbeams must be evaluated. Theeffectivebeam diameter is un-certain, but we estimate it at 25 mm at 1310 nm. For snow ofSSA=35 m2 kg−1 and density=200 kg m−3, the snow thick-ness needed to obtain 99% of the reflectance at infinite thick-ness is 1.1 cm at 1310 nm, so that the effective sample vol-ume is estimated to be 5.4 cm3.
At 1550 nm, we estimate the effective beam diameterto be 20 mm. This longer wavelength was used to mea-sure high-SSA snow, so we calculate that for snow ofSSA=100 m2 kg−1 and density=50 kg m−3, the snow thick-ness needed to obtain 99% of the reflectance at infinite thick-ness is now 4.2 mm. The effective sample volume is then1.3 cm3.
As a comparison, the typical snow volume used to mea-sure SSA using methane adsorption is 50 cm3. These threenumbers are significantly greater than the minimal snow vol-umes correctly representing bulk snow properties, and whichare always less than 0.1 cm3 for seasonal snow (Coleou et al.,2001).
Given that reflectance measurements are sensitive to thesurface state of the sample, we devised a sampling proce-dure that minimized perturbation. A stainless steel cylin-der 63 mm i.d. (the same as the DUFISSS sample holder)equiped with a piston was used to sample a snow cylinder30 mm-high, as shown in Fig. 4. A sharp stainless steel spat-ula is then used to cut a perfectly flat surface at the base ofthe core while it is still inside the sampling cylinder. Thesnow core is then pushed into the DUFISSS sample holder,typically 25 mm deep. The 5 mm that stick out of the sampleholder are then shaved off with the sharp spatula, producinga flat and smooth surface. The only perturbation done to thesnow is therefore cutting a flat face with a spatula. With ourtechnique, the face is measured within seconds of cutting,so that any perturbation caused by exposition to warm air isminimized. This temperature aspect is crucial to study freshsnow having high SSA or any snow when the air temperatureis near 0◦C, as the presence of liquid water will of course re-duce the accuracy of our method in a manner that still needsto be quantified.
Difficulties to obtain a perfect surface were encountered inabout 20% of the cases, which required slight modificationsto the protocol, on a case by case basis. It is useful, however,to detail the procedure for hard windpacks. In that case, shav-
Fig. 4. Sampling device. A cylindrical snow core 30 mm thickhaving the exact diameter of the sample holder is taken. The core ispushed into the 25 mm deep sample holder with a piston. The extra5 mm are shaved of with a sharp spatula, providing a fresh surface.
ing off the extra 5 mm generated small particles that couldcause a relative increase in reflectance of 5%. The shavingwas then done placing the sample holder vertically and thesurface was brushed gently to remove loose small particles.For large depth hoar crystals, it was best to average severalsamples, as sometimes only a few crystals were probed bythe beam. The 1550 nm wavelength was only used for freshsnow, whose grains were only loosely bonded, so that no de-tectable effect of sampling was seen despite the short lightpenetration depth.
The SSA-reflectance calibration data at 1310 nm is shownin Fig. 5. While for SSA<66 m2 kg−1, the data show theexpected trend of Fig. 1, we see that for SSA>66 m2 kg−1,reflectance values show a lot of scatter and are much lowerthan expected from an extrapolation of the data at lower SSA:the maximum reflectance is 56.2%, obtained for a SSA of131.3 m2 kg−1, and that value is barely higher than 54.4%,obtained for a sample of SSA 65.3 m2 kg−1. Since all thesesnows with high SSAs also had a low density, we realizedthat the geometry of our system could produce artifacts oftwo kinds, shown in Fig. 6:
– The penetration depth of light can become sufficient inlow-density snow so that a significant amount of lightreaches the bottom of the black sample holder, whereit is absorbed. The optical depth of the snow sample isthen insufficient to consider the medium semi-infinite.Hence, the hemispherical reflectance measured by DU-FISSS is less than that of a semi-infinite sample (infi-nite optical depth) having the same SSA. This resultsin practice in an apparent dependence on snow density(hereafter: density artifact) that prevents SSA determi-nation. Initially, we used a 13 mm-deep sample holdersubsequently replaced with a 25 mm-deep one to reducethis artifact.
www.the-cryosphere.net/3/167/2009/ The Cryosphere, 3, 167–182, 2009

172 J.-C. Gallet et al.: Measuring snow specific surface area by infrared reflectance
Fig. 5. Calibration curve to determine snow specific surface areafrom hemispherical reflectance at 1310 nm measured with the in-tegration sphere. Specific surface area was measured by CH4 ad-sorption at 77 K. Hemispherical reflectance was obtained with snowsamples contained either in a 13 or a 25 mm deep sample holder.Reflectance was also calculated using the DISORT model, for25 mm thick snow samples of density 400 kg m−3, with ω=0.972and f=0.95, over a surface with 6% reflectance. For snow withSSA above 66 m2 kg−1, the scatter and deviation from DISORTcalculations are caused by the artifacts detailed in Fig. 6. The lineat SSA=60 m2 kg−1 indicates that above that line, snow usually hasa low density and the use of this calibration may lead to large errors.Below SSA=1 m2 kg−1, Mie theory breaks down and calculationsare not possible.
– Even if light does not reach the base of the sampleholder, light scattered by crystals at a depth z below thesnow surface will have an effective solid angle wherereflected light can escape from the cylindrical sampleholder that is lower than for a snow crystal located nearthe surface, where the effective solid angle is in prin-ciple 2π steradians. This creates an artifact (hereafter:geometric artifact) because 1) the reflectance standardsused for the calibration are unaffected by light penetra-tion whereas snow is affected and 2) it results in a slightunder-estimation of the reflectance that depends on theoptical depth, i.e. the snow density in our case.
Quantifying these effects and correcting them to obtain a cal-ibration curve that would be simple to use required modeling,detailed in Sect. 3. Another option that we pursued after be-coming aware of these artifacts was to use a wavelength witha reduced penetration depth. Given commercially availablediode lasers, we selected 1550 nm, and the relevant resultsare detailed in Sect. 4.
3 Reflectance modeling at 1310 nm
Our first modeling approach used the DISORT code ofStamnes et al. (1988) in conjunction with snow grain opticalproperties from Mie theory. This method approximates snowcrystals as disconnected spheres and models the reflection of
Fig. 6. Two artifacts detected in our system that lower snow re-flectance.(a) in low density snow, light penetrates sufficiently deepin the snow that it can reach the bottom of the sample holder, whereit is absorbed.(b) light scattered by reflectors below the surfacehas a reduced probability of escaping, because its field of view islimited by angleψ .
diffuse and directional light by a discrete number of snowlayers of finite thickness but infinite in the horizontal direc-tion. To compare our modeling approach to DUFISSS, weused nadir incoming radiation and worked in terms of fluxes.To compute hemispherical reflectance with DISORT, we use4 computational polar angles (i.e. streams) as recommendedin the documentation.
To reduce biases due to discretization and resonance ef-fects (e.g. Zender and Talamantes, 2006), we represent snowcrystals as a log-normal distribution of spheres. The re-flectance depends slightly on the exact distribution chosen.Since DISORT models disconnected spheres and not realsnow, perfect agreement between calculations and experi-ments is not expected. To optimize the agreement, we choseto adjust the size distribution and the ice optical constants.In all cases we used a log-normal distribution withσ=1.6,as observed in Antarctica by Grenfell and Warren (1999),and which resolves all sizes between 0.2 and 5reff, wherereff=3/(ρiceSSA) is the effective radius. At 1310 nm, theice optical constant used wasn1310=1.29584+i1.302×10−5,based on the compilation of Warren and Brandt (2008). Thereal part used is that of the compilation. For the imaginarypart, the compilation value is 1.310×10⁻⁵ at−7◦C but thereis a 2% experimental uncertainty and an unquantified temper-ature dependence, so our value is reasonable. At 1550 nm,the optical constant used wasn1550=1.2907+i4.586×10−4.The real part is that of Warren and Brandt (2008). For theimaginary part, Gosse et al. (1995) recommend 4.26×10⁻⁴
at−22◦C, with an error of 3% and a temperature dependenceof 0.6% K−1 (Warren and Brandt, 2008), so that our value iswithin the acceptable range. The effect of using modified op-tical constants is small. At 1310 nm, under the conditions ofour experimental setup, for snow with SSA=30 m2 kg−1 anddensity=400 kg m−3, the modified constants change hemi-spherical reflectance from 0.4049 to 0.4059. At 1550 nm, forsnow with SSA=100 m2 kg−1 and density=400 kg m−3, themodified constants change hemispherical reflectance from0.1028 to 0.0960.
The Cryosphere, 3, 167–182, 2009 www.the-cryosphere.net/3/167/2009/

J.-C. Gallet et al.: Measuring snow specific surface area by infrared reflectance 173
In our sphere, the illumination is mostly by direct lightwith normal incidence, but the snow is also illuminated bydiffuse light coming from all over the sphere surface. Sincehemispherical reflectance depends on the angle of incidence(and therefore on the diffuse/direct character of the illumina-tion), modeling the reflectance measured by DUFFISSS re-quires the estimation of the amount of diffuse light hitting thesnow. The photon distribution in an ideal integrating sphereevolves as a Markov process (Pickering et al., 1993). Weadapted the simple yet accurate Markov model presented andevaluated in Hidovic-Rowe et al. (2006) to our experimentalgeometry. The model needs to assume that the snow sur-face is flat and Lambertian, an approximation whose impactis delicate to evaluate. It also accounts for the optical bafflewhich blocks the detector from specular reflection (Fig. 2).Hidovic-Rowe et al. (2006, their Sect. 2) show how to ex-press the diffuse downwelling radiationf ↓
d as a fraction of
the incident direct beam. Applying their recipe forf ↓
d toour detector configuration (flat sample with baffle occludingspecular reflectance), we obtain:
f↓
d =rωαs
1 − (s + d)− ωα {1 − [d + (1 − r) s]}(3)
wherer is the snow hemispherical reflectance to direct nor-mal radiation, andω andr are the hemispherical reflectancesof the sphere wall and the snow to isotropic illumination,respectively. The remaining parameters are the normalizedsurface areas of the photodiode (d=0.000145), snow sample(s=0.015877), and laser diode (h=0.002336). The reflectivesphere wall area (α=0.981642) is determined by the normal-ization conditionα+d+h+s=1.
We observed, however, that the signal was higher than ex-pected in the absence of a sample indicating that the beamcollimation was not perfect and that some photons hit thesphere walls directly. Correcting Eq. (3) to account for emis-sion fractionsf and 1−f initially striking the sample (colli-mated photons) and the sphere walls (stray photons), respec-tively, yields
f↓
d = ωsf rα +
{1 − f
}[1 − (s + d)]
1 − (s + d)− ωα {1 − [d + (1 − r) s]}(4)
The theoretical signal,m, expected to be measured at thephotodiode is :
m = ωdf rα +
{1 − f
}[1 − (s + d)]
1 − (s + d)− ωα {1 − [d + (1 − r) s]}(5)
In practice, the gain of the electronics,G, and an offset,A,caused by electronic or optical noise has been added so thatthe actual signalmreal, is:
mreal = Gm+ A (6)
Equation (6) was used to fit the calibration curves of Fig. 3.According to the manufacturer, reflectance standards are
Fig. 7. Difference in reflectance at 1310 nm, for given SSA val-ues, between the calculations by DISORT and our measured value.DISORT uses snow with a density of 400 kg m−3. The system-atically lower value of our measurement for SSA>66 m2 kg−1 ap-pears clearly. The lowest point on the graph, at SSA=12.6 m2 kg−1,was a melt-freeze crust with a rough surface that affected the mea-surement quality.
lambertian so we user=r in Eq. (5) for the standards. Fit-ting the curve yielded the values forω, f ,G andA. We usedtwo different integrating spheres and foundω1310=0.972and ω1550=0.965 for the first one, andω1310=0.986 andω1550=0.978 for the other. The fitted calibration curves werethen used to determine the reflectance of the snow samplesfrom the photodiode signal.
Figure 5 also shows a SSA-Reflectance theoretical curvecalculated for lighting conditions prevailing in the sphere,using DISORT to calculater and r and Eq. (4) to accountfor diffuse light reflected by the snow. We used a horizon-tally infinite 25 mm-thick snow layer of density 400 kg m−3
(i.e. dense and deep enough to consider the medium semi-infinite), made of disconnected spheres. For this theoreti-cal curve, done for our first sphere, we usedω1310=0.972and f=0.95. The value off in fact has little impact onthe calculated reflectance at 1310 nm. For example, forSSA=40 m2 kg−1, reflectance is 46.081% forf=0.9 and45.807% forf=1. However, the value ofω has a notice-able impact. Changingω from 0.972 to 0.986 produced arelative increase in reflectance for a given SSA of about 5%.The theoretical calibration to use therefore depends on thesphere and diode properties and has to be recalculated usingDISORT for every system. Our combined SSA-reflectancemeasurements of Fig. 5 allowed the determination of the ad-equate optical parameters and size distribution to use.
Figure 7 shows quantitatively the difference betweencalculated and measured hemispherical reflectances, forthe SSA values obtained by CH4 adsorption. ForSSA<66 m2 kg−1, the data are reproduced fairly well. Thereis scatter of±10% for a number of points with SSA around20 m2 kg−1. It is tempting to attribute this difference to grainshape as several theoretical studies show that it influences
www.the-cryosphere.net/3/167/2009/ The Cryosphere, 3, 167–182, 2009

174 J.-C. Gallet et al.: Measuring snow specific surface area by infrared reflectance
Fig. 8. Calibration curve to determine snow specific surface areafrom hemispherical reflectance at 1550 nm measured with DU-FISSS. Specific surface area was measured by CH4 adsorption at77 K. Hemispherical reflectance was obtained with snow samplescontained in a 25 mm deep sample holder. Hemispherical re-flectance was also calculated using the DISORT model, for 25 mmthick snow samples of density 400 kg m−3, over a surface with 6%reflectance. Measurements and calculations were performed for3 values off .
reflectance (Picard et al., 2009, and references therein).However, some of these points were obtained from sampleswith rounded grains, while others were from depth hoar, andfor the moment we have not detected experimentally any cor-relation between grain shape and reflectance. These low-SSA samples all had large grains, and it was difficult to ob-tain a smooth sample surface. Some surfaces had hollows,while others had grains sticking out of the surface despiteprecautions taken to smooth the surface. Given the geomet-ric artifact discussed above, it is clear that this affected re-flectance, and we suggest that this uneven sample surfaceis the main reason for the difference between experimentand theory. In Fig. 7, a cluster of points with SSA around60 m2 kg−1 shows excellent agreement between theory andexperiment, because the grains were much smaller and it waseasier to obtain a smooth surface.
For SSA>66 m2 kg−1, the calculated reflectance is sys-tematically greater than the measured value, and the dif-ference is about 16% for SSA>75 m2 kg−1. We made de-tailed investigations to test whether these differences couldbe explained by density or geometric artifacts (Fig. 6). Wealso adapted the SNOWRAT ray-tracing model of Picard etal. (2009) to the configuration of DUFISSS. These investi-gations are detailed in the appendix. The conclusion is thatsnow of high SSA always has a low density, with the resultthat the optical depth will rarely be sufficient to avoid arti-facts. Corrections are in principle possible, but these causelarge uncertainties. We were therefore led to the inescapableconclusion that our integration sphere with illumination at1310 nm is not adapted to the measurement of the SSA of
low-density high-SSA snow. For such snows, large opticaldepth can only be reached by using much deeper sampleholder or by chosing a wavelength with a greater absorptionthan 1310 nm. We propose a method based on this secondoption.
4 Determination of high SSA values from hemisphericalreflectance at 1550 nm
The ice absorption band around 1500 nm is stronger than thataround 1300 nm and is a good candidate to avoid the densityand geometric artifacts in low density snow. If however ab-sorption is too large, the reflectance signal will be too low, re-ducing accuracy. Given commercially available laser diodes,the best compromise that we found was to use 1550 nm radi-ation.
Figure 8 shows the SSA-reflectance calibration data at1550 nm. As before, the reflectance at 1550 nm (and alsoat 1310 nm) was measured, followed by a SSA measurementusing CH4 adsorption at 77 K, and by a second reflectancemeasurement. Only snow samples with high SSAs were se-lected for these measurements. These were necessarily freshor very recent snow samples that therefore had low densities.Figure 8 also shows calculations using DISORT, without ge-ometric corrections, usingω1550=0.965. At 1550 nm, cal-culated reflectances were found to show a significant depen-dence onf . This is probably because at 1550 nm snow hemi-spherical reflectance more strongly depends on the angle ofincidence than at 1310 nm. Figure 8 therefore shows threecurves for thef values corresponding to those used in the ex-periments. For SSAs in the range 58–93 m2 kg−1, with den-sities in the range 35–178 kg m−3, our experimental pointscoincide well with the predictions of DISORT and in par-ticular the data points obtained withf=0.81 tend to show ahigher reflectance than those obtained withf=0.94. How-ever, for the five samples whose SSAs fall in the range 107–131 m2 kg−1, with densities in the range 33–41 kg m−3, mea-sured reflectances are slightly lower than calculated by DIS-ORT.
It is essential to test whether these differences are simplydue to experimental error or whether they are an artifact ofthe very low snow density even at 1550 nm. Modeling testsusing DISORT and SNOWRAT led to the conclusion that,with the available data, the deviation of the calibration pointsfrom theory at very high SSA, shown in Fig. 8, is not causedby an artifact. Details of the supporting calculations are re-ported in the appendix. We therefore conclude that it is dueto experimental error. Indeed, random errors of 5 to 10%can explain the observed difference between calculations andmeasurements. Additional data points would be desirable,but opportunities to sample snow with such high SSAs arefew.
The Cryosphere, 3, 167–182, 2009 www.the-cryosphere.net/3/167/2009/

J.-C. Gallet et al.: Measuring snow specific surface area by infrared reflectance 175
5 Recommendations to determine SSA fromhemispherical reflectance
The above experimental and modeling data, including thosein the appendix, indicate that snow SSA can be determinedrapidly and accurately in the laboratory or in the field usingDUFISSS and the following recommendations.
5.1 Recommendation for snow with SSA<60 m2 kg−1
For snow with SSA<60 m2 kg−1, we recommend the use of1310 nm radiation. The first step is to determine the signal-to-reflectance relationship as in Fig. 3. This curve is used todetermine the reflectance of the sphere wallω, the diode col-limation f , and the gainG and offsetA defined in Eq. (6).To determine these four parameters, we recommend the useof at least six standards. We emphasize the importance ofusing one high-reflectance standard to obtain a robust deter-mination of the parameters.
The next step is to use the reflectance-to-SSA relationshipcalculated using DISORT, Eqs. (4) to (5), the optical param-eters and the size distribution given in section 3.1. The DIS-ORT curve of Fig. 5, can be used forω=0.972,f between0.9 and 1, and for snow densitiesρ>200 kg m−3. To facili-tate the use of Fig. 5, we propose the following polynomialfit, with SSA in m2 kg−1 and hemispherical reflectanceRs in%:
SSA = 1.739× 10⁻⁷R5s − 1.633× 10⁻⁵R4
s + 8.166×
10−4R3s − 0.01081R2
s + 0.4508Rs + 0.03519 (7)
Even though we recommend Eq. (7) for SSA<60 m2 kg−1,we are fairly confident that it can be used in the range1<SSA<66 m2 kg−1, as suggested by Fig. 5. For the sameSSA range, but for 50<ρ<200 kg m−3, we recommend tak-ing into account the effect of density,ρ. To derive an em-pirical equation that takes into account density, we usedSNOWRAT simulations detailed in the appendix. Fromthose data, we propose to replace the measured reflectanceRs with a corrected valueRs,corr :
Rs,corr =Rs(2000+ 0.986ρ2.25)
ρ2.25(8)
and to useRs,corr in Eq. (7) to obtain the SSA. Equation (8)has no theoretical basis, it is purely empirical and its onlymerit and purpose are to reproduce our data and calculations.Many other forms of equations could be proposed, all withthe same arbitrary character.
The error on SSA can be evaluated. The reflectance stan-dards have an absolute accuracy of 0.6%, determined bythe manufacturer. An individual SSA measurement usingCH4 adsorption has a random error of 6% (Legagneux et al.,2002). The relevant part of the calibration curve in Fig. 3uses 34 points, and we estimate that the error done by using
this calibration is 4%. The random error of one reflectancemeasurement is 1%, as detailed in Sect. 2. Despite the factthat we could not detect any significant effect of snow crys-tal shape on reflectance, there is a clear possibility that thiseffect does exist, and we estimate that it may produce an er-ror of 3% on SSA. The use of Eqs. (7) and (8) produce anerror which is less than 1% in all cases. At 1310 nm, the er-ror caused by variations inf is considered negligible, iffremains between 0.9 and 1. The total random error in SSAdetermination is therefore 8 %. This estimate may seem opti-mistic in view of Fig. 7. However, a lot of the outlying pointswere obtained at an early stage of our work, before we hadfully realized the impact of the state of the sample surfaceon reflectance, especially for samples with large grains. Sub-sequent measurements averaged a larger number of samples,reducing the random error.
The main systematic error is that of the CH4 adsorptionmethod. Legagneux et al. (2002) estimated it at 10%, lead-ing to an overall error of 12%. However, Kerbrat et al. (2008)showed that the CH4 adsorption method gave results within3% of X-ray tomography, so that it is reasonable to suggestthat the systematic error due to CH4 adsorption is 5% or less.In that case, combining a random error of 8% and a system-atic error of 5%, we conclude that the uncertainty of SSAdetermination using IR hemispherical reflectance at 1310 nmunder the current conditions is 10%.
As discussed in Sect. 3.1, SSA determination is also af-fected by the value ofω, the reflectance of the sphere wall.For a given sphere, the determination ofω by curve fittingsis sufficiently accurate that we neglect uncertainties onω.However, different spheres have differentω values, whichneeds to be taken into account when calculating the adequatecalibration curve. Sensitivity studies using DISORT indicatethat, as a rule of thumb, using a value ofω that is too low by0.003 will cause the SSA to be overestimated by 1%. For oursecond sphere, we calculated using DISORT the theoreticalcurve forω=0.986 andf=0.85. Both factors contribute toa greater fraction of diffuse lightf ↓
d , as dictated by Eq. (4)so that the measured reflectance of snow samples increased.The new equation was:
SSA= 2.959× 10⁻⁷R5s − 3.789× 10⁻⁵R4
s + 2.229×
10−3R3s − 0.05498R2
s + 1.073Rs − 3.412 (9)
And the SSA values obtained are about 6% lower than ifEq. (7) were used. Therefore, large changes in sphere prop-erties, if uncorrected, only lead to moderate changes in SSAso that the method can be considered robust.
5.2 Recommendation for snow with SSA>60 m2 kg−1
For snow with SSA>60 m2 kg−1, we recommend the use of1550 nm radiation and the DISORT curves of Fig. 8, which
www.the-cryosphere.net/3/167/2009/ The Cryosphere, 3, 167–182, 2009

176 J.-C. Gallet et al.: Measuring snow specific surface area by infrared reflectance
shows that the beam collimation that determinesf notice-ably affects the location of the curve. We recommend to col-limate the beam to obtain about an 8 mm spot on the snowin order to illuminate a representative surface. With our1550 nm Mitsubishi laser diode,f is then close to 0.87. Tofacilitate the use of Fig. 8, we propose the following poly-nomial fit, valid for 50<SSA<160 m2 kg−1, with SSA inm2 kg−1 andRs in %:
SSA= 0.07637R2s + 8.480Rs + 11.55 (10)
The error on this determination can be evaluated as above.Assuming thatf=0.87, the error in the calibration curve ishere estimated to be 5% because of the lower number of datapoints than at 1310 nm. The random error due to reflectancemeasurement is 2%, and the error due to crystal shape isagain 3%, leading to a random error of 10%. Using an es-timate of systematic error of 5%, we evaluate the accuracy ofSSA measurement using reflectance at 1550 nm to be 12%.
For the sake of completeness, we mention here the poly-nomial fit whenf=0.94:
SSA= 0.07320R2s + 8.636Rs + 11.78 (11)
and forf=0.81:
SSA= 0.07923R2s + 8.335Rs + 11.34 (12)
Implicitly, the 60 m2 kg−1 threshold suggests that the SSAof the snow must be evaluated before the measurement ismade. This requirement is somewhat relaxed because bothranges overlap over the 50–66 m2 kg−1 range. Moreover, inpractice, a moderate amount of training and experience by acareful observer is sufficient to allow the visual estimation ofSSA within about 20%. This was tested a number of timesby writing down field estimates, subsequently compared tomeasurements.
6 Determination of snow SSA in the field usingDUFISSS
We have used DUFISSS many times in Alpine, Arctic andAntarctic environments. DUFISSS can easily be used tomeasure the SSA of surface snow, and to obtain the verticalSSA profile of a snow cover. In general, once the stratigraphyhas been observed and the instrument is in place, the SSAvalues of 10 to 20 layers can be measured in less than 30 minby two people. One person samples the snow as shown inFig. 4, weighs the filled sample holder to measure the snowdensity, and hands it over to the other person who measuresreflectance. Meanwhile, the first person fills a second identi-cal sample holder.
Such measurements allow the determination of the snowarea index (SAI) of snowpacks. The SAI has been definedby Taillandier et al. (2006), by analogy to the leaf area index
(LAI) as the vertically integrated surface area of the snow-pack. It is expressed in m2 of snow surface area per m2 ofground, and is therefore a dimensionless variable. It is com-puted as:
SAIsnowpack=∑i
SSAihiρi (13)
with h the height of layeri andρi its density. Layers thick-nesses are obtained from stratigraphic observations, densityis obtained from the sample preparation and SSA is obtainedwith DUFISSS.
7 Conclusions
DUFISSS allows the rapid determination of snow SSA in thefield with an accuracy better than 12%. The principle, tech-nology and use of DUFISSS are simple, making it a usefultool for chemical, climate, and snow physics research. Asstated in the introduction, it can be used to study atmosphere-snow exchanges of chemicals (Burniston et al., 2007), es-pecially right after snow falls, when SSA decreases rapidly.Hopefully it can also be used to help relate changes in snowradiative properties to snow physical properties, in particularin remote sensing studies. This may not be simple, however,because radiative properties measured in the field or derivedfrom satellites are usually directional, not hemispherical, andcomplex BRDF considerations may be necessary. New ap-proaches however appear promising (Zege et al., 2008). Fi-nally, this rapid method will be beneficial for the study ofsnow physics, and in particular the understanding of the fac-tors affecting the rate of SSA changes, because in the pastthis has been limited by the small amount of data that couldbe obtained by CH4 adsorption (Taillandier et al., 2007).
This method complements those of Matzl and Schnee-beli (2006) and of Painter et al. (2007a). Both those meth-ods are excellent to obtain the detailed stratigraphy of snow-packs, while our method is not designed for that useful pur-pose. On the other hand, and as detailed in the introduc-tion, DUFISSS operates at longer wavelengths than boththese previous methods, and as shown in Fig. 1, more ac-curate SSA determinations can in principle be obtained, es-pecially for high SSA snows. In summary, an ideal snowstratigraphic study will use the high resolution stratigraphicimaging proposed by those other authors, and the SSA mea-surement method proposed here.
Appendix A
The comparison between experimental hemispherical re-flectance data and modeling using DISORT at 1310 nm isdetailed in Sect. 3 and in Fig. 5. A good agreement isobserved for snows with SSA<66 m2 kg−1, but deviationsare observed for snows with higher SSAs. In particular, ifSSA>75 m2 kg−1, deviations up to 24% are observed. This
The Cryosphere, 3, 167–182, 2009 www.the-cryosphere.net/3/167/2009/

J.-C. Gallet et al.: Measuring snow specific surface area by infrared reflectance 177
Table A1. Hemispherical reflectances at 1310 nm of experimental snow samples with high SSA and low density, compared to calcula-tions using DISORT that test the effect of density, and to calculations that account for the geometric artifact.f=0.95 was used in all thecalculations.
Measured SSA,m2 kg−1
Measureddensitykg m−3
Sample holderdepth, mm
Measuredreflectance,%
Calculatedreflectance%, actualdensity
Calculatedreflectance %,density=400kg m−3
Reflectancewith actualdensity andgeometricartifact, %
131.3 35 25 52.2 65.21 66.05 60.89112.7 36 25 53.1 62.60 63.69 58.08108.6 35 25 49.5 61.89 63.23 57.1697.7 109 13 53.7 61.26 61.48 59.5777.3 169 13 53.0 57.64 57.68 55.30
appendix reports the tests that were made to identify thecauses of this disagreement and the attempts to correct forthem.
A1 Modeling using DISORT at 1310 nm
To test whether the finite optical depth of the sample ow-ing to the low density of some samples could explainthe gap between our theoretical curve and the data forSSA>75 m2 kg−1 we calculated with DISORT the hemi-spherical reflectance of these 25 mm deep samples 1) us-ing their measured densities and 2) using a density of400 kg m−3, large enough to ensure that no significant radi-ation reached the bottom of the sample. Table A1 comparesthe experimental data to calculations. Comparison of bothcalculated values for each sample show that the reflectancewith actual density is no more than 1% lower than that of asemi-inifinite medium. This shows that the gap between theexperimental points with SSA>75 m2 kg−1 and the theoreti-cal curve of Fig. 5 cannot be explained by the density artifactalone.
To assess the contribution of the geometric artifact to themeasured reflectanceRs , we modeledRs as the sum (overall snow layers) of the product of two independent terms foreach layer: the mean field-of-view (FOV, measured in hemi-spheres) subtended, and the reflectance contributionRk pre-dicted by plane-parallel radiative transfer theory. We approx-imated the geometric correction due to finite horizontal andvertical sample dimensions as Eq. (A1), the sum of layer-dependent geometric factors (FOVk) times the correspond-ing plane-parallel layer reflectance contribution (Ak). Thesefactors are intuitive and predictable for all wavelengths withstandard methods.
Rs =
∑k
FOVkRK (A1)
The snow was discretized on a 32-layer vertical grid stretch-ing in layer thicknesses from 10µm near the top to 2.5 mm
near the bottom. On this grid, no layer contributes more than10% toRs . For each layer, we calculated the mean solid an-gle of the integrating sphere subtended by each snow layer.Snow farther from the central axis of the sample containersubtends a smaller planar angleψ of the aperture (Fig. 6b),and occupies a greater relative surface area than snow nearerthe central axis. The average layer FOV is estimated as thesurface-area mean FOV of all snow extending out to the ra-dius of illumination. Note that the FOV determined in thisway is geometric only; it does not account for attenuationand scattering. The FOV of diffusely illuminated snow de-creases from 1.0 to 0.43 to 0.2 hemispheres (1 hemisphere isa solid angle of 2π steradian) as snow depth increases from0 to 13 to 25 mm. The FOV depends on whether the beamis collimated or whether illumination is diffuse. At 25 mmdepth, the mean FOV for snow illuminated by the collimatedbeam (∼10 mm diameter) exceeds that of snow diffusely il-luminated across the entire aperture by about 6%.
The plane-parallel prediction of each layer’s contributionto reflectanceRk was constructed by applying the addingmethod to the delta-Eddington approximation of snow sam-ple optical properties. After first discretizing the (presum-ably) homogeneous snow sample into 32 layers, the proce-dure of Coakley et al. (1983) was used to determine and addthe optical properties for each layer. We treat the sampleholder bottom as an additional layer with reflectance 6% andtransmittance 0% in order to determine its contribution to re-flectance. At 1310 nm, the measured snow reflectance in the13 mm sample holder is within about 2.5% of the reflectanceof a semi-infinite layer,A∞, of bright snow of low den-sity (50 kg m−3, SSA=100 m2 kg−1). For the 25 mm sampleholder, or for fresh snow of higher density (>100 kg m−3),Rs deviates fromR∞ by <0.1%. We estimate that the ab-sorbing lower boundary reduces the measured reflectance ofthe samples in Table A1 by less than 1% from their semi-infinite value. The geometric correction (Eq. A1) results inrelative reduction of the plane-parallel modeled reflectanceRs for the samples shown in Table A1 by 6.6%, 7.2%, 7.6%,
www.the-cryosphere.net/3/167/2009/ The Cryosphere, 3, 167–182, 2009

178 J.-C. Gallet et al.: Measuring snow specific surface area by infrared reflectance944
945
946
947 948 949 950 951 952 953 954
60
70
80
90
100
110
120
130
140
35 40 45 50 55 60 65 70Reflectance 1310 nm, %
SSA
, m
2 kg-1
MeasurementDISORTDISORT + correctionSNOWRATSérie4Série5Série6Série7
35
3336
169
3886
109
4135
80
90
100
110
120
130
140
7 8 9 10 11 12 13 14Reflectance 1550 nm, %
SSA
, m
2 kg-1
ExperimentalDISORTDISORT + correctionSNOWRATSérie4Série6Série7Série8
35
3633
38
86
41
35
Figure A1. Hemispherical reflectance at 1310 nm (left) and 1550 nm (right) of snow samples
whose SSA was measured using CH4 adsorption at 77 K. Three methods were used to
obtain hemispherical reflectance: measurement with the integration sphere, calculation using
DISORT with geometric corrections using eq. (A1), and the ray-tracing model SNOWRAT.
For each snow sample, there are therefore 3 reflectance values, some of which are
connected by blue lines for clarity. The numbers next to each measured value is the mean
density of the snow sample in the sample holder, in kg m-3. (Left) The SSA-Reflectance
relationship using DISORT without correction, for snow of density 400 kg m-3 and with
f& =0.95, is also shown. (Right) The SSA-Reflectance relationship using DISORT without
correction, with
955
f& =0.94, is also shown. 956
37
Fig. A1. Hemispherical reflectance at 1310 nm (left) and 1550 nm (right) of snow samples whose SSA was measured using CH4 adsorptionat 77 K. Three methods were used to obtain hemispherical reflectance: measurement with the integration sphere, calculation using DISORTwith geometric corrections using Eq. (A1), and the ray-tracing model SNOWRAT. For each snow sample, there are therefore 3 reflectancevalues, some of which are connected by blue lines for clarity. The numbers next to each measured value is the mean density of the snowsample in the sample holder, in kg m−3. (Left) The SSA-Reflectance relationship using DISORT without correction, for snow of density400 kg m−3 and withf=0.95, is also shown. (Right) The SSA-Reflectance relationship using DISORT without correction, withf=0.94, isalso shown.
957
958
959
960
961 962 963
Figure A2. Left: depth hoar crystal, showing the coexistence of faceted and rounded shapes.
Right: melt-freeze crust, showing faceted shapes, even though melt-freeze crusts are often
thought to consist only of rounded shapes. Scale bars : 1 mm.
38
Fig. A2. Left: depth hoar crystal, showing the coexistence offaceted and rounded shapes. Right: melt-freeze crust, showingfaceted shapes, even though melt-freeze crusts are often thought toconsist only of rounded shapes. Scale bars: 1 mm.
2.8%, and 4.1%, respectively. Hence this geometric cor-rection reduces the bias between the measured and plane-parallel modeled reflectances in Table A1 by 25–50%. Atthe same time, the geometric correction reducesRs by lessthan∼1% for denser snow (>200 kg m−3) with moderatelyhigh SSA (∼66 m2 kg−1).
Figure A1a shows that for those low-density samples withSSA>66 m2 kg−1, these corrections only account for lessthan half of the difference between the reflectance valuesmeasured and those calculated by DISORT for a 25 mm-thicksnow layer of density 400 kg m−3. We believe that this is be-cause our corrections and DISORT cannot take into accountthe complex path taken by rays of light in the sample. Ourcorrection method hypothesizes that if a given areal fractionof a given snow layer is illuminated, the fraction of scatteredlight that will escape the sample can be predicted by simplegeometric considerations. However, the three-dimensionalsample geometry causes edge effects that are not captured bythe one-dimensional multiple scattering algorithm (DISORT)
or by our geometric corrections. We conclude that plane-parallel optical models, even with corrections, are inade-quate for quantitative treatment of bright, low-density snowreflectance in DUFISSS.
A2 Modeling using a ray-tracing model at 1310 nm
The other approach pursued was to use the ray-tracingmethod of Picard et al. (2009) to obtain theoretical calibra-tion curves for various snow densities. Picard et al. (2009)showed that snow hemispherical reflectance was highly de-pendent on crystal shape. For example, for a given SSA,the reflectance of cubes was 27% greater than that of dis-connected spheres, as used in DISORT. However, for SSAslower than 66 m2 kg−1, this large dependence is not repro-duced by our data, which do not show much scatter aroundthe DISORT theoretical curve, calculated using disconnectedspheres (Fig. 5). We suggest that this is due to the fact thatnatural snow always contains a mixture of a wide range ofshapes. Indeed, except perhaps for surface hoar, snow isnever formed of only faceted crystals. This is because facetedshapes are caused by rapid growth, which is fed by the sub-limation of other crystals, and sublimation always producesrounded shapes (Nelson, 1998). Figure A2 shows a depthhoar crystal, with the obvious and typical coexistence of bothfaceted and rounded shapes. Likewise, snow is rarely if everformed of only rounded shapes. Melt-freeze crusts are gen-erally thought to consist only of rounded shapes. However,Fig. A2 also shows a melt-freeze crust, and although roundedshapes predominate, faceted forms are commonly found. Wespeculate that these could be formed either in localized envi-ronments where latent heat release produced large water va-por fluxes or because these melt-freeze crusts were subjectedto strong transient temperature gradients that produced rapidgrowth after the melting event. Snow subjected to perfectly
The Cryosphere, 3, 167–182, 2009 www.the-cryosphere.net/3/167/2009/
J.-C. Gallet et al.: Measuring snow specific surface area by infrared reflectance 179
964
965
966 967 968 969 970 971 972 973 974 975 976
977
Figure A3. Effect of snow density on hemispherical reflectance as calculated by SNOWRAT
for our integration sphere. (a) With illlumination at 1310 nm for low-density snows of
SSA=110 m2 kg-1. The measured hemispherical reflectance of a snow sample of the same
SSA is also shown. (b) At 1310 nm, for snows of moderate densities and of SSA=28 m2 kg-1.
The measured hemispherical reflectance of a snow sample of SSA=28.1 m2 kg-1 is also
shown. (c) At 1310 nm for snows of low to moderate densities and with SSA= 60 m2 kg-1. The
measured hemispherical reflectances of snow samples having SSAs in the range 57-63 m2
kg-1 are also shown. (d) At 1550 nm for low-density snows of SSA=110 m2 kg-1. The
measured hemispherical reflectance of a snow sample of the same SSA is also shown. In all
four panels, SNOWRAT simulates the snow with disconnected spheres. The curves are not
perfectly smooth because of numerical noise.
39
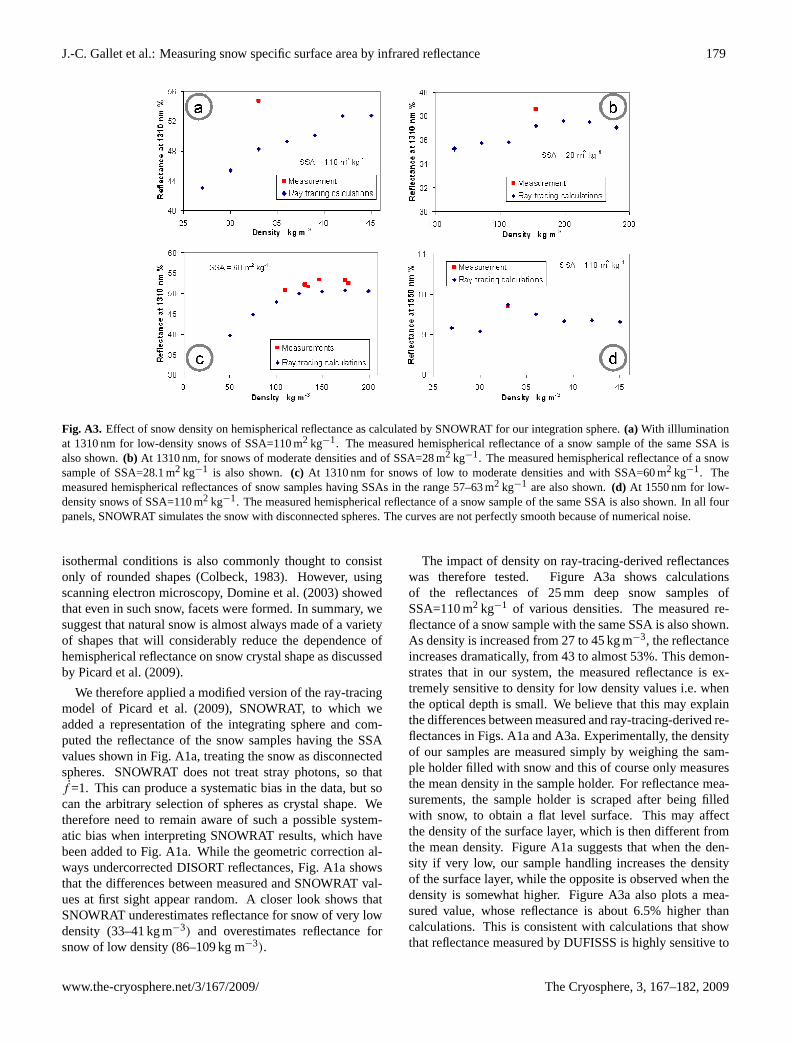
Fig. A3. Effect of snow density on hemispherical reflectance as calculated by SNOWRAT for our integration sphere.(a) With illluminationat 1310 nm for low-density snows of SSA=110 m2 kg−1. The measured hemispherical reflectance of a snow sample of the same SSA isalso shown.(b) At 1310 nm, for snows of moderate densities and of SSA=28 m2 kg−1. The measured hemispherical reflectance of a snowsample of SSA=28.1 m2 kg−1 is also shown.(c) At 1310 nm for snows of low to moderate densities and with SSA=60 m2 kg−1. Themeasured hemispherical reflectances of snow samples having SSAs in the range 57–63 m2 kg−1 are also shown.(d) At 1550 nm for low-density snows of SSA=110 m2 kg−1. The measured hemispherical reflectance of a snow sample of the same SSA is also shown. In all fourpanels, SNOWRAT simulates the snow with disconnected spheres. The curves are not perfectly smooth because of numerical noise.
isothermal conditions is also commonly thought to consistonly of rounded shapes (Colbeck, 1983). However, usingscanning electron microscopy, Domine et al. (2003) showedthat even in such snow, facets were formed. In summary, wesuggest that natural snow is almost always made of a varietyof shapes that will considerably reduce the dependence ofhemispherical reflectance on snow crystal shape as discussedby Picard et al. (2009).
We therefore applied a modified version of the ray-tracingmodel of Picard et al. (2009), SNOWRAT, to which weadded a representation of the integrating sphere and com-puted the reflectance of the snow samples having the SSAvalues shown in Fig. A1a, treating the snow as disconnectedspheres. SNOWRAT does not treat stray photons, so thatf=1. This can produce a systematic bias in the data, but socan the arbitrary selection of spheres as crystal shape. Wetherefore need to remain aware of such a possible system-atic bias when interpreting SNOWRAT results, which havebeen added to Fig. A1a. While the geometric correction al-ways undercorrected DISORT reflectances, Fig. A1a showsthat the differences between measured and SNOWRAT val-ues at first sight appear random. A closer look shows thatSNOWRAT underestimates reflectance for snow of very lowdensity (33–41 kg m−3) and overestimates reflectance forsnow of low density (86–109 kg m−3).
The impact of density on ray-tracing-derived reflectanceswas therefore tested. Figure A3a shows calculationsof the reflectances of 25 mm deep snow samples ofSSA=110 m2 kg−1 of various densities. The measured re-flectance of a snow sample with the same SSA is also shown.As density is increased from 27 to 45 kg m−3, the reflectanceincreases dramatically, from 43 to almost 53%. This demon-strates that in our system, the measured reflectance is ex-tremely sensitive to density for low density values i.e. whenthe optical depth is small. We believe that this may explainthe differences between measured and ray-tracing-derived re-flectances in Figs. A1a and A3a. Experimentally, the densityof our samples are measured simply by weighing the sam-ple holder filled with snow and this of course only measuresthe mean density in the sample holder. For reflectance mea-surements, the sample holder is scraped after being filledwith snow, to obtain a flat level surface. This may affectthe density of the surface layer, which is then different fromthe mean density. Figure A1a suggests that when the den-sity if very low, our sample handling increases the densityof the surface layer, while the opposite is observed when thedensity is somewhat higher. Figure A3a also plots a mea-sured value, whose reflectance is about 6.5% higher thancalculations. This is consistent with calculations that showthat reflectance measured by DUFISSS is highly sensitive to
www.the-cryosphere.net/3/167/2009/ The Cryosphere, 3, 167–182, 2009

180 J.-C. Gallet et al.: Measuring snow specific surface area by infrared reflectance
density (for low densities) and with our suggestion that themean density may not reflect density variations within thesample, so that predicting reflectance from the mean densitymay result in errors.
Figure A3b shows a plot of the effect of density on thereflectance of low SSA (28 m2 kg−1) snow samples. Suchsnows are usually denser than high-SSA snows, and the den-sity range chosen here is 145–270 kg m−3. Figure A3b showsthat over this range, reflectance only varies between 35.25and 37.60%, and these extreme values include numericalnoise, i.e. noise caused by an insufficient number of lightrays used (1 million) because of limitations in computerressources, which results in imperfect convergence. There-fore, actual meaningful variations in calculated reflectanceare probably within 1%. The measured reflectance of a snowsample with SSA=28.1 m2 kg−1 is also shown, and is 38.9%,within 1.5% of the calculated value. The facts that at moder-ate SSA and density, reflectance weakly depends on densityand that calculated and measured reflectances are close in-dicate that determining SSA from reflectance measured in a25 mm deep sample holder is possible for such snows. How-ever, the data of Fig. A3a lead to the conclusion that, giventhe density dependence of reflectance for snow of low den-sity and high SSA, and given the fact that fresh snow of highSSA almost always has a low density, our integration spherewith illumination at 1310 nm is not well adapted to the mea-surement of the SSA of low-density high-SSA snow.
Given the artifact detected in low-density high-SSA snow,it is legitimate to wonder whether such an artefact mightalso be observed in snows of moderate SSAs and moder-ate densities, because in that case the optical depth may alsobe insufficient. This may for example be the case for freshsnow that has aged in the absence of wind, and whose SSAwould have decreased below 60 m2 kg−1, while its densitywould have remained below 100 kg m−3. To test for that, ad-ditional SNOWRAT calculations performed for SSA=60 m2
kg−1 are shown in Fig. A3c. They show that as long as den-sity is greater than 100 kg m−3, any correction for density issmall. However, for densities between 50 and 100 kg m−3,corrections are more important. Figure A3b and c were usedto propose empirical Eq. (8) in the main text, that can be usedwhen the snow density is between 50 and 200 kg m−3.
For snows of yet lower densities, which are always freshand therefore of high SSA, corrections would be too largeand probably cause a significant error. This is why we testedwhether using the wavelength of 1550 nm, where ice absorp-tion is larger than at 1310 nm, increases sufficiently the opti-cal depth without changing the sample holder physical depth.
A3 Modeling using a ray-tracing model at 1550 nm
Figure A3d shows the effect of density on reflectance at1550 nm, as calculated by the ray-tracing model with theDUFISSS geometry. The variations appear to be within nu-
merical noise, and the density and geometric artifacts cantherefore be neglected at 1550 nm.
To confirm this, the second panel of Fig. A1 comparesmeasured reflectances to those calculated using SNOWRAT,DISORT, and DISORT with the geometric correction. Thedifferences between the measurements and SNOWRAT pre-dictions are between 0.01% and 0.53% of reflectance in ab-solute value and are random, consistent with the absence ofa detectable density artifact. The geometric correction is toosmall to explain the systematically too bright DISORT bias.Although we realize that the number of data points availableat very high SSA is limited, we conclude with available datathat the deviation of the calibration points from theory at veryhigh SSA, shown in Fig. 8, is due to experimental error andnot to an effect of density.
Acknowledgements.DUFISSS was built without any externalfunds, despite repeated requests. We thank the LGGE director forhis encouragements and support. Ray-tracing calculations weremade on the OSUG cluster maintained by F. Roch at UniversiteJoseph Fourier, Grenoble. We thank Laurent Arnaud, Eric Lefebvreand Jean-Philippe Balestrieri for useful advice on some aspects ofthe instrumentation. CSZ was supported by NSF ARC-0714088and NASA NNX07AR23G and acknowledges partial support fromCNRS during his sabbatical year at LGGE. We are grateful toT. Painter, M. Schneebeli, and an anonymous reviewer for theirhelpful comments. We thank S. Gruber for detailed editing of themanuscript.
Edited by: S. Gruber
The publication of this article is financed by CNRS-INSU.
References
Aoki, T., Aoki, T., Fukabori, M., Hachikubo, A., Tachibana, Y.,and Nishio, F.: Effects of snow physical parameters on spectralalbedo and bidirectional reflectance of snow surface, J. Geophys.Res., 105D, 10219–10236, 2000.
Beine, H. J., Honrath, R. E., Domine, F., Simpson, W. R., andFuentes, J. D.: NOx During Background and Ozone DepletionPeriods at Alert: Fluxes Above the Snow Surface, J. Geophys.Res., 107(D21), 4584, doi:10.1029/2002JD002082, 2002.
Burniston, D. A., Strachan, W. J. M., Hoff, J. T., and Wania, F.:Changes in surface area and concentrations of semivolatile or-ganic contaminants in aging snow, Environ. Sci. Technol., 41,4932–4937, 2007.
Cabanes, A., Legagneux, L., and Domine, F.: Evolution of the spe-cific surface area and of crystal morphology of Arctic fresh snowduring the ALERT 2000 campaign, Atmos. Environ., 36, 2767–2777, 2002.
The Cryosphere, 3, 167–182, 2009 www.the-cryosphere.net/3/167/2009/

J.-C. Gallet et al.: Measuring snow specific surface area by infrared reflectance 181
Cabanes, A., Legagneux, L., and Domine, F.: Rate of evolution ofthe specific surface area of surface snow layers, Environ. Sci.Technol., 37, 661–666, 2003
Coakley, J. A, Cess, R. D., and Yurevich, F. B.: The effect of tropo-spheric aerosols on the Earth’s radiation budget: a parameteriza-tion for climate models, J. Atmos. Sci., 40, 116–138, 1983.
Colbeck, S. C.: Ice crystal morphology and growth rates at low su-persaturations and high temperatures, J. Appl. Phys., 54, 2677–2682, 1983.
Coleou, C., Lesaffre, B., Brzoska, J.-B., Ludwig, W., and Boller,E.: Three-dimensional snow images by X-ray microtomography,Ann. Glaciol., 32, 75–81, 2001.
Daly, G. L. and Wania, F.: Simulating the influence of snow on thefate of organic compounds, Environ. Sci. Technol., 38, 4176–4186, 2004.
Davis, R. E., Dozier, J., and Perla, R.: Measurement of snow grainproperties. In : Seasonal Snowcovers: Physics, Chemistry, Hy-drology, edited by: Jones, H. G. and Orville-Thomas, W. J.,D. Reidel Publishing Dompany, 63–74, 1987.
Domine, F. and Shepson, P. B.: Air-snow interactions and atmo-spheric chemistry, Science, 297, 1506–1510, 2002.
Domine, F., Lauzier, T., Cabanes, A., Legagneux, L., Kuhs, W. F.,Techmer, K., and Heinrichs, T.: Snow metamorphism as revealedby scanning electron microscopy, Microsc. Res. Tech., 62, 33–48, 2003.
Domine, F., Salvatori, R., Legagneux, L., Salzano, R., Fily, M., andCasacchia, R.: Correlation between the specific surface area andthe short wave infrared: SWIR reflectance of snow, Cold RegionsSci. Technol., 46, 60–68, 2006.
Domine, F., Taillandier, A.-S., and Simpson, W. R.: A parameteri-zation of the specific surface area of snow in models of snowpackevolution, based on 345 measurements, J. Geophys. Res., 112,F02031, doi:10.1029/2006JF000512, 2007a.
Domine, F., Cincinelli, A., Bonnaud, E., Martellini, T., and Picaud,S.: Adsorption of Phenanthrene on Natural Snow, Environ. Sci.Technol., 41, 6033–6038, 2007b.
Domine, F., Albert, M., Huthwelker, T., Jacobi, H.-W.,Kokhanovsky, A., Lehning, M., Picard, G., and Simpson, W.R.: Snow Physics as Relevant to Snow Photochemistry, Atmos.Chem. Phys., 8, 171–208, 2008,http://www.atmos-chem-phys.net/8/171/2008/.
Flanner, M. G. and Zender, C. S.: Linking snowpack micro-physics and albedo evolution, J. Geophys. Res., 111, D12208,doi:10.1029/2005JD006834, 2006.
Flanner, M. G., Zender, C. S., Randerson, J. T., Rasch,P. J.: Present-day climate forcing and response fromblack carbon in snow, J. Geophys. Res., 112, D11202,doi:10.1029/2006JD008003, 2007.
Flin, F., Brzoska, J.-B., Lesaffre, B., Coleou, C., and Pieritz, R. A.:Full three-dimensional modelling of curvature-dependent snowmetamorphism: first results and comparison with experimentaltomographic data, J. Phys. D. Appl.Phys., 36, 1–6, 2003.
Gosse, S., Labrie, D., and Chylek, P.: Refractive index of ice in the1.4–7.8-µm spectral range, Appl. Optics, 34, 6582–6586, 1995.
Gow, A. J.: On the rates of growth of grains and crystals in southpolar firn, J. Glaciol., 8, 241–252,1969.
Grannas, A. M., Jones, A. E., Dibb, J., Ammann, M., Anastasio, C.,Beine, H. J., Bergin, M., Bottenheim, J., Boxe, C. S., Carver, G.,Chen, G., Crawford, J. H., Domine, F., Frey, M. M., Guzman,
M. I., Heard, D. E., Helmig, D., Hoffmann, M. R., Honrath, R.E., Huey, L. G., Hutterli, M., Jacobi, H. W., Klan, P., Lefer, B.,McConnell, J., Plane, J., Sander, R., Savarino, J., Shepson, P.B., Simpson, W. R., Sodeau, J. R., von Glasow, R., Weller, R.,Wolff, E. W., and Zhu, T.: An overview of snow photochem-istry: evidence, mechanisms and impacts, Atmos. Chem. Phys.,7, 4329–4373, 2007,http://www.atmos-chem-phys.net/7/4329/2007/.
Grenfell, T. C., Warren, S. G., and Mullen, P. C.: Reflection of solarradiation by the Antarctic snow surface at ultraviolet, visible, andnear-infrared wavelengths, J. Geophys. Res., 99, 18669-18684,1994.
Grenfell, T. C. and Warren, S. G.: Representation of a nonsphericalice particle by a collection of independent spheres for scatter-ing and absorption of radiation, J. Geophys. Res., 104, 31697–31709, 1999.
Hall, A.: The role of surface albedo feedback in climate, J. Climate,17, 1550–1568, 2004.
Herbert, B. M. J., Halsall, C. J., Villa, S., Jones, K. C., and Kallen-born, R.: Rapid changes in PCB an OC pesticide concentrationsin Arctic snow, Environ. Sci. Technol., 39, 2998–3005, 2005.
Hidovic-Rowe, D., Rowe, J. E., and Lualdi, M.: Markov models ofintegrating spheres for hyperspectral imaging, Appl. Optics, 45,5248–5257, 2006.
Honrath, R. E., Peterson, M. C., Guo, S., Dibb, J. E., Shepson, P. B.,and Campbell, B.: Evidence of NOx production within or uponice particles in the Greenland snowpack, Geophys. Res. Lett., 26,695–698, 1999.
Jacobi, H.-W. and Hilker, B.: A mechanism for the photochemicaltransformation of nitrate in snow, J. Photochem. Photobiol. A.,185, 371–382, 2007.
Jones, A. E., Weller, R., Anderson, P. S., Jacobi, H.-W., Wolff, E.W., Schrems, O., and Miller, H.: Measurements of NOx emis-sions from the Antarctic snowpack, Geophys. Res. Lett., 28,1499–1502, 2001.
Kaempfer T. U. and Schneebeli, M.: Observation of isother-mal metamorphism of new snow and interpretation asa sintering process, J. Geophys. Res., 112, D24101,doi:10.1029/2007JD009047, 2008.
Kerbrat, M., Pinzer, B., Huthwelker, T., Gaggeler, H. W., Ammann,M., and Schneebeli, M.: Measuring the specific surface area ofsnow with X-ray tomography and gas adsorption: comparisonand implications for surface smoothness, Atmos. Chem. Phys.,8, 1261–1275, 2008,http://www.atmos-chem-phys.net/8/1261/2008/.
Kokhanovsky, A. A.: Scaling constant and its determination fromsimultaneous measurements of light reflection and methane ad-sorption by snow samples, Opt. Lett., 31, 3282–3284, 2006.
Legagneux, L., Cabanes, A., and Domine, F.: Measurementof the Specific Surface Area of 176 Snow Samples UsingMethane Adsorption at 77 K, J. Geophys. Res., 107(D17), 4335,doi:10.1029/2001JD001016, 2002.
Matzl, M. and Schneebeli, M.: Measuring specific surface areaof snow by near-infrared photography, J. Glaciol., 52, 558–564,2006.
Narita, H.: Specific surface of deposited snow II, Low Temp. Sci.,A29, 69–81, 1971.
Nolin, A. W. and Dozier, J.: A hyperspectral method for remotelysensing the grain size of snow, Remote Sens. Environ., 74, 207–
www.the-cryosphere.net/3/167/2009/ The Cryosphere, 3, 167–182, 2009

182 J.-C. Gallet et al.: Measuring snow specific surface area by infrared reflectance
216, 2000.Nelson, J.: Sublimation of ice crystals, J. Atmos. Sci., 55, 910–919,
1998.Painter, T. H., Molotch, N. P., Cassidy, M., Flanner, M., and Steffen,
K.: Contact Spectroscopy for Determination of Stratigraphy ofOptical Grain Siz, J. Glaciol., 53, 121–127, 2007a.
Painter T. H., Barrett, A. P., Landry, C. C., Neff, J. C., Cassidy, M.P., Lawrence, C. R., McBride, K. E., and Farmer G. L.: Impactof disturbed desert soils on duration of mountain snow cover,Geophys. Res. Lett., 34, L12502, doi:10.1029/2007GL030284,2007b.
Perla, R., Dozier, J., and Davis, R. E.: Preparation of serial sectionsin dry snow specimens, J. Microsc., 141, 111–114, 1986.
Picard, G., Arnaud, L., Domine, F., and Fily, M.: Determiningsnow specific surface area from near-infrared reflectance mea-surements: numerical study of the influence of grain shape, ColdRegions Sci. Technol., 56(1), 10–17, 2009.
Pickering, J. W., Prahl, S. A., Vanwieringen, N., Beek, J. F., Steren-borg, H. J. C. M., and Vangemert, M. J. C.: Double-integrating-sphere system for measuring the optical properties of tissue,Appl. Optics, 32, 399–410, 1993.
Schaepman-Strub, G., Schaepman, M. E., Painter, T. H., Dangel,S., and Martonchik, J. V.: Reflectance quantities in optical re-mote sensing-definitions and case studies, Remote Sens. Envi-ron., 103, 27–42, 2006.
Stamnes, K., Tsay, S. C., Wiscombe, W., and Jayaweera, K.: Nu-merically stable algorithm for discrete-ordinate-method radiativetransfer in multiple scattering and emitting layered media, Appl.Optics, 27, 2502–2509, 1988.
Taillandier, A.-S., Domine, F., Simpson, W. R., Sturm, M., Douglas,T. A., and Severin, K.: Evolution of the Snow Area Index ofthe subarctic snowpack in Central Alaska over a whole season.Consequences for the air to snow transfer of pollutants, Environ.Sci. Technol., 40, 7521–7527, 2006.
Taillandier, A.-S., Domine, F., Simpson, W. R., Sturm, M., andDouglas, T. A.: The rate of decrease of the specific surface areaof dry snow: isothermal versus temperature gradient conditions,J. Geophys. Res., 112, F03003, doi:10.1029/2006JF000514,2007.
Warren, S. G.: Optical properties of snow, Rev. Geophys. SpacePhys., 20, 67–89, 1982.
Warren, S. G.: Optical constants of ice from the ultraviolet to themicrowave, Appl. Optics, 23, 1206–1225, 1984.
Warren S. G. and Brandt, R. E.: Optical constants of ice from theultraviolet to the microwave: A revised compilation, J. Geophys.Res., 113, D14220, doi:10.1029/2007JD009744, 2008.
Wiscombe, W. J. and Warren, S. G.: A model for the spectral albedoof snow, I: Pure snow. J. Atmos. Sci., 37, 2712–2733, 1980.
Zege, E., Katsev, I., Malinka, A., Prikhach, A., Polonsky, I.: Newalgorithm to retrieve the effective snow grain size and pollutionamount from satellite data, Ann. Glaciol., 49, 139–144, 2008.
Zender, C. S. and Talamantes, J.: Solar absorption by Mie reso-nances in cloud droplets, J. Quant. Spectrosc. Radiat. Transfer,98, 122–129, 2006.
The Cryosphere, 3, 167–182, 2009 www.the-cryosphere.net/3/167/2009/
Related Documents