PHYSICAL REVIEW D VOLUME 53, NUMBER 1 Measurement of the mass of the T lepton 1 JANUARY 1996 J. Z. Bai,’ 0. Bardon,e R. A. Becker-Szendy,8 I. Blum,” A. Breakstone,’ T. Burnett,” G. P. Chen,’ H. F. Chen,4 .I. Chen,5 S. J. Chen,l S. M. Chen,l Y. Chen,’ Y. B. Chen,’ Y. Q. Chen,’ B. S. Cheng,’ R. F. Cowan,e H. C. Cu&l X. Z. Cui,’ H. L. Ding,’ Z. Z. Du,’ W. Dunwoodie,e X. L. Fan,’ J. Fang, 1 C. S. Gao,’ M. L. Gao,l S. Q. Gao,’ W. X. Gao 1 P. Gratton,” J. H. Go,’ S. D. Gu,’ W. X. Gu,’ Y. F. Gu,’ Y. N. Guo,’ S. W. Han,’ Y. Han,’ F. A. H&ie,s M. Hatanaka, J. He,’ K. R. He,’ M. He,’ D. G. Hitlin,3 G. Y. Hu,’ T. Hu,’ X. Q. Hu,l D. Q. Huang,’ Y. Z. Huang,’ J. M. Izen,” Q. Pr Jia: C. H. Jiang,’ Z. Z. Jiang: S. Jin,’ Y. Jin,’ L. Jone~,~ S. H. Kang,’ Z. J. Ke,’ M. H. Kel~ey,~ B. K. Kim, l1 Y. F. Lai,’ H. B. Lm,’ P. F. Lang,’ A. Lankford,” F. Li,’ J. Li,’ P. Q. Li,’ Q. Li,’ R. B. Li,’ W. Li,’ W. D. Li,’ W. G. Li,l X. H. Li, ’ X. N. Li,’ Y. S. Li,’ S. Z. Lin,’ H. M. Liu,l J. Liu,’ J. H. Liu,’ Q. Liu,’ R. G. Liu,’ Y. Liu,’ Z. A. Liu,’ X. C. Lou,” B. Lowery,“,* F. Lu,’ J. G. Lu,’ Y. Luo,l A. M. Ma,l D. H. Ma,’ E. C. Ma,’ J. M. Ma,l H. S. Mao,’ Z. P. Mao,l R. Malchow,’ M. Mandelkern, lo H. Marsiske,e X. C. Meng,’ H. L. Ni,’ J. Nie,’ S. L. 0lser1,~ J. Oyang,3 D. Paluselli: L. J. Pan,’ J. Panetta,3 F. Porter,3 E. Prabhakar,3 N. D. Qi,’ Y. K. Que, 1 J. Quigley,e G. Rang,’ M. Schernau,l” B. Schmid,“’ J. Schultz, lo Y. Y. Shao,’ B. W. Shen,’ D. L. Shea,’ H. Shen,’ X. Y. Shen, ’ H. Y. Shag,’ H. Z. Shi,’ X. R. Shi,3 A. Smith,‘O E. Soderstrom,e X. F. Song,’ J. Standifird,” D. Stoker,” F. Sun,’ H. S. Sun,’ S. J. Sun,’ J. Synodinos,’ Y. P. Tan,l S. Q. Tang, ’ W. Toki,5 G. L. Tong,’ E. Torrence,e F. Wang,’ L. S. Wang,’ L. Z. Wang,’ M. Wang,’ P. Wang,’ P. L. Wang,’ S. M. Wang, 1 T. J. Wang,’ Y. Y. Wang,’ C. L. Wei,’ S. Whittaker,’ R. Wilson,5 W. J. Wisniewski,13’t Y. G. Wu,l D. M. Xi,’ X. M. Xia,’ P. P. Xie,’ X. X. Xie,’ W. J. Xiong,’ D. Z. Xu,’ M. K. Xu, l4 R. S. Xu,’ Y. D. XU,‘~ Z. Q. Xu,l S. T. Xue,’ R. Yamamoto,e J. Yan,’ W. G. Yan,l C. M. Yang,’ C. Y. Yang,l J. Yang,’ W. Yang,’ H. B. Yao,’ M. H. Ye,’ S. W. Ye,4 S. Z. Ye,’ C. S. Yu,l C. X. Yu,’ Y. H. Yu,14 Z. Q, Yu,’ C. Z. Yuan,’ J. Y. Zag,’ B. Y. Zhang,’ C. C. Zhang,l D. H. Zhang,l H. L. Zhang,’ J. Zhang,’ J. W. Zhang,’ L. S. Zhang,’ S. Q. Zhang,’ Y. Zhang,l Y. Y. Zhang,’ D. X. Zhao,’ H. W. Zhao,’ J. W. Zhao,l M. Zhao,’ P. D. Zhao,’ W. R. Zhao,’ J. P. Zheng,’ L. S. Zheng,’ Z. P. Zheng,l G. P. Zhou,l H. S. Zhou,’ Li Zhou,’ X. F. Zhou,’ Y. H. Zhou,’ H. G. Zhu,’ Q, M. Zhu,’ Y. C. Zhu,’ Y. S. Zhu,’ B. A. Zhuang,’ G. Zioulas” (BES Collaboration) ‘Institute of High Energy Physics, Beijing 100039, People’s Republic of China ‘Boston University, Boston, Massachusetts 02215 3Ca1ijomia Institute of Technology, Pasadena, Calijomia 91125 4 University of Science and Technology of China, Hejei 230026, People’s Republic of China 5Colorado State University, Fort Collins, Colorado 80523 eMassachusetts Institute of Technology, Cambridge, Mossachwetti 02139 ‘Shandong University, Jinan 250100, People’s Republic of China eStanford Linear Accelerator Center, Stanford, California 94309 ‘University of Hawaii, Bonokdu, Hawaii 96822 ‘“University of California at Irvine, Irvine, Calijomia 92717 ” University of Term at Dallas, Richardson, Tezas 75083-0688 la University of Washington, Seattle, Washington 98195 ‘3Superconducting Supercollider Laboratory, Dallas, Texas 75237-3946 ‘*Hangdou University, Hangzhou 310028, People’s Republic of China (Received 25 July 1995) A data-driven energy ecan in the immediate vicinity of the 7 pair production tbreshold has been performed using the Beijing Spectrometer at the Beijing Electron-Positron Collider. Approximately 5 pb-’ of data, distributed over 12 ecan points, have been collected. A previous maee value for the 7 lepton, obtained using only the ep final state, has been published. In this paper, the final BES result on the maes measurement is presented. The analysis is based on the combined data from the ee, ep, eh, VW, ph, and hh final states, where h denotes a charged ?( or K. A maximum likelihood fit to the r pair production cross section data yields the value rn, = 1776.96+~:~~!~:~~ MeV. PACS number(s): 14.60.Fg, 13.1O.+q I. INTRODUCTION ‘Present address: Kansas State University, Manhattan, Measurements of the mass, lifetime, and electronic Kansas 66506-2601. branching fraction of the 7 lepton have been improved to tpresent address: Stanford Linear Accelerator Center, Stan- the extent that they can be used to provide a significant ford, California 94309. test of lepton universality. The most precise measure- 0556-2821/96/53~1~/20~15~/%06.00 53 20 0 1996 The American Physical Society

Welcome message from author
This document is posted to help you gain knowledge. Please leave a comment to let me know what you think about it! Share it to your friends and learn new things together.
Transcript

PHYSICAL REVIEW D VOLUME 53, NUMBER 1 1 JANUARY 1996
Measurement of the mass of the T lepton
J. Z. Bai,’ 0. Bardon,e R. A. Becker-Szendy,8 I. Blum,” A. Breakstone,’ T. Burnett,” G. P. Chen,’ H. F. Chen,4 .I. Chen,5 S. J. Chen,l S. M. Chen,l Y. Chen,’ Y. B. Chen,’ Y. Q. Chen,’ B. S. Cheng,’ R. F. Cowan,e H. C. Cu&l
X. Z. Cui,’ H. L. Ding,’ Z. Z. Du,’ W. Dunwoodie,e X. L. Fan,’ J. Fang, 1 C. S. Gao,’ M. L. Gao,l S. Q. Gao,’ W. X. Gao 1 P. Gratton,” J. H. Go,’ S. D. Gu,’ W. X. Gu,’ Y. F. Gu,’ Y. N. Guo,’ S. W. Han,’ Y. Han,’
F. A. H&ie,s M. Hatanaka, J. He,’ K. R. He,’ M. He,’ D. G. Hitlin,3 G. Y. Hu,’ T. Hu,’ X. Q. Hu,l D. Q. Huang,’ Y. Z. Huang,’ J. M. Izen,” Q. Pr Jia: C. H. Jiang,’ Z. Z. Jiang: S. Jin,’ Y. Jin,’ L. Jone~,~
S. H. Kang,’ Z. J. Ke,’ M. H. Kel~ey,~ B. K. Kim, l1 Y. F. Lai,’ H. B. Lm,’ P. F. Lang,’ A. Lankford,” F. Li,’ J. Li,’ P. Q. Li,’ Q. Li,’ R. B. Li,’ W. Li,’ W. D. Li,’ W. G. Li,l X. H. Li, ’ X. N. Li,’ Y. S. Li,’ S. Z. Lin,’ H. M. Liu,l J. Liu,’ J. H. Liu,’ Q. Liu,’ R. G. Liu,’ Y. Liu,’ Z. A. Liu,’ X. C. Lou,” B. Lowery,“,* F. Lu,’
J. G. Lu,’ Y. Luo,l A. M. Ma,l D. H. Ma,’ E. C. Ma,’ J. M. Ma,l H. S. Mao,’ Z. P. Mao,l R. Malchow,’ M. Mandelkern, lo H. Marsiske,e X. C. Meng,’ H. L. Ni,’ J. Nie,’ S. L. 0lser1,~ J. Oyang,3 D. Paluselli: L. J. Pan,’ J. Panetta,3 F. Porter,3 E. Prabhakar,3 N. D. Qi,’ Y. K. Que, 1 J. Quigley,e G. Rang,’ M. Schernau,l” B. Schmid,“’ J. Schultz, lo Y. Y. Shao,’ B. W. Shen,’ D. L. Shea,’ H. Shen,’ X. Y. Shen, ’ H. Y. Shag,’ H. Z. Shi,’ X. R. Shi,3
A. Smith,‘O E. Soderstrom,e X. F. Song,’ J. Standifird,” D. Stoker,” F. Sun,’ H. S. Sun,’ S. J. Sun,’ J. Synodinos,’ Y. P. Tan,l S. Q. Tang, ’ W. Toki,5 G. L. Tong,’ E. Torrence,e F. Wang,’ L. S. Wang,’ L. Z. Wang,’ M. Wang,’ P. Wang,’ P. L. Wang,’ S. M. Wang, 1 T. J. Wang,’ Y. Y. Wang,’ C. L. Wei,’ S. Whittaker,’ R. Wilson,5
W. J. Wisniewski,13’t Y. G. Wu,l D. M. Xi,’ X. M. Xia,’ P. P. Xie,’ X. X. Xie,’ W. J. Xiong,’ D. Z. Xu,’ M. K. Xu, l4 R. S. Xu,’ Y. D. XU,‘~ Z. Q. Xu,l S. T. Xue,’ R. Yamamoto,e J. Yan,’ W. G. Yan,l C. M. Yang,’
C. Y. Yang,l J. Yang,’ W. Yang,’ H. B. Yao,’ M. H. Ye,’ S. W. Ye,4 S. Z. Ye,’ C. S. Yu,l C. X. Yu,’ Y. H. Yu,14 Z. Q, Yu,’ C. Z. Yuan,’ J. Y. Zag,’ B. Y. Zhang,’ C. C. Zhang,l D. H. Zhang,l H. L. Zhang,’ J. Zhang,’
J. W. Zhang,’ L. S. Zhang,’ S. Q. Zhang,’ Y. Zhang,l Y. Y. Zhang,’ D. X. Zhao,’ H. W. Zhao,’ J. W. Zhao,l M. Zhao,’ P. D. Zhao,’ W. R. Zhao,’ J. P. Zheng,’ L. S. Zheng,’ Z. P. Zheng,l G. P. Zhou,l H. S. Zhou,’ Li Zhou,’
X. F. Zhou,’ Y. H. Zhou,’ H. G. Zhu,’ Q, M. Zhu,’ Y. C. Zhu,’ Y. S. Zhu,’ B. A. Zhuang,’ G. Zioulas” (BES Collaboration)
‘Institute of High Energy Physics, Beijing 100039, People’s Republic of China
‘Boston University, Boston, Massachusetts 02215 3Ca1ijomia Institute of Technology, Pasadena, Calijomia 91125
4 University of Science and Technology of China, Hejei 230026, People’s Republic of China 5Colorado State University, Fort Collins, Colorado 80523
eMassachusetts Institute of Technology, Cambridge, Mossachwetti 02139
‘Shandong University, Jinan 250100, People’s Republic of China eStanford Linear Accelerator Center, Stanford, California 94309
‘University of Hawaii, Bonokdu, Hawaii 96822
‘“University of California at Irvine, Irvine, Calijomia 92717 ” University of Term at Dallas, Richardson, Tezas 75083-0688
la University of Washington, Seattle, Washington 98195 ‘3Superconducting Supercollider Laboratory, Dallas, Texas 75237-3946 ‘*Hangdou University, Hangzhou 310028, People’s Republic of China
(Received 25 July 1995)
A data-driven energy ecan in the immediate vicinity of the 7 pair production tbreshold has been performed using the Beijing Spectrometer at the Beijing Electron-Positron Collider. Approximately 5 pb-’ of data, distributed over 12 ecan points, have been collected. A previous maee value for the 7 lepton, obtained using only the ep final state, has been published. In this paper, the final BES result on the maes measurement is presented. The analysis is based on the combined data from the ee, ep, eh, VW, ph, and hh final states, where h denotes a charged ?( or K. A maximum likelihood fit to the r pair production cross section data yields the value rn, = 1776.96+~:~~!~:~~ MeV.
PACS number(s): 14.60.Fg, 13.1O.+q
‘Present address: Kansas State University, Manhattan, Kansas 66506-2601.
tpresent address: Stanford Linear Accelerator Center, Stan- ford, California 94309.
0556-2821/96/53~1~/20~15~/%06.00 53
I. INTRODUCTION
Measurements of the mass, lifetime, and electronic branching fraction of the 7 lepton have been improved to the extent that they can be used to provide a significant test of lepton universality. The most precise measure-
20 0 1996 The American Physical Society

53 MEASUREMENT OF THE MASS OF THE 7 LEPTON 21
ment to date of the mass of the 7 lepton is described in this paper.
As the third of the sequential charged leptons, the 7 decays similarly to the /I by virtue of its coupling to a virtual W boson and a neutrino; however, the 7 has many more open decay channels as a consequence of its large mass. Within the standard model, leptonic decay rates are given by [lj
r(L + ~~L4) = ~F&L, ml) 1 (1)
where mr, is the mass of the parent lepton L, ml is the mass of the daughter lepton 1, GL is the Fermi weak coupling constant, and the correction factor F,,, is given
by
with
f(z) = 1 - 83: + 8z3 - z4 - 12~~ Inz , (3)
and
L= [l+q$($4)] (5)
The function f(z) results from the integration of the squared matrix element for 7 decay over the three-body final state phase space. The correction factor Fw ac- counts for the nonlocal structure of the W propaga- tor, where rnw is the mass of the W boson; the fac- tor Frad arises due to initial and final state radiative corrections [a(mT)-l = 133.3 [l)]. It should be noted that the current value of the Fermi weak coupling con- stant, GF = 1.16639(2) x 10m5 GeV-‘, is obtained from Eqs. (l)-(5) in the case of @ decay by inserting the val- ues rn, = 105.658389f0.000034 MeV, IQ + evp)-’ = (2.19703 ZL 0.00004) x lo@ s, mw = 80.22 f 0.26 GeV
[2], with a(m,,-’ = 136 [l]. The electronic decays of the 7 and muon can be related
through Eq. (1) where the substitutions r(7 + evi?) = B,-,,,,o/t, and r(p --t Eve) = l/t, yield
(‘3)
where tr denotes the lepton lifetime, and B,,,,, the branching &&ion for the decay 7 + evD; the functions F car, whose contributions are listed in Table I, together contribute to the ratio of the squared coupling constants at the level of 0.0004. The value of tbis ratio is unity under the assumption of lepton universality. Prior to the
TABLE I. The corrections to the p and 7 decay rates, cal- culated using 01(m,,)-~ = 136 and a(mr)-’ = 133.3 [l].
Correction W&e
f (d/4‘) 0.9998 h+b) 1.0000 Fdh‘) 0.9958
1.0000 1.0003 0.9957
&mh,m.) 0.99558 ~,,.&;~.j 0.99597
present experiment, the uncertainty in the value of rn, was~3-4 MeV. Since rn, enters Eq. (6) at the fifth power, lepton universality could be tested only at the 1% level at best. The goal of this experiment was to improve the measurement precision of rn7 by an order of magnitude, thus making possible tests of universality down to the 0.1% level.
The experimental procedure has been described pre- viously [3]. A data-driven search near threshold for e+e- + 7+~- was performed in which candidate events were identified by requiring that one 7 decay via 7 + evp, and the other via 7 + pvv. The 7 lepton mass value, ob- tained from a fit to the energy dependence of the resulting T+T- cross section data, was rn, = 1776.9’$&0.2 MeV
r31. In this paper the analysis is extended to include the
ee, pp, eh, ph, and hh final states, where h can be either a charged ?r or K. These final states provide additional information which is independent of the ep events which drove the energy scan, and result in a reduction in the statistical uncertainty in,the mass value by a factor of 2.
II. THE BEIJING COLLIDER AND BEIJING SPECTROMETER
The Beijing Electron Positron Collider (BEPC) [4], shown schematically in Fig. 1, operates in the 3 - 5 GeV
FIG. 1. The Beijing Electron Positron Collider (BEPC). The 202 ‘rn injection linac leading to the 240 rn circumfer- ence storage ring is shown at the left. The electrons circulate clockwise and the positrons counterclockwise. The BES sits on the side of the ring opposite the injection linac.

22 .I. Z. BAI et al. 53
c.m. energy range. Neti T+T- threshold, the peak lu- minosity is 5 x IO3 CIX-~S-~, the luminosity-weighted uncertainty in the mean cm. energy is -0.1~ MeV, and the distribution of cm. energy about its nominal value is described by a Gaussian with standard deviataion - 1.4 MeV. The absolute energy scale and energy spread are determined by linear interpolation between the re- sults of repeated scans of the .7/$ and $’ [+(2S)], reso- nances.
The Beijing Spectrometer (BES), shown in Fig. 2, is a conventional cylindrical detector described in detail in Ref. 15). A four-layer central drift chamber (CDC) surrounding the beam pipe provides trigger information. Charged tracks are reconstructed in a 40-layer main drift chamber (MDC) which provides solid angle coverage of
85% of 47r. Momentum resolution of 2.1%- (p in GeV/c) and energy loss (dE/dz) resolutions of 8.5% for electrons, 9.4% for muons, and 11% for hadrons are obtained in the present experiment. Scintillation coun- ters provide time-of-flight (TOF) measurements over 76% of 4n, with resolutions of 390 ps for klectrons, 410 ps for muons, and 450 ps for hadrons. A ~12-radiation- length, lead-gas barrel shower counter (BSC), operating in limited streamer mode, measwes the energies of elec-
trons and photons over 80% of the total solid angle, and achieves energy resolution q/E = 0.22/o (E in GeV) for electrons, and spatial resolutions 04 = 4.5 mrad and o, = 2 cm. A solenoidal magnet provides a 0.4 T mag- tietic field in the central tracking region of the detector. Three double-layer muon counters instrument the mag- net flux return, and serxto identify muons of momentum greater than 500 MeV/c. They cover 68% of.the total solid angle with longitudinal (transverse) spatial resolu- tion 5 cm (3 cm). End-cap time-of-flight and shower counters extend coverage to the forward and backward regions.
III. r+r- PRODUCTION CROSS SECTION NEAR THRESHOLD
The likelihood function used to estimate the 7 lepton mass value incorporates the r+r- production cross sec- tion near threshold [6]. Including the c.m. energy spread A, initial state radiation corrections [7] F(z,W), and vacuum polarization corrections [S] II(W), the cross sec- tion is
1-s c7(W,m,) = -
AA 2:T dW’exp s dzF(z,W’)ul(W’diG,m,) , (7)
where 01 is given by
9 “‘^ P2) F&w,(P) . - II - TTIW\lZ '
(8)
W is the cm. energy, and p = dm. The Coulomb interaction and final state radiation corrections are described by the functions F&3) and F,.(p) [9]. The effect of these corrections on the lowest order QED cross
-. ^
Muon Counter
Barrel Shower Counter
Central Drift Chamber
-. TTbA ce- Beam
Luminosity Monitor Endcap Shower Counter
. Endcap TOF Counter
FIG. 2. The Beijing Spec- trometer (BES) in y-z projec- tion,
53 MEASUREMENT OF THE MASS OF THE 7 LEPTON 23
/- _. 1.5 ,/ ,‘,....’ ,,/ ..
z ,‘....... ,‘, 2” .g 1.0 ,‘,...’ ’ c%
,‘/ / ,,..’ g b 0.5
II-
,p I :’ I/
I:’ I:’ I
o- 3.54 3.56 3.56 3.60
W (GeV)
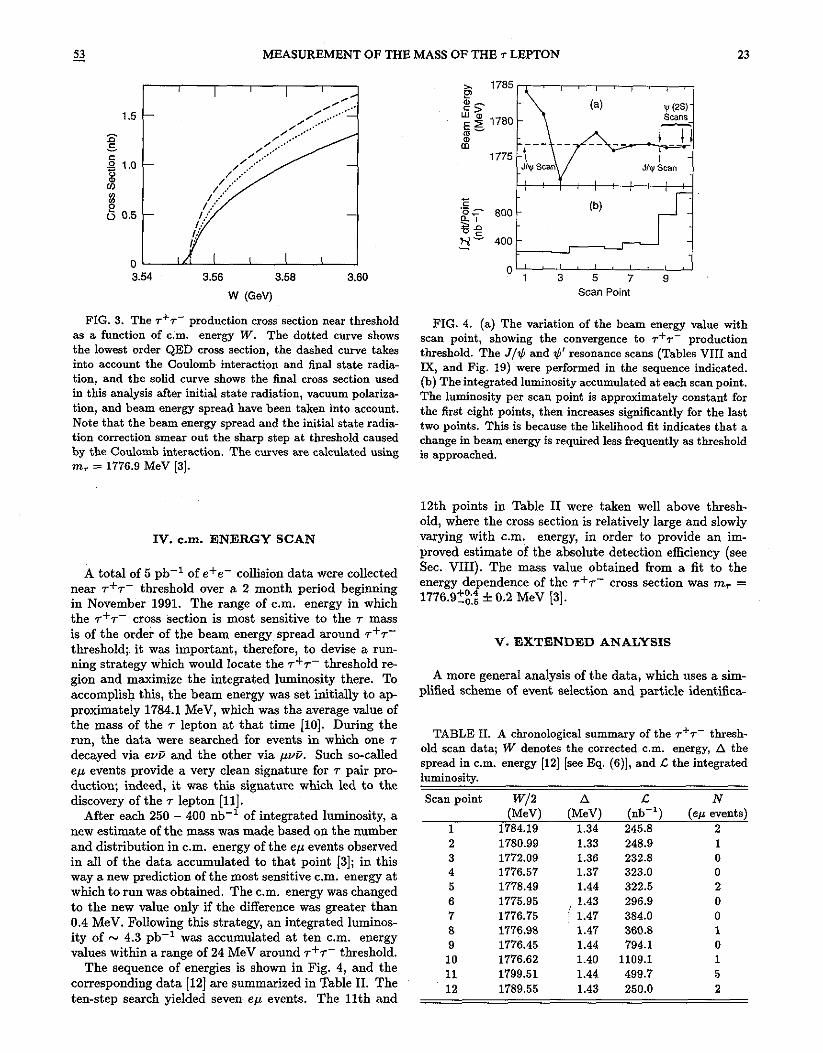
FIG. 3. The T+T- production cross section near threshold as a function of cm. energy W. The dotted curve shows the lowest order QED cross section, the dashed curve takes into account the Coulomb interaction and final state radia- tion, and the solid curve shows the final cross section used in this analysis after initial state radiation, vacuum polariaa- tion, and beam energy spread have been taken into account. Note that the beam energy spread and the initial state radia- tion correction smear out the sharp step at threshold caused by the Coulomb interaction. The curves are calculated using rn, = 1776.9 MeV [3].
IV. c.m. ENERGY SCAN
A total of 5 pb-l of e+e- collision data were collected near T+T- threshold over a 2 month period beginning in November 1991. The range of c.m. energy in which the ~+~-~cross section is most sensitive to the 7 mass is of the order of the beam energy spread around @T- threshold;, it was important, therefore, to devise a run- ning strategy which would locate the T+T- threshold re- gion and maximize the integrated luminosity there. To accomplish this, the beam energy was set initially to ap proximately 1784.1 MeV, which was the average value of the mass of the 7 lepton at that time [lo]. During the run, the data were searched for events in which one 7 decayed via WD and the other via pv.?. Such so-called ep events provide a very clean signature for 7 pair pro- duction; indeed, it was this signature which led to the discovery of the 7 lepton [ll].
After each 250 - 400 nb-l of integrated luminosity, a new estimate of the mass was made based on the number and distribution in cm. energy of the ep events observed in all of the data accumulated to that point 131; in this way a new prediction of the most sensitive cm. energy at which to run was obtained. The c.m. energy was changed to the new value only if the difference was greater than 0.4 MeV. Following tbis strategy, an integrated luminos- ity of - 4.3 pb-’ was accumulated at ten cm. energy values within a range of 24 MeV around T+T- threshold.
The sequence of energies is shown in Fig. 4, and the corresponding data [12] are summarized in Table II. The ten-step search yielded seven ep events. The 11th and
01 3 6 7 9 Scan Point
FIG. 4. (a) The variation of the beam energy value with scan point, showing the convergence to r+r- production threshold. The J/Q and $’ resonance scans (Tables VIII and IX, and Fig. 19) were performed in the sequence indicated. (b) The integrated luminosity accumulated at each scan point. The luminosity per scan point is approximately constant for the first eight points, then increases significantly for the last two points. This is because the likelihood fit indicates that a change in beam energy is required less frequently as threshold is approached.
12th points in Table II were taken well above thresh- old, where the cross section is relatively large and slowly varying with c.m. energy, in order to provide an im- proved estimate of the absolute detection efficiency (see Sec. VIII). The mass value obtained from a fit to the energy dependence of the ~+r- cross section was rn, = 1776.9+“,:; i 0.2 MeV 131.
V. EXTENDED ANALYSIS
A more general analysis of the data, which uses a sim-
plified scheme of event selection and particle identifica-
TABLE II. A chronological summary of the ~+r- thresh- old scan data; W denotes the corrected c.m. energy, A the spread in cm. energy 1121 [see Eq. (6)], and I: the integrated luminosity.
Scan Doint w/2 A .c N (Md+) (MeV) (nb-‘) (el.c events)
1 1784.19 1.34 245.8 2 2 1780.99 1.33 248.9 1 3 1772.09 1.36 232.8 0 4 1776.57 1.37 323.0 0 5 1778.49 1.44 322.5 2 6 1775.95 1.43 7 1776.75 ! 1.47
296.9 0 384.0 0
8 1776.98 1.47 360.8 1 9 1776.45 1.44 794.1 0 10 1776.62 1.40 1109.1 1 11 1799.51 1.44 499.7 5 12 1789.55 1.43 250.0 2

24 J. Z. BA1 er al. 53
tion, is presented in this paper. This second analysis incorporates the ep final state and several additional two- prong T+Y final states, and results in a reduction of the statistical error in the mass value of the 7 lepton to the level of the systematic uncertainty.
To select candidate two-prong T+T- decay events from the 11.7~10~ triggers representing the data listed in Ta- ble II, it is fist required that exactly two charged tracks be well reconstructed, without regard to net charge. For each track, the point of closest approach to the beam line must have radius < 1.5 cm and Itl 5 15 cm where I is measured along the beam line from the nominal beam crossing point; in addition Izl - ~21 must be less than 5 cm. Furthermore, each track is required to satisfy 1 cose 5 0.75, where 0 is the polar angle, to ensure that it is contained within the barrel region of the detector. These criteria reduce the data sample by a factor of N 20.
Next, it is required that the transverse momentum of each charged track be above the 100 MeV/c minimum needed to traverse the barrel time-of-flight counter and reach the outer radius of the barrel shower counter in the 0.4 T axial magnetic field. In addition, the magnitude of the momentum must be less than the maximum expected in any 7 decay at the given cm. energy within a tolerance of three standard deviations in momentum resolution. These constraints on momentum reduce the data sample by over an order of magnitude, leaving - 40 000 events. Most of this reduction is due to the removal of Bhabha scattering and p pair production events.
The search for T+Y production events is restricted to final states which do not contain x0’s or 7’s. Conse- quently, a further requirem&t is that there be no isolated photon present in the barrel or end-cap shower counters. For this purpose, an isolated photon is defined by requir- ing that it have energy greater than 60 MeV; it must make an angle of greater than 12” with respect to the original direction of each of the charged tracks, and also with respect to the direction defined for each charged track by connecting its point of entry to the barrel shower counter to the origin of the coordinate system. This re- duces the data sample to N 33 000 events. At this point there remains a significant number of cosmic ray events. The bulk of these are removed by rejecting any event for which either track has a measured time-of-flight value less than 2.5 ns or greater than 8.5 ns.
The particle identification procedure is applied to the - 25000 remaining events. For each allowed mass hy- pothesis (e, p, z, K) for each track, the measured mo- mentum is used to predict the expected values of dE/dx, time of flight, and shower counter energy. The corre- sponding measured quantities and resolutions are then used to create an overall x2 value, which is converted to a confidence level using the number of contributing subdetectors as the number of degrees of freedom. The confidence level distributions found for samples of known pious, electrons, and muons within the momentum range accessible to 7 decay are shown in Fig. 5. These distri- butions are all consistent with being flat, as would be expected for pure samples if the individual device reso- lutions were reliably assigned. Similar confidence level
600 M
400 - 200 (a) -
0
40 -
0 0.2 0.4 0.6 0.8 1.0
FIG. 5. The confidence level distributions for samples of (a)~ pions from J/q + W?TT events and beam-gas electropro- duction events, (b) electrons from radiative Bhabha events, (c) muons from fi pair production, and (d) muons from radia- tive p pair production.
behavior is observed for each particle type in each indi- vidual detector system, confirming that this is indeed the case.
Events are rejected if either track has confidence lev- els of less than 5% for all particle hypotheses., Next, the p hypothesis is assigned to a track if its momen- tum is greater than 500 MeV/c, it has confidence level greater than 5% as a ,u, and there are corroborating muon counter hits. Failing the p requirement, a track is as- signed either the e or h (for hadron, i.e., ?r or K) hy- pothesis debending on which has the higher confidence level, and provided that confidence level is at least 5%. If the confidence level for the x (K) assignment is over 5%, it is further required that the track momentum be consistent with two-body 7 + ?YY (Kv) decay at the 3 0 level. For the calculation of the relevant momentumu limits, rn, is taken 1.0 MeV below the previous measure- ment [3] to reduce the dependence of the 7 + ?iv (Kv) selection efficiency on the cm. energy; in extracting the 7 mass value from the data, the small residual depen- dence is taken into account as described in Sec. VIII. The momentum limits for pions and kaons are shown as a function of cm. energy in Fig. 6; for scan point 3, which is well below threshold [3], the threshold momen- tum limits are used. It should be emphasized that if, for a given track, either the ?r or the K hypothesis has confidenck level’greater than 5% and does not satisfy the momentum criterion, the event is rejected, even if the electron interpretation yields a higher confidence level.
More generally, for each event any mass hypothesis combination for which both tracks satisfy the 5% confi- dence level criterion is required to satisfy any subsequent seIec$on criteria applied to that final state. If one such hypothesis fails this requirement, the event is rejected,

53 MEASUREMENT OF THE MASS OF THE r LEFTON 25
, I 1 I 1 I
3.56 3.58 3.80
W (GeV)
FIG. 6. The momentum limits as a function of cm. energy W for pions and kaons for the decays r + nv and r + Kv, respectively, obtained using a 7 mass value of 1775.9 MeV, as discussed in the text.
even if another hypothesis is acceptable. This conser- vative approach is adopted since the main concern is to exclude background events f?om the T+T- data sample.
For example, the number of background events in the data sample is greatest at scan points 9 and 10, for which the integrated luminosity is largest (see Table II). By de- sign, these points are very close to the 7 pair production threshold. If background events enter the T+T- sample at these points, they will drive the final mass to a value which is systematically low. It follows that the selection procedure followed in the analysis must be directed pri- marily toward the exclusion of background, while yielding an acceptable efficiency for the extraction of 7 pair pro- duction events. The approach described in the previous paragraph is compatible with these goals.
Throughout the remainder of the analysis, each track is labeled by the most probable mass’ hypothesis, and t,he final state assigned accordingly. After the particle identification procedures,~ there remain 9080 ee events, 73 /IP, events and 165 events in other final states.
VI. MONTE CARLO SIMULATION AND THE SELECTION OF THE FINAL ;+r- EVENT
SAMPLE
In order to complete the T+T- event selection, it is necessary to compare the data sample obtained to this point in the analysis to an equivalent sample of Monte Carlo generated T+T- events. Consequently, the Monte Carlo program KORALB [13] is used to produce a sample of 100000 7 pairs whose decays according to all known branching fractions (21 are fully simulated in the BES. Events are generated at each of the cm. energies of the scan, and are distributed in number according to the product of luminosity and corrected cross section (i.e., the solid curve of Fig. 3) at each scan point; for this purpose, the threshold for 7 pair production is chosen as 3553.8 MeV, as obtained in the previous ep analy-
sis 131. The Monte Carlo events are reconstructed as for real data, and,subjected to the selection criteria used to extract the T+T- candidate sample through the particle identification stage, as described in Sec. V.
The surviving Monte Carlo sample contains 17% ee events, 8% p~/l events, and 75% events in other final states. As indicated at the end of Set V, the composition of the corresponding data sample is quite different, there being - 5/9 as many P/I events, and * 70 times as many ee events, as events in other final states.
The ee data sample results predominantly from two- photon e+e- --f e+(e-e+)e- events for which the leading e+ and e- in the final state are undetected. The pp sam- ple similarly results primarily from e+e- -t e+(p+p-)e- events, together with some few surviving cosmic rays. These background events are characterized by small net observed transverse momentum and, for the QED events, large missing energy. It follows that the variable PTEM, defined as
PT,,=&= (6 + QT
rn198 w - IFlI - Ifi1 (9)
(i.e., the ratio of the net observed transverse momentum to the maximum possible value of the missing energy), is localized to small values for QED background events; tbis is shown explicitly in Fig. 7(a) for the Y+T- can- didate events. The corresponding distribution for the T+T- Monte Carlo sample is shown in Fig. 7(b); the contrast between these distributions is dramatic, and it is clear that the purity of the T+T- data sample can be greatly enhanced by removing candidates at small values of PTEM.
Since the ee final state in the data sample appears to consist almost entirely of background, it is considered first. This is necessary, not because of the resulting di- rect contribution of ee events to the 7 mass measure- ment (which proves to be small), but in order to prevent ee background events from feeding through to other fi- nal states as a consequence of particle misidentification.
0.2 0.4 0.8 0.8 1.0
PTEM
FIG. 7. The distribution in the variable PTEM for (a) the T+T- candidate sample after the application of the particle identification criteria and (b) r+~- events from the Monte Carlo simulation selected by the same criteria.
26 I. Z. BA1 et ol.
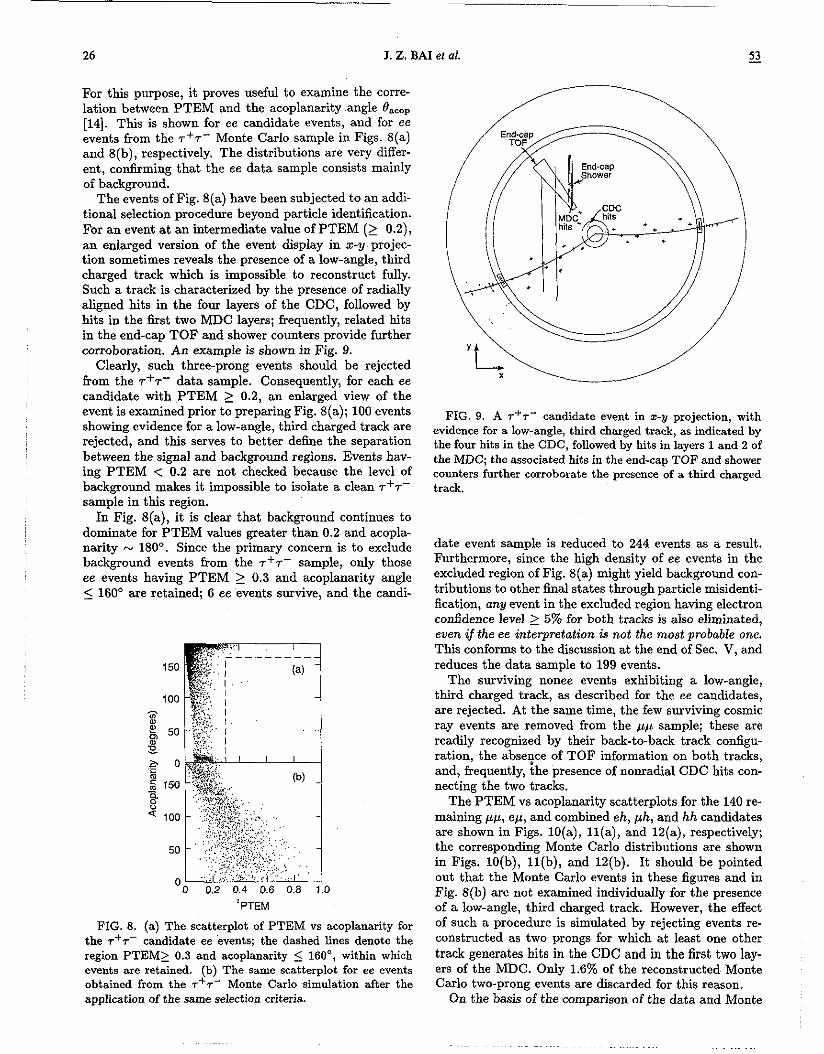
For this purpose, it proves useful to examine the corre- lation between PTEM and the acoplanarity angle eaeop [14]. This is shown for ee candidate events, and for ee events from the T+T- Monte Carlo sample in Figs. S(a) and 8(b), respectively. The distributions are very differ- ent, co&ming that the ee data sample consists mainly of background.
The events of Fig. 8(a) have been subjected to an addi- tional selection procedure beyond particle identification. For an event at an intermediate value of PTEM (2 0.2), an enlarged version of the event display in r-y projec- tion sometimes reveals the presence of a low-angle, third charged track which is impossible to reconstruct fully. Such a track is characterized by the presence of radially aligned hits in the four layers of the CDC, followed by hits in the first two MDC layers; frequently, related bits in the end-cap TOF and shower counters provide further corroboration. An example is shown in Fig. 9.
Clearly, such three-prong events should be rejected from the T+T- data sample. Consequently, for each ee candidate with PTEM 2 0.2, an enlarged view of the event is examined prior to preparing Fig. S(a); 100 events showing evidence for a low-angle, third charged track are rejected, and this serves to better define the separation between the signal and background regions. Events hav- ing PTEM c: 0.2 are not checked because the level of background makes it impossible to isolate a clean T+T- sample in this region.
In Fig. 8(a), it is clear that background continues to dominate for PTEM values greater than 0.2 and acopla- narity N 180°. Since the primary concern is to exclude background events from the T+T- sample, only those ee events having PTEM 2 0.3 and acoplanarity angle 5 160’ are retained; 6 ee ‘events survive, and the candi-
* PTEM
FIG. 8. (a) The scatterplot of PTEM vs acoplanarity for the T+T- candidate ee kvents; the dashed lines denote the region PTEM>_ 0.3 and acoplanarity 5 160°, within which events are retained. (b) The same scatterplot for ee events obtained from the T+T- Monte Carlo simulation after the application of the same selection criteria.
FIG. 9. A r’~- candidate event in z-y projection, with evidence for a low-angle, third charged track, as indicated by the four hits in the CDC, followed by hits in layers 1 and 2 of the MDC; the associated hits in the end-cap TOF and shower counters further corroborate the presence of a thud charged track.
date event sample is reduced to 244 events as a result. Furthermore, since the high density of ee events in the excluded region of Fig. 8(a) might yield background con- tributions to other final states through particle misidenti- fication, any event in the excluded region having electron confidence level 2 5% for both tracks is also eliminated, even 2f the ee interpretation is not the most probable one. This conforms to the discussion at the end of Sec. V, and reduces the data sample to 199 events.
The surviving nonee events exhibiting a low-angle, third charged track, as described for the ee candidates, are rejected. At the same time, the few surviving cosmic ray events are removed from the /LP sample; these are readily recognized by their back-to-back track configu- ration, the absence of TOF information on both tracks, and, frequently, ihe &sence of nonradial CDC hits con- necting the two tracks.
The PTEM vs acoplanarity scatterplots for the 140 re- maining pp, el.~, and combined eh, ph, and hh candidates are shown in Figs. 10(a), 11(a), and 12(a), respectively; the corresponding Monte Carlo distributions are shown in Figs. 10(b), 11(b), and 12(b). It should be pointed out that the Monte Carlo events in these figures and in Fig. S(b) are not examined individually for the presence of a low-angle, third charged track. However, the effect of such a procedure is simulated by rejecting events re- constructed as two prongs for which at least one other track generates hits in the CDC and in the first two lay- ers of the MDC. Only 1.6% of the reconstructed, Monte Carlo two-prong events are discarded for this reason.
On the basis of the comparison of the data and Monte

MEASUREMENT OF THE MASS OF THE 7 LEPTON 27
0 0.2 0.4 0.6 0.8 1.0
PTEM
FIG. 10. (a) The scatterplot of PTEM vs acoplanarity for the ~+r- candidate pp events. (b) The same scatterplot for pp events obtained from the T+T- Monte Carlo simulation after the application of the same selection criteria.
Carlo scatterplots, only those pp events for which PTEM > 0.2 are retained [Fig. 10(a)]. The ep sample of Fig. 11(a) .seems free of background, and so no PTEM criterion is imposed, while for the data of Fig. 12(a), the
events for which PTEM < 0.1 are excluded from the final sample. After removal of the events failing to satisfy the PTEM criteria, there remain only 65 events in the T+T- candidate sample.
The effect of the sequential event selection criteria is
o 0.2 0.4 0.6 0.8 1.0
PTEM
FIG. 11. (a) The scatterplot of PTEM vs acoplanarity for the T+T- candidate ep events. (b) The same scatterplot for ep events obtained from the r+r- Monte Carlo simulation after the application of the same selection criteria.
‘PTEM
0
FIG. 12. (a) The scatterplot of PTEM vs acoplanarity for the ~+r- candidate eh, &, and hh events. (b) The same scatterplot for the combined eh, ph, and hh events obtained from the r+~- Monte Carlo simulation after the application of the same selection criteria.
summarized in Table III, and the event display for a typical surviving ep event is shown in x-y projection in Fig. 13. The events of Figs. S(a), 10(a), 11(a), and 12(a) are distributed by final state as indicated in the second
FIG. 13. A typical ep candidate event in z-y projection. The MDC hits provide dE/dx information on each track; in addition, both tracks activate the barrel TOF counters as in- dicated, and hence have associated velocity measurements. The electron track ends in a large shower in the electromag- netic calorimeter, which contributes significantly to its iden- tification as an electron, while the muon track penetrates the shower counter, the magnet coil, and two layers of the muon system.

28 J. Z. BAI et al.
TABLE III. The effect of the sequential event selection criteria on the data sample (initially, 11.7 x 10⁶ events).
Selection criteria Events remaining
Two charged tracks with vertex in the interaction region 1 cm81 < 0.75 for each track 470000
PT 2 100 MeV/c; Ir;1 5 P,,,&V,mr) + 30~ 40000
Removal of events with > 1 isolated photon
[ET 2 60 MeV and min{cos-‘(g F)} 2 12’1 33000
Removal of cosmic ray events (TOFs2.5 ns or TOF>8.5 ns) 25000
Final state particle ID; hadron momentum requirement for r --t hv 9318
Removal of ee events with PTEM? 0.2 and a low-angle, third charged track 9218
Removal of ee events with PTEM< 0.3 or 8.,,, > 160° (6 ee events survive) 244
Removal of any non-ee event with an acceptable ee interpretation having PTEM< 0.3 or 8,,,, > 160” 199
Removal of Non-ee events with low-angle, third charged track removal of residual cosmic ray bp events 146
Non-.% PTEM requirements 65
column of Table IV. The relevant PTEM criteria are listed in the third column, and the number of candidates surviving is shown in column 4; these selected events are distributed by final state and xan point as indicated in Table V. -
None of the surviving candidates has net charge f2, even though the requirement of charge balance is not im- posed. This shows explicitly that the T+Y selection cri- teria successfully remove background contributions from two-photon events of the type e+e- + e+e-X+X- to the eX final states, since same-sign and opposite-sign contributions from such a source are equally likely to oc- cur.
For the Monte Carlo sample, 7588 events survive the selection criteria. Only two events have net charge +L2, and these were generated as four-prong events (i.e., one 7 decayed to the one-prong topology, and the other to the
three-prong topology). The remaining events are gener- ated and reconstructed as two-prong events with zero net charge.
VII. COMPARISON OF THE DATA AND EQUIVALENT MONTE CARLO SAMPLES
The PTEM vs acoplanarity scatterplot for the final T+T- data sample is shown in Fig. 14(a) in comparison to that for the Monte Carlo sample [Fig. 14(b)] after application of the same selection criteria. There is very good qualitative agreement.
The distributions in acoplanarity [14], PTEM, and track momentum for the T+T- candidate sample (points) are compared to the correspotiding Monte Carlo distribu-
TABLE IV. The number of r+~- candidate events by final state before and after PTEM selec-
Final Number of events state before PTEM selection
ee 8980 w 14 eh 25 w 51 @ 26 hh 24
Minimum value of PTEM
0.3 and I&.,,, < 160’ 0.0 0.1 0.2 0.1 0.1
Events remaining after PTEM selection
6 14 21 2 11 11
53 MEASUREMENT OF THE MASS OF THE r LEPTON 29
TABLE V. The number of T+T- candidate events by final state and scan point after selecting on PTEM at the values listed in Table IV.
Scan point AU final states ee e+ eh @p ph hh 1 I 9 2 3 2 2
2 7 2 3 1 1 3 0
4 0
5 5 2 2 1 6 1 1
7 2 1 1 8 1 1 9 1 1 10 3 1 1 1 11 24 258126
12 12 2 1 3 4 2
Total 65 6 14 21 2 11 11
tions (histograms) normalized to the data in Figs. 15-17. The quantitative agreement is very good in all cases.
The data distribution by final state is compared to that for the Monte Carlo sample of Fig. 14(b) (normal- ized to 65 events) in Table VI. Again there is very good quantitative agreement.
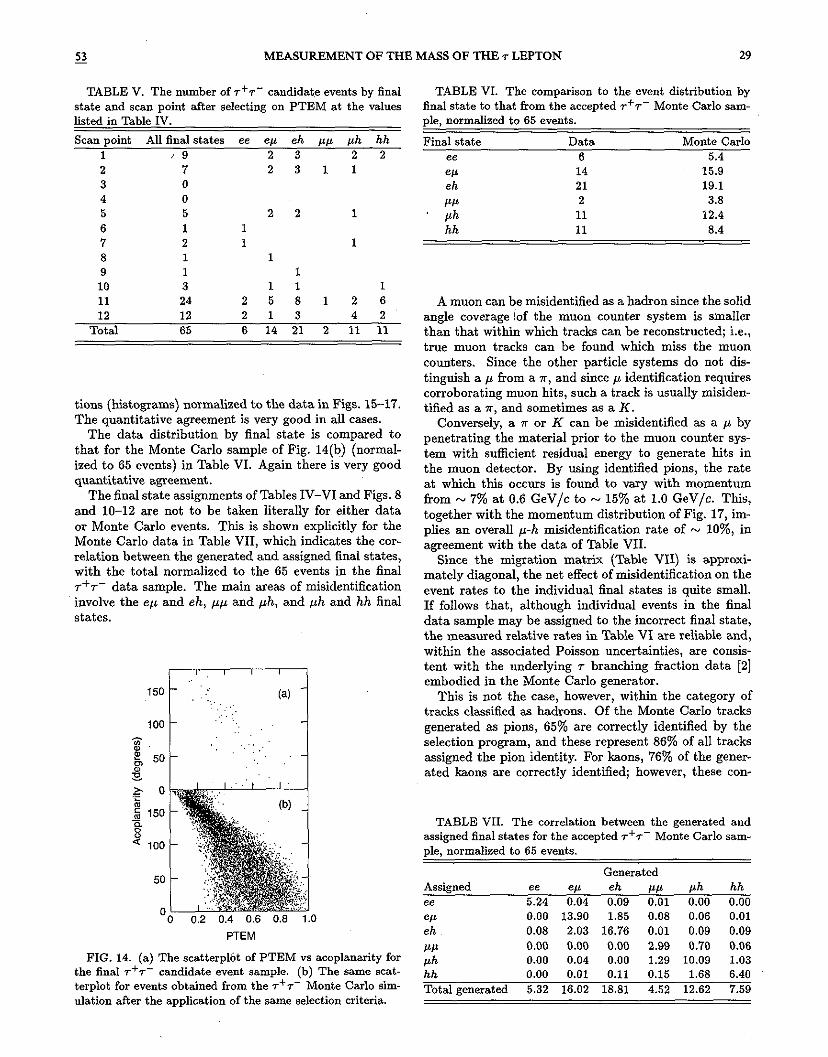
The final state assignments of Tables IV-VI and Figs. S and lo-12 are not to be taken literally for either data or Monte Carlo events. Tbis is shown explicitly for the Monte Carlo data in Table VII, which indicates the cm- relation between the generated and awgned final states, with the total normalized to the 65 events in the final t+~- data sample. The main areas of misidentification involve the ep and eh, pp and ph, and wh and hh final states.
PTEM
FIG. 14. (a) The scatterplbt of PTEM vs acoplanarity for the final T+T- candidate event sample. (b) The same scat- &plot for events obtained from the T+T- Monte Carlo sim- ulation after the application of the same selection criteria.
TABLE VI. The comparison to the event distribution by final state to that from the accepted T+T- Monte Carlo sam- ple, normalized to 65 events.
Final state Data Monte Carlo ee 6 5.4
e!J 14 15.9
eh 21 19.1
tw 2 3.8
@ 11 12.4
hh 11 8.4
A muon can be misidentified as a hadron since the solid angle coverage lof the muon counter system is smaller than that within which tracks can be reconstructed; i.e., true muon tracks can be found which miss the muon counters. Since the other particle systems do not dis- tinguish a /I from a ?r, and since p identification requires corroborating muon hits, such a track is usually misiden- tified as a ?r, and sometimes as a X.
Conversely, a ?r or K can be misidentified as a p by penetrating the material prior to the muon counter sys- tem with sufficient residual energy to generate bits in the muon detector. By using identified pions, the rate at which this occurs is found to vary with momentum from N 7% at 0.6 GeV/c to N 15% at 1.0 GeV/c. This, together with the momentum distribution of Fig. 17, im- plies an overall p-h misidentification rate of - lo%, in agreement with the data of Table VII.
Since the migration matrix (Table VII) is approxi- mately diagonal, the net effect of misidentification on the event rates to the individual final states is quite small. If follows that, although individual events in the final data sample may be assigned to the incorrect final state, the measured relative rates in Table VI are reliable and, within the associated Poisson uncertainties, are consis- tent with the underlying 7 branching fraction data [Z] embodied in the Monte Carlo generator.
This is not the case, however, within the category of tracks classified as hadrons. Of the Monte Carlo tracks generated as pions, 65% are correctly identified by the selection program, and these represent 86% of all tracks assigned the pion identity. For kaom, 76% of the gener- ated kaons are correctly identified; however, these con-
TABLE VII. The correlation between the generated and assigned final states for the accepted T+T- Monte Carlo sam- ple, normalized to 65 events.
Generated Assigned ee ep eh II/A ph hh ee 5.24 0.04 0.09 0.01 0.00 0.00
w 0.00 13.90 1.85 0.08 0.06 0.01 eh 0.08 2.03 16.76 0.01 0.09 0.09
w 0.00 0.00 0.00 2.99 0.70 0.06
@ 0.00 0.04 0.00 1.29 10.09 1.03
hh 0.00 0.01 0.11 0.15 1.68 6.40
Total generated 5.32 16.02 18.81 4.52 12.62 7.59

30 .I. 2. BAI et al.
0 0 50 100 150
Acoplanarity Angle (degrees)
FIG. 15. The distribution in acoplanarity angle for the T+T- candidate events (points) compared to that for the ~+r- Monte Carlo events subjected to the same selection criteria and normalized to the data (histogram).
stitute only 11% of all tracks assigned as kaons, 80% of which are actually misidentified pions. In contrast, 88% of the tracks generated as hadrons are actually assigned to this category.
The excellent agreement between data and Monte Carlo samples evident in Figs. 15-17 and in Table VI indicates that the pion and kaon identification problems do not adversely affect the ability of the selection crite- ria to extract T+T- ‘events from the data. Consequently, this sample is used as described in Sec. VIII to obtain a measurement of the mass of the 7 lepton.
VIII. MAXIMUM LIKELIHOOD FIT TO THE DATA
The mass of the 7 lepton is obtained from the final T+T- candidate sample by means of a maximum like- lihood fit to the cm. energy dependence of the 7 pair
PTEM
FIG. 16. The distribution in PTEM for the ~~7~ candi- date events (points) compared to that for the T+T- Monte Carlo events subjected to the same Selection criteria and nor- malized to the data (histogram).
L ! 0 0.2 0.4 0.6 0.6 1.0 1.2
Momentum (GeV/c)
FIG. 17. The distribution in momentum for the tracks from the T+T- candidate events (points) compared to that for the ~“r- Monte Carlo events subjected to the same selection criteria and normalized to the data (histogram).
production cross section. The likelihood function is a product of Poisson distributions, one at each of the 12 scan points, and takes the form
where Ni is the number of observed T+Y events at scan point i; p; is the corresponding number of events ex- petted, and is given by
pi = [E TiU(W, rn,) + CB] Li (11)
In Eq. (ll), rn, is the mass of the 7 lepton, and e is the overall efficiency for identifying T+T- events; this includes branching fractions, and allows for uncertain- ties in luminosity scale, and in trigger and detector ef- ficiency; the T; are the point-to-point relative efficiency values measured using the Monte Carlo data surviving the 7 event selection criteria; for scan points 1, 2, 5, 11, and 12, 7; N 1.0, while for the remaining points in the immediate vicinity of threshold, ri N 0.9; rg is an effec- tive background cross section, and is assumed constant over the limited range of cm. energy, Wi, covered by the scan; & is the integrated luminosity at scan point i, and 0 (Wi,mr) is the corresponding cross section for +T- production corrected for Coulomb interaction, ini- tial and final state radiation, vacuum polarization, and beam energy spread, as given by Eqs. (7) and (8), and represented by the solid curve of Fig. 3.
As a test of the procedure, the likelihood fit is per- formed on the selected Monte Carlo data sample. With the background cross section set to zero, the value of rn, used in generating the events is recovered to within 0.005 MeV. If the relative efficiency factors T; in Eq. (11.) are set to 1.0, the fitted value of rn, is found to be 0.06 MeV higher than the input value; this demonstrates the need to take account of the point-to-point relative efficiency.
In carrying out the maximum likelihood fit, rn,, E, and
53 MEASUREMENT OF THE MASS OF THE 7 LEPTON 31
nb are allowed to vary, subject to the requirement 0~ > 0. The fit to the data of liable V is performed using the program MINUIT [15], and the maximum likelihood solution is found to correspond to the parameter values
rn, = 1776.96+;:$ MeV,
e = 4.26’;:;; ?&
CTB = O+“.‘4 pb
(12)
For E and og, the quoted uncertainties are obtained by fixing the other two parameters at their maximum likelihood values and finding the parameter values corre- sponding to a decrease in 1nL of 0.5.
The statistical uncertainty in rn, is found by setting E = 4.26%, DB = 0, and integrating the likelihood func- tion to find the 68.27% confidence level interval; i.e., for rn < mrr the lu error point, rnlow, is defined by
J ml
Ldm = 0.6827 mIDI J
tnr Ldm , (13)
0
and for rn > rn,, the lo error point rnhigh is defined by
J rnhigh
Ldm = 0.6827 Ldm (14) rn,
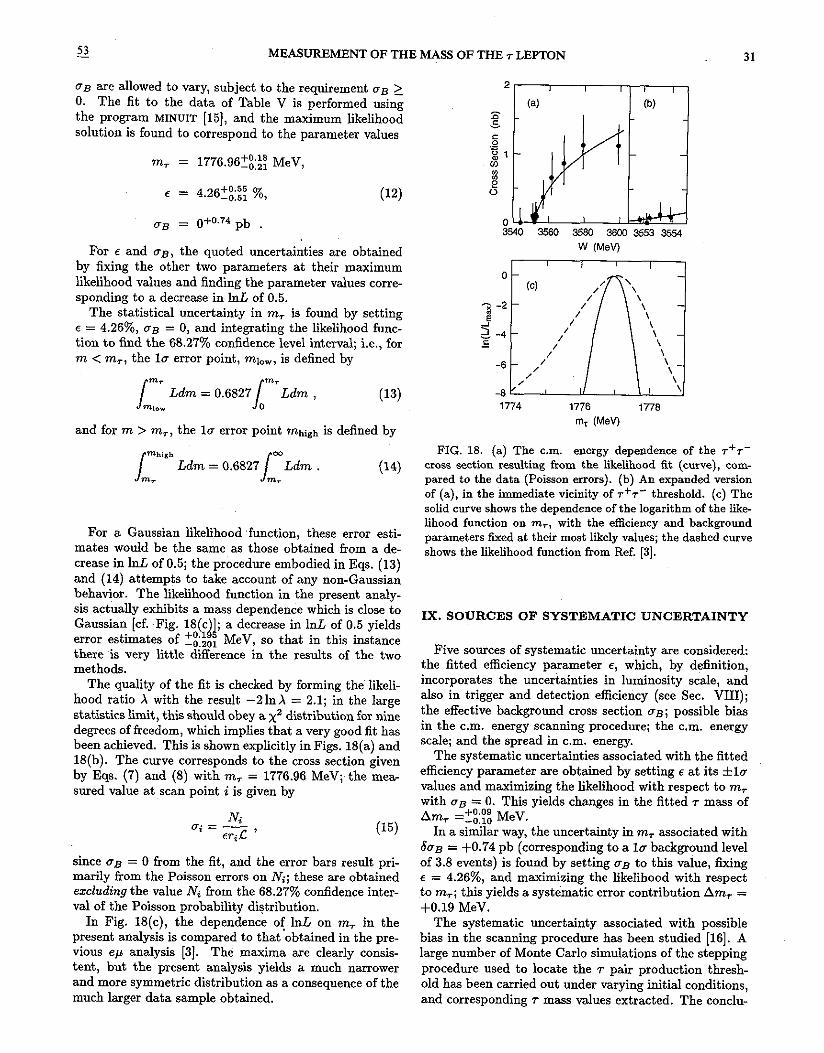
For a Gaussian likelihood .function, these error esti- mates would be the same as those obtained from a de- crease in 1nL of 0.5; the procedure embodied in Eqs. (13) and (14) attempts to take account of any non-Gaussian behavior. The likelihood function in the present analy- sis actually exhibits a mass dependence which is close to Gaussian [cf. ,Fig. lS(cji; a decrease in 1nL of 0.5 yields error estimates of ‘&,, MeV, so that in this instance there his very little difference in the results of the two methods.
The quality of the fit is checked by forming th& likeli- hood ratio X with the result -21nX = 2.1; in the large statistics limit, this should obey a x2 distribution for nine degrees of &edom, which implies that a very good fit has been achieved. This is shown explicitly in Figs. U(a) and 18(b). The curve corresponds to the cross section given by Eqs. (7) and (8) with rn, = 1776.96 MeV, the mea- sured value at scan point i is given by
since Q = 0 from the fit, and the error bars result pri- marily from the Poisson errors on N;; these are obtained excluding the value N; from the 68.27% confidence inter- val of the Poisson probability distribution.
In Fig. 18(c), the dependence of 1nL on rn, in the present analysis is compared to that obtained in the pre- vious ep analysis [3]. The maxima are clearly consis- tent, but the present analysis yields a much narrower and more symmetric distribution as a consequence of the much larger data sample obtained.
2, I I
i-
Cb)
.!
In a similar way, the uncertainty in rn, associated with 6~ = +0.74 pb (corresponding to a la background level of 3.8 events) is found by setting Q to this value, fixing e = 4.26%, and maximizing the likelihood with respect to rn,; this yields a systematic error contribution Am, = +0.19 MeV.
The systematic uncertainty associated with possible bias in the scanning procedure has been studied [16]. A large number of Monte Carlo simulations of the stepping procedure used to locate the 7 pair production thresh- old has been carried out under varying initial conditions, and corresponding 7 mass values extracted. The conclu-
1774 1776 1778 m, (MeV)
FIG. 18. (a) The c.m. energy dependence of the r+r- cross section resulting from the likelihood fit (curve), com- pared to the data (Poisson errors). (b) An expanded version of (a), in the immediate vicinity of T+T- threshold. (c) The solid cucve shows the dependence of the logarithm of the like- lihood function on rn,, with the efficiency and background parameters fixed at their most likely values; the dashed curve shows the likelihood function from Ref. [3].
IX. SOURCES OF SYSTEMATIC UNCERTAINTY
Five sources of systematic uncertainty are considered: the fitted efficiency parameter e, which, by definition, incorporates the uncertainties in luminosity scale, and also in trigger and detection efficiency (see Sec. VIII); the effective background cross section os; possible bias in the cm. energy scanning procedure; the cm. energy scale; and the spread in cm. energy.
The systematic uncertainties associated with the fitted efficiency parameter are obtained by setting E at its +lu values and maximizing the likelihood with respect to rn, with Q = 0. This yields changes in the fitted 7 mass of Am, =c:;; MeV.

32 J. Z. BAI ef al.
TABLE VIII. The measured mass and c.m. energy spread determined from fits to the hadronic cross section observed in the J/+ resonance scans performed during data acquistion.
Fitted .7/ti mass (MeV) c.m. energy spread (MeV) 3097.32 * 0.02 1.04 + 0.017 3097.07* 0.02 1.20 f0.016
sion is that the degree of bias in the maas value obtained in this way is very small, and contributes a systematic uncertainty of zlcO.10 MeV to the measurement.
Finally, the systematic errors due to uncertainties in the c.m. energy scale and energy spread are dis- cussed. The energy scale is determined from several scans of the J/l/l and $’ resonances performed during the experiment [see Fig. 4 (a)]. The plots of observed hadcon cross section vs cm. energy for two of the five scans are shown in Fig. 19. From the data in Ta- ble VIII the values A& = 3097.20 MeV and 6A’f+ =
(3097.32 - 3097.07(/& = 0.18 MeV are obtained, and from the data in Table IX, A$ = 3686.88 MeV and
6M+z = ,/(0.15)2 + 0.02 + (O.l4)2/fi = 0.15 MeV. The uncertainties in the energy scale, including the uncer- tainty in the reproducibility of the BEPC energy settings listed above, are listed in Table X. Assuming a linear re- lation between measured energy W.w and the corrected value W, the latter is given by
The resulting cm. energy scale correction at 7+7- threshold is W - WM = -0.754 MeV, with correspond- ing uncertainty SW = 0.173 MeV. This is included as a systematic uncertainty of Am, = SW/2 = ho.09 MeV.
Fits to the two resonances are used to measure the beam energy spread, and its variation with cm. energy and beam current [12]. The resulting uncertainty in cm. energy spread is estimated to be f0.08 MeV. By varying the spread parameter over this range, and repeating the likelihood fits, the corresponding uncertainty in the 7 mass value is found to be Am, = &0.02 MeV.
The independent systematic error contributions are summarized in Table XI. Added in quadrature, they yield a total systematic mass uncertainty Am, = ‘“,I;“, MeV. It follows from Eq. (12) that, as a result of the improved statistics in the present analysis, the sta- tistical and systematic uncertainties associated with the tau mass value are now comparable; the consequence is
TABLE IX. The measured mass and c.m. energy spread determined from fits to the hadronic cross section observed in the $’ resonance scans performed during data acquistion.
Fitted $’ mass (MeV) c.m. energy spread (MeV) 3687.03 f0.03 1.49 f 0.043 3686.88 ?c 0.03 1.34 i 0.038
3686.74f0.03 1.40 ho.024
? 3.08 3.09 3.10 3.11 3.12
1 3.67 3.68 3.69 3.70 3.71
W (GeV)
FIG. 19. The results of typical scans, taken during the ex- periment of (a) the J/G resonance and (b) the $’ resonance; W is the c.m. energy.
an improvement in overall precision by a factor of 2 with respect to the previous BES measurement [3].
X. CONCLUSION
By means of a maximum likelihood fit to T+T- cross section data near threshold, the mass of the 7 lepton has been measured as rn, = 1776.96 ‘“,I;“, ?“,I;; MeV, where the first uncertainties are statistical and the second systematic. This measurement is shown with all other measurements of the mass of the 7 lepton [2] in Fig. 20. Inserting this new value into Eq. (6), together with the values t, = (291.6U.7) fs and B,,,,, = (17.66iO.11)% [17], the ratio of squared coupling constants becomes
(G,,,,~/Gp,,,,)2 = 0.9886 f 0.0085 , (17)
so that this test of 7~ universality is satisfied at the 1.3 standard deviation level.
The consistency of mrr t,, and B,,.,o with 711 uni- versality is shown graphically in Fig. 21. From Eq. (6), the values of t, and B,,,,, should lie on a line with slope proportional to my5 through the origin. The solid lines in Fig. 21 indicate the flu band obtained by using the measurement of rn, from the present analysis and by
TABLE X. The contributions to the uncertainty in the cm. energy scale.
Quantity Error (MeV) WM : BEPC tieasured c.m. energy 0.10 M+ : BES value for J/IJJ mass 0.18
M+, : BES value for $’ mass 0.15 T* : Nominal value for J/$ mass [2] 0.04
Tw : Nominal value for $’ mass 121 0.09

II MEASUREMENT OF THE MASS OF THE 7 LEPTON 33
I I I I I
DASP ,807fao I I
SPEC md:; -
DELCO 17835 rn
Mark II 1787*10 -
ARGUS 1776.3 * 2.8 rn
CLEO 1777.8 * 1.8 rn
BES 1776.96+“.33 H -0.27
I I I I L
1700 1725 1750 1775 ,800 1825
m, (MeV)
FIG. 20. A comparison of the value of the mass of the T lepton obtained from the present analysis to the results from other experiments [2].
assuming Tfi universality. The point labeled HEP94 corresponds to the present
values oft, and B,-,,,u (So errors) [l-l], and shows the 1.3 standard deviation discrepancy indicated by Eq. (17). The dashed lines and point labeled PDG92 indicate the equivalent status using the 1992 Particle Data Group val-
310
g
.g 300 5i 3 P
29C
I-
,-
16 17 16 19 20
FIG. 21. The variation of the 7 lepton lifetime t,, with B,,,., given by Eq. (6) under the assumption of lepton uni- versality; the Alu bands obtained by using the value of rn, from the present analysis (solid lines) and by using the PDG92
value [lo] (dashed lines) are shown in comparison to the points (lu error bars) corresponding to the current average values of t, and B,,.,, (HEP94 [17]) and the PDG92 values.
TABLE XI. ,The systematic error contributions to the un- certainty in the value of the mass of the r lepton.
SOlIKe
sc= 7::;: % 6m, (MeV)
+ ” “V &,B = +O.W Pb G%
Bias in the s&ning procedure zto.10 Uncertainty in the cm. energy scale *to.09 Uncertainty in the cm. energy spread zto.02
Total systematic uncertainty + ” Zb - 0:u
ues [lo]; these yield the value 0.9405?~:~~~~ for the cou- pling strength ratio. It follows that the deviation from 7~ universality has decreased from 2.4 to 1.3 standard deviations as a result of the increased precision of the individual measurements.
The present experiment has reduced the uncertainty in the mr5 factor in Eq. (6) to less than one part in 1000. However, in order to improve the overall precision of the squared coupling constant ratio of Eq. (1’7) to - 2.5 parts in 1000 (which would give the present discrepancy five standard deviation significance), t, would have to be known to within 0.4 fs and B,,,,, known to within 0.03%. It does not appear likely that such precision will be attained in the near future, so that detecting the vi- olation of 711 universality at the few percent level will remain a tantalizing possibility for some time to come [from Eq. (17), 3~ N 2.5%].
ACKNOWLEDGMENTS
The BES Collaboration would like to thank the staffs of the BEPC accelerator and the Computing Cen- ter at the Institute of High Energy Physics, Beijing, for their outstanding efforts, and also Y. S. Tsai for helpful discussions about the T+T- cross section near threshold. The work of the BES Collaboration was supported in part by the National Natural Science Foundation of China under Contract No. 19290400 and the Chinese Academy of Sciences under Contract NO. KJ85 (IHEP), by the Department of Energy under Contracts No. DE-FG02.91ER40676 (Boston University), DE-FG03-92ER40701 (California Institute of Technology), DEFG03-93ER40788 (Colorado State University), DE-AC02-76ER03069 (MIT), DE-AC03- 76SF00515 (SLAC), DE-FG03-91ER40679 (University of California at Irvine), DE-FG03-94ER40833 (University of Hawaii), DE-FG05-92ER40736 (University of Texas at Dallas), DE-AC35-89ER40486 (SSC Lab), by the U.S. National Science Foundation, Grant No. PHY9203212 (University of Washington), and by the Texas Na- tional Research Laboratory Commission under Contracts Nos. RGFYQlB5, RGFY92B5 (Colorado State), and RCFY93-316H (University of Texas at Dallas).

34 J. Z. BAI et al. 53
[l] W. .I. Marciano and A. Sirlin, Phys. Rev. Lett. 61, 1815 (1088).
121 Particle Data Group, L. Mo&met et al., Phys. Rev. D 60, 1173 (1994).
131 J. 2. Bai et al.. Phvs. Rev. Lett. 60. 3021 ~19921, i43 M. H. Ye and ‘Z. 6. Zheng, in Prockdings‘of thk XIVth
Intenational Symposium on Lepton and Photon Interac- tions, Stanford, California, 1989, edited by M. Fliordan (World Scientific, Singapore, 1990), p. 122.
[5] J. Z. Bai et al., Nucl. Instrum Methods A 344, 319 (1994).
[6] F. Porter (private communication); J. M. Wu and P. Y. Zhao, Chin. J. High Energy Nucl. Phys. 17, 379 .~ (J993).
[7] E. A. Kuaev and V. S. Fadin, Yad. Fiz. 41, 733 (1985) (Sov. J. Nucl. Phys. 41, 466 (1985)].
ISI F. A. Berends and G. J. Komen, Phys. Lett. 6SB, 432 (1976).
[9] M. B. V&shin, in Proceedings of the r-Charm Factory Wor~shoo. Stanford. California. 1989. edited bv Lvdia V. Beers (SiAC Report No. 343, &f&d, 1989; ”
[lo] Particle Data Group, K. Hikasa et al., Phys. Rev. D 45,
SI (1992). [11] M. L. Per1 et al., Phys. Rev. Lett. 35, 1489 (1975). 1121 The cm. energy spread A is determined according to
the equation A = (Ar + B)(CWa + D), where f is the average beam current; A, B, C, and D are fitted to beam current measurements and to measurements of the energy spreads at the J/+ and $’ wscmances.
[13] S. Jadach and Z. Was, Comput. Phys. Commun. 64, 26’7 (1991).
[14] The acoplanarity angle O.,,, is defined as the angle be- tween the planes spanned by the beam direction and the momentum vectors of the two final state charged tracks; i.e., it is the angle between the transverse momentum vectors of the two final state charged tracks.
[15] F. James and M. Roes, ‘+mput. Phys. Commun. 10,343 (1975).
1161 F. Porter, BES Report No. 93-013, 1993 (unpublished); L. Jones, Ph.D. thesis, Caltech, 1995.
[17] J. R. Patterson, in Proceedings of the XXVI&h Inter- national Conference on High Energy Physics, Glasgow, Scotland, 1994, edited by P. J. Bussey and I. G. Knowles (IOP, London, 1995), Vol. I, p. 149.
Related Documents


![arXiv:1312.7826v2 [hep-ex] 1 Aug 2014 · 51University of Science and Technology of China, Hefei 230026 52Seoul National University, Seoul 151-742 53Soongsil University, Seoul 156-743](https://static.cupdf.com/doc/110x72/5fdbad0cd4fd056cbc36c199/arxiv13127826v2-hep-ex-1-aug-2014-51university-of-science-and-technology-of.jpg)


